Attached files
| file | filename |
|---|---|
| 8-K - FORM 8-K - ASHFORD HOSPITALITY TRUST INC | d78809e8vk.htm |
Exhibit 99.1

| Investor Presentation January 2011 |
| Safe Harbor In keeping with the SEC's "Safe Harbor" guidelines, certain statements made during this presentation could be considered forward-looking and subject to certain risks and uncertainties that could cause results to differ materially from those projected. When we use the words "will likely result," "may," "anticipate," "estimate," "should," "expect," "believe," "intend," or similar expressions, we intend to identify forward-looking statements. Such forward-looking statements include, but are not limited to, our business and investment strategy, our understanding of our competition, current market trends and opportunities, projected operating results, and projected capital expenditures. These forward-looking statements are subject to known and unknown risks and uncertainties, which could cause actual results to differ materially from those anticipated including, without limitation: general volatility of the capital markets and the market price of our common stock; changes in our business or investment strategy; availability, terms and deployment of capital; availability of qualified personnel; changes in our industry and the market in which we operate, interest rates or the general economy, and the degree and nature of our competition. These and other risk factors are more fully discussed in the Company's filings with the Securities and Exchange Commission. EBITDA is defined as net income before interest, taxes, depreciation and amortization. EBITDA yield is defined as trailing twelve month EBITDA divided by the purchase price. EBITDA, FFO, AFFO, CAD and other terms are non-GAAP measures, reconciliations of which have been provided in prior earnings releases and filings with the SEC. |
| Ashford Overview Company Snapshot High Quality, Well-Diversified Portfolio Attractive Industry Fundamentals Proactive With Maturities & Covenants Well-Timed Interest Rate Hedges Capital Markets Expertise Strong Operating Performance Shareholder Value Creation High Insider Ownership |
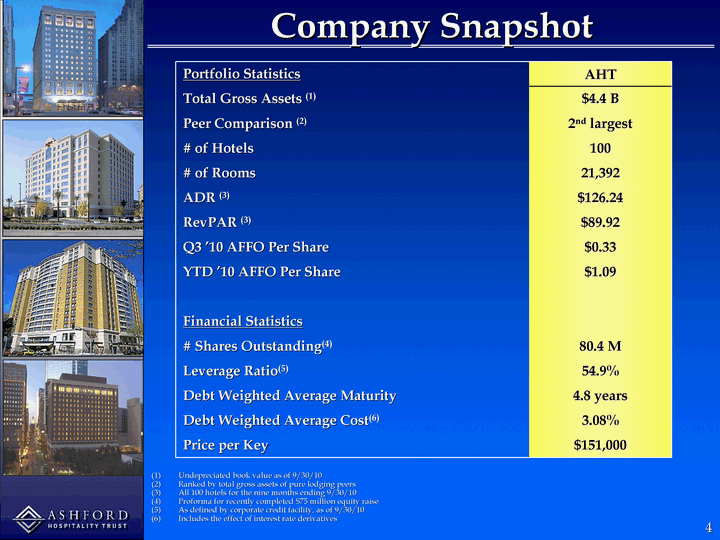
| Company Snapshot Portfolio Statistics AHT Total Gross Assets (1) $4.4 B Peer Comparison (2) 2nd largest # of Hotels 100 # of Rooms 21,392 ADR (3) $126.24 RevPAR (3) $89.92 Q3 '10 AFFO Per Share $0.33 YTD '10 AFFO Per Share $1.09 Financial Statistics # Shares Outstanding(4) 80.4 M Leverage Ratio(5) 54.9% Debt Weighted Average Maturity 4.8 years Debt Weighted Average Cost(6) 3.08% Price per Key $151,000 Undepreciated book value as of 9/30/10 Ranked by total gross assets of pure lodging peers All 100 hotels for the nine months ending 9/30/10 Proforma for recently completed $75 million equity raise As defined by corporate credit facility, as of 9/30/10 Includes the effect of interest rate derivatives |
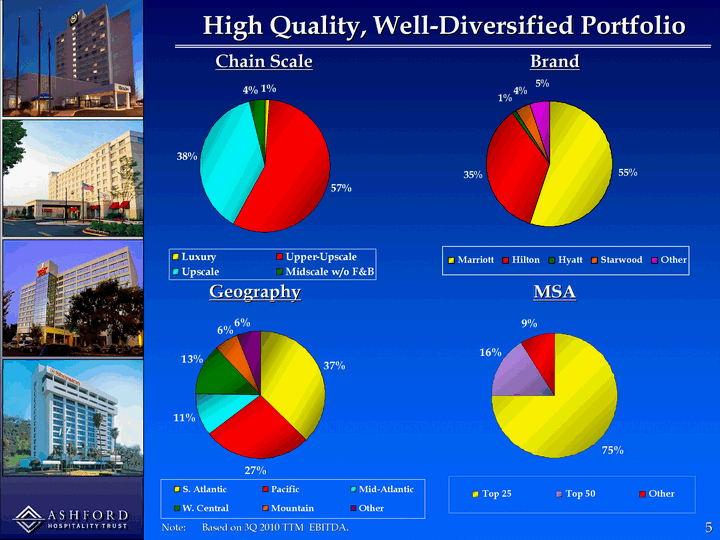
| 5 High Quality, Well-Diversified Portfolio Note: Based on 3Q 2010 TTM EBITDA. Chain Scale Brand Geography MSA |
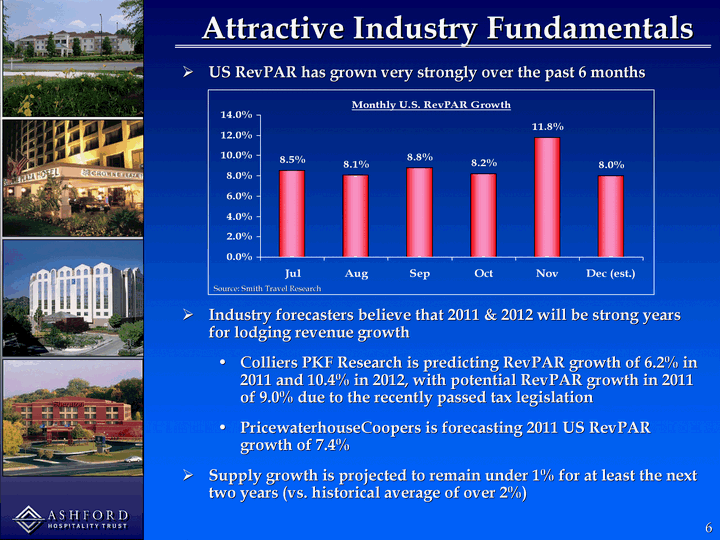
| 6 US RevPAR has grown very strongly over the past 6 months Industry forecasters believe that 2011 & 2012 will be strong years for lodging revenue growth Colliers PKF Research is predicting RevPAR growth of 6.2% in 2011 and 10.4% in 2012, with potential RevPAR growth in 2011 of 9.0% due to the recently passed tax legislation PricewaterhouseCoopers is forecasting 2011 US RevPAR growth of 7.4% Supply growth is projected to remain under 1% for at least the next two years (vs. historical average of over 2%) Attractive Industry Fundamentals Jul Aug Sep Oct Nov Dec (est.) Monthly RevPAR 0.085 0.081 0.088 0.082 0.118 0.08 Source: Smith Travel Research |
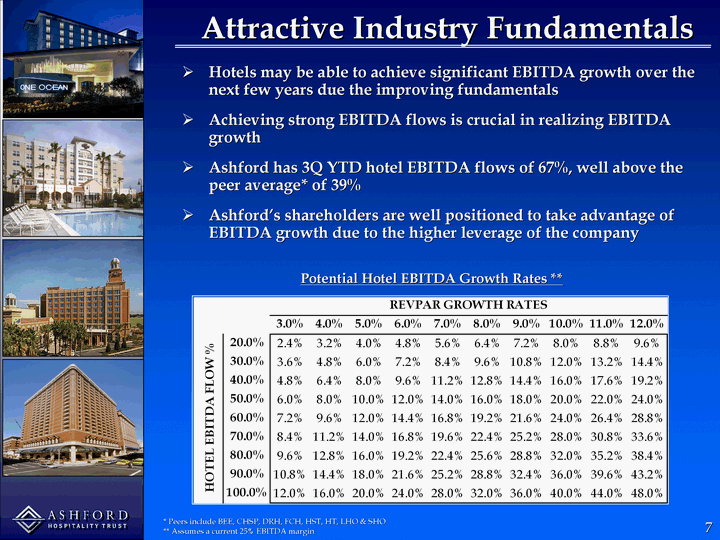
| 7 Hotels may be able to achieve significant EBITDA growth over the next few years due the improving fundamentals Achieving strong EBITDA flows is crucial in realizing EBITDA growth Ashford has 3Q YTD hotel EBITDA flows of 67%, well above the peer average* of 39% Ashford's shareholders are well positioned to take advantage of EBITDA growth due to the higher leverage of the company Attractive Industry Fundamentals Potential Hotel EBITDA Growth Rates ** * Peers include BEE, CHSP, DRH, FCH, HST, HT, LHO & SHO ** Assumes a current 25% EBITDA margin |
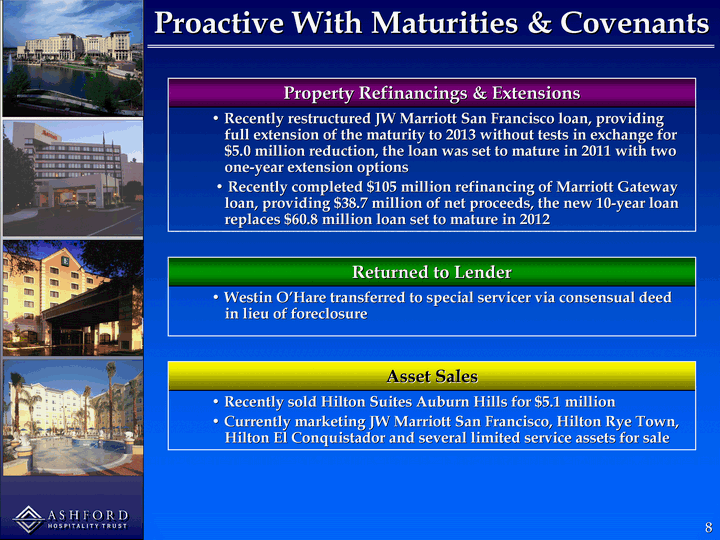
| Proactive With Maturities & Covenants Property Refinancings & Extensions • Recently restructured JW Marriott San Francisco loan, providing full extension of the maturity to 2013 without tests in exchange for $5.0 million reduction, the loan was set to mature in 2011 with two one-year extension options • Recently completed $105 million refinancing of Marriott Gateway loan, providing $38.7 million of net proceeds, the new 10-year loan replaces $60.8 million loan set to mature in 2012 Returned to Lender • Westin O'Hare transferred to special servicer via consensual deed in lieu of foreclosure Asset Sales • Recently sold Hilton Suites Auburn Hills for $5.1 million • Currently marketing JW Marriott San Francisco, Hilton Rye Town, Hilton El Conquistador and several limited service assets for sale |
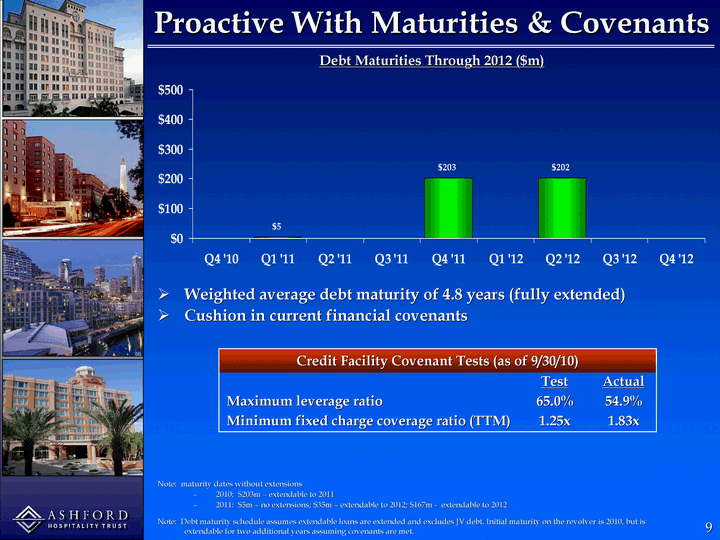
| Weighted average debt maturity of 4.8 years (fully extended) Cushion in current financial covenants Note: maturity dates without extensions 2010: $203m - extendable to 2011 2011: $5m - no extensions; $35m - extendable to 2012; $167m - extendable to 2012 Q4 '10 Q1 '11 Q2 '11 Q3 '11 Q4 '11 Q1 '12 Q2 '12 Q3 '12 Q4 '12 Current 5 203 202 Note: Debt maturity schedule assumes extendable loans are extended and excludes JV debt. Initial maturity on the revolver is 2010, but is extendable for two additional years assuming covenants are met. Credit Facility Covenant Tests (as of 9/30/10) Credit Facility Covenant Tests (as of 9/30/10) Credit Facility Covenant Tests (as of 9/30/10) Test Actual Maximum leverage ratio 65.0% 54.9% Minimum fixed charge coverage ratio (TTM) 1.25x 1.83x Debt Maturities Through 2012 ($m) Proactive With Maturities & Covenants |
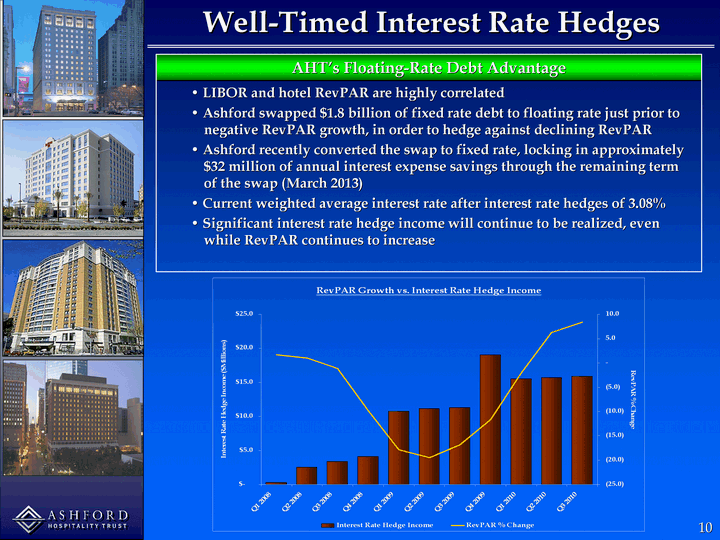
| Well-Timed Interest Rate Hedges AHT's Floating-Rate Debt Advantage • LIBOR and hotel RevPAR are highly correlated • Ashford swapped $1.8 billion of fixed rate debt to floating rate just prior to negative RevPAR growth, in order to hedge against declining RevPAR • Ashford recently converted the swap to fixed rate, locking in approximately $32 million of annual interest expense savings through the remaining term of the swap (March 2013) • Current weighted average interest rate after interest rate hedges of 3.08% • Significant interest rate hedge income will continue to be realized, even while RevPAR continues to increase |
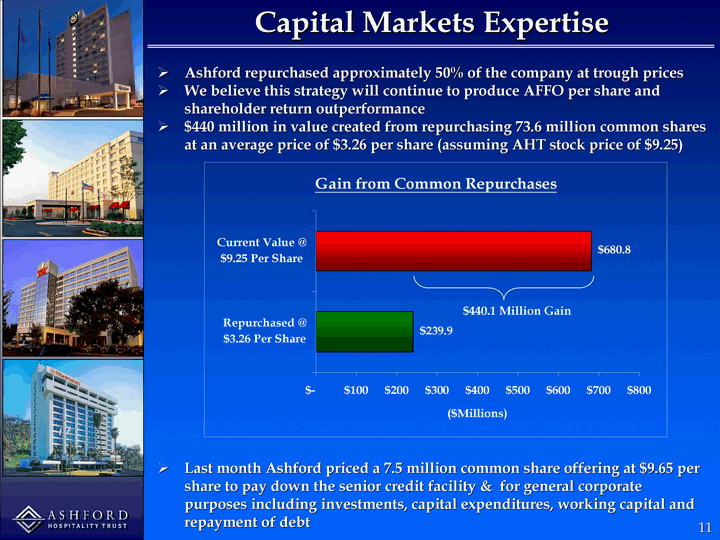
| Ashford repurchased approximately 50% of the company at trough prices We believe this strategy will continue to produce AFFO per share and shareholder return outperformance $440 million in value created from repurchasing 73.6 million common shares at an average price of $3.26 per share (assuming AHT stock price of $9.25) Last month Ashford priced a 7.5 million common share offering at $9.65 per share to pay down the senior credit facility & for general corporate purposes including investments, capital expenditures, working capital and repayment of debt Capital Markets Expertise $440.1 Million Gain |
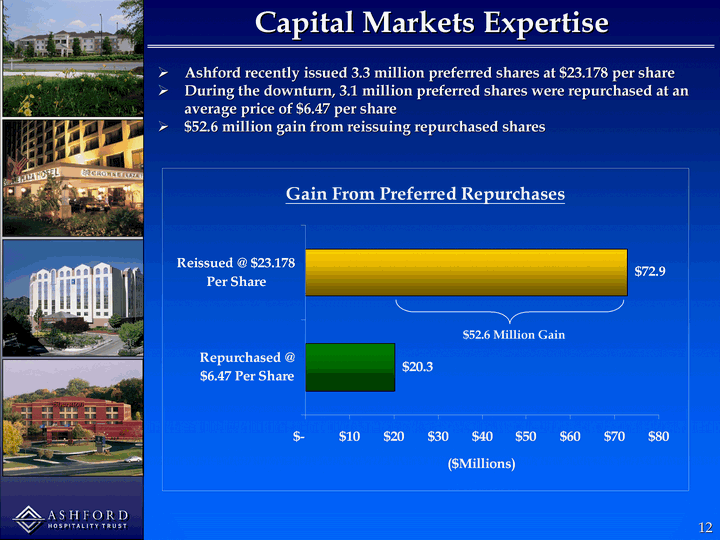
| Ashford recently issued 3.3 million preferred shares at $23.178 per share During the downturn, 3.1 million preferred shares were repurchased at an average price of $6.47 per share $52.6 million gain from reissuing repurchased shares Capital Markets Expertise $52.6 Million Gain |
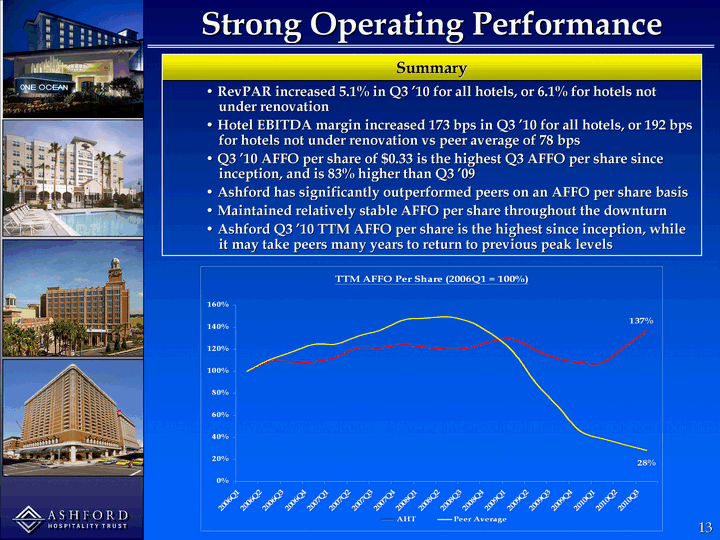
| Strong Operating Performance Summary • RevPAR increased 5.1% in Q3 '10 for all hotels, or 6.1% for hotels not under renovation • Hotel EBITDA margin increased 173 bps in Q3 '10 for all hotels, or 192 bps for hotels not under renovation vs peer average of 78 bps • Q3 '10 AFFO per share of $0.33 is the highest Q3 AFFO per share since inception, and is 83% higher than Q3 '09 • Ashford has significantly outperformed peers on an AFFO per share basis • Maintained relatively stable AFFO per share throughout the downturn • Ashford Q3 '10 TTM AFFO per share is the highest since inception, while it may take peers many years to return to previous peak levels |
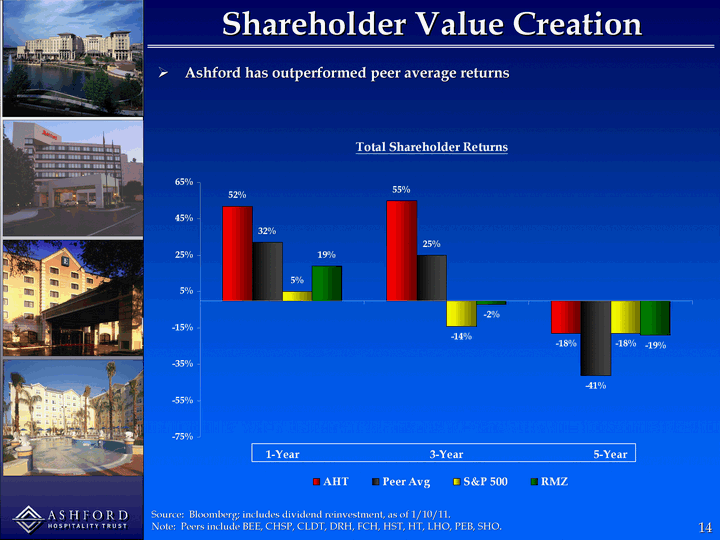
| Shareholder Value Creation Ashford has outperformed peer average returns Source: Bloomberg; includes dividend reinvestment, as of 1/10/11. Note: Peers include BEE, CHSP, CLDT, DRH, FCH, HST, HT, LHO, PEB, SHO. |

| High Insider Ownership Insider Ownership East 0.2 0.8 Insider Ownership East 0.04 0.96 Ashford management interests are closely aligned with shareholders, with 20% insider ownership 5x higher insider ownership than peer average Source: Company Filings |
| Ashford Overview Company Snapshot High Quality, Well-Diversified Portfolio Attractive Industry Fundamentals Proactive With Maturities & Covenants Well-Timed Interest Rate Hedges Capital Markets Expertise Strong Operating Performance Shareholder Value Creation High Insider Ownership |
