Attached files
| file | filename |
|---|---|
| 8-K - REHABCARE GROUP 4Q2010 PRESENTATION - REHABCARE GROUP INC | eightk4q2010presentation.htm |

Investor Presentation
J.P. Morgan Healthcare Conference
January 11, 2011
Exhibit 99
Investment Highlights
1
n Leading provider of post-acute care
n Largest contract manager of rehabilitation services
n Fourth largest post-acute hospital operator, third largest long-term acute care hospital provider
n Large, growing and highly fragmented market provides multiple organic and acquisitive
growth opportunities
growth opportunities
n Positioned to leverage continuum capabilities and real-time technology under
healthcare reform
healthcare reform
n Strong financial model
n Diversified business lines
n Track record of strong earnings
and operating cash flow
n Experienced management team with successful track record of adapting to change
13%
Patient Discharge Destination1
No post-
acute care
acute care
Hospice/Home Health
65%
Acute care
hospital
hospital
2
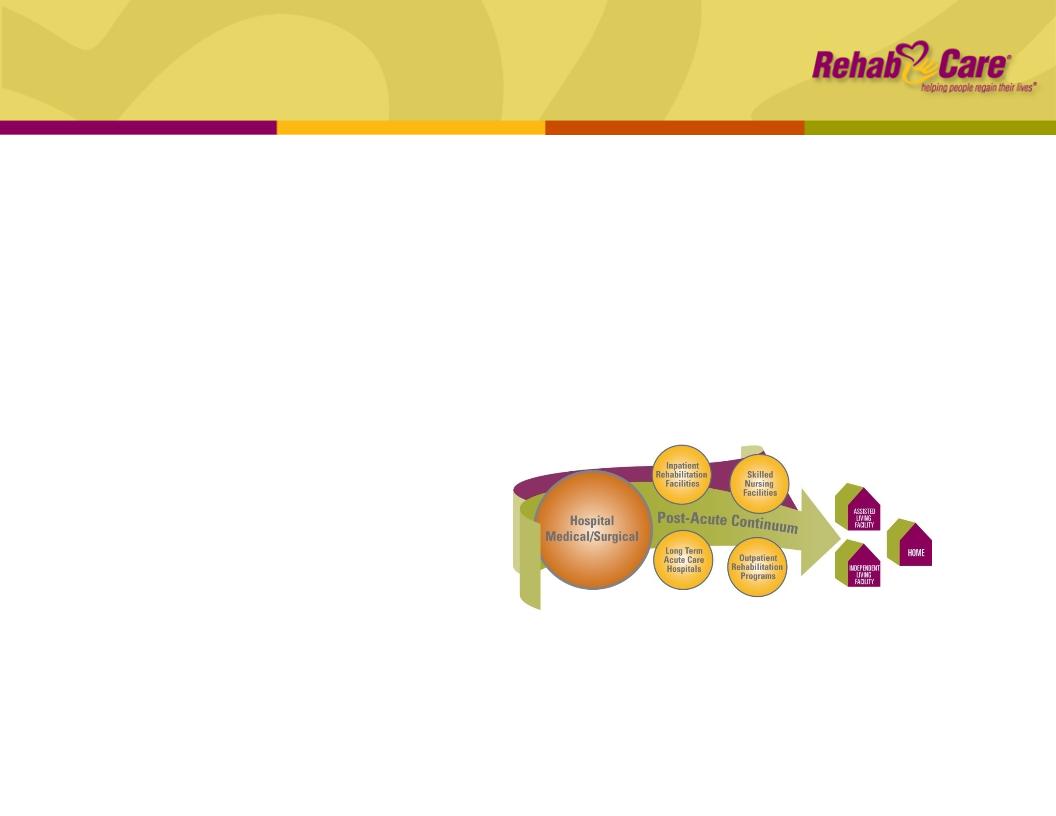
Post-Acute Market Overview
1“Examining Post-Acute Care Relationships in an Integrated Hospital System,” Dept. of
Health and Human Services, Feb. 2009
Health and Human Services, Feb. 2009
2MedPAC Data Book, June 2010; does not include Home Health or Medicare Advantage
3Avalere Health LLC, Apr. 2009; does not include Home Health or Medicare Advantage
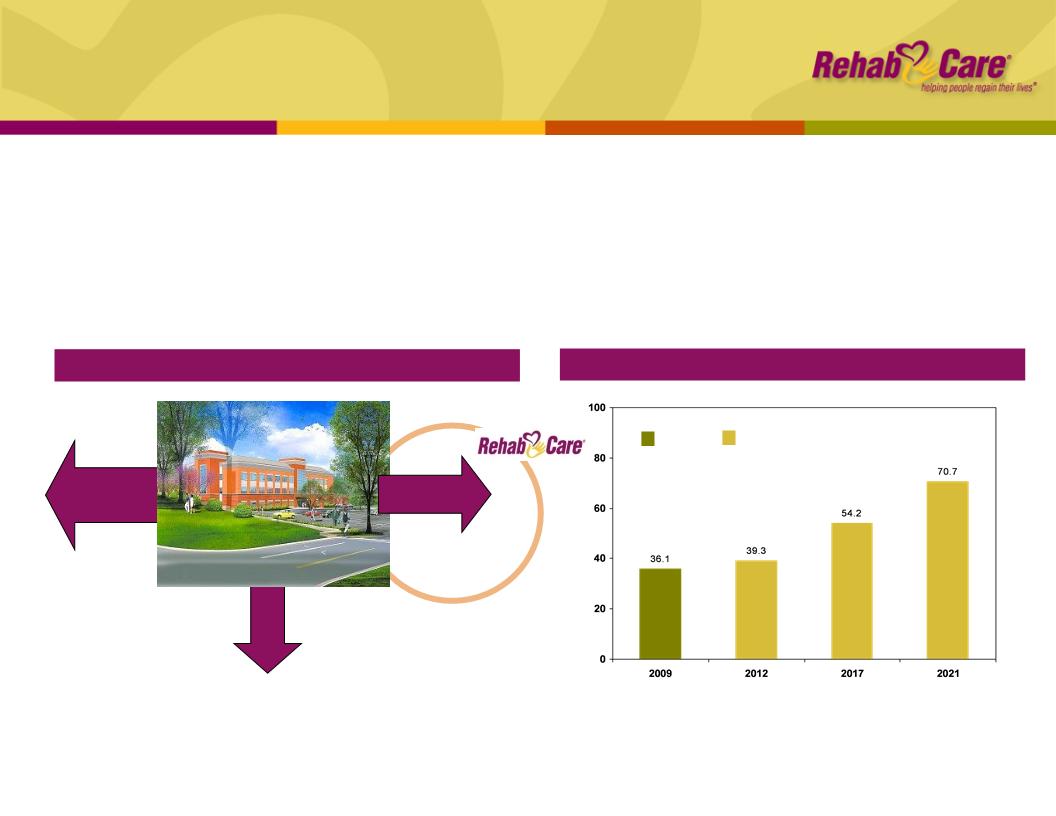
Medicare Post-Acute Spending (in billions)
$
n Positive demographic trends, with first wave of Baby Boomers entering Medicare
this year; ≈ 72% of RehabCare patients are Medicare
this year; ≈ 72% of RehabCare patients are Medicare
n Medicare expenditures for post-acute services (excluding home health) projected
to increase 96% from 2009 to 2021
to increase 96% from 2009 to 2021
Projected3
Actual2
LTACHs = Long-Term Acute Care Hospitals
IRFs = Inpatient Rehabilitation Facilities
SNFs = Skilled Nursing Facilities
LTACH / SNF
IRF
22%

Division Overviews
Skilled Nursing
Rehabilitation Services
n $514 mm - 39% of pro forma
revenue
revenue
n 1,131 SNF/long-term care
programs in 38 states
programs in 38 states
n 8.2 mm annual patient visits
n Polaris Group - consulting for
long-term care facilities
long-term care facilities
n VTA Management Services -
therapy and nurse staffing for
New York
therapy and nurse staffing for
New York
$1.3 billion pro forma1 operating revenues for LTM 9/30/10
Hospital
Rehabilitation Services
n $179 mm - 14% of pro forma
revenue
revenue
n 147 hospital-based programs
in 34 states
in 34 states
n 42,000 IRF discharges/year
n 1.1 mm annual outpatient
visits
visits
n $629 mm - 47% of pro forma
revenue
revenue
n 29 LTACHs, 6 IRFs; 13 states
n 23 FS LTACHs, 6 HIHs; 4 FS
IRFs, 2 HIHs
IRFs, 2 HIHs
n 1,605 licensed LTACH beds;
243 IRF beds
243 IRF beds
n 431,000 annual patient days
FS = Freestanding
HIH = Hospital in Hospital
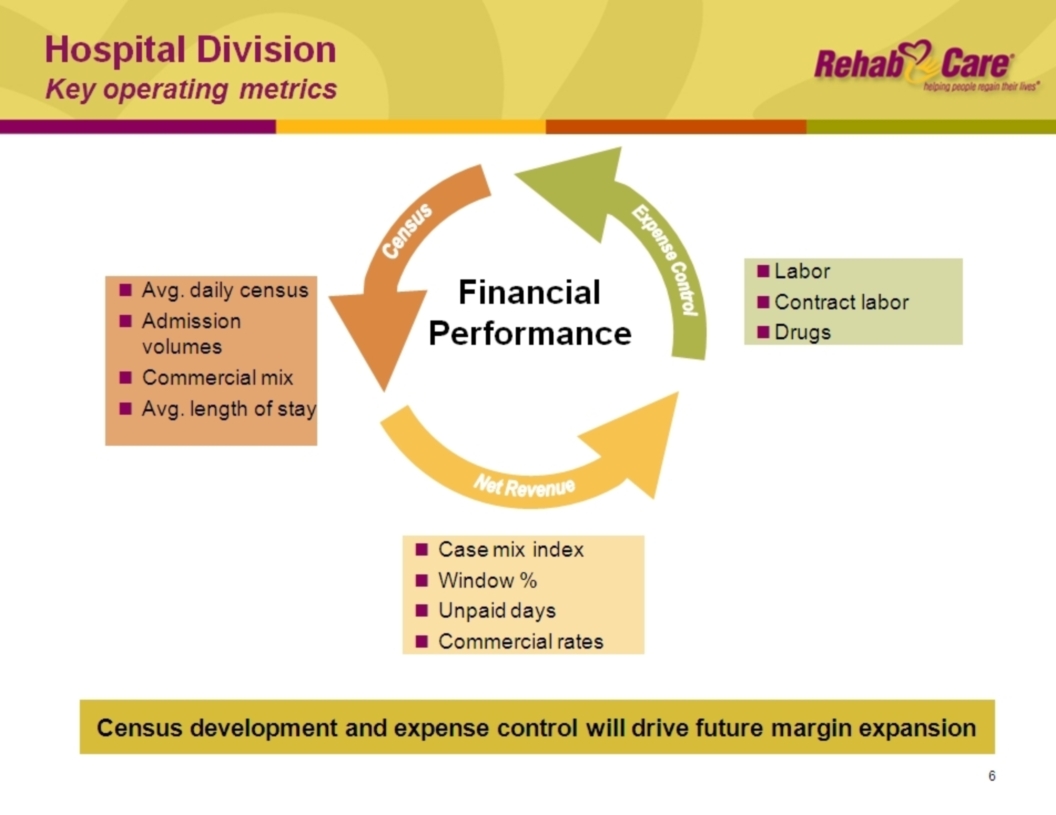
Hospital Division
3
1Reflects acquisition of Triumph HealthCare on Nov. 24, 2009
Hospital Division
Overview
Overview
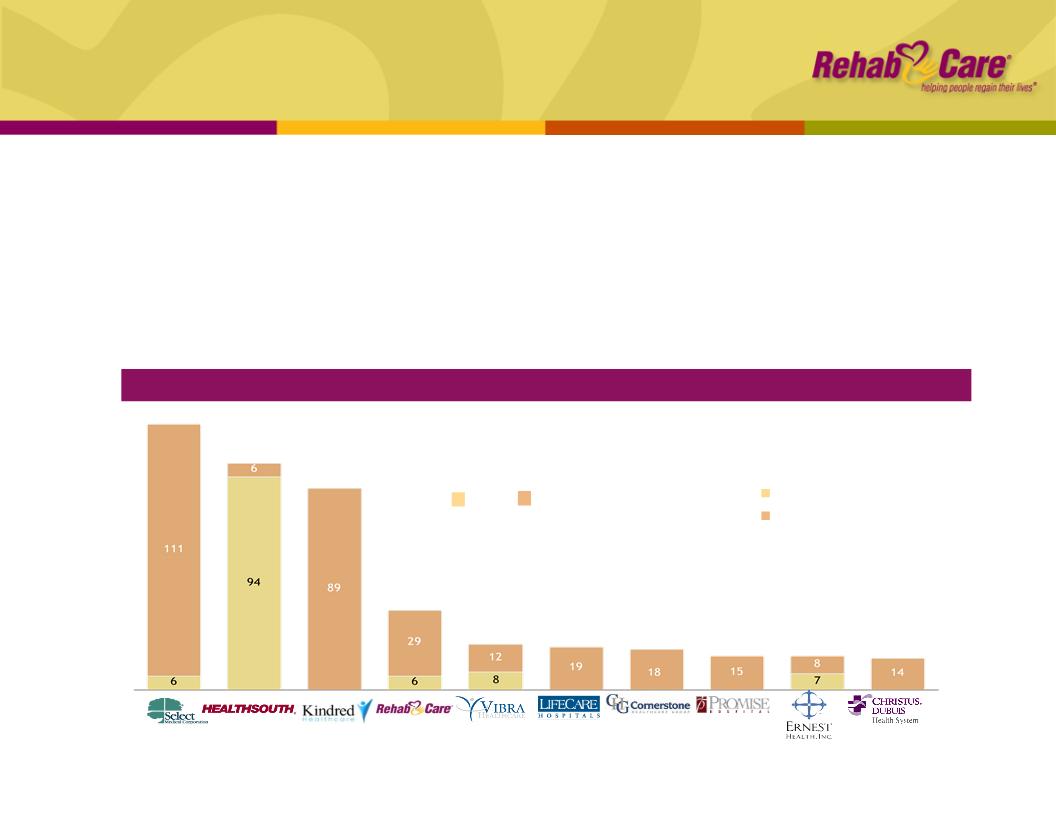
Competitive Landscape
n Owns and operates 35 LTACHs and IRFs
n LTACHs represent the earliest discharge option from the short-term acute care setting
for medically complex patients; IRFs provide intensive rehabilitation with a ≈ 75%
return to community rate
for medically complex patients; IRFs provide intensive rehabilitation with a ≈ 75%
return to community rate
n RehabCare pursues joint venture hospital partnerships (nine currently, representing
15 locations) with market-leading acute care providers and physician groups, in
addition to our wholly owned facilities
15 locations) with market-leading acute care providers and physician groups, in
addition to our wholly owned facilities
Market Size1: 221 IRFs
(FS and HIHs)
Market Size1: 386 LTACHs
IRFs
LTACHs
4
117
100
892
35
20
19
15
15
18
14
1MedPAC, Mar. 2010 Report to the Congress
2Includes acquisition of five LTACHs from Vista Healthcare completed on Nov. 1, 2010 and
new hospital opened in Dec.
new hospital opened in Dec.
Source: Information available from public filings or
company websites
company websites
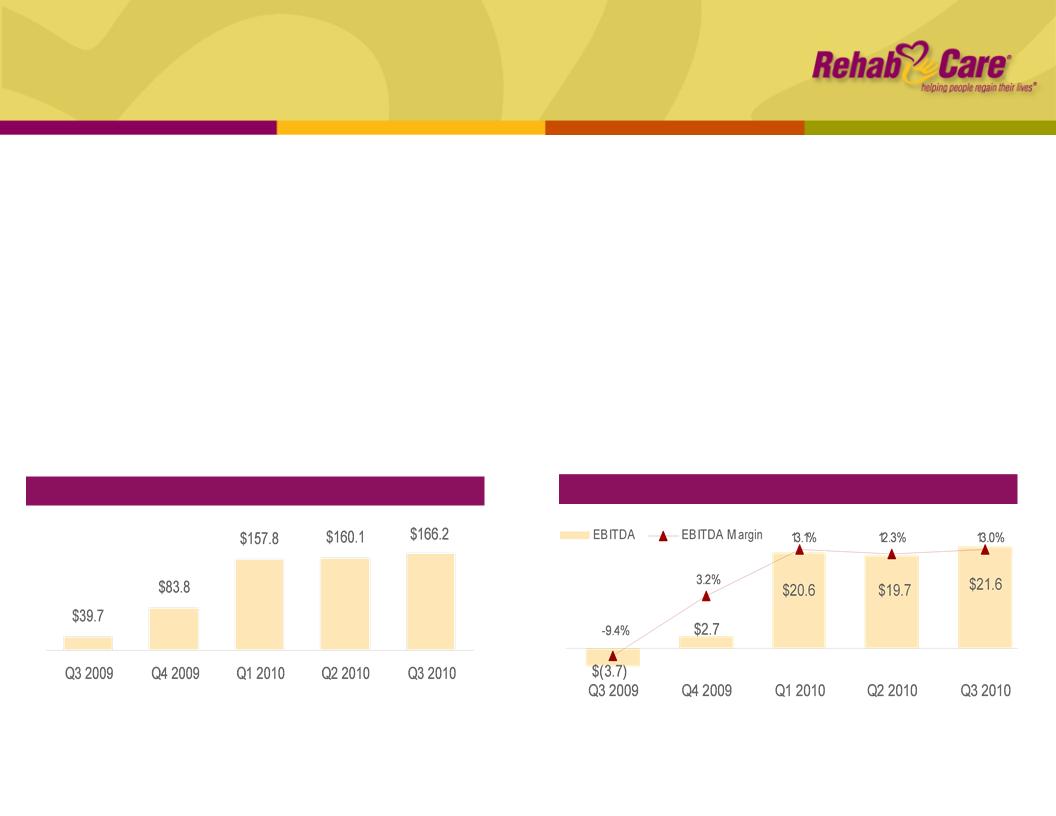
Adjusted Revenue¹ ($mm)
5
Hospital Division
Performance
Performance
1See Appendix for Reconciliation to GAAP
² Excludes a $1.7 mm unfavorable cost report adjustment in Q2’10
Note: Triumph acquired on Nov. 24, 2009
n In 3Q ’10, completed integration of Triumph; 2011 annualized run rate of synergies expected
to be upper end of $5 to $7 mm
to be upper end of $5 to $7 mm
n Volumes grew with the addition of new clinical programs and costs/patient day declined
n Legacy RehabCare hospitals improved same store operating performance by $2.4 mm²
sequentially; now expected to achieve positive operating earnings for full year 2010
sequentially; now expected to achieve positive operating earnings for full year 2010
n Sequential decline in Triumph EBITDA due to operational issues at four hospitals, which
should improve by year end, in addition to slower progress with start-ups in Philadelphia and
Houston Heights
should improve by year end, in addition to slower progress with start-ups in Philadelphia and
Houston Heights
n Focused on census development and expense control to drive margin expansion
Adjusted EBITDA¹ ($mm)

n Continue to improve margins across division
n Expand post-acute services in key markets
n Exchanging 60-bed IRF (Miami, FL) for Select 70-bed LTACH (Northwest IN) - closed Jan. 1,
2011
2011
n Entering 40-bed IRF joint venture with Saint Joseph Regional Medical Center (South Bend, IN) -
closing Q1 ’11
closing Q1 ’11
n Building 46-bed IRF (Northeast Houston, TX) - opening beginning of 2012
n Evaluating several projects that develop our IRF services in continuum markets
n Complete two planned expansion projects
n The Specialty Hospital (Rome, GA) - opening Jan. ’11
n Central Texas Rehabilitation Hospital (Austin, TX) - opening Q1 ’12
n Invest in quality upgrades and new clinical programs and services
Hospital Division
Growth strategy
Growth strategy
7

n Combined revenue of $163 - $168 mm
n EBITDA margin of ≈ 14% driven by sequential improvement in Triumph hospitals
n Beginning in 2011, reported results and outlook will be for the consolidated division
rather than legacy groups and on a year-over-year basis
rather than legacy groups and on a year-over-year basis
Hospital Division
Financial and regulatory outlook
Financial and regulatory outlook
8
Financial (Q4 ’10)
Regulatory
n Rate Year (RY) 2011 rule for LTACHs, effective Oct. 1, 2010, results in a negative 1%
adjustment for our LTACHs
adjustment for our LTACHs
n IRF rule increases payments by a net 2.4% for our owned IRFs
n Healthcare reform legislation extended LTACH provisions contained in the Medicare,
Medicaid and SCHIP Extension Act (MMSEA) through the end of 2012 (see Appendix for
summary of healthcare reform impact)
Medicaid and SCHIP Extension Act (MMSEA) through the end of 2012 (see Appendix for
summary of healthcare reform impact)
Skilled Nursing Rehabilitation Services
Division overview
Division overview
n Manages 1,131 rehab programs for SNFs
n Each Medicare-certified SNF is required to provide physical, speech and occupational therapy,
but many lack the know-how and/or scale to effectively manage a program
but many lack the know-how and/or scale to effectively manage a program
n RehabCare provides a compelling value proposition to our SNF partners
n Access to advanced technology platform
n Broader array of clinical programming
n Better access to scarce therapist labor pool
n Reimbursement expertise and denials management
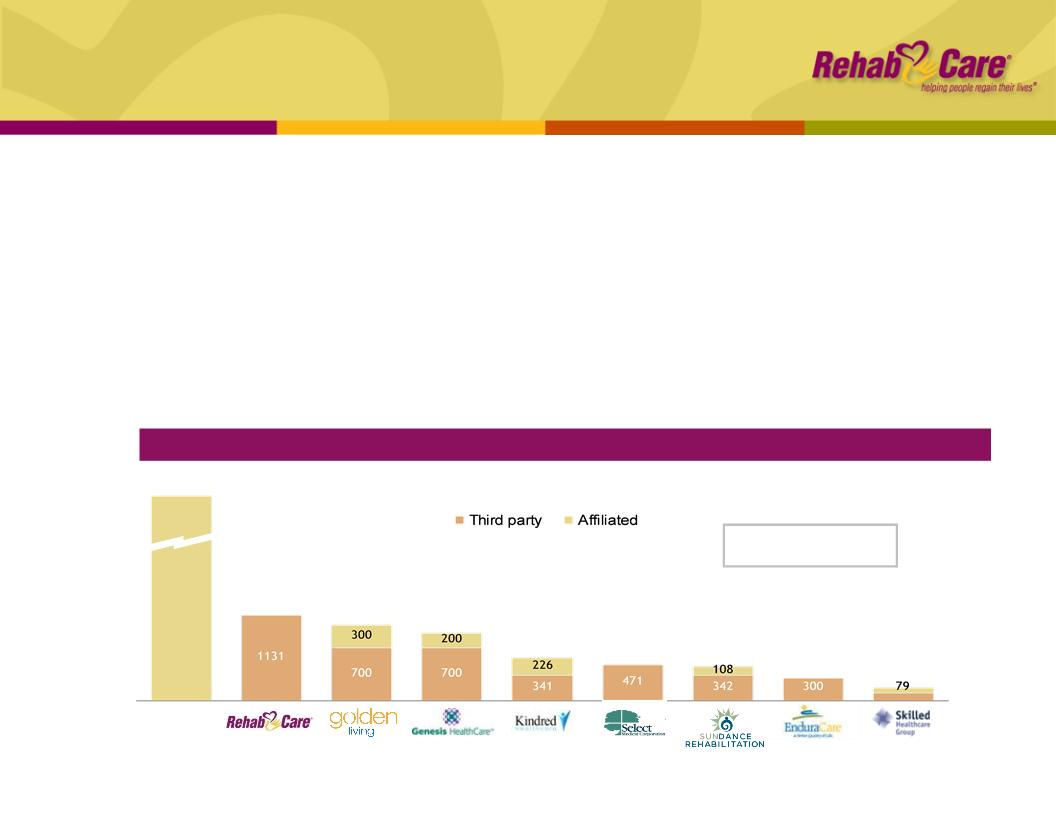
Source: Information available from public filings or from company websites
¹Source: MedPAC Report to Congress, Mar. 2010
Competitive Landscape — # of facilities served
Self-
operated
11,000+
1,131
1,000
900
567
471
450
300
179
Market Size1: 15,000+
Medicare-certified SNFs
Medicare-certified SNFs
9
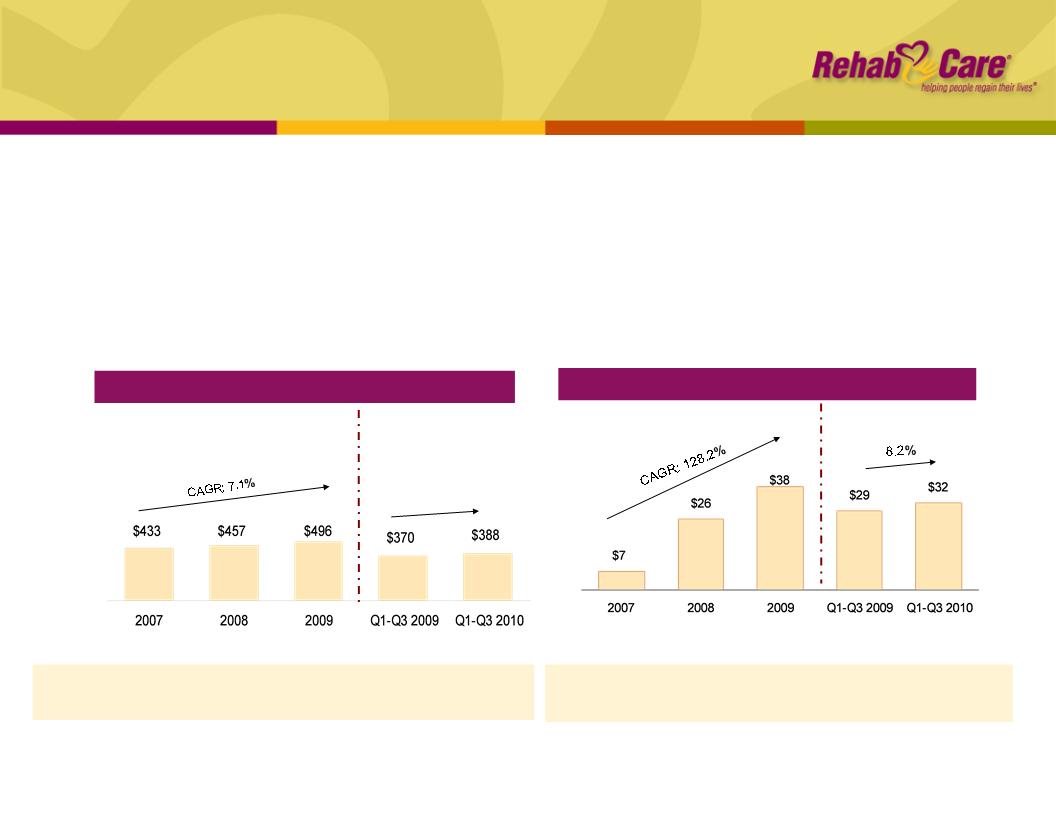
Skilled Nursing Rehabilitation Services
Performance
Performance
Note: Includes Symphony HealthCare acquisition as of July 1, 2006
1Same store analysis does not include Symphony
% Margin: 1.7% 5.6% 7.6% 7.9% 8.2%
Operating Earnings ($ mm)
10
n In Q3 ’10, achieved 7.9% operating earnings margin while preparing for Oct. 1
regulatory changes and implementing new information system technologies
regulatory changes and implementing new information system technologies
n Reduced concurrent therapy utilization to less than 1% at end of Oct.
n Sales were strong, but closures were ahead of projections
n Same store revenue has begun to moderate as smaller, less profitable units have been
culled from the portfolio and benefit of IRF 60% Rule to patient mix has been realized
culled from the portfolio and benefit of IRF 60% Rule to patient mix has been realized
YOY growth: 24.4% 5.6% 8.5% 9.2% 4.8%
Same store: 7.1%1 12.4% 8.8% 10.3% 1.7%
Revenue ($ mm)
4.8%
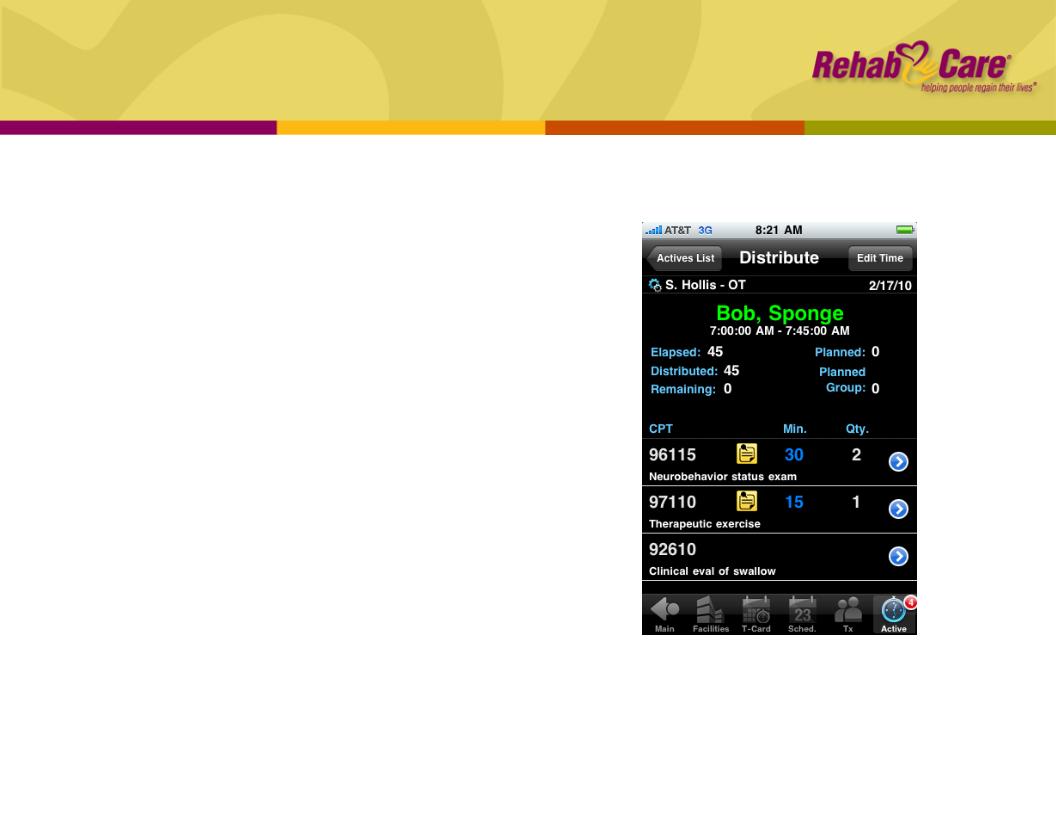
Skilled Nursing Rehabilitation Services
Advanced technology platform
Advanced technology platform
11
n Completing rollout of iTouch technology and
upgraded therapy management platform to all
programs by the beginning of Q2 ’11
upgraded therapy management platform to all
programs by the beginning of Q2 ’11
n Increases speed and accuracy of data input to
maximize therapist productivity, reduce billing errors
and subsequent denials
maximize therapist productivity, reduce billing errors
and subsequent denials
n Tracks real-time patient outcome data, including
discharge location and hospital readmissions
discharge location and hospital readmissions
n Resource Utilization Group (RUG) planner ensures
appropriate RUG category placement and payment
appropriate RUG category placement and payment
n Benchmarking reports provide national comparative
data on key metrics
data on key metrics
n Collaboration with Apple enables data sharing across
the post-acute continuum, providing the basis for
more evidence-based care
the post-acute continuum, providing the basis for
more evidence-based care
http://www.apple.com/ipad/business/profiles/rehabcare/

Skilled Nursing Rehabilitation Services
Financial and regulatory outlook
Financial and regulatory outlook
12
n 5.5% - 6.0% operating earnings margin, which reflects the estimated impact of:
n Regulatory changes
n Concurrent therapy
n Minimum Data Set 3.0 / RUGs IV
n Rollout of new technologies
n Relatively flat unit growth
Financial (Q4 ’10)
Regulatory
n SNF payment update provides a net 1.7% increase in RY2011
n Beginning in 2011, Multiple Procedure Payment Reduction rule will cut reimbursement
for Part B therapy services by ≈ $5 to $6 mm annually
for Part B therapy services by ≈ $5 to $6 mm annually
n Net impact after mitigation expected to be ≈ $2 to $3 mm annually
n Part B therapy cap exceptions process and current Medicare payment rates for
physicians extended through Dec. 31, 2011
physicians extended through Dec. 31, 2011
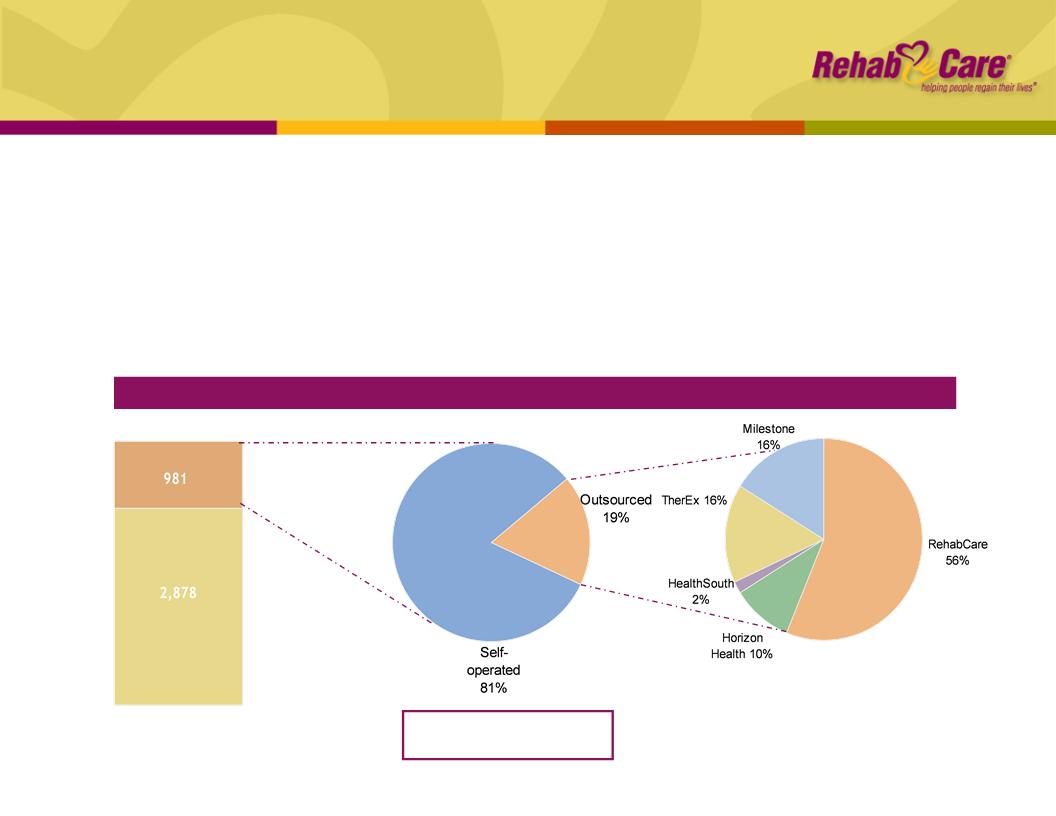
IRF Competitive Landscape
Have IRF
No IRF
n Manages 147 hospital-based IRFs, subacute and outpatient therapy programs on a
contract basis, providing our partners with:
contract basis, providing our partners with:
n Improved internal patient flow
n Ability to attract ≈ 30% admissions from external sources
n Successful clinical outcomes and broader clinical programming (brain, stroke, spinal dysfunction)
n Regulatory compliance (60% rule, Recovery Audit Contractor review, 3-hour rule)
n Recruiting and labor management
3,859¹ short-term acute
care hospitals
care hospitals
190 outsourced
Hospital Rehabilitation Services
Division overview
Division overview
Market Size²: 981 hospital
-based IRFs
-based IRFs
Source: Information available from public filings, company
websites and RehabCare estimates
websites and RehabCare estimates
1American Hospital Directory
²MedPAC Mar. 2010 Report to Congress
13
14
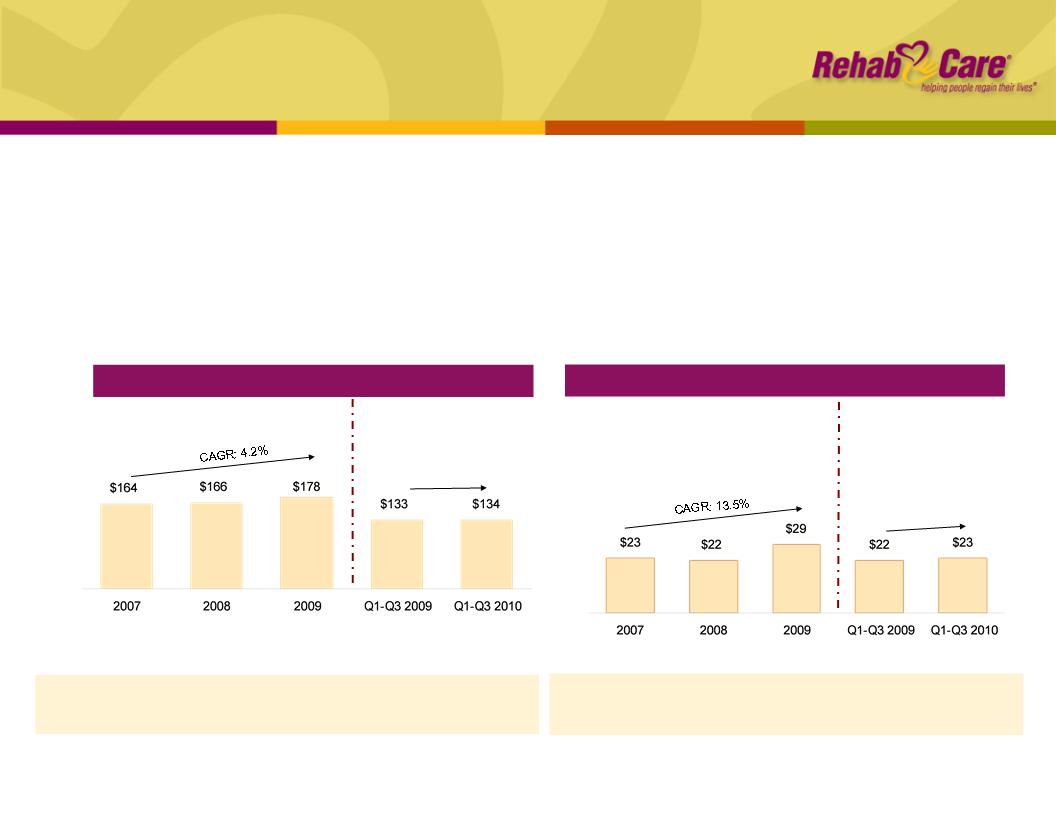
Hospital Rehabilitation Services
Performance
Performance
n In Q3 ’10, inpatient and outpatient same store revenues improved 3.3% and 8%,
respectively, year over year
respectively, year over year
n Better leveraging of SG&A resulted in an 18.7% operating earnings margin in Q3 ’10
n Ended quarter with six signed but unopened contracts, including three IRFs
¹Includes $1.2 mm pretax charge from a bad debt write-down related to an
outpatient transaction
outpatient transaction
YOY growth: (8.7%) 0.9% 7.6% 9.2% 0.3%
IRFs: 107 113 106 110 106
Operating Earnings ($ mm)
% Margin: 14.0% 13.3% 16.6% 16.6% 17.5%
1
Revenue ($ mm)
0.3%
5.4%

Hospital Rehabilitation Services
Growth strategy and outlook
Growth strategy and outlook
15
n ≈ 18% operating earnings margin
n Greater than 6% growth in IRF same store discharges compared to Q4’09
n Net one less IRF program
n Increase market share through:
n Targeted market focus - e.g., small systems
n Product development - e.g., centers of excellence
n Second product sales
n Invest in enabling technology
n Electronic pre-screen to increase speed of admissions,
drive volumes
drive volumes
n Point-of-service technology to improve productivity
n Integration with eRehabData for national benchmarking
capabilities
capabilities
n Opportunity to upsell therapy management services
Growth Strategy
Outlook (Q4 ’10)
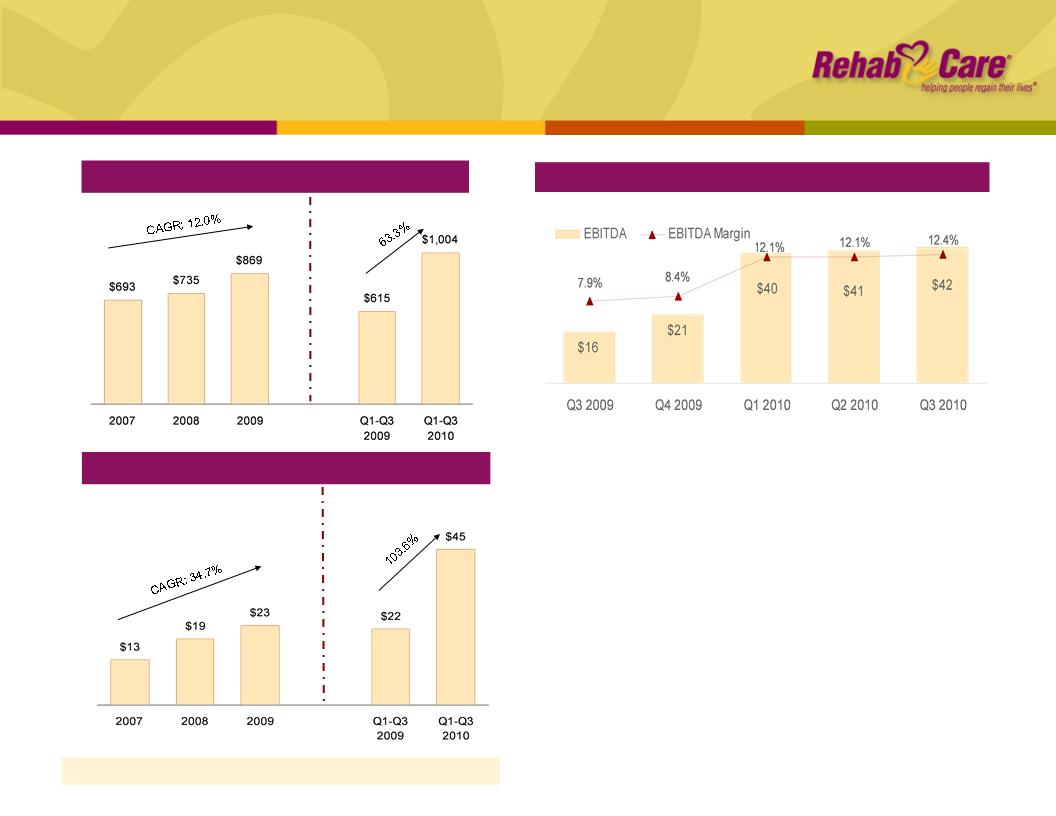
Revenue ($ mm)
¹
Net Earnings ($ mm)
EPS: $0.73 3 $1.05 4 $ 1.22 5 $1.24 5 $1.84
16
Consolidated Financial Summary
1RehabCare 2009 historical includes $39.7 mm in revenue generated by Triumph
2See Appendix for Reconciliation to GAAP
3Includes $0.17 per diluted share impairment charge on an intangible asset
4Includes $0.09 per diluted share in charges related to a bad debt write-down of an
outpatient transaction and cancellation of a planned acquisition and development
project
outpatient transaction and cancellation of a planned acquisition and development
project
5Includes transaction and severance related charges of $0.07 in Q3 ’09 and $0.41 per
diluted share in 2009
diluted share in 2009
Adjusted EBITDA² ($mm)
17
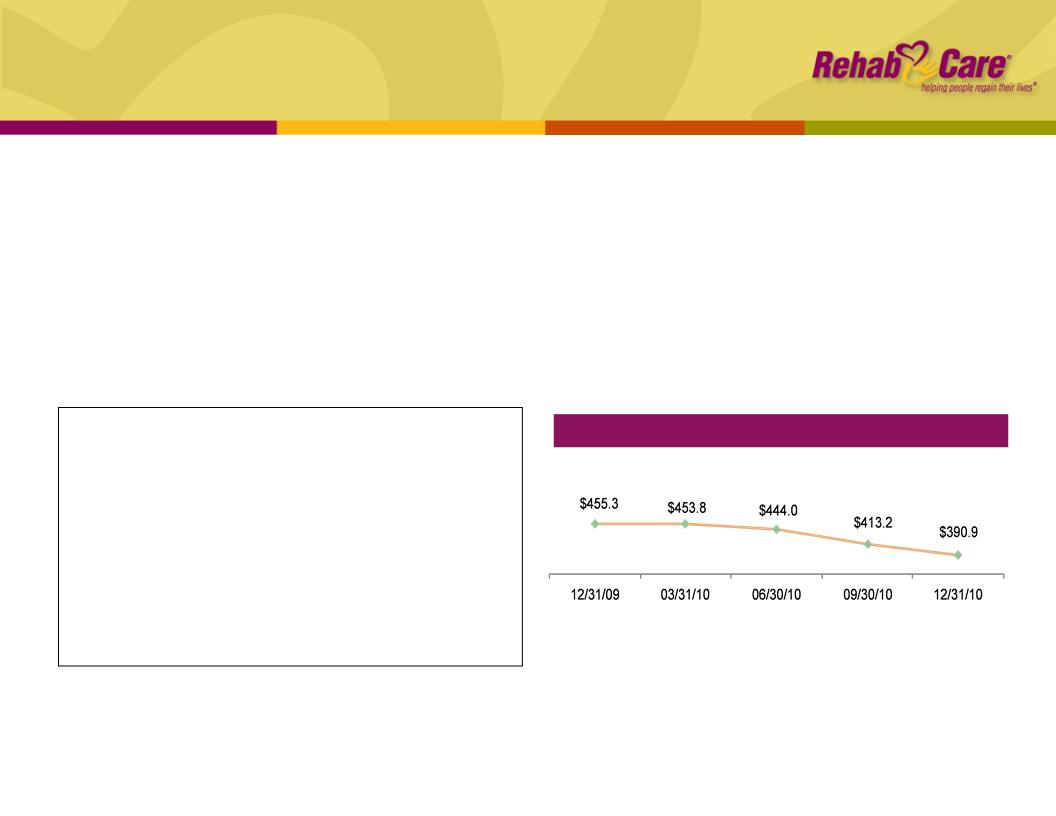
Consolidated Balance Sheet
n Cash flow from operations was $68.7 mm for nine months ended Sept. 30, 2010
compared with $46.6 mm in the prior year period
compared with $46.6 mm in the prior year period
n Days sales outstanding was 61.9 days at Sept. 30 compared to 62.1 days at June 30
n Expect DSO of approximately 60 to 63 days
n Capital expenditures anticipated to be $9 mm in Q4 ’10, consisting of information
system investments, expansion projects and maintenance
system investments, expansion projects and maintenance
n Paying down debt is a priority before next significant acquisition
Cash and Cash Equivalents
Total Assets
Total Debt
Stockholders’ Equity
Noncontrolling Interests
Percent of Debt to Total Capital¹
($mm)
$ 22.5
1,122.5
413.2
484.5
20.9
45%
9/30/10
1Total capital represents the sum of debt, stockholders’ equity and noncontrolling interests
Total Debt ($mm)

18
Forward-looking statements have been provided pursuant to the safe harbor
provisions of the Private Securities Litigation Reform Act of 1995. Such statements
are based on the Company’s current expectations and could be affected by
numerous factors, risks and uncertainties discussed in the Company’s filings with
the Securities and Exchange Commission, including its most recent report on
Form 10-K, subsequent reports on Form 10-Q and current reports on Form 8-K.
Do not rely on forward looking statements as the Company cannot predict or
control many factors that affect its ability to achieve the results estimated. The
Company makes no promise to update any forward looking statements whether as
a result of changes in underlying factors, new information, future events or otherwise.

Appendix
19

|
|
Apr. 1, 2010
|
RY 2011
|
RY 2012-13
|
RY 2014
|
RY 2015-16
|
RY 2017-19
|
|
IRF
|
0.25
|
0.25
|
0.10
|
0.30
|
0.20
|
0.75
|
|
LTACH
|
0.25
|
0.50
|
0.10
|
0.30
|
0.20
|
0.75
|
Impact of Healthcare Reform
20
n Extends LTACH provisions of MMSEA through Dec 2012
n Maintains existing status related to 25% Rule and short-stay outliers
n Delays one-time budget neutrality adjustment (estimated at 3.75%)
n Continues moratorium on new LTACH beds while facility criteria is established
n Establishes reductions in market basket updates for IRFs and LTACHs
n Productivity (negative) adjustments for SNFs, IRFs and LTACHs beginning in 2012
n Prohibits physician ownership of hospitals and creates new transparency, reporting
and expansion requirements for “grandfathered” hospitals
and expansion requirements for “grandfathered” hospitals
n Beginning in 2012, allows providers organized as Accountable Care Organizations
that voluntarily meet quality thresholds to share in cost savings achieved in
Medicare program
that voluntarily meet quality thresholds to share in cost savings achieved in
Medicare program

Impact of Healthcare Reform
21
n Establishes a national pilot program by 2013 to study effectiveness of bundled
payment system for hospital+physician+post-acute services delivered three days
prior to hospitalization through 30 days post-discharge
payment system for hospital+physician+post-acute services delivered three days
prior to hospitalization through 30 days post-discharge
n Continuing Care Hospital (CCH) is one of the suggested models to study under
required Innovation Center
required Innovation Center
n CCH is a post-acute, capitative hospital model that would serve complex rehabilitation
and medical patients by providing patient-specific levels of care for a 30-day period
and medical patients by providing patient-specific levels of care for a 30-day period
n In 2015, establishes Medicare Independent Payment Advisory Board (IPAB); IRFs
and LTACHs exempt from any binding proposals of IPAB
and LTACHs exempt from any binding proposals of IPAB

22
Primary Post-Acute Settings
Overview
Overview
|
|
Long-Term Acute Care Hospitals
|
Skilled Nursing Facilities
|
Inpatient Rehab Facilities
|
|
Medicare
Spending 2009 |
$4.9 billion
|
$25.5 billion
(est. $6 billion rehab) |
$5.7 billion
|
|
Patients Served
2008 |
130,869 Medicare discharges
|
2.6 million Medicare admissions
|
370,048 Medicare discharges
|
|
Type of Patient
|
High acuity
|
Low to moderate acuity, may
require some rehab |
High acuity, requires extensive
rehab (min 3 hrs/day) |
|
Avg. Length of
Stay |
At least 25 days (Medicare patients)
|
27 days
|
13.2 days
|
|
Medicare
Reimbursement |
LTACH PPS - Receive a single payment
when Medicare beneficiary is discharged for all services rendered |
SNF PPS - Receive a per diem
payment under both Medicare Part A and state Medicaid programs |
IRF PPS- Receive a single
payment when Medicare beneficiary is discharged for all services rendered |
|
Medicare
Requirements |
• Average length of stay of all Medicare
patients must be >25 days • 25% rule: no more than 25% of
patients may be referred from a single source (HIHs fixed at 50% through 2012, no cap on FS or co-located) • Moratorium on new LTACH beds until
2013 |
Medicare covers up to 100 days
of SNF care following an acute hospital stay of at least 3 days |
60% Rule: 60% of patients
must satisfy one of 13 defined conditions |
Source: MedPAC
FS = Freestanding
HIH = Hospital in Hospital
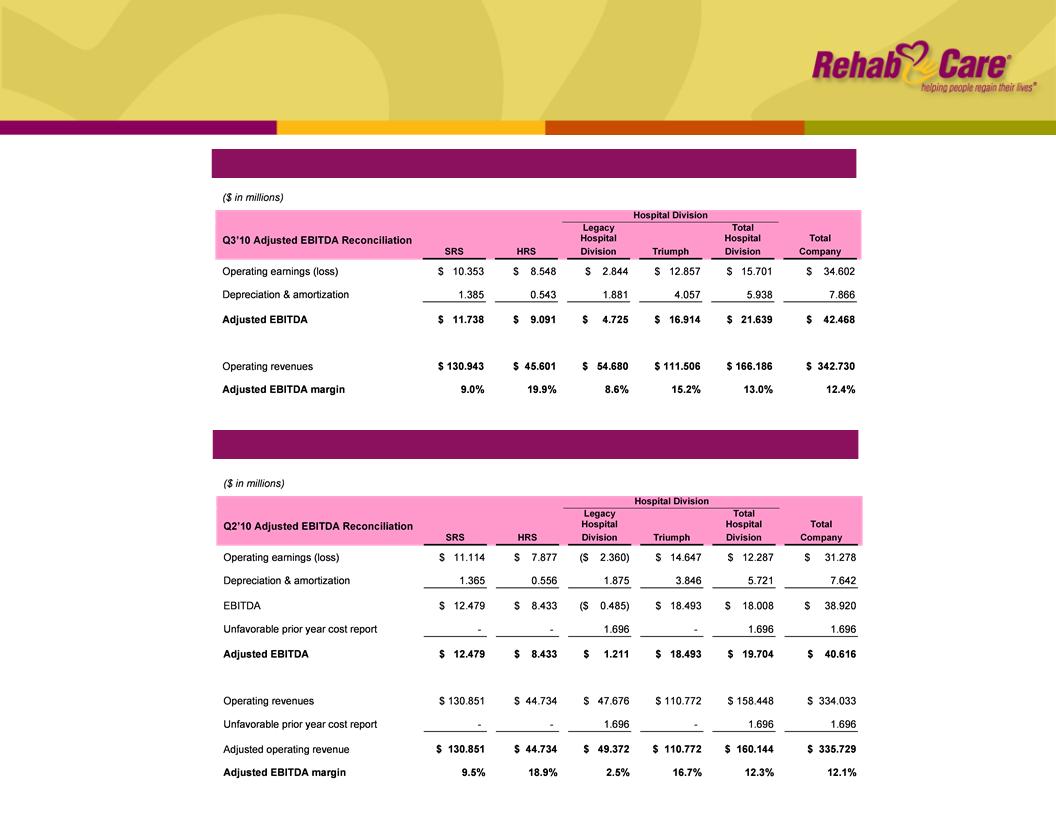
Q3 ’10 and Q2 ’10 Adjusted EBITDA
Reconciliations
Reconciliations
23
Q2 ’10 Adjusted EBITDA Reconciliation
Q3 ’10 Adjusted EBITDA Reconciliation
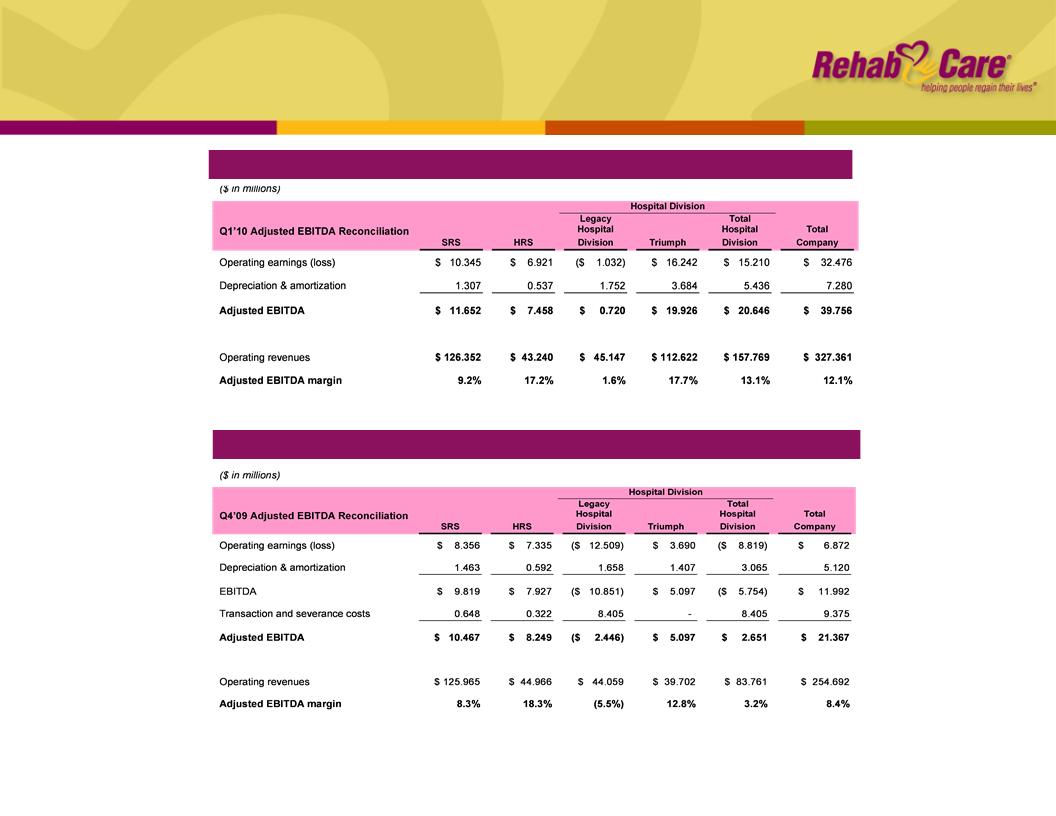
Q1 ’10 and Q4 ’09 Adjusted EBITDA
Reconciliation
Reconciliation
24
Q1 ’10 Adjusted EBITDA Reconciliation
Q4 ’09 Adjusted EBITDA Reconciliation
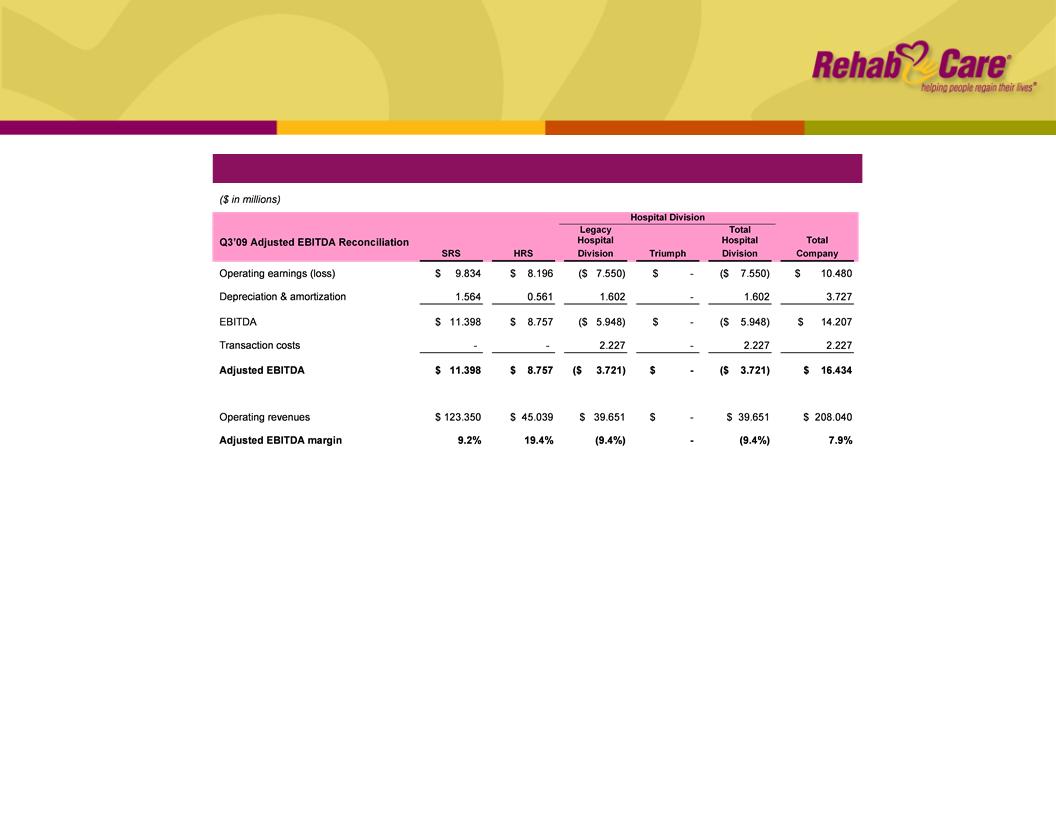
Q3 ’09 Adjusted EBITDA Reconciliation
25
Q3 ’09 Adjusted EBITDA Reconciliation