UNITED STATES
SECURITIES AND EXCHANGE COMMISSION
Washington, D.C. 20549
FORM 10-K
ANNUAL REPORT PURSUANT TO SECTION 13 OR 15(d) OF THE SECURITIES
EXCHANGE ACT OF 1934
For fiscal year ended, SEPTEMBER 30, 2010
Commission File Number 1-9965
KEITHLEY INSTRUMENTS, INC.
(Exact name of registrant as specified in its charter)
| |
|
|
|
Ohio
(State or other jurisdiction of incorporation or organization)
|
|
34-0794417
(I.R.S. Employer Identification No.) |
Address of principal executive offices: 28775 Aurora Road, Solon, Ohio, 44139
Registrant’s telephone number, including area code: (440) 248-0400
Securities registered pursuant to section 12(b) of the Act:
| |
|
|
|
| Common Shares, Without Par Value
|
|
New York Stock Exchange |
| (Title of Each Class)
|
|
(Name of Each Exchange on Which Registered) |
Securities registered pursuant to Section 12(g) of the Act: None
Indicate by check mark if the registrant is a well-known seasoned issuer, as defined in Rule 405 of
the Securities Act.
Yes o No þ
Indicate by check mark if the registrant is not required to file reports pursuant to Section 13 or
Section 15(d) of the Act.
Yes o No þ
Indicate by check mark whether the registrant: (1) has filed all reports required to be filed by
Section 13 or 15(d) of the Securities Exchange Act of 1934 during the preceding 12 months (or for
such shorter period that the registrant was required to file such reports), and (2) has been
subject to such filing requirements for the past 90 days.
Yes þ No o
Indicate by check mark whether the registrant has submitted electronically and posted on its
corporate Web site, if any, every Interactive Data File required to be submitted and posted
pursuant to Rule 405 of Regulation S-T during the preceding 12 months (or for such shorter period
that the registrant was required to submit and post such files). Yes o No o
Indicate by check mark if disclosure of delinquent filers pursuant to Item 405 of Regulation S-K is
not contained herein, and will not be contained, to the best of the registrant’s knowledge, in
definitive proxy or information statements incorporated by reference in Part III of this Form 10-K
or any amendment to this Form 10-K. þ
Indicate by check mark whether the registrant is a large accelerated filer, an accelerated filer, a
non-accelerated filer, or a smaller reporting company. See the definitions of “large accelerated
filer,” “accelerated filer” and “smaller reporting company” in Rule 12b-2 of the Exchange Act.
(Check one):
|
|
|
|
|
|
|
| |
|
|
|
|
|
|
| Large accelerated filer o
|
|
Accelerated filer þ
|
|
Non-accelerated filer o
|
|
Smaller reporting company o |
|
|
|
|
|
(Do not check if a smaller reporting company) |
|
|
Indicate by check mark whether the registrant is a shell company (as defined in Rule 12b-2 of the
Act).
Yes o No þ
The aggregate market value of the Common Shares of the Registrant held by non-affiliates was $85.74
million and the aggregate market value of the Class B Common Shares of the Registrant held by
non-affiliates was $0.13 million for a total aggregate market value of all classes of Common Shares
held by non-affiliates of $85.87 million at March 31, 2010, the Registrant’s most recently
completed second fiscal quarter. While the Class B Common Shares are not listed for public trading
on any exchange or market system, shares of that class are convertible into Common Shares at any
time on a share-for-share basis. The market values indicated were calculated based upon the last
sale price of the Common Shares as reported by the New York Stock Exchange on March 31, 2010, which
was $6.60.
As of December 8, 2010 (last practicable date), there were outstanding 13,778,741 Common Shares
(net of shares repurchased held in treasury), without par value, and 2,150,502 Class B Common
Shares, without par value.
Keithley Instruments, Inc.
10-K Annual Report
Table of Contents
2
Forward-Looking Statements
Statements and information included in this Annual Report on Form 10-K that are not purely
historical are forward-looking statements intended to be covered by the “safe harbor” provisions of
the Private Securities Litigation Reform Act of 1995.
Forward-looking statements in this Report on Form 10-K include statements regarding Keithley’s
expectations, intentions, beliefs, and strategies regarding the future, including recent trends,
cyclicality, growth in the markets into which Keithley sells, conditions of the electronics
industry and the economy in general, deployment of our own sales employees throughout the world,
expected cost savings from recent cost-cutting actions, investments to develop new products, the
potential impact of adopting new accounting pronouncements, our future effective tax rates,
liquidity position, ability to generate cash, expected growth, and obligations under our retirement
benefit plans.
When used in this report, the words “believes,” “expects,” “anticipates,” “intends,” “assumes,”
“estimates,” “evaluates,” “opinions,” “forecasts,” “may,” “could,” “future,” “forward,”
“potential,” “probable,” and similar expressions are intended to identify forward-looking
statements.
These forward-looking statements involve risks and uncertainties. We may make other forward-looking
statements from time to time, including in press releases and public conference calls and webcasts.
All forward-looking statements made by Keithley are based on information available to us at the
time the statements are made, and we assume no obligation to update any forward-looking statements.
It is important to note that the forward-looking statements are subject to a number of risks and
uncertainties that could cause actual results to differ materially from those included in such
forward-looking statements. Some of these risks and uncertainties are discussed below in Item 1A
Risk Factors of this Form 10-K.
PART I
ITEM 1 — BUSINESS
General
Keithley Instruments, Inc. was founded in 1946 and organized as an Ohio corporation in 1955. Its
principal executive offices are located at 28775 Aurora Road, Solon, Ohio 44139; telephone (440)
248-0400. References herein to the “Company,” “Keithley,” “we” or “our” are to Keithley
Instruments, Inc. and its subsidiaries unless the context indicates otherwise.
On December 8, 2010, the Company completed the transactions contemplated by the Agreement and
Plan of Merger (the “Merger Agreement”) dated
September 29, 2010, among Danaher Corporation
(“Danaher”), Aegean Acquisition Corp. and the Company. Pursuant to the Merger Agreement, Aegean
Acquisition Corp. was merged into the Company and each outstanding Common Share and Class B
Common Share of the Company was converted into the right to receive $21.60 per share in cash.
We design, develop, manufacture, and market complex electronic instruments and systems geared to
the specialized needs of engineers at electronics manufacturers and academic institutions for
research, product development, high-performance production testing and process monitoring. We
currently offer approximately 500 products used to source, measure, connect, control or communicate
direct current (DC) and alternating current (AC) signals. Our product offerings include integrated
systems solutions, along with instruments and data acquisition modules that can be used as system
components or stand-alone solutions. Customers of our products are scientists and engineers in the
worldwide electronics industry involved with advanced materials research, semiconductor device
development and fabrication, and the production of electronic systems and products.
During the fiscal year ended September 30, 2010, or fiscal 2010, approximately 35 percent of our
orders were received from the semiconductor industry; approximately 5 percent came from the
wireless communications customer group; approximately 25 percent came from the precision
electronics customer group, which includes customers in automotive, computers and peripherals,
medical equipment, aerospace and defense, and manufacturers of components; and approximately 25
percent came from research and education customers. The remainder of orders came from customers in
a variety of other industries. Although our products vary in capability, sophistication, use, size
and price, they generally test, measure and analyze electrical, optical or physical properties. As
such, we consider our business to be in a single industry segment.
3
Business Strategy
We have focused our efforts on identifying test applications within segments of the electronics
test and measurement industry that have high rates of technology change, long-term growth in
demand, and a meaningful market size, and that leverage our measurement capabilities and/or other
test applications. New products are an important factor in our sales growth strategy, and we have
generally sought to maintain our investment in product development activity spending levels to
expand our product offering and accelerate the introduction of new products. During fiscal 2009,
however, the significant decline in our revenues as a result of global economic conditions made it
difficult for us to continue product development spending at historical levels. As a result, we
selectively reduced these costs, most notably by exiting our S600 parametric test line, reducing
worldwide headcounts, eliminating or curtailing various discretionary spending items, and in fiscal
2010, selling our RF product line. Our product development spending is now more focused on
expanding and enhancing our core product lines.
We work closely with our customers to build partnerships in order to anticipate their current and
future measurement needs. A thorough understanding of their applications coupled with our precision
measurement technology enables us to add value to our customers’ processes improving the quality,
throughput and yield of their products, as well as to determine which test applications we will
choose to serve. We believe our ability to serve our customers has been aided by deploying our own
sales and support employees throughout the Americas, Europe and Asia, as opposed to relying on an
independent sales force.
We leverage our applications expertise and product platforms to other industries. By concentrating
on interrelated industries and product technologies, we are able to gain insight into measurement
problems experienced by one set of customers that can be addressed and offered as solutions for
others. Our applications knowledge and technology solutions in one area build credibility as we
expand to related fields, often using the same measurement platforms that are already proven among
a variety of customers.
Product Offerings
We have approximately 500 products used to source, measure, connect, control or communicate direct
current and alternating current signals. Product offerings include integrated systems solutions,
along with instruments and data acquisition modules that can be used as system components or
stand-alone solutions. Prices per product vary. Our semiconductor characterization systems range in
price from $25,000 to $200,000. Bench top instruments generally range in price from $1,000 to
$25,000 on a stand-alone basis and from $15,000 to $35,000 when used as a system. Switch systems
generally range in price from $2,000 to $50,000. PC plug-in boards are used for process control and
data collection applications. Selling prices generally range from $200 for a single module to
$4,000 for a system. In February 2009, we announced the exit of our S600 series parametric test
product line. We continued to accept orders through fiscal 2010 and will provide technical support,
calibration, and repair services through 2014 or longer if parts are
available. In November 2009, we sold
substantially all of our RF product line, which will continue to be supported by Agilent
Technologies, Inc. (Agilent).
New Products During Fiscal Year 2010
Our objective is to grow faster than the overall test and measurement industry by pursuing
applications that outpace overall demand for test and measurement equipment. New products play a
critical role in providing us the opportunity to achieve this higher growth rate. During fiscal
2010, we introduced several new products and enhancements that add complementary capability to our
product offering. These products provide our customers with critical tools to serve their
production test application and research and development needs.
We introduced the Model 4225-PMU Ultra-Fast I-V instrument module, the latest addition to our
growing range of instrumentation options for the Model 4200-SCS Semiconductor Characterization
System. It integrates ultra-fast voltage waveform generation and current/voltage measurement
capabilities into the Model 4200-SCS’s test environment, and allows semiconductor companies and
researchers to gain further insight as they work on new materials, shrinking geometries and new
devices. Its measurement capabilities make it well-suited for applications that demand both
ultra-fast voltage outputs and synchronized current-voltage measurements. Unlike competitive
units that require up to three separate test stands, the Model 4225-PMU is able to deliver this
measurement performance within a single instrument platform.
We introduced the Model 3732 Quad 4x28 Ultra-High Density Reed Relay Matrix Card, which was
designed for automated switch measure applications that require multiple instrument connections
as well as high crosspoint density and high speed. The Company’s Series 3700 System
Switch/Multimeter and Plug-in Card Family offers users the accuracy and flexibility of
instrument-grade switching integrated with low-noise, high performance multimeter instruments.
4
The Company released its ACS Basic Edition Version 1.2 Semiconductor Parametric Test Software for
semiconductor test and
measurement applications. This software upgrade adds new levels of usability, convenience and
productivity in the characterization of component and discrete semiconductor devices.
The Company also introduced the six-slot Model 707B and single-slot Model 708B switch matrix
mainframes, which are optimized for both research and development and production semiconductor test
applications. Both of these new mainframes incorporate the
Company’s virtual backplane technology
implemented with our Test Script Processor architecture which provides substantial throughput
advantages over competitive models. These switch mainframes are also key components of the S530
parametric test system.
Geographic Markets and Distribution
During fiscal 2010, the majority of our products were manufactured in Ohio and were sold in over 80
countries throughout the world. Our principal markets are Asia, Europe and the United States.
In the United States, our products are sold by our own sales personnel and through direct marketing
and catalog mailings. Outside the United States, we market our products directly in countries in
which we have sales offices and through distributors or manufacturers’ representatives in other
countries. We have subsidiary sales and service offices located in Great Britain, Germany, France,
the Netherlands, Italy, Japan, Malaysia and China. We also have sales offices in Belgium, Korea,
Taiwan, India and Singapore.
Sources and Availability of Raw Materials
Our products require a wide variety of electronic and mechanical components, most of which are
purchased. We have multiple sources for the vast majority of the components and materials we use;
however, there are some instances in which the components are obtained from a sole-source supplier.
If we were unable to purchase components or materials from a sole-source supplier, we could
experience a temporary adverse impact on operations; however, we believe alternative sources could
be found. Although shortages of purchased materials and components have been experienced from time
to time, these items have generally been available as needed.
Patents
Electronic instruments of the nature we design, develop and manufacture generally cannot be
patented in their entirety. Although we hold patents with respect to certain of our products, we do
not believe our business is dependent to any material extent upon any single patent or group of
patents because of the rapid rate of technological change in the industry.
Seasonal Trends and Working Capital Requirements
Our business is not subject to significant seasonal trends. However, many of the industries we
serve, including the semiconductor industry, the wireless communications industry and other sectors
of the global electronics industry, historically have been cyclical. We generally maintain adequate
working capital to support our business and do not have any unusual working capital requirements.
Customers
Our customers generally are involved in production test, engineering research and development,
electronic service or repair, and educational and governmental research. During fiscal year 2010,
no one customer accounted for more than 10 percent of our sales. We do not believe that the loss of
any one customer would materially affect our sales or net income.
Backlog
Our
backlog of unfilled orders amounted to approximately $18.0 million as of September 30, 2010,
and approximately $12.2 million as of September 30, 2009. We expect that substantially all of the
orders included in the 2010 backlog will be delivered during fiscal 2011. A portion of orders
included in backlog may be canceled by the customer prior to shipment. The level of backlog at any
given time will be affected by the timing of our receipt of orders, the speed with which those
orders are filled and our customers’ requested delivery schedules. Accordingly, our backlog as of
September 30, 2010, may not necessarily represent the actual amount of shipments or sales for any
future period.
5
Competition
The Company competes on the basis of quality, performance, service, product availability, and
price, with quality and performance frequently being the most important. There are many firms in
the world engaged in the manufacture of electronic measurement instruments, some of which are
larger and have greater financial resources than the Company. In general, the Company competes with
a number of companies in specialized areas of the test and measurement industry and one large broad
line measurement products supplier, Agilent Technologies, Inc.
Research and Development
Our engineering development activities are directed toward the development of new products that
will complement, replace or add to the products currently included in our product line. We do not
perform basic research, but on an ongoing basis we utilize new component and software technologies
in the development of our products. The highly technical nature of our products and the rapid rate
of technological change in the industry require a large and continuing commitment to engineering
development efforts. Product development expenses were $12.1 million in 2010, $18.0 million in 2009
and $25.5 million in 2008, or approximately 10%, 18% and 17% of net sales, respectively, for each
of the last three fiscal years.
Government Regulations
We believe our current operations and uses of property, plant and equipment conform in all material
respects to applicable laws and regulations. Keithley has not experienced, nor do we anticipate,
any material claim or material capital expenditure in connection with environmental laws and other
regulations.
Employees
As of September 30, 2010, the Company employed approximately 490 persons, 161 of whom were located
outside the United States. None of our employees are covered under the terms of a collective
bargaining agreement, and we believe that relations with our employees are good.
Foreign Operations and Export Sales
Information related to foreign and
domestic operations and export sales is contained in Note P of
the Notes to the Consolidated Financial Statements included in Item 8 of this Form 10-K.
During fiscal 2010, non-U.S. sales accounted for more than 70 percent of our revenue. There are
several risks attendant to such foreign operations. These risks include increased exposure to the
risk of foreign currency fluctuations and the potential economic and political impacts from
conducting business in foreign countries. With the exception of changes in the value of foreign
currencies, which are not possible to predict, we believe our foreign subsidiaries and other larger
international markets are in countries where the economic and political climates generally are
stable. The Company also must comply with foreign regulations, which may increase the complexity of
conducting its business.
Executive Officers of the Registrant
Certain information regarding our executive officers is set forth below:
| |
|
|
|
|
|
|
| Name |
|
Position |
|
Age |
|
Joseph P. Keithley
|
|
Chairman of the Board of Directors, President and Chief Executive Officer
|
|
|
61 |
|
Daniel Faia
|
|
Vice President Sales and Support
|
|
|
43 |
|
Mark A. Hoersten
|
|
Vice President Marketing
|
|
|
52 |
|
Larry L. Pendergrass
|
|
Vice President New Product Development
|
|
|
55 |
|
Mark J. Plush
|
|
Senior Vice President and Chief Financial Officer
|
|
|
61 |
|
Linda C. Rae
|
|
Executive Vice President and Chief Operating Officer
|
|
|
45 |
|
| |
|
|
Joseph P. Keithley was elected Chairman of the Board of Directors in February 1991. He was
elected Chief Executive Officer in November 1993, and President in May 1994. He has been a
Director since 1986, and was elected Vice Chairman of the Board in February 1988. Mr. Keithley
joined the Company in 1976 and held various positions in production, customer service, sales and
marketing prior to being elected Vice President of Marketing in 1986. From 1986 until his
election to Chief Executive Officer in 1993, Mr. Keithley held various management positions
within the Company. He is Chairman of the Board of Nordson Corporation, a worldwide producer of
precision dispensing equipment and manufacturer of equipment used in the testing and inspection
of electronic components as well as technology-based systems for curing and surface treatment
processes, and a director
of Brush Engineered Materials, Inc., which is an integrated producer of high performance
specialty engineered materials used in a variety of electrical, electronic, thermal and
structural applications. |
6
| |
|
|
Daniel Faia joined the Company in February 2009 as Vice President Sales and Support. Prior to
joining Keithley, Mr. Faia served as Vice President/Worldwide Sales and Marketing at Eagle Test
Systems with responsibility for managing global sales, applications and customer service efforts.
Prior to joining Eagle Test, Mr. Faia was employed by Teradyne, Inc. in various sales and product
marketing positions from March 1997 to April 2004. |
| |
| |
|
|
Mark A. Hoersten was elected Vice President Business Management in May 2003, and in September
2008 his role was expanded to Vice President of Marketing. He joined the Company in June 1980 as
a Design Engineer and held various positions in product development and marketing before becoming
Vice President, including Director of Marketing, Telecommunications Test Business Manager, and
General Manager. |
| |
| |
|
|
Larry L. Pendergrass joined the Company in May 2003 as Vice President New Product Development.
Prior to joining Keithley, Mr. Pendergrass had over 20 years experience in research and
development, product development, and manufacturing engineering in various roles including
Section Manager, Project Manager and Project Leader with Agilent Technologies and
Hewlett-Packard. |
| |
| |
|
|
Mark J. Plush was elected Vice President and Chief Financial Officer in October 1998 and was
named Senior Vice President in February 2010. Mr. Plush joined the Company in March 1982 as
Controller and has been an officer of the Company since 1989. |
| |
| |
|
|
Linda C. Rae was elected Executive Vice President and Chief Operating Officer in December 2005.
Ms. Rae joined the Company in September 1995 as a Product Marketer and has held various marketing
positions with the Company since then, including Component Test Business Manager from July 1999
to June 2000, Business Manager of Optoelectronics from June 2000 to April 2001, General Manager
from April 2001 to May 2003, and Senior Vice President and General Manager from May 2003 to
December 2005. |
Available Information
Our website address is http://www.keithley.com. We make our annual reports on Form 10-K, quarterly
reports on Form 10-Q, current reports on Form 8-K and amendments to those reports filed with or
furnished to the U.S. Securities and Exchange Commission (the “SEC”) available to the public free
of charge through our website as soon as reasonably practicable after making such filings. The
public may read and copy any materials we file with the SEC at the SEC’s Public Reference Room at
100 F Street, NE, Washington, DC 20549. The public may also obtain information on the operation of
the Public Reference Room by calling the SEC at 1-800-SEC-0330. Additionally, the SEC maintains an
internet site (http://www.sec.gov) that contains reports, proxy and information statements, and
other information regarding issuers that file electronically with the SEC.
ITEM 1A — RISK FACTORS
Cyclicality of the electronics industry and timing of the current economic downturn and large
orders
Many of the industries we serve, including but not limited to the semiconductor, wireless
communications, and precision electronic industries, have historically been very cyclical and have
experienced periodic downturns. The downturns have had, and may have in the future, a material
adverse impact on our customers’ demand for equipment, including test and measurement equipment.
The severity and length of a downturn also may affect overall access to capital, which could
adversely affect the Company’s customers. These conditions could impact our ability to effectively
manage inventory levels, create unabsorbed costs due to lower net sales and ultimately result in
write downs of assets, which would adversely affect our profitability.
The factors leading to and the severity and length of a downturn are difficult to predict and there
can be no assurance that we will appropriately anticipate changes in the underlying end markets we
serve or that any increased levels of business activity will continue as a trend into the future.
Our orders are cancelable by customers, and consequently, orders outstanding at the end of a
reporting period may not result in realized sales in the future. Orders from our top 25 customers
during the quarter can generally vary between 20-35 percent of
our total quarterly orders. This can cause our financial results to fluctuate from quarter to quarter.
7
Rapid technology changes
Our business strategy includes significant investment in and expenditures for product development.
We sell our products in several industries that are characterized by rapid and significant
technological changes, frequent new product introductions and enhancements and evolving industry
standards. Without the timely introduction of new products, our products will likely become
technologically obsolete over time. Our new products may not gain market acceptance and may not
result in significant sources of revenue and earnings in the future. In addition, revenues from our
current products may not be sufficient to support development expenses for new generations of our
current products or expansions of our product line. If we are unable to make new product
development investments or such investments do not result in future earnings, our operating results
could be adversely affected.
Competitive factors
The Company competes on the basis of quality, performance, service, product availability, and
price, with quality and performance frequently being the most important. There are many firms in
the world engaged in the manufacture of electronic measurement instruments, some of which are
larger and have greater financial resources than we do and/or have established significant
reputations within the test and measurement industry and with the customer base we serve. If any of
our competitors were to develop products or services that were more cost-effective or technically
superior to ours, or if we were unable to differentiate our product offerings from those of our
competitors, demand for our products could slow. Additionally, aggressive competition could cause
downward pricing pressure, which would reduce our gross margins or cause us to lose market share.
Dependence on key personnel
Our future success depends partly on the continued service of research, engineering, sales,
marketing, manufacturing, executive and administrative personnel. Competition for employees with
the skills we require is strong in any technology industry. We believe our pay levels remain
competitive; however, there can be no assurance that we will be able to retain one or more key or
other personnel. Additionally, there is competition for personnel having certain highly technical
specialties. The loss of one or more key or other employees, a decrease in our ability to attract
additional qualified employees, or a delay in hiring key personnel could each have a material
adverse effect on our business.
Dependence on key suppliers
Our products contain large quantities of electronic components and subassemblies that in some cases
are supplied through sole or limited source third-party suppliers. The current economic climate has
increased the possibility that these suppliers could become insolvent or otherwise go out of
business. Additionally, vendors can obsolete part(s) unexpectedly. As a result, there can be no assurance that parts and supplies will be available in a
timely manner and at reasonable prices. Additionally, our inventory is subject to risks of changes
in market demand for particular products. Our inability to obtain critical parts and supplies or
any resulting excess and/or obsolete inventory could have an adverse impact on our results of
operations.
International operations, political and economic conditions
We currently have subsidiaries or sales offices located in 14 countries outside the United States,
and international sales accounted for more than 70 percent of our revenue during fiscal 2010. Our
international sales and operations are subject to significant risks and difficulties, including
fluctuating foreign currency exchange rates, trade protection measures, domestic and foreign import
or export licensing requirements, unexpected changes in legal and regulatory requirements,
compliance with customs regulations, the credit risk, financial condition of, and relationships
with local customers and distributors, and cultural differences in the conduct of business. Any of
these factors could have a negative impact on our revenue and operating results.
Effective tax rates
We are subject to taxation and pay taxes in numerous countries and other jurisdictions throughout
the world. Our future effective tax rate may be lower or higher than experienced in the past due to
numerous factors, including a change in the mix of profitability from country to country, changes
in valuation allowances against our deferred tax assets, changes in accounting for income taxes and
recently enacted and future changes in tax laws in jurisdictions in which we operate. Any of these
factors could cause us to experience an effective tax rate significantly different than our current
expectations, which could have an adverse effect on our future results of operations.
8
Changes in manufacturing processes and capacity
We have implemented a lean manufacturing environment in our sole manufacturing facility located in
Solon, Ohio. Because we cannot immediately adapt our production capacities to rapidly changing
market conditions, when demand does not meet our expectations, our manufacturing capacity will
likely exceed our production requirements. Excess manufacturing capacity will result in unabsorbed
or underabsorbed fixed costs which would adversely affect our results of operations.
Information technology management systems
Our IT systems are critical to our normal business operations, and we rely on them to provide
adequate, accurate and timely information for our order entry, billing, manufacturing and other
customer support functions. Any failure in those systems could adversely affect our operating
results. We have outsourced the hosting of these systems to a third-party vendor. If our
third-party vendor experiences shut downs or other service-related issues, it could interrupt our
normal business processes including our ability to process orders, ship our products, bill and
service our customers, and otherwise run our business, resulting in a material adverse effect on
our revenue and operating results.
Fixed cost of sales force
We have built our direct sales force throughout the world with our own employees rather than
utilizing third-party sales representatives. This action increases our fixed costs, and our results
could be adversely affected during times of depressed sales.
Impairment charges for definite-lived and long-lived assets
We are required to assess recoverability of the carrying value for property, plant and equipment
and other long-lived tangible assets whenever there are indicators of impairment, such as an
adverse change in business climate. An impairment charge would reduce our earnings.
Historical stock option grant practices
We are subject to an SEC inquiry regarding our historical stock option practices, the outcome of
which we cannot predict. It could result in significant new expenses, diversion of management’s
attention from our business, commencement of formal similar, administrative or litigation actions
against the Company or our current or former officers or directors, significant fines or penalties,
indemnity commitments to current and former officers and directors and other material harm to our
business. The SEC also may disagree with the manner in which we have accounted for and reported (or
not reported) the financial impact of past option grants or other potential accounting errors, and
there is a risk that its inquiry could lead to circumstances in which we may have to restate our
prior financial statements, amend prior SEC filings or otherwise take actions not currently
contemplated.
ITEM 1B — UNRESOLVED STAFF COMMENTS
None.
ITEM 2 — PROPERTIES
The Company’s principal administrative, marketing, manufacturing and development activities are
conducted at a Company-owned building in Solon, Ohio. This building is approximately 125,000 square
feet and sits on approximately 26 acres of land. The Company also owns an additional facility
located in Solon, Ohio that is adjacent to its executive offices. The additional facility is
approximately 50,000 square feet on 5.5 acres of land and is currently being leased to others, but
is available for expansion should additional space be required. Additionally, we have a number of
leased facilities for our sales and service offices in the United States and overseas. We believe
the facilities owned and leased are well maintained, adequately insured and suitable for their
present and intended uses.
ITEM 3 — LEGAL PROCEEDINGS
As previously disclosed, in August 2006, the Company’s Board of Directors formed a Special
Committee of independent directors to investigate the Company’s stock option practices since the
beginning of the fiscal year ended September 30, 1995. The Committee retained independent counsel
(the “Independent Counsel”) to assist it in the investigation. Following appointment of the Special
Committee, the Company voluntarily notified the staff of the Securities and Exchange Commission of
the Special Committee investigation. In September 2006, the Company received notice that the SEC
was conducting an inquiry into the Company’s option grant practices.
9
In December 2006, the Company announced the Special Committee’s findings, which were adopted by the
Board of Directors and were as follows:
| • |
|
There was no evidence of “backdating” annual stock option grants prior to the date of
approval by the Board of Directors. |
| • |
|
There was a multi-day delay by management in setting the exercise price for annual stock
option grants in 2000, 2001 and 2002. The delay resulted in the options having a lower
exercise price than the price on the date of Board approval. |
| • |
|
Although the Special Committee determined that the terms of the Company’s stock incentive
plans required the options to be priced on the date the Board approved them, there was no
finding of intentional misconduct on the part of senior management or any other Keithley
officer, director or employee responsible for the administration of the Company’s stock option
grants. |
| • |
|
Based on evidence gathered and analyzed by the Independent Counsel, the Special Committee
found the dates selected by management for the annual grants in 2000-2002 are the appropriate
measurement dates for accounting purposes. Accordingly, the Company was not required to record
any compensation expense with respect to the annual option grants in 2000-2002, and the
Company was not required to restate its financial statements as a result of these grants. |
| • |
|
The Special Committee concluded that the Company’s public filings regarding annual options
grants during the years reviewed were accurate; there is no evidence that the Company timed
the grant date or pricing of annual stock option grants to take advantage of material
non-public information; and there was no wrong doing or lack of oversight by the Company’s
independent directors or the Human Resources and Compensation Committee of the Board of
Directors (the “Compensation Committee”). |
| • |
|
The Special Committee also reviewed the Company’s practices regarding stock option grants,
other than its annual grants, which are generally grants of smaller numbers of options to new
hires and to existing employees for promotions. The Special Committee concluded that
management exceeded certain of the authority granted to management by the Company’s stock
option plans and the Compensation Committee, but that these grants involved small numbers of shares and were largely the result of ministerial errors by management. |
To the Company’s knowledge, no further action was taken by the SEC during fiscal 2010 with respect
to this matter.
On
October 4, 2010, a purported class action and derivative lawsuit
was filed related to the then-pending
merger of the Company into a subsidiary of Danaher Corporation (“Danaher”) pursuant to the
Agreement and Plan of Merger, dated as of September 29, 2010, by and among the Company, Danaher and
Aegean Acquisition Corp. The case, Donald Freidlander v. Danaher Corporation, Brian R. Bachman,
James B. Griswold, Leon J. Hendrix, Jr., Brian J. Jackman, Joseph P. Keithley, N. Mohan Reddy,
Thomas A. Saponas, Barbara V. Scherer and Keithley Instruments, Inc.,
was filed on October 4, 2010,
in the Court of Common Pleas of Cuyahoga County, Ohio (Case No. CV 10 738257). The complaint
alleged, among other things, that the Company’s directors breached their fiduciary duties in
connection with the merger and that Danaher aided and abetted the Company’s directors in their
alleged breaches of fiduciary duties. The relief sought by the plaintiff included a declaration
that the action is properly maintainable as a derivative and class action, a declaration that the
merger is unlawful and unenforceable, an injunction barring the merger, rescinding (to the extent
already implemented) the merger or any of the terms thereof and the payment of costs and
disbursements of the action, including attorneys’ and experts’ fees. On November 15, 2010, counsel
for all parties reached an agreement in principle regarding the settlement of the Action. The
parties are waiting for court approval of the settlement.
10
PART II
ITEM 5 — MARKET FOR THE REGISTRANT’S COMMON EQUITY, RELATED STOCKHOLDER MATTERS AND ISSUER
PURCHASES OF EQUITY SECURITIES
The Company’s Common Shares traded on the New York Stock Exchange (the “NYSE”) under the symbol
KEI. There was no established public trading market for the Class B Common Shares; however, they
were readily convertible on a one-for-one basis into Common Shares.
The following table shows the high and low sales prices of the Company’s Common Shares as reported
on the NYSE and the amount of cash dividends declared on the Company’s Common Shares and Class B
Common Shares during the periods indicated.
| |
|
|
|
|
|
|
|
|
|
|
|
|
|
|
|
|
| |
|
|
|
|
|
|
|
|
|
|
|
|
|
Cash Dividends |
|
| |
|
|
|
|
|
|
|
|
|
Cash Dividends |
|
|
Per Class B |
|
| |
|
High |
|
|
Low |
|
|
Per Common Share |
|
|
Common Share |
|
Fiscal 2010 |
|
|
|
|
|
|
|
|
|
|
|
|
|
|
|
|
First Quarter |
|
$ |
5.50 |
|
|
$ |
3.20 |
|
|
$ |
.0125 |
|
|
$ |
.010 |
|
Second Quarter |
|
|
7.70 |
|
|
|
4.50 |
|
|
|
.0125 |
|
|
|
.010 |
|
Third Quarter |
|
|
10.89 |
|
|
|
6.27 |
|
|
|
.0375 |
|
|
|
.030 |
|
Fourth Quarter |
|
|
21.51 |
|
|
|
8.15 |
|
|
|
.0375 |
|
|
|
.030 |
|
Fiscal 2009 |
|
|
|
|
|
|
|
|
|
|
|
|
|
|
|
|
First Quarter |
|
$ |
8.64 |
|
|
$ |
2.02 |
|
|
$ |
.0375 |
|
|
$ |
.030 |
|
Second Quarter |
|
|
3.91 |
|
|
|
1.86 |
|
|
|
.0375 |
|
|
|
.030 |
|
Third Quarter |
|
|
4.59 |
|
|
|
2.76 |
|
|
|
.0125 |
|
|
|
.010 |
|
Fourth Quarter |
|
|
6.45 |
|
|
|
3.47 |
|
|
|
.0125 |
|
|
|
.010 |
|
Pursuant to the Merger Agreement, at the closing of the merger, on December 8, 2010, all Keithley
Common Shares and Class B Common Shares were converted into the right to receive $21.60 per Common
Share in cash, without interest and less any required withholding taxes. Accordingly, Keithley is
a wholly owned subsidiary of Danaher.
Equity Compensation Plan Information as of September 30, 2010
| |
|
|
|
|
|
|
|
|
|
|
|
|
| |
|
|
|
|
|
|
|
|
|
Number of securities remaining |
|
| |
|
Number of securities to be |
|
|
Weighted-average |
|
|
available for future issuance |
|
| |
|
issued upon exercise of |
|
|
exercise price of |
|
|
under equity compensation |
|
| |
|
outstanding options, |
|
|
outstanding options, |
|
|
plans (excluding securities |
|
| |
|
rights or warrants |
|
|
rights or warrants |
|
|
reflected in column (a)) |
|
| Plan category |
|
(a) |
|
|
(b) |
|
|
(c) |
|
Equity
compensation plans
approved by
security holders |
|
|
3,127,176 |
(1) |
|
$ |
14.65 |
|
|
|
722,669 |
(2) |
Equity compensation
plans not approved
by security holders |
|
|
— |
|
|
|
— |
|
|
|
— |
|
Total |
|
|
3,127,126 |
(1) |
|
$ |
14.65 |
|
|
|
722,669 |
(2) |
| |
|
|
| (1) |
|
Includes outstanding stock options to purchase 2,516,951 shares, 216,675 restricted award
units and 393,550 performance award units under the Company’s stock incentive plan that are
payable in Common Shares. The number of performance award units included above represents the
maximum number of units that may be earned pursuant to performance award units agreements. See
Note I. Restricted award units and performance award units do not have an exercise price, and
therefore, were not included for purposes of computing the weighted-average exercise price.
Subsequent to September 30, 2010, 120,350 of the 221,400 performance award units associated
with the 2008-2010 period were issued as the vesting provisions were attained. Pursuant to the
Merger Agreement, all outstanding stock options, restricted award units and performance award
units were, at the time of closing, fully vested and cancelled in exchange for the merger
consideration of $21.60 for each underlying Common Share, less any exercise price per share. |
| |
| (2) |
|
Includes 452,245 shares available for issuance under the 2005 Employee Stock Purchase and
Dividend Reinvestment Plan. |
11
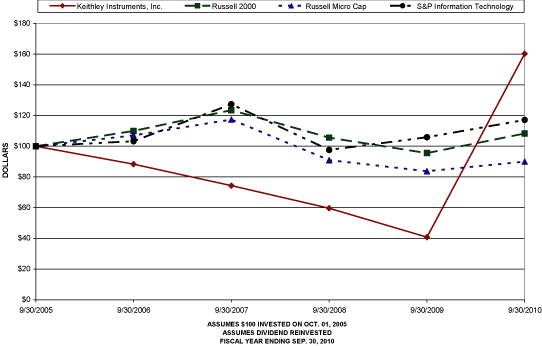
Stock Performance Graph
The graph below compares the five year cumulative return from investing $100 on September 30, 2005
in each of the Company’s Common Shares, the Russell 2000 Index, the Russell MicroCap and the
Standard & Poor’s Information Technology Index. We included the Russell MicroCap as we believe it
is a more comparable index given our current size, and also because it is the index against which
the targets of certain of our incentive compensation programs are measured. The comparison assumes
that all dividends are reinvested.
COMPARISON OF CUMULATIVE TOTAL RETURN
| |
|
|
|
|
|
|
|
|
|
|
|
|
|
|
|
|
|
|
|
|
|
|
|
|
| |
|
Fiscal Year Ending |
|
| Company/Index/Market |
|
9/30/2005 |
|
|
9/30/2006 |
|
|
9/30/2007 |
|
|
9/30/2008 |
|
|
9/30/2009 |
|
|
9/30/2010 |
|
Keithley Instruments, Inc. |
|
$ |
100.00 |
|
|
$ |
88.32 |
|
|
$ |
74.33 |
|
|
$ |
59.63 |
|
|
$ |
40.75 |
|
|
$ |
160.24 |
|
Russell 2000 |
|
$ |
100.00 |
|
|
$ |
109.92 |
|
|
$ |
123.49 |
|
|
$ |
105.60 |
|
|
$ |
95.52 |
|
|
$ |
108.27 |
|
Russell Micro Cap |
|
$ |
100.00 |
|
|
$ |
107.02 |
|
|
$ |
117.39 |
|
|
$ |
90.96 |
|
|
$ |
83.75 |
|
|
$ |
89.97 |
|
S&P Information Technology |
|
$ |
100.00 |
|
|
$ |
103.26 |
|
|
$ |
127.35 |
|
|
$ |
97.57 |
|
|
$ |
105.86 |
|
|
$ |
117.14 |
|
12
ITEM 6 — SELECTED FINANCIAL DATA
The following data has been derived from our consolidated financial statements. Consolidated
Balance Sheets as of September 30, 2010 and 2009 and the related Consolidated Statements of
Operations, Cash Flows and Shareholders’ Equity for each of the three years in the period ended
September 30, 2010 and notes thereto appear elsewhere in this Annual Report.
| |
|
|
|
|
|
|
|
|
|
|
|
|
|
|
|
|
|
|
|
|
| (In thousands of dollars |
|
For the years ended September 30, |
|
| except for per share data) |
|
2010 |
|
|
2009 |
|
|
2008 |
|
|
2007 |
|
|
2006 |
|
Operating Results: |
|
|
|
|
|
|
|
|
|
|
|
|
|
|
|
|
|
|
|
|
Net sales |
|
$ |
126,870 |
|
|
|
102,527 |
|
|
|
152,468 |
|
|
|
143,658 |
|
|
|
155,212 |
|
Gross margin percentage |
|
|
64.8 |
% |
|
|
53.7 |
%(1) |
|
|
58.9 |
% |
|
|
59.8 |
% |
|
|
61.3 |
% |
Severance and related charges |
|
$ |
(124 |
) |
|
|
6,926 |
|
|
|
1,377 |
|
|
|
— |
|
|
|
— |
|
Gain on the sale of RF product line |
|
$ |
(2,894 |
) |
|
|
— |
|
|
|
— |
|
|
|
— |
|
|
|
— |
|
Gain on the sale of building |
|
$ |
(1,862 |
) |
|
|
— |
|
|
|
— |
|
|
|
— |
|
|
|
— |
|
Transaction costs associated with pending merger |
|
$ |
1,250 |
|
|
|
— |
|
|
|
— |
|
|
|
— |
|
|
|
— |
|
Income (loss) before income taxes |
|
$ |
25,397 |
|
|
|
(19,366 |
) |
|
|
(4,356 |
) |
|
|
(1,685 |
) |
|
|
9,913 |
|
Provision (benefit) for income taxes |
|
$ |
519 |
|
|
|
31,138 |
(2) |
|
|
(1,943 |
) |
|
|
(1,336 |
) |
|
|
1,552 |
|
Net income (loss) |
|
$ |
24,878 |
|
|
|
(50,504 |
) |
|
|
(2,593 |
) |
|
|
(349 |
) |
|
|
8,361 |
|
Basic earnings (loss) per share |
|
$ |
1.58 |
|
|
|
(3.23 |
) |
|
|
(0.16 |
) |
|
|
(0.02 |
) |
|
|
0.51 |
|
Diluted earnings (loss) per share |
|
$ |
1.53 |
|
|
|
(3.23 |
) |
|
|
(0.16 |
) |
|
|
(0.02 |
) |
|
|
0.50 |
|
Common Stock Information: |
|
|
|
|
|
|
|
|
|
|
|
|
|
|
|
|
|
|
|
|
Cash dividends per Common Share |
|
$ |
0.100 |
|
|
|
0.100 |
|
|
|
0.150 |
|
|
|
0.150 |
|
|
|
0.150 |
|
Cash dividends per Class B Common Share |
|
$ |
0.080 |
|
|
|
0.080 |
|
|
|
0.120 |
|
|
|
0.120 |
|
|
|
0.120 |
|
Weighted average number of shares outstanding- diluted |
|
|
16,228 |
|
|
|
15,648 |
|
|
|
15,854 |
|
|
|
16,207 |
|
|
|
16,567 |
|
At fiscal year-end: |
|
|
|
|
|
|
|
|
|
|
|
|
|
|
|
|
|
|
|
|
Dividend payout ratio |
|
|
6.5 |
% |
|
|
n/m |
|
|
|
n/m |
|
|
|
n/m |
|
|
|
30.0 |
% |
Shareholders’ equity per share |
|
$ |
3.51 |
|
|
|
2.14 |
|
|
|
6.12 |
|
|
|
6.76 |
|
|
|
7.03 |
|
Closing market price |
|
$ |
21.51 |
|
|
|
5.54 |
|
|
|
8.37 |
|
|
|
10.60 |
|
|
|
12.75 |
|
Balance Sheet Data: |
|
|
|
|
|
|
|
|
|
|
|
|
|
|
|
|
|
|
|
|
Total assets |
|
$ |
104,656 |
|
|
|
73,102 |
|
|
|
137,978 |
|
|
|
146,406 |
|
|
|
148,892 |
|
Current ratio |
|
|
3.4 |
|
|
|
2.9 |
|
|
|
3.3 |
|
|
|
3.8 |
|
|
|
4.2 |
|
Short-term debt |
|
$ |
— |
|
|
|
— |
|
|
|
23 |
|
|
|
799 |
|
|
|
872 |
|
Long-term obligations |
|
$ |
22,428 |
|
|
|
19,382 |
|
|
|
12,939 |
|
|
|
11,102 |
|
|
|
9,792 |
|
Shareholders’ equity |
|
$ |
56,935 |
|
|
|
36,610 |
|
|
|
103,302 |
|
|
|
113,024 |
|
|
|
116,503 |
|
Total debt-to-capital |
|
|
0.0 |
% |
|
|
0.0 |
% |
|
|
0.0 |
% |
|
|
0.7 |
% |
|
|
0.7 |
% |
Other Data: |
|
|
|
|
|
|
|
|
|
|
|
|
|
|
|
|
|
|
|
|
Return on average shareholders’ equity |
|
|
53.2 |
% |
|
|
-72.2 |
% |
|
|
-2.4 |
% |
|
|
-0.3 |
% |
|
|
7.3 |
% |
Return on average total assets |
|
|
28.0 |
% |
|
|
-47.9 |
% |
|
|
-1.8 |
% |
|
|
-0.2 |
% |
|
|
5.7 |
% |
Return on net sales |
|
|
19.6 |
% |
|
|
-49.3 |
% |
|
|
-1.7 |
% |
|
|
-0.2 |
% |
|
|
5.4 |
% |
Number of employees at year end |
|
|
490 |
|
|
|
557 |
|
|
|
696 |
|
|
|
698 |
|
|
|
673 |
|
Sales per employee |
|
$ |
242.3 |
|
|
|
163.7 |
|
|
|
218.7 |
|
|
|
209.6 |
|
|
|
234.5 |
|
Cash flow: |
|
|
|
|
|
|
|
|
|
|
|
|
|
|
|
|
|
|
|
|
Net cash provided by (used in) operating activities |
|
$ |
18,904 |
|
|
|
(5,416 |
) |
|
|
1,706 |
|
|
|
5,641 |
|
|
|
5,985 |
|
Ten-year compound annual growth rate: |
|
|
|
|
|
|
|
|
|
|
|
|
|
|
|
|
|
|
|
|
Net sales |
|
|
(1.7 |
)% |
|
|
0.2 |
% |
|
|
2.6 |
% |
|
|
1.5 |
% |
|
|
2.7 |
% |
Net income |
|
|
1.7 |
% |
|
|
n/m |
|
|
|
n/m |
|
|
|
n/m |
|
|
|
n/m |
|
| |
|
|
| n/m — |
|
These ratios are not meaningful due to the reported net losses in fiscal 1996, 2007, 2008
and 2009. |
| |
| (1) |
|
Included in gross margins were $2,540 of costs associated with the exit of a product line.
Excluding those costs, the gross margin percentage for fiscal 2009 would have been 56.2% |
| |
| (2) |
|
Included in the provision for income taxes was a valuation allowance against U.S. deferred
tax assets of $29,967. |
13
ITEM 7 — MANAGEMENT’S DISCUSSION AND ANALYSIS OF FINANCIAL CONDITION AND RESULTS OF OPERATIONS
In Thousands of Dollars except for per share information.
Introduction and Overview
This Management’s Discussion and Analysis of Financial Condition and Results of Operations is
intended to provide investors with an understanding of the operating performance and financial
condition of Keithley Instruments, Inc. A discussion of our business, including our strategy for
growth, products and competition, is included in Part I of this Form 10-K.
Business Overview
Our business is to design, develop, manufacture and market complex electronic instruments and
systems geared to the specialized needs of engineers at electronics manufacturers and academic
institutions for research, product development, high-performance production testing and process
monitoring. Our primary products are integrated systems used to source, measure, connect, control
or communicate electrical direct current (DC) and alternating current (AC) signals. Our product
offerings include integrated systems solutions, along with instruments and data acquisition modules
that can be used as system components or stand-alone solutions. Our customers are engineers,
technicians and scientists in manufacturing, product development and research functions. During
fiscal 2010, approximately 35 percent of our orders were received from the semiconductor industry;
approximately five percent came from the wireless communications customer group; approximately 25
percent came from the precision electronics customer group, which includes customers in automotive,
computers and peripherals, medical equipment, aerospace and defense, and manufacturers of
components; and approximately 25 percent came from research and education customers. The remainder
of orders came from customers in a variety of other industries. Although our products vary in
capability, sophistication, use, size and price, they generally test, measure and analyze
electrical, optical or physical properties. As such, we consider our business to be in a single
industry segment.
The most important factors influencing our ability to grow revenue are (i) our customers’ spending
patterns as they invest in new capacity or upgrade manufacturing lines for new product offerings,
(ii) our ability to offer interrelated products with differentiated value that solve our customers’
most compelling test challenges, and (iii) our success in penetrating key accounts with our
globally deployed sales and service team. We continue to believe that our strategy of pursuing a
focused set of applications will allow us to grow faster than the overall test and measurement
industry.
Many of the industries we serve, including the semiconductor, wireless communications and precision
electronic components industries, have historically been very cyclical and have experienced
periodic downturns followed by periods of secular growth. Our customers across all industries and
geographies demonstrated reduced order patterns, beginning in the fourth quarter of fiscal 2008 and
continuing through mid-fiscal year 2009. In response to these conditions, we took various cost
reduction actions beginning in the fourth quarter of fiscal 2008 and continuing through the first
quarter of fiscal 2010 to reduce our future operating expenses. These actions included headcount
reductions, a hiring freeze with the exception of a few critical replacements, reductions in our
capital expenditures, and travel and other discretionary spending, a pay reduction for the majority
of U.S. exempt employees and unpaid days off for U.S. non-exempt employees, the suspension of the
annual bonus program for management and lower sales commissions payments to the sales force, the
suspension of the Company’s 401(k) match and the exit of our S600 series product line. In addition,
we sold substantially all of the assets related to our RF product line. Global semiconductor device
sales have now exceeded levels achieved just prior to the financial crisis that began in the fall
of calendar 2008, and we have experienced sequential increases in orders from our customers since
the second quarter of fiscal 2009. Because of that improvement coupled with the previous cost
reduction measures that are still in place, effective January 1, 2010, we restored compensation
levels and work hours for U.S. exempt and non-exempt employees, respectively, reinstated the
Company’s 401(k) match, and recorded variable costs for both annual and long-term incentive plans.
The Company recorded approximately $7,000 of expense during fiscal year 2010 as a result of the
aforementioned costs.
Our focus during the past several years has continued to center on building long-term relationships
and strong collaborative partnerships with our global customers to serve their measurement needs.
Toward that end, we rely primarily upon employing our own sales personnel to sell our products, and
using sales representatives, to whom we pay a commission, in areas where we believe it is not
cost-beneficial to employ our own people. This sales channel strategy allows us to build a sales
network of focused, highly trained sales engineers who specialize in measurement expertise and
problem-solving for customers and enhances our ability to sell our products to customers with
worldwide operations. We believe our ability to serve our customers has been strongly enhanced by
deploying our own employees throughout the United States, Europe and Asia. As a substantial portion
of our selling costs are fixed,
we expect that selling through our own sales force will be
favorable to earnings during times of strong sales, but will be unfavorable during times of
depressed sales.
14
We continue to believe that both the semiconductor and wireless areas drive change within the
electronics industry. These technology changes create many opportunities for us and we continued
the introduction of new products and enhancements during fiscal 2010. Our research and education
customers’ work involves advanced materials research in areas including nanotechnology, organic
materials and thin film research. These materials are ultimately used in the next generation of
semiconductors and cutting-edge electronic devices. Additionally, our semiconductor customers
include large integrated device manufacturers and foundries, fabless
manufacturers as well as solar cell developers. We believe these customers will continue to
generate demand because they continually are improving existing devices or developing new devices
that in turn, create new measurement requirements.
On
December 8, 2010, the Company completed the transactions
contemplated by the Merger Agreement,
pursuant to which Aegean Acquisition Corp. was merged into the Company and each outstanding
Common Share and Class B Common Share of the Company was converted into the right to receive
$21.60 per share in cash. Also pursuant to the Merger Agreement, all outstanding stock options,
restricted award units and performance award units were, at the time of closing, fully vested
and cancelled in exchange for the merger consideration of $21.60 for each underlying Common
Share, less any exercise price per share.
Critical Accounting Policies and Estimates
Management has identified the Company’s “critical accounting policies.” These policies have the
potential to have a more significant impact on our financial statements, either because of the
significance of the financial statement item to which they relate, or because they require judgment
and estimation due to the uncertainty involved in measuring, at a specific point in time, events
which will be settled in the future.
Use of estimates:
The preparation of financial statements in conformity with accounting principles generally accepted
in the United States of America (“U.S. GAAP”) requires management to make estimates and assumptions
that affect the reported amounts of assets and liabilities and disclosure of contingent assets and
liabilities at the date of the reported financial statements and the reported amounts of revenues
and expenses during the reporting period. Actual results could differ materially from those
estimates.
Revenue recognition:
Keithley Instruments, Inc. recognizes product revenue when persuasive evidence of an arrangement
exists, delivery has occurred, the sales price is fixed or determinable and collectability is
reasonably assured. Delivery is considered to have been met when title and risk of loss have
transferred to the customer. Upon shipment, a provision is made for estimated costs that may be
incurred for product warranties and sales returns. Revenue earned from service contracts is
recognized ratably over the contractual service periods and is not material to the Company’s
consolidated results. Shipping and handling costs are recorded as Cost of goods sold in the
Consolidated Statements of Operations.
Inventories:
Inventories are stated at the lower of cost or market. Cost is determined based on a
currently-adjusted standard, which approximates actual cost on a first-in, first-out basis. We
periodically review our recorded inventory and estimate a reserve for obsolete or slow-moving
items. If actual demand and market conditions are less favorable than those projected by
management, additional reserves may be required. If actual market conditions are more favorable
than anticipated, our cost of sales will be lower than expected in that period.
Income taxes:
Keithley is subject to taxation from federal, state and international jurisdictions. The annual
provision for income taxes and the determination of the resulting deferred tax assets and
liabilities involves a significant amount of judgment by management. Judgment also is applied in
determining whether the deferred tax assets will be realized in full or in part. In evaluating our
ability to recover our net deferred tax assets, which totaled $2,601 at September 30, 2010, we
considered all available positive and negative evidence including our past operating results, the
existence of cumulative losses in the most recent fiscal years, and our forecast of future taxable
income. In determining future taxable income, we are responsible for assumptions utilized including
the amount of pretax
operating income in each tax jurisdiction, the reversal of book versus tax
differences, and the implementation of feasible and prudent tax planning strategies. These
assumptions require significant judgment about the forecasts of future taxable income and are
consistent with plans and estimates we are using to manage the underlying business.
15
We have established a valuation allowance against deferred tax assets, including net operating
losses, or NOLs, in the United States and in certain foreign jurisdictions which may not be
realized due to the uncertainty of future profit levels in the respective jurisdictions. We intend
to maintain this valuation allowance until sufficient positive evidence exists to support reversal
of the valuation allowance, until such NOLs are utilized or until such NOLs expire. Our income tax
expense recorded in the future will be reduced to the extent of offsetting decreases in our
valuation allowance. The realization of certain tax credits and the remaining
deferred tax asset is dependent upon achieving future forecasted taxable income. If actual results
are significantly less than our forecast, an additional valuation allowance may be recorded against
the remaining net deferred tax assets, which totaled $2,601 at September 30, 2010. An increase in
the valuation allowance would result in additional income tax expense in such period and could have
a material impact on our future earnings and financial position. In addition, the calculation of
our tax liabilities involves uncertainties in the application of complex tax regulations in various
tax jurisdictions. We recognize potential liabilities for anticipated tax issues based upon our
estimate of whether additional taxes will be due. If payment of these amounts ultimately proves to
be unnecessary, the reversal of the liabilities would result in tax benefits being recognized in
the period when we determine that the liabilities are no longer necessary. If our estimate of tax
liabilities proves to be less than the ultimate assessment, a further charge of income tax expense
would result.
Pension plans:
Our retirement benefit plans are a significant cost of doing business and their related obligations
will inherently be settled far in future periods. Therefore, the ultimate amount of those
obligations is subject to estimation. Pension accounting is intended to reflect the recognition of
future benefit costs over the employee’s approximate service period based on the terms of the plans
and the investment and funding decisions made by us. We are required to make assumptions regarding
such variables as the expected long-term rate of return on assets and the discount rate applied to
determine service cost and interest cost to arrive at pension income or expense for the year.
Because the assumption regarding the rate of return on plan assets is a long-term estimate, it can
differ materially from the actual return realized on plan assets in any given year, particularly
when markets are highly volatile. We have analyzed the rates of return on assets used and
determined that the rates we use are reasonable based on the plans’ historical performance relative
to the overall markets in the countries where the plans are in place, as well as the plans’ asset
allocation between equities and fixed income investments. Assumed discount rates are used in
measurements of the projected and accumulated benefit obligations, and the service and interest
cost components of net periodic pension cost. See Note H to Consolidated Financial Statements for
further details.
The discount rate for the United States
plan was determined as of the September 30, 2010,
measurement date by constructing a portfolio of bonds with cash flows from coupon payments and
maturities matching the projected benefit payments under the Plan. Bonds considered in constructing
the model portfolio are rated AA- or higher by Standard & Poor’s. Callable bonds were excluded from
consideration in this analysis. The longest maturity of any bond included in the data is August 15,
2037. Benefit payments beyond 2037 were discounted back to this year using interest rates taken
from the Citigroup Pension Discount Curve Comparison to Above Median as of September 30, 2010. The
matching bond portfolio produces coupon income in excess of what is needed to meet early period
benefit payments. The excess coupon income is accumulated as interest, based on the Citigroup
Pension Discount Curve Comparison to Above Median as of September 30, 2010, until such time as it
is used to pay benefits.
The discount rates used in determining the recorded liability as of year end for our United States
pension plan were 5.375% for 2010, 6.0% for 2009 and 7.0% for 2008. The 62.5 and 100 basis point
decrease from 2009 to 2010 and 2008 to 2009, respectively, reflects the decline in interest rates
stemming from the global economic crisis that began in late fiscal 2008 and continued in fiscal
2010; this situation pushed bond yields lower than previous levels. The discount rates for our
German pension plan were 4.5% for 2010, 6.5% for 2009 and 6.25% for 2008. The decrease in the
fiscal 2010 rate reflects the reduction in yields for corporate bonds during the year. The slight
increase in the fiscal 2009 rate reflects the change in spread between government and highly-rated
Corporate bond yields for Euro instruments having durations similar to the German pension
liability.
Actual rate of return on United States plan assets was 11.1% for fiscal 2010 compared to an
expected rate of return of 8.0%. A 0.25% increase (decrease) in the expected rate of return would
have produced a $116 decrease (increase) in fiscal 2010 expense.
16
The pension plan assets in Germany are invested through an insurance company. The insurance company
directs the investments for this insurance contract. Because of the type of investments in the
insurance contract, an expected rate of return of 4.5% was assumed.
Management will continue to assess the expected long-term rate of return on plan assets and
discount rate assumptions for both the United States plan and the non-U.S. plans based on relevant
market conditions as prescribed by U.S. GAAP and will make adjustments to the assumptions as
appropriate. Pension income or expense is allocated to Cost of goods sold, Selling, general and
administrative expenses, and Product development expenses in the accompanying Consolidated
Statements of Operations.
Stock compensation plans:
We grant non-cash compensation in the form of non-qualified stock options, performance award units
and restricted share units. In accordance with U.S. GAAP, the Company is required to record the
fair value of stock-based compensation awards as an expense. In order to determine the fair value
of stock options on the date of grant, the Company applies the Black-Scholes option-pricing model.
Inherent in this model are assumptions related to expected stock-price volatility, option life,
risk-free interest rate and dividend yield.
While risk-free interest rate and dividend yield are less subjective assumptions, typically based
on factual data derived from public sources, the expected stock-price volatility and option life
assumptions require a greater level of judgment which makes them critical accounting estimates. We
use an expected stock-price volatility assumption primarily based upon observed historical
volatility of Keithley’s stock price, as there is not a substantial enough market for
exchange-traded options. For stock options granted during fiscal year 2010, we used a stock-price
volatility assumption of 63%. With regard to the weighted-average expected option life assumption,
we consider several factors, including the historical option exercise behavior of our employees,
historical cancellation rates of past options, and the current life of options outstanding and
vested. During fiscal year 2010, we used an expected life assumption of 4.75 years. We also are
required to estimate an expected forfeiture rate when recognizing compensation cost. We review this
rate during each reporting period and adjust it when necessary based upon our past history of
actual forfeitures. The total estimated unrecognized compensation at September 30, 2010 was $1,658
and was expected to be recognized over a weighted average period of 2.5 years.
The final number of common shares to be issued pursuant to the performance award units
is determined at the end of each three-year performance period. The awards granted in fiscal year
2008 vested on September 30, 2010. The performance criteria related to these awards were met and
resulted in a payout at 100 percent of target in November 2010 for those awards measured on return
on assets. Additionally, it was determined that the subset of these awards measured on return on
invested capital achieved a payout at 125 percent of target and were issued accordingly in November
2010. The awards granted in fiscal year 2008 could be adjusted in 25 percent increments
and ranged from a maximum of twice the initial award, as specified in the agreement, to a minimum
of zero units depending upon the level of attainment of performance thresholds. During fiscal 2010,
we recorded expenses of $1,099 relating to the 2008-2010 awards. We granted no performance award
units during fiscal 2009.
During fiscal 2010, the Company granted performance award units to officers and key employees. The
performance award unit agreements provide for the award of performance units with each unit
representing the right to receive one of the Company’s Common Shares to be issued after the
applicable award period. The final number of units awarded for this grant was to be determined, as
of September 30, 2012, based upon the Company’s total shareholder return over the performance
period compared to the Russell MicroCap Index and could range from a minimum of no units to a
maximum of twice the initial award. The weighted average fair value for these performance units was
$6.73 and was determined using a Monte Carlo simulation model incorporating the following
assumptions:
| |
|
|
|
|
|
Risk-free interest rate |
|
|
1.25 |
% |
Volatility |
|
|
78 |
% |
The Company recognizes the estimated cost of these awards, as determined under the simulation
model, over the performance period, with no adjustment in future periods based upon the actual
shareholder return over the performance period. During fiscal 2010, we recorded expenses of $164
relating to the 2010-2012 awards.
Our future earnings can fluctuate throughout the performance period specified in the agreements
depending upon our estimate of the number of awards we expect will be issued upon the completion of
the performance period.
Restructuring and cost reduction programs:
We expense costs associated with exit and disposal activities designed to restructure operations
and reduce ongoing costs of operations when we incur the related liabilities or when other
triggering events occur. After the appropriate level of management having the authority approves
the detailed cost reduction or restructuring plan, we establish accruals for underlying activities
by estimating employee termination costs. Our estimates are based upon factors including affected
employees’ length of service, any statutory requirements, contract provisions, salary level, and
health care benefit choices. As part of our assessment of exit and disposal activities, we also
analyze the carrying value of any affected long-lived assets for impairment and reductions in the
estimated useful
lives. We believe our estimates and assumptions used to calculate the costs
associated with these restructuring provisions are appropriate, and although we do not anticipate
significant changes, actual costs could differ from the estimates should we make changes to the
nature or timing of the plans.
17
Results of Operations
The following discussion should be read in conjunction with the Financial Statements and
Supplementary Data included in Item 8 of this Annual Report.
Percent of net sales for the years ended September 30:
| |
|
|
|
|
|
|
|
|
|
|
|
|
| |
|
2010 |
|
|
2009 |
|
|
2008 |
|
Net sales |
|
|
100.0 |
% |
|
|
100.0 |
% |
|
|
100.0 |
% |
Cost of goods sold |
|
|
35.2 |
|
|
|
43.8 |
|
|
|
41.1 |
|
Inventory write off and accelerated depreciation for exit of product line |
|
|
0.0 |
|
|
|
2.5 |
|
|
|
0.0 |
|
|
|
|
|
|
|
|
|
|
|
Gross profit |
|
|
64.8 |
|
|
|
53.7 |
|
|
|
58.9 |
|
Selling, general and administrative expenses |
|
|
38.1 |
|
|
|
48.4 |
|
|
|
43.6 |
|
Product development expenses |
|
|
9.6 |
|
|
|
17.6 |
|
|
|
16.7 |
|
Gain on the sale of RF product line |
|
|
(2.3 |
) |
|
|
— |
|
|
|
— |
|
Gain on the sale of building |
|
|
(1.5 |
) |
|
|
— |
|
|
|
— |
|
Severance and related charges |
|
|
— |
|
|
|
6.8 |
|
|
|
0.9 |
|
|
|
|
|
|
|
|
|
|
|
Operating income (loss) |
|
|
20.9 |
|
|
|
(19.1 |
) |
|
|
(2.3 |
) |
Investment income |
|
|
0.1 |
|
|
|
0.3 |
|
|
|
1.0 |
|
Interest expense |
|
|
— |
|
|
|
(0.1 |
) |
|
|
— |
|
Transaction costs associated with pending merger |
|
|
(1.0 |
) |
|
|
— |
|
|
|
— |
|
Impairment of long-term investments |
|
|
— |
|
|
|
— |
|
|
|
(1.7 |
) |
|
|
|
|
|
|
|
|
|
|
Earnings (loss) before income taxes |
|
|
20.0 |
|
|
|
(18.9 |
) |
|
|
(3.0 |
) |
Provision (benefit) for income taxes |
|
|
0.4 |
|
|
|
30.4 |
|
|
|
(1.3 |
) |
|
|
|
|
|
|
|
|
|
|
Net income (loss) |
|
|
19.6 |
% |
|
|
(49.3 |
)% |
|
|
(1.7 |
)% |
|
|
|
|
|
|
|
|
|
|
We
recorded net income of $24,878, or $1.53 per diluted share, for
fiscal 2010, and net losses of
$50,504, or $3.23 per diluted share, for fiscal 2009 and $2,593, or $0.16 per diluted share, for
fiscal 2008.
Net sales were $126,870 in 2010 compared with $102,527 in 2009 and $152,468 in 2008. The 24
percent increase in sales in 2010 was substantially driven by stronger customer demand, including
demand for production-related applications as well as an increase in large dollar orders compared
the prior year. The weak worldwide economic conditions that began during the latter part of
fiscal 2008 intensified considerably in the first quarter of 2009 as the U.S. financial markets
froze and persisted throughout the duration of fiscal 2009 as global markets reacted and
responded. Our customers responded with reduced demand in fiscal 2009 for products in all
industries and all geographic regions served. On a relative basis, demand in fiscal 2009 for
products used in research and development declined from fiscal 2008 levels less significantly than
demand for products used in production for our customers in each of the semiconductor, wireless and
precision electronics industries.
Geographically, fiscal 2010 sales increased 26 percent in the Americas, 35 percent in Asia and 9
percent in Europe, all as compared to our respective 2009 results.
For fiscal 2009, sales declined
29 percent in the Americas, 34 percent in Asia and likewise fell 35 percent in Europe, all as
compared to our respective 2008 results. The effect of a weaker U.S. dollar positively impacted
sales growth by approximately one percentage point in fiscal 2010 and four percentage points in
fiscal 2008. The stronger U.S. dollar negatively affected sales by two percentage points in fiscal
2009.
Cost of goods sold as a percentage of net sales was 35.2%, 43.8% and 41.1% in 2010, 2009 and 2008,
respectively. The decrease in costs as a percentage of sales in 2010 was driven by the increase in
sales volumes, favorable product mix and lower manufacturing costs primarily as a result of the
various cost cutting measures undertaken in fiscal 2009 and the first quarter of fiscal 2010. The
increase in costs as a percentage of sales in 2009 was driven by the lower sales volumes that were
not fully offset by these cost cutting measures. During 2009, we exited our S600 product line, and
as a result, recorded $2,540 of charges for inventory write offs and accelerated depreciation on
related production equipment. Foreign exchange hedging had a minimal effect on Cost of goods sold
in 2009, 2008, and 2007.
18
Selling, general and administrative expenses of $48,385 declined $1,379, or three percent, in 2010
as compared to 2009 levels, and decreased 16,649, or 25 percent in 2009 from $66,413 in 2008. The
decrease in 2010 over 2009 was the result of cost reductions put in
place in 2009 offset by the restoration of employee compensation to full levels beginning January 1, 2010 and the
reinstatement of the 401(k) match retroactive to January 1, 2010 as well as $1,099 in fiscal 2010
of stock based compensation expense for performance-based stock awards that were previously not
expected to payout. The sharp decline in 2009 was principally attributable to worldwide headcount
reductions and other concerted cost-containment measures which began in September 2008 and
continued throughout the entirety of fiscal 2009. Additionally, we recorded reversals of $950
during fiscal 2009 for previously-accrued performance-based stock awards that either did not vest
during fiscal 2009 or were no longer expected to vest due to the poor financial performance.
Product development expenses of $12,145 in 2010 decreased 33 percent from $18,024 in 2009 and
decreased 29 percent in 2009 from $25,504 in 2008. The decline from 2009 to 2010 was attributable
to targeted reductions in spending coupled with headcount reduction related to the sale of the RF
product line. The decline from 2008 to 2009 was attributable to targeted reductions in spending
coupled with headcount reductions in response to lower customer demand, as well as the
aforementioned exit of the S600 product line.
During fiscal 2010, we recorded $2,894 for the gain on the sale of substantially all of the
Company’s RF assets to Agilent. Additionally, we recorded $1,862 for the gain on the sale of a
facility located on Bainbridge Road in Solon, Ohio, during fiscal 2010. No such gains were
realized during fiscal 2009 or 2008.
During 2010, we recorded $124 of income for the reversal of previously accrued expenses related to
the 2009 severance and related charges. In 2009, we recorded expenses of $6,926 for costs
associated with severance and related charges compared to expenses of $1,377 in 2008 for costs
associated with the first reduction in our global workforce. See Note K for further discussion.
Investment income was $95 in 2010, $303 in 2009 and $1,603 in 2008. The 2010 reduction from 2009
levels was driven mostly by a more conservative investment portfolio comprised principally of
certificates of deposits and money market funds. The 2009 reduction from 2008 levels was driven
mostly by lower average cash and investment levels coupled with a more conservative investment
portfolio comprised principally of certificates of deposits and money market funds. See Note D for
further details. Interest expense was $23 in 2010, $52 in 2009 and $70 in 2008.
During fiscal 2010, we recorded $1,250 for transaction costs associated with the pending merger
with Danaher. These costs were incurred primarily for legal fees and strategic advisory expenses.
The effective tax rate for fiscal 2010, including discrete items, was two percent, and was lower
than the U.S. statutory rate primarily because we recognized income in the U.S. with no
corresponding tax expense as a result of fully reserved tax assets and benefited from the carryback
of the net operating losses generated in fiscal 2009. We also recorded tax expense on certain
profitable foreign jurisdictions. See Note J for further discussion.
The effective tax rate for fiscal 2009, including discrete items, was 161 percent, and was
substantially driven by a valuation allowance of $29,967 recorded in the first quarter against U.S.
deferred tax assets, as well as $6,307 of tax expense on a U.S. loss without tax benefit. We also
recorded tax expense on certain profitable foreign jurisdictions. See Note J for further
discussion.
The effective tax rate for fiscal 2008, including discrete items, was a benefit of 42.8 percent.
The effective benefit in 2008 was greater than the U.S. statutory rate due to the recognition of
current year research tax credits, state and local tax benefits and the recognition of benefits
associated with prior year adjustments. These benefits were partially offset by the net impact of
losses in foreign jurisdiction which are not available for a tax benefit and U.S. tax on foreign
remittances. See Note J for further discussion.
Our financial results are affected by foreign exchange rate fluctuations. Generally, a weakening
U.S. dollar versus foreign currency favorably impacts our foreign currency denominated sales. A
strengthening U.S. dollar has an unfavorable effect. This foreign exchange effect cannot be
precisely isolated since many other factors affect our foreign sales and earnings. These factors
include product offerings and pricing policies of Keithley and our competition, whether competition
is foreign or U.S. based, changes in technology, product and customer mix, and local and worldwide
economic conditions.
We utilize hedging techniques designed to mitigate the short-term effect of exchange rate
fluctuations on operations and balance sheet positions by entering into foreign exchange forward
contracts. We do not speculate in foreign currencies or derivative financial instruments, and
hedging techniques do not increase our exposure to foreign exchange rate fluctuations.
19
Financial Condition, Liquidity and Capital Resources
Working Capital
The following table summarizes working capital as of September 30:
| |
|
|
|
|
|
|
|
|
| |
|
2010 |
|
|
2009 |
|
Current assets: |
|
|
|
|
|
|
|
|
Cash and cash equivalents |
|
$ |
50,790 |
|
|
$ |
24,114 |
|
Restricted cash |
|
|
537 |
|
|
|
569 |
|
Short-term investments |
|
|
3,912 |
|
|
|
759 |
|
Refundable income taxes |
|
|
1,030 |
|
|
|
466 |
|
Accounts receivable and other, net |
|
|
19,111 |
|
|
|
11,738 |
|
Total inventories |
|
|
9,072 |
|
|
|
9,937 |
|
Deferred income taxes |
|
|
659 |
|
|
|
303 |
|
Other current assets |
|
|
1,518 |
|
|
|
1,753 |
|
|
|
|
|
|
|
|
Total current assets |
|
|
86,629 |
|
|
|
49,639 |
|
|
|
|
|
|
|
|
Current liabilities: |
|
|
|
|
|
|
|
|
Short-term debt |
|
|
— |
|
|
|
— |
|
Accounts payable |
|
|
5,903 |
|
|
|
4,916 |
|
Accrued payroll and related expenses |
|
|
11,602 |
|
|
|
5,648 |
|
Other accrued expenses |
|
|
5,166 |
|
|
|
5,424 |
|
Income taxes payable |
|
|
2,622 |
|
|
|
1,122 |
|
|
|
|
|
|
|
|
Total current liabilities |
|
|
25,293 |
|
|
|
17,110 |
|
|
|
|
|
|
|
|
Working capital |
|
$ |
61,336 |
|
|
$ |
32,529 |
|
|
|
|
|
|
|
|
Working capital increased during fiscal year 2010 by $28,807, substantially driven by a $36,990
increase in current assets from September 30, 2009. The increase in current assets was caused by
the combined effect of $26,676 increase in Cash and cash equivalents, driven primarily by operating
activities and proceeds from the sale of the RF product line and Bainbridge Road facility in Solon,
Ohio, $3,153 of more short-term investments and $7,373 of higher accounts receivable resulting from
increased customer sales. Current liabilities increased from 2009 to 2010 by $8,183. The increased
levels in current liabilities resulted primarily from an increase in accrued employee incentives
and sales commissions.
Sources and Uses of Cash
The following table is a summary of our Consolidated Statements of Cash Flows:
| |
|
|
|
|
|
|
|
|
|
|
|
|
| |
|
2010 |
|
|
2009 |
|
|
2008 |
|
Cash provided by (used in): |
|
|
|
|
|
|
|
|
|
|
|
|
Operating activities |
|
$ |
18,904 |
|
|
$ |
(5,416 |
) |
|
$ |
1,706 |
|
Investing activities |
|
|
8,966 |
|
|
|
9,178 |
|
|
|
16,031 |
|
Financing activities |
|
|
(1,374 |
) |
|
|
(2,029 |
) |
|
|
(8,844 |
) |
Operating activities. Cash provided by operating activities was $18,904 in fiscal year 2010
compared to cash used in operations of $5,416 for fiscal year 2009. Cash from operating activities
is net income (loss) adjusted for certain non-cash expenses and changes in assets and liabilities. During
fiscal year 2010, operating cash flows resulted primarily from a net income of $24,878 offset by an
increase in accounts receivable, deferred income taxes and the gain on the sale of assets $7,384,
$1,168 and $4,755, respectively, and augmented by non-cash charges from depreciation, stock-based
compensation and accrued employee incentives. We also made a $2,000 contribution to our U.S. pension
plan. During fiscal 2009, the net use of cash in operating
activities stemmed primarily from the net loss which was not fully offset by non-cash charges and
reductions in working capital. We also made $750 of voluntary contributions to our U.S. pension
plan. During fiscal year 2008, operating cash flows resulted primarily from a decrease in accounts
receivable, and the positive impact of non-cash charges from depreciation, stock-based compensation
and assets impairment charges. This was partially offset by non-cash charges for deferred taxes, an
increase in inventory, and $1,500 in contributions to the Company’s U.S. pension plan in fiscal
2008.
20
Investing
activities. Cash provided by investing activities was $8,966 in fiscal year 2010
compared to $9,178 in fiscal year 2009. Cash flows from investing activities consist primarily of
the sale of assets related to the RF product line and the Bainbridge Facility, the purchase and
sale of investments and purchases of property, plant and equipment. Capital spending declined to
$713 in 2010 from $1,994 in 2009 as we curtailed spending in response to the difficult economic
conditions experienced throughout the prior year. In
2010, the Company had proceeds from the sale
of assets totaling $12,800. This was comprised of the completed sale of the RF product line assets
to Agilent for a cash purchase price of $9,000 and $3,800 for the sale of the Company’s Bainbridge
Facility. We purchased $3,153 of short-term investments in fiscal year 2010 versus $759 in fiscal
year 2009, while sales of short-term investments generated $0 in cash in fiscal 2010 versus $12,500
last year. As a result, during fiscal 2010 we increased investments due to an increase in overall
cash by $3,153, compared to liquidating approximately $11,741 of investments to provide cash for
operations and other activities in fiscal year 2009. The increase in these investment activities
directly relate to the improved operational performance in fiscal year 2010 compared to fiscal year
2009. Additionally, in fiscal year 2009 we used $569 in connection with pledges against outstanding
letters of credit as required under our existing credit arrangement. See Note E for details.
Financing
activities. Cash used for financing activities in fiscal year
2010 was $1,374
versus $2,029 in fiscal year 2009. During fiscal year 2010, we repurchased $12 of our Common Shares
compared to $787 in fiscal year 2009. See Note C for further details. Cash dividends in fiscal year
2010 of $1,535 were comparable with the $1,521 incurred in fiscal year 2009.
The Company amended its credit agreement in March 2010. The revised facility consisted of a $5,000
debt facility ($0 outstanding at September 30, 2010) that provided unsecured, multi-currency
revolving credit at various interest rates based on Prime or LIBOR. The
agreement did not contain debt covenants, but required cash to be pledged against outstanding
borrowings and stand-by letters of credit. We were required to pay a facility fee of 0.25% per
annum on the total amount of the commitment. The expiration date had been extended to March 31,
2012, but the credit agreement was terminated on December 8, 2010. The Company had a number of other such
credit facilities in various currencies and for standby letters of credit aggregating $1,734 ($83
outstanding at September 30, 2010).
At September 30, 2010, we had total unused lines of credit with domestic and foreign banks
aggregating $6,114. See Note E for further details. Under certain provisions of the former debt
agreement, we were required to comply with various financial ratios and covenants.
Our stock repurchase program expired on February 28, 2009 and was not renewed or replaced.
Accordingly, we have been unable to repurchase Common Shares since such date. See Note C for more
details.
During 2011, we expect to finance capital spending and working capital requirements with cash and
short-term investments on hand and cash provided by operations.
Set forth below is a table of information with respect to the Company’s contractual obligations as
of September 30, 2010:
| |
|
|
|
|
|
|
|
|
|
|
|
|
|
|
|
|
|
|
|
|
| |
|
Payments Due by Period |
|
| Contractual Obligations |
|
Total |
|
|
Less than 1 year |
|
|
1-3 years |
|
|
3-5 years |
|
|
More than 5 years |
|
Short-Term Debt |
|
$ |
— |
|
|
$ |
— |
|
|
$ |
— |
|
|
$ |
— |
|
|
$ |
— |
|
Operating Lease Obligations (a) |
|
|
5,367 |
|
|
|
1,890 |
|
|
|
2,081 |
|
|
|
786 |
|
|
|
610 |
|
Payments Under Deferred Compensation Agreements (b) |
|
|
2,250 |
|
|
|
193 |
|
|
|
296 |
|
|
|
156 |
|
|
|
1,605 |
|
Pension Benefits (c) |
|
|
— |
|
|
|
— |
|
|
|
(c |
) |
|
|
(c |
) |
|
|
(c |
) |
Non-cancelable Purchase Commitments |
|
$ |
288 |
|
|
$ |
288 |
|
|
|
— |
|
|
|
— |
|
|
|
— |
|
Total Contractual Obligations |
|
$ |
7,905 |
|
|
$ |
2,371 |
|
|
$ |
2,377 |
|
|
$ |
942 |
|
|
$ |
2,215 |
|
| |
|
|
| (a) |
|
Agilent assumed the Santa Rosa lease associated with the RF product line: however, the
Company remains a guarantor in the event of default. Agilent will indemnify the Company for
any amounts paid by the Company to the landlord in event of any default. Accordingly,
obligations of approximately $305 and $178 under that lease are not included in the above
table as they are not expected to be incurred by the Company for fiscal 2011 and 2012,
respectively. |
| |
| (b) |
|
Includes amounts due under deferred compensation agreements with current and former
employees. At September 30, 2010, investment in insurance assets to fund future deferred
compensation payments were $1,842. Amounts exclude additional interest and investment gains or
losses that may be earned or incurred from September 30, 2010 through the time of payment. |
| |
| (c) |
|
The obligation related to pension benefits is actuarially determined and is reflective of
obligations as of September 30, 2010. The Company made a voluntary pension contribution of
$2,000 in fiscal 2010, and a $2,000 contribution was made in October 2010 to satisfy the
requirement for fiscal 2011. No further contributions are anticipated. We are not able to
reasonably estimate our future required contributions beyond 2011 due to uncertainties
regarding significant assumptions involved in estimating future required contributions to our
defined benefit pension plans, including interest rate levels, the amount and timing of asset
returns; what, if any, changes may occur in legislation; and how contributions in excess of
the minimum requirements could impact the amounts and timing of future contributions. |
21
Off-Balance Sheet Arrangements
The Company has no off-balance sheet arrangements.
Recently Adopted Accounting Pronouncements
In February 2007, the FASB issued guidance which allows companies to choose, at specified election
dates, to measure eligible financial assets and liabilities at fair value that are not otherwise
required to be measured at fair value. Unrealized gains and losses shall be reported on items for
which the fair value option has been elected in earnings at each subsequent reporting date. The
guidance was effective for fiscal years beginning after November 15, 2007. The Company adopted the
guidance effective October 1, 2008, and the adoption did not have a material impact on its
Consolidated Financial Statements.
In March 2008, the FASB issued updates to guidance, amending and expanding the disclosure
requirements related to the use of derivative instruments and hedging activities to provide
improved transparency into the uses and financial statement impact of derivative instruments and
hedging activities. The new disclosure provisions were adopted by the Company in the second quarter
of fiscal 2009. See Note F for the required disclosures related to derivative instruments and
hedging activities.
In April 2009, the FASB issued authoritative guidance for disclosures about derivative instruments
and hedging activities. The guidance is intended to improve financial reporting about derivative
instruments and hedging activities by requiring enhanced disclosures to enable investors to better
understand their effects on an entity’s results of operations. The Company adopted the guidance in
the third quarter of fiscal 2009. Adoption did not have an effect on its consolidated results of
operations, financial position or cash flows.
In June 2009, the Financial Accounting Standards Board (“FASB”) issued the Accounting Standards
Codification (“ASC”) to serve as the single source of authoritative U.S. GAAP. The ASC supersedes
all the existing non-SEC accounting and reporting standards upon its effective date and,
subsequently, the FASB will not issue new standards in the form of Statements, Staff Positions, or
Emerging Issues Task Force Abstracts. The guidance is not intended to change or alter existing U.S.
GAAP. The guidance became effective for the Company in the fourth quarter of fiscal 2009. Adoption
did not have an impact on its consolidated results of operations, financial position or cash flows.
In May 2009, the FASB issued authoritative guidance which establishes general standards for
accounting and disclosure of events occurring subsequent to the balance sheet date but prior to
issuance of the financial statements. The guidance is not intended to result in significant change
to current practice. The Company adopted the guidance in the fourth quarter of fiscal 2009.
Adoption did not have an effect on its consolidated results of operations, financial position or
cash flows.
In September 2006, the FASB issued guidance that requires that employers recognize the funded
status of defined benefit pension and other postretirement benefit plans as a net asset or
liability on the balance sheet and recognize as a component of other comprehensive income, net of
tax, the gains or losses and prior service costs or credits that arise during the period but are
not recognized as a component of net periodic benefit cost. Companies are required to measure plan
assets and benefit obligations as of their fiscal year end. The Company adopted the presentation
requirements of the guidance in fiscal 2007, which resulted in a net charge to other comprehensive
income of $1,975. We adopted the measurement date provisions in fiscal 2009, and as a result,
recorded a charge of $105 to retained earnings. See Note H for additional information related to
the change in measurement date provisions.
In September 2006, the FASB issued authoritative guidance which established a framework for
measuring fair value in generally accepted accounting principles, and expanded disclosures about
fair value measurements. The guidance is applicable to other accounting pronouncements that require
or permit fair value measurements. Accordingly, the guidance did not require any new fair value
measurements. However, for some entities, the application changed current practice. The guidance
became effective for financial statements issued for fiscal years beginning after November 15,
2007, and interim periods within those fiscal years. However, the FASB provided a one-year deferral
for the implementation for nonfinancial assets and liabilities. The Company adopted the guidance
effective October 1, 2008, except with respect to nonfinancial assets and liabilities, and the
adoption did not have a material impact on its Consolidated Financial Statements. The Company
adopted the guidance related to nonfinancial assets and liabilities effective October 1, 2009,
which resulted in expanded disclosures in its consolidated financial statements. In January 2010,
the FASB issued updates to the guidance that is intended to improve disclosures about fair value
measurements. The Company adopted the guidance effective January 1, 2010. Adoption did not have a
material impact on its consolidated financial statements.
In December 2008, the FASB issued updates to the guidance which is intended to enhance
disclosures regarding assets in defined benefit pension or other postretirement plans. The updates
are effective for the Company in the fourth quarter of fiscal 2010. The
Company the adopted the guidance effective July 1, 2010. Adoption did not have a material impact on its Consolidated Financial Statements.
22
Recently Issued Accounting Pronouncements
In June 2009, the FASB issued updates to guidance that address accounting for variable interest
entities. These updates to ASC 810 are effective for the Company in the first quarter of fiscal
2011. The Company is currently assessing the impact that adoption will have on its consolidated
results of operations, financial position, or cash flows.
In October 2009, the FASB issued ASU 2009-13, updates to address revenue recognition for
multiple-deliverable revenue arrangements that include software elements. The new guidance is
effective for the Company in fiscal 2011. The Company is currently assessing the impact that
adoption will have on its consolidated results of operations, financial position, or cash flows.
In April 2010, the FASB issued ASU 2010-17, updates to address revenue recognition for arrangements
in which a vendor satisfies its performance obligations over time, with all or a portion of the
consideration contingent on future events, referred to as “milestones.” The new guidance is
effective for the Company in fiscal 2011. The Company is currently assessing the impact that
adoption will have on its consolidated results of operations, financial position, or cash flows.
In July 2010, the FASB issued ASU 2010-20, updates to guidance that address disclosures about the
credit quality of financing receivables and the allowance for credit losses. The new guidance
amends ASC Topic 310 and is effective for the Company in the first quarter of fiscal 2011. The
Company is currently assessing the impact that adoption will have on its consolidated results of
operations, financial position, or cash flows.
|
|
|
| ITEM 7A |
|
— QUANTITATIVE AND QUALITATIVE DISCLOSURES ABOUT MARKET RISK |
The Company is exposed to a variety of risks, including foreign currency fluctuations, interest
rate fluctuations and changes in the market value of its short-term investments. In the normal
course of business, we employ established policies and procedures to manage our exposure to
fluctuations in foreign currency values and interest rates.
The Company is exposed to foreign currency exchange rate risk primarily through transactions
denominated in foreign currencies. We currently utilize foreign exchange forward contracts or
option contracts to sell foreign currencies to fix the exchange rates related to near-term sales
and effectively fix our margins. Generally, these contracts have maturities of three months or
less. Our policy is to only enter into derivative transactions when we have an identifiable
exposure to risk, thus not creating additional foreign currency exchange rate risk. In our opinion,
a 10 percent adverse change in foreign currency exchange rates would not have a material effect on
these instruments nor, therefore, on our results of operations, financial position or cash flows.
The Company maintains a short-term investment portfolio consisting primarily of various money
market funds and certificates of deposit (CDs) with numerous institutions and differing maturity
dates. A decline in interest rates would generally not change the value of these investments as
they mature, but would decrease earnings on future CDs purchased with cash or proceeds from other
matured CDs. During fiscal 2010, the amount of short-term investments has increased in terms of
both dollars and as a percentage of total current assets. However, in management’s opinion, a 10
percent decline in interest rates would not have a material impact on our consolidated results of
operations, financial position or cash flows.
23
ITEM 8 — FINANCIAL STATEMENTS AND SUPPLEMENTARY DATA
Report of Independent Registered Public Accounting Firm
To the Board of Directors and Shareholders of Keithley Instruments, Inc.
In our opinion, the accompanying consolidated balance sheets and the related consolidated
statements of operations, shareholders’ equity and cash flows present fairly, in all material
respects, the financial position of Keithley Instruments, Inc. and its subsidiaries at September
30, 2010 and 2009, and the results of their operations and their cash flows for each of the three
years in the period ended September 30, 2010 in conformity with accounting principles generally
accepted in the United States of America. Also in our opinion, the Company maintained, in all
material respects, effective internal control over financial reporting as of September 30, 2010,
based on criteria established in Internal Control — Integrated Framework issued by the Committee
of Sponsoring Organizations of the Treadway Commission (COSO). The Company’s management is
responsible for these financial statements, for maintaining effective internal control over
financial reporting and for its assessment of the effectiveness of internal control over financial
reporting, included in management’s report on internal control over financial reporting included in
Item 9A. Our responsibility is to express opinions on these financial statements and on the
Company’s internal control over financial reporting based on our integrated audits. We conducted
our audits in accordance with the standards of the Public Company Accounting Oversight Board
(United States). Those standards require that we plan and perform the audits to obtain reasonable
assurance about whether the financial statements are free of material misstatement and whether
effective internal control over financial reporting was maintained in all material respects. Our
audits of the financial statements included examining, on a test basis, evidence supporting the
amounts and disclosures in the financial statements, assessing the accounting principles used and
significant estimates made by management, and evaluating the overall financial statement
presentation. Our audit of internal control over financial reporting included obtaining an
understanding of internal control over financial reporting, assessing the risk that a material
weakness exists, and testing and evaluating the design and operating effectiveness of internal
control based on the assessed risk. Our audits also included performing such other procedures as we
considered necessary in the circumstances. We believe that our audits provide a reasonable basis
for our opinions.
A company’s internal control over financial reporting is a process designed to provide reasonable
assurance regarding the reliability of financial reporting and the preparation of financial
statements for external purposes in accordance with generally accepted accounting principles. A
company’s internal control over financial reporting includes those policies and procedures that (i)
pertain to the maintenance of records that, in reasonable detail, accurately and fairly reflect the
transactions and dispositions of the assets of the company; (ii) provide reasonable assurance that
transactions are recorded as necessary to permit preparation of financial statements in accordance
with generally accepted accounting principles, and that receipts and expenditures of the company
are being made only in accordance with authorizations of management and directors of the company;
and (iii) provide reasonable assurance regarding prevention or timely detection of unauthorized
acquisition, use, or disposition of the company’s assets that could have a material effect on the
financial statements.
Because of its inherent limitations, internal control over financial reporting may not prevent or
detect misstatements. Also, projections of any evaluation of effectiveness to future periods are
subject to the risk that controls may become inadequate because of changes in conditions, or that
the degree of compliance with the policies or procedures may deteriorate.
/s/ PricewaterhouseCoopers LLP
Cleveland, Ohio
December 13, 2010
24
Consolidated Statements of Operations
For the years ended September 30, 2010, 2009 and 2008 (In Thousands of Dollars Except for Per Share
Data)
| |
|
|
|
|
|
|
|
|
|
|
|
|
| |
|
2010 |
|
|
2009 |
|
|
2008 |
|
Net sales |
|
$ |
126,870 |
|
|
$ |
102,527 |
|
|
$ |
152,468 |
|
Cost of goods sold |
|
|
44,645 |
|
|
|
44,890 |
|
|
|
62,623 |
|
Inventory writedowns and accelerated depreciation for exit of product line |
|
|
— |
|
|
|
2,540 |
|
|
|
— |
|
|
|
|
|
|
|
|
|
|
|
Gross profit |
|
|
82,225 |
|
|
|
55,097 |
|
|
|
89,845 |
|
Selling, general and administrative expenses |
|
|
48,385 |
|
|
|
49,764 |
|
|
|
66,413 |
|
Product development expenses |
|
|
12,145 |
|
|
|
18,024 |
|
|
|
25,504 |
|
Gain on the sale of RF product line |
|
|
(2,894 |
) |
|
|
— |
|
|
|
— |
|
Gain on the sale of building |
|
|
(1,862 |
) |
|
|
— |
|
|
|
— |
|
Severance and related charges |
|
|
(124 |
) |
|
|
6,926 |
|
|
|
1,377 |
|
|
|
|
|
|
|
|
|
|
|
Operating income (loss) |
|
|
26,575 |
|
|
|
(19,617 |
) |
|
|
(3,449 |
) |
Investment income |
|
|
95 |
|
|
|
303 |
|
|
|
1,603 |
|
Interest expense |
|
|
(23 |
) |
|
|
(52 |
) |
|
|
(70 |
) |
Transaction costs associated with pending merger |
|
|
(1,250 |
) |
|
|
— |
|
|
|
— |
|
Impairment of long-term investments |
|
|
— |
|
|
|
— |
|
|
|
(2,620 |
) |
|
|
|
|
|
|
|
|
|
|
Earnings (loss) before income taxes |
|
|
25,397 |
|
|
|
(19,366 |
) |
|
|
(4,536 |
) |
Provision (benefit) for income taxes |
|
|
519 |
|
|
|
31,138 |
|
|
|
(1,943 |
) |
|
|
|
|
|
|
|
|
|
|
Net income (loss) |
|
$ |
24,878 |
|
|
$ |
(50,504 |
) |
|
$ |
(2,593 |
) |
|
|
|
|
|
|
|
|
|
|
Basic earnings (loss) per share |
|
$ |
1.58 |
|
|
$ |
(3.23 |
) |
|
$ |
(0.16 |
) |
|
|
|
|
|
|
|
|
|
|
Diluted earnings (loss) per share |
|
$ |
1.53 |
|
|
$ |
(3.23 |
) |
|
$ |
(0.16 |
) |
|
|
|
|
|
|
|
|
|
|
The accompanying notes are an integral part of the consolidated financial statements.
25
Consolidated Balance Sheets
As of September 30, 2010 and 2009 (In Thousands of Dollars Except for Share Data)
| |
|
|
|
|
|
|
|
|
| |
|
2010 |
|
|
2009 |
|
Assets |
|
|
|
|
|
|
|
|
Current assets: |
|
|
|
|
|
|
|
|
Cash and cash equivalents |
|
$ |
50,790 |
|
|
$ |
24,114 |
|
Restricted cash |
|
|
537 |
|
|
|
569 |
|
Short-term investments |
|
|
3,912 |
|
|
|
759 |
|
Refundable income taxes |
|
|
1,030 |
|
|
|
466 |
|
Accounts receivable and other, net of allowance for doubtful accounts of $649 and $598 as of September 30,
2010 and 2009, respectively |
|
|
19,111 |
|
|
|
11,738 |
|
Inventories: |
|
|
|
|
|
|
|
|
Raw materials |
|
|
6,060 |
|
|
|
5,760 |
|
Work in process |
|
|
768 |
|
|
|
613 |
|
Finished products |
|
|
2,244 |
|
|
|
3,564 |
|
|
|
|
|
|
|
|
Total inventories |
|
|
9,072 |
|
|
|
9,937 |
|
Deferred income taxes |
|
|
659 |
|
|
|
303 |
|
Prepaid expenses |
|
|
1,518 |
|
|
|
1,753 |
|
|
|
|
|
|
|
|
Total current assets |
|
|
86,629 |
|
|
|
49,639 |
|
|
|
|
|
|
|
|
Property, plant and equipment, at cost: |
|
|
|
|
|
|
|
|
Land |
|
|
923 |
|
|
|
1,325 |
|
Buildings and leasehold improvements |
|
|
10,819 |
|
|
|
18,053 |
|
Manufacturing, laboratory and office equipment |
|
|
26,242 |
|
|
|
34,703 |
|
|
|
|
|
|
|
|
|
|
|
37,984 |
|
|
|
54,081 |
|
Less-Accumulated depreciation and amortization |
|
|
32,271 |
|
|
|
42,981 |
|
|
|
|
|
|
|
|
Total property, plant and equipment, net |
|
|
5,713 |
|
|
|
11,100 |
|
|
|
|
|
|
|
|
Deferred income taxes |
|
|
1,942 |
|
|
|
748 |
|
Intangible assets |
|
|
— |
|
|
|
910 |
|
Other assets |
|
|
10,372 |
|
|
|
10,705 |
|
|
|
|
|
|
|
|
Total assets |
|
$ |
104,656 |
|
|
$ |
73,102 |
|
|
|
|
|
|
|
|
Liabilities and Shareholders’ Equity |
|
|
|
|
|
|
|
|
Current liabilities: |
|
|
|
|
|
|
|
|
Accounts payable |
|
$ |
5,903 |
|
|
$ |
4,916 |
|
Accrued payroll and related expenses |
|
|
11,602 |
|
|
|
5,648 |
|
Other accrued expenses |
|
|
5,166 |
|
|
|
5,424 |
|
Income taxes payable |
|
|
2,622 |
|
|
|
1,122 |
|
|
|
|
|
|
|
|
Total current liabilities |
|
|
25,293 |
|
|
|
17,110 |
|
|
|
|
|
|
|
|
Long-term deferred compensation |
|
|
180 |
|
|
|
2,111 |
|
Long-term income taxes payable |
|
|
2,985 |
|
|
|
2,852 |
|
Other long-term liabilities |
|
|
19,263 |
|
|
|
14,419 |
|
Commitments and contingencies (See Note L) |
|
|
|
|
|
|
|
|
Shareholders’ equity: |
|
|
|
|
|
|
|
|
Common Shares, stated value $.0125: |
|
|
|
|
|
|
|
|
Authorized — 80,000,000; issued and outstanding — 15,031,420 and 14,950,093 in 2010 and 2009, respectively |
|
|
188 |
|
|
|
187 |
|
Class B Common Shares, stated value $.0125: |
|
|
|
|
|
|
|
|
Authorized — 9,000,000; issued and outstanding — 2,150,502 in 2010 and 2009 |
|
|
27 |
|
|
|
27 |
|
Capital in excess of stated value |
|
|
41,495 |
|
|
|
39,121 |
|
Retained earnings |
|
|
51,972 |
|
|
|
28,629 |
|
Accumulated other comprehensive loss |
|
|
(21,170 |
) |
|
|
(15,900 |
) |
Common Shares held in treasury, at cost |
|
|
(15,577 |
) |
|
|
(15,454 |
) |
|
|
|
|
|
|
|
Total shareholders’ equity |
|
|
56,935 |
|
|
|
36,610 |
|
|
|
|
|
|
|
|
Total liabilities and shareholders’ equity |
|
$ |
104,656 |
|
|
$ |
73,102 |
|
|
|
|
|
|
|
|
The accompanying notes are an integral part of the consolidated financial statements.
26
Consolidated Statements of Shareholders’ Equity
For the years ended September 30, 2010, 2009 and 2008 (In Thousands of Dollars Except for Per Share
Data)
| |
|
|
|
|
|
|
|
|
|
|
|
|
|
|
|
|
|
|
|
|
|
|
|
|
|
|
|
|
| |
|
|
|
|
|
|
|
|
|
Capital |
|
|
|
|
|
|
Accumulated |
|
|
Common |
|
|
|
|
| |
|
|
|
|
|
Class B |
|
|
in excess |
|
|
|
|
|
|
other |
|
|
Shares |
|
|
Total |
|
| |
|
Common |
|
|
Common |
|
|
of stated |
|
|
Retained |
|
|
comprehensive |
|
|
held in |
|
|
shareholders’ |
|
| |
|
Shares |
|
|
Shares |
|
|
value |
|
|
earnings |
|
|
loss |
|
|
treasury |
|
|
equity |
|
Balance September 30, 2007 |
|
$ |
182 |
|
|
$ |
27 |
|
|
$ |
36,436 |
|
|
$ |
85,676 |
|
|
$ |
(946 |
) |
|
$ |
(8,351 |
) |
|
$ |
113,024 |
|
Comprehensive Loss: |
|
|
|
|
|
|
|
|
|
|
|
|
|
|
|
|
|
|
|
|
|
|
|
|
|
|
|
|
Net loss |
|
|
|
|
|
|
|
|
|
|
|
|
|
|
(2,593 |
) |
|
|
|
|
|
|
|
|
|
|
|
|
Translation adjustment |
|
|
|
|
|
|
|
|
|
|
|
|
|
|
|
|
|
|
85 |
|
|
|
|
|
|
|
|
|
Pension liability adjustment |
|
|
|
|
|
|
|
|
|
|
|
|
|
|
|
|
|
|
(720 |
) |
|
|
|
|
|
|
|
|
Net unrealized gain on derivative securities |
|
|
|
|
|
|
|
|
|
|
|
|
|
|
|
|
|
|
132 |
|
|
|
|
|
|
|
|
|
Net unrealized investment loss |
|
|
|
|
|
|
|
|
|
|
|
|
|
|
|
|
|
|
(424 |
) |
|
|
|
|
|
|
|
|
Total comprehensive loss |
|
|
|
|
|
|
|
|
|
|
|
|
|
|
|
|
|
|
|
|
|
|
|
|
|
|
(3,520 |
) |
Stock-based compensation |
|
|
|
|
|
|
|
|
|
|
1,832 |
|
|
|
|
|
|
|
|
|
|
|
|
|
|
|
1,832 |
|
Cash dividends: |
|
|
|
|
|
|
|
|
|
|
|
|
|
|
|
|
|
|
|
|
|
|
|
|
|
|
|
|
Common Shares ($.15 per share) |
|
|
|
|
|
|
|
|
|
|
|
|
|
|
(2,049 |
) |
|
|
|
|
|
|
|
|
|
|
(2,049 |
) |
Class B Common Shares ($.12 per share) |
|
|
|
|
|
|
|
|
|
|
|
|
|
|
(258 |
) |
|
|
|
|
|
|
|
|
|
|
(258 |
) |
Adoption of FIN 48 |
|
|
|
|
|
|
|
|
|
|
|
|
|
|
(17 |
) |
|
|
|
|
|
|
|
|
|
|
(17 |
) |
Shares issued under stock plans, net of taxes |
|
|
2 |
|
|
|
|
|
|
|
451 |
|
|
|
|
|
|
|
|
|
|
|
|
|
|
|
453 |
|
Common Shares acquired for settlement of deferred
Directors’ fees |
|
|
|
|
|
|
|
|
|
|
234 |
|
|
|
|
|
|
|
|
|
|
|
(234 |
) |
|
|
— |
|
Common Shares reissued in settlement of Director’s fees |
|
|
|
|
|
|
|
|
|
|
(23 |
) |
|
|
|
|
|
|
|
|
|
|
23 |
|
|
|
— |
|
Repurchase of Common Shares |
|
|
|
|
|
|
|
|
|
|
|
|
|
|
|
|
|
|
|
|
|
|
(6,163 |
) |
|
|
(6,163 |
) |
|
|
|
|
|
|
|
|
|
|
|
|
|
|
|
|
|
|
|
|
|
|
Balance September 30, 2008 |
|
|
184 |
|
|
|
27 |
|
|
|
38,930 |
|
|
|
80,759 |
|
|
|
(1,873 |
) |
|
|
(14,725 |
) |
|
|
103,302 |
|
Comprehensive Loss: |
|
|
|
|
|
|
|
|
|
|
|
|
|
|
|
|
|
|
|
|
|
|
|
|
|
|
|
|
Net loss |
|
|
|
|
|
|
|
|
|
|
|
|
|
|
(50,504 |
) |
|
|
|
|
|
|
|
|
|
|
|
|
Translation adjustment |
|
|
|
|
|
|
|
|
|
|
|
|
|
|
|
|
|
|
424 |
|
|
|
|
|
|
|
|
|
Pension liability adjustment |
|
|
|
|
|
|
|
|
|
|
|
|
|
|
|
|
|
|
(14,756 |
) |
|
|
|
|
|
|
|
|
Net unrealized gain on derivative Securities |
|
|
|
|
|
|
|
|
|
|
|
|
|
|
|
|
|
|
(137 |
) |
|
|
|
|
|
|
|
|
Net unrealized investment gain |
|
|
|
|
|
|
|
|
|
|
|
|
|
|
|
|
|
|
442 |
|
|
|
|
|
|
|
|
|
Total comprehensive loss |
|
|
|
|
|
|
|
|
|
|
|
|
|
|
|
|
|
|
|
|
|
|
|
|
|
|
(64,531 |
) |
Stock-based compensation |
|
|
|
|
|
|
|
|
|
|
(53 |
) |
|
|
|
|
|
|
|
|
|
|
|
|
|
|
(53 |
) |
Implementation of pension measurement date change |
|
|
|
|
|
|
|
|
|
|
|
|
|
|
(105 |
) |
|
|
|
|
|
|
|
|
|
|
(105 |
) |
Cash dividends: |
|
|
|
|
|
|
|
|
|
|
|
|
|
|
|
|
|
|
|
|
|
|
|
|
|
|
|
|
Common Shares ($.10 per share) |
|
|
|
|
|
|
|
|
|
|
|
|
|
|
(1,349 |
) |
|
|
|
|
|
|
|
|
|
|
(1,349 |
) |
Class B Common Shares ($.08 per share) |
|
|
|
|
|
|
|
|
|
|
|
|
|
|
(172 |
) |
|
|
|
|
|
|
|
|
|
|
(172 |
) |
Shares issued under stock plans, net of taxes |
|
|
3 |
|
|
|
|
|
|
|
302 |
|
|
|
|
|
|
|
|
|
|
|
|
|
|
|
305 |
|
Common Shares acquired for settlement of deferred
Directors’ fees |
|
|
|
|
|
|
|
|
|
|
228 |
|
|
|
|
|
|
|
|
|
|
|
(228 |
) |
|
|
— |
|
Common Shares reissued in settlement of Director’s fees |
|
|
|
|
|
|
|
|
|
|
(286 |
) |
|
|
|
|
|
|
|
|
|
|
286 |
|
|
|
— |
|
Repurchase of Common Shares |
|
|
|
|
|
|
|
|
|
|
|
|
|
|
|
|
|
|
|
|
|
|
(787 |
) |
|
|
(787 |
) |
|
|
|
|
|
|
|
|
|
|
|
|
|
|
|
|
|
|
|
|
|
|
Balance September 30, 2009 |
|
|
187 |
|
|
|
27 |
|
|
|
39,121 |
|
|
|
28,629 |
|
|
|
(15,900 |
) |
|
|
(15,454 |
) |
|
|
36,610 |
|
Comprehensive Income: |
|
|
|
|
|
|
|
|
|
|
|
|
|
|
|
|
|
|
|
|
|
|
|
|
|
|
|
|
Net income |
|
|
|
|
|
|
|
|
|
|
|
|
|
|
24,878 |
|
|
|
|
|
|
|
|
|
|
|
|
|
Translation adjustment |
|
|
|
|
|
|
|
|
|
|
|
|
|
|
|
|
|
|
302 |
|
|
|
|
|
|
|
|
|
Pension liability adjustment |
|
|
|
|
|
|
|
|
|
|
|
|
|
|
|
|
|
|
(5,555 |
) |
|
|
|
|
|
|
|
|
Net unrealized gain on derivative Securities |
|
|
|
|
|
|
|
|
|
|
|
|
|
|
|
|
|
|
(17 |
) |
|
|
|
|
|
|
|
|
Total comprehensive income |
|
|
|
|
|
|
|
|
|
|
|
|
|
|
|
|
|
|
|
|
|
|
|
|
|
|
19,608 |
|
Stock-based compensation |
|
|
|
|
|
|
|
|
|
|
2,092 |
|
|
|
|
|
|
|
|
|
|
|
|
|
|
|
2,092 |
|
Cash dividends: |
|
|
|
|
|
|
|
|
|
|
|
|
|
|
|
|
|
|
|
|
|
|
|
|
|
|
|
|
Common Shares ($.10 per share) |
|
|
|
|
|
|
|
|
|
|
|
|
|
|
(1,363 |
) |
|
|
|
|
|
|
|
|
|
|
(1,363 |
) |
Class B Common Shares ($.08 per share) |
|
|
|
|
|
|
|
|
|
|
|
|
|
|
(172 |
) |
|
|
|
|
|
|
|
|
|
|
(172 |
) |
Shares issued under stock plans, net of taxes |
|
|
1 |
|
|
|
|
|
|
|
171 |
|
|
|
|
|
|
|
|
|
|
|
|
|
|
|
172 |
|
Common Shares acquired for settlement of deferred
Directors’ fees |
|
|
|
|
|
|
|
|
|
|
158 |
|
|
|
|
|
|
|
|
|
|
|
(158 |
) |
|
|
— |
|
Common Shares reissued in settlement of Director’s fees |
|
|
|
|
|
|
|
|
|
|
(47 |
) |
|
|
|
|
|
|
|
|
|
|
47 |
|
|
|
— |
|
Repurchase of Common Shares |
|
|
|
|
|
|
|
|
|
|
|
|
|
|
|
|
|
|
|
|
|
|
(12 |
) |
|
|
(12 |
) |
|
|
|
|
|
|
|
|
|
|
|
|
|
|
|
|
|
|
|
|
|
|
Balance September 30, 2010 |
|
$ |
188 |
|
|
$ |
27 |
|
|
$ |
41,495 |
|
|
$ |
51,972 |
|
|
$ |
(21,170 |
) |
|
$ |
(15,577 |
) |
|
$ |
56,935 |
|
|
|
|
|
|
|
|
|
|
|
|
|
|
|
|
|
|
|
|
|
|
|
The accompanying notes are an integral part of the consolidated financial statements.
27
Consolidated Statements of Cash Flows
For the years ended September 30, 2010, 2009 and 2008 (In Thousands of Dollars)
| |
|
|
|
|
|
|
|
|
|
|
|
|
| |
|
2010 |
|
|
2009 |
|
|
2008 |
|
Cash flows from operating activities: |
|
|
|
|
|
|
|
|
|
|
|
|
Net income (loss) |
|
$ |
24,878 |
|
|
$ |
(50,504 |
) |
|
$ |
(2,593 |
) |
Adjustments to reconcile net income (loss) to net cash provided by (used in)
operating activities: |
|
|
|
|
|
|
|
|
|
|
|
|
Depreciation |
|
|
2,157 |
|
|
|
3,626 |
|
|
|
4,157 |
|
Amortization |
|
|
47 |
|
|
|
280 |
|
|
|
210 |
|
Deferred income taxes |
|
|
(1,332 |
) |
|
|
30,412 |
|
|
|
(3,174 |
) |
Deferred compensation |
|
|
236 |
|
|
|
18 |
|
|
|
(76 |
) |
Stock-based compensation |
|
|
2,092 |
|
|
|
(53 |
) |
|
|
1,832 |
|
Non-cash charges for exit of product line |
|
|
— |
|
|
|
4,498 |
|
|
|
— |
|
Gain on the sale of assets |
|
|
(4,756 |
) |
|
|
— |
|
|
|
— |
|
Loss on the disposition/impairment of assets |
|
|
284 |
|
|
|
110 |
|
|
|
2,775 |
|
Change in current assets and liabilities: |
|
|
|
|
|
|
|
|
|
|
|
|
Refundable income taxes |
|
|
(562 |
) |
|
|
(191 |
) |
|
|
516 |
|
Accounts receivable and other |
|
|
(7,384 |
) |
|
|
5,494 |
|
|
|
2,330 |
|
Inventories |
|
|
(957 |
) |
|
|
5,945 |
|
|
|
(5,210 |
) |
Prepaid expenses |
|
|
(62 |
) |
|
|
465 |
|
|
|
(90 |
) |
Other current liabilities |
|
|
4,399 |
|
|
|
(5,541 |
) |
|
|
1,208 |
|
Other operating activities |
|
|
(136 |
) |
|
|
25 |
|
|
|
(179 |
) |
|
|
|
|
|
|
|
|
|
|
Net cash provided by (used in) operating activities |
|
|
18,904 |
|
|
|
(5,416 |
) |
|
|
1,706 |
|
|
|
|
|
|
|
|
|
|
|
Cash flows from investing activities: |
|
|
|
|
|
|
|
|
|
|
|
|
Proceeds from the sale of assets |
|
|
12,800 |
|
|
|
— |
|
|
|
— |
|
Capital expenditures |
|
|
(713 |
) |
|
|
(1,994 |
) |
|
|
(3,831 |
) |
Restricted cash |
|
|
32 |
|
|
|
(569 |
) |
|
|
— |
|
Purchase of investments and other |
|
|
(3,153 |
) |
|
|
(759 |
) |
|
|
(13,225 |
) |
Proceeds from maturities and sales of investments |
|
|
— |
|
|
|
12,500 |
|
|
|
33,087 |
|
|
|
|
|
|
|
|
|
|
|
Net cash provided by investing activities |
|
|
8,966 |
|
|
|
9,178 |
|
|
|
16,031 |
|
|
|
|
|
|
|
|
|
|
|
Cash flows from financing activities: |
|
|
|
|
|
|
|
|
|
|
|
|
Net repayment of short-term debt |
|
|
0 |
|
|
|
(25 |
) |
|
|
(861 |
) |
Proceeds from employee stock purchase and option plans |
|
|
201 |
|
|
|
212 |
|
|
|
347 |
|
Tax benefit of stock purchase and stock-based compensation arrangements |
|
|
(28 |
) |
|
|
92 |
|
|
|
140 |
|
Repurchase of Common Shares |
|
|
(12 |
) |
|
|
(787 |
) |
|
|
(6,163 |
) |
Cash dividends |
|
|
(1,535 |
) |
|
|
(1,521 |
) |
|
|
(2,307 |
) |
|
|
|
|
|
|
|
|
|
|
Net cash used in financing activities |
|
|
(1,374 |
) |
|
|
(2,029 |
) |
|
|
(8,844 |
) |
|
|
|
|
|
|
|
|
|
|
Effect of changes in foreign currency exchange rates on cash and cash equivalents |
|
|
180 |
|
|
|
308 |
|
|
|
292 |
|
|
|
|
|
|
|
|
|
|
|
Increase in cash and cash equivalents |
|
|
26,676 |
|
|
|
2,041 |
|
|
|
9,185 |
|
Cash and cash equivalents at beginning of period |
|
|
24,114 |
|
|
|
22,073 |
|
|
|
12,888 |
|
|
|
|
|
|
|
|
|
|
|
Cash and cash equivalents at end of period |
|
$ |
50,790 |
|
|
$ |
24,114 |
|
|
$ |
22,073 |
|
|
|
|
|
|
|
|
|
|
|
Supplemental disclosures of cash flow information |
|
|
|
|
|
|
|
|
|
|
|
|
Cash paid during the year for: |
|
|
|
|
|
|
|
|
|
|
|
|
Income taxes |
|
$ |
227 |
|
|
$ |
1,229 |
|
|
$ |
1,945 |
|
Interest |
|
|
29 |
|
|
|
53 |
|
|
|
59 |
|
The accompanying notes are an integral part of the consolidated financial statements.
28
NOTES TO CONSOLIDATED FINANCIAL STATEMENTS
(In Thousands of Dollars Except for Per-Share Data)
Note A — Summary of Significant Accounting Policies
Principles of consolidation
The consolidated financial statements include the accounts of Keithley Instruments, Inc. and its
subsidiaries (“Keithley” or “Company”). Intercompany transactions have been eliminated.
Nature of operations
Keithley’s business is to design, develop, manufacture and market complex electronic instruments
and systems to serve the specialized needs of electronics manufacturers for high-performance
production testing, process monitoring, product development and research. Our primary products are
integrated systems used to source, measure, connect, control or communicate electrical direct
current (DC) or optical signals. Although our products vary in capability, sophistication, use,
size and price, they generally test, measure and analyze electrical, optical or physical
properties. As such, we consider our business to be in a single industry segment.
On November 30, 2009, the Company closed its transaction with Agilent Technologies, Inc.
(“Agilent”) with respect to the sale of its RF product line. Accordingly, our business did not
include those operations following the closing date.
Revenue recognition
Keithley Instruments, Inc. recognizes product revenue when persuasive evidence of an arrangement
exists, delivery has occurred, the sales price is fixed or determinable and collectability is
reasonably assured. Delivery is considered to have been met when title and risk of loss have
transferred to the customer. Upon shipment, a provision is made for estimated costs that may be
incurred for product warranties and sales returns. Revenue earned from service is recognized
ratably over the contractual service periods and is not material to the Company’s consolidated
results. Shipping and handling costs are recorded as Cost of goods sold in the Consolidated
Statements of Operations.
Foreign currency translation
Our revenues, costs and expenses, and assets and liabilities are exposed to changes in foreign
currency exchange rates as a result of our global operations. For those subsidiaries that operate
in a local functional currency environment, all assets and liabilities are translated into U.S.
dollars using current exchange rates, and revenues and expenses are translated using weighted
average exchange rates in effect during the period. Resulting translation adjustments are reported
as a separate component of accumulated comprehensive income in shareholders’ equity. For those
entities that operate in a U.S. dollar functional currency environment, foreign currency assets and
liabilities are remeasured into U.S. dollars at current exchange rates. Gains or losses from
foreign currency remeasurement are generally immaterial and are included in the “Selling, general
and administrative expenses” caption of the Consolidated Statements of Operations.
Advertising
Advertising production and placement costs are expensed when incurred. Advertising expenses were
$4,956, $5,043 and $7,985 in 2010, 2009 and 2008, respectively.
Intangible assets
Intangible assets include software costs related to our RF product line, which was sold to Agilent
in November 2009. Prior to the sale, the asset was amortized over the estimated economic life of
the software products, which was estimated to be five years. At each balance sheet date, the
unamortized cost of the software was compared to its net realizable value. The net realizable value
was the estimated future gross revenues from the software product reduced by the estimated future
costs of completing and disposing of that product, including the costs of performing maintenance
and customer support. The excess of the unamortized cost over the net realizable value would then
have been recognized as an impairment loss. Amortization expense is recorded as “Cost of goods
sold” in the Consolidated Statements of Operations and was $47, $280 and $210 in 2010, 2009 and
2008, respectively.
29
Product development expenses
Expenditures for product development are charged to expense as incurred.
Fair Value Measurements
Assets and liabilities measured at fair value are classified using the following hierarchy, which
is based upon the transparency of inputs to the valuation as of the measurement date.
| • |
|
Level 1 — Valuation is based upon quoted prices (unadjusted) for identical assets or
liabilities in active markets. |
| • |
|
Level 2 — Valuation is based upon quoted prices for similar assets and liabilities in active
markets, or other inputs that are observable for the asset or liability, either directly or
indirectly, for substantially the full term of the financial instrument. |
| • |
|
Level 3 — Valuation is based upon other unobservable inputs that are significant to the fair
value measurement. |
The classification of fair value measurements within the hierarchy is based upon the lowest level
of input that is significant to the measurement.
Cash and cash equivalents
The Company considers all highly liquid investments with maturities of three months or less when
purchased to be cash equivalents. The Company’s cash equivalents and investments are diversified
with numerous financial institutions which management believes to have acceptable credit ratings.
These investments are primarily money-market funds and short term certificates of deposit. The
recorded amount of these investments approximates fair value determined based on Level 1 and 2
inputs as defined under U.S. GAAP. Cash flows resulting from hedging transactions are classified in
the same category as the cash flows from the item being hedged.
Restricted cash
Effective March 31, 2010, the Company amended its $5,000 credit agreement. While the agreement does
not contain debt covenants, the Company is required to pledge cash against outstanding borrowings
and letters of credit. See Note E for further details.
Accounts receivable and allowance for doubtful accounts
Trade accounts receivable are recorded at the invoiced amount and do not bear interest. The
allowance for doubtful accounts is our best estimate of the amount of probable credit losses in our
existing accounts receivable. We determine the allowance based on historical write-off experience
by industry and regional economic data. We review our allowance for doubtful accounts periodically,
and all customer account balances are reviewed for collectability. Account balances are charged off
against the allowance when we feel it is probable the receivable will not be recovered. We do not
have any off-balance sheet credit exposure related to our customers. The changes in the allowance
for doubtful accounts for fiscal years ending September 30, 2010, 2009 and 2008 are as follows:
| |
|
|
|
|
|
|
|
|
|
|
|
|
| |
|
2010 |
|
|
2009 |
|
|
2008 |
|
Balance at beginning of year |
|
$ |
598 |
|
|
$ |
555 |
|
|
$ |
500 |
|
Additions |
|
|
59 |
|
|
|
79 |
|
|
|
63 |
|
Write-offs, net of recoveries |
|
|
(5 |
) |
|
|
(43 |
) |
|
|
(6 |
) |
Foreign exchange revaluation |
|
|
(3 |
) |
|
|
7 |
|
|
|
(2 |
) |
|
|
|
|
|
|
|
|
|
|
Balance at end of year |
|
$ |
649 |
|
|
$ |
598 |
|
|
$ |
555 |
|
|
|
|
|
|
|
|
|
|
|
Inventories
Inventories are stated at the lower of cost or market. Cost is determined based on a
currently-adjusted standard, which approximates actual cost on a first-in, first-out basis. The
Company provides inventory allowances based on excess and obsolete inventories determined primarily
by future demand forecasts. The allowance is measured as the difference between the cost of the
inventory and market based upon assumptions about future demand and charged to the provision for
inventory, which is a component of Cost of goods sold. At the point of the loss recognition, a new,
lower-cost basis for that inventory is established, and subsequent changes in facts and
circumstances do not result in the restoration or increase in that newly established cost basis.
See Note K for further details.
30
Property, plant and equipment
Property, plant and equipment are stated at cost. Depreciation is provided over periods
approximating the estimated useful lives of the assets. Substantially all manufacturing, laboratory
and office equipment is depreciated by the double declining balance method over periods of 3 to 10
years. Buildings are depreciated by the straight-line method over periods of 23 to 45 years.
Leasehold improvements are amortized over the shorter of the asset lives or the terms of the
leases. Depreciation expense was $2,157, $3,626 and $4,157 in fiscal 2010, 2009 and 2008,
respectively.
Capitalized software
Certain internal and external costs incurred to acquire or create internal use software are
capitalized. Capitalized software is included in property, plant and equipment and is depreciated
over 3 to 5 years after it is placed in service.
Impairment of long-lived assets
Long-lived assets are reviewed for impairment when events or circumstances indicate costs may not
be recoverable. Impairment exists when the carrying value of the assets is greater than the pretax
undiscounted future cash flows expected to be provided by the asset. If impairment exists, the
asset is written down to its fair value. Fair value is determined through quoted market values or
through the calculation of the pretax present value of future cash flows expected to be provided by
the asset.
Capital stock
The Company has two classes of stock. Each Class B Common Share has ten times the voting power of a
Common Share, but the Class B Common Shares are entitled to cash dividends of no more than 80% of
the cash dividends on the Common Shares. Holders of Common Shares, voting as a class, elect
one-fourth of the Company’s Board of Directors and participate with holders of Class B Common
Shares in electing the balance of the Directors and in voting on all other corporate matters
requiring shareholder approval. Additional Class B Common Shares may be issued only to holders of
such shares for stock dividends or stock splits. These shares are convertible at any time to Common
Shares on a one-for-one basis.
The number of Common Shares, Class B Common Shares and Common Shares held in treasury is shown
below:
| |
|
|
|
|
|
|
|
|
|
|
|
|
| |
|
|
|
|
|
Class B |
|
|
Common Shares |
|
| |
|
Common Shares |
|
|
Common Shares |
|
|
held in treasury |
|
Balance at September 30, 2007 |
|
|
14,580,978 |
|
|
|
2,150,502 |
|
|
|
(740,048 |
) |
Common Shares acquired for settlement of deferred Directors’ fees |
|
|
— |
|
|
|
— |
|
|
|
(26,162 |
) |
Common Shares reissued in settlement of directors’ fees |
|
|
— |
|
|
|
— |
|
|
|
1,616 |
|
Shares issued under stock plans |
|
|
141,607 |
|
|
|
— |
|
|
|
— |
|
Repurchase of Common Shares |
|
|
— |
|
|
|
— |
|
|
|
(636,600 |
) |
|
|
|
|
|
|
|
|
|
|
Balance at September 30, 2008 |
|
|
14,722,585 |
|
|
|
2,150,502 |
|
|
|
(1,401,194 |
) |
Common Shares acquired for settlement of deferred Directors’ fees |
|
|
— |
|
|
|
— |
|
|
|
(64,643 |
) |
Common Shares reissued in settlement of directors’ fees |
|
|
— |
|
|
|
— |
|
|
|
34,530 |
|
Shares issued under stock plans |
|
|
227,508 |
|
|
|
— |
|
|
|
— |
|
Repurchase of Common Shares |
|
|
— |
|
|
|
— |
|
|
|
(166,733 |
) |
|
|
|
|
|
|
|
|
|
|
Balance at September 30, 2009 |
|
|
14,950,093 |
|
|
|
2,150,502 |
|
|
|
(1,598,040 |
) |
|
|
|
|
|
|
|
|
|
|
Common Shares acquired for settlement of deferred Directors’ fees |
|
|
— |
|
|
|
— |
|
|
|
(28,658 |
) |
Common Shares reissued in settlement of directors’ fees |
|
|
— |
|
|
|
— |
|
|
|
5,890 |
|
Shares issued under stock plans |
|
|
81,327 |
|
|
|
— |
|
|
|
— |
|
Repurchase of Common Shares |
|
|
— |
|
|
|
— |
|
|
|
(2,649 |
) |
|
|
|
|
|
|
|
|
|
|
Balance at September 30, 2010 |
|
|
15,031,420 |
|
|
|
2,150,502 |
|
|
|
(1,623,457 |
) |
|
|
|
|
|
|
|
|
|
|
31
Accumulated other comprehensive loss
The components of accumulated other comprehensive loss, net of taxes, at September 30, 2010, 2009
and 2008 are as follows:
| |
|
|
|
|
|
|
|
|
|
|
|
|
| |
|
2010 |
|
|
2009 |
|
|
2008 |
|
Translation adjustment |
|
$ |
1,973 |
|
|
$ |
1,671 |
|
|
$ |
1,247 |
|
Net unrealized (loss) gain on derivative securities |
|
|
(108 |
) |
|
|
(91 |
) |
|
|
46 |
|
Net unrealized investment loss |
|
|
— |
|
|
|
— |
|
|
|
(442 |
) |
Benefit plan obligation |
|
|
(23,035 |
) |
|
|
(17,480 |
) |
|
|
(2,724 |
) |
|
|
|
|
|
|
|
|
|
|
Accumulated other comprehensive loss |
|
$ |
(21,170 |
) |
|
$ |
(15,900 |
) |
|
$ |
(1,873 |
) |
|
|
|
|
|
|
|
|
|
|
Income taxes
Deferred tax assets and liabilities are recognized under the liability method based upon the
difference between the amounts reported for financial reporting and tax purposes. Deferred taxes
are measured by applying currently enacted tax rates. Valuation allowances are established when
necessary to reflect the estimated amount of deferred tax assets that may not be realized based
upon the Company’s analysis of estimated future taxable income and establishment of tax strategies.
Future taxable income, the results of tax strategies and changes in tax laws could impact these
estimates. We have provided for estimated foreign withholding taxes and United States income taxes,
less available tax credits, for the undistributed earnings of the non-United States subsidiaries as
of September 30, 2010, 2009 and 2008.
Restructuring and Cost Reduction Programs
We expense costs associated with exit and disposal activities designed to restructure operations
and reduce ongoing costs of operations when we incur the related liabilities or when other
triggering events occur. After the appropriate level of management having the authority approves
the detailed cost reduction or restructuring plan, we establish accruals for underlying activities
by estimating employee termination costs. Our estimates are based upon factors including affected
employees’ length of service, any statutory requirements, contract provisions, salary level, and
health care benefit choices. As part of our assessment of exit and disposal activities, we also
analyze the carrying value of any affected long-lived assets for impairment and reductions in the
estimated useful lives.
Use of estimates
The preparation of financial statements in conformity with accounting principles generally accepted
in the United States of America requires management to make estimates and assumptions. These
estimates and assumptions affect the reported amounts of assets and liabilities and disclosure of
contingent assets and liabilities at the date of the reported financial statements and the reported
amounts of revenues and expenses during the reporting periods. Examples include the allowance for
doubtful accounts, estimates of contingent liabilities, inventory valuation, pension plan
assumptions, estimates and assumptions relating to stock-based compensation costs, and the
assessment of the valuation of deferred income taxes and income tax reserves. Actual results could
differ from those estimates.
Earnings per share
Both Common Shares and Class B Common Shares are included in calculating earnings per share. The
weighted average number of shares outstanding used in the calculation is set forth below:
| |
|
|
|
|
|
|
|
|
|
|
|
|
| |
|
2010 |
|
|
2009 |
|
|
2008 |
|
Net income (loss) in thousands |
|
$ |
24,878 |
|
|
$ |
(50,504 |
) |
|
$ |
(2,593 |
) |
Weighted average shares outstanding |
|
|
15,762,760 |
|
|
|
15,648,258 |
|
|
|
15,853,938 |
|
Assumed exercise of stock options, weighted average of incremental shares |
|
|
465,116 |
|
|
|
— |
|
|
|
— |
|
|
|
|
|
|
|
|
|
|
|
Diluted shares — adjusted weighted-average shares and assumed conversions |
|
|
16,227,876 |
|
|
|
15,648,258 |
|
|
|
15,853,938 |
|
|
|
|
|
|
|
|
|
|
|
Basic earnings (loss) per share |
|
$ |
1.58 |
|
|
$ |
(3.23 |
) |
|
$ |
(0.16 |
) |
Diluted earnings (loss) per share |
|
$ |
1.53 |
|
|
$ |
(3.23 |
) |
|
$ |
(0.16 |
) |
Due to the net losses in fiscal 2009 and 2008, 17,855 and 187,252 shares, respectively, were
excluded from the dilutive calculation for the exercise of stock options, the issuance of
stock-based awards and purchase of stock under the stock purchase plan.
32
Stock-based compensation
As of September 30, 2010, the Company had established a number of stock-based incentive programs as
discussed in more detail in Note I. The provisions of U.S. GAAP require that all stock-based
compensation be recognized as an expense in the financial statements and that such cost be measured
at the fair value of the award. U.S. GAAP also requires that excess tax benefits related to stock
option exercises be reflected as financing cash inflows instead of operating cash inflows. In
calculating diluted earnings per share, we have elected to use the actual method for calculating
windfall tax benefits or shortfalls for fully and partially vested options
in arriving at the assumed proceeds in the treasury stock calculation. We used the adoption
transition guidance in determining the pool of windfall tax benefits upon adoption.
Derivatives and Hedging Activities
In accordance with U.S. GAAP, all of the Company’s derivative instruments are recognized on the
balance sheet at their fair value. The Company currently utilizes foreign exchange forward
contracts or option contracts to sell foreign currencies to fix the exchange rates related to
near-term sales and effectively fix the Company’s margins. Underlying hedged transactions are
recorded at hedged rates, therefore realized and unrealized gains and losses are recorded when the
hedged transactions occur.
On the date the derivative contract is entered into, the Company designates its derivative as
either a hedge of the fair value of a recognized asset or liability (“fair value” hedge), as a
hedge of the variability of cash flows to be received (“cash flow” hedge), or as a foreign-currency
cash flow hedge (“foreign currency” hedge). Changes in the fair value of a derivative that is
highly effective as, and that is designated and qualifies as, a fair value hedge, along with the
gain or loss on the hedged asset or liability that is attributable to the hedged risk are recorded
in current period earnings. Changes in the fair value of a derivative that is highly effective and
that is designed and qualifies as a cash flow hedge are recorded in other comprehensive income
until earnings are affected by the transaction in the underlying asset. Changes in the fair value
of derivatives that are highly effective and that qualify as foreign currency hedges are recorded
in either current period income or other comprehensive income, depending on whether the hedge
transaction is a fair value hedge or a cash flow hedge. We determine fair value based upon Level 2
inputs as defined under U.S. GAAP. At September 30, 2010, the foreign exchange forward contracts
were designated as foreign currency hedges.
The Company documents all relationships between hedging instruments and hedged items, as well as
its risk-management objective and strategy for undertaking various hedge transactions. The Company
also assesses whether the derivatives that are used in hedging transactions are highly effective in
offsetting changes in cash flows of hedged items. If it is determined that a derivative is not
highly effective as a hedge, the Company discontinues hedge accounting prospectively. Cash flows
resulting from hedging transactions are classified in the consolidated statements of cash flows in
the same category as the cash flows from the item being hedged.
Recently Adopted Accounting Pronouncements
In February 2007, the FASB issued guidance which allows companies to choose, at specified election
dates, to measure eligible financial assets and liabilities at fair value that are not otherwise
required to be measured at fair value. Unrealized gains and losses shall be reported on items for
which the fair value option has been elected in earnings at each subsequent reporting date. The
guidance was effective for fiscal years beginning after November 15, 2007. The Company adopted the
guidance effective October 1, 2008, and the adoption did not have a material impact on its
Consolidated Financial Statements.
In March 2008, the FASB issued updates to guidance, amending and expanding the disclosure
requirements related to the use of derivative instruments and hedging activities to provide
improved transparency into the uses and financial statement impact of derivative instruments and
hedging activities. The new disclosure provisions were adopted by the Company in the second quarter
of fiscal 2009. See Note F for the required disclosures related to derivative instruments and
hedging activities.
In April 2009, the FASB issued authoritative guidance for disclosures about derivative instruments
and hedging activities. The guidance is intended to improve financial reporting about derivative
instruments and hedging activities by requiring enhanced disclosures to enable investors to better
understand their effects on an entity’s results of operations. The Company adopted the guidance in
the third quarter of fiscal 2009. Adoption did not have an effect on its consolidated results of
operations, financial position or cash flows.
In June 2009, the Financial Accounting Standards Board (“FASB”) issued the Accounting Standards
Codification (“ASC”) to serve as the single source of authoritative U.S. GAAP. The ASC supersedes
all the existing non-SEC accounting and reporting standards upon its effective date and,
subsequently, the FASB will not issue new standards in the form of Statements, Staff Positions, or
Emerging Issues Task Force Abstracts. The guidance is not intended to change or alter existing U.S.
GAAP. The guidance became effective for the Company in the fourth quarter of fiscal 2009. Adoption
did not have an impact on its consolidated results of operations, financial position or cash flows.
33
In May 2009, the FASB issued authoritative guidance which establishes general standards for
accounting and disclosure of events occurring subsequent to the balance sheet date but prior to
issuance of the financial statements. The guidance is not intended to result in significant change
to current practice. The Company adopted the guidance in the fourth quarter of fiscal 2009.
Adoption did not have an effect on its consolidated results of operations, financial position or
cash flows.
In September 2006, the FASB issued guidance that requires that employers recognize the funded
status of defined benefit pension and other postretirement benefit plans as a net asset or
liability on the balance sheet and recognize as a component of other comprehensive income, net of
tax, the gains or losses and prior service costs or credits that arise during the period but are
not recognized as a component of net periodic benefit cost. Companies are required to measure plan
assets and benefit obligations as of their fiscal year end. The Company adopted the presentation
requirements of the guidance in fiscal 2007, which resulted in a net charge to other comprehensive
income of $1,975. We adopted the measurement date provisions in fiscal 2009, and as a result,
recorded a charge of $105 to retained earnings. See Note H for additional information related to
the change in measurement date provisions.
In September 2006, the FASB issued authoritative guidance which established a framework for
measuring fair value in generally accepted accounting principles, and expanded disclosures about
fair value measurements. The guidance is applicable to other accounting pronouncements that require
or permit fair value measurements. Accordingly, the guidance did not require any new fair value
measurements. However, for some entities, the application changed current practice. The guidance
became effective for financial statements issued for fiscal years beginning after November 15,
2007, and interim periods within those fiscal years. However, the FASB provided a one-year deferral
for the implementation for nonfinancial assets and liabilities. The Company adopted the guidance
effective October 1, 2008, except with respect to nonfinancial assets and liabilities, and the
adoption did not have a material impact on its Consolidated Financial Statements. The Company
adopted the guidance related to nonfinancial assets and liabilities effective October 1, 2009,
which resulted in expanded disclosures in its consolidated financial statements. In January 2010,
the FASB issued updates to the guidance that is intended to improve disclosures about fair value
measurements. The Company adopted the guidance effective January 1, 2010. Adoption did not have a
material impact on its consolidated financial statements.
In December 2008, the FASB issued updates to the guidance which is intended to enhance disclosures
regarding assets in defined benefit pension or other postretirement plans. The updates are
effective for the Company in the fourth quarter of fiscal 2010. The Company adopted the guidance
effective July 1, 2010. Adoption did not have a material impact on its Consolidated Financial
Statements.
Recently Issued Accounting Pronouncements
In June 2009, the FASB issued updates to guidance that address accounting for variable interest
entities. These updates to ASC 810 are effective for the Company in the first quarter of fiscal
2011. The Company is currently assessing the impact that adoption will have on its consolidated
results of operations, financial position, or cash flows.
In October 2009, the FASB issued ASU 2009-13, updates to address revenue recognition for
multiple-deliverable revenue arrangements that include software elements. The new guidance is
effective for the Company in fiscal 2011. The Company is currently assessing the impact that
adoption will have on its consolidated results of operations, financial position, or cash flows.
In April 2010, the FASB issued ASU 2010-17, updates to address revenue recognition for arrangements
in which a vendor satisfies its performance obligations over time, with all or a portion of the
consideration contingent on future events, referred to as “milestones.” The new guidance is
effective for the Company in fiscal 2011. The Company is currently assessing the impact that
adoption will have on its consolidated results of operations, financial position, or cash flows.
In July 2010, the FASB issued ASU 2010-20, updates to guidance that address disclosures about the
credit quality of financing receivables and the allowance for credit losses. The new guidance
amends ASC Topic 310 and is effective for the Company in the first quarter of fiscal 2011. The
Company is currently assessing the impact that adoption will have on its consolidated results of
operations, financial position, or cash flows.
Note B — Product Warranties
Generally, the Company’s products are covered under a one-year warranty; however, certain products
are covered under a two or three-year warranty. It is the Company’s policy to accrue for all
product warranties based upon historical in-warranty repair data. In addition, the Company accrues
for specifically identified product performance issues. The Company also offers extended warranties
for certain of its products for which revenue is recognized over the life of the contract period.
The costs associated with servicing the extended warranties are expensed as incurred. The revenue
from the extended warranties, as well as the related costs, are immaterial for fiscal years 2010,
2009 and 2008.
34
A reconciliation of the estimated changes in the aggregated product warranty liability for fiscal
year 2010 and 2009 is as follows:
| |
|
|
|
|
|
|
|
|
| |
|
2010 |
|
|
2009 |
|
Beginning balance |
|
$ |
466 |
|
|
$ |
701 |
|
Accruals for warranties issued during the period |
|
|
1,063 |
|
|
|
984 |
|
Accruals related to pre-existing warranties (including changes in estimates and expiring warranties) |
|
|
(149 |
) |
|
|
(116 |
) |
Settlements made (in cash or in kind) during the period |
|
|
(765 |
) |
|
|
(1,103 |
) |
|
|
|
|
|
|
|
Ending balance |
|
$ |
615 |
|
|
$ |
466 |
|
|
|
|
|
|
|
|
Note C — Repurchase of Common Shares
In February 2007, the Company announced its Board of Directors had approved an open market stock
repurchase program (the “2007 Program”). Under the terms of the 2007 Program, the Company was
authorized to purchase over a two year period ending February 28, 2009 up to 2,000,000 Common
Shares, which represented approximately 12 percent of its total outstanding Common Shares at the
time the 2007 Program was approved. A total of 942,600 shares at an average price of $8.97 per
share including commissions were repurchased through the life of the 2007 Program. The purpose of
the 2007 Program was to offset the dilutive effect of the employee stock option and stock purchase
plans and to provide value to shareholders. Common Shares held in treasury may be reissued in
settlement of stock purchases under the employee stock option and stock purchase plans. The Company
did not replace the 2007 Program upon its expiration.
The following table summarizes the Company’s stock repurchase activity:
| |
|
|
| |
|
Fiscal Year 2009 |
Total number of shares purchased |
|
155,000 |
Average price paid per share (including commissions) |
|
$4.80 |
Identity of broker-dealer used to effect the purchases |
|
National Financial Securities LLC |
Number of shares purchased as part of a publicly announced repurchase program |
|
155,000 |
Maximum number of shares that remain to be purchased under the program |
|
0 |
Additional shares were purchased for withholding of payroll taxes relating to vested equity awards.
Under the Company’s 2002 Stock Incentive Plan, we repurchased 2,649 Common Shares during fiscal
2010 for $12 for withholding of payroll taxes relating to vested restricted share awards in 2009,
representing an average cost of $4.67 each (there were no associated commissions). During fiscal
year 2009, the Company purchased 11,733 Common Shares for $42 at an average cost of $3.62 per share
for withholding of payroll taxes upon the issuance of Common Shares for vested performance award
units in November 2008.
At September 30, 2010 and 2009, 1,380,297 and 1,377,648 Common Shares purchased under the Company’s
share repurchase programs remained in treasury at an average cost, including commissions, of $9.93
and $9.94, respectively.
Also, included in the “Common shares held in treasury, at cost” caption of the Company’s
Consolidated Balance Sheets are shares repurchased to settle non-employee Directors’ fees deferred
pursuant to the Keithley Instruments, Inc. 1996 Outside Directors Deferred Stock Plan. Shares held
in treasury pursuant to this plan totaled 243,160 and 220,392 at September 30, 2010 and 2009,
respectively.
Note D — Investments and Notes Receivable
The Company classifies its investments in certificates of deposits as “trading”, which requires they be recorded at fair market value in the Company’s
Consolidated Balance Sheets with the changes in fair value and resulting gains and losses included
in the Company’s Consolidated Statements of Operations. There were no realized gains or losses on
sales of marketable securities in fiscal years 2010, 2009 or 2008. U.S GAAP defines fair value as
the price that would be received upon sale of an asset or paid upon transfer of a liability in an
orderly transaction between market participants at the measurement date and in the principal or
most advantageous market for that asset or liability. We determined the fair market value of the
trading investments at September 30, 2010 and 2009 using quoted prices for similar assets, which is
a Level 2 hierarchy fair value measurement. All trading investments have maturity dates of one year
or less.
35
Trading investments at September 30, 2010 were comprised of the following:
| |
|
|
|
|
|
|
|
|
|
|
|
|
|
|
|
|
| |
|
Adjusted cost |
|
|
Unrealized gains |
|
|
Unrealized losses |
|
|
Market value |
|
Short Term: |
|
|
|
|
|
|
|
|
|
|
|
|
|
|
|
|
Certificates of deposits |
|
$ |
3,912 |
|
|
$ |
— |
|
|
$ |
— |
|
|
$ |
3,912 |
|
Trading investments at September 30, 2009 were comprised of the following:
| |
|
|
|
|
|
|
|
|
|
|
|
|
|
|
|
|
| |
|
Adjusted cost |
|
|
Unrealized gains |
|
|
Unrealized losses |
|
|
Market value |
|
Short Term: |
|
|
|
|
|
|
|
|
|
|
|
|
|
|
|
|
Certificates of deposits |
|
$ |
759 |
|
|
$ |
— |
|
|
$ |
— |
|
|
$ |
759 |
|
The caption, “Other assets,” on the Company’s Consolidated Balance Sheets includes the following
long-term investments carried using the cost method at September 30, 2010 and 2009:
| |
|
|
|
|
|
|
|
|
| |
|
2010 |
|
|
2009 |
|
Non-marketable equity securities |
|
$ |
150 |
|
|
$ |
150 |
|
Venture capital fund |
|
|
32 |
|
|
|
32 |
|
Notes receivable, net of reserve of $1,711 and $1,500 at September 30, 2010 and 2009 |
|
|
1,753 |
|
|
|
1,753 |
|
|
|
|
|
|
|
|
|
|
$ |
1,935 |
|
|
$ |
1,935 |
|
|
|
|
|
|
|
|
Notes receivable at September 30, 2010 and 2009 include a note with a principal balance of $2,750
plus accrued interest of $714 which was accrued at a rate of 8.65% compounded annually. This note,
including interest, becomes payable on demand on or after September 21, 2016. We agreed to suspend
interest accumulation during fiscal 2009, and effective October 1, 2009, the note again began
accruing interest at an annual rate of 6.5%. As the Company believes that it is probable that it
will be unable to collect all amounts due according to the contractual terms of the loan agreement,
a $1,500 valuation allowance has been recorded against this note receivable in fiscal year 2008
with an additional $211 valuation allowance recorded in fiscal 2010 for the interest accrued. The
fair market value was determined by examining the collateral value of the assets pledged by the
grantor on the balance sheet dates based upon financial information provided by the grantor.
The Company reviews its long-term investments for other-than-temporary impairment whenever the fair
value of an investment is less than amortized cost and evidence indicates that an investment’s
carrying value is not recoverable within a reasonable period of time. In the evaluation of whether
an impairment is other-than-temporary, the Company considers its ability and intent to hold the
investment until the market price recovers, the reasons for the impairment, compliance with the
Company’s investment policy, the severity and duration of the impairment and expected future
performance. Based on this evaluation, the Company recorded no impairment losses during fiscal
years 2010 and 2009.
Note E — Financing Arrangements
Effective March 31, 2010, the Company amended its $5,000 credit agreement. The revised agreement
consisted of a $5,000 facility ($537 of standby letters of credit outstanding at September 30, 2010)
that provides unsecured, multi-currency revolving credit at various interest rates based on Prime
or LIBOR. LIBOR was 0.29% and the Prime rate was 3.25% as of September 30, 2010. The agreement
did not contain debt covenants, but required cash to be pledged against outstanding borrowings and
standby letters of credit. The Company was required to pay a facility fee of 0.25% per annum on the
total amount of the commitment. The agreement’s expiration date
was March 31, 2012, however, the agreement was terminated
December 8, 2010. Additionally, per the terms of the agreement, the
Company was able to borrow up to
$5,000 from other lenders. The Company has a number of other such credit facilities in various
currencies and standby letters of credit aggregating $1,734 ($83 outstanding at September 30,
2010). At September 30, 2010, the Company had total unused lines of credit with domestic and
foreign banks aggregating $6,114.
Under the Company’s former facility, there were no borrowings during 2009. Additionally, the
Company had a number of other such credit facilities in various currencies and for standby letters
of credit aggregating $1,585 ($0 outstanding at September 30, 2009). At September 30, 2009, the
Company had total unused lines of credit with domestic and foreign banks aggregating $6,016.
36
Note F — Derivatives and Hedging Activities
In the normal course of business, the Company uses derivative financial instruments to manage
foreign currency exchange rate risk. The Company does not enter into derivative transactions for
trading purposes. The objective of the Company’s hedging strategy is to hedge the foreign currency
risk associated with the anticipated sale of inventory and the settlement of the related
intercompany accounts receivable. The forward contracts are designated as cash flow hedges that
encompass the variability of U.S. dollar cash flows attributable to the settlement of intercompany
foreign currency denominated receivables resulting from the sale of inventory manufactured in the
U.S. to our wholly-owned foreign subsidiaries. The foreign exchange forward contracts generally
have maturities of three months or less. Changes in the fair value of these derivatives are
recorded in the financial statement line item “Accumulated other comprehensive loss” on the
consolidated balance sheets and reclassified into the financial statement line item “Cost of goods
sold” on the consolidated statements of operations in the same period during which the hedged
transaction affects earnings. Cash flows resulting from hedging transactions are classified in the
consolidated statements of cash flows in the same category as the cash flows from the item being
hedged; i.e., in operating activities. In accordance with U.S. GAAP, all of the Company’s
derivative instruments are recognized on the balance sheet at their fair value. At September 30,
2010, the Company had obligations under foreign
exchange forward contracts to sell 1,800,000 Euros, 180,000 British pounds and 195,000,000 Yen at
various dates through December 2010.
At September 30, 2010 and 2009, the fair values of the derivative instruments are recorded on the
consolidated balance sheets as follows:
| |
|
|
|
|
|
|
|
|
| |
|
2010 |
|
|
2009 |
|
Assets: |
|
|
|
|
|
|
|
|
Contract value |
|
$ |
901 |
|
|
$ |
371 |
|
Fair value |
|
|
900 |
|
|
|
360 |
|
|
|
|
|
|
|
|
Total asset |
|
|
1 |
|
|
|
11 |
|
|
|
|
|
|
|
|
Liabilities: |
|
|
|
|
|
|
|
|
Contract value |
|
|
3,969 |
|
|
|
4,350 |
|
Fair value |
|
|
4,177 |
|
|
|
4,531 |
|
|
|
|
|
|
|
|
Total liability |
|
|
(208 |
) |
|
|
(181 |
) |
|
|
|
|
|
|
|
Net liability |
|
$ |
(207 |
) |
|
$ |
(170 |
) |
|
|
|
|
|
|
|
The net liability balances are included in the line item “Other accrued expenses” on the Company’s
Consolidated Balance Sheets. Forward foreign exchange contracts are entered into with substantial
and creditworthy multinational banks. The fair market value was determined by utilizing a valuation
received from the foreign currency trader, which we independently verified, and as such, is
considered to be derived from Level 2 inputs as defined by U.S. GAAP.
At September 30, 2010, the amount related to derivatives designated as cash flow hedges and
recorded in Accumulated other comprehensive loss totaled $108, which is expected to be reclassified
into earnings in the next three months. See Note A for gains and losses recognized in Comprehensive
loss. Set forth below are the amounts and location of losses on derivative instruments and related
hedged items reclassified from Other Comprehensive Loss and included in the Statement of Operations
for the years ended September 30, 2010, 2009 and 2008.
| |
|
|
|
|
|
|
|
|
|
|
|
|
| Financial Statement Line Item |
|
2010 |
|
|
2009 |
|
|
2008 |
|
Cost of goods sold |
|
$ |
6 |
|
|
$ |
245 |
|
|
$ |
314 |
|
The Company documents all relationships between hedging instruments and hedged items, as well as
its risk-management objective and strategy for undertaking various hedge transactions. The Company
also assesses whether the derivatives that are used in hedging transactions are highly effective in
offsetting changes in cash flows of hedged items. At September 30, 2010, the derivatives were
considered highly effective. If it was determined that a derivative was not highly effective as a
hedge, the Company would discontinue hedge accounting prospectively.
Note G — Foreign Currency
The functional currency for the Company’s foreign subsidiaries is the applicable local currency.
Income and expenses are translated into U.S. dollars at average exchange rates for the period.
Assets and liabilities are translated at the rates in effect at the end of the period. Translation
gains and losses are recognized in the Accumulated other comprehensive loss component of
shareholders’ equity.
Certain transactions of the Company and its foreign subsidiaries are denominated in currencies
other than the functional currency. The Consolidated Statements of Operations include (losses) and
gains from such foreign exchange transactions of $(150), $23 and $61 for 2010, 2009 and 2008,
respectively.
37
Note H — Employee Benefit and Incentive Compensation Plans
The Company has a noncontributory defined benefit pension plan covering all of its eligible
employees in the United States and a contributory defined benefit plan covering eligible employees
at its German subsidiary. Pension benefits are based upon the employee’s length of service and a
percentage of compensation. The Company also has government mandated defined benefit retirement
plans for its eligible employees in Japan and Korea; however, these plans are not material to the
Company’s consolidated financial statements.
In September 2006, the FASB issued guidance in ASC 715 (Compensation—Retirement Benefits), which
required companies to measure plan assets and benefit obligations as of their fiscal year end. The
Company adopted the measurement date provisions of ASC 715 in the fourth quarter of fiscal 2009.
Upon adoption of the measurement provisions in fiscal 2009, we recorded a charge to retained
earnings of $105 for the Company’s U.S. pension plans. The measurement date for the Company’s other
defined benefit pension plans was September 30 in prior years, and as such, there was no effect of
the adoption for those plans.
The following table sets forth the funded status of the Company’s significant benefit plans at
September 30, 2010 and 2009:
| |
|
|
|
|
|
|
|
|
|
|
|
|
|
|
|
|
| |
|
United States Plan |
|
|
German Plan* |
|
| |
|
2010 |
|
|
2009 |
|
|
2010 |
|
|
2009 |
|
Change in projected benefit obligations: |
|
|
|
|
|
|
|
|
|
|
|
|
|
|
|
|
Benefit obligation at beginning of year |
|
$ |
44,183 |
|
|
$ |
36,594 |
|
|
$ |
7,520 |
|
|
$ |
7,384 |
|
Service cost |
|
|
1,472 |
|
|
|
1,895 |
|
|
|
170 |
|
|
|
182 |
|
Interest cost |
|
|
2,611 |
|
|
|
3,194 |
|
|
|
444 |
|
|
|
438 |
|
Actuarial loss (gain) |
|
|
4,535 |
|
|
|
5,147 |
|
|
|
2,333 |
|
|
|
(495 |
) |
Benefits paid |
|
|
(1,345 |
) |
|
|
(1,537 |
) |
|
|
(281 |
) |
|
|
(270 |
) |
Curtailments |
|
|
— |
|
|
|
(1,110 |
) |
|
|
— |
|
|
|
— |
|
Foreign currency exchange rate changes |
|
|
— |
|
|
|
— |
|
|
|
(314 |
) |
|
|
281 |
|
|
|
|
|
|
|
|
|
|
|
|
|
|
Benefit obligation at year end |
|
$ |
51,456 |
|
|
$ |
44,183 |
|
|
$ |
9,872 |
|
|
$ |
7,520 |
|
|
|
|
|
|
|
|
|
|
|
|
|
|
Accumulated benefit obligation at year end |
|
$ |
48,805 |
|
|
$ |
41,115 |
|
|
$ |
9,223 |
|
|
$ |
7,000 |
|
|
|
|
|
|
|
|
|
|
|
|
|
|
Change in plan assets: |
|
|
|
|
|
|
|
|
|
|
|
|
|
|
|
|
Fair value of plan assets at beginning of year |
|
$ |
37,230 |
|
|
$ |
44,549 |
|
|
$ |
1,628 |
|
|
$ |
1,493 |
|
Actual return (loss) on pension assets |
|
|
4,150 |
|
|
|
(6,532 |
) |
|
|
(125 |
) |
|
|
100 |
|
Employer contributions |
|
|
2,000 |
|
|
|
750 |
|
|
|
63 |
|
|
|
67 |
|
Participants’ contributions |
|
|
— |
|
|
|
— |
|
|
|
— |
|
|
|
— |
|
Benefits paid |
|
|
(1,345 |
) |
|
|
(1,537 |
) |
|
|
(49 |
) |
|
|
(42 |
) |
Foreign currency exchange rate changes |
|
|
— |
|
|
|
— |
|
|
|
(85 |
) |
|
|
10 |
|
|
|
|
|
|
|
|
|
|
|
|
|
|
Fair value of plan assets at end of year |
|
|
42,035 |
|
|
|
37,230 |
|
|
|
1,432 |
|
|
|
1,628 |
|
|
|
|
|
|
|
|
|
|
|
|
|
|
Pension liability recognized |
|
$ |
(9,421 |
) |
|
$ |
(6,953 |
) |
|
$ |
(8,440 |
) |
|
$ |
(5,892 |
) |
|
|
|
|
|
|
|
|
|
|
|
|
|
|
|
|
| * |
|
The Company has purchased indirect insurance which is expected to be available to the Company
as German pension liabilities mature. The caption, “Other assets,” on the Company’s
Consolidated Balance Sheets includes $6,215 and $6,607 at September 30, 2010 and 2009,
respectively, for this asset. In accordance with U.S. GAAP, this Company asset is not included
in the German plan assets. |
The amounts recognized in the Consolidated Balance Sheets shown above for the United States Plan
and German Plan are included in the caption “Other long-term liabilities” as of September 30, 2010
and 2009.
As of September 30, 2010 and 2009, accumulated other comprehensive loss before tax was comprised of
the following:
| |
|
|
|
|
|
|
|
|
|
|
|
|
|
|
|
|
| |
|
United States Plan |
|
|
German Plan |
|
| |
|
2010 |
|
|
2009 |
|
|
2010 |
|
|
2009 |
|
Unrecognized actuarial (loss) gain |
|
$ |
(23,520 |
) |
|
$ |
(19,834 |
) |
|
$ |
(1,684 |
) |
|
$ |
978 |
|
Unrecognized prior service cost |
|
|
(159 |
) |
|
|
(189 |
) |
|
|
(11 |
) |
|
|
(17 |
) |
|
|
|
|
|
|
|
|
|
|
|
|
|
Accumulated other comprehensive (loss) income |
|
$ |
(23,679 |
) |
|
$ |
(20,023 |
) |
|
$ |
(1,695 |
) |
|
$ |
961 |
|
|
|
|
|
|
|
|
|
|
|
|
|
|
38
Activity and balances in accumulated other comprehensive loss before tax related to defined benefit
pension plans are summarized below:
| |
|
|
|
|
|
|
|
|
|
|
|
|
|
|
|
|
| |
|
United States Plan |
|
|
German Plan |
|
| |
|
2010 |
|
|
2009 |
|
|
2010 |
|
|
2009 |
|
Balance at beginning of year |
|
$ |
(20,023 |
) |
|
$ |
(4,914 |
) |
|
$ |
961 |
|
|
$ |
435 |
|
Net actuarial (loss) gain arising during the year |
|
|
(4,084 |
) |
|
|
(15,310 |
) |
|
|
(2,534 |
) |
|
|
467 |
|
Amortization of actuarial net loss |
|
|
398 |
|
|
|
55 |
|
|
|
— |
|
|
|
— |
|
Amortization of prior service cost |
|
|
30 |
|
|
|
101 |
|
|
|
5 |
|
|
|
5 |
|
Adjustment to apply new measurement provision guidance
(as of October 1, 2008) |
|
|
— |
|
|
|
45 |
|
|
|
— |
|
|
|
— |
|
Exchange rate effects |
|
|
— |
|
|
|
— |
|
|
|
(127 |
) |
|
|
54 |
|
|
|
|
|
|
|
|
|
|
|
|
|
|
Balance at end of year |
|
$ |
(23,679 |
) |
|
$ |
(20,023 |
) |
|
$ |
(1,695 |
) |
|
$ |
961 |
|
|
|
|
|
|
|
|
|
|
|
|
|
|
Estimated prior service costs of $30 for the United States Plan and $5 for the German plan will be
amortized from accumulated other comprehensive loss into net period benefit cost in fiscal 2011.
Additionally, $859 of unrecognized actuarial losses in the United States plan will also be
amortized into net periodic benefit cost in fiscal 2011.
A summary of the components of net periodic pension cost based on the respective measurement dates
for the United States and German plans is shown below:
| |
|
|
|
|
|
|
|
|
|
|
|
|
|
|
|
|
| |
|
United States Plan |
|
|
German Plan |
|
| |
|
2010 |
|
|
2009 |
|
|
2010 |
|
|
2009 |
|
Service cost-benefits earned during the year |
|
$ |
1,472 |
|
|
$ |
1,505 |
|
|
$ |
213 |
|
|
$ |
170 |
|
Interest cost on projected benefit obligation |
|
|
2,611 |
|
|
|
2,565 |
|
|
|
427 |
|
|
|
444 |
|
Expected return on plan assets |
|
|
(3,699 |
) |
|
|
(3,780 |
) |
|
|
(63 |
) |
|
|
(76 |
) |
Curtailment loss |
|
|
— |
|
|
|
44 |
|
|
|
— |
|
|
|
— |
|
Amortization of transition asset |
|
|
— |
|
|
|
— |
|
|
|
55 |
|
|
|
(16 |
) |
Amortization of prior service cost |
|
|
30 |
|
|
|
57 |
|
|
|
5 |
|
|
|
5 |
|
Amortization of actuarial net loss |
|
|
398 |
|
|
|
55 |
|
|
|
— |
|
|
|
— |
|
|
|
|
|
|
|
|
|
|
|
|
|
|
Net periodic pension cost |
|
$ |
812 |
|
|
$ |
446 |
|
|
$ |
637 |
|
|
$ |
527 |
|
|
|
|
|
|
|
|
|
|
|
|
|
|
As of the measurement dates, the asset allocation for the United States plan by category was as
follows:
| |
|
|
|
|
|
|
|
|
| |
|
September 30, 2010 |
|
|
September 30, 2009 |
|
Equity securities |
|
|
61 |
% |
|
|
63 |
% |
Fixed income |
|
|
20 |
|
|
|
17 |
|
Market neutral hedge fund |
|
|
13 |
|
|
|
14 |
|
Cash equivalent (money market fund) |
|
|
4 |
|
|
|
4 |
|
Real estate |
|
|
2 |
|
|
|
2 |
|
|
|
|
|
|
|
|
|
|
|
100 |
% |
|
|
100 |
% |
|
|
|
|
|
|
|
The United States plan investment strategy is to emphasize total return, which is defined as the
aggregate return from capital appreciation, dividends, and interest income. In determining the
asset classes in which this plan will invest, as well as the target weightings for each asset
class, the Company gives consideration to several factors. These include historical risk and return
statistics for each asset class and the statistical relationships between the asset classes. The
Company also has recognized certain aspects specific to this plan, including, but not limited to,
the current funding status, the average age of employee participants, and the ability of the
Company to make future contributions.
German plan assets represent employee and Company contributions and are invested by an insurance
company in a direct insurance contract payable to the individual participants. The insurance
company directs the investments for this contract.
39
The significant actuarial assumptions used to determine benefit obligations at September 30, 2010
and 2009 were as follows:
| |
|
|
|
|
| |
|
2010 |
|
2009 |
United States Pension Plan: |
|
|
|
|
Discount rate |
|
5.375% |
|
6.0% |
Rate of increase in compensation levels |
|
0.0% for one year, and 3.0% thereafter |
|
0.0% for two years, and 3.5% thereafter |
German Pension Plan: |
|
|
|
|
Discount rate |
|
4.5% |
|
6.5% |
Rate of increase in compensation levels |
|
2.5% |
|
2.5% |
The significant actuarial assumptions used to determine net pension expense for fiscal years 2010,
2009 and 2008 were as follows:
| |
|
|
|
|
|
|
| |
|
2010 |
|
2009 |
|
2008 |
United States Pension Plan: |
|
|
|
|
|
|
Discount rate |
|
6.0% |
|
7.0%/ 6.875% |
|
6.375% |
Expected long-term rate of return on plan assets |
|
8.0% |
|
8.00% |
|
8.25% |
Rate of increase in compensation levels |
|
0.0% for FY 2009 and FY
2010, and 3.5% thereafter |
|
4.0% |
|
4.0% |
German Pension Plan: |
|
|
|
|
|
|
Discount rate |
|
6.5% |
|
6.25% |
|
5.5% |
Expected long-term rate of return on plan assets |
|
5.0% |
|
5.0% |
|
5.0% |
Rate of increase in compensation levels |
|
2.5% |
|
2.5% |
|
2.5% |
We used two discount rates in determining the fiscal 2009 U.S. plan’s net pension expense due to
the remeasurement that occurred as of February 28, 2009 in connection with a curtailment event. For
fiscal 2009 expense recognized until February 28, 2009, a discount rate of 7.0% was used. Following
that date, net pension expense was determined using a discount rate of 6.875%. The reduction in the
discount rate reflects interest rate declines driven by the disruption experienced in the credit
markets from October 2008 through February 2009.
In determining its expected long-term rate-of-return-on-assets assumption for the fiscal year
ending September 30, 2010, the Company considered historical experience, its asset allocation,
expected future long-term rates of return for each major asset class, an assumed long-term
inflation rate, and an asset performance simulator.
Expected future benefit payments for both the United States and the German plans are as follows:
| |
|
|
|
|
|
|
|
|
| |
|
United States Plan |
|
|
German Plan |
|
2011 |
|
$ |
1,476 |
|
|
$ |
310 |
|
2012 |
|
$ |
1,661 |
|
|
$ |
340 |
|
2013 |
|
$ |
1,759 |
|
|
$ |
360 |
|
2014 |
|
$ |
1,859 |
|
|
$ |
390 |
|
2015 |
|
$ |
2,104 |
|
|
$ |
417 |
|
2016 – 2020 |
|
$ |
13,263 |
|
|
$ |
2,701 |
|
The Company contributed $2,000 to its pension plans in October 2010 for fiscal year 2011. No
further contributions are anticipated.
In addition to the defined benefit pension plans, the Company also maintains a retirement plan for
all of its eligible employees in the United States under Section 401(k) of the Internal Revenue
Code. The Company’s practice is to match a minimum of 25 percent of the first six percent of
a participants’ contribution, with a maximum match up to 50 percent of the first six percent of a
participants contribution depending upon the Company’s financial performance, as part of its profit
sharing program. The Company suspended matching contributions for calendar 2009 as part of its
cost reduction efforts, but reinstated then effective January 1, 2010.
Expense for the 401(k) plan amounted to $461, $115 and $498 in 2010, 2009 and 2008, respectively.
In addition to the extra 25 percent match in the 401(k) plan, the Company may contribute additional
profit sharing to all eligible worldwide employees. U.S. employee participants, at their
discretion, may opt for a cash payout or may defer the bonus into the 401(k) plan. Non-U.S.
employees receive a cash payout. The Company recorded $800 of expense in 2010 related to the
additional profit sharing program. There was no expense related to the additional profit sharing
program recorded in fiscal 2009.
40
The fair values of our pension plan assets at September 30, 2010, by asset category are as follows:
| |
|
|
|
|
|
|
|
|
|
|
|
|
|
|
|
|
| |
|
Fair Value Measurements at September 30, 2010 |
|
| |
|
U.S. Pension Assets |
|
| |
|
Total |
|
|
Level 1 |
|
|
Level 2 |
|
|
Level 3 |
|
Cash and Short Term Securities |
|
|
2,250 |
|
|
|
2,250 |
|
|
|
— |
|
|
|
— |
|
Equity Securities |
|
|
|
|
|
|
|
|
|
|
|
|
|
|
|
|
Common and Preferred Stock: |
|
|
|
|
|
|
|
|
|
|
|
|
|
|
|
|
U.S. Companies |
|
|
10,099 |
|
|
|
10,099 |
|
|
|
— |
|
|
|
— |
|
Non U.S. Companies |
|
|
5,787 |
|
|
|
5,787 |
|
|
|
— |
|
|
|
— |
|
Mutual Funds |
|
|
7,569 |
|
|
|
— |
|
|
|
7,569 |
|
|
|
|
|
Debt Securities |
|
|
|
|
|
|
|
|
|
|
|
|
|
|
|
|
Mutual Funds |
|
|
6,973 |
|
|
|
— |
|
|
|
6,973 |
|
|
|
— |
|
Real Estate |
|
|
|
|
|
|
|
|
|
|
|
|
|
|
|
|
Mutual Funds |
|
|
779 |
|
|
|
— |
|
|
|
779 |
|
|
|
— |
|
Other Investments |
|
|
|
|
|
|
|
|
|
|
|
|
|
|
|
|
Limited Partnerships |
|
|
8,578 |
|
|
|
— |
|
|
|
— |
|
|
|
8,578 |
|
|
|
|
|
|
|
|
|
|
|
|
|
|
Total Plan Assets |
|
|
42,035 |
|
|
|
18,136 |
|
|
|
15,321 |
|
|
|
8,578 |
|
|
|
|
|
|
|
|
|
|
|
|
|
|
The classification of fair value measurements within the hierarchy is based upon the lowest level
of input that is significant to the measurement. Valuation methodologies used for assets and
liabilities measured at fair value are as follows:
Cash and Short Term Securities are valued at the closing price on the active market based on
exchange rate to United States dollar.
Common and Preferred Stock are valued at the closing price reported on the active market on which
the individual securities are traded. Mutual funds are valued at the net asset value of shares held
at year end, as determined by the closing price reported on the active market on which the
individual securities are traded, or pricing vendor or fund family if an active market is not
available.
Debt Securities Mutual Funds are valued at the net asset value of shares held at year end, as
determined by the closing price reported on the active market on which the individual securities
are traded, or pricing vendor or fund family if an active market is not available.
Real Estate Mutual Funds include real estate investment trusts, which are valued at the closing
price reported on the active market on which the individual securities are traded, and
participation in real estate funds, which are valued at net asset value as determined by the fund
manager.
Other Investments are investments in limited partnerships. Limited partnership funds are priced
based on valuations using the partnership’s available financial statements coinciding with the
Company’s year-end.
The methods described above may produce a fair value calculation that may not be indicative of net
realizable value or reflective of future fair values. Furthermore, while the Company believes its
valuation methods are appropriate and consistent with other market participants, the use of
different methodologies or assumptions to determine the fair value of certain financial instruments
could result in a different fair value measurement at the reporting date.
The following table sets forth a summary of changes in fair value of the pension plan investments
classified as Level 3 for the year ended September 30, 2010:
| |
|
|
|
|
| |
|
Other Investments |
|
| |
|
Limited Partnerships |
|
Beginning balance |
|
|
6,839 |
|
Realized gains |
|
|
170 |
|
Unrealized gains relating to instruments
still held at reporting date |
|
|
432 |
|
Purchases, sales, issuances and settlements (net) |
|
|
1,247 |
|
Transfers out of Level 3 assets |
|
|
(110 |
) |
|
|
|
|
Ending balance |
|
|
8,578 |
|
|
|
|
|
41
Annual Incentive Compensation Plan
The objective of the Company’s Annual Incentive Compensation Plan (the “Incentive Plan”) is to
provide an opportunity to those employees whose performance has a significant impact on the
Company’s short-term and long-term profitability to earn annual incentive compensation based on
such profitability. The Human Resources and Compensation Committee (“the Committee”) of the
Company’s Board of Directors administers the Incentive Plan, designates participants in the
Incentive Plan and reviews and approves the annual performance criteria. The Committee has the
authority to amend, modify, or discontinue the Incentive Plan.
A target incentive award for each participant is established at the beginning of each award term,
which coincides with the Company’s fiscal year of October 1 through September 30. Individual target
incentive compensation may not exceed two times the target incentive award. For fiscal year 2010,
the Committee established an Incentive Plan that would pay out only after company-wide salaries and
the 401(k) plan match were reinstated to levels in place immediately prior to January 1, 2009.
Salaries and the 401(k) plan match were restored effective January 1, 2010. Under the Incentive
Plan, the performance target above which compensation would be paid was earnings before income
taxes of at least five percent of net sales. The Company’s fiscal 2010 performance resulted in
earnings before income taxes of 20 percent of net sales. Accordingly, the Company recorded bonus
expense and corresponding accrual of $4,295, the maximum allowed under the Incentive Plan. The
incentive awards were paid in November 2010. As the Incentive Plan was cancelled in 2009 and the
Company did not meet the performance targets in fiscal 2008, no payments were made under the plan
for these years.
Note I — Stock Plans
In December 2008, the Company’s Board of Directors approved the Keithley Instruments, Inc. 2009
Stock Incentive Plan (the “2009 Stock Plan”), which was approved by the Company’s shareholders at
its annual meeting held on February 7, 2009. Under the terms of this plan, 1,000,000 Common Shares
were reserved for the granting of equity-based awards to directors, officers and other key
employees. The 2009 Stock Plan expires on February 6, 2019. No awards have been granted from the
2009 Stock Plan since its inception through September 30, 2010.
The Company’s 2002 Stock Incentive Plan (the “2002 Stock Plan”) is also currently active. Under the
terms of the 2002 Stock Plan, 3,000,000 Common Shares were reserved for the granting of
equity-based awards to directors, officers and other key employees. This plan expires on February
16, 2012. The Company has two other equity-based compensation plans under which options are
currently outstanding; however, no new award may be granted under the two other plans as they have
been terminated or have expired.
All options outstanding at the time of termination of all four plans shall continue in full force
and effect in accordance with their terms. The Compensation and Human Resources Committee of the
Board of Directors administers the plans. The option price under nonqualified stock options is
determined by the Committee based upon the date the option is granted. In addition to stock
options, the 2002 Stock Plan also provides for restricted share awards, restricted share units,
performance unit awards and stock appreciation rights, as does the 2009 Plan. At September 30,
2010, 320,424 shares were registered and available for the granting of equity-based awards to
directors, officers and other key employees in the 2002 Stock Plan.
Stock-based compensation expense is attributable to the granting of stock options, performance
share units, restricted share units and restricted share awards. The Company records the expense on
a straight-line basis over the requisite service period of the respective grants. The amount
recorded during fiscal 2010 represents net compensation expense, and includes approximately $1,099
for performance award units granted in 2008 that vested at 100 percent of target for the first
specified group and 125 percent of target for a second specified group, based on each group’s
defined performance targets. The amount recorded in 2009, represents net compensation income and
includes favorable adjustments of approximately $950 for performance award units granted in fiscal
years 2007 and 2008 which either did not vest or were not expected to vest as the performance
targets were not met or were not expected to be met. During fiscal years 2010, 2009 and 2008, the
Company recorded stock-based compensation expense (income) as follows:
| |
|
|
|
|
|
|
|
|
|
|
|
|
| |
|
2010 |
|
|
2009 |
|
|
2008 |
|
Cost of goods sold |
|
$ |
158 |
|
|
$ |
(59 |
) |
|
$ |
152 |
|
Selling, general and administrative expenses |
|
|
1,687 |
|
|
|
127 |
|
|
|
1,412 |
|
Product development expenses |
|
|
247 |
|
|
|
(121 |
) |
|
|
268 |
|
|
|
|
|
|
|
|
|
|
|
Stock-based compensation included in operating expenses |
|
|
2,092 |
|
|
|
(53 |
) |
|
|
1,832 |
|
Estimated tax impact of stock-based compensation |
|
|
— |
|
|
|
— |
|
|
|
598 |
|
|
|
|
|
|
|
|
|
|
|
Stock-based compensation expense (income), net of tax |
|
$ |
2,092 |
|
|
$ |
(53 |
) |
|
$ |
1,234 |
|
|
|
|
|
|
|
|
|
|
|
Stock-based compensation expense per share, net of tax |
|
$ |
0.13 |
|
|
$ |
0.00 |
|
|
$ |
0.08 |
|
|
|
|
|
|
|
|
|
|
|
42
At September 30, 2010 and 2009, the total estimated unrecognized compensation cost related to
unvested stock-based compensation was $1,658 and $948, respectively, and the related
weighted-average period over which it was expected to be recognized is approximately 2.5 years and
2.3 years, respectively.
In accordance with U.S. GAAP, the Company does not record the tax benefits of stock-based
compensation in excess of the book deductions until these benefits are realized using the tax law
ordering rules. The Company recorded to additional paid-in-capital a debit of $28 and credits of
$92 and $140 in fiscal 2010, 2009 and 2008, respectively, in connection with these excess tax
benefits.
Stock Option Activity
A summary of the Company’s stock option programs is as follows:
| |
|
|
|
|
|
|
|
|
|
|
|
|
|
|
|
|
| |
|
|
|
|
|
Weighted |
|
|
Weighted Average |
|
|
|
|
| |
|
Number |
|
|
Average |
|
|
Remaining |
|
|
Aggregate |
|
| |
|
of Shares |
|
|
Exercise Price |
|
|
Contractual Life (Years) |
|
|
Intrinsic Value |
|
Outstanding at September 30, 2007 |
|
|
3,241,580 |
|
|
|
20.31 |
|
|
|
5.04 |
|
|
$ |
945 |
|
Options granted at fair market value |
|
|
146,125 |
|
|
|
9.13 |
|
|
|
|
|
|
|
|
|
Options exercised |
|
|
(74,874 |
) |
|
|
3.57 |
|
|
|
|
|
|
$ |
459 |
|
Options forfeited |
|
|
(32,400 |
) |
|
|
13.14 |
|
|
|
|
|
|
|
|
|
Options expired |
|
|
(253,300 |
) |
|
|
24.58 |
|
|
|
|
|
|
|
|
|
|
|
|
|
|
|
|
|
|
|
|
|
|
Outstanding at September 30, 2008 |
|
|
3,027,131 |
|
|
|
19.90 |
|
|
|
4.43 |
|
|
$ |
276 |
|
Options granted at fair market value |
|
|
309,050 |
|
|
|
3.05 |
|
|
|
|
|
|
|
|
|
Options exercised |
|
|
(35,000 |
) |
|
|
4.13 |
|
|
|
|
|
|
$ |
4 |
|
Options forfeited |
|
|
(55,810 |
) |
|
|
9.37 |
|
|
|
|
|
|
|
|
|
Options expired |
|
|
(310,620 |
) |
|
|
18.02 |
|
|
|
|
|
|
|
|
|
|
|
|
|
|
|
|
|
|
|
|
|
|
Outstanding at September 30, 2009 |
|
|
2,934,751 |
|
|
$ |
18.72 |
|
|
|
4.08 |
|
|
$ |
736 |
|
Options granted at fair market value |
|
|
187,800 |
|
|
|
4.46 |
|
|
|
|
|
|
|
|
|
Options exercised |
|
|
(9,500 |
) |
|
|
16.80 |
|
|
|
|
|
|
$ |
44 |
|
Options forfeited |
|
|
(53,223 |
) |
|
|
4.46 |
|
|
|
|
|
|
|
|
|
Options expired |
|
|
(542,377 |
) |
|
|
34.11 |
|
|
|
|
|
|
|
|
|
|
|
|
|
|
|
|
|
|
|
|
|
|
Outstanding at September 30, 2010 |
|
|
2,517,451 |
|
|
$ |
14.65 |
|
|
|
3.88 |
|
|
$ |
18,466 |
|
|
|
|
|
|
|
|
|
|
|
|
|
|
Vested and expected to vest at September 30, 2010 |
|
|
2,507,494 |
|
|
$ |
17.20 |
|
|
|
3.86 |
|
|
$ |
18,295 |
|
|
|
|
|
|
|
|
|
|
|
|
|
|
Exercisable at September 30, 2010 |
|
|
2,008,225 |
|
|
$ |
17.20 |
|
|
|
2.71 |
|
|
$ |
9,838 |
|
|
|
|
|
|
|
|
|
|
|
|
|
|
The options outstanding at September 30, 2010 have been segregated into ranges for additional
disclosure as follows:
| |
|
|
|
|
|
|
|
|
|
|
|
|
|
|
|
|
|
|
|
|
| Outstanding |
|
|
Exercisable |
|
| |
|
|
|
|
|
Weighted Average |
|
|
|
|
|
|
|
|
| |
|
Number |
|
|
Remaining |
|
|
Weighted |
|
|
Number |
|
|
Weighted |
|
| Range of |
|
of Shares |
|
|
Contractual |
|
|
Average |
|
|
of Shares |
|
|
Average |
|
| Exercise Prices |
|
Outstanding |
|
|
Life (years) |
|
|
Exercise Price |
|
|
Exercisable |
|
|
Exercise Price |
|
$2.99 – $5.48 |
|
|
434,975 |
|
|
|
8.71 |
|
|
$ |
3.59 |
|
|
|
0 |
|
|
$ |
0.00 |
|
$9.12 – $13.76 |
|
|
508,425 |
|
|
|
3.13 |
|
|
$ |
12.45 |
|
|
|
450,621 |
|
|
$ |
12.86 |
|
$14.00 – $23.13 |
|
|
1,504,051 |
|
|
|
2.90 |
|
|
$ |
17.55 |
|
|
|
1,487,604 |
|
|
$ |
17.59 |
|
$36.85 |
|
|
70,000 |
|
|
|
0.38 |
|
|
$ |
36.85 |
|
|
|
70,000 |
|
|
$ |
36.85 |
|
|
|
|
|
|
|
|
|
|
|
|
|
|
|
|
|
|
|
|
2,517,451 |
|
|
|
3.88 |
|
|
$ |
14.65 |
|
|
|
2,008,225 |
|
|
$ |
17.20 |
|
|
|
|
|
|
|
|
|
|
|
|
|
|
|
|
|
The exercise period for all stock options generally may not exceed ten years from the date of
grant. Stock option grants to individuals generally vest fifty percent after two years, and an
additional twenty five percent after each of years three and four.
The weighted-average fair values at date of grant for options granted during fiscal years 2010,
2009 and 2008 were $2.19, $1.08, and $3.01, respectively. The fair value of options at the date of
grant was estimated using the Black-Scholes option-pricing model with the following assumptions:
| |
|
|
|
|
|
|
|
|
|
|
|
|
| |
|
2010 |
|
|
2009 |
|
|
2008 |
|
Expected life (years) |
|
|
4.75 |
|
|
|
4.75 |
|
|
|
4.75 |
|
Risk-free interest rate |
|
|
2.12 |
% |
|
|
1.90 |
% |
|
|
3.84 |
% |
Volatility |
|
|
63 |
% |
|
|
49 |
% |
|
|
38 |
% |
Dividend yield |
|
|
1.2 |
% |
|
|
2.5 |
% |
|
|
1.6 |
% |
43
The risk-free interest rate and dividend yield were obtained from published sources based upon
factual data. In order to determine the expected life, we considered the historical exercise
behavior, vesting periods, and the remaining contractual life of outstanding options. The
weighted-average expected stock-price volatility assumptions were determined primarily based upon
observed historical volatility of Keithley’s stock price, as there is not a substantial enough
market for comparable exchange-traded options.
Performance Award Units
Beginning in fiscal 2006, the Company began granting performance award units to officers and other
key employees.
Performance award units—Fiscal 2010 Grant
During fiscal 2010, the Company granted 86,075 performance award units to officers and key
employees. The performance award unit agreements provide for the award of performance units with
each unit representing the right to receive one of the Company’s Common Shares to be issued after
the applicable award period. The final number of units awarded for this grant will be determined,
as of September 30, 2012, based upon the Company’s total shareholder return over the performance
period compared to the Russell MicroCap Index and may range from a minimum of no units to a maximum
of twice the initial award. The weighted average fair value for these performance units was $6.73
and was determined using a Monte Carlo simulation model incorporating the following assumptions:
| |
|
|
|
|
|
Risk-free interest rate |
|
|
1.25 |
% |
Volatility |
|
|
78 |
% |
The Company recognizes the estimated cost of these awards, as determined under the simulation
model, over the performance period, with no adjustment in future periods based upon the actual
shareholder return over the performance period. During fiscal 2010, we recorded expenses of $164
relating to the 2010-2012 awards.
Performance award units—Grants prior to Fiscal 2010
The performance award unit agreements provided for the award of performance units with each unit
representing the right to receive one of the Company’s Common Shares to be issued after the
applicable award period. The awards were valued at the closing market price of the Company’s Common
Shares on the date of grant and vested at the end of the performance period. The final number of
units earned pursuant to an award may have ranged from a minimum of no units, to a maximum of twice
the initial award. The awards issued in fiscal 2007 and 2008 could have been adjusted in 25 percent
increments. The number of units earned was based on the Company’s revenue growth relative to a
defined peer group, and the Company’s return on assets or return on invested capital. For each
reporting period, the compensation cost of the performance award units was subject to adjustment
based upon our estimate of the number of awards we expected would be issued upon completion of the
performance period. We granted no performance award units during fiscal 2009.
The awards granted in fiscal year 2007 that vested on September 30, 2009 were not issued as the
payout was zero percent of target.
The awards granted in fiscal year 2008 vested on September 30, 2010, and 120,350 Common Shares were
issued on October 27, 2010. The performance criteria related to these awards were met and resulted
in a payout at 100 percent of target for those awards measured on return on assets. Additionally,
it was determined that the subset of these awards which was measured on return on invested capital
achieved a payout at 125 percent of target and were issued accordingly.
Each reporting period, the compensation costs of the performance award units was subject to
adjustment based upon our estimate of the number of awards we expected would be issued upon the
completion of the three-year performance period. During fiscal 2010, we recorded expenses of $1,099
relating to the 2008-2010 awards. During fiscal 2009, management determined that the performance
criteria related to the awards granted in fiscal 2007 and 2008 were not expected to be met and that
none of these awards were expected to vest. Therefore, in fiscal 2009, all previously-recorded
expense of $950 for awards relating to the 2007-2009 period as well as the 2008-2010 period was
reversed. During fiscal 2008, we recorded a favorable adjustment of $512 for the awards granted
during fiscal 2006, as we expected an attainment of 50 percent of target would be achieved compared
with previously expected achievement of 100 percent of target.
44
Following is a summary of activity related to performance awards based on the number of units
expected to vest:
| |
|
|
|
|
|
|
|
|
| |
|
|
|
|
|
Weighted Average |
|
| |
|
|
|
|
|
Grant Date |
|
| |
|
Number of Units |
|
|
Fair Value |
|
Outstanding at September 30, 2007 |
|
|
220,525 |
|
|
|
14.34 |
|
Awards granted |
|
|
173,225 |
|
|
|
9.13 |
|
Awards forfeited |
|
|
(35,813 |
) |
|
|
10.85 |
|
Adjustment of 2007 awards |
|
|
(61,275 |
) |
|
|
13.94 |
|
|
|
|
|
|
|
|
Outstanding at September 30, 2008(1) |
|
|
296,662 |
|
|
|
11.55 |
|
Awards issued |
|
|
(71,487 |
) |
|
|
15.05 |
|
Awards granted |
|
|
— |
|
|
|
— |
|
Awards forfeited |
|
|
(49,700 |
) |
|
|
10.60 |
|
Adjustment of 2007 awards |
|
|
(46,100 |
) |
|
|
13.95 |
|
Adjustment of 2008 awards |
|
|
(129,375 |
) |
|
|
9.13 |
|
|
|
|
|
|
|
|
Outstanding at September 30, 2009 |
|
|
— |
|
|
|
— |
|
Awards issued |
|
|
— |
|
|
|
— |
|
Awards granted |
|
|
86,075 |
|
|
|
6.73 |
|
Awards forfeited |
|
|
(18,675 |
) |
|
|
9.13 |
|
Adjustment of 2008 awards |
|
|
139,025 |
|
|
|
9.13 |
|
|
|
|
|
|
|
|
Outstanding at September 30, 2010(2) |
|
|
206,425 |
|
|
$ |
8.13 |
|
|
|
|
|
|
|
|
|
|
|
| (1) |
|
Included in the awards outstanding at September 30, 2008 are 71,487 units for the
2006-2008 Plan awards that were vested, but were not yet issued as the performance targets
could only be measured following September 30, 2008. These awards were issued on November
6, 2008 when the Company’s previous trading day’s closing stock price was $3.62 per share. |
| |
| (2) |
|
Included in the awards outstanding at September 30, 2010 are 120,350 units for the
2008-2010 Plan awards that were vested, but were not yet issued as the performance targets
could only be measured following September 30, 2010. These awards were issued on October
27, 2010 when the Company’s previous trading day’s closing stock price was $21.53 per
share. |
Restricted Award Units
Beginning in fiscal 2006, the Company began granting restricted award units to key employees. The
restricted award unit agreements provide for the award of restricted units with each unit
representing one share of the Company’s Common Shares. The awards generally will vest on the fourth
anniversary of the award date, subject to certain conditions specified in the agreement. They were
valued at the closing market price of the Company’s Common Shares on the date of grant and vest at
the end of the performance period.
Following is a summary of activity related to restricted award units:
| |
|
|
|
|
|
|
|
|
| |
|
|
|
|
|
Weighted Average |
|
| |
|
|
|
|
|
Grant Date |
|
| |
|
Number of Units |
|
|
Fair Value |
|
Outstanding at September 30, 2007 |
|
|
38,100 |
|
|
$ |
13.96 |
|
Awards granted |
|
|
21,725 |
|
|
|
9.17 |
|
Awards vested |
|
|
(5,425 |
) |
|
|
12.36 |
|
Awards forfeited |
|
|
(1,800 |
) |
|
|
13.03 |
|
|
|
|
|
|
|
|
Outstanding at September 30, 2008 |
|
|
52,600 |
|
|
|
12.25 |
|
Awards granted |
|
|
125,800 |
|
|
|
2.99 |
|
Awards vested |
|
|
— |
|
|
|
— |
|
Awards forfeited |
|
|
(24,850 |
) |
|
|
8.31 |
|
|
|
|
|
|
|
|
Outstanding at September 30, 2009 |
|
|
153,550 |
|
|
|
5.30 |
|
Awards granted |
|
|
112,400 |
|
|
|
4.27 |
|
Awards vested |
|
|
(8,625 |
) |
|
|
15.05 |
|
Awards forfeited |
|
|
(40,650 |
) |
|
|
5.70 |
|
|
|
|
|
|
|
|
Outstanding at September 30, 2010 |
|
|
216,675 |
|
|
$ |
4.30 |
|
|
|
|
|
|
|
|
The total fair value of shares vested during fiscal year 2010 was $40.
45
Directors Equity Plans
The Company’s non-employee Directors receive an annual Common Share grant up to $58 per individual.
The Common Shares are issued on a quarterly basis out of the Keithley Instruments, Inc. 2002 Stock
Incentive Plan; however, to limit dilution to shareholders, for grants after December 2008, no more
than 3,000 shares per quarter per Director may be issued. During fiscal years 2010, 2009 and 2008,
we recorded expense of $392, $394 and $522 for the issuance of 58,184, 103,155 and 52,524 shares,
respectively, pursuant to this program based upon the fair market value of the shares at the date
of grant. The Board of Directors also may issue restricted stock grants worth $75 to a new
non-employee Director at the time of his or her election. These restricted stock grants will vest
over a 3-year period. There have been no such grants since February 2006.
Employee Stock Purchase Plan
The Company’s 2005 Employee Stock Purchase and Dividend Reinvestment Plan, as amended, (the “2005
Plan”) offered eligible employees the opportunity to acquire the Company’s Common Shares at a small
discount and without transaction costs. Eligible employees could only participate in the plan on a
year-to-year basis, must have enrolled prior to the commencement of each plan year, and in the case
of U.S. employees, must have authorized monthly payroll deductions. Non-U.S. employees submitted
their contribution at the end of the plan year. A mid-year enrollment option was also available for
new employees. For each plan year, the purchase price was equal to 95 percent of the market price
at the end of the subscription period. The provisions contained in the 2005 Plan eliminated the
measurement of compensation expense required under applicable U.S. GAAP. The 2005 Plan subscription
period began on July 1 and ended on June 30. In July 2010, 2009 and 2008, 5,018, 17,866 and 8,785
shares were purchased by employees under this plan at a price of $8.39, $3.80 and $9.03 per share,
respectively. A total of 500,000 Common Shares were reserved for
purchase under the 2005 Plan, of which 452,245 remained available for purchase at September 30,
2010. As of July 1, 2010, the 2005 Plan was discontinued.
Note J — Income Taxes
Income (loss) before income taxes, based on geographic location of the operation to which such
earnings and losses are attributable, is provided below. Because the Company has elected to treat
certain foreign subsidiaries as branches for United States income tax purposes, pretax losses
attributable to the U.S. shown below may differ from the pretax losses or income reported on the
Company’s annual U.S. Federal income tax return.
| |
|
|
|
|
|
|
|
|
|
|
|
|
| |
|
2010 |
|
|
2009 |
|
|
2008 |
|
United States |
|
$ |
20,322 |
|
|
$ |
(18,551 |
) |
|
$ |
(8,204 |
) |
Non — U.S. |
|
|
5,075 |
|
|
|
(815 |
) |
|
|
3,668 |
|
|
|
|
|
|
|
|
|
|
|
|
|
$ |
25,397 |
|
|
$ |
(19,366 |
) |
|
$ |
(4,536 |
) |
|
|
|
|
|
|
|
|
|
|
The provision (benefit) for income taxes is as follows:
| |
|
|
|
|
|
|
|
|
|
|
|
|
| |
|
2010 |
|
|
2009 |
|
|
2008 |
|
Current: |
|
|
|
|
|
|
|
|
|
|
|
|
Federal |
|
$ |
(356 |
) |
|
$ |
678 |
|
|
$ |
160 |
|
Non — U.S. |
|
|
2,130 |
|
|
|
22 |
|
|
|
985 |
|
State and local |
|
|
77 |
|
|
|
26 |
|
|
|
86 |
|
|
|
|
|
|
|
|
|
|
|
Total current |
|
|
1,851 |
|
|
|
726 |
|
|
|
1,231 |
|
|
|
|
|
|
|
|
|
|
|
Deferred: |
|
|
|
|
|
|
|
|
|
|
|
|
Federal, state & local |
|
|
(570 |
) |
|
|
30,100 |
|
|
|
(3,208 |
) |
Non — U.S. |
|
|
(762 |
) |
|
|
312 |
|
|
|
34 |
|
|
|
|
|
|
|
|
|
|
|
Total deferred |
|
|
(1,332 |
) |
|
|
30,412 |
|
|
|
(3,174 |
) |
|
|
|
|
|
|
|
|
|
|
Total provision (benefit) |
|
$ |
519 |
|
|
$ |
31,138 |
|
|
$ |
(1,943 |
) |
|
|
|
|
|
|
|
|
|
|
46
The following is a reconciliation between the provision (benefit) for income taxes and the
amount computed by applying the U.S. Federal income tax rate of 34% to loss before taxes:
| |
|
|
|
|
|
|
|
|
|
|
|
|
| |
|
2010 |
|
|
2009 |
|
|
2008 |
|
Federal income tax (benefit) at statutory rate |
|
$ |
8,635 |
|
|
$ |
(6,585 |
) |
|
$ |
(1,542 |
) |
U.S. (income) loss without tax (expense) benefit |
|
|
(6,924 |
) |
|
|
6,307 |
|
|
|
— |
|
State and local income taxes |
|
|
77 |
|
|
|
26 |
|
|
|
(199 |
) |
Benefit from 2009 NOL carryback |
|
|
(1,220 |
) |
|
|
— |
|
|
|
— |
|
Research tax credit |
|
|
— |
|
|
|
— |
|
|
|
(243 |
) |
Foreign losses without tax benefit |
|
|
— |
|
|
|
669 |
|
|
|
324 |
|
(Benefit) tax on non-U.S. income |
|
|
(348 |
) |
|
|
(35 |
) |
|
|
576 |
|
Foreign tax credit carryforwards |
|
|
— |
|
|
|
— |
|
|
|
(545 |
) |
Valuation allowance |
|
|
— |
|
|
|
29,967 |
|
|
|
— |
|
Accruals and tax law changes |
|
|
267 |
|
|
|
789 |
|
|
|
(316 |
) |
Other |
|
|
32 |
|
|
|
— |
|
|
|
2 |
|
|
|
|
|
|
|
|
|
|
|
Effective provision (benefit) for income taxes |
|
$ |
519 |
|
|
$ |
31,138 |
|
|
$ |
(1,943 |
) |
|
|
|
|
|
|
|
|
|
|
Effective provision (benefit) income tax rate |
|
|
2.0 |
% |
|
|
160.8 |
% |
|
|
(42.8 |
)% |
|
|
|
|
|
|
|
|
|
|
In fiscal year 2010,the Company was able to utilize fully reserved deferred tax assets to
reduce its tax expense. As a result, the fiscal 2010 tax expense included a benefit for U.S.
income that the Company did not record tax against. The 2009 period’s tax expense included a
$29,967 non-cash expense for a valuation allowance recorded against U.S. deferred tax assets, which
was recorded during the first quarter of fiscal year 2009. When considering the need for a
valuation allowance against deferred tax assets, we consider all positive and negative evidence
that would indicate whether or not we will be able to utilize the deferred tax assets. As a result
of the overall downturn in the U.S. economy in the first quarter of fiscal year 2009, and more
specifically, in the industries in which we operate, our sales and profitability were adversely
impacted resulting in a cumulative loss in the U.S. for the twelve quarters ended December 31,
2008. Additionally, during January 2009, we revised our fiscal 2009 forecast downward to reflect
continuing weakness in the end markets in which we serve. As a result of this negative evidence we
concluded that it was more likely than not that we would not have the necessary future taxable
income to realize the deferred tax assets; accordingly, we recorded the full valuation allowance on
the U.S. deferred tax assets. Although the economy and the Company have experienced significant
improvement, the Company believes there is continued uncertainty and believes that it is premature
to release the valuation allowance based on one year of profitability.
The research tax credit expired effective December 31, 2007, therefore the 2008 benefit only
includes the credit through December 31, 2007. On October 3, 2008, former President Bush signed the
Economic Stabilization Act of 2008 (“The Act”). The Act included a provision to retroactively
extend the research tax credit from January 1, 2008 through December 31, 2009. Because The Act was
signed after September 30, 2008, an approximate $730 research tax credit for the period January 1,
2008 through September 30, 2008 has been reflected as a discrete item in the first quarter of the
fiscal year ending September 30, 2009. As a result of the valuation allowance described above, the
$730 increase to the fiscal year 2008 research tax credit was not recognized as a benefit to income
tax expense.
47
Significant components of the Company’s deferred tax assets and liabilities as of September 30,
2010 and 2009 are as follows:
| |
|
|
|
|
|
|
|
|
| Deferred tax assets: |
|
2010 |
|
|
2009 |
|
Stock options |
|
$ |
1,790 |
|
|
$ |
585 |
|
Capitalized research and development |
|
|
11,046 |
|
|
|
13,936 |
|
Inventory |
|
|
2,833 |
|
|
|
3,425 |
|
Deferred compensation |
|
|
805 |
|
|
|
864 |
|
Tax credit carryforward |
|
|
12,102 |
|
|
|
7,751 |
|
Depreciation |
|
|
754 |
|
|
|
1,743 |
|
Warranty |
|
|
181 |
|
|
|
142 |
|
Medical |
|
|
202 |
|
|
|
204 |
|
State and local taxes |
|
|
2,240 |
|
|
|
2,202 |
|
Net operating losses |
|
|
1,057 |
|
|
|
9,702 |
|
Pension |
|
|
3,639 |
|
|
|
2,647 |
|
Impaired assets |
|
|
978 |
|
|
|
910 |
|
Other |
|
|
2,520 |
|
|
|
1,992 |
|
|
|
|
|
|
|
|
Total deferred tax assets |
|
|
40,147 |
|
|
|
46,103 |
|
|
|
|
|
|
|
|
Total deferred tax liabilities |
|
|
— |
|
|
|
— |
|
|
|
|
|
|
|
|
Valuation allowance |
|
|
(37,546 |
) |
|
|
(45,052 |
) |
|
|
|
|
|
|
|
Net deferred tax assets |
|
$ |
2,601 |
|
|
$ |
1,051 |
|
|
|
|
|
|
|
|
The valuation allowance at September 30, 2009, related to the U.S. deferred tax assets
described above and to net operating losses, which the Company believed may not be realized due to
the uncertainty of future profit levels in certain taxing jurisdictions. The increase in the
valuation allowance during the year ended September 30, 2009 was due to the additional valuation
allowance taken against U.S. deferred tax assets described above. This increase included $29,967 of
U.S. deferred tax assets on hand at September 30, 2008 plus an additional $14,027 of deferred tax
assets generated globally during the year ended September 30, 2009. The decrease in the valuation
allowance during the year ended September 30, 2010 was primarily due to the utilization of U.S.
deferred tax assets. The Company believes it is premature to release the entire valuation
allowance based on one year of profitability because of uncertainty in the economy and the
Company’s business in general.
The changes in the valuation allowance for deferred tax assets for fiscal years ending September
30, 2010, 2009, and 2008 are as follows:
| |
|
|
|
|
|
|
|
|
|
|
|
|
| |
|
2010 |
|
|
2009 |
|
|
2008 |
|
Balance at beginning of year |
|
$ |
45,052 |
|
|
$ |
1,058 |
|
|
$ |
1,180 |
|
Charged to costs and expenses |
|
|
— |
|
|
|
39,088 |
|
|
|
415 |
|
Charged to other comprehensive loss |
|
|
1,355 |
|
|
|
5,024 |
|
|
|
— |
|
Charged to other accounts |
|
|
— |
|
|
|
60 |
|
|
|
(74 |
) |
Deductions |
|
|
(8,861 |
) |
|
|
(178 |
) |
|
|
(463 |
) |
|
|
|
|
|
|
|
|
|
|
Balance at end of year |
|
$ |
37,546 |
|
|
$ |
45,052 |
|
|
$ |
1,058 |
|
|
|
|
|
|
|
|
|
|
|
During
2010, 2009 and 2008, respectively, the Company utilized $8,861, $178 and $463 and of
losses against which a valuation allowance was previously recorded.
At September 30, 2010, the Company had tax credit and net operating loss carryforwards as follows:
| |
|
|
|
|
|
|
|
|
|
|
|
|
| |
|
|
|
|
|
Year Expiration Commences |
|
Alternative minimum tax credit |
|
$ |
1,896 |
|
|
Indefinite |
|
Foreign tax credit |
|
|
5,260 |
|
|
2016-2019 |
|
R&D credit |
|
|
4,931 |
|
|
2016-2029 |
|
Foreign net operating losses |
|
|
5,755 |
|
|
2010-Indefinite |
|
48
In accordance with U.S. GAAP, the Company does not record the tax benefits of stock-based
compensation in excess of the book deductions until these benefits are realized using the tax law
ordering rules. The Company recorded a debit of $28 and credits of $92
and $140 to additional paid-in-capital during the years ended September 30, 2010, 2009 and 2008,
respectively, in connection with these excess tax benefits.
The calculation of the Company’s provision for income taxes involves the interpretation of complex
tax laws and regulations. Tax benefits for certain items are not recognized, unless it is more
likely than not that the Company’s position will be sustained if challenged by tax authorities. Tax
liabilities for other items are recognized for anticipated tax contingencies based on the Company’s
estimate of whether additional taxes will be due.
As of September 30, 2009, the Company had gross unrecognized tax benefits of $5,820. The total
amount of such unrecognized benefits that, if recognized, would benefit the effective tax rate was
$4,001. As of September 30, 2010, the Company had approximately $6,327 of total gross unrecognized
tax benefits. The total amount of such unrecognized tax benefits, if recognized, that would benefit
the tax rate was approximately $4,228. The Company anticipates a decrease in its unrecognized tax
positions of approximately $800 to $900 over the next 12 months. The anticipated decrease is
primarily due to the expiration of statutes of limitations in various jurisdictions. The nature of
the soon to be expiring tax positions includes the allocation of income and certain deductions
between jurisdictions.
The following table reconciles the Company’s gross unrecognized tax benefits for the fiscal years
ended September 30, 2010 and 2009.
| |
|
|
|
|
|
|
|
|
| |
|
2010 |
|
|
2009 |
|
Balance at October 1 |
|
$ |
5,820 |
|
|
$ |
5,389 |
|
Tax positions related to the current year: |
|
|
|
|
|
|
|
|
Additions |
|
|
381 |
|
|
|
630 |
|
Tax positions related to prior years: |
|
|
|
|
|
|
|
|
Additions |
|
|
224 |
|
|
|
249 |
|
Subtractions |
|
|
— |
|
|
|
— |
|
Settlements with tax authorities |
|
|
— |
|
|
|
— |
|
Lapses in statutes of limitation |
|
|
(98 |
) |
|
|
(448 |
) |
|
|
|
|
|
|
|
Balance at September 30 |
|
$ |
6,327 |
|
|
$ |
5,820 |
|
|
|
|
|
|
|
|
The Company records interest and penalties related to uncertain tax position as income tax
expense. As of September 30, 2010 and 2009, the Company accrued approximately $1,980 and $1,764,
respectively, for interest and penalties. We recorded $216 and $330 for penalties and interest
related to uncertain tax positions during fiscal 2010 and 2009, respectively. During the year ended
September 30, 2010, the Company settled an audit by the Internal Revenue Service for the tax year
ended September 30, 2008. As of September 30, 2010, the Company was being audited by Germany for
the years ended September 30, 2005 through September 30, 2008 and by France for the tax years ended
September 30, 2003 — September 30, 2004 and September 30, 2007 — September 30, 2008.
Subsequently, the audit in France was resolved.
Note K — Severance and Other Restructuring Charges
During the past two fiscal years and continuing into the first quarter of fiscal 2010, the Company
implemented several global workforce reductions and exited two product lines. Initiated in response
to a prolonged deterioration in economic conditions, the actions and the related activities are
substantially completed.
In January 2009, the Company implemented cost reduction actions including a reduction in its
worldwide work force of approximately seven percent, which included the impact of an early
retirement program. These charges totaled $1,190, the majority of which related to amounts incurred
in connection with one-time termination benefits, and are included in fiscal year 2009
Consolidated Statements of Operations under the “Severance and related charges” caption. All
benefits were paid during the remainder of fiscal year 2009, with the exception of one individual
who received severance benefits through the third quarter of fiscal year 2010.
49
Additionally, in February 2009, the Company announced that it would exit its S600 parametric test
product line resulting in a charge in fiscal year 2009 of $5,550, including non-cash charges of
$4,498. The majority of the activities related to this action were completed by the end of fiscal
year 2009. The $5,550 charge is comprised of the following:
| |
|
|
|
|
| |
|
Product line exit costs |
|
Severance and other restructuring charges: |
|
|
|
|
Severance and related benefits |
|
$ |
1,052 |
|
Sales demonstration inventory write-off |
|
|
1,579 |
|
Write-down of fixed assets |
|
|
341 |
|
Pension plan curtailment charge |
|
|
28 |
|
Lease termination charge |
|
|
10 |
|
|
|
|
|
|
|
|
3,010 |
|
Inventory write-off and accelerated
depreciation for exited product line |
|
|
2,540 |
|
|
|
|
|
|
|
$ |
5,550 |
|
|
|
|
|
The remaining payments associated with the workforce reductions were completed by September 30,
2010. Since the fourth quarter of fiscal year 2008, we have incurred total cumulative
restructuring, severance and related charges of $8,179 in addition to other costs associated with
the exit of our S600 product line totaling $2,540.
In November 2009, the Company completed the aforementioned sale of the RF product line for which we
recorded $669 of severance charges during the in fiscal 2010 (see Note M.) The severance charges
are included within “Gain on the sale of product line” in the Consolidated Statement of
Operations.
At September 30, 2010, $82 of accrued severance charges was included in the “Accrued payroll and
related expenses” caption of the Consolidated Balance Sheets. In total, approximately
160 employees have been terminated under the various workforce reduction initiatives since
September 2008. The activities and our accruals relating to our restructuring and cost reduction
programs are summarized below:
| |
|
|
|
|
|
Balance—September 30, 2008 |
|
$ |
1,252 |
|
Expense recorded |
|
|
4,823 |
|
Adjustments to previously-recorded expense |
|
|
2 |
|
Cash payments |
|
|
(4,077 |
) |
|
|
|
|
Balance—September 30, 2009 |
|
|
2,000 |
|
Expense recorded |
|
|
669 |
|
Adjustments to previously-recorded expense |
|
|
(124 |
) |
Cash payments |
|
|
(2,463 |
) |
|
|
|
|
Balance—September 30, 2010 |
|
$ |
82 |
|
|
|
|
|
Note L — Commitments and Contingencies
The Company leases certain office and manufacturing facilities and office equipment under operating
leases. Rent expense under operating leases (net of sublease income of $128 in 2010, $166 in 2009
and $128 in 2008) was $1,958, $2,369 and $3,161 for 2010, 2009 and 2008, respectively. Future
minimum lease payments under operating leases as of September 30, 2010 are as follows:
| |
|
|
|
|
|
2011 |
|
$ |
1,890 |
|
2012 |
|
|
1,272 |
|
2013 |
|
|
809 |
|
2014 |
|
|
411 |
|
2015 |
|
|
375 |
|
After 2015 |
|
|
610 |
|
|
|
|
|
Total minimum operating lease payments |
|
$ |
5,367 |
|
|
|
|
|
In November 2009, the Company sold substantially all of its assets of its RF product line to
Agilent. While Agilent assumed the obligations under the Company’s lease in Santa Rosa California,
the Company remains obligated in the event of default by Agilent; however, Agilent will indemnify
the Company for any amounts paid by the Company to the landlord in event of any default.
Accordingly, obligations of approximately $305 and $178 under that lease are excluded from the
above table as they are not expected to be incurred by the Company for fiscal 2011 and 2012,
respectively.
50
Note M— Gain on the Sale of RF Product Line
On November 30, 2009, the Company completed the sale of its RF product line to Agilent. Under terms
of the purchase agreement, the Company sold substantially all of the Company’s assets related to
the RF product line (including inventory, property and
equipment, and capitalized software) for a cash purchase price of $9,000, and Agilent assumed
related contractual (including lease obligations), product support and other liabilities and hired
the majority of the RF employees. The Company is prohibited from competing against Agilent solely
with respect to the RF product line until November 30, 2012. The purchase agreement contains
customary indemnification obligations with respect to the representations, warranties and covenants
of the parties. As a result of the transaction, the Company recorded pre-tax gain of $2,894, which
included accumulative expenses associated with the transaction of $1,622, of which $669 relates to
severance benefits for terminated employees (see Note K.). The Company expects no further costs to
be incurred relating to this transaction. As the RF product line did not have separately
identifiable financial and cash flow information, the gain on sale is considered a component of
continuing operations.
Additionally, on November 30, 2009, the parties entered into a transition service agreement (“TSA”)
which terminated during the third quarter of fiscal year 2010. In exchange for consideration as
specified in the TSA, Keithley provided certain limited services as they related to its former RF
product line.
Note N — Gain on the Sale of Building
During fiscal 2010, the Company sold its 75,600 square feet facility which was situated on
approximately seven acres of land located on Bainbridge Road in Solon, Ohio. The sale resulted in
net proceeds of $3,573, and the Company realized a gain on the sale as follows:
| |
|
|
|
|
|
Gross proceeds from sale of building |
|
$ |
3,800 |
|
Less: expenses related to the sale |
|
|
227 |
|
Less: net book value of assets: |
|
|
|
|
Land, Building and improvements |
|
|
1,697 |
|
Equipment, furniture and fixtures |
|
|
14 |
|
|
|
|
|
Net gain on the sale of building |
|
$ |
1,862 |
|
|
|
|
|
Note O — Fair Value Measurements
Authoritative guidance defines fair value as the price that would be received from selling an asset
or paid to transfer a liability in an orderly transaction between market participants at the
measurement date. We categorize financial instruments within the fair value hierarchy based upon
the lowest level of input that is significant to the fair value measurement. Our financial
instruments consist primarily of cash and cash equivalents, restricted cash, accounts receivable,
short-term investments, forward contracts to purchase foreign currencies and accounts payable. Due
to their short-term nature, the carrying values of accounts receivable and accounts payable
approximate fair value. Level 1 assets represent those whose fair value is based upon quoted
prices in active markets for identical assets, while Level 2 assets represent those whose fair
value is based upon significant other observable inputs. The Company
has no Level 3 assets aside from limited partnership investments held
in the U.S. pension assets.
Financial assets measured at fair value on a recurring basis as of September 30, 2010, were as
follows:
| |
|
|
|
|
|
|
|
|
|
|
|
|
| |
|
Level 1 |
|
|
Level 2 |
|
|
Total |
|
Assets |
|
|
|
|
|
|
|
|
|
|
|
|
Cash and cash equivalents (1) |
|
$ |
48,706 |
|
|
$ |
2,084 |
|
|
$ |
50,790 |
|
Restricted cash |
|
|
537 |
|
|
|
— |
|
|
|
537 |
|
Certificates of deposit (2) |
|
|
— |
|
|
|
3,912 |
|
|
|
3,912 |
|
|
|
|
|
|
|
|
|
|
|
|
|
$ |
49,243 |
|
|
$ |
5,996 |
|
|
$ |
55,239 |
|
|
|
|
|
|
|
|
|
|
|
Liabilities |
|
|
|
|
|
|
|
|
|
|
|
|
Foreign currency forward contracts (3) |
|
$ |
— |
|
|
$ |
207 |
|
|
$ |
207 |
|
|
|
|
|
|
|
|
|
|
|
51
Financial assets measured at fair value on a recurring basis as of September 30, 2009, were as
follows:
| |
|
|
|
|
|
|
|
|
|
|
|
|
| |
|
Level 1 |
|
|
Level 2 |
|
|
Total |
|
Assets |
|
|
|
|
|
|
|
|
|
|
|
|
Cash and cash equivalents (1) |
|
$ |
22,444 |
|
|
$ |
1,670 |
|
|
$ |
24,114 |
|
Restricted cash |
|
|
569 |
|
|
|
— |
|
|
|
569 |
|
Certificates of deposit (2) |
|
|
— |
|
|
|
759 |
|
|
|
759 |
|
|
|
|
|
|
|
|
|
|
|
|
|
$ |
23,013 |
|
|
$ |
2,429 |
|
|
$ |
25,442 |
|
|
|
|
|
|
|
|
|
|
|
Liabilities |
|
|
|
|
|
|
|
|
|
|
|
|
Foreign currency forward contracts (3) |
|
$ |
— |
|
|
$ |
170 |
|
|
$ |
170 |
|
|
|
|
|
|
|
|
|
|
|
|
|
|
| (1) |
|
Consists of cash, money market funds and certificates of deposit having maturities of less than
90 days. |
| |
| (2) |
|
Included in “Short term investments” in the unaudited condensed consolidated balance sheets. |
| |
| (3) |
|
Included in “Prepaid expenses” or “Other accrued expenses” in the unaudited condensed
consolidated balance sheets, with related unrecognized gains and losses being recorded in
“Accumulated other comprehensive losses” until realized, at which time they are recorded in “Cost
of goods sold” in the condensed consolidated statement of operations. |
Certain nonfinancial assets are measured at fair value on a nonrecurring basis and, therefore, are
not included in the tables above. These assets primarily consist of notes receivable and are
included in “Other assets” in the condensed consolidated balance sheets. They are measured at cost
and are tested for impairment when events and circumstances warrant by comparing the fair value of
the underlying net assets to the carrying value of the notes receivable.
Note P — Segment and Geographic Information
The Company reports a single Test and Measurement segment. Our net sales and long-lived assets by
geographic area are presented below. The basis for attributing revenues from external customers to
a geographic area is the location to which the product is shipped.
| |
|
|
|
|
|
|
|
|
|
|
|
|
| |
|
2010 |
|
|
2009 |
|
|
2008 |
|
Net sales: |
|
|
|
|
|
|
|
|
|
|
|
|
United States |
|
$ |
33,947 |
|
|
$ |
26,907 |
|
|
$ |
37,115 |
|
Other Americas |
|
|
2,310 |
|
|
|
1,845 |
|
|
|
3,174 |
|
Germany |
|
|
12,913 |
|
|
|
12,786 |
|
|
|
20,815 |
|
Other Europe |
|
|
23,823 |
|
|
|
21,117 |
|
|
|
31,177 |
|
Japan |
|
|
15,909 |
|
|
|
12,851 |
|
|
|
16,574 |
|
China |
|
|
16,275 |
|
|
|
12,998 |
|
|
|
18,679 |
|
Other Asia |
|
|
21,693 |
|
|
|
14,023 |
|
|
|
24,934 |
|
|
|
|
|
|
|
|
|
|
|
|
|
$ |
126,870 |
|
|
$ |
102,527 |
|
|
$ |
152,468 |
|
|
|
|
|
|
|
|
|
|
|
Long-lived assets: |
|
|
|
|
|
|
|
|
|
|
|
|
United States |
|
$ |
4,525 |
|
|
$ |
9,751 |
|
|
$ |
11,749 |
|
Other |
|
|
1,188 |
|
|
|
1,349 |
|
|
|
1,403 |
|
|
|
|
|
|
|
|
|
|
|
|
|
$ |
5,713 |
|
|
$ |
11,100 |
|
|
$ |
13,152 |
|
|
|
|
|
|
|
|
|
|
|
Note Q — Subsequent Events
On
October 4, 2010, a purported class action and derivative lawsuit
was filed related to the then-pending
merger of the Company into a subsidiary of Danaher Corporation (“Danaher”) pursuant to the
Agreement and Plan of Merger, dated as of September 29, 2010, by and among the Company, Danaher and
Aegean Acquisition Corp. The case, Donald Freidlander v. Danaher Corporation, Brian R. Bachman,
James B. Griswold, Leon J. Hendrix, Jr., Brian J. Jackman, Joseph P. Keithley, N. Mohan Reddy,
Thomas A. Saponas, Barbara V. Scherer and Keithley Instruments, Inc.,
was filed on October 4, 2010,
in the Court of Common Pleas of Cuyahoga County, Ohio (Case No. CV 10 738257). The complaint
alleged, among other things, that the Company’s directors breached their fiduciary duties in
connection with the merger and that Danaher aided and abetted the Company’s directors in their
alleged breaches of fiduciary duties. The relief sought by the plaintiff included a declaration
that the action is properly maintainable as a derivative and class action, a declaration that the
merger is unlawful and unenforceable, an injunction barring the merger, rescinding (to the extent
already implemented) the merger or any of the terms thereof and the payment of costs and
disbursements of the action, including attorneys’ and experts’ fees. On November 15, 2010, counsel
for all parties reached an agreement in principle regarding the settlement of the Action. The
parties are waiting for court approval of the settlement.
On December 8, 2010, the Company completed the transactions contemplated by the Agreement and
Plan of Merger (the “Merger Agreement”) dated September 29, 2010 among Danaher Corporation
(“Danaher”), Aegean Acquisition Corp. and the Company. Pursuant to the Merger Agreement, Aegean
Acquisition Corp. was merged into the Company and each outstanding Common Shares and Class B
Common Share of the Company was converted into the right to receive $21.60 per share in cash.
Subsequent to the closing of the merger, a
Triggering Event occurred as defined in the Change in Control Agreement and Amended Employment Agreement with two of the
Company’s executives. Accordingly, the executives will receive the payments and other benefits payable under such
agreements.
52
Unaudited Quarterly Results of Operations
Following are the Company’s unaudited quarterly results of operations for fiscal 2010 and 2009.
| |
|
|
|
|
|
|
|
|
|
|
|
|
|
|
|
|
| |
|
First |
|
|
Second |
|
|
Third |
|
|
Fourth |
|
Fiscal 2010 |
|
|
|
|
|
|
|
|
|
|
|
|
|
|
|
|
Net sales |
|
$ |
28,397 |
|
|
$ |
29,846 |
|
|
$ |
30,686 |
|
|
$ |
37,941 |
|
Gross profit |
|
|
17,881 |
|
|
|
19,646 |
|
|
|
19,661 |
|
|
|
25,037 |
|
Gain on the sale of RF product line |
|
|
(3,493 |
) |
|
|
407 |
|
|
|
18 |
|
|
|
174 |
|
Gain on the sale of building |
|
|
— |
|
|
|
— |
|
|
|
— |
|
|
|
(1,862 |
) |
Severance and related charges |
|
|
(30 |
) |
|
|
(104 |
) |
|
|
39 |
|
|
|
(29 |
) |
Transaction costs associated with pending merger |
|
|
— |
|
|
|
— |
|
|
|
186 |
|
|
|
1,064 |
|
Earnings before income taxes |
|
|
7,029 |
|
|
|
4,607 |
|
|
|
4,664 |
|
|
|
9,097 |
|
Net income |
|
|
6,057 |
|
|
|
4,132 |
|
|
|
5,606 |
|
|
|
9,083 |
|
Diluted earnings per share |
|
|
0.38 |
|
|
|
0.26 |
|
|
|
0.34 |
|
|
|
0.55 |
|
Fiscal 2009 |
|
|
|
|
|
|
|
|
|
|
|
|
|
|
|
|
Net sales |
|
$ |
31,070 |
|
|
$ |
23,961 |
|
|
$ |
23,438 |
|
|
$ |
24,058 |
|
Gross profit |
|
|
17,775 |
|
|
|
11,012 |
(1) |
|
|
12,485 |
|
|
|
13,825 |
|
Loss before income taxes |
|
|
(2,135 |
) |
|
|
(10,036 |
)(2) |
|
|
(2,825 |
) |
|
|
(4,394 |
)(3) |
Net loss |
|
|
(32,359 |
)(4) |
|
|
(10,279 |
) |
|
|
(3,426 |
) |
|
|
(4,440 |
) |
Diluted loss per share |
|
|
(2.07 |
) |
|
|
(0.66 |
) |
|
|
(0.22 |
) |
|
|
(0.28 |
) |
|
|
|
| (1) |
|
Included in gross profit in the second quarter of fiscal 2009 are $2,540 of charges for
inventory write downs and accelerated depreciation incurred in connection with the exit of the
S600 product line. |
| |
| (2) |
|
Included in loss before income taxes for the second quarter of fiscal 2009 are charges of
$2,540 described in (1) above, as well as additional severance charges of $2,242, $1,579 for
the write off of sales demonstration inventory, $341 for write down of fixed assets, and $38
for pension curtailment and lease termination charges. |
| |
| (3) |
|
Included in loss before income taxes for the fourth quarter of fiscal 2009 are severance
charges of $2,583, $128 due to an office consolidation, and $15 for pension curtailment. |
| |
| (4) |
|
Included in net loss is a valuation allowance of $29,967 taken on U.S. deferred tax assets in
the first quarter of fiscal 2009. |
ITEM 9 — CHANGES IN AND DISAGREEMENTS WITH ACCOUNTANTS ON ACCOUNTING AND FINANCIAL DISCLOSURE
None.
ITEM 9A — CONTROLS AND PROCEDURES
Evaluation of Disclosure Controls and Procedures
The Company has evaluated, under the supervision and with the participation of the Company’s Chief
Executive Officer and Chief Financial Officer, the design and operation of the Company’s disclosure
controls and procedures as of September 30, 2010, pursuant to Rule 13a-15(b) under the Securities
Exchange Act of 1934. Based on that evaluation, the Chief Executive Officer and Chief Financial
Officer have concluded that the Company’s disclosure controls and procedures are effective in
ensuring that information required to be disclosed in the reports it files or submits under the
Exchange Act is recorded, processed, summarized and reported, within the time periods specified in
the Securities and Exchange Commission’s rules and forms, and that information was accumulated and
communicated to the Company’s management, including the Chief Executive Officer and Chief Financial
Officer, as appropriate, to allow timely decisions regarding required disclosure.
53
Management’s Report on Internal Control over Financial Reporting
Management is responsible for establishing and maintaining adequate internal control over financial
reporting, as defined in Rule 13a-15(f) under the Exchange Act. Our internal control over financial
reporting is a process designed to provide reasonable assurance regarding the reliability of our
financial reporting and the preparation of financial statements for external purposes in accordance
with generally accepted accounting principles. Under the supervision and with the participation of
our management, including the Chief Executive Officer and Chief Financial Officer, we conducted an
evaluation of the effectiveness of our internal control over financial reporting based on the
framework in Internal Control — Integrated Framework issued by the Committee of Sponsoring
Organizations
of the Treadway Commission (COSO). Based upon the evaluation, management has concluded that our
internal control over financial reporting was effective as of September 30, 2010.
Because of its inherent limitations, internal control over financial reporting may not prevent or
detect misstatements. Also, projections of any evaluation of effectiveness to future periods are
subject to the risk that controls may become inadequate because of changes in conditions, or that
the degree of compliance with the policies or procedures may deteriorate.
PricewaterhouseCoopers LLP, our independent registered public accounting firm, has issued an
attestation report on internal control over financial reporting, which appears under Item 8 of this
Form 10-K.
Changes in Internal Control over Financial Reporting
There were no changes in our internal control over financial reporting during the Company’s most
recent quarter that have materially affected, or are reasonably likely to materially affect, our
internal control over financial reporting.
Chief Executive and Chief Financial Officer Certifications
The certifications of our Chief Executive Officer and Chief Financial Officer required under
Section 302 of the Sarbanes-Oxley Act have been filed as Exhibits 31(a) and 31(b) to this report.
ITEM 9B — OTHER INFORMATION
None.
PART III
|
|
|
| ITEM 10 |
|
— DIRECTORS, EXECUTIVE OFFICERS AND CORPORATE GOVERNANCE |
Directors and Executive Officers of the Registrant
Certain information regarding our executive officers is set forth under Part I, Item 1 above.
Certain information regarding our directors during fiscal year 2010 is set forth below. Each
of these directors resigned from the Company’s Board of Directors effective as of December 8, 2010,
the effective date of the merger.
| |
|
|
|
|
|
|
| Name |
|
Position |
|
Age |
|
Joseph P. Keithley
|
|
Chairman of the Board of Directors, President and Chief Executive Officer
|
|
|
61 |
|
Brian R. Bachman
|
|
Director since 1996
|
|
|
65 |
|
James B. Griswold
|
|
Director since 1989
|
|
|
64 |
|
Leon J. Hendrix, Jr.
|
|
Director since 1990
|
|
|
70 |
|
Brian J. Jackman
|
|
Director since 2005
|
|
|
69 |
|
Dr. N. Mohan Reddy
|
|
Director since 2001
|
|
|
57 |
|
Thomas A. Saponas
|
|
Director since 2006
|
|
|
61 |
|
Barbara V. Scherer
|
|
Director since 2004
|
|
|
54 |
|
54
Joseph P. Keithley was elected Chairman of the Board of Directors in February 1991. He was
elected Chief Executive Officer in November 1993, and President in May 1994. He has been a director
since 1986, and was elected Vice Chairman of the Board in February 1988. Mr. Keithley joined the
Company in 1976 and held various positions in production, customer service, sales and marketing
prior to being elected Vice President of Marketing in 1986. From 1986 until his election to Chief
Executive Officer in 1993, Mr. Keithley held various management positions within the Company. He is
Chairman of the Board of Nordson Corporation, a worldwide producer of precision dispensing
equipment and manufacturer of equipment used in the testing and inspection of electronic components
as well as technology-based systems for curing and surface treatment processes, and a director of
Brush Engineered Materials, Inc., which in an integrated producer of high performance specialty
engineered materials used in a variety of electrical, electronic, thermal and structural
applications. With over 34 years of service to the Company, including 24 years as both an executive
and director, Mr. Keithley brings valuable institutional and operational knowledge to the Board and
provides management perspective as the only director on the Board that is also employed by the
Company.
Brian Bachman is a private investor and has served as Managing Partner of River Farm LLC, an
agriculture and business consulting company, from September 2004 to the present. From 2000 until
2002, Mr. Bachman served as the Chief Executive Officer and Vice Chairman of Axcelis Technologies,
which produces equipment used in the fabrication of semiconductors. Mr. Bachman is a director of
Kulicke and Soffa Industries Inc., a supplier of equipment to the semiconductor assembly market,
and director of Trident Microsystems, a supplier of HD video processing integrated circuits (ICs)
for flat panel televisions and set top box. Mr. Bachman also served as a director of Ultra Clean
Holdings, Inc. from 2004 until 2009. With significant experience gained as a former executive
officer and through directorships of public companies in the electronics industry, including
service on our Board since 1996, Mr. Bachman brings valuable management and oversight experience
and industry knowledge to the Board.
James B. Griswold is the Chief Investment Officer of Danville Partners LLC, a private equity
firm, a position he has held since May 2007. Mr. Griswold is a retired Partner in the law firm of
Baker & Hostetler LLP, concentrating in the areas of mergers and acquisitions, venture capital,
financing business negotiations, and assisting entrepreneurs and high-growth companies. Through his
experience with similar companies, Mr. Griswold brings valuable cross-functional and strategic
analysis as well as legal and regulatory perspective to the Board.
Leon J. Hendrix, Jr. is a private investor. Mr. Hendrix served as Chairman of the Board of
Remington Arms Co., a manufacturer and marketer of firearms and ammunition, from 1997 until he
retired in June 2007. Mr. Hendrix was also a Principal of Clayton, Dubilier & Rice, Inc., a
private investment firm, from 1993 to 2000, Chief Operating Officer of Reliance Electric Company
from 1992 to 1993, Executive Vice President of Reliance from 1989 to 1992 and Vice President of
Corporate Development of Reliance from 1987 to 1989. Reliance Electric is now a part of Baldor
Electric Co., a worldwide manufacturer of industrial electric motors, drives and generators. Mr.
Hendrix serves as a director of Cambrex Corp., a provider of products and services to the life
sciences industries, and is also a member and past Chairman of the Board of Trustees of Clemson
University. Formerly holding a series of executive management level positions, Mr. Hendrix
provides valuable operational and governance knowledge to the Board.
Brian J. Jackman is the President of The Jackman Group, Inc., a management consulting
organization formed in 2005. From 1998 until his retirement in 2001, Mr. Jackman served as
President, Global Systems and Technology of Tellabs, Inc., which designs, deploys and services
optical networking, broadband access and voice-quality enhancement equipment for the
telecommunications industry. He also served as Tellab’s President of Operations from 1993 to 1998,
and held various sales and marketing positions during his tenure. Prior to joining Tellabs, Mr.
Jackman held various systems, sales and marketing positions with IBM Corporation, which
manufactures and markets advanced information processing products, including computer and
microelectronic technology, software and networking systems. Mr. Jackman is a director of PCTEL,
Inc., a leading supplier of products which simplify mobile connectivity, and Open Text™
Corporation, a provider of Enterprise Content Management solutions for global organizations. As a
former executive officer and director of technology and telecommunications companies, Mr. Jackman
brings valuable management expertise and industry knowledge to the Board.
Dr. N. Mohan Reddy is the Dean of the Weatherhead School of Management, Case Western Reserve
University, a position he has held since 2006. Dr. Reddy has been the Albert J. Weatherhead, III
Professor of Management since January 2007, Associate Professor of Marketing since 1991 and
Keithley Professor of Technology Management since 1996 at the Weatherhead School of Management,
Case Western Reserve University. Mr. Reddy also serves as a consultant to firms in the
electronics, semiconductor and telecommunications industries on commercializing new technologies
and marketing strategy implementation. Mr. Reddy is a director of Brush Engineered Materials, Inc.,
which through its subsidiaries supplies beryllium-containing products and other engineered
materials for end-use applications within the worldwide telecommunications and computer, automotive
electronics, industrial components, optical media, aerospace, defense and appliance markets. With
knowledge of and significant experience advising companies in industrial marketing and technology
product development, Dr. Reddy provides the Board valuable insight into operating a business
serving the global electronic and semiconductor manufacturing markets.
55
Thomas A. Saponas is a private investor and served as the Senior Vice President and Chief
Technology Officer of Agilent Technologies, Inc., a measurement solutions company, from April 1999
until he retired in October 2003. Prior to Agilent’s spin-off from Hewlett-Packard, Mr. Saponas was
Vice President and General Manager of Hewlett-Packard’s Electronic Instruments Group from June 1998
to April 1999. Mr. Saponas joined Hewlett-Packard in 1972 and held a number of other positions
prior to those listed. Mr. Saponas is a director of Procera Networks, a global provider of
networking infrastructure equipment. Drawing on his experience at public companies in the same
industry as the Company, Mr. Saponas brings valuable technological expertise to the Board.
Barbara V. Scherer is the Senior Vice President Finance & Administration and Chief Financial
Officer of Plantronics, Inc., a position she has held since 1998. She also served as Vice
President Finance & Administration and Chief Financial Officer of Plantronics from 1997 to 1998.
Plantronics is the leading provider of headsets to telephone companies and the business community
worldwide. Prior to joining Plantronics, Ms. Scherer held various executive management positions
spanning eleven years in the disk drive industry, was an employee with The Boston Consulting Group
and was a member of the corporate finance team at ARCO. With
significant financial management experience at technology companies, Ms. Scherer provides valuable
financial expertise and oversight to the Board.
Section 16(a) Beneficial Ownership Reporting Compliance
Section 16(a) of the Securities Exchange Act of 1934 requires Keithley’s executive officers,
directors and persons who own more than 10% of Keithley’s common shares to file reports of
ownership and changes in ownership with the Securities and Exchange Commission. These persons are
required to provide the Company with copies of all Section 16(a) forms that they file. Based solely
on the Company’s review of these forms and written representations from the executive officers and
directors, the Company believes that all Section 16(a) filing requirements were met during fiscal
year 2010.
Code of Business Conduct and Ethics
The Company has a Code of Business Conduct and Ethics that applies to all employees, executive
officers and directors of the Company, including the Company’s principal executive officer,
principal financial officer and principal accounting officer. The Code of Business Conduct and
Ethics includes provisions covering compliance with laws and regulations, insider trading
practices, conflicts of interest, confidentiality, protection and proper use of Company assets,
accounting and recordkeeping, fair competition and fair dealing, business gifts and entertainment,
payments to government personnel, and the reporting of illegal or unethical behavior. The Code of
Business Conduct and Ethics was posted under the “Investor Relations” section of our website at
www.keithley.com. Any waiver of any provision of the code granted to an executive officer or
director may only be made by the Board or a Committee of the Board authorized to do so.
Shareholder Recommendations of Director Candidates
The charter of the Nominating and Corporate Governance Committee of the Company’s Board of
Directors provides that the Committee shall make recommendations to the Board regarding director
nominations, including director candidates recommended by shareholders. There have been no changes
to the procedures by which shareholders may recommend nominees for the Board of Directors.
Audit Committee Members and Financial Expert
The Company’s Board of Directors had a standing Audit Committee, comprised of Barbara V.
Scherer (Chairman), Brian Bachman, Brian J. Jackman and James B. Griswold. The Board has
determined that Ms. Scherer is an audit committee financial expert within the meaning of Item 407
of Regulation S-K under the federal securities laws, and is independent applying the standards set
forth in the New York Stock Exchange listing standards.
ITEM 11 — EXECUTIVE COMPENSATION
Compensation Discussion and Analysis
This section describes the material elements of the Company’s compensation
objectives and policies and the application of these objectives and policies to the Company’s
executive officers, particularly the individuals named in the “Summary Compensation Table” set
forth below.
56
Executive Compensation Governance
The Compensation and Human Resources Committee (the “Committee”) of the Board of Directors is
responsible for reviewing and approving the Company’s executive compensation policies and
objectives, reviewing the performance of senior management, setting executive compensation, and
reviewing and approving the Company’s incentive compensation plans for senior management and equity
based compensation plans for all eligible employees. Additionally, the Committee reviews and
approves the amount and form of compensation to be paid to directors for serving on the Board of
Directors and its committees. The Committee meets at least quarterly and more frequently as
circumstances require. Members of the committee are independent directors under the listing
standards of the New York Stock Exchange, “non-employee directors” within the meaning of Rule 16b-3
promulgated under the Securities Exchange Act of 1934, as amended, and “outside directors” within
the meaning of Section 162(m) of the Internal Revenue Code of 1986, as amended.
The Committee has selected and retained Radford, a business unit of Aon Consulting, as an
independent consultant on compensation issues. The Committee engaged Radford to provide the
Committee peer group analysis, survey data and counsel on compensation trends and issues, including
compensation levels for officers and the Board of Directors, equity grants (both value and grant
terms), stock ownership guidelines and change in control benefits. The consultants report
directly to the Chairman of the Compensation and Human Resources Committee, although they also
provide advice and discuss compensation issues directly with management. The Committee has
available to it relevant data and information regarding all elements of compensation as it makes
its decisions regarding each element of compensation for the named executive officers. In fiscal
year 2010, Radford did not otherwise provide consulting or advisory services to the Company.
The Chief Executive Officer and Chief Operating Officer attend committee meetings by
invitation to provide input with respect to compensation and performance assessments of executive
officers. In addition, the Chief Financial Officer attends certain meetings by invitation to
provide input with respect to compensation plans. Consistent with the equity award grant policy
adopted by the Board, the Committee delegates to the Chief Executive Officer authority to grant a
limited number of equity awards as further described below under “— Equity Award Granting
Practices.”
Executive Compensation Philosophy
The Committee seeks to support a pay for performance culture through the Company’s executive
compensation programs with the following goals:
| |
• |
|
motivate executives to create shareholder value; |
| |
• |
|
align the executives’ and shareholders’ short-term and long-term interests; and |
| |
• |
|
attract, reward and retain high-performance executives. |
In particular, the Company’s compensation programs are designed to reward the achievement of
sales and earnings growth, quality of earnings and appreciation in the Company’s share price. The
Committee also endeavors to set compensation levels that are competitive with similarly sized
companies that are its direct competitors in the test and measurement industry as well as a broader
group of technology companies with which we compete for employees.
The Committee evaluates the Company’s compensation program at least annually to ensure that
compensation opportunities provided to key executives are competitive with the compensation
packages provided to similarly situated executives in the Company’s peer group and market surveys
of similarly sized technology companies based on revenue, number of employees and market
capitalization. The Committee also reviews whether the program motivates executives to take the
actions necessary to create shareholder value. The Committee seeks to foster a performance-oriented
environment by making a significant portion of each executive’s cash and equity compensation based
on the achievement of performance that the Committee believes will drive shareholder value
creation. While in fiscal year 2009, due to global economic conditions and their effect on the
Company and its industry, the Committee cancelled the cash bonus program for fiscal year 2009 and
awarded equity incentives in the form of stock options and restricted stock instead of performance
unit awards, due to the improvement in the Company’s results and sales forecasts, the Committee
returned to its past practice of establishing a cash bonus program and awarding performance unit
awards as part of its compensation program in fiscal 2010. In addition, during fiscal 2010, as the
Company began its process of seeking a buyer for the Company, the Committee also considered
retention and commitment to a successful sale process as another significant compensation
objective.
57
The Committee allocates total compensation between currently paid cash compensation and
long-term compensation. Although this allocation may vary from year to year, for fiscal year 2010
the allocation for Mr. Keithley, our Chief Executive Officer, or CEO, was 100% cash, of which 38%
of total compensation was base salary and 62% was performance based. The allocation for Ms. Rae,
our Chief Operating Officer, or COO, was approximately 80% cash and 20% long-term compensation.
For our other executive officers, the allocation ranged from approximately 78% to 84%
cash and 16% to 22% long-term compensation. The allocations are generally based on market
competitiveness and the impact that the Committee believes each executive has on the Company’s
long-term strategy. The executives with a greater impact on our long-term strategy and financial
performance generally receive a higher percentage of long-term compensation; however, as discussed
in more detail below, at Mr. Keithley’s suggestion, the equity awards that might otherwise have
been allocated to him were allocated to other employees due to burn rate constraints.
Executive Compensation Methodologies
The design of the Company’s executive compensation program has two principal aspects:
| |
• |
|
establishing an overall total targeted compensation amount for each individual
executive that is competitive within our industry; and |
| |
• |
|
establishing for each individual executive the appropriate mix of base salary, and
target bonus and equity incentive compensation tied to performance goals and the value
of our common shares. |
The Committee endeavors to set the sum of three components of our compensation program (base
salary, annual cash bonus and long-term stock awards), or total direct compensation, at median
levels for the executive’s position based on a review of peer group companies and two-broadly-based
compensation surveys as described more fully below. Health and welfare benefits are the fourth
component of our compensation program and are not considered part of total direct compensation, but
are driven by median market practice. The Committee targets executives’ compensation at the market
median for effective performance because it believes the median ensures that our compensation
program is sufficiently competitive to attract and retain talented executives and maintain external
pay equity. Further, our annual bonus and long-term incentive awards are typically structured to
offer above median total direct compensation for Company performance that exceeds target
performance. In addition, compensation decisions regarding specific individuals are impacted by
individual job performance, internal pay equity, Company performance and significant changes in the
competitive landscape for individuals possessing particular skills the Company requires. For
fiscal year 2010, global economic conditions and their impact on the Company’s performance and cash
position continued to factor into the Committee’s compensation decisions, as it balanced its usual
considerations against the need for the Company to maintain appropriate cost levels and the
challenges of setting performance targets in volatile market conditions.
The Committee annually reviews market information about executive compensation provided by
Radford, together with performance assessments of our executives and recommendations provided by
the CEO and COO (with the exception of Mr. Keithley for which no recommendation is made and Ms. Rae
whose recommendation is made solely by the CEO). Generally, the Committee seeks to set executive
officers’ base salaries to fall within a range of +/- 10% of the median of surveyed companies for
effective performance, target bonus (as a percentage of salary) at approximately median, and target
long-term compensation at median within the overall objective of targeting median total direct
compensation in total for each executive performing at an effective level. From year to year,
target long-term compensation may be constrained by the rate at which equity is issued under our
equity compensation plans, or “burn rate.” If the Company has above-average performance, actual
total compensation could exceed the median for total compensation for the surveyed companies in a
given year.
58
For fiscal year 2010, the Committee generally continued to follow these methodologies and also
considered how to account for the cost-cutting actions taken by the Company in fiscal 2009 in
response to the global economic downturn that included a Company-wide salary reduction (12% for
Messrs. Keithley and Plush and Ms. Rae and 10% for most other salaried personnel) and whether to
put in place compensation arrangements that would be triggered by a change in control of the
Company. In November 2009, the Committee established a fiscal year 2010 bonus plan that would pay
out only after Company-wide salaries and 401(k) plan match were reinstated and, in January 2010,
these items were reinstated. The Committee also acknowledged that the limitation of maintaining a
burn rate that is consistent with proxy advisory firm preferences would restrict the Company’s
ability to provide equity awards that were at market median levels and offered appropriate
incentives to its employees, including the executive officers. Seeking to stay below a certain
burn rate can reduce the number of shares that can be subject to awards and, when the Company’s
share price is also low, result in low aggregate equity compensation. To aid in striking a balance
between these considerations, the Committee accepted Mr.
Keithley’s recommendation that he not receive any equity awards, and the shares that may have been
allocated to him were instead used to compensate other employees. These factors, among others
discussed in more detail below, such as the maximum bonus payout, resulted in total compensation
for the named executive officers, other than Mr. Keithley, that was above the market median and, for Mr. Keithley, was at market median.
In determining what it believes to be market median for executive positions, the Committee
obtains market information from Radford regarding competitive market compensation data available
from the proxy statements of peer group companies selected by the Committee and from two
broad-based electronics industry surveys. The Committee reviews the peer group each year to ensure
that it continues to be comprised of companies appropriate for purposes of comparison. Generally,
the Committee establishes the peer group so that, based on revenues, the Company rank is near the
50th percentile. To achieve this result for fiscal year 2010, the Committee had to
remove several companies from last year’s list due to mergers and acquisitions. The peer group for
fiscal year 2010 consists of the following publicly traded corporations, which are among those that
we compete with for employees with similar skills:
| |
|
|
|
|
|
|
|
•
|
|
Cascade Microtech, Inc.
|
|
•
|
|
Cohu, Inc. |
•
|
|
Electro Scientific Industries, Inc.
|
|
•
|
|
EXFO Electro-Optical Engineering Inc. |
•
|
|
FARO Technologies, Inc.
|
|
•
|
|
Intevac, Inc. |
•
|
|
Ixia
|
|
•
|
|
LeCroy Corporation |
•
|
|
LTX-Credence Corporation
|
|
•
|
|
Mattson Technology, Inc |
•
|
|
Nanometrics Incorporated
|
|
•
|
|
Rudolph Technologies, Inc. |
•
|
|
Symmetricom, Inc.
|
|
•
|
|
Tollgrade Communications, Inc. |
•
|
|
X-Rite, Incorporated
|
|
•
|
|
Zygo Corporation |
In addition, Radford supplemented the peer group data with data from two broad-based surveys
covering companies in the electronics industry with revenue generally between $50 and $250 million
to calculate a median consisting of a blended average of the two broad-based surveys and data from
the peer group. The Committee uses the blended average to minimize the impact of any outlaying
data points and because, in certain circumstances, the companies in the peer group do not have
proxy data for similarly situated executive positions that can be used for comparison to one or
more of our executives.
Our management works with Radford to make specific recommendations to the Committee with
regard to compensation based upon the market data and management’s assessment of the performance of
each individual executive officer (other than the CEO). Compensation amounts realized from past
years and prior year equity awards are generally not considered in the current year’s determination
of each individual’s compensation package. The impacts of tax or accounting treatments for
particular forms of compensation also are generally not considered, except to the extent they
reflect industry norms. For the CEO’s compensation, the Lead Director and the Chairman of the
Committee lead an assessment by the independent directors of the CEO’s performance. Each
independent director is asked to provide a confidential written assessment of the CEO to the Lead
Director and to the Chairman of the Committee. The Chairman of the Committee then prepares a
consolidated review, which is distributed to the Lead Director, and then to the independent
directors for comment. Based on this assessment and the market data, the Committee sets the CEO’s
compensation, and discusses its recommendations with the independent directors. This process was
modified beginning with the establishment of the CEO’s fiscal year 2010 compensation, with the Lead
Director taking the primary role in soliciting and consolidating the assessments by the other
independent directors.
59
All salary changes for executive officers are generally made effective each January 1 and base
pay levels and long-term incentive awards are generally determined and approved near the end of the
calendar year at a regularly scheduled Committee meeting. The date is determined well in advance
and generally occurs at the same time each year (in November) in connection with regularly
scheduled Board and Committee meetings. For fiscal year 2010, as noted above, salaries were
increased in January 2010 just to restore the January 2009 levels, and no further increases were
made to the executive officers’ salaries. The bonus plan structure, which is based on return on
sales, and preliminary annual bonus targets were reviewed at the Committee meetings held in August
and September 2009, and final annual bonus targets were reviewed and approved at a meeting in
November 2009. At these meetings, the Committee also reviewed the
burn rate and type of equity awards and allocation among such types to be made to the named
executive officers, as well as the performance targets and related assumptions and calculations for
the Performance Award Unit Program. The Committee approved the Performance Award Unit Program and
the equity awards to executive officers at a December 2009 meeting, rather than the November
meeting, due to the pending announcement of the sale of the Company’s radio frequency (or RF)
product line.
Elements of Executive Compensation
The Company’s executive compensation program provides the named executive officers with the
elements of compensation described below.
Base Salary
Executive officers’ base salaries are benchmarked against the market median of the proxy data
and the surveys discussed above. In general, for those executive officers who are not new to their
positions and who are performing in an effective manner, their salaries are targeted to the market
median. Performing in an effective manner means that the executive produces expected results,
meets business objectives, demonstrates growth and is consistent with median performance of any
possible peer comparisons with regard to accomplishments, skills, knowledge, demonstration of
results and key values. The Committee typically considers salary increases based upon individual
experience and performance and to ensure the Company’s compensation remained competitive with
market movements for individuals with similar skills and experience in similar industries, with a
target percentage for each of these individuals within a range of 10% of median.
The following table sets forth the annualized base salary and the percentage increase for each
named executive officer for fiscal year 2010.
| |
|
|
|
|
|
|
|
|
|
|
|
|
| |
|
|
|
|
|
% Increase Over 2009 Base |
|
|
% Increase Over 2008 |
|
| Named Executive Officer |
|
Annual Base Salary |
|
|
Salary (1) |
|
|
Base Salary (1) |
|
Joseph P. Keithley |
|
$ |
425,184 |
|
|
|
14 |
% |
|
|
0 |
% |
Mark J. Plush |
|
$ |
255,589 |
|
|
|
14 |
% |
|
|
0 |
% |
Linda C. Rae |
|
$ |
275,015 |
|
|
|
14 |
% |
|
|
0 |
% |
Larry L. Pendergrass |
|
$ |
224,000 |
|
|
|
11 |
% |
|
|
0 |
% |
Daniel A. Faia |
|
$ |
250,008 |
|
|
|
0 |
% |
|
|
0 |
% |
|
|
|
| (1) |
|
The increase reflects the reinstatement, effective January 1, 2010, of salaries in effect
prior to the Company-wide salary reductions implemented on January 1, 2009. Mr. Faia joined
the Company in February 2009 and, therefore, had not been subject to the salary reductions. |
60
Annual Bonus Program under the Annual Incentive Compensation Plan
The Committee typically determines target bonus awards under the Company’s Annual Incentive
Compensation Plan, which are expressed as a percentage of base salary, for each executive officer
based on the blended average market median discussed above determined by Radford for similar
positions. The target bonus amounts are determined by the Committee, with consideration of the
CEO’s recommendations (other than with respect to his own). Given the timing of salary increases,
the prior year’s base salaries are usually used for determining target bonus awards in the current
fiscal year Annual Incentive Compensation Plan. For each executive, the Committee establishes a
performance threshold and target and a level at which the executive’s maximum bonus is earned.
Awards under the plan are paid based upon actual performance against the pre-established
performance objectives for the year approved by the Committee. For Company performance at or below
threshold performance, no bonus is earned. If Company performance is above threshold, payouts
progress up to a maximum of two times the target bonus amount established for each executive.
The Committee evaluates the performance factors and targets for the Annual Incentive
Compensation Plan each
year. The Committee does not necessarily establish the performance targets based on
management’s operating plan, but rather on performance levels that the Committee believes promotes
Company growth without sacrificing quality of earnings or providing an incentive to executives to
engage in risky business activities. For fiscal year 2010, the Committee approved an Annual
Incentive Compensation Plan with a design different from prior years to also address the need to
balance the Company’s cash position against performance incentives. The plan provided that for
each fiscal quarter in fiscal year 2010, 25% of the amount by which the Company’s Return on Sales
(as defined below) exceeded 5% would be contributed to a bonus pool (the “Bonus Pool”) to be
divided among participants in accordance with the percentage of the Bonus Pool specified in such
participant’s award. “Return on Sales” is defined as pre-tax earnings divided by net sales
(excluding special items as approved by the Committee in its sole discretion). No funds were to be
allocated to the Bonus Pool during a quarter unless the Company had restored its salaries and
401(k) plan match to at least the levels in place immediately prior to January 1, 2009. Each
quarter, the percentage of total bonus was to be calculated based on the current participants at
quarter end. As of the end of fiscal year 2010, the aggregate amount accumulated in the Bonus Pool
was payable to the participants in accordance with such participant’s award and the other terms and
conditions of the Plan.
Bonus payouts under the Annual Incentive Compensation Plan are calculated at the end of each
fiscal year and are paid annually in cash unless the employee has made a deferral election. Company
performance in fiscal year 2010 resulted in a Return on Sales of 20%. As a result, the bonuses for
the executive officers represented their maximum payout amounts.
The following table shows the annual bonus target under the Annual Incentive Compensation
Plan, both as a percentage of salary and as a dollar amount for each named executive officer for
fiscal 2010:
| |
|
|
|
|
|
|
|
|
|
|
|
|
| Named Executive |
|
Annual Bonus Target as a |
|
|
|
|
|
|
|
| Officer |
|
Percentage of Salary |
|
|
Annual Bonus Target ($) |
|
|
Actual Bonus Payout ($) |
|
Joseph P. Keithley |
|
|
80 |
% |
|
$ |
340,147 |
|
|
$ |
680,294 |
|
Mark J. Plush |
|
|
50 |
% |
|
$ |
127,795 |
|
|
$ |
255,590 |
|
Linda C. Rae |
|
|
60 |
% |
|
$ |
165,008 |
|
|
$ |
330,016 |
|
Larry L. Pendergrass |
|
|
40 |
% |
|
$ |
89,600 |
|
|
$ |
179,200 |
|
Daniel A. Faia |
|
|
65 |
% |
|
$ |
162,505 |
|
|
$ |
325,010 |
|
Long-Term Compensation Program
The purpose of the Company’s long-term incentive compensation program is to provide a
substantial equity incentive for our executive officers to manage the business for the long-term,
complementing the annual bonus that rewards performance in a particular year, and to reward them
for the performance of the Company and its enterprise value over multi-year periods.
61
The Committee annually has awarded long-term compensation in the form of non-qualified stock
options, performance award units and restricted stock units. Stock options typically vest as to
50% of the shares two years from the grant date, with an additional 25% vesting each year
thereafter. Restricted stock units vest and are settled by the issuance of common shares on the
fourth anniversary of the grant date. Performance award units entitle the executive to receive a
specified number of Common Shares if performance goals have been achieved as of the end of a
three-year period. In fiscal year 2009, the Committee did not establish a Performance Award Unit
Program, but made a subsequent award of stock options to key employees other than Mr. Keithley.
This was due to the strategic decisions the Company would likely be facing during fiscal year 2009
to address the industry downturn, and potential costs and uncertainty that could accompany these
decisions, which made it difficult to set performance metrics for equity awards that would serve as
an appropriate incentive during the course of the performance period. For fiscal year 2010, the
Committee awarded a combination of stock options, restricted stock units or performance award
units. The allocation was based on the targeted aggregate amount of compensation, retention goals
and the executives’ ability to impact the Company’s execution of its long-term plans, and
therefore, the greater emphasis on pay for performance that each type of award provides.
Mr. Keithley did not receive any equity awards for fiscal year 2010 so that these awards could
be allocated to other employees. Ms. Rae and Mr. Plush received a split between stock options and
performance award units that reflected an allocation of 1/3 of the aggregate award value in options
and 2/3 of the aggregate value in performance award units. The other executive officers received
1/3 of their award value in each of stock options, performance award units and restricted stock
units.
The performance award units awarded by the Committee for fiscal year 2010 have a performance
period that began on the grant date of December 4, 2009 and ends on September 30, 2012. The
performance measure for the award is the Company’s Total Shareholder Return (TSR) growth rate
compared to that of companies in the Russell Microcap Index. If there are changes in the companies
that are included in the index as of the beginning of the measurement period compared to the end of
the measurement period, for example, as a result of acquisitions, mergers, bankruptcies or going
private transactions, that have a significant impact on the resulting TSR growth rate, the
Committee in its sole discretion may exclude the impact of one or more of such companies’ TSR from
the index group.
The common shares subject to the performance award units will be earned and issued at the
target (100%) payout amounts if the Company’s TSR growth rate is at the median of the companies in
the index. Actual payout percentages will be based on a linear slope with a minimum payout
threshold at the 25th percentile and maximum payout of 200% of target at the 75th percentile. Each
percentile increase above the 25th will equate to a 4% payout increase, as demonstrated in the
table below.
| |
|
|
|
|
|
|
|
|
|
|
|
|
|
|
|
|
|
|
|
|
|
|
|
|
| The Company’s |
|
|
|
|
|
|
|
|
|
|
|
|
|
|
|
|
|
|
| TSR Growth Rate |
|
|
|
|
|
|
|
|
|
|
|
|
|
|
|
|
|
|
| Percentile |
|
0 – < 25th |
|
|
> 25th
– < 35th |
|
|
> 35th
– <50th |
|
|
> 50th
– < 65th |
|
|
> 65th
– < 75th |
|
|
> 75th
– < 100th |
|
% Payout of Target |
|
|
0 |
% |
|
|
4% – 40 |
% |
|
|
44% – 100 |
% |
|
|
104% – 160 |
% |
|
|
164% – 200 |
% |
|
|
200 |
% |
The Committee has not established any long-term incentive programs that are settled in
cash because the Committee believes that stock settled programs offer better alignment between the
interests of our executive officers and our shareholders. In fiscal year 2009, the Committee
established guidelines for the 10-year retention of a portion of the restricted stock unit awards
as part a change in its long-term compensation philosophy. See “—Company Stock Ownership
Guidelines.”
Radford establishes a median dollar value for competitive long-term pay for each executive
officer position based on the blended average market median described above. As noted above,
because of the burn rate constraints, the Company was not able to provide market median long-term
compensation values to employees in fiscal 2010, and Mr. Keithley did not receive any equity
awards. As a result, the Committee awarded a mix of equity awards with a targeted value below the
market median for each position, with adjustments for individual performance.
62
The following table shows the median total dollar amount of the long-term compensation as
determined by Radford for each executive officer, the actual number of stock options, performance
award units and restricted stock units granted to each named executive officer in fiscal year 2010,
and the total dollar value of long-term awards granted for fiscal year 2010.
| |
|
|
|
|
|
|
|
|
|
|
|
|
|
|
|
|
|
|
|
|
| |
|
Median Target |
|
|
|
|
|
|
|
|
|
|
Number of |
|
|
Dollar Value |
|
| |
|
Dollar Value of the |
|
|
Number of |
|
|
Number of |
|
|
Restricted |
|
|
of Long-term |
|
| |
|
Long-Term |
|
|
Stock Options |
|
|
Performance |
|
|
Stock |
|
|
Incentives |
|
| |
|
Compensation as |
|
|
Awarded in |
|
|
Award Units |
|
|
Granted in |
|
|
Awarded in |
|
| Named Executive |
|
determined by |
|
|
Fiscal Year |
|
|
Granted in |
|
|
Fiscal Year |
|
|
Fiscal Year |
|
| Officer |
|
Radford |
|
|
2010 |
|
|
Fiscal Year 2010 |
|
|
2010 |
|
|
2010 (1) |
|
Joseph P. Keithley |
|
$ |
331,000 |
|
|
|
— |
|
|
|
— |
|
|
|
— |
|
|
|
— |
|
Mark J. Plush |
|
$ |
149,400 |
|
|
|
22,250 |
|
|
|
22,250 |
|
|
|
— |
|
|
$ |
141,230 |
|
Linda C. Rae |
|
$ |
151,100 |
|
|
|
25,350 |
|
|
|
25,350 |
|
|
|
— |
|
|
$ |
160,907 |
|
Larry L. Pendergrass |
|
$ |
100,800 |
|
|
|
13,200 |
|
|
|
6,600 |
|
|
|
4,400 |
|
|
$ |
74,414 |
|
Daniel A. Faia |
|
$ |
134,100 |
|
|
|
18,850 |
|
|
|
9,450 |
|
|
|
6,300 |
|
|
$ |
106,442 |
|
|
|
|
| (1) |
|
For this purpose, performance award units and restricted stock award units are valued at the
share price at the time of the grant, and stock options are valued at the time of the grant,
based on a Black-Scholes model that represents about 49% of the stock price at the date of
grant. For additional detail about our equity awards and the accounting for them, see the
“Grants of Plan-Based Awards for Fiscal Year 2010” and the “Outstanding Equity Awards at
September 30, 2010” tables below. |
The three-year performance period for awards granted under the Company’s Performance
Award Unit Program in fiscal year 2008 was completed at the end of fiscal year 2010. The Committee
reviewed the award payouts under the program in November 2010 and reviewed the revenue growth of
the peer companies compared to the Company’s revenue growth for the relevant three-year period that
ended June 30, 2010. In addition, the Committee reviewed the Company’s average ROA and average
ROIC for the three-year period that ended September 30, 2010. It was determined, based on the
Company’s performance, that Mr. Keithley, Mr. Plush and Ms. Rae had earned a payout of 125% of the
initial award value based on the ROIC target and that the other executive officers had earned a
payout of 100% of the initial award value based on the ROA target.
Change in Control Severance Benefits
During fiscal 2010, the Company engaged in a process to identify a buyer for the Company,
which resulted in the execution of a merger agreement with Danaher Corporation, or Danaher, on
September 29, 2010. The process spanned many months and required a significant commitment from the
Company’s executive officers to reach a successful conclusion. The Committee recognized the need
for the management team’s effort and determined, with the advice of Radford, that the Company
should enter into change in control agreements with the executive officers other than Mr. Plush and
Mr. Keithley and an amended employment agreement with Mr. Plush, and the Board determined to enter
into a change in control agreement with Mr. Keithley, to retain and motivate these individuals
through the sale process. The Committee considered the severance arrangements established by the
Company’s peers and others to set severance benefit levels that it felt were comparable with
general market practice. The terms of these agreements, which are described in more detail under
“Potential Payments Under Employment Termination, Death or Change in Control — Change in Control
Agreements” and “—Amended Employment Agreement with Mr. Plush,” generally provide for the payment
of a severance package upon termination of employment by the Company without cause or by the
executive for good reason within the two year (or in the case of Mr. Plush, three year) period
following a change in control.
Health and Welfare
The Committee reviews the benefits provided to executive officers annually. Periodically, it
compares the value of these benefits to market data provided by Radford to ensure that these
benefits and their value are reasonable and customary.
63
The Committee has provided named executive officers with the same health and welfare benefits
it provides all its other U.S. based employees, including: medical, dental and vision coverage,
life and disability insurance, a defined benefit pension plan, a defined contribution plan and an
employee stock purchase plan. In addition, the Company provides each employee with term life
insurance with death benefits equal to two times base salary, although executive officers, at their
option, may receive whole life insurance rather than term life insurance.
Retirement Plans
The Company provides opportunities for all employees to save for retirement in three benefit
plans: a voluntary defined contribution plan (401(k)), a company funded defined benefit pension
plan and an employee stock purchase plan. These plans are designed to provide competitive
retirement benefits. The Committee determined that the annual cost to the Company of the 401(k)
and defined benefit pension plans approximated the median contributions of similarly situated
companies for combined employee savings/retirement programs.
401(k). The Company maintains a defined contribution retirement plan for all its
eligible employees in the United States under Section 401(k) of the Internal Revenue Code (the
“401(k) Plan”).
The 401(k) Plan offers the named executive officers and all other employees the opportunity to
defer income. In years prior to fiscal year 2009, the Company made a mandatory matching
contribution to each employee equal to 25% of up to 6% compensation deferred by the employee, and
was to match up to 50% of up to 6% of compensation deferred depending upon the Company’s financial
performance. In December 2008, the Company determined to suspend its matching contributions in
response to the rapid deterioration in global economic and industry conditions. The match was
reinstated as of January 1, 2010. The rules of the Internal Revenue Code limit the compensation
that may be used in applying any deferral election or matching contribution. In 2010, that limit
was $16,500 the (“IRS Cap”). In addition, the 401(k) Plan limits contributions to 25% of an
employee’s base pay or the IRS Cap, whichever is less. The Company does not provide a tax-deferred
non-qualified plan which would allow employees in excess of the IRS Cap to defer and receive a
match on that portion of their compensation that does not qualify for the 401(k) Plan.
Defined Benefit Pension Plan. The Company’s United States pension plan provides
retirement benefits to eligible participants who terminate employment at or after age 65, or who
terminate employment before age 65 with at least five years of service. Benefits commence after
termination of employment, but not before age 55. Retirement benefits are computed on the basis of
pension credits for each year of the employee’s service. Generally, an employee’s pension credits
will be equal to the sum of (i) 0.9% of the employee’s high five-year average annual compensation,
not in excess of the employee’s Social Security “covered compensation” (as defined by Section
401(I)(5)(E) of the Internal Revenue Code) as of September 30, 1999, plus 1.5% of such average
annual compensation in excess of “covered compensation,” with such sum multiplied by the employee’s
years of credited service (up to 30 years) through September 30, 1999; plus (ii) 1.2% of the
employee’s annual compensation for each plan year beginning on or after October 1, 1999. The annual
retirement benefit (paid as a straight life annuity) of an average employee who works until normal
retirement age will equal approximately 20-25% of his or her final pay at age 65. Several factors
would impact the amount of the retirement benefit including leaving employment prior to normal
retirement age or receiving wages that exceed the compensation limit for qualified pension plans.
The Company does not maintain any supplemental retirement plans in which any named executive
officer participates.
Employee Stock Purchase Plan. The Company provides an Employee Stock Purchase Plan to
all eligible employees, including named executive officers. The plan provides that an employee may
defer up to $25,000 per calendar year into the plan. The plan purchases shares with monies
deferred once a year giving each plan participant a 5% discount on the share price. The share
price is determined by the closing share price on the last day of the plan year which is June 30.
The plan was suspended as of June 30, 2010 and terminated as of the closing of the merger with
Danaher.
64
Perquisites
The Company provides executive officers with a Company car, a cell phone, access to financial
planning services, and access to a health club membership. Executive officers other than Mr.
Keithley receive whole life insurance equal to two times their annual salary (in lieu of term
insurance that is available to other employees and received by Mr. Keithley). In addition, to
assist the Company in conducting business meetings and/or entertainment, the Company pays the cost
of certain club dues for the CEO. Although the CEO may derive some personal benefit from the club
use, the membership is used extensively for business purposes and he pays all expenses of his
personal use.
Other Change in Control and Severance Arrangements
Upon a change in control as defined in the Keithley Instruments, Inc. 2002 Stock Incentive
Plan and 2009 Stock Incentive Plan, all stock options and any outstanding stock appreciation rights
granted under the plans become immediately exercisable in full and all restricted stock grants,
including restricted stock units and performance award units, become immediately vested and any
applicable restrictions lapse. Performance award units vest at target levels. The Company does not
have a formal severance policy, and the Committee must review and approve the severance of any
officer. With the exception of Mr. Plush, no executive officer has a separate agreement providing
for severance benefits not in connection with a change in control.
Equity Award Granting Practices
The Committee’s typical practice has been to grant long-term incentive awards (options,
performance award units and restricted stock units) at its November meeting held during the
Company’s first fiscal quarter. The Board of Directors adopted a formal policy regarding the
granting of equity awards in December 2006, which was amended in August 2009, and provides for the
following:
| |
• |
|
All options will be made in accordance with the 2002 Stock Incentive Plan, 2009 Stock
Incentive Plan or any successor plan. |
| |
• |
|
All awards will be granted by the Committee, except for stock options, performance
unit awards, restricted stock or restricted stock units to be granted by the CEO
pursuant to specifically delegated authority, including inducement grants to new hires,
retention grants and promotion grants, which may not exceed a certain number of shares
per fiscal year as established by the Committee. The CEO’s delegated authority does not
include any grants to executive officers, which is retained solely by the Committee. |
| |
• |
|
All annual grants will generally be made at a Committee meeting held in conjunction
with the first regularly scheduled Board meeting of the fiscal year, which will
generally be scheduled to occur shortly after the announcement of fiscal year-end
earnings. As discussed above, in fiscal year 2010, the Committee deferred
consideration of annual equity grants at its December 2010 meeting due to the pending
announcement of the sale of the Company’s RF business. |
| |
• |
|
Annual grants will have a grant date of the approval date and will have an exercise
price of the NYSE closing price on the date of approval or the next trading day after
the date of approval if the approval date is not a trading date. |
| |
• |
|
Any off-cycle award (awards to new hires or in connection with a promotion or other
special recognition) made by either the Committee or the CEO will have a grant date of
the third trading day following the next release of annual or quarterly earnings and an
exercise price equal to the closing price of the NYSE closing price on the grant date. |
65
In addition, all long-term equity incentive awards are subject to forfeiture, set off and
recoupment for certain claims that the Company may have against an award recipient within a
three-year period following the end of the recipient’s employment with the Company. These claims
include:
| |
• |
|
direct or indirect disclosure of trade secret or confidential information; |
| |
• |
|
use of confidential information within the three years preceding the recipient’s
termination from employment with the Company; |
| |
• |
|
any material violation by the optionee of the terms of any written agreement between
the recipient and the Company; |
| |
• |
|
any act of embezzlement, fraud or breach of fiduciary duty during the recipient’s
employment with the Company that contributed to a restatement of the Company’s financial
statements; |
| |
• |
|
any act of embezzlement, fraud, dishonesty, nonpayment of any obligation to the
Company, breach of fiduciary duty or deliberate disregard of Company rules resulting in
a loss, damage or injury to the Company; or |
| |
• |
|
any attempt to induce any Company employee or any consultant of the Company to
terminate his or her employment or other contractual relationship with the Company. |
These rights of forfeiture, set off and recoupment extend to any gain, profit and income a
recipient has realized from awards granted in 2007 or later, net of amounts withheld by the Company
in connection with any exercise(s), within the 36-month period prior to the violation.
Company Stock Ownership Guidelines
The Committee adopted a Share Ownership Program which requires executive officers who receive
restricted stock units under the long-term incentive program to hold some portion of the vested
after-tax award for a period of ten years or termination from the Company. The percentages of
after-tax amounts to be held are as follows:
| |
|
|
|
|
| Job Title |
|
% of Restricted Grant (after tax) to be Held |
|
CEO |
|
|
100 |
% |
COO |
|
|
75 |
% |
CFO |
|
|
75 |
% |
Vice President |
|
|
50 |
% |
Compensation Committee Report
The Compensation Committee has reviewed and discussed the foregoing Compensation Discussion
and Analysis with the Company’s management. Based on the review and discussions referred to above,
the Compensation Committee recommended to the Company’s Board of Directors that the Compensation
Discussion and Analysis be included in this Annual Report on Form 10-K for the fiscal year ended
September 30, 2010.
Compensation and Human Resources Committee(1)
Brian R. Bachman, Chairman
Leon J. Hendrix, Jr.
Dr. N. Mohan Reddy
Thomas A. Saponas
|
|
|
| (1) |
|
Until the closing of the merger on December 8, 2010. |
66
Summary Compensation Table
The following table sets forth information concerning the compensation for our Chief Executive
Officer and Chief Financial Officer, as well as the three next highest paid executive officers of
the Company during fiscal year 2010 (collectively, the “Named Executive Officers”).
| |
|
|
|
|
|
|
|
|
|
|
|
|
|
|
|
|
|
|
|
|
|
|
|
|
|
|
|
|
|
|
|
|
|
|
|
|
| |
|
|
|
|
|
|
|
|
|
|
|
|
|
|
|
|
|
|
|
|
|
|
|
|
|
Change in |
|
|
|
|
|
|
|
| |
|
|
|
|
|
|
|
|
|
|
|
|
|
|
|
|
|
|
|
|
|
|
|
|
|
Pension Value |
|
|
|
|
|
|
|
| |
|
|
|
|
|
|
|
|
|
|
|
|
|
|
|
|
|
|
|
|
|
Non-Equity |
|
|
and Nonqualified |
|
|
All |
|
|
|
|
| |
|
|
|
|
|
|
|
|
|
|
|
|
|
Stock |
|
|
Option |
|
|
Incentive Plan |
|
|
Compensation |
|
|
Other |
|
|
|
|
| |
|
Year |
|
|
Salary |
|
|
Bonus |
|
|
Awards(1) |
|
|
Awards(1) |
|
|
Compensation(2) |
|
|
Earnings(3) |
|
|
Compensation(4) |
|
|
Total |
|
Joseph P. Keithley |
|
|
2010 |
|
|
$ |
412,429 |
|
|
|
— |
|
|
$ |
— |
|
|
$ |
— |
|
|
$ |
680,294 |
|
|
$ |
135,625 |
|
|
$ |
50,044 |
|
|
$ |
1,278,392 |
|
Chairman, President |
|
|
2009 |
|
|
|
386,918 |
|
|
|
— |
|
|
|
— |
|
|
|
— |
|
|
|
— |
|
|
|
125,306 |
|
|
|
50,564 |
|
|
|
562,788 |
|
and CEO |
|
|
2008 |
|
|
|
425,184 |
|
|
|
— |
|
|
|
176,016 |
|
|
|
115,061 |
|
|
|
— |
|
|
|
11,182 |
|
|
|
54,315 |
|
|
|
781,758 |
|
|
|
|
|
|
|
|
|
|
|
|
|
|
|
|
|
|
|
|
|
|
|
|
|
|
|
|
|
|
|
|
|
|
|
|
|
|
Mark J. Plush |
|
|
2010 |
|
|
$ |
247,921 |
|
|
|
— |
|
|
$ |
149,743 |
|
|
$ |
46,520 |
|
|
$ |
255,590 |
|
|
$ |
98,665 |
|
|
$ |
35,581 |
|
|
$ |
834,020 |
|
Senior Vice President and |
|
|
2009 |
|
|
|
232,586 |
|
|
|
— |
|
|
|
13,754 |
|
|
|
29,065 |
|
|
|
— |
|
|
|
88,705 |
|
|
|
33,830 |
|
|
|
397,940 |
|
Chief Financial Officer |
|
|
2008 |
|
|
|
255,589 |
|
|
|
— |
|
|
|
87,552 |
|
|
|
38,153 |
|
|
|
— |
|
|
|
12,292 |
|
|
|
35,320 |
|
|
|
428,906 |
|
|
|
|
|
|
|
|
|
|
|
|
|
|
|
|
|
|
|
|
|
|
|
|
|
|
|
|
|
|
|
|
|
|
|
|
|
|
Linda C. Rae |
|
|
2010 |
|
|
$ |
266,764 |
|
|
|
— |
|
|
$ |
170,606 |
|
|
$ |
53,001 |
|
|
$ |
330,018 |
|
|
$ |
37,005 |
|
|
$ |
29,096 |
|
|
$ |
886,490 |
|
Executive Vice President |
|
|
2009 |
|
|
|
250,263 |
|
|
|
— |
|
|
|
15,548 |
|
|
|
32,765 |
|
|
|
— |
|
|
|
32,699 |
|
|
|
22,863 |
|
|
|
354,138 |
|
and Chief Operating Officer |
|
|
2008 |
|
|
|
275,015 |
|
|
|
— |
|
|
|
88,464 |
|
|
|
57,981 |
|
|
|
— |
|
|
|
59 |
|
|
|
35,181 |
|
|
|
456,700 |
|
|
|
|
|
|
|
|
|
|
|
|
|
|
|
|
|
|
|
|
|
|
|
|
|
|
|
|
|
|
|
|
|
|
|
|
|
|
Larry L. Pendergrass |
|
|
2010 |
|
|
$ |
218,400 |
|
|
|
— |
|
|
$ |
63,162 |
|
|
$ |
27,598 |
|
|
$ |
179,200 |
|
|
$ |
38,836 |
|
|
$ |
21,516 |
|
|
$ |
548,712 |
|
Vice President, |
|
|
2009 |
|
|
|
207,200 |
|
|
|
— |
|
|
|
17,342 |
|
|
|
18,390 |
|
|
|
— |
|
|
|
29,991 |
|
|
|
19,992 |
|
|
|
292,915 |
|
New Product Development |
|
|
2008 |
|
|
|
221,793 |
|
|
|
— |
|
|
|
57,456 |
|
|
|
24,935 |
|
|
|
— |
|
|
|
8,967 |
|
|
|
27,452 |
|
|
|
340,603 |
|
|
|
|
|
|
|
|
|
|
|
|
|
|
|
|
|
|
|
|
|
|
|
|
|
|
|
|
|
|
|
|
|
|
|
|
|
|
Daniel A. Faia(5) |
|
|
2010 |
|
|
$ |
250,008 |
|
|
|
— |
|
|
$ |
90,437 |
|
|
$ |
39,411 |
|
|
$ |
325,010 |
|
|
$ |
17,554 |
|
|
$ |
2,525 |
|
|
$ |
724,945 |
|
Vice President, |
|
|
2009 |
|
|
|
166,672 |
|
|
|
— |
|
|
|
— |
|
|
|
78,245 |
|
|
|
— |
|
|
|
23,881 |
|
|
|
100,000 |
|
|
|
368,798 |
|
Worldwide Sales & Support |
|
|
2008 |
|
|
|
— |
|
|
|
— |
|
|
|
— |
|
|
|
— |
|
|
|
— |
|
|
|
— |
|
|
|
— |
|
|
|
— |
|
|
|
|
| (1) |
|
The amount reported represents the grant date fair value of stock options, performance
award units and restricted stock units awarded during fiscal year 2010 under the Company’s
long-term compensation program and, more specifically, under the Company’s 2002 Stock
Incentive Plan. See the Grants of Plans Based Awards for Fiscal 2010 table below and Note I of
Notes to Consolidated Financial Statements included in Part II — Item 8 of this Annual Report
on Form 10-K for fiscal year 2010 (“Form 10-K”) for information on the grant date fair value
of each award and a description of the assumptions used in that computation. The actual value
realized to the Named Executive Officers with respect to stock awards was the consideration
paid at the closing of the merger. |
| |
| (2) |
|
Represents annual cash incentive awards under the Annual Incentive Compensation Plan. For
fiscal year 2008, the Company did not achieve the threshold targets specified for payout of
bonus awards under the Annual Incentive Compensation Plan. For fiscal year 2009, the awards
under the Annual Incentive Compensation Plan were cancelled. Accordingly, no amounts were
earned under this plan in fiscal years 2009 or 2008. For fiscal year 2010, the Company’s
aggregate bonus pool was based on the amount by which the Company’s Return on Sales exceeded
5% and a portion of the bonus pool was allocated to each of the Named Executive Officers in
accordance with their target bonus percentage established under the 2010 Annual Incentive
Compensation Plan. See “Compensation Discussion and Analysis—Elements of Executive
Compensation—Annual Bonus Program under the Annual Incentive Compensation Plan” above. |
| |
| (3) |
|
Amounts consist of the change in the annual actuarial present value of the pension benefits
for each Named Executive Officer pursuant to the Company’s Defined Benefit Pension Plan, as
also reported in the Pension Benefits at September 30, 2010 table below. The discount rate
used to determine the present value of the pension benefit was 5.375%, 6.0% and 7.0% for
fiscal years 2010, 2009 and 2008, respectively. None of the Named Executive Officers received
above-market or preferential earnings on deferred compensation under the Deferred Compensation
Plan. |
67
|
|
|
| (4) |
|
The following table provides detail for the aggregate “All Other” Compensation for each Named
Executive Officer: |
| |
|
|
|
|
|
|
|
|
|
|
|
|
|
|
|
|
|
|
|
|
|
|
|
|
|
|
|
|
| |
|
|
|
|
|
|
|
|
|
401(k) |
|
|
|
|
|
|
|
|
|
|
|
|
|
| |
|
|
|
|
|
|
|
|
|
Matching |
|
|
|
|
|
|
|
|
|
|
|
|
|
| |
|
Year |
|
|
Company Car (a) |
|
|
Contribution |
|
|
Club Dues |
|
|
Financial Planning |
|
|
Life Insurance (c) |
|
|
Miscellaneous |
|
Joseph P. Keithley |
|
|
2010 |
|
|
$ |
13,170 |
|
|
$ |
3,954 |
|
|
$ |
15,048 |
|
|
$ |
12,000 |
|
|
$ |
5,872 |
|
|
|
— |
|
|
|
|
2009 |
|
|
|
14,550 |
|
|
|
107 |
|
|
|
14,716 |
|
|
|
12,000 |
|
|
|
9,191 |
|
|
|
— |
|
|
|
|
2008 |
|
|
|
15,069 |
|
|
|
3,375 |
|
|
|
14,681 |
|
|
|
12,000 |
|
|
|
9,190 |
|
|
|
— |
|
Mark J. Plush |
|
|
2010 |
|
|
$ |
17,308 |
|
|
$ |
2,847 |
|
|
$ |
1,882 |
|
|
$ |
8,000 |
|
|
$ |
5,544 |
|
|
|
— |
|
|
|
|
2009 |
|
|
|
18,251 |
|
|
|
853 |
|
|
|
1,946 |
|
|
|
7,500 |
|
|
|
5,280 |
|
|
|
— |
|
|
|
|
2008 |
|
|
|
17,417 |
|
|
|
3,375 |
|
|
|
2,000 |
|
|
|
7,500 |
|
|
|
5,028 |
|
|
|
— |
|
Linda C. Rae |
|
|
2010 |
|
|
$ |
15,155 |
|
|
$ |
3,094 |
|
|
$ |
879 |
|
|
$ |
8,000 |
|
|
$ |
1,968 |
|
|
|
— |
|
|
|
|
2009 |
|
|
|
18,204 |
|
|
|
356 |
|
|
|
1,003 |
|
|
|
1,500 |
|
|
|
1,800 |
|
|
|
— |
|
|
|
|
2008 |
|
|
|
18,678 |
|
|
|
3,375 |
|
|
|
1,677 |
|
|
|
7,500 |
|
|
|
1,786 |
|
|
$ |
2,165 |
(b) |
Larry L. Pendergrass |
|
|
2010 |
|
|
$ |
15,207 |
|
|
$ |
1,400 |
|
|
|
— |
|
|
$ |
1,205 |
|
|
$ |
3,704 |
|
|
|
— |
|
|
|
|
2009 |
|
|
|
14,943 |
|
|
|
— |
|
|
|
— |
|
|
|
1,055 |
|
|
|
3,994 |
|
|
|
— |
|
|
|
|
2008 |
|
|
|
12,635 |
|
|
|
3,323 |
|
|
|
— |
|
|
|
7,500 |
|
|
|
3,994 |
|
|
|
— |
|
Daniel A. Faia |
|
|
2010 |
|
|
|
— |
|
|
$ |
1,875 |
|
|
|
— |
|
|
|
— |
|
|
$ |
650 |
|
|
|
— |
|
|
|
|
2009 |
|
|
|
— |
|
|
|
— |
|
|
|
— |
|
|
|
— |
|
|
|
— |
|
|
$ |
100,000 |
(b) |
|
|
|
2008 |
|
|
|
— |
|
|
|
— |
|
|
|
— |
|
|
|
— |
|
|
|
— |
|
|
|
— |
|
|
|
|
| (a) |
|
The amounts were determined based on costs of the car leases, insurance, maintenance
and gasoline. |
| |
| (b) |
|
For Ms. Rae, represents payment made upon the sale of Company car pursuant to the terms
of the lease arrangement and for Mr. Faia, represents a real estate allowance paid in
connection with relocation to Cleveland, Ohio pursuant to the terms of Mr. Faia’s
employment letter. |
| |
| (c) |
|
Represents premiums for whole life insurance and, for Mr. Keithley, term life
insurance. |
| |
| (5) |
|
Mr. Faia joined the Company in February 2009. |
68
Grants of Plan-Based Awards for Fiscal Year 2010
The following awards were granted on the terms set forth below during fiscal year 2010 and
were cancelled in exchange for the consideration specified in the Merger Agreement and the closing
of the merger on December 8, 2010.
| |
|
|
|
|
|
|
|
|
|
|
|
|
|
|
|
|
|
|
|
|
|
|
|
|
|
|
|
|
|
|
|
|
|
|
|
|
|
|
|
|
|
|
|
|
| |
|
|
|
|
|
|
|
|
|
|
|
|
|
|
|
|
|
|
|
|
|
|
|
|
|
|
|
|
|
All |
|
|
|
|
|
|
|
|
|
|
|
|
| |
|
|
|
|
|
|
|
|
|
|
|
|
|
|
|
|
|
|
|
|
|
|
|
|
|
|
|
|
|
Other |
|
|
|
|
|
|
|
|
|
|
|
|
| |
|
|
|
|
|
|
|
|
|
|
|
|
|
|
|
|
|
|
|
|
|
|
|
|
|
|
|
|
|
Stock |
|
|
|
|
|
|
|
|
|
|
Grant |
|
| |
|
|
|
|
|
|
|
|
|
|
|
|
|
|
|
|
|
|
|
|
|
|
|
|
|
|
|
|
|
Awards: |
|
|
All Other |
|
|
Exercise |
|
|
Date Fair |
|
| |
|
|
|
|
|
|
|
|
|
|
|
|
|
|
|
|
|
|
|
|
|
|
|
|
|
|
|
|
|
Number |
|
|
Option |
|
|
or |
|
|
Value of |
|
| |
|
|
|
|
|
Estimated Future Payouts Under |
|
|
|
|
|
|
|
|
|
|
|
|
|
|
of |
|
|
Awards: |
|
|
Base |
|
|
Stock |
|
| |
|
|
|
|
|
Non-Equity Incentive Plan Awards |
|
|
Estimated Future Payouts Under |
|
|
Shares |
|
|
Number |
|
|
Price of |
|
|
and |
|
| |
|
|
|
|
|
(1)(2) |
|
|
Equity Incentive Plan Awards(3) |
|
|
of Stock |
|
|
of Securities |
|
|
Option |
|
|
Option |
|
| |
|
Grant |
|
|
Threshold |
|
|
Target |
|
|
Maximum |
|
|
Threshold |
|
|
Target |
|
|
Maximum |
|
|
or Units |
|
|
Underlying |
|
|
Awards |
|
|
Awards |
|
| Name |
|
Date |
|
|
$ |
|
|
$ |
|
|
$ |
|
|
# |
|
|
# |
|
|
# |
|
|
# (4) |
|
|
Options # (5) |
|
|
$/Sh (6) |
|
|
$ (7) |
|
Joseph P. Keithley |
|
|
12/4/2009 |
|
|
|
0 |
|
|
|
340,147 |
|
|
|
680,294 |
|
|
|
— |
|
|
|
— |
|
|
|
— |
|
|
|
— |
|
|
|
— |
|
|
|
— |
|
|
|
— |
|
Mark J. Plush |
|
|
12/4/2009 |
|
|
|
0 |
|
|
|
127,795 |
|
|
|
255,590 |
|
|
|
0 |
|
|
|
22,250 |
|
|
|
44,500 |
|
|
|
— |
|
|
|
22,250 |
|
|
$ |
4.26 |
|
|
$ |
196,263 |
|
Linda C. Rae |
|
|
12/4/2009 |
|
|
|
0 |
|
|
|
165,008 |
|
|
|
330,016 |
|
|
|
0 |
|
|
|
25,350 |
|
|
|
50,700 |
|
|
|
— |
|
|
|
25,350 |
|
|
$ |
4.26 |
|
|
$ |
223,607 |
|
Larry L. Pendergrass |
|
|
12/4/2009 |
|
|
|
0 |
|
|
|
89,600 |
|
|
|
179,200 |
|
|
|
0 |
|
|
|
6,600 |
|
|
|
13,200 |
|
|
|
4,400 |
|
|
|
13,200 |
|
|
$ |
4.26 |
|
|
$ |
90,760 |
|
Daniel A. Faia |
|
|
12/4/2009 |
|
|
|
0 |
|
|
|
162,505 |
|
|
|
325,010 |
|
|
|
0 |
|
|
|
9,450 |
|
|
|
18,900 |
|
|
|
6,300 |
|
|
|
18,850 |
|
|
$ |
4.26 |
|
|
$ |
129,848 |
|
|
|
|
| (1) |
|
The options, shares acquired upon exercise of options or vesting or performance award
units and restricted stock awards and any gain realized in connection therewith are subject to
additional forfeiture and recoupment provisions for conduct that is detrimental to the
Company. See “Compensation Discussion and Analysis— Equity Award Granting Practices” above. |
| |
| (2) |
|
Represents possible payouts under the 2010 Annual Incentive Compensation Plan. See
“Compensation Discussion and Analysis—Elements of Executive Compensation—Annual Bonus
Program under the Annual Incentive Compensation Plan” above. The Named Executive Officers
received their maximum payout amounts. |
| |
| (3) |
|
Represents the range of common shares that could be earned pursuant to the performance award
units made under the 2002 Stock Incentive Plan as part of the long-term compensation program.
See “Compensation Discussion and Analysis—Elements of Compensation—Long Term Compensation
Program” above. |
| |
| (4) |
|
Represents restricted stock units awarded under the 2002 Stock Incentive Plan as part of the
long-term compensation program that become fully vested on December 4, 2013. Common shares
represented by such vested restricted unit awards are to be delivered promptly after such
vesting date. |
| |
| (5) |
|
Represents stock options awarded under the 2002 Stock Incentive Plan, as part of the
long-term compensation program, having an exercise price equal to the fair market value of the
common shares on the date of grant. The options vest as to 50% of the common shares subject
to the award on the second anniversary of the date of grant and as to 25% of the shares on
each anniversary thereafter. The stock options expire 10 years from the date of grant unless
otherwise expired as described above. |
| |
| (6) |
|
Represents the exercise price of the stock option, which was the closing date market price of
the Company’s common shares on the NYSE on the grant date. |
| |
| (7) |
|
The grant date fair value of each award was computed in accordance with FASB ASC Topic 718.
For options, the per share valuation was $2.09, for restricted stock units it was $4.26 per
share and for performance award units it was $6.73. See Note I of Notes to Consolidated
Financial Statements included in Part II — Item 8 of this Form 10-K. |
69
Outstanding Equity Awards at September 30, 2010
The following awards were outstanding on September 30, 2010 and were cancelled in exchange for
the consideration, ig any, specified in the Merger Agreement and the closing of the merger on
December 8, 2010.
| |
|
|
|
|
|
|
|
|
|
|
|
|
|
|
|
|
|
|
|
|
|
|
|
|
|
|
|
|
|
|
|
|
| |
|
|
|
|
|
|
|
|
|
|
|
|
|
|
|
|
|
Stock Awards |
|
| |
|
|
|
|
|
|
|
|
|
|
|
|
|
|
|
|
|
|
|
|
|
Market |
|
|
|
|
|
|
Equity Incentive |
|
| |
|
|
|
|
|
|
|
|
|
|
|
|
|
|
|
|
|
|
|
|
|
Value |
|
|
|
|
|
|
Plan Awards: |
|
| |
|
Option Awards |
|
|
Number of |
|
|
of Shares or |
|
|
Equity Incentive |
|
|
Market or |
|
| |
|
Number of |
|
|
Number of |
|
|
|
|
|
|
|
|
|
|
Shares or |
|
|
Units of |
|
|
Plan Awards: |
|
|
Payout |
|
| |
|
Securities |
|
|
Securities |
|
|
|
|
|
|
|
|
|
|
Units of |
|
|
Stock |
|
|
Number of |
|
|
Value of |
|
| |
|
Underlying |
|
|
Underlying |
|
|
|
|
|
|
|
|
|
|
Stock |
|
|
That |
|
|
Unearned |
|
|
Unearned |
|
| |
|
Unexercised |
|
|
Unexercised |
|
|
Option |
|
|
|
|
|
|
That Have |
|
|
Have |
|
|
Shares, Units |
|
|
Shares, Units |
|
| |
|
Options |
|
|
Options |
|
|
Exercise |
|
|
Option |
|
|
Not Yet |
|
|
Not Yet |
|
|
or Other Rights |
|
|
or Other Rights |
|
| |
|
# |
|
|
# |
|
|
Price |
|
|
Expiration |
|
|
Vested |
|
|
Vested |
|
|
That Have Not |
|
|
That Have Not |
|
| Name |
|
Exercisable |
|
|
Unexercisable |
|
|
$ |
|
|
Date |
|
|
# (1) |
|
|
$ (1) |
|
|
Yet Vested # (2) |
|
|
Yet Vested $ (2) |
|
Joseph P. Keithley |
|
|
100,000 |
|
|
|
|
|
|
|
18.41 |
|
|
|
7/24/2011 |
|
|
|
1,308 |
(3) |
|
$ |
28,135 |
|
|
|
0 |
|
|
|
0 |
|
|
|
|
100,000 |
|
|
|
|
|
|
|
13.76 |
|
|
|
7/23/2012 |
|
|
|
|
|
|
|
|
|
|
|
|
|
|
|
|
|
|
|
|
100,000 |
|
|
|
|
|
|
|
16.12 |
|
|
|
7/18/2013 |
|
|
|
|
|
|
|
|
|
|
|
|
|
|
|
|
|
|
|
|
70,000 |
|
|
|
|
|
|
|
18.75 |
|
|
|
7/16/2014 |
|
|
|
|
|
|
|
|
|
|
|
|
|
|
|
|
|
|
|
|
55,000 |
|
|
|
|
|
|
|
15.05 |
|
|
|
10/3/2015 |
|
|
|
|
|
|
|
|
|
|
|
|
|
|
|
|
|
|
|
|
19,150 |
|
|
|
19,150 |
(4) |
|
|
9.12 |
|
|
|
11/9/2017 |
|
|
|
|
|
|
|
|
|
|
|
|
|
|
|
|
|
Mark J. Plush |
|
|
38,000 |
(5) |
|
|
|
|
|
|
18.41 |
|
|
|
7/24/2011 |
|
|
|
5,552 |
(6) |
|
$ |
119,424 |
|
|
|
22,250 |
|
|
$ |
478,598 |
|
|
|
|
25,029 |
|
|
|
|
|
|
|
13.76 |
|
|
|
7/23/2012 |
|
|
|
|
|
|
|
|
|
|
|
|
|
|
|
|
|
|
|
|
33,000 |
|
|
|
|
|
|
|
16.12 |
|
|
|
7/18/2013 |
|
|
|
|
|
|
|
|
|
|
|
|
|
|
|
|
|
|
|
|
28,000 |
|
|
|
|
|
|
|
18.75 |
|
|
|
7/16/2014 |
|
|
|
|
|
|
|
|
|
|
|
|
|
|
|
|
|
|
|
|
10,400 |
|
|
|
|
|
|
|
15.05 |
|
|
|
10/3/2015 |
|
|
|
|
|
|
|
|
|
|
|
|
|
|
|
|
|
|
|
|
6,350 |
|
|
|
6,350 |
(4) |
|
|
9.12 |
|
|
|
11/9/2017 |
|
|
|
|
|
|
|
|
|
|
|
|
|
|
|
|
|
|
|
|
|
|
|
|
27,500 |
(7) |
|
|
2.99 |
|
|
|
2/6/2019 |
|
|
|
|
|
|
|
|
|
|
|
|
|
|
|
|
|
|
|
|
|
|
|
|
22,250 |
(8) |
|
|
4.26 |
|
|
|
12/4/2019 |
|
|
|
|
|
|
|
|
|
|
|
|
|
|
|
|
|
Linda C. Rae |
|
|
25,000 |
|
|
|
|
|
|
|
18.41 |
|
|
|
7/24/2011 |
|
|
|
5,200 |
|
|
$ |
111,852 |
|
|
|
25,350 |
|
|
$ |
545,278 |
|
|
|
|
30,000 |
|
|
|
|
|
|
|
13.76 |
|
|
|
7/23/2012 |
|
|
|
|
|
|
|
|
|
|
|
|
|
|
|
|
|
|
|
|
50,000 |
|
|
|
|
|
|
|
16.12 |
|
|
|
7/18/2013 |
|
|
|
|
|
|
|
|
|
|
|
|
|
|
|
|
|
|
|
|
41,000 |
|
|
|
|
|
|
|
18.75 |
|
|
|
7/16/2014 |
|
|
|
|
|
|
|
|
|
|
|
|
|
|
|
|
|
|
|
|
25,000 |
|
|
|
|
|
|
|
15.05 |
|
|
|
10/3/2015 |
|
|
|
|
|
|
|
|
|
|
|
|
|
|
|
|
|
|
|
|
18,750 |
|
|
|
6,250 |
(9) |
|
|
14.00 |
|
|
|
1/30/2017 |
|
|
|
|
|
|
|
|
|
|
|
|
|
|
|
|
|
|
|
|
9,650 |
|
|
|
9,650 |
(4) |
|
|
9.12 |
|
|
|
11/9/2019 |
|
|
|
|
|
|
|
|
|
|
|
|
|
|
|
|
|
|
|
|
|
|
|
|
31,000 |
(7) |
|
|
2.99 |
|
|
|
2/6/2019 |
|
|
|
|
|
|
|
|
|
|
|
|
|
|
|
|
|
|
|
|
|
|
|
|
25,350 |
(8) |
|
|
4.26 |
|
|
|
12/4/2019 |
|
|
|
|
|
|
|
|
|
|
|
|
|
|
|
|
|
Larry L. Pendergrass |
|
|
20,000 |
|
|
|
|
|
|
|
12.43 |
|
|
|
5/19/2013 |
|
|
|
10,200 |
|
|
$ |
219,402 |
|
|
|
6,600 |
|
|
$ |
141,966 |
|
|
|
|
25,000 |
|
|
|
|
|
|
|
18.75 |
|
|
|
7/16/2014 |
|
|
|
|
|
|
|
|
|
|
|
|
|
|
|
|
|
|
|
|
8,800 |
|
|
|
|
|
|
|
15.05 |
|
|
|
10/3/2015 |
|
|
|
|
|
|
|
|
|
|
|
|
|
|
|
|
|
|
|
|
7,200 |
|
|
|
2,400 |
(9) |
|
|
14.00 |
|
|
|
1/30/2017 |
|
|
|
|
|
|
|
|
|
|
|
|
|
|
|
|
|
|
|
|
4,150 |
|
|
|
4,150 |
(4) |
|
|
9.12 |
|
|
|
11/9/2017 |
|
|
|
|
|
|
|
|
|
|
|
|
|
|
|
|
|
|
|
|
|
|
|
|
17,400 |
(7) |
|
|
2.99 |
|
|
|
2/6/2019 |
|
|
|
|
|
|
|
|
|
|
|
|
|
|
|
|
|
|
|
|
|
|
|
|
13,200 |
(8) |
|
|
4.26 |
|
|
|
12/4/2019 |
|
|
|
|
|
|
|
|
|
|
|
|
|
|
|
|
|
Daniel Faia |
|
|
|
|
|
|
70,000 |
(10) |
|
|
3.16 |
|
|
|
2/9/2019 |
|
|
|
6,300 |
|
|
$ |
135,513 |
|
|
|
9,450 |
|
|
$ |
203,270 |
|
|
|
|
|
|
|
|
18,850 |
(8) |
|
|
4.26 |
|
|
|
12/4/2019 |
|
|
|
|
|
|
|
|
|
|
|
|
|
|
|
|
|
|
|
|
| (1) |
|
Represents restricted stock units awarded under the 2002 Stock Incentive Plan as part of
the long-term compensation program, which vest four years after the date of grant. The value
is based on the closing price of the common shares on the NYSE on September 30, 2010 of $21.51
per share. |
| |
| (2) |
|
These amounts represent performance award units that were granted in fiscal year 2010 under
the 2002 Stock Incentive Plan as part of the long-term compensation program. The value is
based on the closing price of the common shares on the NYSE on September 30, 2010 of $21.51
per share. |
| |
| (3) |
|
Restricted shares, which vested December 1, 2010. |
70
|
|
|
| (4) |
|
Represents options that vest as follows: 50% of the shares vested on November 9, 2009; 25% of
the shares vested on November 9, 2010; and the final 25% of the shares will vest on November
9, 2011. |
| |
| (5) |
|
Includes an option to purchase 16,251 shares held by Mr. Plush’s former wife. Mr. Plush may
exercise the options solely upon the direction of his former wife who is entitled to the
shares issued upon exercise. |
| |
| (6) |
|
Includes 4,600 restricted stock units awarded under the 2002 Stock Incentive Plan as part of
the long-term compensation program, which vest four years after the date of grant and 952
restricted shares vesting on June 1, 2011. |
| |
| (7) |
|
Represents options that vest as follows: 50% of the shares vest on February 6, 2011; 25% of
the shares vest on February 6, 2012; and the final 25% of the shares will vest on February 6,
2013. |
| |
| (8) |
|
Represent options that vest as follows: 50% of the shares vest on December 4, 2011; 25% of
the shares vest on December 4, 2012; and the final 25% of the shares will vest on December 4,
2013. |
| |
| (9) |
|
Represents options that vest as follows: 50% of the shares vest on January 30, 2009; 25% of
the shares vest on January 30, 2010; and the final 25% of the shares will vest on January 30,
2011. |
| |
| (10) |
|
Represents options that vest as follows: 50% of the shares vest on February 9, 2011; 25% of
the shares vest on February 9, 2012; and the final 25% of the shares will vest on February 9,
2013. |
Option Exercises and Stock Vested for Fiscal Year 2010
| |
|
|
|
|
|
|
|
|
|
|
|
|
|
|
|
|
| |
|
Option Awards |
|
|
Stock Awards (1) |
|
| |
|
Number of Shares |
|
|
Value Realized on |
|
|
Number of Shares |
|
|
Value Realized on |
|
| |
|
Acquired on Exercise |
|
|
Exercise |
|
|
Acquired on Vesting |
|
|
Vesting |
|
| Name |
|
(#) |
|
|
($) |
|
|
($) |
|
|
($) |
|
Joseph P. Keithley |
|
|
— |
|
|
|
— |
|
|
|
24,125 |
|
|
$ |
518,929 |
|
Mark J. Plush |
|
|
— |
|
|
|
— |
|
|
|
12,000 |
|
|
$ |
258,120 |
|
Linda C. Rae |
|
|
— |
|
|
|
— |
|
|
|
12,125 |
|
|
$ |
260,809 |
|
Larry L. Pendergrass |
|
|
— |
|
|
|
— |
|
|
|
6,300 |
|
|
$ |
135,513 |
|
Daniel Faia |
|
|
— |
|
|
|
— |
|
|
|
— |
|
|
|
— |
|
|
|
|
| (1) |
|
These amounts represent performance award units that were granted in fiscal year 2008
under the 2002 Stock Incentive Plan as part of the long-term compensation program and vested
on September 30, 2010. The final payout amounts were established based on and following the
Committee’s review of the Company’s financial performance over the performance period of
fiscal year 2008 through fiscal year 2010. The payouts reflect 125% of the individual’s
target award, except for Mr. Pendergrass, which reflects 100% of his target award. The awards
were settled for the number of common shares set forth in the table on October 27, 2010. The
value set forth in the table is based on the closing price of the common shares on the NYSE on
September 30, 2010 of $21.51 per share. |
71
Pension Benefits at September 30, 2010
| |
|
|
|
|
|
|
|
|
|
|
|
|
|
|
| |
|
|
|
|
|
|
|
Present Value |
|
|
Payments |
|
| |
|
|
|
Number of Years |
|
|
of Accumulated |
|
|
During Last |
|
| |
|
|
|
Credited Service |
|
|
Benefit |
|
|
Fiscal Year |
|
| Name |
|
Plan Name |
|
(#) |
|
|
($) (1) |
|
|
($) |
|
| Joseph P. Keithley |
|
Keithley
Instruments, Inc.
Employees’ Pension
Plan |
|
|
34.4 |
|
|
|
783,562 |
|
|
|
— |
|
| Mark J. Plush |
|
Keithley
Instruments, Inc.
Employees’ Pension
Plan |
|
|
28.6 |
|
|
|
518,205 |
|
|
|
— |
|
| Linda C. Rae |
|
Keithley
Instruments, Inc.
Employees’ Pension
Plan |
|
|
15.6 |
|
|
|
127,535 |
|
|
|
— |
|
| Larry L. Pendergrass |
|
Keithley
Instruments, Inc.
Employees’ Pension
Plan |
|
|
7.3 |
|
|
|
128,618 |
|
|
|
— |
|
| Daniel Faia |
|
Keithley
Instruments, Inc.
Employees’ Pension
Plan |
|
|
1.7 |
|
|
|
17,554 |
|
|
|
— |
|
|
|
|
| (1) |
|
The accrued benefits are shown as annual straight life annuities payable at age 65
calculated as of the measurement date of September 30, 2010. The actuarial present value of
the accumulated benefits under the Defined Benefit Plan is based on assumptions consistent
with those used for fiscal year 2010 disclosure under U.S. GAAP, which includes a discount
rate of 5.375%, retirement at age 65 and no pre-retirement decrements. See “Compensation
Discussion and Analysis—Elements of Executive Compensation—Retirement Plans—Defined Benefit
Pension Plan” above. |
Nonqualified Deferred Compensation for Fiscal Year 2010
| |
|
|
|
|
|
|
|
|
|
|
|
|
|
|
|
|
|
|
|
|
| |
|
Executive |
|
|
Registrant |
|
|
Aggregate Earnings |
|
|
Aggregate |
|
|
Aggregate |
|
| |
|
Contributions in |
|
|
Contributions in |
|
|
(Losses) in Last |
|
|
Withdrawals/ |
|
|
Balance at |
|
| |
|
Last FY |
|
|
Last Fiscal Year |
|
|
Fiscal Year |
|
|
Distributions |
|
|
Last Fiscal Year |
|
| Name |
|
($) |
|
|
($) |
|
|
($) (1) |
|
|
($) |
|
|
($) |
|
|
|
|
|
|
|
|
|
|
|
|
|
|
|
|
|
|
|
|
|
|
Joseph P. Keithley (2) |
|
|
-0- |
|
|
|
-0- |
|
|
|
-0- |
|
|
|
-0- |
|
|
|
-0- |
|
|
|
|
|
|
|
|
|
|
|
|
|
|
|
|
|
|
|
|
|
|
Mark J. Plush |
|
|
-0- |
|
|
|
-0- |
|
|
|
15,808 |
|
|
|
-0- |
|
|
|
175,783 |
|
|
|
|
|
|
|
|
|
|
|
|
|
|
|
|
|
|
|
|
|
|
Linda C. Rae |
|
|
-0- |
|
|
|
-0- |
|
|
|
10,209 |
|
|
|
-0- |
|
|
|
84,984 |
|
|
|
|
|
|
|
|
|
|
|
|
|
|
|
|
|
|
|
|
|
|
Larry L. Pendergrass (3) |
|
|
— |
|
|
|
— |
|
|
|
— |
|
|
|
— |
|
|
|
— |
|
|
|
|
|
|
|
|
|
|
|
|
|
|
|
|
|
|
|
|
|
|
Daniel A. Faia (3) |
|
|
— |
|
|
|
— |
|
|
|
— |
|
|
|
— |
|
|
|
— |
|
|
|
|
| (1) |
|
Not reported as compensation to the Named Executive Officers for tax purposes. Until
fiscal 2009, the deferred compensation plan provided the Named Executive Officers with the
opportunity to defer receipt of cash compensation. The Company does not contribute to this
plan. Participants were able to elect to defer all or part of their cash compensation (base
salary and annual bonus) for a specified period of years or until retirement and select from a
variety of investment funds from which the earnings on their deferred cash compensation
account will be determined. |
| |
| (2) |
|
Mr. Keithley’s distribution was made pursuant to his previously made election to receive a
lump sum payment at the beginning of the month of his 60th birthday. |
| |
| (3) |
|
Messrs. Pendergrass and Faia are not participants in this plan. |
72
Potential Payments upon Employment Termination, Death or Change of Control
The Company’s executive officers are entitled to payments upon termination of their employment
in certain circumstances under an employment agreement, change in control agreements and the
Company’s pension and equity award plans. The Company generally has not entered into employment
agreements with its executive officers; however, during a transition in management in 1994, the
Company entered into an employment agreement with Mr. Plush, that was amended in December 2008 to
add provisions required to comply with certain tax laws. In addition, in consideration of a
possible sale of the Company, in August of 2010, the Company entered into change in control
agreements with the Company’s executive officers other than Mr. Plush and, in September of 2010,
entered into an amended employment agreement with Mr. Plush to add terms similar to those in the
change in control agreements. A Change of Control of the Company (as defined in such agreements)
occurred on December 8, 2010, the closing date of the merger of the Company with a subsidiary of
Danaher pursuant to the Merger Agreement.
Equity Award Plans
The stock options, restricted stock units, restricted shares and performance award units
granted to the Company’s executive officers under its 1992 Stock Incentive Plan, as amended, and
2002 Stock Incentive Plan, as amended, provided for full vesting of all awards at the effective
time of a change in control.
The agreements entered into by the executive officers and the Company providing for equity
awards state that the shares or value received under the awards are subject to set off and
recoupment for certain claims that the Company may have against the executive officer within a
three-year period following the end of his or her employment with the Company. In addition, if a
performance award unit recipient terminates or the Company terminates his or her employment before
the end of the performance period, the entire award will be forfeited unless the termination is due
to retirement upon satisfactory conditions. Such retirees will receive a pro rata payout based on
the performance goals achieved by the Company at the end of the performance period, but pro rated
to the number of the days in the period that the retiree was employed by the Company. In addition,
the equity award plans, as well as the Annual Incentive Plan, provide the Committee with discretion
to award terminated employees a pro-rated share of an award depending on the circumstances of their
termination.
Change in Control Agreements
The change in control agreements provide that, if within the two years following the Change in
Control, the Company terminates the executive’s employment without cause or the executive resigns
for good reason (a “Triggering Event”), the executive will be entitled to a lump sum payment
consisting of:
| |
• |
|
1.0 or, with respect to Mr. Keithley and Ms. Rae, 1.5 times the higher of the
executive’s annual salary at the time of the Change in Control or the Triggering Event; |
| |
• |
|
1.0 or, with respect to Mr. Keithley and Ms. Rae, 1.5 times the higher of (1) the
executive’s current target bonus or (2) the average of the executive’s actual target
bonus received for the three fiscal years preceding the Change in Control (or the number
of fiscal years that the executive has been with the Company, if less than three); and |
| |
• |
|
a portion of his or her then current year target bonus prorated for the number of
days in the fiscal quarter in which the Triggering Event occurred, less any amount of
such bonus that has already been paid to the executive. |
The executive will also receive:
| |
• |
|
continued medical, welfare and other benefit coverage until the earlier of the date
on which he or she is eligible to receive comparable benefits from another employer or
the one-year or, in the case of Mr. Keithley and Ms. Rae, the 18-month anniversary of
the Triggering Event; and |
| |
• |
|
outplacement services up to a cost of $25,000. |
Equity awards held by the executives as of the Change in Control were treated in accordance
with the provisions set forth in the applicable equity award plans and agreements, except that in
the case of performance award units, if a Triggering Event occurs, the executives will be entitled
to a payout equal to $21.60 times 50 percent of the number of shares subject to the initial award.
73
In the event payments to the executive result in the executive becoming liable for the payment
of excise taxes pursuant to
section 4999 of the Internal Revenue Code, the payments to be made to the executive as a result of
the Change in Control will be reduced to the extent necessary to prevent the payments from being
subject to the excise tax, but only if by reason of the reduction, the after-tax benefit of the
reduced payments exceeds the after-tax benefit if such reduction were not made.
In addition, payments to the executive are conditioned upon the executive’s execution and
delivery of a release in favor of the Company in the form described in the change in control
agreement. The change in control agreement also provides that, for a period of one year from the
date of termination of the executive’s employment that results in a severance payment under the
change in control agreement, the executive will not (1) solicit the employment of any employee who
has been employed by the Company at any time during the prior six months or (2) solicit customers,
business, patronage or orders for, or sell, any products and services in competition with, or for
any business, wherever located, that, as of the date of the executive’s termination of employment,
competes with, the business of the Company.
Amended Employment Agreement with Mr. Plush
The Amended and Restated Employment Agreement by and between the Company and Mr. Plush dated
September 29, 2010, or amended employment agreement, provided for the following benefits if his
employment is terminated without cause and no Change in Control (as defined in the amended
employment agreement) has occurred:
| |
• |
|
continued payment of his monthly salary in effect as of his termination for 18 months
thereafter; |
| |
• |
|
full participation in the Annual Incentive Plan if the termination occurs after June
30th; |
| |
• |
|
full participation in any performance award if the performance measuring period is
within six months following his termination; |
| |
• |
|
30 days to exercise all vested options; provided such 30 days does not extend the
term of the options; |
| |
• |
|
a supplemental retirement benefit reflecting the difference between the benefits that
would be payable to Mr. Plush under the Company’s pension plan if he were fully vested
and his compensation, as defined in the pension plan, was equal to the highest amount of
annual compensation he earned in the final three years prior to termination, and his
actual benefits payable under the pension plan; |
| |
• |
|
all fringe benefits that he was receiving immediately prior to his termination for
the 18-month period following his termination; and |
| |
• |
|
outplacement services up to a cost of $10,000. |
As a result of the amended terms implemented in September 2010, the amended
employment agreement also provides that, if within thirty-six months following the Change in
Control, the Company terminates Mr. Plush’s employment other than For Cause (as defined in the
amended employment agreement) or the executive resigns for Good Reason (as defined in the amended
employment agreement) (each, a “Triggering Event”), Mr. Plush will be entitled to the following
benefits:
| |
• |
|
1.5 times the higher of his annual salary at the time of the Change in Control or the
Triggering Event, paid out in monthly installments over a 24-month period; |
| |
• |
|
full participation in the annual bonus plan if termination of employment is
subsequent to June 30 of the respective fiscal year; |
| |
• |
|
a supplemental retirement benefit reflecting the difference between the benefits that
would be payable to Mr. Plush under the Company’s pension plan if he were fully vested
and his compensation, as defined in the pension plan, was equal to the highest amount of
annual compensation he earned in the final three years prior to termination, and his
actual benefits payable under the pension plan; |
74
| |
• |
|
continued medical, welfare and other benefit coverage until the earlier of the date
on which he is eligible to receive comparable benefits from another employer and the
24-month anniversary of the Triggering Event, as well as continued
fringe perquisites to which Mr. Plush was entitled immediately prior to termination for a
period of 18 months following the Triggering Event; and |
| |
• |
|
outplacement services up to a cost of $10,000. |
Equity awards held by Mr. Plush as of the Change in Control were treated in accordance with
the provisions set forth in the applicable equity award plans and agreements, except that in the
case of performance award units, if a Triggering Event occurs, Mr. Plush will be entitled to a
payout equal to $21.60 per share times 50 percent of the number of shares subject to the initial
award.
In addition, payments to Mr. Plush are conditioned upon his covenant not to (1) accept
employment directly or indirectly with any competitor of the Company, (2) allow use of his name by
or in any competitive business, (3) employ the services of any other employee of the Company
without the Company’s written permission or (4) be unreasonably unavailable for consultation by the
officers and directors of the Company until such time as Mr. Plush turns 65.
75
Potential Payments as of September 30, 2010
The amounts shown below represent amounts that would be payable assuming the termination
and/or Change in Control occurred on September 30, 2010 under the Company’s benefit plans and
agreements applicable to each Named Executive Officer. The Change in Control under the Merger
Agreement occurred on December 8, 2010.
| |
|
|
|
|
|
|
|
|
|
|
|
|
|
|
|
|
| |
|
|
|
|
|
Involuntary |
|
|
Voluntary Termination |
|
|
|
|
| |
|
Termination, |
|
|
Termination |
|
|
for Good Reason or Involuntary |
|
|
Change |
|
| |
|
Death or |
|
|
Other Than for |
|
|
Termination Other than for Cause |
|
|
of |
|
| Name |
|
Retirement (1) |
|
|
Cause (1) (2) |
|
|
following a Change in Control (3) |
|
|
Control (4) |
|
Joseph P. Keithley |
|
|
|
|
|
|
|
|
|
|
|
|
|
|
|
|
Lump Sum Salary and Bonus |
|
|
— |
|
|
|
— |
|
|
$ |
1,147,997 |
|
|
|
— |
|
Current Year Bonus |
|
|
— |
|
|
|
— |
|
|
|
— |
|
|
|
— |
|
Benefits |
|
|
— |
|
|
|
— |
|
|
|
32,988 |
|
|
|
— |
|
Outplacement |
|
|
— |
|
|
|
— |
|
|
|
25,000 |
|
|
|
— |
|
Equity Awards |
|
$ |
28,135 |
|
|
|
— |
|
|
|
265,404 |
|
|
$ |
265,404 |
|
Mark J. Plush |
|
|
|
|
|
|
|
|
|
|
|
|
|
|
|
|
Continued Salary and Bonus |
|
|
— |
|
|
|
$ 383,384 |
|
|
$ |
383,384 |
|
|
|
— |
|
Current Year Bonus |
|
|
— |
|
|
|
— |
|
|
|
— |
|
|
|
— |
|
Medical Benefits |
|
|
— |
|
|
|
— |
|
|
|
21,169 |
|
|
|
— |
|
Fringe Benefits |
|
|
— |
|
|
|
50,751 |
|
|
|
50,751 |
|
|
|
— |
|
Outplacement |
|
|
— |
|
|
|
10,000 |
|
|
|
10,000 |
|
|
|
— |
|
Equity Awards |
|
$ |
180,010 |
|
|
|
— |
|
|
|
1,809,109 |
|
|
$ |
1,569,810 |
|
Supplemental Retirement
Benefit |
|
|
— |
|
|
|
1,269,187 |
|
|
|
1,269,187 |
|
|
|
— |
|
Linda C. Rae |
|
|
|
|
|
|
|
|
|
|
|
|
|
|
|
|
Lump Sum Salary and Bonus |
|
|
— |
|
|
|
— |
|
|
$ |
660,035 |
|
|
|
— |
|
Current Year Bonus |
|
|
— |
|
|
|
— |
|
|
|
— |
|
|
|
— |
|
Benefits |
|
|
— |
|
|
|
— |
|
|
|
23,419 |
|
|
|
— |
|
Outplacement |
|
|
— |
|
|
|
— |
|
|
|
25,000 |
|
|
|
— |
|
Equity Awards |
|
$ |
181,760 |
|
|
|
— |
|
|
|
2,107,679 |
|
|
$ |
1,835,040 |
|
Larry L. Pendergrass |
|
|
|
|
|
|
|
|
|
|
|
|
|
|
|
|
Lump Sum Salary and Bonus |
|
|
— |
|
|
|
— |
|
|
$ |
313,600 |
|
|
|
— |
|
Current Year Bonus |
|
|
— |
|
|
|
— |
|
|
|
— |
|
|
|
— |
|
Benefits |
|
|
— |
|
|
|
— |
|
|
|
17,190 |
|
|
|
— |
|
Outplacement |
|
|
— |
|
|
|
— |
|
|
|
25,000 |
|
|
|
— |
|
Equity Awards |
|
$ |
47,322 |
|
|
|
— |
|
|
|
1,051,742 |
|
|
$ |
980,759 |
|
Daniel A. Faia |
|
|
|
|
|
|
|
|
|
|
|
|
|
|
|
|
Lump Sum Salary and Bonus |
|
|
— |
|
|
|
— |
|
|
$ |
412,513 |
|
|
|
— |
|
Current Year Bonus |
|
|
— |
|
|
|
— |
|
|
|
— |
|
|
|
— |
|
Benefits |
|
|
— |
|
|
|
— |
|
|
|
14,217 |
|
|
|
— |
|
Outplacement |
|
|
— |
|
|
|
— |
|
|
|
25,000 |
|
|
|
— |
|
Equity Awards |
|
$ |
67,757 |
|
|
|
— |
|
|
|
2,050,080 |
|
|
$ |
1,948,446 |
|
|
|
|
| (1) |
|
The amounts shown represent the pro rata payout of performance award units upon a
qualifying retirement. In addition, the 2002 Stock Incentive Plan and related award
agreements and Annual Incentive Compensation Plan provide the Committee with discretion to
grant terminated employees additional vesting of other equity awards or a pro-rated bonus
depending on the circumstances of their termination. Upon termination from employment, the
Keithley Instruments, Inc. Employees’ Pension Plan may also provide certain benefits to
participants, including executive officers, depending on the reason for termination. |
| |
| (2) |
|
The amounts shown represent an estimate of the aggregate value of benefits that would be
payable by the Company to Mr. Plush under the amended employment agreement if his employment
was terminated without cause (as defined in the amended employment agreement) and not in
connection with or following a Change in Control. These amounts assume there is no match
under the Company’s 401(k) beyond the base match and equity award values are calculated as set
forth in footnote (4) below. |
76
|
|
|
| (3) |
|
The amounts shown represent an estimate of the aggregate value of benefits that would be
payable by the Company to the executive officer under the change in control agreement or
amended employment agreement, in the case of Mr. Plush, if his or her employment was
terminated by the executive for good reason (as defined in the applicable agreement) or
without cause (as defined in the applicable agreement) within two years, or three years in the
case of Mr. Plush, following a Change in Control. These amounts assume there is no match
under the Company’s 401(k) beyond the base match. All equity awards provide for accelerated
vesting upon a Change in Control and their values were computed based upon the closing price
of the common shares on the NYSE of $21.51 and the number of shares underlying equity awards
held by the executive officer on September 30, 2010. The amounts shown represent the sum of
(a) the product of (i) the number of common shares subject to options held by such executive
officer multiplied by (ii) the excess of $21.51 over the exercise price of such options, (b)
the product of $21.51 multiplied the number of common shares represented by performance award
units at 1.5 times the initial award amount (which assumes the maximum possible payout), and
(c) $21.51 per common share underlying restricted stock units and restricted share. |
| |
| (4) |
|
All equity awards provide for accelerated vesting upon a change in control and their values
were computed based upon the closing price per common share on the NYSE of $21.51 and the
number of shares underlying equity awards held by the executive officer on September 30, 2010.
The amounts shown represent the sum of (a) the product of (i) the number of common shares
subject to options held by such executive officer multiplied by (ii) the excess of $21.51 over
the exercise price of such options, (b) the product of $21.51 multiplied the number of common
shares represented by performance award units at the initial award amount, and (c) $21.51 per
common share underlying restricted stock units and restricted share. The actual value
realized to the Named Executive Officers with respect to such awards was the consideration
paid at the closing of the merger, which was calculated as described in the preceding sentence
using the per share price of $21.60, rather than the closing price on September 30, 2010 of
$21.51. |
77
Director Compensation
Effective October 1, 2007, non-employee directors’ began receiving their compensation based
upon a retainer structure. Previously, director compensation was based on a combination of retainer
and meeting attendance. The change in structure did not result in a material change to the total
compensation that an individual director received. This change was implemented so that meeting fees
would not be a limit on Board of Director involvement in important corporate matters.
For fiscal year 2010, directors who are not employees of the Company received the following
fees, which are paid quarterly:
| |
|
|
|
|
|
Annual Retainer |
|
$ |
27,000 |
|
Lead Director |
|
$ |
11,000 |
|
Audit Committee Chairperson |
|
$ |
22,000 |
|
Compensation and Human Resources Committee Chairperson |
|
$ |
12,000 |
|
Other Committee Chairpersons |
|
$ |
10,000 |
|
Audit Committee members excluding Chairperson |
|
$ |
12,000 |
|
Compensation and Human Resources Committee members (excluding Chairperson) |
|
$ |
7,000 |
|
Other Committee members excluding Chairperson |
|
$ |
5,000 |
|
For fiscal year 2010, the Compensation Committee approved an increase to the annual retainer
by $5,000 due to the dissolution of the Strategy Committee and shift of its responsibilities to the
full Board of Directors.
Directors had the option to defer their fees under the Keithley Instruments, Inc. 1996 Outside
Directors Deferred Stock Plan. Under the terms of that Plan, the fees were invested in common
shares, or a cash account and the account balances were paid out at the closing of the merger.
In addition to retainer fees paid in cash, for fiscal year 2010, each non-employee director
received an annual common share grant equal to up to $58,000 issued in four installments, with the
number of common shares that could be issued to each non-employee director with respect to his or
her annual common share grant limited to 3,000 shares per quarter. For fiscal year 2010, the
aggregate value of the annual common share grant was approximately $56,000. Additionally, any new
non-employee director was to receive a restricted stock award worth $75,000, rounded to whole
shares, upon his or her initial appointment to the Board. The shares were to vest over a three-year
period. These shares are issued pursuant to the Keithley Instruments Inc. 2002 Stock Incentive
Plan.
Effective October 1, 2005, the Board established a policy requiring directors to own $100,000
of common shares in the Company (including shares held in the deferred compensation plan). The
value of the shares is calculated based on the higher of the aggregate market value on (1) the date
of acquiring the shares or (2) the date on which compliance with the policy is measured. It is
expected that the Company’s directors achieve this ownership level within four years of the
establishment of the policy, or in the case of new directors, within four year’s of their election.
All of the directors had met this obligation.
78
The following table summarizes the compensation received by each director during fiscal year
2010:
Director Compensation for Fiscal Year 2010
| |
|
|
|
|
|
|
|
|
|
|
|
|
| Name |
|
Fees Earned or Paid in Cash ($) |
|
|
Fees Earned or Paid in Stock ($) (1) |
|
|
Total ($) |
|
Brian R. Bachman |
|
|
45,000 |
|
|
|
56,022 |
|
|
|
101,022 |
|
James B. Griswold |
|
|
12,250 |
|
|
|
92,772 |
|
|
|
105,022 |
|
Leon J. Hendrix, Jr. |
|
|
8,500 |
|
|
|
81,522 |
|
|
|
90,022 |
|
Brian J. Jackman |
|
|
12,500 |
|
|
|
93,522 |
|
|
|
106,022 |
|
Dr. N. Mohan Reddy |
|
|
9,750 |
|
|
|
85,272 |
|
|
|
95,022 |
|
Thomas A. Saponas |
|
|
9,750 |
|
|
|
85,272 |
|
|
|
95,022 |
|
Barbara V. Scherer |
|
|
49,000 |
|
|
|
56,022 |
|
|
|
105,022 |
|
|
|
|
| (1) |
|
Represents the annual common share grant awarded under the Company’s 2002 Stock Incentive
Plan described above. The grant date fair value of each award was computed in accordance
with FASB ASC Topic 718. See Note I of Notes to Consolidated Financial Statements included in
Part II — Item 8 of this Form 10-K. |
| |
| (2) |
|
Represents the dollar value of fees that have been deferred in the 1996 Outside Directors
Deferred Stock Plan described above. |
The Company also reimburses directors for their reasonable expenses associated with attending
Board meetings and provides them with liability insurance coverage for their activities as
directors.
Under the Company’s Articles of Incorporation and Code of Regulations, the directors are
entitled to indemnification from the Company to the fullest extent permitted by Ohio law. The
Company has entered into indemnification agreements with each of the directors. The agreements do
not increase or decrease the scope of the indemnification provided by law and set forth processes
and procedures for indemnification claims.
Compensation Policies and Practices as Related to Risk Management
The Compensation Committee and the Company’s management do not believe that the Company
maintains compensation policies or practices that are reasonably likely to have a material adverse
effect on the Company. The Company’s management, under the Compensation Committee’s oversight and
with assistance from human resources, legal and compliance personnel, has assessed the Company’s
compensation programs and has concluded that its compensation policies and practices do not create
risks that are reasonably likely to have a material adverse effect on it.
ITEM 12 — SECURITY OWNERSHIP OF CERTAIN BENEFICIAL OWNERS AND MANAGEMENT AND RELATED STOCKHOLDER
MATTERS
Information concerning securities authorized for issuance under equity compensation plans is
included under “Equity Compensation Plan Information as of September 30, 2010” in Item 5 of Part II
of this Annual Report and is incorporated herein by this reference.
Security Ownership of Certain Beneficial Owners and Management
As of December 9, 2010, all of the outstanding shares of the Company were owned by
Nano Acquisition ApS, an indirect subsidiary of Danaher, as a result of the closing of the merger
on December 8, 2010. The address of Nano Acquisition ApS is c/o Danaher Corporation, 2099
Pennsylvania Avenue N.W., 12th Floor, Washington, D.C. 20006.
79
ITEM 13 — CERTAIN RELATIONSHIPS AND RELATED TRANSACTIONS, AND DIRECTOR INDEPENDENCE
Procedures for Review of Related Party Transactions
Pursuant to its charter, the Audit Committee of the Company’s Board of Directors was to review
transactions between the Company and its directors and others, and with firms that employ
directors, and any other material related party transactions, including those requiring disclosure
under Item 404(a) of Regulation S-K under the federal securities laws. The Audit Committee did not
have written policies, procedures or standards that it applies in such review.
Director Independence
The Board has determined that all of the directors, serving until December 8, 2010 merger
closing, except for Mr. Keithley, were independent directors applying the standards set forth in
the New York Stock Exchange listing standards. All of the members of the Board’s Audit Committee,
Compensation and Human Resources Committee and Nominating and Corporate Governance Committee were
independent directors and met the independence criteria of the New York Stock Exchange listing
standards with respect to such committee membership.
ITEM 14 — PRINCIPAL ACCOUNTANT FEES AND SERVICES
The firm of PricewaterhouseCoopers LLP has served as the Company’s independent registered
public accounting firm since 1958. The following table shows the fees incurred by the Company for
PricewaterhouseCoopers LLP’s professional services rendered for the fiscal years ended September
30, 2010 and 2009:
| |
|
|
|
|
|
|
|
|
| |
|
Fiscal 2010 |
|
|
Fiscal 2009 |
|
Audit Fees |
|
$ |
771,000 |
|
|
$ |
698,000 |
|
Audit Related Fees |
|
|
10,000 |
|
|
|
10,000 |
|
Tax Fees |
|
|
267,000 |
|
|
|
206,000 |
|
All Other Fees |
|
|
3,000 |
|
|
|
3,000 |
|
|
|
|
|
|
|
|
Total |
|
$ |
1,051,000 |
|
|
$ |
917,000 |
|
|
|
|
|
|
|
|
Fees related to fiscal 2010 and 2009 are comprised of the services as described in the following items:
| |
• |
|
“Audit Fees” consist of fees incurred for professional services rendered for the
audit of Keithley Instruments, Inc.’s consolidated financial statements, the audit of
the Company’s internal control over financial reporting as required by the
Sarbanes-Oxley Act of 2002, Section 404, review of the interim consolidated financial
statements included in quarterly reports, and services that are normally provided by
PricewaterhouseCoopers LLP in connection with statutory and regulatory filings or
engagements. |
| |
• |
|
“Audit Related Fees” consist of fees incurred for due diligence services related to
the merger. |
| |
• |
|
“Tax Fees” consist of fees incurred for professional services for tax compliance, tax
advice and tax planning for the Company’s subsidiaries and sales offices in various tax
jurisdictions throughout the world. |
| |
• |
|
“All Other Fees” consist of licensing fees for an accounting research database
maintained by PricewaterhouseCoopers LLP. |
Policy on Audit Committee Pre-Approval of Audit and Permissible Non-Audit Services of Independent
Registered Public Accounting Firm
The Audit Committee of the Company’s Board of Directors pre-approved, on an individual basis,
all audit and permissible non-audit services provided by the independent registered public
accounting firm. These services may include audit services, audit-related services, tax services
and other services. Pre-approval is generally provided for up to one year and any pre-approval is
detailed as to the particular service or category of services and is generally subject to a
specific budget. The independent registered public accounting firm and management were required to
periodically report to the Audit Committee regarding the extent of services
provided by the independent registered public accounting firm in accordance with this
pre-approval, and the fees for the services performed to date.
80
PART IV
ITEM 15 — EXHIBITS AND FINANCIAL STATEMENT SCHEDULES
(a)(1) Financial Statements
Our Consolidated Financial Statements and Notes thereto are included in Item 8 of this Annual
Report.
(a)(2) Financial Statement Schedules
The following additional information should be read in conjunction with our Consolidated Financial
Statements described in Item 15(a)(1): Schedules other than those listed above are omitted because
they are not required or not applicable, or because the information is furnished elsewhere in the
consolidated financial statements or the notes thereto.
(a)(3) Index to Exhibits
| |
|
|
|
|
| Exhibit |
|
|
|
| Number |
|
|
Description |
| |
|
|
|
|
| |
2.1 |
|
|
Agreement and Plan of Merger, dated as of September 29, 2010, by and among Danaher
Corporation, Aegean Acquisition Corp. and Keithley Instruments, Inc. (Reference is made
to Exhibit 2.1 of the Company’s Current Report on Form 8-K dated September 29, 2010 (File
No. 1-9965), which Exhibit is incorporated herein by reference.) |
| |
|
|
|
|
| |
3.1 |
|
|
Code of Regulations, as amended on February 9, 2008.
(Reference is made to Exhibit 3(a) of the Company’s Quarterly Report on Form 10-Q for the period ended March 31, 2008 (File
No. 1-9965), which Exhibit is incorporated herein by reference.) |
| |
|
|
|
|
| |
3.2 |
|
|
Restated Articles of Incorporation, adopted August 8, 2008. (Reference is made to Exhibit
3.1 of the Company’s Quarterly Report on Form 10-Q for the fiscal quarter ended December
31, 2009 (File no. 1-9965), which Exhibit is incorporated herein by reference.) |
| |
|
|
|
|
| |
4.1 |
|
|
Specimen Share Certificate for the Common Shares, without par value. (Reference is made
to Exhibit 4(a) of the Company’s Annual Report on Form 10-K for the year ended September
30, 1999 (File No. 1-9965), which Exhibit is incorporated herein by reference.) |
| |
|
|
|
|
| |
10.1 |
|
|
Credit Agreement dated as of March 30, 2001 by and among Keithley Instruments, Inc. and
Subsidiary Borrowers and the Lenders and Bank One, NA, as agent. (Reference is made to
Exhibit 10(l) of the Company’s Quarterly Report on form 10-Q for the fiscal quarter ended
March 31, 2001 (File No. 1-9965) which Exhibit is incorporated herein by reference.) |
| |
|
|
|
|
| |
10.2 |
|
|
First Amendment to Credit Agreement, dated August 1, 2002. (Reference is made to Exhibit
10(j) of the Company’s Quarterly Report on Form 10-Q for the quarter year ended June 30,
2002 (File No. 1-9965), which Exhibit is incorporated herein by reference.) |
| |
|
|
|
|
| |
10.3 |
|
|
Second Amendment to Credit Agreement, dated March 28, 2003. (Reference is made to Exhibit
10(l) of the Company’s Quarterly Report on Form 10-Q for the fiscal quarter ended March
31, 2003 (File No. 1-9965), which Exhibit is incorporated herein by reference.) |
| |
|
|
|
|
| |
10.4 |
|
|
Third Amendment to Credit Agreement, dated March 30, 2004. (Reference is made to Exhibit
10(m) of the Company’s Quarterly Report on Form 10-Q for the fiscal quarter ended March
31, 2004 (File No. 1-9965), which Exhibit is incorporated herein by reference.) |
| |
|
|
|
|
| |
10.5 |
|
|
Fourth Amendment to Credit Agreement, dated March 30, 2005. (Reference is made to Exhibit
10(n) of the Company’s Current Report on Form 8-K dated March 30, 2005 (File No. 1-9965),
which Exhibit is incorporated herein by reference.) |
| |
|
|
|
|
| |
10.6 |
|
|
Fifth Amendment to Credit Agreement, dated September 27, 2006. (Reference is made to
Exhibit 10(r) of the Company’s Annual Report on Form 10-K for the fiscal year ended
September 30, 2006 (File No. 1-9965), which Exhibit is incorporated herein by reference.) |
| |
|
|
|
|
| |
10.7 |
|
|
Sixth Amendment to Credit Agreement, dated March 31, 2009. (Reference is made to Exhibit
10.1 of the Company’s Quarterly Report on Form 10-Q for the fiscal quarter ended March
31, 2009 (File No. 1-9965), which Exhibit is incorporated herein by reference.) |
| |
|
|
|
|
| |
10.8 |
|
|
Seventh Amendment to Credit Agreement, dated March 31, 2010. (Reference is made to
Exhibit 10.1 of the Company’s Quarterly Report on Form 10-Q for the fiscal quarter ended
March 31, 2010 (File No. 1-9965), which Exhibit is incorporated herein by reference.) |
| |
|
|
|
|
| |
10.9 |
|
|
Pledge, Assignment and Security Agreement by and between the Company and JPMorgan Chase
Bank dated March 31, 2009. (Reference is made to Exhibit 10.2 of the Company’s Quarterly
Report filed on Form 10-Q for the fiscal quarter ended March 31, 2009 (File No. 1-9965),
which Exhibit is incorporated herein by reference.) |
81
| |
|
|
|
|
| Exhibit |
|
|
|
| Number |
|
|
Description |
| |
|
|
|
|
| |
10.10* |
|
|
Form of Indemnification Agreement entered into by the Company and each of Brian R.
Bachman, James B. Griswold, Leon J. Hendrix, Jr., Joseph P. Keithley, Dr. N. Mohan Reddy,
Barbara Scherer and R. Elton White, as members of the Company’s Board of Directors On
December 2, 2004. (Reference is made to Exhibit 10.1 of the Company’s Current Report on
Form 8-K dated December 2, 2004 (File No. 1-9965), which Exhibit is incorporated herein
by reference.) |
| |
|
|
|
|
| |
10.11* |
|
|
Form of Indemnification Agreement entered into by the Company and each Mark J. Plush and
Linda C. Rae, as executive officers of the Company, on December 2, 2004. (Reference is
made to Exhibit 10.2 of the Company’s Current Report on Form 8-K dated December 2, 2004
(File No. 1-9965), which Exhibit is incorporated herein by reference.) |
| |
|
|
|
|
| |
10.12* |
|
|
Form of Indemnification Agreement entered into by the Company and Brian J. Jackman, as a
member of the Company’s Board of Directors on May 5, 2005. (Reference is made to Exhibit
10.1 of the Company’s Current Report on Form 8-K dated December 2, 2004 (File No.
1-9965), which Exhibit is incorporated herein by reference.) |
| |
|
|
|
|
| |
10.13* |
|
|
Form of Indemnification Agreement entered into by the Company and Thomas A. Saponas, as a
member of the Company’s Board of Directors, on May 11, 2007. (Reference is made to
Exhibit 10.1 of the Company’s Current Report on Form 8-K dated December 2, 2004 (File No.
001-09965), which Exhibit is incorporated herein by reference.) |
| |
|
|
|
|
| |
10.14* |
|
|
Supplemental Executive Retirement Plan. (Reference is made to Exhibit 10(e) of the
Company’s Annual Report on Form 10-K for the year ended September 30, 1999 (File No.
1-9965), which Exhibit is incorporated herein by reference.) |
| |
|
|
|
|
| |
10.15* |
|
|
Keithley Instruments, Inc. Deferred Compensation Plan (Amended and Restated January 1,
2005). (Reference is made to Exhibit 10.7 of the Company’s Quarterly Report on Form 10-Q
for the fiscal quarter ended December 31, 2008 (File No. 1-9965), which Exhibit is
incorporated herein by reference.) |
| |
|
|
|
|
| |
10.16* |
|
|
Keithley Instruments, Inc. Supplemental Deferral Plan (as Amended and Restated January 1,
2008). (Reference is made to Exhibit 10.6 of the Company’s Quarterly Report on Form 10-Q
for the fiscal quarter ended December 31, 2008 (File No. 1-9965), which Exhibit is
incorporated herein by reference.) |
| |
|
|
|
|
| |
10.17* |
|
|
1992 Stock Incentive Plan, as amended. (Reference is made to Exhibit 10(f) of the
Company’s Annual Report on Form 10-K for the year ended September 30, 1999 (File No.
1-9965), which Exhibit is incorporated herein by reference.) |
| |
|
|
|
|
| |
10.18* |
|
|
1992 Directors’ Stock Option Plan. (Reference is made to Exhibit 10(g) of the Company’s
Annual Report on Form 10-K for the year ended September 30, 1999 (File No. 1-9965), which
Exhibit is incorporated herein by reference.) |
| |
|
|
|
|
| |
10.19* |
|
|
1996 Outside Directors Deferred Stock Plan (as Amended and Restated). (Reference is made
to Exhibit 10.2 of the Company’s Quarterly Report on Form 10-Q for the fiscal quarter
ended December 31, 2008 (File No. 1-9965), which Exhibit is incorporated herein by
reference.) |
| |
|
|
|
|
| |
10.20* |
|
|
1997 Directors’ Stock Option Plan (as Amended and Restated). (Reference is made to
Exhibit 10.3 of the Company’s Quarterly Report on Form 10-Q for the fiscal quarter ended
December 31, 2008 (File No. 1-9965), which Exhibit is incorporated herein by reference.) |
| |
|
|
|
|
| |
10.21* |
|
|
Keithley Instruments, Inc. 2005 Employee Stock Purchase and Dividend Reinvestment Plan
(as amended August 2007). (Reference is made to Exhibit 10(z) of the Company’s Annual
Report on Form 10-K for the year ended September 30, 2007 (File No. 1-9965), which
Exhibit is incorporated herein by reference.) |
| |
|
|
|
|
| |
10.22* |
|
|
Keithley Instruments, Inc. 2002 Stock Incentive Plan (as Amended and Restated January 1,
2007). (Reference is made to Exhibit 10.4 of the Company’s Quarterly Report on Form 10-Q
for the fiscal quarter ended December 31, 2008 (File No. 1-9965), which Exhibit is
incorporated herein by reference.) |
| |
|
|
|
|
| |
10.23* |
|
|
Keithley Instruments, Inc. form of option agreement for use in connection with awards
granted under the Keithley Instruments, Inc. 2002 Stock Incentive Plan. (Reference is
made to Exhibit 10.1 of the Company’s Current Report on Form 8-K dated October 3, 2005
(File No. 1-9965), which Exhibits are incorporated herein by reference.) |
| |
|
|
|
|
| |
10.24* |
|
|
Keithley Instruments, Inc. form of option agreement for use in connection with awards
granted under the Keithley Instruments, Inc. 2002 Stock Incentive Plan. (Reference is
made to Exhibit 10(aa) of the Company’s Annual Report on Form 10-K for the year ended
September 30, 2007 (File No. 1-9965), which Exhibit is incorporated herein by reference.) |
| |
|
|
|
|
| |
10.25* |
|
|
Keithley Instruments, Inc. form of restricted unit award agreement for use in connection
with awards granted under the Keithley Instruments, Inc. 2002 Stock Incentive Plan.
(Reference is made to Exhibit 10.3 of the Company’s Current Report on Form 8-K dated
October 3, 2005 (File No. 1-9965), which Exhibits are incorporated herein by reference.) |
| |
|
|
|
|
| |
10.26* |
|
|
Keithley Instruments, Inc. form of restricted unit award agreement for use in connection
with awards granted under the Keithley Instruments, Inc. 2002 Stock Incentive Plan.
(Reference is made to Exhibit 10(cc) of the Company’s Annual Report on Form 10-K for the
year ended September 30, 2007 (File No. 1-9965), which Exhibit is incorporated herein by
reference.) |
82
| |
|
|
|
|
| Exhibit |
|
|
|
| Number |
|
|
Description |
| |
|
|
|
|
| |
10.27* |
|
|
Keithley Instruments, Inc. form of Management Restricted Unit Award Agreement for use in
connection with awards granted under the Keithley Instruments, Inc. 2002 Stock Incentive
Plan. (Reference is made to Exhibit 10.9 of the Company’s Quarterly Report on Form 10-Q
for the fiscal quarter ended December 31, 2008 (File No. 1-9965), which Exhibits are
incorporated herein by reference.) |
| |
|
|
|
|
| |
10.28* |
|
|
Keithley Instruments, Inc. form of performance award agreement for use in connection with
awards granted under the Keithley Instruments, Inc. 2002 Stock Incentive Plan. (Reference
is made to Exhibit 10(bb) of the Company’s Annual Report on Form 10-K for the year ended
September 30, 2007 (File No. 1-9965), which Exhibit is incorporated herein by reference.) |
| |
|
|
|
|
| |
10.29* |
|
|
Keithley Instruments, Inc. 2009 Stock Incentive Plan. (Reference is made to Exhibit 10.10
of the Company’s Form 10-Q for the fiscal quarter ended December 31, 2008 (File No.
1-9965), which Exhibit is incorporated herein by reference.) |
| |
|
|
|
|
| |
10.30* |
|
|
Keithley Instruments, Inc. Annual Incentive Compensation Plan (Amended and Restated as of
January 1, 2008). (Reference is made to Exhibit 10.1 of the Company’s Quarterly Report on
Form 10-Q dated December 31, 2008 (File No. 1-9965), which Exhibit is incorporated herein
by reference.) |
| |
|
|
|
|
| |
10.31* |
|
|
Keithley Instruments, Inc. 2009 Annual Incentive Compensation Plan. (Reference is made to
Exhibit 10.1 of the Company’s Current Report on Form 8-K dated October 31, 2008 (File No.
1-9965), which Exhibit is incorporated herein by reference.) |
| |
|
|
|
|
| |
10.32* |
|
|
Form of Keithley Instruments, Inc. 2002 & 2009 Stock Incentive Plans Performance Award
Agreement. (Reference is made to Exhibit 10.01 of the Company’s Current Report on Form
8-K dated December 4, 2009 (File No. 1-9965), which Exhibit is incorporated herein by
reference.) |
| |
|
|
|
|
| |
10.33* |
|
|
Form of Change in Control Agreement entered into by the Company with each of Joseph P.
Keithley and Linda C. Rae. (Reference is made to Exhibit 10.1 of the Company’s Current
Report on Form 8-K dated August 9, 2010 (File No. 1-9965), which Exhibit is incorporated
herein by reference.) |
| |
|
|
|
|
| |
10.34* |
|
|
Change in Control Agreement entered into by the Company with Larry L. Pendergrass.
(Reference is made to Exhibit 10.2 of the Company’s Current Report on Form 8-K dated
August 9, 2010 (File No. 1-9965), which Exhibit is incorporated herein by reference.) |
| |
|
|
|
|
| |
10.35* |
|
|
Change in Control Agreement entered into by the Company with Daniel A. Faia. (Reference
is made to Exhibit 10.3 of the Company’s Current Report on Form 8-K dated August 9, 2010
(File No. 1-9965), which Exhibit is incorporated herein by reference.) |
| |
|
|
|
|
| |
10.36 |
|
|
Voting Agreement, dated as of September 29, 2010, by and among Danaher Corporation,
Aegean Acquisition Corp. and Keithley Investment Co. Limited Partnership. (Reference is
made to Exhibit 10.1 of the Company’s Current Report on Form 8-K dated September 29, 2010
(File No. 1-9965), which Exhibit is incorporated herein by reference.) |
| |
|
|
|
|
| |
10.37* |
|
|
Amended and Restated Employment Agreement, dated September 29, 2010, by and between
Keithley Instruments, Inc. and Mark J. Plush. (Reference is made to Exhibit 10.2 of the
Company’s Current Report on Form 8-K dated September 29, 2010 (File No. 1-9965), which
Exhibit is incorporated herein by reference.) |
| |
|
|
|
|
| |
10.38* |
|
|
Keithley Instruments, Inc. 2011 Annual Incentive Compensation Plan. (Reference is made
to Exhibit 10.1 of the Company’s Current Report on Form 8-K dated October 15, 2010 (File
No. 1-9965), which Exhibit is incorporated herein by reference.) |
| |
|
|
|
|
| |
22.1 |
|
|
Subsidiaries of the Company |
| |
|
|
|
|
| |
31.1 |
|
|
Certification of Joseph P. Keithley pursuant to Rule 13a-14(a)-15d-14(a). |
| |
|
|
|
|
| |
31.2 |
|
|
Certification of Mark J. Plush pursuant to Rule 13a-14(a)-15d-14(a). |
| |
|
|
|
|
| |
32.1 |
+ |
|
Certification of Joseph P. Keithley pursuant to Rule 13a-14(b) and 18 U.S.C. Section 1350. |
| |
|
|
|
|
| |
32.2 |
+ |
|
Certification of Mark J. Plush pursuant to Rule 13a-14(b) and 18 U.S.C. Section 1350. |
|
|
|
| * |
|
Management contract or compensatory plan or arrangement. |
| |
| + |
|
The certifications furnished pursuant to this item will not be deemed “filed” for purposes of
Section 18 of the Exchange Act (15 U.S.C. 78r), or otherwise subject to the liability of that
section. Such certification will not be deemed to be incorporated by reference into any filing
under the Securities Act or the Exchange Act, except to the extent that the registrant
specifically incorporates it by reference. Item 15(b) Exhibits: See “Index to Exhibits” at
Item 15(a)(3) above. Item 15(c) Financial Statement Schedules: Schedules required to be filed
in response to this portion are listed above in Item 15(a)(2). |
83
ITEM 15(b) EXHIBITS
See “Index to Exhibits” at Item 15(a)(3) above.
ITEM 15(c) FINANCIAL STATEMENT SCHEDULES
Schedules required to be filed in response to this portion are listed above in Item 15(a)(2).
84
SIGNATURES
Pursuant to the requirements of Section 13 or 15(d) of the Securities Exchange Act of 1934, the
Registrant has duly caused this report to be signed on its behalf by the undersigned, thereunto
duly authorized.
Keithley Instruments, Inc.
(Registrant)
| |
|
|
|
|
|
By:
|
|
/s/ Joseph P. Keithley
Joseph P. Keithley, Chairman, President and
|
|
|
|
|
Chief Executive Officer |
|
|
Date: December 15, 2010
Pursuant to the requirements of the Securities Exchange Act of 1934, this report has been signed
below by the following persons on behalf of the Registrant and in the capacities on the date indicated.
| |
|
|
|
|
| Signature |
|
Title |
|
Date |
|
|
|
|
|
/s/ Joseph P. Keithley
Joseph P. Keithley
|
|
Chairman of the Board of Directors,
President and
Chief Executive Officer
(Principal Executive Officer)
|
|
12/15/10 |
|
|
|
|
|
/s/ Mark J. Plush
Mark J. Plush
|
|
Senior Vice President and Chief Financial
Officer
(Principal Financial and
Accounting Officer)
|
|
12/15/10 |
|
|
|
|
|
/s/ Robert S. Lutz
Robert S. Lutz
|
|
Director
|
|
12/15/10 |
|
|
|
|
|
/s/ Frank T. McFaden
Frank T. McFaden
|
|
Director
|
|
12/15/10 |
85