Attached files
| file | filename |
|---|---|
| 8-K - FORM 8-K - EVERGREEN SOLAR INC | b83711e8vk.htm |
Exhibit 99.1

| Evergreen Solar Business Update December 2010 |

| Forward Looking Statements This presentation and any discussion by Management in connection with the presentation include statements regarding expectations, beliefs, strategies, goals, outlook and other non-historical matters. Any such statements are forward-looking statements made pursuant to the safe harbor provisions of Section 21E of the Securities Exchange Act of 1934. Forward-looking statements include but are not limited to statements about the Company's expectations as to the timing, cost, and success of the Company's ongoing and future manufacturing expansions in China, the Company's ability to reduce costs, and the Company's expectations of competitor cost. These and other forward-looking statements are neither promises nor guarantees and are subject to a number of risks and uncertainties that will cause our actual results or the results of our competitors to differ from the expectations in these forward looking statements, including the difficulty of accurately forecasting the cost benefits from new technologies, new operational strategies and operational scaling, the lack of reliability of forecasts regarding the competitive landscape, and other risks and uncertainties described in filings that the Company makes from time-to-time with the Securities and Exchange Commission. Forward-looking statements speak only as of the date they are made and we undertake no obligation to update any of these forward looking statements. 1 |

| Evergreen at a Glance String Ribbon wafers - technology differentiation in a commodity business A patented low cost wafer manufacturing technology is our sustainable competitive advantage Proven technology: Over 480MW of panels made with our String Ribbon wafers produced to date Evergreen Solar's panels are known for high quality and strong performance Existing manufacturing facilities in Devens, MA and Wuhan, China At ~180MW, Devens is among the largest solar panel manufacturing facilities in the U.S. Will continue to produce wafers & cells Transition to outsourced panel assembly to begin in 2011 Wuhan, China facility produces 75MW of wafers cell and panel processing outsourced Technology development focus on commercializing Industry Standard Wafers (ISW) 2 |

| String RibbonTM Wafers |

| Casting and sawing Cast & Cut Wafers (All other silicon based manufacturers) * * * * * * * * * * * * * * * * * * * * * * * * * * * * * * * * * * * * * * * * * * * * * * * * * * * * * * * * * * * * * * * * * * * * * * * * * * * * * * * * * * * * Kerf loss Silicon Usage: Today - 6.5 g/W 2012 ~5.0 g/W 4 Wafer Manufacturing is the Key Difference Direct harvesting String Ribbon Wafers (Evergreen Solar only) Avoids Ingot manufacturing Sectioning Wire saw Kerf loss RIBBONS 1 & 2 RIBBONS 3 & 4 SOLID-MELT INTERFACE MOLTEN SILICON STRING CRUCIBLE SILICON FEED TO LASER CUTTING BOX Significant silicon consumption advantage Silicon Usage: Today - 3.7g/W 2012 ~2.8g/W |

| Non-Silicon Process Cost Lower Silicon Consumption not the Only Advantage String Ribbon "non-silicon" costs are lower than ingot growing and wire slicing, including: String Ribbon crucibles last for up to two weeks of continuous operation. while crucibles required for sliced wafer ingot growing are used only once and are expensive. The "string" in String Ribbon becomes a part of the wafer. There are fewer process steps which reduce the number of consumables and lower maintenance. Wafer slicing uses cutting wires, lubricants, and abrasives, each of which has a finite lifetime and must be land filled after use. String Ribbon furnaces require less energy to produce a wafer. This is attributed to having to melt more than twice as much silicon at over 1,400 degrees Celsius to produce a sliced wafer. 5 |
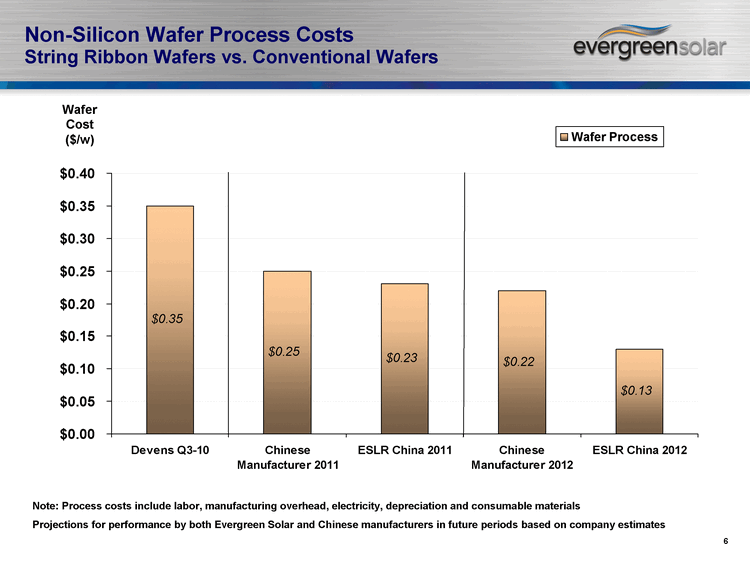
| Non-Silicon Wafer Process Costs String Ribbon Wafers vs. Conventional Wafers Devens Q3-10 Chinese Manufacturer 2011 ESLR China 2011 Chinese Manufacturer 2012 ESLR China 2012 Non-cash Si 0.07 Silicon 0.23 0.3 0.17 0.25 0.12 Wafer Process 0.35 0.25 0.23 0.22 0.13 Wafer Cost ($/w) 6 Note: Process costs include labor, manufacturing overhead, electricity, depreciation and consumable materials Projections for performance by both Evergreen Solar and Chinese manufacturers in future periods based on company estimates |

| Silicon Cost String Ribbon Wafers vs. Conventional Wafers Devens Q3-10 Chinese Manufacturer 2011 ESLR China 2011 Chinese Manufacturer 2012 ESLR China 2012 Non-cash Si 0.07 Silicon 0.23 0.3 0.17 0.23 0.12 Wafer Process 0.35 0.25 0.23 0.2 0.13 Si cost ($/kg) Si usage (g/w) Wafer Cost ($/w) $85/kg ~3.7 g/w $50/kg ~6.0 g/w $50/kg ~3.6 g/w $45/kg ~5.0 g/w $45/kg <2.8 g/w 7 Non-cash Si cost represents amortization of prepaid inventory cost associated with common stock granted to OCI in connection with silicon supply contract Projections for performance by both Evergreen Solar and Chinese manufacturers in future periods based on company estimates |

| Our Sustainable Total Wafer Cost Advantage String Ribbon Wafers vs. Conventional Wafers Devens Q3-10 Chinese Manufacturer 2011 ESLR China 2011 Chinese Manufacturer 2012 ESLR China 2012 Non-cash Si 0.07 Silicon 0.23 0.3 0.17 0.23 0.12 Wafer Process 0.35 0.25 0.23 0.22 0.13 $0.65 Si cost ($/kg) Si usage (g/w) Wafer Cost ($/w) $0.55 $0.40 $0.45 $0.25 ~44% ~27% $85/kg ~3.7 g/w $50/kg ~6.0 g/w $50/kg ~3.6 g/w $45/kg ~5.0 g/w $45/kg <2.8 g/w 8 Non-cash Si cost represents amortization of prepaid inventory cost associated with common stock granted to OCI in connection with silicon supply contract Projections for performance by both Evergreen Solar and Chinese manufacturers in future periods based on company estimates |

| String Ribbon Wafers Enable Lowest-Cost Panels Conventional Cost Leaders Si @ $55 Si @ $45 Conventional Cost Leaders Si @ $55 Si @ $45 ESLR Asia Devens Si @ $45 ESLR Asia Devens Si @ $45 ESLR + Cost Leaders Devens Si @ $45 ESLR + Cost Leaders Devens Si @ $45 Thin film Thin film Today 2012 Today 2012 Today 2012 Today 2012 Silicon $0.31 $0.23 $0.30 $0.12 $0.30 $0.12 Wafer 0.30 0.22 0.35 0.13 0.35 0.13 Cell 0.25 0.20 0.25 0.20 Module 0.35 0.30 0.35 0.30 Total $1.21 $0.95 $1.25 $0.75 $0.80 $0.65 Combined cost structure approaching thin film cost projections 20+% Lower Cost Estimates for current competitor costs, and future costs for Evergreen Solar and competitors, based on company estimates. 9 |
| Wafer Development |

| Focus: Standard Sized Wafer - 156mm x 156 mm Benefits of standard wafers Leverage existing industry capacity in cell and panel processing Implement cell processing best practices more quickly Increase business development opportunities Progress to date Over 30,000 wafers grown to date Wafer characteristics nearly identical to current form factor 10 new furnaces ordered for December delivery Near-term plan ~5MW Pilot operations in U.S. through Q2-11 Provide samples to industry participants for evaluation Expect to have 25MW+ installed capacity in U.S. and China late 2011 11 |
| In Summary |

| Key Investment Thesis Evergreen has commercialized a differentiated technology that is enabling the production of a low cost solar panel Proprietary wafer furnace technology has proven its value as a source of low-cost wafer manufacturing String Ribbon wafers enable the production of the solar industry's lowest-cost panel Industry Standard Wafers produced using String Ribbon processes are beginning to open up new business development opportunities 13 |

| Thank You for Your Attention |

| Appendix September 2010 Financial Information |

| Evergreen Solar, Inc. (Nasdaq: ESLR) Condensed Consolidated Statements of Operations (a) (in thousands, except per share data) (Unaudited) Quarter Ended Year-to-Date Period Ended October 3, October 2, October 3, October 2, 2009 2010 2009 2010 (Adjusted) (Adjusted) Product revenues $ 75,450 $86,026 $192,586 $245,616 Royalty and fee revenues 2,208 497 4,716 3,908 Total revenues 77,658 86,523 197,302 249,524 Cost of revenues 70,092 80,009 187,842 229,725 Gross profit 7,566 6,514 9,460 19,799 Operating expenses: Research and development 4,417 5,101 13,307 15,078 Selling, general and administrative 5,872 13,672 18,990 28,713 Write-off of loan receivable from silicon supplier — - 43,882 — Facility start-up 2,493 5,509 6,639 14,481 Restructuring charges 777 4,925 3,394 13,780 Total operating expenses 13, 559 29,207 86, 212 72, 052 Operating loss (5,993) (22,693) (76,752) (52,253) Other income (expense): Foreign exchange gains (losses), net 2,478 6,334 3,460 (2,845) Interest income 118 380 3,672 1,612 Interest expense (7,683) (11,229) (20,101) (29,002) Gain on early extinguishment of debt — - — 24,777 Other income (expense), net (5,087) (4,515) (12,969) (5,458) Loss before equity loss from interest in Sovello AG, (impairment) recovery of of equity investment, and income tax benefit (11,080) (27,208) (89,721) (57,711) Equity loss from interest in Sovello AG (9,710) — (16,202) — Impairment and other charges associated with equity investment in Sovello AG (69,713) — (69,713) — Recovery of impairment charges associated with Sovello AG — - — 3,227 Income tax benefit (7,805) — (7,805) — Net loss $ (82,698) $ (27,208) $ (167,831) $ (54,484) Net loss per share (basic and diluted) $ (0.40) $ (0.13) $ (0.92) $ (0.27) Weighted average shares used in computing basic and diluted net loss per share 204,790 205,501 182,250 205,361 Evergreen Solar Confidential (a) On January 1, 2010, the Company adopted the FASB’s update to the Debt topic of the FASB codification which requires an entity that enters into an equity-classified share lending agreement, utilizing its own shares, in contemplation of a convertible debt issuance or other financing to initially measure the share lending arrangement at fair value and treat it as a cost of the financing. In addition, if it becomes probable that the counterparty to the arrangement will default, the issuer shall recognize an expense for the fair value of the unreturned shares, net of probable recoveries. These rules require revision of prior periods to conform to current accounting. 16 |

| Evergreen Solar, Inc. (Nasdaq: ESLR) Condensed Consolidated Balance Sheets (a) (in thousands, except share data) (Unaudited) December 31, October 2, 2009 2010 (Adjusted) Assets Current assets: Cash and cash equivalents $112,368 $93,275 Accounts receivable, net of allowances for doubtful accounts 53,295 59,390 Inventory 34,890 47,140 Prepaid cost of inventory 25,634 34,524 Other current assets 11,451 25,001 Total current assets 237,638 259,330 Restricted cash 3,134 6,710 Deferred financing costs 8,312 10,249 Loan receivable from Jiawei and related interest - 13,311 Prepaid cost of inventory 147,573 121,213 Fixed assets, net 430,681 423,936 Other assets 295 302 Total assets $827,633 $835,051 Liabilities and stockholders’ equity Current liabilities: Accounts payable and accrued expenses $31,420 $37,712 Due to Sovello AG and related guarantees 17,544 — Accrued employee compensation 7,287 4,533 Accrued interest 7,004 11,372 Accrued warranty 2,368 3, 515 Total current liabilities 65,623 57,132 Convertible notes, net of discount 323,276 386,899 Loan and related interest payable 34,152 36,786 Deferred income taxes 5,396 5,396 Total liabilities 428,447 486,213 Commitments and contingencies Stockholders’ equity: Common stock, $ 0.01 par value, 450, 000,000 shares authorized, 207,809,919 and 208,908,066 shares issued and outstanding at December 31, 2009 and October 2, 2010, respectively 2,078 2,089 Additional paid-in capital 1,028,233 1,032,108 Accumulated deficit (631,119) (685,603) Accumulated other comprehensive income (loss) (6) 244 Total stockholders’ equity 399,186 348,838 Total liabilities and stockholders’ equity $827,633 $835,051 Evergreen Solar Confidential (a) On January 1, 2010, the Company adopted the FASB’s update to the Debt topic of the FASB codification which requires an entity that enters into an equity-classified share lending agreement, utilizing its own shares, in contemplation of a convertible debt issuance or other financing to initially measure the share lending arrangement at fair value and treat it as a cost of the financing. In addition, if it becomes probable that the counterparty to the arrangement will default, the issuer shall recognize an expense for the fair value of the unreturned shares, net of probable recoveries. These rules require revision of prior periods to conform to current accounting. 17 |

| Evergreen Solar, Inc. (Nasdaq: ESLR) Condensed Consolidated Statements of Cash Flows (a) (in thousands) (Unaudited) Year-to-Date Period Ended October 3, October 2, 2009 2010 (Adjusted) Cash flows from operating activities: Net loss $ (167,831) $ (54,484) Adjustments to reconcile net loss to net cash used in operating activities: Depreciation expense 29,067 46,237 Gain on early extinguishment of debt — (24,777) Imputed interest and accretion of bond premiums (478) — Bad debt expense — 6,389 Amortization of prepaid cost of inventory 7,479 9,424 Equity loss from Sovello AG and impairment of investment 85,915 — Amortization of deferred debt financing costs 1,796 1,973 Loss on loan receivable from silicon supplier 43,882 — Loss on disposal of fixed assets — 494 Provision for warranty 962 1,229 Amortization of debt discount 8,731 7,629 Compensation expense associated with employee equity awards 5, 253 3, 476 Changes in operating assets and liabilities: Accounts receivable (29,707) (12,484) Inventory and related prepaid cost of inventory (7,670) (3,245) Other current assets (2,208) (13,550) Accounts payable and accrued expenses (26,159) 1,971 Interest payable 2,045 5,817 Deferred income taxes (7,805) — Other 2,685 (200) Net cash used in operating activities (54,043) (24,101) Cash flows from investing activities: Purchases of fixed assets and deposits on fixed assets under construction (101,331) (40,042) Proceeds from the disposal of fixed assets — 62 (Increase) decrease in restricted cash (2,914) (3,561) Increase in Sovello AG loan (11,750) — Capital contribution to Sovello AG (2,917) — Payments associated with sale of Sovello AG and associated guarantee — (14,804) Increase in other loans — (12,800) Proceeds from sale and maturity of marketable securities 76,716 — Net cash used in investing activities (42,196) (71,145) Cash flows from financing activities: Proceeds from the issuance of convertible secured debt, net of offering costs — 158,557 Early redemption of senior convertible debt, net of redemption costs — (82,354) Payment associated with share increase — (144) Proceeds from the issuance of common stock, net of offering costs 72,387 — Proceeds from China government loan 13,592 — Proceeds from exercise of stock options and shares purchased under Employee Stock Purchase Plan 332 94 Net cash provided by financing activities 86,311 76,153 Net increase (decrease) in cash and cash equivalents (9,928) (19,093) Cash and cash equivalents at beginning of period 100,888 112,368 Cash and cash equivalents at end of period $90, 960 $93, 275 Evergreen Solar Confidential (a) On January 1, 2010, the Company adopted the FASB’s update to the Debt topic of the FASB codification which requires an entity that enters into an equity-classified share lending agreement, utilizing its own shares, in contemplation of a convertible debt issuance or other financing to initially measure the share lending arrangement at fair value and treat it as a cost of the financing. In addition, if it becomes probable that the counterparty to the arrangement will default, the issuer shall recognize an expense for the fair value of the unreturned shares, net of probable recoveries. These rules require revision of prior periods to conform to current accounting. 18 |