Attached files
Table of Contents
UNITED STATES
SECURITIES AND EXCHANGE COMMISSION
WASHINGTON, D.C. 20549
FORM 10-K
| þ | ANNUAL REPORT PURSUANT TO SECTION 13 OR 15(d) OF THE SECURITIES EXCHANGE ACT OF 1934 |
FOR THE FISCAL YEAR ENDED DECEMBER 31, 2010
OR
| ¨ | TRANSITION REPORT PURSUANT TO SECTION 13 OR 15(d) OF THE SECURITIES EXCHANGE ACT OF 1934 |
For the transition period from to .
Commission File Number 0-31687
EVERGREEN SOLAR, INC.
(Exact name of registrant as specified in its charter)
| Delaware | 04-3242254 | |
| (State or other jurisdiction of incorporation or organization) |
(I.R.S. Employer Identification No.) | |
| 138 Bartlett Street Marlboro, Massachusetts 01752 |
(508) 357-2221 | |
| Address of principal executive offices) (zip code) | (Registrant’s telephone number, including area code) | |
Securities registered pursuant to Section 12(b) of the Act:
| Title of each class |
Name of each exchange on which registered | |
| Common Stock, Par Value $.01 Per Share | The NASDAQ Stock Market LLC |
Securities registered pursuant to Section 12(g) of the Act:
None
(Title of class)
Indicate by check mark if the registrant is a well-known seasoned issuer, as defined in Rule 405 of the Securities Act. ¨ Yes þ No
Indicate by check mark if the registrant is not required to file reports pursuant to Section 13 or Section 15(d) of the Exchange Act. ¨ Yes þ No
Indicate by check mark whether the registrant (1) has filed all reports required to be filed by Section 13 or 15(d) of the Securities Exchange Act of 1934 during the preceding 12 months (or for such shorter period that the registrant was required to file such reports), and (2) has been subject to such filing requirements for the past 90 days. þ Yes ¨ No
Indicate by check mark whether the registrant has submitted electronically and posted on its corporate website, if any, every Interactive Data File required to be submitted and posted pursuant to Rule 405 of Regulation S-T (§232.405 of this chapter) during the preceding 12 months (or for such shorter period that the registrant was required to submit and post such files). ¨ Yes ¨ No
Indicate by check mark if disclosure of delinquent filers pursuant to Item 405 of Regulation S-K is not contained herein, and will not be contained, to the best of registrant’s knowledge, in definitive proxy or information statements incorporated by reference in Part III of this Form 10-K or any amendment to this Form 10-K. ¨
Indicate by check mark whether the registrant is a large accelerated filer, an accelerated filer, a non-accelerated filer, or a smaller reporting company. See the definitions of “large accelerated filer,” “accelerated filer” and “smaller reporting company” in Rule 12b-2 of the Exchange Act. (Check one):
| Large accelerated filer ¨ | Accelerated Filed | þ | ||||
| Non-accelerated filer ¨ | (do not check if a smaller reporting company) | Smaller Reporting Company | ¨ |
Indicate by check mark whether the registrant is a shell company (as defined in Rule 12b-2 of the Act). ¨ Yes þ No
The aggregate market value of the registrant’s voting and non-voting common equity held by non-affiliates as of July 3, 2010 was approximately $113.5 million.
As of February 25, 2011, there were 38,652,813 shares of the registrant’s Common Stock, $.01 par value per share, outstanding.
Table of Contents
| Page | ||||||
| Item 1. |
Business | 3 | ||||
| Item 1A. |
Risk Factors | 14 | ||||
| Item 2. |
Properties | 29 | ||||
| Item 3. |
Legal Proceedings | 30 | ||||
| Item 5. |
Market for the Registrant’s Common Equity, Related Stockholder Matters and Issuer Purchases of Equity Securities | 31 | ||||
| Item 6. |
Selected Financial Data | 33 | ||||
| Item 7. |
Management’s Discussion and Analysis of Financial Condition and Results of Operations | 36 | ||||
| Item 7A. |
Quantitative and Qualitative Disclosures About Market Risk | 56 | ||||
| Item 8. |
Financial Statements and Supplementary Data | 56 | ||||
| Item 9A. |
Controls and Procedures | 57 | ||||
| Item 9B. |
Other Information | 58 | ||||
| Item 10. |
Directors, Executive Officers and Corporate Governance | 59 | ||||
| Item 11. |
Executive Compensation | 59 | ||||
| Item 12. |
Security Ownership of Certain Beneficial Owners and Management and Related Stockholder Matters | 59 | ||||
| Item 13. |
Certain Relationships and Related Transactions, and Director Independence | 59 | ||||
| Item 14. |
Principal Accounting Fees and Services | 59 | ||||
| Item 15. |
Exhibits, Financial Statement Schedule | 60 | ||||
| F-3 | ||||||
| F-4 | ||||||
| F-5 | ||||||
| F-6 | ||||||
| F-7 | ||||||
Table of Contents
Forward-Looking Statements
This Annual Report on Form 10-K, including “Management’s Discussion and Analysis of Financial Condition and Results of Operations” in Item 7 of this report and the documents incorporated by reference herein, contain forward-looking statements that involve risks, uncertainties and assumptions, including those discussed in Item 1A of “Risk Factors” in this report. If the risks or uncertainties ever materialize or any of the assumptions prove incorrect, our results will differ from those expressed or implied by such forward-looking statements and assumptions. All statements other than statements of historical fact are statements that could be deemed forward-looking statements, including but not limited to statements regarding:
| • | our future growth, revenue, earnings and gross margin improvement; |
| • | our ability to meet manufacturing cost and yield targets in our Wuhan, China manufacturing facility; |
| • | the completion of our Midland, Michigan and Wuhan, China facilities and Jiawei Solar (Wuhan) Co., Ltd.’s Wuhan, China facilities and other potential capacity expansions, and the timing of such facilities becoming fully operational and meeting manufacturing capacity goals on schedule and within budget; |
| • | the timing of the shutdown of our Devens, Massachusetts manufacturing facility, the size of any cash costs or non-cash charges associated with the shutdown and the anticipated impact of the shutdown on our overall cash position; |
| • | the sufficiency of our cash and cash equivalents; access to capital markets to satisfy our anticipated cash requirements or to restructure our outstanding indebtedness; and possible sales or exchanges of securities and our planned use of proceeds from such sales; |
| • | capital requirements to respond to competitive pressures, including production of industry standard wafers, and acquire complementary businesses and necessary technologies; |
| • | costs associated with research and development, building or improving manufacturing facilities, general and administrative expenses and business growth; |
| • | the demand, pricing and market for our products, shifts in our geographic product revenue mix, and our position in the solar power market; |
| • | the making of strategic investments and expansion of strategic partnerships, manufacturing operations and distribution networks; and the future benefit of these activities; |
| • | the operating efficiency of our manufacturing facilities, including increases in manufacturing scale and technological improvements needed to continuously reduce the cost per watt to manufacture our industry standard wafers; |
| • | revenue from customer contracts primarily denominated in Euros that are subject to foreign currency exchange risks and the use of derivative financial instruments to manage those risks; |
| • | our receipt of government sponsored financing and other funding to support our expansion and our ability to satisfy associated obligations; |
| • | our expectations regarding product performance and technological competitiveness; |
| • | our ability to obtain or produce key materials; and |
| • | the benefits of our proprietary technology and new manufacturing processes and other developments, including development of the industry standard size wafer furnaces and other continued enhancements of our wafer, cell and panel production technologies. |
There are numerous risks and uncertainties which could cause our actual results to differ materially from such forward-looking statements, including, for example:
| • | unexpected materials shortages or price increases; |
1
Table of Contents
| • | the uncertainty involved in forecasting the cost benefits from new technologies, new operational strategies and operational scaling; |
| • | the possibility that we may be unable to fund future wafer manufacturing expansions; |
| • | the complexity of forecasting product pricing and customer demand in a volatile and uncertain market for our products; and |
| • | our expectations regarding the impact of the shutdown of our Devens, Massachusetts manufacturing facility may not be correct. |
These statements may be identified with such words as “we expect,” “we believe,” “we anticipate” or similar indications of future expectations. These statements are neither promises nor guarantees and involve risks and uncertainties, which could cause our actual results to differ materially from such forward-looking statements. Such risks and uncertainties constitute forward-looking statements and are made under the safe harbor provisions of Section 27A of the Securities Act of 1933, as amended, and Section 21E of the Securities Exchange Act of 1934, as amended. Our actual results of operations and financial condition have varied and could in the future vary significantly from those stated in any forward-looking statements. The factors described in Part I, Item 1A, “Risk Factors,” in this Annual Report on Form 10-K for the year ended December 31, 2010, could cause actual results to differ materially from those contained in forward-looking statements made in this Annual Report on Form 10-K, in the documents incorporated by reference into this Annual Report on Form 10-K or presented elsewhere by our management from time to time. Such factors, among others, could have a material adverse effect upon our business, results of operations and financial condition We disclaim any obligation to update publicly or revise any such statements to reflect any change in our expectations, or events, conditions, or circumstances on which any such statements may be based, or that may affect the likelihood that actual results will differ from those set forth in such forward-looking statements.
2
Table of Contents
| ITEM 1. | BUSINESS. |
BUSINESS OVERVIEW
We develop and manufacture multi-crystalline silicon wafers utilizing our String Ribbon™ proprietary wafer technology. Our technology involves a unique process to produce multi-crystalline silicon wafers by growing thin strips of silicon that are then cut into wafers. This process substantially reduces the amount of silicon and other processing costs required to produce a wafer when compared to conventional sawing processes. Silicon is the key raw material in manufacturing multi-crystalline silicon wafers. With current silicon consumption of about 3.6 grams per watt, we believe we are the industry leader in efficient silicon consumption and use approximately half the silicon used by wafer manufacturers utilizing conventional sawing processes. The wafers we produce are the primary components of photovoltaic (“PV”) cells which, in turn, are used to produce solar panels (also referred to as solar modules). We believe that our proprietary and patented technologies offer significant cost and manufacturing advantages over competing silicon-based wafer manufacturing technologies. Our wafer manufacturing technology is proven, as over 500 megawatts (“MW”) of solar panels have been produced and sold utilizing String Ribbon wafers, produced primarily from our facilities in Devens, Massachusetts and our new facility in Wuhan, China as well as Sovello AG (our former joint venture with Renewable Energy Corporation ASA and Q-Cells SE).
Historically, we have produced non-standard size rectangular wafers that were then processed into Evergreen Solar branded solar panels primarily in our own fully integrated factory in Devens, Massachusetts. During 2010, we began production at our 75 MW wafer facility in Wuhan, China and we have contracted with another manufacturer to process our wafers into cells and Evergreen Solar branded panels. Our revenues today are primarily derived from the sale of solar panels. We sell our products using distributors, systems integrators and other value-added resellers, who often add value through system design by incorporating our panels with electronics, structures and wiring systems. Applications for our products primarily include on-grid generation, in which supplemental electricity is provided to an electric utility grid. Our products are currently sold to customers primarily in Europe. We currently have active sales contracts with two customers in Germany, which we expect will consume a substantial portion of our capacity during 2011. However, we have recently announced our intention to focus on our wafer manufacturing technology and thus future revenue growth will be driven by the successful expansion of wafer capacity and sales.
We produce wafers today that are among the lowest cost in the industry. To illustrate this point, today our non-silicon processing costs in Devens are $0.35 per watt. This compares to $0.25 to $0.30 per watt for a large scale Chinese manufacturer today. Since we use about 3.6 grams of silicon today, and the rest of the industry generally uses 6 to 7 grams, our silicon cost is substantially lower. When our Wuhan facility reaches full operating metrics by late-2011, our non-silicon processing costs are expected to be about $0.23 per watt. This compares to an estimated $0.25 per watt for our still larger Chinese competitors, and then only the best of breed companies. Assuming silicon costs of $50 per kilogram, we expect to reduce our fully loaded wafer costs to $0.40 per watt in our small Wuhan facility, which compares to $0.55 per watt for our much larger competitors consisting of $0.30 per watt for silicon and $0.25 per watt for processing.
Our target is to reduce non-silicon process cost further, at commercial scale, to $0.13 per watt by the end of 2013, which is substantially less than the projections of Chinese manufacturers. With silicon consumption projected at 2.7 grams per watt or less as we further improve our process and reduce consumable materials costs, our fully loaded wafer costs are expected to be about $0.25 per watt in 2013, assuming silicon costs of $45 per kg . We believe our non-silicon process cost will ultimately be better than the best wafer manufacturers in the world because the “non-silicon” costs used in the manufacturing of String Ribbon wafers are lower than those used in ingot growing and wire slicing, including:
| • | Crucibles used for sliced wafer ingot growing are used only once and are expensive. Crucibles used for making String Ribbon wafers last for up to two weeks of continuous operation. |
3
Table of Contents
| • | Wafer slicing uses cutting wires, lubricants, and abrasives, each of which has a finite lifetime and must be disposed of after use. The “string” used in String Ribbon wafers becomes integrated in of the wafer and there are fewer process steps requiring less consumables and lower maintenance. |
| • | In terms of energy consumption, sliced wafers require more to produce. This is attributed to having to melt more than twice as much silicon at over 1,400 degrees Celsius to produce a sliced wafer than a String Ribbon wafer. |
Our focus moving forward will be on our wafer manufacturing technology and developing an industry standard size wafer. Development activities associated with the industry standard size wafer have progressed substantially in the second half of 2010, resulting in the production of more than 60,000 wafers using modified existing quad furnaces. These wafers perform comparably to the rectangular wafers produced using our existing quad furnaces in Devens and Wuhan. Ten prototype furnaces will be installed and we will begin producing industry standard size wafers in much greater quantities in early 2011. Pilot production of up to 25 MW is expected to begin by the fourth quarter of 2011. Our future expansion will be based on the industry standard size wafer which is central to our strategy of manufacturing the lowest cost wafer, in an industry standard form factor, and providing a wafer that would enable the lowest cost solar panel utilizing multi-crystalline silicon wafers.
In January 2011, we announced our intent to shut down operations at our Devens manufacturing facility to preserve our liquidity and better position us to pursue our industry standard size wafer strategy. We intend to completely shut down the Devens manufacturing facility by the end of the first quarter of 2011. While overall demand for solar may increase, we expect that significant capacity expansions in low cost manufacturing regions combined with potential adverse changes in government subsidies in several markets in Europe will likely result in continuing pressure on solar panel selling prices throughout 2011 and into 2012. Solar manufacturers in China have received considerable government and financial support and, together with their low manufacturing costs, have become price leaders within the industry. Although production costs at our Devens facility have steadily decreased, they are still much higher than those of our low cost competitors in China. As industry selling prices continue their rapid declines into 2011, panel manufacturing in Devens, either fully or partially, is no longer economically feasible, consequently requiring a complete shutdown of the facility. As a result of the pending closure, our total product revenue for 2011 is expected to substantially decrease; and beyond the first quarter of 2011, revenues will only be generated from product produced at our Wuhan facility. With approximately 75 MW of installed wafer capacity in Wuhan, we will continue to supply our outsourcing partner, Jiawei, with wafers for conversion into Evergreen Solar branded solar panels. We will also continue to operate our high temperature filament plant in Midland, Michigan.
At December 31, 2010, we had approximately $68.4 million of cash and cash equivalents, including restricted cash. The Company is subject to risks common to companies in the high-technology and energy industries including, but not limited to, development by our competitors of new technological innovations, dependence on key personnel, dependence on key or sole source suppliers for materials, protection of proprietary technology and compliance with government regulations. Any delay in our plan to implement our business strategy may result in increased costs and could impair business operations.
We believe that our business plan will provide sufficient liquidity to fund our operating needs for the next 12 months. While our business plan anticipates certain levels of potential risk, particularly in light of the difficult and uncertain current economic environment and the continuing reduction of industry panel pricing caused by competition, especially from China, and the resulting excess capacity, we are exposed to additional particular risks and uncertainties including, but not limited to:
| • | the need for our Wuhan manufacturing facility to ramp to 75 MW of capacity and achieve its target manufacturing cost of $1.25 per watt by mid 2012; |
| • | the need for us to continue to make progress on the development of our planned industry standard wafer expansion program allowing further opportunities for growth, including establishing relationships with potential partners and customers for our wafers; |
4
Table of Contents
| • | continued significant fluctuation of the Euro against the U.S. dollar, as a substantial portion of sales are denominated in Euros; and |
| • | the ability of Jiawei to effectively manage production and manufacturing costs which has an indirect impact on the prices charged to us. |
Although our current business plan indicates that we have adequate liquidity to operate under expected operating conditions, the risks noted above could result in liquidity uncertainty. Our plan with regard to this uncertainty includes, among other actions, to continually monitor our operating results against expectations and, if required, to further restrict operating costs and capital spending if events warrant, and if market conditions allow, possibly accessing the capital markets to meet liquidity and capital expenditure requirements. If additional capital is needed and does not become available on acceptable terms, our ability to fund operations, further develop and expand our manufacturing operations and distribution network or otherwise respond to competitive pressures would be significantly limited. In addition, although our long-term debt does not begin to mature until April 2013 (see Note 7 of our consolidated financial statements), we will actively work to identify sources of liquidity to assist in our ability to repay the debt when it becomes due. There is no assurance that such additional sources of liquidity to repay long-term debt can be obtained on terms acceptable to us, or at all.
Sovello AG Joint Venture
Under our technology licensing and sales support agreements with Sovello, we received royalty and sales fees of $16.7 million, $4.7 million and $4.4 million in 2008, 2009 and 2010, respectively. Until December 31, 2008, we marketed and sold all solar panels manufactured by Sovello under the Evergreen Solar brand, as well as managed customer relationships and contracts related to the sale of Sovello manufactured product. In 2009, Sovello began marketing and selling products under its own brand. Sovello continued to manufacture some Evergreen Solar-branded product in 2009, but, with its independent sales and marketing team now in place, our involvement in marketing and selling Sovello product had ceased.
Despite our success in rapidly expanding Sovello’s production capacity and the benefits the joint venture had provided Evergreen Solar in terms of proving the cost effectiveness of our unique technology, Sovello’s business faced significant financial difficulties as a result of the overwhelming 2009 market downturn in demand and pricing for its products, and was in default under its bank loan agreement. In light of this and other financial difficulties, we wrote-off our aggregate investment in Sovello during 2009 in addition to recording charges associated with a guarantee and for estimated payments relating to undertakings with Sovello’s bank and for other expected costs which combined totaled approximately $126.1 million.
On April 21, 2010, all of the outstanding shares of Sovello were sold to Rolling Hills S.à.r.l, an affiliate of Ventizz Capital Fund IV, L.P (“Ventizz”). In connection with the closing of the sale, our existing technology license agreements with Sovello were terminated and a new technology license agreement was entered into, allowing Sovello to continue using our wafer manufacturing technology to produce String Ribbon® solar panels. Under the terms of the new license agreement, Sovello agreed to pay us $2 million in royalties in 2010 and $3 million in each of the subsequent 2 years for its existing capacity (see Note 5 of our consolidated financial statements).
INDUSTRY BACKGROUND
Overview
The electric power industry is one of the world’s largest industries. Furthermore, electric power accounts for a growing share of overall energy use. While a majority of the world’s current electricity supply is generated from fossil fuels such as coal, oil and natural gas, these traditional energy sources face a number of challenges including rising prices, security concerns over dependence on imports from a limited number of countries, which have significant fossil fuel supplies and growing environmental concerns over the climate change risks associated
5
Table of Contents
with power generation using fossil fuels. As a result of these and other challenges facing traditional energy sources, governments, businesses and consumers are increasingly supporting the development of alternative energy sources, including solar energy.
The solar power market has grown significantly in the past decade. According to Solarbuzz, the global solar power market, as measured by annual solar power system installations, increased from 598 MW in 2003 to 15 gigawatts in 2010, representing an approximate CAGR of 58%. Despite the rapid growth, solar energy constitutes only a small fraction of the world’s energy output and therefore may have significant growth potential.
Key Growth Drivers and Advantages of Solar Power
Solar power generation has emerged as one of the most rapidly growing renewable sources of electricity. Solar power generation has several advantages over other forms of electricity generation that have driven and will continue to drive the growth of the solar power industry:
| • | An Increase in Solar Power Generation Will Reduce Dependence on Fossil Fuels. Worldwide demand for electricity is expected to grow by over 50% from 20.6 billion MW hours in 2010 to 31.8 billion MW hours in 2030, according to the U.S. Department of Energy. The combination of declining finite fossil fuel energy resources and increasing energy demand is depleting natural resources as well as driving up electricity costs, underscoring the need for reliable renewable energy production. Solar power systems are renewable energy sources that rely on the sun as an energy source and do not require a fossil fuel supply. As such, they are well positioned to offer a sustainable long-term alternative means of power generation. |
| • | Environmental Advantages. Solar power is one of the cleanest electric generation sources, capable of generating electricity without air or water emissions, noise, vibration, habitat impact or waste generation. In particular, solar power does not generate greenhouse gases that contribute to global climate change or other air pollutants, as power generation based on fossil fuel combustion does, and does not generate radioactive or other wastes as nuclear power and coal combustion do. It is anticipated that greenhouse gas regulation in the United States and internationally will increase the costs and constrain the development of fossil fuel based electric generation and increase the attractiveness of solar power as a renewable electricity source. |
| • | Flexible Locations. From tiny solar cells powering a hand-held calculator, to an array of rooftop panels powering an entire home, to acres of panels on a commercial building roof or field, solar power products can be deployed in many sizes and configurations and can be installed almost anywhere in the world. Solar power is among the best technologies for power generation in urban areas, environmentally sensitive areas and geographically remote areas in both developing and developed countries. |
| • | Government Incentives. Several European countries, Japan and the United States presently account for the majority of world market demand for solar power systems. Government policies in these countries, in the form of both regulation and incentives, have accelerated the adoption of solar technologies by businesses and consumers. Typical government incentives include capital cost rebates, feed-in tariffs, tax credits and net metering. |
The Solar Power Industry Value Chain
Crystalline silicon-based technologies and thin-film technologies are the two primary technologies currently used in the solar power industry.
In the conventional crystalline silicon-based processes, silicon feedstock is processed into ingots, which are then sliced into solar wafers. The wafers are manufactured into solar cells through a multiple step manufacturing process that entails etching, doping, coating and applying electrical contacts. Solar cells are then interconnected and packaged to form solar panels, which together with system components such as batteries and inverters, are installed as solar power systems.
6
Table of Contents
The conventional crystalline silicon-based wafer manufacturing process differs substantially from our proprietary wafer manufacturing technology. Our technology involves a cost-effective process for manufacturing thin strips of crystalline silicon that are cut into wafers using an automated laser process integrated with our furnace. With silicon consumption of approximately 3.6 grams per watt, we believe we are the industry leader in efficient polysilicon consumption and use about half of the silicon used by wafer manufacturers utilizing conventional sawing processes.
In contrast to the crystalline silicon-based wafer manufacturing process, thin film technology involves depositing several thin layers of complex materials such as Copper Indium Gallium Diselenide, or CIGS, or Cadmium Telluride, or CdTe, on a substrate, such as glass, to make a solar cell. There will continue to be significant efforts to develop alternate solar technologies, such as Amorphous Silicon, CIGS, CdTe, crystalline silicon on glass and polymer and nano technologies. Certain thin film technologies are gaining commercial acceptance and are important to broadening the demand for solar energy products for diverse energy generation applications.
Key Challenges for Solar Power
Although solar power can provide a cost-effective alternative for off-grid applications, we believe the principal challenge to widespread adoption of solar power for on-grid applications is reducing manufacturing costs so that the cost of installed solar power is equal to or less than the cost of grid-generated electricity without impairing product reliability. This concept is known as reaching grid parity. We believe the following challenges of solar power technology must be overcome in order to reach grid parity:
| • | Continued Reliance on Government Support and Incentives. At present, most renewable energy sources would not be cost-competitive compared to traditional energy sources without government support. The PV industry relies on governmental incentives to encourage production and consumption, especially for on-grid systems. Changes in government policies could lead to a reduction in incentives and subsidies to the renewable energy sector, which could in turn seriously hinder the growth of the PV industry. |
| • | Reduced Manufacturing Cost. The cost of producing PV panels must be reduced to a point that will enable manufacturers to produce product to support reaching grid parity. One of the most dominant costs of producing crystalline silicon-based solar panels is silicon. The reduction of raw materials waste, particularly the waste associated with sawing silicon by conventional crystalline silicon wafer production technology, known as kerf loss, is a key factor in lowering wafer manufacturing costs. |
| • | Reduced Capital Costs. Decrease the costs and risks associated with new plant investments to lower capital costs per unit of production. |
| • | Improved Product Design and Performance. Increase product conversion efficiency and ease of use. Conversion efficiency refers to the fraction of the sun’s energy converted to electricity. |
We further believe the two principal solar power technologies, conventional crystalline silicon and thin films, are not adequately addressing these challenges:
| • | Crystalline Silicon. Crystalline silicon technology was the earliest practiced solar wafer fabrication technology and continues to be the dominant technology for the market, accounting for approximately 78% of solar cell production in 2009, according to Solarbuzz. Conventional crystalline silicon technology involves sawing thin wafers from solid crystalline silicon blocks. Crystalline silicon products are known for their reliability, performance and longevity. However, factors such as high materials waste from sawing, complex processing procedures and high capital costs have limited the speed at which conventional crystalline silicon wafer manufacturers can reduce manufacturing costs. |
| • | Thin Films. While most major solar power manufacturers currently rely on crystalline silicon technology for their solar cell production, these manufacturers, and other new entrants, are also developing alternative thin film technologies to achieve lower manufacturing costs. Thin film |
7
Table of Contents
| technology involves depositing several thin layers of complex materials such as CIGS or CdTe on a substrate, such as glass, to make a solar cell. Although thin film technologies generally use certain key materials more efficiently than conventional crystalline silicon manufacturing technology, such technologies have disadvantages such as lower conversion efficiency and, in some cases, reduced product performance and reliability. |
OUR BUSINESS
Our Competitive Strengths
We believe we are well-positioned to be a leader in the solar power industry based on the following competitive strengths:
Proven Wafer Manufacturing Technology. Large-scale commercial application of our technology, using furnaces that grow two thin strips of multi-crystalline silicon, began in 2005 with the opening of Sovello. Through on-going research and design efforts and process changes, we continuously improve our wafer manufacturing technology and our ability to manufacture multi-crystalline silicon wafers. Our manufacturing facilities in Devens and in Wuhan use our Quad wafer furnace equipment, which grows four thin strips of multi-crystalline silicon from one furnace and incorporates a state of the art automated laser cutting technology that further improves our wafer manufacturing process. We have further developed our wafer manufacturing technology to produce an industry standard size wafer which will begin pilot production during 2011. Over 500 MW of solar panels have been produced and sold utilizing String Ribbon wafers, produced primarily from our facilities in Devens, Massachusetts and our new facility in Wuhan, China as well as Sovello.
Proven Ability to Execute on New Factory Expansion. We have consistently proven our ability to ramp substantial manufacturing operations that utilize our unique technology. Our management team, engineers and other support staff were responsible for the successful ramp of Sovello’s manufacturing facilities during 2005 to 2007. We also successfully ramped our Devens, Massachusetts facility. Most recently we have successfully ramped our manufacturing operations in Wuhan, China which opened for operations in September 2010.
Proven Low-Cost Wafer Manufacturing Technology. Leveraging the strength of our Quad technology, we reduced our wafer cost to approximately $0.65 per watt during the fourth quarter of 2010 from $0.69 per watt in the fourth quarter of 2009, as we reduced silicon consumption to an industry leading 3.6 grams per watt and improved our operating metrics. We achieved this with an average silicon cost of about $85 per kilogram in the fourth quarter of 2010. We believe Devens is producing wafers that are cost competitive with many of the larger Chinese wafer manufacturers today, despite the high silicon cost and being located in a high cost region. We also believe that we have not yet realized the full benefits of our technology, which is in the early stage of its life cycle. Nor have we obtained the benefits that even larger-scale manufacturing brings. We expect that, with our proprietary technology, we will achieve a total wafer manufacturing cost of approximately $0.25 per watt in 2013 in China.
Established Brand and Recognized Leader in Quality and Performance. Our solar panel products are globally recognized as leaders in quality and performance. Based upon the power attributes of our solar panels, our products have consistently performed among the highest in the industry in terms of electricity delivered per kilowatt installed.
Strong, Experienced Management Team. Michael El-Hillow, our President and Chief Executive Officer, and our other executive team members, have guided us in becoming an emerging manufacturing leader in the solar energy industry. They are dedicated to the continuous development of our technologies, including development of an industry standard size wafer, to enhance our competitive advantage in the cost-efficient production of solar cells. With this talented group of experienced executives from various technology, manufacturing and other relevant backgrounds, we expect to execute on our current business plan and drive continued and rapid growth.
8
Table of Contents
Our Growth Strategies
Historically, we have produced wafers that were then processed into Evergreen Solar branded solar panels primarily in our own fully integrated factory in Devens, Massachusetts. During 2010, we began production at our 75 MW wafer facility in Wuhan, China and we have contracted with another manufacturer to process our wafers into cells and Evergreen Solar branded panels. However, we have recently announced our intention to focus on our wafer manufacturing technology and thus future revenue growth will be driven by the successful expansion of wafer capacity and sales.
Our focus moving forward will be on our wafer manufacturing technology and developing an industry standard size wafer. Development activities associated with the industry standard size wafer have progressed substantially in the second half of 2010, resulting in the production of more than 60,000 wafers using modified existing quad furnaces. These wafers perform comparably to the rectangular wafers produced using our existing quad furnaces in Devens and Wuhan. Ten prototype furnaces will be installed and we will begin producing industry standard size wafers in much greater quantities in early 2011. Pilot production of up to 25 MW is expected to begin by the fourth quarter of 2011. Our future expansion will be based on the industry standard size wafer which is central to our strategy of manufacturing the lowest cost wafer, in an industry standard form factor, and providing a wafer that would enable the lowest cost solar panel utilizing multi-crystalline silicon wafers.
Our fundamental business objective is to use our technologies to become a leader in developing and manufacturing an industry standard size multi-crystalline silicon wafer. We are implementing the following strategies to meet this objective:
Innovate to Continue to Lower the Cost of Manufacturing Wafers. The long-term challenge of solar energy is its higher cost compared to conventional sources of electricity such as fossil fuels. Solar-power product manufacturers who have the ability to manufacture products that can generate electricity at or close to grid parity will consequently have a distinct advantage, including the ability to sell into markets where government subsidies are minimal or non-existent. We expect that utilizing our proprietary wafer manufacturing technology as an integral part of solar panel manufacturing will provide the industry with a step function improvement in manufacturing cost allowing the first of multi-crystalline silicon panel producers to achieve grid parity without subsidies.
We employ approximately 67 research and development employees both in Marlboro, Massachusetts and in Wuhan, China, primarily dedicated to wafer development initiatives. Further enhancing and improving our wafer manufacturing process is critical to enable us to produce and provide our customers low cost wafers as the key component of solar power products that are at or below grid parity. Today, we are working on two major wafer projects:
| • | Optimizing the crystallization characteristics of the wafer to increase power performance, and |
| • | Growing industry standard size wafers. |
Expand Manufacturing Operations and Business Opportunities. Our future expansion will be based on the industry standard size wafer which is central to our strategy of manufacturing the lowest cost wafer, in an industry standard form factor, and providing a wafer that would enable the lowest cost solar panel utilizing multi-crystalline silicon wafers. As such, our strategy is to expand manufacturing operations in low cost manufacturing regions, such as China, commensurate with the growing demand of solar power. We expect that successfully developing a low cost industry standard size wafer will allow us to pursue substantial new business development opportunities including wafer sales, licensing, partnerships and alliances.
9
Table of Contents
Our Products
Historically, we have produced wafers that were then processed into Evergreen Solar branded solar panels primarily in our own fully integrated factory in Devens, Massachusetts. During 2010, we began production at our 75 MW wafer facility in Wuhan, China and we have contracted with another manufacturer to process our wafers into cells and Evergreen Solar branded panels, which currently produce up to 225 watts of power.
One or more solar panels can be assembled in a solar system (or solar array) by physically mounting and electrically interconnecting the panels, often with batteries or power electronics, including inverters, to produce electricity. Typical residential on-grid systems produce 2,000 to 6,000 watts of power. Solar panels currently are our primary product, although we expect to transition to a wafer only business model by the end of 2012. We believe our String Ribbon solar panels are very competitive from a technical standpoint with other products in the marketplace. They are certified to international standards of safety, reliability and quality.
Sales, Marketing and Distribution
We sell our solar panels using domestic and international distributors, system integrators, project developers and other resellers, who often add value through system design by incorporating our solar panels with inverters and other electronics, mounting structures and wiring systems. Most of our distribution partners have a geographic or applications focus. Our distribution partners include companies that are exclusively solar power system resellers as well as others for whom solar power is an extension of their core business, such as engineering design firms or other energy product marketers. As long as we sell solar panels we expect to collaborate closely with a relatively small number of resellers throughout the world. As of December 31, 2010 we had approximately 10 main resellers worldwide. For the year ended December 31, 2010, our top 10 customers accounted for approximately 80% of our total product revenues.
In addition, we market our products through trade shows, on-going distribution partner communications, promotional material, our website, direct mail and advertising. Our staff provides customer service and applications engineering support to our distribution partners while also gathering information on current product performance and future product requirements.
As we complete our transition to a wafer only business model by the end of 2012, we expect to be marketing and selling our wafers to a variety of manufacturers of solar power products, focusing on the beginning of the solar panel value chain.
Manufacturing
Our principal manufacturing objective is to provide for large-scale manufacturing of wafers at low cost. In January 2011, we announced our intent to shut down operations at our Devens manufacturing facility to better position us to pursue our industry standard size wafer strategy. Although production costs at our Devens facility have steadily decreased, they are still much higher than those of our low cost competitors in China. We will continue to operate our wafer facility in Wuhan, China. With approximately 75 MW of installed wafer capacity in Wuhan, we will continue to supply our outsourcing partner, Jiawei, with wafers for conversion into Evergreen Solar branded solar panels.
We use a special form of high temperature filament in our wafer manufacturing process that is not used by any other wafer manufacturer. We currently meet our high temperature filament requirements using a single supplier, and as part of our strategy of securing adequate raw material supplies and reducing cost, we are developing our own ability to produce high temperature filament. We began pilot production of high temperature filament at the end of 2009 at our plant in Midland, Michigan and expect to produce increasing volumes in 2011.
Because the market opportunity for solar power encompasses numerous applications in both developed and developing nations worldwide and requires continuous cost reduction, a significant portion of our future sales will continue to be made outside the United States and our production will be in low cost regions.
10
Table of Contents
Research and Development
Continuously improving our technology is an important part of our overall strategy. Therefore, we have maintained and intend to maintain a strong research and development effort. Approximately 42,000 square feet of space is dedicated to research and development and advanced engineering and contains equipment to support the development, fabrication and evaluation of new solar power products and technologies. We are also expanding our R&D initiatives in China.
Intellectual Property
Patents
We believe that our commercial success will significantly depend on our ability to protect our intellectual property rights underlying our proprietary technologies, particularly the manufacturing methods and product technology used to make String Ribbon wafers. We seek U.S. and international patent protection for major elements of our technology platform, including our manufacturing process and methods and apparatuses for producing crystalline silicon wafers, solar cells and solar panels. We currently have 26 U.S. patents, 6 Japanese patents, 5 Indian patents, and 4 European patents that are enforceable in 1 or more European jurisdictions. These patents begin to expire in 2016 and will all expire by 2028. In addition, we have 20 U.S. patent applications pending and 76 foreign patent applications pending (including PCT applications) related to our business. We devote substantial resources to building a strong patent position and we intend to continue to file additional U.S. and foreign patent applications to seek protection for technology we deem important to our commercial success. Our patents cover the following areas:
| • | Crystalline Silicon Wafers. Our wafer fabrication technology, including methods for automated, high-yield production techniques, are covered by 16 U.S. patents, 5 Indian patents, 2 Japanese patents, and 4 European patents that have been validated with enforceable rights in 1 or more European jurisdictions. In addition, for this technology, we also have 15 pending U.S. patent applications, 3 pending PCT applications, and 63 pending national/regional phase foreign patent applications. |
| • | Solar Cell Fabrication. Our solar cell processing technology is covered by 4 U.S. patents. Among other things, these patents relate to methods for forming wrap-around contacts on solar cells and methods for processing solar cells. In addition, for this technology, we also have 5 pending U.S. patent applications, 3 pending PCT applications, and 7 pending national/regional phase foreign patent applications. |
| • | Solar Panels. For our advanced solar panel designs, we currently own 6 U.S. patents and 4 Japanese patents. The U.S. patents primarily relate to solar cell panels with an improved backskin, solar cell panels with an encapsulant material for solar cell panels, and a solar cell roof tile system. |
Trademarks and Copyrights
We have 2 U.S. registered trademarks we are currently using and 2 pending U.S. trademarks applications we presently intend to continue to pursue. We also own several foreign trademarks associated with and used in our business, including registrations and applications for the trademarks Evergreen Solar, the Evergreen Solar logo, Think Beyond and String Ribbon. Furthermore, we own common law rights in our trademarks and service marks. We are working to increase, maintain and enforce our rights in our trademark portfolio, the protection of which is important to our reputation and branding. We also own copyrights relating to our products, services and business, including copyrights in the software we have developed, in our marketing materials and in our product manuals.
Trade Secrets and Other Confidential Information
With respect to, among other things, proprietary know-how that is not patentable and processes for which patents are difficult to enforce, we rely on trade secret protection and confidentiality agreements to protect our interests. We believe that several elements of our wafers and manufacturing processes involve proprietary know-
11
Table of Contents
how, technology or data, which are not covered by patents or patent applications, including selected materials, technical processes, equipment designs, algorithms and procedures. We have taken security measures to protect our proprietary know-how, technologies and confidential data, and we continue to explore additional methods of protection. While we require all employees, key consultants and other third parties to enter into confidentiality agreements with us, we cannot be assured that proprietary information will not be disclosed inappropriately, that others will not independently develop substantially equivalent proprietary information and techniques or otherwise gain access to our trade secrets, or that we can meaningfully protect our trade secrets. Any material leak of confidential or proprietary information into the public domain or to third parties could result in the loss of a competitive advantage in the solar power market.
Competition
The solar power market is intensely competitive and rapidly evolving. According to Solarbuzz, there are over 300 companies which engaged in PV products manufacturing or have announced an intent to do so. Our main competitors are, among others, BP Solar International Inc., First Solar, Inc., Kyocera Corporation, Mitsubishi, Sanyo Corporation, Sharp Corporation, Solar World AG, SunPower Corporation, Suntech Power Holdings Co., Ltd, Trina Solar, and Yingli. We also expect that future competition will include new entrants to the solar power market offering new technological solutions. We may also face competition from semiconductor manufacturers, several of which have already announced their intention to start production of solar cells.
Many of our existing and potential competitors have substantially greater financial, manufacturing and other resources than we currently do. Our competitors’ greater size and, in some cases, a higher level of vertical integration, provide them with a competitive advantage with respect to manufacturing costs because of their economies of scale, production facilities located in low cost manufacturing regions and their ability to purchase raw materials at lower prices.
We believe that the cost and performance of our wafer technology will continue to have advantages compared to competitive technologies. Our products offer the reliability, efficiency and market acceptance of other crystalline silicon products. We believe our technology will provide lower manufacturing costs resulting from significantly better silicon consumption and fewer processing steps.
The entire solar industry also faces significant competition from other power generation sources, both conventional sources as well as other emerging technologies. Solar power has certain advantages and disadvantages when compared to other power generating technologies. The advantages include the ability to deploy products in many sizes and configurations, to install products almost anywhere in the world, to provide reliable power for many applications, to serve as both a power generator and the skin of a building and to eliminate air, water and noise emissions. Whereas solar generally is cost effective for off-grid applications, the high up-front cost of solar relative to most other solutions is the primary market barrier for on-grid applications. Furthermore, unlike most conventional power generators, which can produce power on demand, solar power cannot generate power where sunlight is not available, although it is often matched with battery storage to provide highly reliable on demand power solutions. Historically, difficult financial markets have resulted in a slowdown for large project builds which directly led to increased availability of solar panels and has accelerated price reductions of the industry, causing decreased margins and an even more competitive marketplace.
Environmental, Health and Safety Regulations
Like all solar companies, we use toxic, volatile or otherwise hazardous chemicals in our research and development and manufacturing activities and generate and discharge hazardous emissions, effluents and wastes from these operations. We are subject to a variety of foreign, federal, state and local governmental regulations related to the storage, use, discharge, emission and disposal of hazardous materials. We are also subject to occupational health and safety regulations designed to protect worker health and safety from injuries and adverse health effects from exposure to hazardous chemicals and working conditions.
12
Table of Contents
We believe that we have all environmental permits necessary to conduct our business. We believe that we have properly handled our hazardous materials and wastes and have not materially contributed to any contamination at any of our past or current premises, although historical contamination may be present at these locations from prior uses. We are not aware of any environmental, health or safety investigation, proceeding or action by foreign, federal or state agencies involving our past or current facilities. If we fail to comply with present or future environmental, health or safety regulations, we could be subject to fines, suspension of production or a cessation of operations. Any failure by us to control the use of, prevent public or employee exposure to, or to restrict adequately the emission and discharge of hazardous substances in accordance with applicable environmental laws and regulations could subject us to substantial financial liabilities, operational interruptions and adverse publicity, any of which could materially and adversely affect our business, results of operations and financial condition. In addition, under some foreign, federal and state statutes and regulations, a governmental agency or private party may seek recovery of response costs or damages from operators of property where releases of hazardous substances have occurred or are ongoing, even if the operator was not responsible for the release or otherwise was not at fault.
EMPLOYEES
As of December 31, 2010, we had approximately 1,034 full-time employees, including approximately 67 engaged in research and development and approximately 877 engaged in manufacturing. Approximately 60 of our employees have advanced degrees, including 18 with Ph.D.s. None of our employees is represented by any labor union nor are they organized under a collective bargaining agreement. We have never experienced a work stoppage due to labor disputes and believe that our relations with our employees are good. We also use a temporary employment agency to supplement our work force needs. At December 31, 2010, we had 232 temporary employees. Including the temporary employees, we have 997 employees in the United States, 257 in China and 12 in Germany. We expect that approximately 800 employees will be impacted by the closure of our Devens manufacturing facility, most by the end of the first quarter of 2011.
AVAILABLE INFORMATION
Our annual report on Form 10-K, quarterly reports on Form 10-Q, current reports on Form 8-K, and all amendments to those reports are made available free of charge though our internet website (http://www.evergreensolar.com) as soon as practicable after such material is electronically filed with, or furnished to, the Securities and Exchange Commission. Except as otherwise stated in these documents, the information contained on our website or available by hyperlink from our website is not incorporated by reference into this report or any other documents we file with or furnish to the Securities and Exchange Commission.
13
Table of Contents
| ITEM 1A. | RISK FACTORS. |
Certain Factors Which May Affect Future Results
The factors discussed below are cautionary statements that identify important factors that could cause actual results to differ materially from those anticipated by the forward-looking statements contained in this report. For more information regarding the forward-looking statements contained in this report, see “Concerns Regarding Forward-Looking Statements” at the beginning of this report. You should carefully consider the risks and uncertainties described below, together with all of the other information included in this report, in considering our business and prospects. The risks and uncertainties described below are not the only ones that we face. Other factors may also exist that we cannot anticipate or that we currently do not consider to be significant based on currently available information. The occurrence of any of the following risks could materially affect our business, financial condition, results of operations, cash flows and future results.
RISKS RELATING TO OUR INDUSTRY, PRODUCTS, FINANCIAL RESULTS AND OPERATIONS
Our high level of interest-related debt service could adversely affect our ability to fulfill our obligations under our outstanding convertible notes and may impact our future operations and growth plans.
Our current annual cash interest obligations associated with our outstanding convertible notes is approximately $31.4 million. In addition, we must repay $38.0 million of loans and related interest payable to Hubei Science and Technology Investment Co., Ltd., an investment fund sponsored by the government of Hubei, China, or HSTIC, by July 24, 2014, in connection with the financing of our China-based wafer manufacturing facility. We may also incur additional debt from time to time to finance working capital, product development efforts, strategic acquisitions, investments and alliances, capital expenditures or other general corporate purposes, subject to the restrictions contained in the indentures governing our outstanding convertible notes and in any other agreements under which we incur indebtedness.
Our significant debt and debt service requirements could adversely affect our ability to operate our business and may limit our ability to take advantage of potential business opportunities. For example, our high level of debt presents the following risks:
| • | we are required to use a substantial portion of our cash flow from operations to pay principal at maturity and interest on our debt when due, thereby reducing the availability of our cash flow to fund working capital, capital expenditures, product development efforts, acquisitions, investments and strategic alliances and other general corporate requirements, as well as making it more difficult for us to make payments on the notes; |
| • | our substantial leverage increases our vulnerability to economic downturns and adverse competitive and industry conditions and could place us at a competitive disadvantage compared to our competitors that have less debt or are less leveraged; |
| • | our debt service obligations could limit our flexibility in planning for, or reacting to, changes in our business and our industry and could limit our ability to pursue other business opportunities, borrow more money for operations or capital in the future and implement our business strategies; |
| • | our level of debt and the covenants within our debt instruments may restrict us from raising additional capital on satisfactory terms to fund working capital, capital expenditures, product development efforts, strategic acquisitions, investments and alliances, and other general corporate requirements; and |
| • | covenants in our debt instruments may limit our ability to pay dividends, issue new or additional debt, guarantee debt, sell, transfer or otherwise dispose of our assets, including through licenses of our intellectual property, or make other restricted payments and investments. |
Any of the above-listed factors could have an adverse effect on our business, financial condition and results of operations.
14
Table of Contents
A failure to comply with the covenants and other provisions in our debt instruments could result in events of default under such instruments, which could permit acceleration of our various outstanding notes. Any required repayment of our indebtedness as a result of acceleration would reduce the amount of our current cash on hand such that we would not have those funds available for use in our business. In addition, we may not have sufficient cash on hand to pay all such amounts in the event of an acceleration.
In February 2011, we closed on an exchange offer for a portion of our existing 4% convertible notes totaling approximately $45.4 million in exchange for approximately $22.7 million in new 4% convertible notes. As a result of the exchange offer, after taking into account subsequent conversions of approximately $10.1 million of the new 4% convertible notes, we reduced our total indebtedness by approximately $32.8 million and our annual cash interest expense by approximately $1.3 million. We cannot assure you that we will be successful with any future exchanges in debt with the goal of further reducing our indebtedness, nor can we assure you that our total indebtedness will be reduced by conversions into common stock, or that we will be able to reduce our various indebtedness as needed prior to the respective maturity dates, or that our business will generate sufficient cash flows from operations or that future borrowings will be available to us in amounts sufficient and on terms reasonable to us to support our liquidity needs. We cannot assure you that any of these remedies could, if necessary, be effected on commercially reasonable terms, or at all, or that they would permit us to meet our scheduled debt service obligations and fund our liquidity needs. In addition, if we incur additional debt, the risks associated with our substantial leverage, including the risk that we will be unable to service our debt or generate enough cash flow to fund our liquidity needs, could intensify. If we are not able to generate sufficient cash flow to service our debt obligations and fund our liquidity needs, we may need to refinance or restructure our indebtedness, sell assets, reduce or delay capital investments, or seek to raise additional capital. If we are unable to successfully further refinance or restructure our indebtedness (including through conversions into common stock), sell assets, reduce or delay capital investments or raise additional capital, we may have to seek bankruptcy protection.
We may need to raise significant additional capital in order to continue to grow our business and fund our operations as planned, which may not be available on acceptable terms or at all.
We will need to generate cash internally or raise significant additional capital to fund our planned expansion of wafer manufacturing facilities, to acquire complementary businesses and to obtain raw materials or necessary technologies. We may have insufficient liquidity to meet our operational and growth needs and may have to take actions such as reducing or delaying capital expenditures, product development efforts, strategic acquisitions, investments and alliances, selling assets, restructuring or refinancing our debt, or seeking additional equity capital. If adequate capital does not become available when needed on acceptable terms, our ability to fund our operations, further develop and expand our wafer manufacturing operations or otherwise respond to competitive pressures would be significantly limited. In such a case, the price of our common stock would likely be further materially and adversely impacted.
Our ability to raise capital may be severely hampered by adverse changes in general economic market conditions. In recent periods, the U.S. and world economy have undergone unprecedented turmoil amid stock market volatility, difficulties in the financial services sector, tightening of the credit markets, softness in the housing markets, concerns of inflation and deflation, reduced corporate profits and capital spending, reduced consumer spending, and various other economic difficulties. This recent turmoil demonstrates how uncertain future economic conditions are and those conditions could negatively impact our ability to obtain debt or equity financing. Although the U.S. economy and financial markets have improved somewhat, concerns about the stability of the markets generally have not been eliminated, and accessing the markets for capital continues to be challenging. If improvement in market and economic conditions does not continue or turmoil and volatility significantly increase, we may be further limited in our ability to access the capital markets to meet liquidity and capital expenditure requirements. We cannot predict the timing, strength or duration of local, regional or global economic downturns or its potential impact on our ability to successfully access the capital markets.
15
Table of Contents
We will continue to invest significantly in the research and development of our proprietary wafer technology to develop a commercially successful industry standard size wafer, and these efforts may not result in the necessary improvement in our technology or a commercially successful industry standard size wafer and our wafers may not be widely accepted.
If our continuing development efforts regarding our wafer manufacturing technologies are not successful, and we are unable to develop a commercially successful industry standard size wafer and continue to decrease manufacturing costs, including further reducing silicon consumption, we may not be able to significantly expand our wafer manufacturing business.
Our future will depend upon our ability to successfully execute on an industry standard size wafer business.
Historically, we have produced wafers that were then processed into Evergreen Solar branded solar panels primarily in our own fully integrated factory in Devens, Massachusetts. During 2010, we began production at our 75 MW wafer facility in Wuhan, China and we have contracted with another manufacturer to process our wafers into cells and Evergreen Solar branded panels. In January 2011, we announced our intent to shut down operations at our Devens manufacturing facility to better position us to pursue our industry standard size wafer strategy and preserve our liquidity. We believe this better positions us to complete our strategy of becoming the low cost producer of industry standard size wafers.
Our focus moving forward will be on our wafer manufacturing technology and to develop an industry standard size wafer. Our future expansion will be based on the industry standard size wafer which is central to our strategy of manufacturing the lowest cost wafer, in an industry standard form factor, and providing a wafer that would enable the lowest cost solar panel utilizing multi-crystalline silicon wafers. However, we cannot provide any assurance that we will be successful in developing our industry standard size wafer in a manner that will be generally accepted in the marketplace or at all. Furthermore, we cannot provide any assurance that we will be able to meet our manufacturing cost objectives that will allow us to sell wafers at economically feasible margins.
We are also subject to the general risk and uncertainties inherent in any substantial shift in business strategy, including:
| • | Developing a product that will gain market acceptance; |
| • | Securing the capital needed to execute and expand upon our strategy; and |
| • | Entering into a market for which we have little experience. |
If we cannot effectively address these and other general risks and uncertainties, we may not be successful in executing our wafer strategy, which could impair our future business.
Evaluating our business and future prospects may be difficult due to the rapidly changing market landscape.
Although we were formed in 1994 to develop crystalline silicon technology for use in manufacturing solar powered products and began shipping solar panels in 1997, we first shipped solar panels at commercial scale in September 2001. Relative to the entire solar industry, we have shipped a small number of solar panels and have no experience selling wafers. The solar power market is rapidly evolving and is experiencing technological advances, a growth of manufacturers in low cost manufacturing regions, new market entrants and rapid capacity growth, which may be outpacing growth in short-term demand. Our future success will require us to scale our wafer manufacturing capacity significantly beyond the capacity of our existing Wuhan, China wafer facility. As a result, you should consider our business and prospects in light of the risks, expenses and challenges that we will face in a growing and rapidly evolving market.
16
Table of Contents
We have a history of losses, expect to incur substantial further losses and may not achieve or maintain profitability in the future, which in turn could further materially decrease the price of our common stock.
Since our inception, we have incurred significant losses. We expect to incur additional losses until we achieve substantial industry standard wafer manufacturing sales. Even if we achieve profitability, we may be unable to sustain or increase our profitability in the future if we are not able to sufficiently expand capacity or continue to reduce our costs, which in turn could further materially decrease the price of our common stock. We expect to continue to make significant capital expenditures and anticipate that our expenses will increase as we seek to:
| • | expand our industry standard wafer manufacturing operations; |
| • | continue investing in research and development; |
| • | implement internal systems and infrastructure to support our growth; and |
| • | hire additional technical personnel. |
We do not know whether our revenues will grow rapidly enough to absorb these costs, and our limited operating history makes it difficult to assess the extent of these expenses or their impact on our operating results.
We may be subject to certain liabilities based upon our prior ownership of Sovello, which may adversely impact our funds available for our operations.
On April 21, 2010, the sale of our interest in Sovello was completed. In connection with such sale, our joint venture agreement concerning Sovello was terminated, as well as our undertaking to certain of Sovello’s lenders to support Sovello’s outstanding indebtedness. However, although we have no remaining contractual obligations, the German government could pursue us for repayment of certain German government grant funding previously issued to Sovello in the event Sovello becomes insolvent prior to the first anniversary of the sale. In the event Sovello becomes insolvent prior to April 21, 2011, and is unable to repay the German grant funding it previously received, we could have significant liability for repayment of such funds.
The costs associated with the shutdown of our Devens, Massachusetts manufacturing facility may be greater than expected and the anticipated positive impact on our cash position may not materialize.
On January 10, 2011, our board of directors and management committed us to shutdown production at our Devens, Massachusetts manufacturing facility. We intend to complete the shutdown during the first quarter of 2011. As a result of the closure of the Devens facility, we incurred non-cash charges of approximately $377.5 million associated with the write-off of existing building, facilities, equipment and prepaid cost of silicon in the fourth quarter of 2010. Furthermore, we expect to incur approximately $15 million to $20 million of costs associated with employee severance and out placement services, facility decommissioning and other costs required to close the facility. These cash charges are expected to be incurred over a twelve month period. In total, we expect that approximately 800 employees will be affected by this action. In addition, as a result of the Devens shutdown, Massachusetts state agencies that provided approximately $20 million of grant funding to partially finance the build out of our Devens facility in 2007 have indicated they will seek repayment of certain unearned amounts under our grant agreements. We do not know the amounts, if any, that will ultimately need to be repaid to Massachusetts state agencies or when those payments would become due. Based on our understanding of the grant agreements, we do not believe these amounts will need to be repaid for several years, but we cannot be sure that an adverse determination would not be made if our interpretation of the agreements were challenged. We also cannot be certain that the costs associated with closing the Devens facility will not be greater than currently expected.
We expect the shutdown of the Devens facility to eliminate the risks associated with continued manufacturing in a high cost region in a period of rapidly declining prices and that a complete facility shutdown will help preserve cash and facilitate the pursuit of our wafer expansion strategy. However, we cannot assure you that the expected positive impact on our cash position will materialize.
17
Table of Contents
Our future success depends on our ability to develop and increase our industry standard wafer manufacturing capacity, license our technologies or enter new markets to sell our wafers. Our inability to increase our production capacity directly or successfully outsource the manufacturing of our products will limit our growth potential and impair our operating results and financial condition.
Our ability to plan, construct and equip additional manufacturing facilities is subject to significant risk and uncertainty, including:
| • | possible delays and cost overruns as a result of a number of factors, many of which may be out of our control, such as delays in government approvals, burdensome permit conditions and delays in the customization, delivery, and installation of manufacturing equipment from numerous suppliers, especially our specially designed furnaces; |
| • | we may be required to depend on third parties or strategic partnerships that we establish in the development and operation of additional production capacity, which may subject us to risks that such third parties do not fulfill their obligations to us under our arrangements with them; and |
| • | in order to effectively execute our strategy of focusing on manufacturing industry standard size wafers, we will be required to access new sales channels for our wafers, develop new partnerships and other alliances with which we have little experience. |
Our dependence on a limited number of suppliers for certain materials, including key components for our solar power products and capital equipment, could adversely affect our ability to manufacture and timely deliver our products.
We manufacture products using materials and components procured from a limited number of suppliers, and certain materials and components we use are proprietary or available only from a limited number of sources, primarily our wafer furnaces, high temperature filament, argon and graphite. If we fail to develop, maintain or expand relationships with suppliers, or if our suppliers fail to supply good quality materials on time that meet our cost requirements and we are unable to find alternative sources, we may be unable to manufacture our products in a timely and cost-effective manner.
If the market price of polysilicon decreases, we could be at a competitive disadvantage because we have entered into multi-year polysilicon contracts.
Polysilicon is the key raw material, and typically the most expensive component for, solar power products utilizing crystalline silicon wafers. The market price for polysilicon steadily decreased from mid-2008 through early 2010. We purchase polysilicon pursuant to long-term supply contracts, which contain fixed pricing and volume requirements. Although we have been able to renegotiate pricing and volumes under our contracts from time to time, other wafer manufacturers may be able to enter into new long-term contracts or purchase polysilicon on the spot market at lower prices than those to which we have agreed with our suppliers. If the price we pay for polysilicon is significantly higher than the price paid or produced by our competitors, our competitive cost advantage of producing wafers could decrease despite using substantially less silicon in our manufacturing process relative to conventional manufacturing processes.
Technological changes in the solar power industry could render our solar power products uncompetitive or obsolete, which could reduce our market share and cause our revenues to decline.
The solar power market is characterized by continually changing technology requiring improved features, such as increased efficiency, higher power output and lower cost. Our failure to further refine our wafer manufacturing technology and develop and introduce new lower cost industry standard wafers could cause our wafers to become uncompetitive or obsolete, which could impact the ability for us to grow our business. A variety of competing solar power technologies are under development by other companies that could result in lower manufacturing costs or higher product performance than those expected for our products. Our development efforts may be rendered obsolete by the technological advances of others, and other technologies may prove more advantageous for the commercialization of solar power products.
18
Table of Contents
Our transition from a solar panel manufacturer to a solar wafer manufacturer may make it difficult for us to sell our remaining production from our Devens facility and the solar modules we expect to produce in our China facility at any significant margin over our costs of production.
For the year ended December 31, 2010, approximately 26%, 15%, 12% and 12% of our product revenues were generated from sales to IBC Solar AG, Wagner & Co. Solartechnik GmbH, Donauer Solartechnik Vertriebs GmbH and NWT a.s., respectively. Due to the planned significant decline in panel production, it is unclear whether our customers will continue to purchase panels at volumes sufficient enough to sell our expected production from China in the future and we may be required to find other customers for our panels. Consequently, it is possible there could be material fluctuations and further declines in our product revenue that will negatively impact our operating results.
Our transition from a solar panel manufacturer to a solar wafer manufacturer could result in the loss of key personnel and difficulty in attracting new personnel.
We rely heavily on the services of our key executive officers and key technology personnel. The loss of services of principal members of our management team and key technology personnel could adversely impact our ability to successfully transition into a successful wafer manufacturer. Given the uncertainty of our success as we transition our business, additional demands that will be placed on key personnel and the competition for qualified personnel in our industry, it is possible our highly qualified personnel may seek and find other opportunities during this critical transitional phase of our business development. We also may not be successful in attracting and retaining sufficient numbers of qualified personnel to support our anticipated growth or to replace key personnel as needed. We cannot guarantee that any employee will remain employed with us for any definite period of time because all of our employees, including our key executives and technologists, serve at-will and may terminate their employment at any time for any reason.
We face particular commercial, jurisdictional and legal risks associated with our proposed expansion in China.
We expect the cells and panels made for us by Jiawei Solar (Wuhan) Co., Ltd., or Jiawei, will represent a substantial portion of our annual capacity by early 2011. Accordingly, our financial condition, results of operations, business or prospects could be materially adversely affected if we are not successful in our subcontracting relationship with Jiawei in China. The success of this relationship and our activities in China in general are subject to the economic, political and legal conditions or developments in China.
Examples of economic and political developments that could adversely affect us include government control over capital investments or changes in tax regulations that are applicable to us. In addition, a substantial portion of the productive assets in China remain government-owned. The Chinese government also exercises significant control over Chinese economic growth through the allocation of resources, controlling payment of foreign currency denominated obligations, setting monetary policy and providing preferential treatment to particular industries or companies. Additionally, China has historically adopted laws, regulations and policies which impose additional restrictions on the ability of foreign companies to conduct business in China or otherwise place them at a competitive disadvantage in relation to domestic companies. Any adverse change in economic conditions or government policies in China could have a material adverse effect on our overall economic growth and therefore have an adverse effect on our financial condition, results of operations, business or prospects.
We also face risks associated with Chinese laws and the Chinese legal system. China’s legal system is rapidly evolving and, as a result, the interpretation and enforcement of many laws, regulations and rules are not always uniform, and legal proceedings in China often involve uncertainties. The legal protections available to us may therefore be uncertain and may be limited. Implementation of Chinese intellectual property-related laws has historically been lacking, primarily because of ambiguities in Chinese laws and difficulties in enforcement. Accordingly, the intellectual property rights and confidentiality protections available to us in China may not be
19
Table of Contents
as effective as in the United States or other countries. In addition, any litigation brought by or against us in China may be protracted and may result in substantial costs and diversion of resources and management attention, and the anticipated outcome would be highly uncertain.
Although we entered into agreements with Jiawei and began production at our 75 MW wafer facility in Wuhan, China, we are subject to significant risks associated with expanding production in China requiring substantial management by our employees. The completion and start-up of our wafer manufacturing facility in Wuhan or Jiawei’s cell and panel manufacturing facilities may take longer or cost more to complete than anticipated.
As a result of the foregoing factors, our financial condition, results of operations, business or prospects may be materially and adversely affected.
Our reliance on Jiawei as a subcontracting manufacturer puts us at risk to the extent that Jiawei cannot manage increasing levels of production
Jiawei has needed support from us since we commenced our relationship in 2009. To assist Jiawei in meeting its obligations to us, we loaned Jiawei approximately $12.8 million through December 31, 2010. These loans were made to provide Jiawei with sufficient financing flexibility to establish its cell and panel manufacturing facility as well as for working capital requirements as Jiawei rapidly ramps its operations. If Jiawei is unable to fulfill its obligations to provide cell and panel manufacturing capacity to match our wafer capacity in China, it will negatively impact our ability to increase our production and revenues.
Our Agreements with HSTIC and Jiawei subject us to risk of loss of control or ownership of our operations in Wuhan, China if we are not successful in running our operations.
If we fail to meet our obligation to repay HSTIC and repurchase its equity interest in our China-based manufacturing affiliate, Evergreen Solar (China) Co., Ltd., or Evergreen China, pursuant to our agreements with HSTIC when due or upon acceleration, we will be required to relinquish our board and management control of, and potentially forfeit our equity interest in, Evergreen China. In addition, if we fail to meet our obligations to Jiawei pursuant to our manufacturing services agreement, we could be required to sell our equity interest in, or the assets of, Evergreen China to Jiawei, or be required to purchase from Jiawei its equity interests in, or the assets of, its Wuhan, China manufacturing subsidiary. As a result of the foregoing factors, our financial condition, results of operations, business or prospects may be materially and adversely affected.
Our growing international operations and customer base require us to comply with complex, multi-national income, value-added and other tax rules, for which our accruals may be insufficient.
Significant judgment is required in determining our worldwide liability for U.S. federal, state and international taxes, including income tax, value-added tax and import and export tax. Although we believe that our estimates of such provisions and accruals are consistent with applicable laws and our contractual relationships with customers and suppliers, no assurance can be given that our provisions and accruals for such taxes have been and will be sufficient. If they are not sufficient, or if our exposure to taxes substantially increases, our financial condition, results of operation, business or prospects may be adversely affected.
Increasing protectionist sentiment in the United States and abroad and the imposition of trade barriers subjects our business to the risk of increased costs and presents other challenges to our ability to effectively compete in the United States and abroad.
With the shutdown of our Devens facility, substantially all of our wafer manufacturing will be located in China and certain key materials will continue to be sourced from the United States, Europe and other Asian countries. In addition, we expect the largest markets for our products will continue to be in Europe and, to a
20
Table of Contents
lesser extent, the United States. As a result, we are subject to the legal, political, social and regulatory requirements and economic conditions in a variety of jurisdictions, including the United States, and we are subject to the difficulties posed by restrictions on foreign trade imposed by the countries in which we do business. A number of trade actions have recently been brought by parties in the United States which aim to restrict the import of certain materials to the United States. One of those actions led to the imposition by the Department of Commerce of significant countervailing and antidumping duties on the framing material we import to the United States from our China-based supplier. As a result we faced increased costs for these materials until we were able to cease the importation of those materials. Although we are shutting down our Devens facility which eliminates issues that may arise related to the importation of manufacturing materials to the United States, we expect we will continue to sell our products from Wuhan, China into the United States and we will need to source certain materials in the United States. It is unclear what other trade barriers might be imposed by the United States or other countries, such as export requirements, tariffs, taxes and other restrictions and expenses, and how those actions could increase the prices of our Chinese made products, and the parts and materials used to make our products. Any such increases would make our product offering less competitive in Europe, the United States or in other countries and adversely impact our results of operations.
If we lose our export license or cannot obtain additional export licenses as needed for the export of high temperature filament, we will be unable to manufacture our wafers and solar panels in China or certain other locations.
The high temperature filament we use to make our wafers and solar panels has defense-related applications and, therefore, is a controlled “dual-use” material for which the Department of Commerce requires us to obtain and maintain a license for exports to China. In 2009, we obtained our first export license which has enabled us to manufacture our wafers and solar panels in China to date. We could lose our export license if we fail to manage and control our high temperature filament as required in that license. The Department of Commerce has broad discretion to determine whether certain dual-use materials can or cannot be exported. It is possible that as a result of developing strains in U.S.-China trade relations, the Department may tighten export restrictions. If that were to happen, we might not be able to extend our current export license once it expires or obtain new export licenses as needed when we expand our operations in China or other countries where an export license is required. Without the appropriate export licenses we will be unable to manufacture our wafers and solar panels in China or certain other locations as needed and our manufacturing operations in China or elsewhere will need to cease.
Because we utilize highly flammable materials in our manufacturing processes, we are subject to the risk of losses arising from explosions and fires, which could materially and adversely affect our financial condition and results of operations.
We utilize highly flammable materials in our manufacturing processes. By utilizing these materials, we are subject to the risk of losses arising from explosions and fires. Our inability to fill customer orders during an extended business interruption could materially and adversely impact existing distribution partner relationships resulting in market share decreases and reduced revenues.
Government subsidies and economic incentives for solar technology distort our marketplace and could cause our revenues to decline, among other reasons, because subsidies and economic incentives we rely on are reduced or our competitors are more successful than we are in obtaining the benefits of government subsidies and economic incentives, which could allow them to sell products at lower costs.
We believe that the growth of the majority of our target markets depends on the availability and size of government subsidies and economic incentives for solar technology. Today, while declining, the cost of solar power exceeds the cost of power furnished by the conventional electric utility grid. As a result, federal, state and local governmental bodies in many countries have provided subsidies in the form of cost reductions, tax incentives and other incentives to end users, distributors, systems integrators, other resellers and manufacturers of solar power products to promote the use of solar energy and to reduce dependency on conventional forms of
21
Table of Contents
energy. In the future, these government subsidies and economic incentives could be reduced or eliminated altogether. For example, German subsidies are designed to decrease annually, and during 2010, the German government announced additional declines in response to the rapidly declining costs of installing solar systems. In addition, the Emerging Renewables Program in California has finite funds that may not last through the current program period. California subsidies have declined in the past and will continue to decline as cumulative installations exceed stated thresholds. Net metering policies in California, which currently cap net metering based upon aggregate customer peak demand, could also limit the amount of solar power installed within California. The reduction or elimination of government subsidies and economic incentives would likely reduce the size of these markets or result in increased price competition, which could cause our revenues to decline.
In addition, China has announced major initiatives to promote the development of its domestic solar industry, including making significant long-term financing available to enable the expansion of local industry participants. By contrast, the Economic Stimulus bill signed by President Obama in February 2009 provides little similar benefits for U.S. solar manufacturers. While we and Jiawei pursue financing and other incentives available to us in China, we are not significant participants in the Chinese solar industry compared to many of our major competitors. To the extent our competitors are successful in obtaining more assistance from the Chinese government than us, we may be at a disadvantage from a financing standpoint.
If we are unable to adequately protect our unique intellectual property, we could lose our competitive advantage in the solar power market.
Our ability to compete effectively against other solar power technologies will depend, in part, on our ability to protect our current and future proprietary technology, product designs and manufacturing processes by obtaining, maintaining and enforcing our intellectual property rights through a combination of patents, copyrights, trademarks and trade secrets and also through unfair competition laws. We may not be able to adequately obtain, maintain or enforce our intellectual property rights and information and unauthorized parties may attempt to obtain and use information we regard as proprietary. We also may need to defend our products against infringement or misappropriation claims, either of which could result in the loss of our competitive advantage in the solar power market and materially harm our business and profitability. We face the following risks in protecting our intellectual property and in developing, manufacturing, marketing and selling our products:
| • | although we have a number of foreign patents and applications, the laws of some foreign jurisdictions, particularly China, do not protect intellectual property rights to the same extent as laws in the United States, and we may encounter difficulties in protecting and defending our rights in such foreign jurisdictions; |
| • | to the extent we license our technology to third parties in foreign countries, we may encounter difficulties in protecting and defending our intellectual property rights against such third parties and others; and |
| • | we also rely substantially on trade secret protections to protect our interests in proprietary know-how and processes for which patents are difficult to obtain or enforce; however, we may not be able to adequately protect our trade secrets. |
In addition, while we pursue a policy of having our employees, consultants and advisors execute proprietary information and invention agreements when they begin working for us, these agreements may not provide meaningful protection for our trade secrets or other proprietary information in the event of unauthorized use or disclosure. If we fail to maintain trade secrets and patent protection, our potential, future revenues may decrease.
Licenses for technologies and intellectual property may not be available to us.
We have entered into license agreements for technologies and intellectual property rights, including an agreement relating to the manufacture of a portion of the high temperature filament we use to produce String
22
Table of Contents
Ribbon wafers. Any of our license agreements may be subject to terms and conditions which may limit our ability to use the licensed intellectual property under certain circumstances. For example, our license to manufacture high temperature filament may terminate if we materially breach the license agreement or if we abandon the construction of a manufacturing facility to exploit the licensed technology. We may need to enter into additional license agreements in the future for other technologies or intellectual property rights of third parties. Such licenses, however, may not be available to us on commercially reasonable terms or at all.
Existing regulations and changes to such regulations concerning the electrical utility industry may present technical, regulatory and economic barriers to the purchase and use of solar power products, which may significantly reduce demand for our products.
The market for electricity generation products is heavily influenced by foreign, federal, state and local government regulations and policies concerning the electric utility industry, as well as internal policies and regulations promulgated by electric utilities. These regulations and policies often relate to electricity pricing and technical interconnection of customer-owned electricity generation. In the United States and in a number of other countries, these regulations and policies are being modified and may continue to be modified. Customer purchases of, or further investment in the research and development of, alternative energy sources, including solar power technology, could be deterred by these regulations and policies, which could result in a significant reduction in the potential demand for our solar power products. For example, utility companies commonly charge fees to larger, industrial customers for disconnecting from the electric grid or for having the capacity to use power from the electric grid for back-up purposes. These fees could increase the cost to our customers of using our solar power products and make them less desirable, thereby harming our business, prospects, results of operations and financial condition. We anticipate that our solar power products and their installation will be subject to oversight and regulation in accordance with national, state and local laws and ordinances relating to building codes, safety, environmental protection, utility interconnection and metering and related matters. There is also a burden in having to track the requirements of individual states and design equipment to comply with the varying standards. Any new government regulations or utility policies pertaining to our solar power products may result in significant additional expenses to us, our resellers and their customers and, as a result, could cause a significant reduction in demand for our solar power products.
Compliance with environmental regulations can be expensive, and noncompliance with these regulations may result in potentially significant monetary damages, penalties, adverse publicity or interruptions to our business.
If we fail to comply with present or future environmental laws or regulations we may be required to pay substantial civil or criminal penalties, incur significant capital expenditures, suspend or limit production or cease operations. We use toxic, volatile and otherwise hazardous chemicals in our research and development and manufacturing activities and generate and discharge hazardous emissions, effluents and wastes from these operations. Any failure by us to control the use of or generation of, or to restrict adequately the discharge or disposal of, hazardous substances or wastes or to otherwise comply with the complex, technical environmental regulations governing our activities could subject us to potentially significant monetary damages and penalties, criminal proceedings, third party property damage or personal injury claims, natural resource damage claims, cleanup costs or other costs, or restrictions or suspensions of our business operations. In addition, under some foreign, federal and state statutes and regulations governing liability for releases of hazardous substances or wastes to the environment, a governmental agency or private party may seek recovery of response costs or damages from generators of the hazardous substances or operators of property where releases of hazardous substances have occurred or are ongoing, even if such party was not responsible for the release or otherwise at fault. Also, federal, state or international environmental laws and regulations may ban or restrict the availability and use of certain hazardous or toxic raw materials that are or may be used in producing our products, and substitute materials may be more costly or unsatisfactory in performance. We believe that we either have all environmental permits necessary to conduct our business or have initiated the process to obtain additional or modified environmental permits needed to conduct our business. While we are not aware of any outstanding,
23
Table of Contents
material environmental claims, liabilities or obligations, future developments such as the implementation of new, more stringent laws and regulations, more aggressive enforcement policies, or the discovery of unknown environmental conditions associated with our current or past operations or properties may require expenditures that could have a material adverse effect on our business, results of operations or financial condition. Any noncompliance with or incurrence of liability under environmental laws may subject us to adverse publicity, damage our reputation and competitive position and adversely affect sales of our products.
Our Devens, Massachusetts manufacturing facility has been constructed on part of the former Fort Devens Army base, which is associated with contamination caused by prior military activities on and near the site. Fort Devens closed in the early 1990’s and subsequently underwent environmental remediation according to an agreement between the U.S. Environmental Protection Agency and the U.S. Army. As a condition to the lease for the property, we must not disturb existing groundwater monitoring wells and must allow the U.S. Army access to the property to conduct testing and remedial activities. If environmental contamination is found on the Devens site it could be incorrectly attributed to our activities or the U.S. Army could be required to take additional remedial actions on the Devens site. Any such activities could subject us to liability for environmental remediation.
Actions against Lehman Brothers and Barclays to recover damages or shares of our common stock loaned to Lehman Brothers could be expensive, time-consuming and ultimately unsuccessful.
In July 2008, we loaned approximately 30 million shares (prior to giving effect to the recent 1-for-6 reverse stock split) of Evergreen Solar’s common stock to Lehman Brothers International (Europe), or LBIE. None of those shares were returned to us upon demand in September 2008, and 12 million of those shares were ultimately transferred to Lehman Brothers Inc., or LBI, and thereafter to Barclays Capital Inc., or Barclays. We are attempting to recover the value of the 30 million shares as of September 2008 by pursuing a claim against LBIE in its UK insolvency proceedings. LBIE has refused, to date, to acknowledge that this claim has any material value, which may lead to litigation to determine the proper amount of the claim. Whatever the claim amount is ultimately determined to be, that amount would not be paid in full, as LBIE is insolvent. We also pursued litigation against LBI and Barclays to recover the 12 million shares that were transferred to them. LBIE and Barclays moved to dismiss that litigation and motions were granted on March 3, 2011. We may incur significant legal expenses and allocate management time and attention to the pursuit of the foregoing claims and litigation related thereto. Despite our expense and efforts, no assurance can be provided that we will be awarded any damages or recover any of the shares from any Lehman Brothers or Barclays entity. If we were to recover the shares, which is unlikely, their current value is far below their value on the date the shares should have been returned to us by LBIE.
If Lehman Brothers’ claims against us arising out of our capped call agreement are successful, our financial position could be materially and adversely affected.
As previously disclosed, we received notification from Lehman Brothers OTC Derivatives Inc. or LOTC, purporting to terminate the capped call transaction that we entered into concurrent with our senior convertible debt offering in June 2008. On September 25, 2009, we received a letter from LOTC demanding payment of $19,992,487 (plus $340,673 in interest) as payment for the purported termination of the capped call transaction. More recently, LOTC increased its demand to no less than $23,643,902 (plus interest). If litigation is commenced, we will likely incur significant legal expenses and allocate management time and attention to defend against these claims, and cannot predict the outcome of any such claims. If LOTC’s claims are successful, our financial position could be materially and adversely affected.
Our ability to use net operating loss carryforwards may be subject to limitation.
Section 382 of the U.S. Internal Revenue Code of 1986, as amended, imposes an annual limit on the amount of net operating loss carryforwards that may be used to offset taxable income when a corporation has undergone
24
Table of Contents
significant changes in its stock ownership or equity structure. Our ability to use net operating losses may be limited by prior changes in our ownership, by the issuance of shares of common stock upon conversion of our outstanding convertible notes, or by the consummation of other transactions. As a result, if we earn net taxable income, our ability to use net operating loss carryforwards to offset U.S. federal taxable income may become subject to limitations, which could potentially result in increased future tax liabilities for us.
Provisions of our outstanding convertible notes could discourage an acquisition of us by a third party.
Certain provisions of our outstanding convertible notes could make it more difficult or more expensive for a third party to acquire us, or may even prevent a third party from acquiring us. For example, upon the occurrence of certain transactions constituting a fundamental change, holders of the notes will have the right, at their option, to require us to repurchase all of their notes or any portion of the principal amount of such notes. By discouraging an acquisition of us by a third party, these provisions could have the effect of depriving the holders of our common stock of an opportunity to sell their common stock, as applicable, at a premium over prevailing market prices.
Unfavorable changes in foreign currency exchange rates could increase the cost to manufacture our products or result in foreign currency exchange losses, which could adversely affect our profits, product orders and market share.
The expansion of our distribution network internationally has increased our exposure to fluctuation in currency exchange rates. A substantial portion of our product revenues have been, and are expected to continue to be, denominated in Euros. As a result, a strengthening of the U.S dollar will decrease our expected U.S. dollar revenue and thereby adversely affect our gross and net profit margins.
We often purchase equipment and materials internationally in transactions denominated in foreign currency. As a result of significant currency fluctuations in recent periods that are expected to continue, we are exposed to potential increased costs if the U.S. dollar currency loses value relative to the applicable foreign currency. Such increased costs will adversely impact our future financial condition and results of operations.
The Chinese Yuan, in which a growing portion of our manufacturing costs are denominated, is subject to somewhat unique potential for valuation changes as the Chinese government is being continually pressured by its trading partners to allow its currency to float in a manner similar to other major currencies. Any increase in the value of the Chinese Yuan may impact our ability to control the cost of our products in the world market. Specifically, the decision by the Chinese government to allow the Yuan to begin to float against the U.S. dollar could significantly increase the labor and other costs incurred in the operation of our Wuhan facility and the cost of materials, parts, components and subassemblies we source in China, thereby having a material and adverse effect on our costs and, in turn, our financial condition and results of operations.
To date, we have not entered into any hedging transactions in an effort to reduce our exposure to foreign currency exchange risk. While we may enter into hedging transactions in the future, the availability and effectiveness of these transactions may be limited and we may not be able to successfully hedge our exposure at all.
We may in the future depend on cash flow generated by our foreign subsidiaries to make payments on our convertible notes as we execute our business strategy of focusing on our foreign expansion.
As we expand our foreign operations, we may in the future depend on cash flows generated by our foreign subsidiaries to make payments on our convertible notes and our other indebtedness. The ability of our subsidiaries to pay dividends or make other payments or advances to us will depend upon their operating results and will be subject to applicable laws and the terms of agreements entered into by us or our subsidiaries. For example, Evergreen China is currently prohibited from making dividends or other distributions to us until we
25
Table of Contents
have repurchased the equity interests in it held by HSTIC. We cannot assure you that cash flow generated by our foreign subsidiaries will be sufficient to service our convertible notes.
Risks Related to Our Common Stock
The issuance or sale of equity, convertible or exchangeable securities in the market, or the perception of such future sales or issuances, could lead to a decline in the price of our common stock.
Any issuance of equity, convertible or exchangeable securities, including for the purposes of financing acquisitions, expanding our business or restructuring our outstanding indebtedness, may have a dilutive effect on our existing stockholders. In addition, the perceived risk associated with the possible issuance of a large number of shares or securities convertible or exchangeable into a large number of shares of common stock could cause some of our stockholders to sell their stock, thus causing the price of our stock to decline. Subsequent sales of our common stock in the open market or the private placement of our common stock or securities convertible or exchangeable into our common stock could also have an adverse effect on the market price of the shares. If our stock price declines, it may be more difficult for us to, or we may be unable to, raise additional capital.
In addition, future sales of substantial amounts of our currently outstanding common stock in the public market, or the perception that such sales could occur, could adversely affect prevailing trading prices of our common stock and could impair our ability to raise capital through future offerings of equity or equity-related securities. We cannot predict what effect, if any, future sales of our common stock, or the availability of shares for future sales, will have on the market price of our stock. As of February 25, 2011, reflecting the recent 1-for-6 reverse stock split, which became effective on January 1, 2011, we would have had:
| • | approximately 38.7 million shares of common stock outstanding; |
| • | approximately 0.3 million shares of common stock underlying options outstanding at a weighted average exercise price of $26.74 per share; |
| • | approximately 2.1 million shares of common stock available and reserved for future issuance or future grant under our Amended and Restated 2000 Stock Option and Incentive Plan; |
| • | approximately 0.2 million shares of common stock available and reserved for future issuance or future grant under our Amended and Restated 2000 Employee Stock Purchase Plan; |
| • | approximately 2.8 million shares of common stock issuable upon the conversion of our existing 4% senior convertible notes due 2013 in the aggregate principal amount of $203.8 million at an initial conversion rate of approximately 13.7599 shares of common stock per $1,000 principal amount of notes (equivalent to a conversion price of approximately $72.675 per share); |
| • | approximately 14.4 million shares of common stock issuable upon the conversion of our outstanding senior secured convertible notes in the aggregate principal amount of $165.0 million at an initial conversion rate of approximately 87.5410 shares of common stock per $1,000 principal amount of notes (equivalent to a conversion price of approximately $11.42 per share); and |
| • | approximately 4.8 million shares of common stock issuable upon the conversion of our new 4% convertible subordinated additional cash notes due 2020 in the aggregate principal amount of $12.6 million at an initial conversion rate of approximately 229.89 shares of common stock per $1,000 principal amount of notes (equivalent to a conversion price of approximately $4.35 per share), which amount of shares also includes make whole shares and additional shares that would be required upon conversion assuming the notes had been converted as of February 25, 2011. |
26
Table of Contents
Conversion of the new notes, or certain other occurrences with respect to our currently outstanding series of notes, will dilute the ownership interest of existing stockholders, including holders who had previously converted their notes.
To the extent we issue common stock upon conversion of the notes, such conversion could dilute the ownership interests of existing stockholders, including holders who had previously converted their notes. Sales of our common stock in the public market or sales of any of our other securities could dilute ownership and earnings per share, and even the perception that such sales could occur could cause the market price of our common stock to decline. In addition, the existence of our new notes and existing notes may encourage short selling of our common stock by market participants who expect that the conversion of the notes could depress the prices of our common stock. The market price of our common stock could also decline as a result of sales of shares of our common stock made after this offering or the perception that such sales could occur.
The price of our common stock may fluctuate significantly, which could result in substantial losses for our stockholders and subject us to litigation.
The trading price of our common stock has been and may continue to be volatile. The closing sale prices of our common stock, as reported by the Nasdaq Global Market and the Nasdaq Capital Market and giving effect to the recent 1-for-6 reverse stock split, have ranged from $1.96 to $7.92 for the 52-week period from February 26, 2010 to February 25, 2011. Our operating performance will significantly affect the market price of our common stock. To the extent we are unable to compete effectively and gain market share or the other factors described in this risk factors section affect us, our stock price will likely decline. The market price of our common stock also may be adversely impacted by broad market and industry fluctuations regardless of our operating performance, including general economic and technology trends. The Nasdaq Global Market and the Nasdaq Capital Market have, from time to time, experienced extreme price and trading volume fluctuations, and the market prices of technology companies such as ours have been extremely volatile. In addition, some companies that have experienced volatility in the market price of their stock have been the subject of securities class action litigation. We may be involved in securities class action litigation in the future. This litigation often results in substantial costs and a diversion of management’s attention and resources.
Our quarterly revenue, operating results and market price of our common stock have fluctuated significantly in the past and may fluctuate significantly from quarter to quarter in the future due to a variety of factors, including:
| • | the amount and timing of expenses associated with our research and development programs and our ability to develop and improve our industry standard wafer; |
| • | the rate and cost at which we are able to expand our wafer manufacturing capacity and drive acceptance in the market place; |
| • | our ability and the terms upon which we are able to raise capital sufficient to finance the expansion of our wafer manufacturing capacity and our sales and marketing efforts; |
| • | delays associated with the supply of specialized materials necessary for the manufacture of our wafers; |
| • | charges resulting from replacing existing equipment or technology with new or improved equipment or technology as part of our strategy to expand our wafer manufacturing capacity; |
| • | developments in the competitive environment, including the introduction of new products or technological advancements by our competitors; |
| • | the timing of adding the personnel necessary to execute our growth plan; and |
| • | the other risks and uncertainties described in “Risk Factors.” |
We anticipate that our operating expenses will continue to increase significantly, particularly as we develop our internal infrastructure to support our anticipated growth in China. If our product gross margins in any quarter
27
Table of Contents
does increase correspondingly, our net losses for that period will increase. Moreover, given that a significant portion of our operating expenses is largely fixed in nature and cannot be quickly reduced, if our product sales are delayed or below expectations, our operating results are likely to be adversely and disproportionately affected. For these reasons, quarter-to-quarter comparisons of our results of operations are not necessarily meaningful and you should not rely on results of operations in any particular quarter as an indication of future performance. If our quarterly revenue or results of operations fall below the expectations of investors or public market analysts in any quarter, the market value of our common stock would likely decrease, and it could decrease rapidly and substantially.
If we fail to maintain compliance with the listing requirements of the Nasdaq Global Market and Nasdaq delists our common stock, the market liquidity and price of our common stock will likely decline and such delisting will permit the holders of our existing notes to require us to repurchase their notes, which we likely would be unable to do.
Our common stock is currently listed on the Nasdaq Capital Market under the symbol “ESLR.” On July 1, 2010, we received a deficiency letter from the Nasdaq Global Market stating that, based on the closing bid price of our common stock for the 30 consecutive business days preceding such date, we no longer meet the minimum $1.00 per share requirement for continued listing on the Nasdaq Global Market under Marketplace Rule 5450(a)(1). In response to the delisting notice, we submitted an application to Nasdaq to move our common stock from the Nasdaq Global Market to the Nasdaq Capital Market which became effective on December 29, 2010, and implemented a 1-for-6 reverse stock split, which became effective on January 1, 2011. Following the implementation of the reverse split, our share price increased above $1 for ten trading days and on January 18, 2011, Nasdaq notified us that we have regained compliance with the minimum price rule and that the matter is now closed.
It is possible, however, that our stock may not continue to meet the Nasdaq bid price requirement, in which case we would be unable to continue to meet the listing requirements of the Nasdaq Capital Market, for that or any other reason, our stockholders will be adversely affected.
Among other adverse consequences of a delisting, there will likely cease to be a trading market for our shares other than in the Pink Sheets or the OTC Bulletin Board. It could become more difficult to dispose of, or obtain accurate quotations for the price of, our common stock, and there would likely also be a reduction in our coverage by security analysts and the news media, which could cause the price of our common stock to decline further. In addition, in the event that our common stock is delisted, the holders of our existing notes will have the right to require us to repurchase their notes, which we likely would be unable to do.
The issuance of equity or debt securities under our shelf registration statement could have a negative impact on the price of our common stock.
We have filed a registration statement on Form S-3 that became effective on December 30, 2010. This registration statement registered up to an aggregate offering price of $200 million in debt and equity securities, including shares of our common stock, preferred stock, warrants to purchase common stock and/or preferred stock, and units consisting of two or more of these classes or series of securities. We may sell any combination of these securities, over a period of up to 3 years. If we issue all of the securities included in the shelf registration, there could be a substantial dilutive effect on our common stock and an adverse effect on the price of our common stock.
Because we do not intend to pay dividends on our common stock, stockholders will benefit from an investment in our common stock only if it appreciates in value.
We have never declared or paid any cash dividends on our common stock. We anticipate that we will retain our future earnings, if any, to support our operations and to finance the growth and development of our business
28
Table of Contents
and do not expect to pay cash dividends in the foreseeable future. As a result, the success of an investment in our common stock will depend upon any future appreciation in the value of our common stock. There is no guarantee that our common stock will appreciate in value or even maintain its current price.
We are subject to anti-takeover provisions in our charter and by-laws and under Delaware law that could delay or prevent an acquisition of our company, even if the acquisition would be beneficial to our stockholders.
Provisions of our certificate of incorporation and by-laws, each as amended, as well as Delaware law, could make it more difficult and expensive for a third party to pursue a tender offer, change in control transaction or takeover attempt that is opposed by our board of directors. Stockholders who wish to participate in these transactions may not have the opportunity to do so. We also have a staggered board of directors, which makes it difficult for stockholders to change the composition of our board of directors in any one year. If a tender offer, change in control transaction, takeover attempt or change in our board of directors is prevented or delayed, the market price of our common stock could decline. Even in the absence of a takeover attempt, the existence of these provisions may adversely affect the prevailing market price of our common stock if they are viewed as discouraging takeover attempts in the future.
We can issue shares of preferred stock that may adversely affect the rights of stockholders of our common stock.
Our certificate of incorporation authorizes us to issue up to 27,227,668 shares of preferred stock, with designations, rights and preferences determined from time-to-time by our board of directors. Accordingly, our board of directors is empowered, without stockholder approval, to issue preferred stock with dividend, liquidation, conversion, voting or other rights superior to those of stockholders of our common stock. For example, an issuance of shares of preferred stock could:
| • | adversely affect the voting power of the stockholders of our common stock; |
| • | discourage bids for our common stock at a premium and make it more difficult for a third party to acquire a majority of our common stock; |
| • | limit or eliminate any payments that the stockholders of our common stock could expect to receive upon our liquidation; or |
| • | otherwise adversely affect the market price of our common stock. |
| ITEM 2. | PROPERTIES. |
As of December 31, 2010, we own and occupy approximately 450,000 square feet of manufacturing and office space located on 23.11 acres of land leased in Devens, Massachusetts from a Massachusetts state agency for an annual rent of $1. We have an option to purchase this property on or before November 20, 2012 for a purchase price of $2.7 million or thereafter for the remainder of the initial 30-year term of the lease for the greater of $2.7 million or the fair market value of the property. In addition, we own and occupy approximately 31,000 square feet of manufacturing and office space in Midland, Michigan for our high temperature filament facility. We also lease approximately 37,000 square feet of office and warehouse space in Marlboro, Massachusetts, Berlin, Germany and Wuhan, China.
Our leases expire on various dates between November 2011 and February 2020 other than our Devens land lease which continues until 2037 and can be extended to 2057. As of December 31, 2010, we were productively utilizing substantially all of the space in our Devens and our Midland facilities.
We believe that our facilities and future plans to lease are suitable and adequate for our present needs; and we periodically evaluate whether additional facilities are necessary.
29
Table of Contents
| ITEM 3. | LEGAL PROCEEDINGS. |
In the ordinary conduct of our business, we are also subject to periodic lawsuits, investigations and claims, including, but not limited to, routine employment matters. Although we cannot predict with certainty the ultimate resolution of lawsuits, investigations and claims asserted against us or administrative proceedings, we are not a party to any other material legal proceedings within the meaning of Item 103 of Regulation S-K other than the following:
Litigation with Barclays and Lehman Brothers.
In October 2008 we filed suit in the United States Bankruptcy Court for the Southern District Court of New York against Barclays PLC and certain of its affiliated entities (or Barclays), and Lehman Brothers Holdings Inc. and certain of its affiliated entities (or Lehman Brothers) seeking the return of approximately 12.2 million shares of our common stock (prior to giving effect to the recent 1-for-6 reverse stock split) previously loaned by us to Lehman Brothers in July 2008. Those shares were held by Lehman Brothers when it filed for bankruptcy and purportedly transferred to an affiliate of Barclays, PLC, Barclays Capital Inc. In our lawsuit, we demanded Barclays immediately return the 12.2 million shares it obtained from Lehman Brothers after Lehman Brothers filed for bankruptcy on the grounds that, among other things, Lehman Brothers did not hold title to the shares at the time of the purported transfer to Barclays.
In connection with the initiation of the lawsuit, we asked the Court to enjoin any further transfer of the shares received by Barclays from Lehman. On November 5, 2008 the Bankruptcy Court denied our motion for such an injunction. In February 2009 we agreed to dismiss our claims against Barclays PLC as it was determined that the 12.2 million shares had been transferred to Barclays Capital Inc. and Barclays PLC was not needed as a party to the lawsuit. In February 2009, the remaining defendants filed motions to dismiss all of our claims. In response, we filed our opposition to the motions to dismiss and a hearing on the motions to dismiss was held on April 22, 2009. At the April 22 hearing, oral arguments were presented by the defendants and us for and against the defendants’ motions to dismiss our claims. The court granted the defendants’ motions to dismiss on March 3, 2011. We are reviewing our alternatives to appeal and otherwise pursue relief.
30
Table of Contents
| ITEM 5. | MARKET FOR THE REGISTRANT’S COMMON EQUITY, RELATED STOCKHOLDER MATTERS AND ISSUER PURCHASES OF EQUITY SECURITIES: |
Market for Our Common Stock
Effective December 29, 2010 our common stock is traded on the Nasdaq Capital Market under the symbol “ESLR”. Prior to this date our common stock was traded on the Nasdaq Global Market under the symbol “ESLR”. The following table sets forth for the calendar periods indicated, the high and low sales price of our common stock on the respective Nasdaq market.
| High | Low | |||||||
| Year ended December 31, 2009 |
||||||||
| First Quarter |
$ | 22.74 | $ | 6.00 | ||||
| Second Quarter |
$ | 17.76 | $ | 10.20 | ||||
| Third Quarter |
$ | 14.70 | $ | 9.42 | ||||
| Fourth Quarter |
$ | 11.16 | $ | 8.22 | ||||
| Year ended December 31, 2010 |
||||||||
| First Quarter |
$ | 11.22 | $ | 6.48 | ||||
| Second Quarter |
$ | 7.62 | $ | 3.72 | ||||
| Third Quarter |
$ | 4.80 | $ | 3.60 | ||||
| Fourth Quarter |
$ | 7.14 | $ | 3.24 | ||||
On February 25, 2011, the last reported sale price for our common stock on the Nasdaq Capital Market was $2.10 per share. As of February 25, 2011, there were 38,652,813 shares of our common stock outstanding held by approximately 145 holders of record.
Dividend Policy
We have never declared or paid any cash dividends on our common stock. We anticipate that we will retain our earnings to support operations and to finance the growth and development of our business and do not expect to pay cash dividends on our common stock in the foreseeable future.
Equity Compensation Plan Information
Information about our equity incentive plans can be found in Part III, Item 12 of this Annual Report on Form 10-K and in Note 11 and Note 19 to our consolidated financial statements contained within this Annual Report on Form 10-K.
31
Table of Contents
STOCK PERFORMANCE GRAPH
The following graph compares the cumulative total stockholder return on our common stock against the cumulative total return of (i) the Hemscott Weighted Nasdaq Index (the “NASDAQ Market Index”) and (ii) an SIC Index that includes all organizations in the Hemscott Group 836 Code Index—Diversified Electronics (the “Hemscott Group Index”) for the five fiscal years beginning January 1, 2006 and ending December 31, 2010. The comparison assumes $100 was invested at the close of business on December 31, 2005, the last trading day before the beginning of our fifth preceding fiscal year, in our common stock and in each of the foregoing indices and assumes dividends, if any, were reinvested. The comparisons are provided in response to Securities and Exchange Commission disclosure requirements and are not intended to forecast or be indicative of future performance.
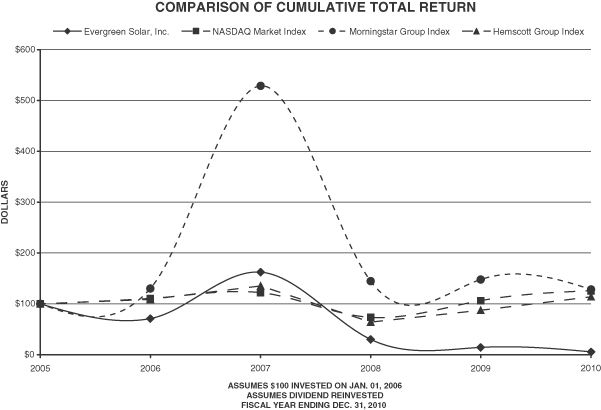
| 12/31/05 | 12/31/06 | 12/31/07 | 12/31/08 | 12/31/09 | 12/31/10 | |||||||||||||||||||
| Evergreen Solar, Inc. |
$ | 100.00 | $ | 71.08 | $ | 162.16 | $ | 29.95 | $ | 14.18 | $ | 5.47 | ||||||||||||
| NASDAQ Market Index |
$ | 100.00 | $ | 110.26 | $ | 121.89 | $ | 73.10 | $ | 106.23 | $ | 125.37 | ||||||||||||
| Morningstar Group Index |
$ | 100.00 | $ | 129.92 | $ | 528.54 | $ | 144.42 | $ | 147.92 | $ | 128.12 | ||||||||||||
| HemScott Group Index |
$ | 100.00 | $ | 108.85 | $ | 135.30 | $ | 64.10 | $ | 87.30 | $ | 113.42 | ||||||||||||
| (1) | This Stock Performance Graph is not “soliciting material,” is not deemed filed with the Securities and Exchange Commission and shall not be incorporated by reference in any of our filings under the Securities Act of 1933 or the Securities Exchange Act of 1934, whether made before or after the date hereof and irrespective of any general incorporation language in any such filing. |
| (2) | Information used to prepare this Stock Performance Graph was obtained from Morningstar, Inc., a source believed to be reliable, but we are not responsible for any errors or omissions in such information. |
32
Table of Contents
| ITEM 6. | SELECTED FINANCIAL DATA. |
You should read the data set forth below in conjunction with our financial statements and related notes and “Management’s Discussion and Analysis of Financial Condition and Results of Operations” appearing elsewhere in this filing. The statement of operations data presented below for the fiscal years ended December 31, 2008, 2009, and 2010 and the balance sheet data at December 31, 2009 and 2010 have been derived from our audited financial statements which appear elsewhere in this filing. The statement of operations data presented below for the years ended December 31, 2006 and 2007, and the balance sheet data at December 31, 2006, 2007 and 2008 have been derived from our audited financial statements, which are not included in this filing. As of December 31, 2005 we owned 64% of Sovello. On December 19, 2006 we reduced our interest to one-third. As a result of our reduction in ownership to one-third, effective December 20, 2006, we account for our ownership interest in Sovello using the equity method of accounting. Under the equity method of accounting, we report our one-third share of Sovello’s net income or loss as a single line item in our income statement and our investment in Sovello as a single line item on our balance sheet. Prior to December 20, 2006, we consolidated Sovello’s results of operations into our results of operations. Therefore, our results of operations from prior periods are not comparable with our results of operations since December 20, 2006. Under our prior sales agreement with Sovello, until December 31, 2008 we marketed and sold all solar panels manufactured by Sovello under the Evergreen Solar brand, as well as managed customer relationships and contracts related to those sales for which we receive fees; however, we did not report product revenue or cost of revenue for the sale of Sovello manufactured panels. We also receive royalty payments pursuant to a technology license agreement with Sovello. On April 21, 2010, we and Sovello’s other shareholders sold all of the outstanding shares of Sovello.
Effective January 1, 2009 we adopted the new guidance included in the Consolidation and Debt Conversion and Other topics of the FASB codification; and effective January 1, 2010 we adopted the new guidance included in the Debt topic of the FASB codification for own-share lending arrangements. The impact of these accounting standards, which required retrospective application, is included in the table below.
33
Table of Contents
On July 27, 2010, at our annual meeting of stockholders, holders of a majority of our outstanding shares of common stock approved a proposal to permit our Board of Directors to amend our certificate of incorporation to authorize a 1-for-6 reverse stock split of our issued and outstanding common stock and a reduction in the number of our authorized shares of common stock from 450,000,000 to 120,000,000. On December 29, 2010, we filed an amendment to our certificate of incorporation to implement the 1-for-6 reverse split. The reverse split became effective at 12:01 a.m. Eastern Standard Time, on Saturday, January 1, 2011. The reverse split has been retrospectively applied.
| Year Ended December 31, | ||||||||||||||||||||
| 2006 | 2007 | 2008 | 2009 | 2010 | ||||||||||||||||
| STATEMENT OF OPERATIONS DATA: |
||||||||||||||||||||
| Product revenues |
$ | 102,252 | $ | 58,334 | $ | 95,245 | $ | 267,112 | $ | 334,382 | ||||||||||
| Royalty and fee revenues |
— | 11,532 | 16,714 | 4,736 | 4,403 | |||||||||||||||
| Total Revenues |
102,252 | 69,866 | 111,959 | 271,848 | 338,785 | |||||||||||||||
| Cost of revenues |
90,310 | 52,838 | 93,073 | 253,484 | 319,429 | |||||||||||||||
| Impairment of prepaid inventory |
— | — | — | — | 74,544 | |||||||||||||||
| Total cost of revenues |
90,310 | 52,838 | 93,073 | 253,484 | 393,973 | |||||||||||||||
| Gross profit |
11,942 | 17,028 | 18,886 | 18,364 | (55,188 | ) | ||||||||||||||
| Operating Expenses: |
||||||||||||||||||||
| Research and development |
18,390 | 20,594 | 22,039 | 18,058 | 19,453 | |||||||||||||||
| Selling, general and administrative |
21,890 | 20,608 | 23,868 | 26,260 | 36,495 | |||||||||||||||
| Write-off of loan receivable from silicon supplier |
— | — | — | 43,882 | — | |||||||||||||||
| Equipment write-offs |
1,526 | — | 8,034 | 6,008 | 410 | |||||||||||||||
| Facility start-up |
— | 1,404 | 30,623 | 10,107 | 18,446 | |||||||||||||||
| Impairment of long-lived assets |
— | — | — | — | 302,979 | |||||||||||||||
| Restructuring charges |
— | — | 30,413 | 11,940 | 18,343 | |||||||||||||||
| Total operating expenses |
41,806 | 42,606 | 114,977 | 116,255 | 396,126 | |||||||||||||||
| Operating loss |
(29,864 | ) | (25,578 | ) | (96,091 | ) | (97,891 | ) | (451,314 | ) | ||||||||||
| Other income (expense), net |
1,851 | 6,806 | (140,963 | ) | (20,614 | ) | (17,350 | ) | ||||||||||||
| Loss before equity income (loss) from interest in Sovello AG, (impairment) recovery of equity investment, and income tax benefit |
(28,013 | ) | (18,772 | ) | (237,054 | ) | (118,505 | ) | (468,664 | ) | ||||||||||
| Equity income (loss) from interest in Sovello AG |
495 | 2,170 | 8,435 | (29,748 | ) | — | ||||||||||||||
| Impairment and other charges associated with equity investment in Sovello AG |
— | — | — | (126,057 | ) | — | ||||||||||||||
| Recovery of impairment charges associated with Sovello AG |
— | — | — | — | 3,227 | |||||||||||||||
| Income tax benefit |
— | — | — | (8,090 | ) | — | ||||||||||||||
| Net loss including noncontrolling interest |
(27,518 | ) | (16,602 | ) | (228,619 | ) | (266,220 | ) | (465,437 | ) | ||||||||||
| Net loss attributable to noncontrolling interest |
849 | — | — | — | — | |||||||||||||||
| Net loss attributable to Evergreen Solar, Inc. |
$ | (26,669 | ) | $ | (16,602 | ) | $ | (228,619 | ) | $ | (266,220 | ) | $ | (465,437 | ) | |||||
| Net loss per share attributable to Evergreen Solar, Inc. (basic and diluted) |
$ | (2.44 | ) | $ | (1.15 | ) | $ | (10.50 | ) | $ | (8.51 | ) | $ | (13.59 | ) | |||||
| Weighted average shares used in computing basic and diluted net loss per share |
10,944 | 14,467 | 21,780 | 31,297 | 34,237 | |||||||||||||||
34
Table of Contents
| As of December 31, | ||||||||||||||||||||
| 2006 | 2007 | 2008 | 2009 | 2010 | ||||||||||||||||
| BALANCE SHEET DATA: |
||||||||||||||||||||
| Cash, cash equivalents and marketable securities * |
$ | 49,421 | $ | 140,703 | $ | 177,509 | $ | 112,368 | $ | 61,574 | ||||||||||
| Investment in and advances to Sovello AG |
70,460 | 87,894 | 115,553 | — | — | |||||||||||||||
| Working capital |
57,590 | 112,228 | 157,802 | 172,015 | 159,829 | |||||||||||||||
| Total assets |
207,251 | 553,255 | 1,008,511 | 827,633 | 424,470 | |||||||||||||||
| Subordinated convertible notes |
90,000 | 90,000 | — | — | — | |||||||||||||||
| Convertible notes, net of discount |
— | — | 311,531 | 323,276 | 389,083 | |||||||||||||||
| Total stockholders' equity (deficit) |
92,847 | 393,293 | 587,638 | 399,186 | (61,129 | ) | ||||||||||||||
| * | Includes restricted cash at December 31, 2007 |
35
Table of Contents
| ITEM 7. | MANAGEMENT’S DISCUSSION AND ANALYSIS OF FINANCIAL CONDITION AND RESULTS OF OPERATIONS. |
EXECUTIVE OVERVIEW
We develop and manufacture multi-crystalline silicon String Ribbon™ wafers utilizing our proprietary wafer manufacturing technology. Our technology involves a unique process to produce multi-crystalline silicon wafers by growing thin strips of silicon that are then cut into wafers. This process substantially reduces the amount of silicon and other processing costs required to produce a wafer when compared to conventional sawing processes. Silicon is the key raw material in manufacturing multi-crystalline silicon wafers. With current silicon consumption of about 3.6 grams per watt, we believe we are the industry leader in efficient silicon consumption and use approximately half the silicon used by wafer manufacturers utilizing conventional sawing processes. The wafers we produce are the primary components of photovoltaic (“PV”) cells which, in turn, are used to produce solar panels (also referred to as solar modules). We believe that our proprietary and patented technologies offer significant cost and manufacturing advantages over competing silicon-based wafer manufacturing technologies. Our wafer manufacturing technology is proven, as over 500 MW of solar panels have been produced and sold utilizing String Ribbon wafers, produced primarily from our facilities in Devens, Massachusetts and our new facility in Wuhan, China as well as Sovello AG (our former joint venture with Renewable Energy Corporation ASA and Q-Cells SE).
Historically, we have produced non-standard size rectangular wafers that were then processed into Evergreen Solar branded solar panels primarily in our own fully integrated factory in Devens, Massachusetts. During 2010, we began production at our 75 MW wafer facility in Wuhan, China and we have contracted with another manufacturer to process our wafers into cells and Evergreen Solar branded panels. Our revenues today are primarily derived from the sale of solar panels. We sell our products using distributors, systems integrators and other value-added resellers, who often add value through system design by incorporating our panels with electronics, structures and wiring systems. Applications for our products primarily include on-grid generation, in which supplemental electricity is provided to an electric utility grid. Our products are currently sold to customers primarily in Europe. We currently have active sales contracts with two customers in Germany, which we expect will consume a substantial portion of our capacity during 2011. However, we have recently announced our intention to focus on our wafer manufacturing technology and thus future revenue growth will be driven by the successful expansion of wafer capacity.
We produce wafers today that are among the lowest cost in the industry. To illustrate this point, today our non-silicon processing costs in Devens are $0.35 per watt. This compares to $0.25 to $0.30 per watt for a large scale Chinese manufacturer today. Since we use about 3.6 grams of silicon today, and the rest of the industry generally uses 6 to 7 grams, our silicon cost is substantially lower. When our Wuhan facility reaches full operating metrics by late-2011, our non-silicon processing costs are expected to be about $0.23 per watt. This compares to an estimated $0.25 per watt for our still larger Chinese competitors, and then only the best of breed companies. Assuming silicon costs of $50 per kilogram, we expect to reduce our fully loaded wafer costs to $0.40 per watt, which compares to $0.55 per watt for our much larger competitors consisting of $0.30 per watt for silicon and $0.25 per watt for processing.
Our target is to reduce non-silicon process cost further, at commercial scale, to $0.13 per watt by the end of 2013, which is substantially less than the projections of Chinese manufacturers. With silicon consumption projected at 2.8 grams per watt or less as we further improve our process and reduce consumable materials costs, our fully loaded wafer costs are expected to be about $0.25 per watt in 2013. We believe our non-silicon process cost will ultimately be better than the best wafer manufacturers in the world because the “non-silicon” costs used in the manufacture of String Ribbon wafers are lower than those used in ingot growing and wire slicing, including:
| • | Crucibles used for sliced wafer ingot growing are used only once and are expensive. Crucibles used for making String Ribbon wafers last for up to two weeks of continuous operation. |
| • | Wafer slicing uses cutting wires, lubricants, and abrasives, each of which has a finite lifetime and must be disposed of after use. The “string” used in String Ribbon wafers becomes integrated in the wafer and there are fewer process steps requiring less consumables and lower maintenance. |
36
Table of Contents
| • | In terms of energy consumption, sliced wafers require more to produce. This is attributed to having to melt more than twice as much silicon at over 1,400 degrees Celsius to produce a sliced wafer than a String Ribbon wafer. |
Our focus moving forward will be on our wafer manufacturing technology and to develop an industry standard size wafer. Development activities associated with the industry standard size wafer have progressed substantially in the second half of 2010, resulting in the production of more than 60,000 wafers manufactured using modified existing quad furnaces. These wafers are performing comparably to those produced using our existing furnaces in Devens and China. Ten prototype furnaces will be installed and we will begin producing industry standard size wafers in much greater quantities in early 2011. Pilot production of up to 25 megawatts (“MW”) is expected to begin by the fourth quarter of 2011. Our future expansion will be based on the industry standard size wafer which is central to our strategy of manufacturing the lowest cost wafer, in an industry standard form factor, and providing a wafer that would enable the lowest cost solar panel utilizing multi-crystalline silicon wafers.
In January 2011, we announced our intent to shut down operations at our Devens manufacturing facility to better position us to pursue our industry standard size wafer strategy and preserve our liquidity. We intend to completely shut down the Devens manufacturing facility by the end of the first quarter of 2011. While overall demand for solar may increase, we expect that significant capacity expansions in low cost manufacturing regions combined with potential adverse changes in government subsidies in several markets in Europe will likely result in continuing pressure on solar panel selling prices throughout 2011. Solar manufacturers in China have received considerable government and financial support and, together with their low manufacturing costs, have become price leaders within the industry. Although production costs at our Devens facility have steadily decreased, they are still much higher than those of our low cost competitors in China. As industry selling prices continue their rapid declines into 2011, panel manufacturing in Devens, either fully or partially, is no longer economically feasible, consequently requiring a complete shutdown of the facility. We believe this is the right long-term decision for the Company, and better positions us to complete our strategy of becoming the low cost producer of industry standard size wafers. As a result of the pending closure, our total product revenue for 2011 is expected to substantially decrease; and beyond the first quarter of 2011, revenues will only be generated from product produced at our Wuhan, China facility.
We will continue to operate our high temperature filament plant in Midland, Michigan and our wafer facility in Wuhan, China. With approximately 75 MW of installed wafer capacity in Wuhan, we will continue to supply our outsourcing partner, Jiawei, with wafers for conversion into Evergreen Solar branded solar panels.
At December 31, 2010, we had approximately $68.4 million of cash and cash equivalents, including restricted cash. The Company is subject to risks common to companies in the high-technology and energy industries including, but not limited to, development by us or our competitors of new technological innovations, dependence on key personnel, dependence on key or sole source suppliers for materials, protection of proprietary technology and compliance with government regulations. Any delay in our plan to implement our business strategy may result in increased costs and could impair business operations.
We believe that our business plan will provide sufficient liquidity to fund our operating needs for the next 12 months. While our business plan anticipates certain levels of potential risk, particularly in light of the difficult and uncertain current economic environment and the continuing reduction of industry panel pricing caused by competition, especially from China, and the resulting excess capacity, we are exposed to additional particular risks and uncertainties including, but not limited to:
| • | the need for our Wuhan manufacturing facility to ramp to 75 MW of capacity and achieve its target manufacturing cost of $1.25 per watt by mid 2012; |
| • | the need for us to continue to make progress on the development of our planned industry standard wafer expansion program allowing further opportunities for growth, including establishing relationships with potential partners and customers for our wafers; |
37
Table of Contents
| • | continued significant fluctuation of the Euro against the U.S. dollar, as a substantial portion of sales are denominated in Euros; |
| • | the ability of Jiawei to effectively manage production and manufacturing costs which has an indirect impact on the pricing charged to us; and |
| • | our ability to maintain the costs associated with the shutdown of our Devens facility to within expectations. |
Although our current business plan indicates that we have adequate liquidity to operate under expected operating conditions, the risks noted above could result in liquidity uncertainty. Our plan with regard to this uncertainty includes, among other actions, to continually monitor our operating results against expectations and, if required, to further restrict operating costs and capital spending if events warrant, and if market conditions allow, possibly accessing the capital markets to meet liquidity and capital expenditure requirements. If additional capital is needed and does not become available on acceptable terms, our ability to fund operations, further develop and expand our manufacturing operations and distribution network or otherwise respond to competitive pressures would be significantly limited. In addition, although our long-term debt does not begin to mature until April 2013 (see Note 7 of our consolidated financial statements), we will actively work to identify sources of liquidity to assist in our ability to repay the debt when it becomes due. There is no assurance that such additional sources of liquidity to repay long-term debt can be obtained on terms acceptable to us, or at all.
On July 27, 2010, at our annual meeting of stockholders, holders of a majority of our outstanding shares of common stock approved a proposal to permit our Board of Directors to amend our certificate of incorporation to authorize a 1-for-6 reverse stock split of our issued and outstanding common stock and a reduction in the number of our authorized shares of common stock from 450,000,000 to 120,000,000. On December 29, 2010, we filed an amendment to our certificate of incorporation to implement the 1-for-6 reverse split. The reverse split became effective at 12:01 a.m. Eastern Standard Time, on Saturday, January 1, 2011. The reverse split, which has been retrospectively applied, has reduced the number of outstanding shares of our common stock from approximately 209 million shares to approximately 35 million shares.
CRITICAL ACCOUNTING POLICIES AND ESTIMATES
The preparation of consolidated financial statements in accordance with generally accepted accounting principals requires us to make estimates and judgments that affect the reported amounts of assets, liabilities, revenues and expenses, and related disclosure of contingent assets and liabilities, if applicable. We base our estimates on historical experience and on various other assumptions that are believed to be reasonable under the circumstances, the results of which form the basis for making judgments about the carrying values of assets and liabilities that are not readily apparent from other sources. Actual results may differ from these estimates under different assumptions or conditions. We believe the following critical accounting policies affect our more significant judgments and estimates used in the preparation of our consolidated financial statements.
Accounting for Sovello AG
Prior to the sale of Sovello AG (“Sovello”) on April 21, 2010, we owned a one-third interest in them and therefore applied the equity method of accounting for our share of Sovello’s operating results in accordance with the Investments topic of the FASB codification. Under the equity method of accounting, we reported our one-third share of Sovello’s net income or loss as a single line item in our statement of operations. Our investment in and advances to Sovello were reported as a single line item in our balance sheet. We regularly monitored the performance of Sovello and, utilizing several factors, assessed the need to record an impairment of the carrying value of our aggregate investment when the impairment was determined to be other than temporary in nature. The process of assessing whether our investment’s net realizable value was less than its carrying cost required a significant amount of judgment. In making this judgment, we carefully considered Sovello’s cash position, projected cash flows, financing needs, comparable market data, the current investing environment, management changes and competition. Based on our evaluation, we recorded an impairment charge of
38
Table of Contents
approximately $126.1 million related to our aggregate investment in Sovello during the year ended December 31, 2009 as a result of the deterioration in Sovello’s operations, their difficulties in renegotiating their bank financing, and on-going deterioration in world-wide pricing for their products. In making this assessment, we considered a range of scenarios including Sovello’s ability to continue as a going concern, future projections of volumes and selling prices, and enterprise value multiples of comparable entities.
Until December 31, 2008, we marketed and sold all solar panels manufactured by Sovello under the Evergreen Solar brand, and managed customer relationships and contracts related to the sale of Sovello manufactured product. We received selling fees from Sovello and did not report gross revenue or cost of goods sold resulting from the sale of Sovello’s solar panels. In addition, we receive royalty payments for our ongoing technology license to Sovello. Combined, the sales and marketing fee and royalties earned totaled approximately $16.7 million, $4.7 million and $4.4 million for the years ended December 31, 2008, 2009 and 2010, respectively. For 2009, we, Q-Cells and REC, our one-third partners in the Sovello joint venture, agreed to have Sovello begin marketing and selling its products under its own brand. With its independent sales and marketing team now in place, our involvement in marketing and selling Sovello product ceased. In light of the sales transition, our selling fee for Sovello product sold under the Evergreen Solar brand was reduced to 0.5% for 2009 from 1.6% in 2008 and was eliminated for 2010.
During the third and fourth quarters of 2009 the Company wrote-off its aggregate investment in Sovello in addition to recording charges associated with its guarantee and for estimated payments relating to undertakings with Sovello’s bank due to Sovello’s significant financial difficulties at that time. As a result, the Company’s 2010 consolidated statement of operations and consolidated statement of cash flows do not include its one-third share of Sovello’s results of operations. On April 21, 2010, all of the outstanding shares of Sovello were sold to Rolling Hills S.à.r.l, an affiliate of Ventizz Capital Fund IV, L.P (“Ventizz”) (see Note 5 of our consolidated financial statements for further information).
Revenue Recognition and Allowance for Doubtful Accounts
We recognize product revenue if there is persuasive evidence of an agreement with the customer, shipment has occurred, risk of loss has transferred to the customer, the sales price is fixed or determinable, and collectability is reasonably assured. The market for solar power products is emerging and rapidly evolving. We currently sell our solar power products primarily to distributors, system integrators and other value-added resellers within and outside of North America, who typically resell our products to end users throughout the world. We have not offered rights to return our products other than for normal warranty conditions. For new customers requesting credit, we evaluate creditworthiness based on credit applications, feedback from provided references, and credit reports from independent agencies. For existing customers, we evaluate creditworthiness based on payment history and any known changes in their financial condition. Through the third quarter of 2009, royalty and fee revenue were recognized at contractual rates upon sale of product by Sovello. Beginning in the second quarter of 2010, upon entering a new agreement, royalty revenue from Sovello is recognized based upon a flat royalty rate. Product revenues represented 85%, 98% and 99% of total revenues for the years ended December 31, 2008, 2009 and 2010, respectively. International product sales accounted for approximately 42%, 74% and 85% of total product revenues for the years ended December 31, 2008, 2009 and 2010, respectively.
We maintain allowances for doubtful accounts for estimated losses resulting from the inability of our customers to make required payments. If the financial condition of our customers were to deteriorate, such that their ability to make payments was impaired, additional allowances could be required.
Warranty
Our current standard product warranty includes a ten-year warranty period for defects in material and workmanship, effective for product sold beginning on January 1, 2011, and a 25-year warranty period for declines in power performance which are standard in the solar industry. We currently accrue a liability of approximately 0.5%, on average, of current product revenues for the estimated future costs of meeting our warranty obligations, the levels of which are consistent with industry ranges. We make and revise this estimate
39
Table of Contents
based on the number of solar panels shipped and our historical experience with warranty claims. During 2008, we re-evaluated potential warranty exposure as a result of the substantial increase in production volumes at our Devens, Massachusetts manufacturing facility. In addition, we evaluated the quality of the panels produced by Jiawei. We continuously monitor the quality of our product. As of December 31, 2010, our accrual for estimated future warranty costs is approximately $3.9 million.
We engage in product quality programs and processes, including monitoring and evaluating the quality of component suppliers, in an effort to ensure the quality of our product and reduce our warranty exposure. Our warranty obligation will be affected not only by our product failure rates, but also the costs to repair or replace failed products and potential service and delivery costs incurred in correcting a product failure. If our actual product failure rates, repair or replacement costs, or service or delivery costs differ from these estimates, accrued warranty costs would be adjusted in the period that such events or costs become known.
Stock-based Compensation
We measure compensation cost arising from the grant of share-based payments to employees at fair value and recognize such cost in our operating results over the period during which the employee is required to provide service in exchange for the award, usually the vesting period, in accordance with the provisions of the Stock Compensation topic of the FASB codification. Total equity compensation expense recognized during the years ended December 31, 2008, 2009 and 2010 was approximately $7.2 million, $6.7 million, and $4.3 million, respectively. For grants of restricted stock and restricted stock units, stock-based compensation cost is measured at the grant date based on the fair value of the award and is recognized as expense on a straight-line basis over the awards’ service periods, which are the vesting periods, less estimated forfeitures. For grants of stock options we estimate the fair value using the Black-Scholes option valuation model. Key input assumptions used to estimate the fair value of stock options include the exercise price of the award, the expected option term, the expected volatility of our stock over the option’s expected term, the risk-free interest rate over the stock option’s expected term and the annual dividend yield.
During 2006 and 2007, we granted 133,334 shares and 150,000 shares, respectively, of performance-based restricted stock which would immediately vest upon the achievement of specific financial performance targets prior to 2011 and 2012, respectively. We had assumed that none of these grants would vest and accordingly did not provide for compensation expense associated with the awards. Of the 283,334 shares granted, 216,667 shares have since been cancelled due to employee terminations in addition to the expiration of the performance period associated with the 2006 grant without attaining the financial performance targets. We have assumed that none of the remaining performance-based awards will vest and accordingly have not provided for compensation expense associated with the awards. We periodically evaluate the likelihood of reaching the performance requirements and will be required to recognize compensation expense of approximately $3.4 million associated with the remaining performance-based awards if such awards should vest.
See Note 11 of our consolidated financial statements for further information regarding our stock-based compensation assumptions and expenses.
Inventory
Inventory is valued at the lower of cost or market determined on a first-in, first-out basis. Certain factors may impact the net realizable value of our inventory including, but not limited to, technological changes, market demand, changes in product mix strategy, new product introductions and significant changes to our cost structure. Estimates of reserves are made for obsolescence based on the current product mix on hand and its expected net realizable value. If actual market conditions are less favorable or other factors arise that are significantly different than those anticipated by management, additional inventory write-downs or increases in obsolescence reserves may be required. We consider lower of cost or market adjustments and inventory reserves as an adjustment to the cost basis of the underlying inventory. Accordingly, favorable changes in market conditions are not recorded to inventory in subsequent periods. In addition, we have made non-refundable prepayments under several of our multi-year polysilicon supply agreements which are presented on the balance
40
Table of Contents
sheet in Prepaid Cost of Inventory. These prepayments will be amortized as an additional cost of inventory as we receive and utilize the silicon. The prepayments are classified as short-term based upon the value of silicon contracted to be delivered during the next twelve months. We carry these prepayments on our balance sheet at cost and periodically evaluate the vendor’s ability to fulfill its obligations under the terms of the silicon contract. As a result of our announced intentions to close our Devens facility, we recorded a non-cash impairment charge of approximately $74.5 million on our prepaid cost of silicon inventory (see Note 3 of our consolidated financial statements).
Impairment of Long-lived Assets
Our policy regarding long-lived assets is to evaluate the recoverability or usefulness of these assets when the facts and circumstances suggest that these assets may be impaired. This analysis relies on a number of factors, including changes in strategic direction, business plans, regulatory developments, economic and budget projections, technological improvements, and operating results. The test of recoverability or usefulness is a comparison of the asset value to the undiscounted cash flow over the asset’s remaining useful life. If such a test indicates that an impairment exists, then the asset is written down to its estimated fair value. Any write-downs would be treated as permanent reductions in the carrying amounts of the assets and an operating loss would be recognized. See Note 14 of our consolidated financial statements for further information.
Income Taxes
We are required to estimate our income taxes in each of the jurisdictions in which we operate as part of our consolidated financial statements. This involves estimating the actual current tax in addition to assessing temporary differences resulting from differing treatments for tax and financial accounting purposes. These differences together with net operating loss carryforwards and tax credits may be recorded as deferred tax assets or liabilities on the balance sheet. A judgment must then be made of the likelihood that any deferred tax assets will be recovered from future taxable income. To the extent that we determine that it is more likely than not that deferred tax assets will not be utilized, a valuation allowance is established. Taxable income in future periods significantly different from that projected may cause adjustments to the valuation allowance that could materially increase or decrease future income tax expense.
Results of Operations
Description of Our Revenues, Costs and Expenses
Revenues. Our total revenues consist of revenues from the sale of products in addition to royalty revenue associated with a technology agreement with Sovello. The technology agreement was renegotiated in 2010 as part of our divestiture of Sovello during the second quarter of 2010. Prior to 2009 we received royalty revenue associated with a technology agreement with Sovello, and fees from Sovello for our marketing and selling activities associated with sales of product manufactured by Sovello under the Evergreen Solar brand. Product revenues consist of revenues primarily from the sale of solar panels. Product revenues represented 85%, 98% and 99% of total revenues in 2008, 2009 and 2010, respectively. International product sales accounted for approximately 42%, 74% and 85% of total product revenues for the years ended December 31, 2008, 2009 and 2010, respectively.
Cost of revenues. Cost of revenues consists primarily of material expenses including the amortization of non-cash costs associated with a silicon contract, salaries and related personnel costs, including stock based compensation, depreciation expense, maintenance, rent and other support expenses associated with the manufacture of our solar power products. In addition, 2010 cost of revenues includes a non-cash charge associated with accelerated amortization for a portion of its prepaid cost of silicon inventory.
Research and development expenses. Research and development expenses consist primarily of salaries and related personnel costs, including stock based compensation costs, consulting expenses and prototype costs
41
Table of Contents
related to the design, engineering, development, testing and enhancement of our products, manufacturing equipment and manufacturing technology. We expense our research and development costs as incurred. We also may receive payments from third parties as reimbursement of certain research and development costs we will incur. We believe that research and development is critical to our strategic objectives of enhancing our technology, reducing manufacturing costs and meeting the changing requirements of our customers.
Selling, general and administrative expenses. Selling, general and administrative expenses consist primarily of salaries and related personnel costs, including stock based compensation costs, employee recruiting costs, accounting and legal fees, rent, insurance and other selling, marketing and administrative expenses. We expect that selling expenses will decrease during 2011 as a result of having less product to sell due to the closing of our Devens manufacturing facility.
Facility start-up. Facility start-up expenses consist primarily of salaries and personnel-related costs and the cost of operating a new facility before it has been qualified for full production. It also includes all expenses related to the selection of a new site and the related legal and regulatory costs and the costs to maintain our plant expansion program, to the extent we cannot capitalize these expenditures. We expect that facility start-up expenses associated with our 75 MW wafer manufacturing facility in Wuhan, China will substantially decrease during 2011 as the facility approaches full capacity.
Restructuring charges. Restructuring charges consist of costs associated with the closure of our Marlboro pilot manufacturing facility which occurred on December 31, 2008 and accelerated depreciation associated with our original plan of transitioning our Devens based panel manufacturing to China prior to the announcement of our intention to close the entire Devens facility. The charges primarily include severance costs, the write-off of manufacturing equipment, leasehold improvements and inventory, the cost of moving equipment out of the facility, occupancy expenses and accelerated depreciation expenses.
Other income (expense), net. Other income (expense) consists of net foreign exchange gains and losses, interest income primarily from interest earned on the holding of short-term investments and outstanding loans and finance charges associated with late customer payments, interest expense on outstanding debt, and gains and losses from the extinguishment of outstanding debt.
Equity income (loss) from interest in Sovello AG and impairment of investment. Prior to the write-off of our investment in Sovello during the fourth quarter of 2009 and its ultimate disposition in April 2010, we accounted for our one-third share of Sovello’s operating results under the equity method of accounting, which required us to record our one-third share of Sovello’s net income or loss as one line item in our consolidated statement of operations. We also accounted for any impairment of the carrying value of our aggregate investment, including advances, when the impairment was determined to be other than temporary in nature.
COMPARISON OF YEARS ENDED DECEMBER 31, 2010 AND 2009
Revenues. Our product revenues for the year ended December 31, 2010 increased 25% to $334.4 million from $267.1 million for the year-ended December 31, 2009. This increase in product revenue resulted from increases in sales volume as we continued to scale our Devens facility which began shipping product in the third quarter of 2008. During the year ended December 31, 2010 we shipped approximately 164.5 MW compared to 103.7 MW for the year ended December 31, 2009. We believe that this increase in volume was also due, in part, to the negative impact on 2009 sales which resulted from the credit constraints that began with the 2008 worldwide economic downturn. The increase in volumes was offset by lower selling prices which have declined, on average, by approximately 21% from 2009 as a result of continued pricing pressures in the market place and, to a lesser extent a slightly stronger U.S. dollar. Due to our announced intention to close our Devens manufacturing facility, our total product revenue for 2011 is expected to substantially decrease; and beyond the first quarter of 2011, revenues will only be generated from product produced at our 75 MW Wuhan, China facility.
42
Table of Contents
Royalty revenue earned from Sovello for the year ended December 31, 2010 was $4.4 million, a decrease of 7% or $333,000 from $4.7 million for the year ended December 31, 2009. As part of the sale of our investment in Sovello during the second quarter of 2010, we negotiated a new license agreement under which Sovello agreed to pay us $2 million in royalties in 2010 and approximately $3 million in each of the subsequent 2 years for the capacity that exists at Sovello. As a result, we recognized $2.0 million of royalty revenue during the year ended December 31, 2010 under the new agreement. In addition, as part of the settlement of the sale of Sovello, we received approximately $2.4 million of royalty payments associated with the fourth quarter of 2009 which were not previously recognized as royalty revenue due to the substantial doubt that existed at that time regarding Sovello’s ability to settle the amount.
International product revenues accounted for 74% and 85% of total product revenues for the years ended December 31, 2009 and 2010, respectively. The increase in our capacity, driven by the completion of our Devens facility, had allowed us to continually adjust our distribution strategy as the markets for solar energy products rapidly developed and changed. Despite larger than historically experienced declines in global subsidies, particularly those in Germany, rapid declines in product pricing, combined with the development of new geographic markets have driven continued overall market growth in Europe. While further declines in subsidies are expected, declines in selling prices are also anticipated which makes the market reaction to such declines difficult to predict.
The following table summarizes the concentration of our product revenues by geography and customer:
| 2009 | 2010 | |||||||
| By geography: |
||||||||
| United States |
26 | % | 15 | % | ||||
| Germany |
52 | % | 61 | % | ||||
| Czechoslovakia |
2 | % | 12 | % | ||||
| All other |
20 | % | 12 | % | ||||
| 100 | % | 100 | % | |||||
| By customer: |
||||||||
| IBC Solar AG |
17 | % | 26 | % | ||||
| Ralos Vertriebs GmbH |
15 | % | — | |||||
| Wagner & Co. Solartechnik GmbH |
14 | % | 15 | % | ||||
| Donauer Solartechnik Vertriebs GmbH |
5 | % | 12 | % | ||||
| NWT a.s. |
2 | % | 12 | % | ||||
| All other |
47 | % | 35 | % | ||||
| 100 | % | 100 | % | |||||
Cost of product revenues and gross margin. Our cost of product revenues for the year ended December 31, 2010 was approximately $319.4 million, an increase of approximately $65.9 million, from $253.5 million for the year ended December 31, 2009. Gross margin for the year ended December 31, 2010 was -16.3% as compared to 6.8% for the year ended December 31, 2009. The decrease in gross margin primarily resulted from an impairment charge of $74.5 million incurred on our prepaid cost of silicon inventory. The charge was associated with our announced intentions to close our Devens facility. In addition to the impairment charge, we experienced a significant decline in average selling prices that began during the early part of 2009 and has since continued. The decline in average selling prices were partially offset by lower average costs which for the year ended December 31, 2010 were approximately $1.94 per watt, down from $2.45 per watt for the year ended December 31, 2009. The lower costs were driven by improved efficiencies in overhead manufacturing costs as a result of the level of fixed costs in relation to the significant increase in our sales volumes that resulted from our continued ramp in capacity at Devens during 2010, and significant improvements in factory yields.
43
Table of Contents
As a result of anticipated lower solar panel sales volumes due to production only in Wuhan, China, with expected capacity of approximately 75 MW annually, we do not expect gross margins to improve meaningfully until we begin large scale commercial operations of expanded wafer capacity associated with our industry standard wafer manufacturing strategy, expected to begin during 2012.
Research and development expenses. Our research and development expenses for the year ended December 31, 2010 were approximately $19.5 million an increase of approximately $1.4 million, or 8%, from $18.1 million for the year ended December 31, 2009. The increase is attributable to higher material and equipment expenses of approximately $1.1 million primarily associated with initiatives to increase cell efficiency, increased compensation and related costs of approximately $452,000, and higher travel expenses of approximately $209,000 primarily in support of our new operation in Wuhan, China. These expenses were offset by lower depreciation expense of approximately $345,000. We expect that research and development expenses will increase in 2011 as we strategically invest in the development of an industry standard wafer.
Selling, general and administrative expenses. Our selling, general and administrative expenses for the year ended December 31, 2010 were approximately $36.5 million, an increase of $10.2 million, or 39%, from $26.3 million for the year ended December 31, 2009. This increase was primarily attributable to a third quarter doubtful account charge of approximately $6.4 million relating to a receivable from a Korean customer. The remaining increases in our selling, general and administrative costs were, in general, the result of our overall expansion of operations. Compensation and related costs increased approximately $1.7 million associated with higher incentive compensation costs, merit increases and additional personnel in support of our overall expansion of operations, which were partially offset by lower stock compensation costs. We experienced lower compensation costs in 2009 due to an organization wide salary reduction and lower incentive compensation accruals. We also incurred increased professional fees of approximately $701,000, increased travel expenses of $277,000, increased trade show costs of $561,000 and an increase in information technology costs of approximately $386,000. As a result of the shutdown of our Devens facility and the associated functions impacted by this shutdown, we expect that selling expenses, and to a lesser extent general and administrative expenses, will be lower in 2011.
Write-off of loan receivable from silicon supplier. During December 2007, we entered into a multi-year silicon supply agreement with Silicium De Provence (“Silpro”) which provided the general terms and conditions pursuant to which Silpro would supply us with specified annual quantities of silicon at fixed prices beginning in 2010 and continuing through 2019. In connection with this supply agreement, we loaned Silpro 30 million Euros, which was scheduled to be repaid in the first quarter of 2013. The loan carried an interest rate of 3.0% compounded annually. In April 2009 as a result of its inability to obtain additional financing to continue construction of its factory, Silpro announced that the French commercial court ordered the filing for judicial settlement proceedings (redressement judiciaire), a process similar to bankruptcy proceedings in the United States. As a result, the loan receivable and the related interest from Silpro will not be repaid; and we recognized a non-cash charge of $43.9 million. In August 2009, the court ordered liquidation proceedings (liquidation judiciaire) due to Silpro’s inability to secure further financing.
Equipment write-offs. During the year-ended December 31, 2010 we wrote-off approximately $410,000 of certain discontinued development equipment. Also, in our continuing efforts to streamline our operations, we incurred charges of approximately $6.0 million during the year ended December 31, 2009 as a result of the write-off of certain Devens equipment in addition to development equipment that was discontinued in the fourth quarter.
Facility start-up. In preparing for the operations of our Midland, Michigan and Wuhan, China facilities we incurred costs during the year ended December 31, 2010 of approximately $18.4 million, an increase of $8.3 million from $10.1 million in 2009. Start-up costs include salaries and personnel related costs, consulting costs, consumable material costs, utilities and miscellaneous other costs associated with preparing and qualifying these facilities for production. Construction of the facility in Midland began during the third quarter of 2008 with the first production runs beginning in the fourth quarter of 2009. Planning for our facility in China, which started preliminary operations during July 2010, began during the second quarter of 2009. Construction of the facility in Devens began in September 2007, and the first solar panels were produced in the third quarter of 2008.
44
Table of Contents
Impairment of long-lived assets. As a result of our intent to fully shutdown operations at our Devens manufacturing facility by the end of the first quarter of 2011 in order to better position us to pursue our industry standard size wafer strategy and preserve our liquidity, we recorded asset impairment charges of approximately $303 million relating to the fixed assets at Devens. As a result of the announced shutdown we performed an impairment analysis for all of our long-lived assets. The impairment analysis required us to compare our asset values to the undiscounted net operating cash flow over the assets’ remaining useful lives. The results of the analysis required us to write down the assets to their estimated fair value which was treated as a permanent reduction in the carrying amount of the assets and an operating loss recognized. In determining fair value, we referred to a combination of third party appraisals, estimates from brokers, estimates of scrap value and other value measures consistent with the highest and best use for the various assets. This represented our best estimate of fair value and is subject to change based on the final disposition of the assets. We plan to continue utilizing the Wuhan and Midland facilities; and based on the fact that they were only recently completed, we have concluded that the current carrying values for these facilities approximates fair value.
Restructuring charges. During the fourth quarter of 2009, our Board of Directors approved a plan to accelerate our strategic initiative of focusing on our unique wafer manufacturing technology by transitioning our Devens, Massachusetts based panel assembly to China beginning in 2010 with the expectation of reducing manufacturing costs associated with panel assembly once the transition is complete.
On December 31, 2008, we ceased production at our Marlboro pilot manufacturing facility as part of our restructuring plan to lower overhead costs and reduce overall cash requirements. Ongoing R&D activities continue to be performed at our research and development facility in Marlboro; and advanced manufacturing piloting activities are now performed at our Devens manufacturing facility. The Marlboro pilot manufacturing facility employees were transferred to the Devens manufacturing facility.
For the year ended December 31, 2010 we recorded costs of approximately $18.3 million comprised primarily of accelerated depreciation of our existing Devens panel assembly equipment and, to a lesser extent, occupancy and support costs for our Marlboro pilot manufacturing facility. For the year ended December 31, 2009 we recorded costs of approximately $11.9 million primarily for severance to terminated employees, rent and utilities, and professional fees and support costs associated with closure of our Marlboro facility. We continued to incur occupancy, support and moving costs through the end of the lease term which expired during the third quarter of 2010.
Other income (expense) net. Other net expense of $17.4 million for the year ended December 31, 2010 was comprised of approximately $40.3 million in interest expense primarily associated with our convertible debt in addition to our China loan, and approximately $3.8 million of net foreign exchange losses. These expenses were offset by approximately $24.8 million of gain recognized on the early extinguishment of a portion of our 4% convertible notes and approximately $2.0 million in interest income. Other net expense of $20.6 million for the year ended December 31, 2009 was comprised of approximately $28.0 million in interest expense offset by approximately $4.7 million in interest income and approximately $2.7 million of net foreign exchange gains. The increase in net foreign exchange loses was due to the strengthening of the U.S. dollar that occurred during 2010 primarily on our Euro denominated accounts receivable. The higher interest expense is attributable to our higher debt obligations, which, in the aggregate increased by approximately $40 million since December 31, 2009 in addition to higher interest rates on the new debt obligations. The decrease in interest income is largely attributable to the cessation of interest earned on our prior outstanding loans, primarily Sovello, lower interest collected on past due accounts receivable and lower interest earned on invested funds. These declines were offset by interest earned on our outstanding loans to Jiawei which were advanced during the first half of 2010.
Equity income (loss) from interest in Sovello AG and impairment of equity interest. The equity loss from our interest in Sovello for the year ended December 31, 2009, excluding the impairment charge, was approximately $29.7 million, net of withholding taxes. In conjunction with the write-off of our aggregate investment in Sovello during the fourth quarter of 2009, we ceased recording our one-third share of Sovello’s operating results. In
45
Table of Contents
addition we recorded an impairment charge of approximately $126.1 million related to our aggregate investment in Sovello, including advances, for the year ended December 31, 2009 as a result of the significant deterioration in Sovello’s operations, due in part to the on-going deterioration in world-wide pricing for their products, and their continued difficulties in renegotiating their bank financing.
During the year ended December 31, 2009 we recorded an $8.1 million income tax benefit in our statement of operations as a result of the impairment charge recorded against the book basis of our investment in Sovello. This income tax benefit arose from the reversal of a previously recorded deferred income tax liability.
Recovery of impairment charges associated with Sovello AG. For the year ended December 31, 2010, we recorded a recovery of approximately $3.2 million which represents a portion of the 2009 impairment charge we recorded on our aggregate investment in Sovello. This recovery resulted from the sale of Sovello to Ventizz on April 21, 2010 (see Note 5 to our Consolidated Financial Statements).
Net loss. As a result of the foregoing, our net loss was $465.4 million for the year ended December 31, 2010 ($13.59 net loss per share, basic and diluted) compared to a net loss of $266.2 million for the year ended December 31, 2009 ($8.51 net loss per share, basic and diluted).
COMPARISON OF YEARS ENDED DECEMBER 31, 2009 AND 2008
Revenues. Our product revenues for the year ended December 31, 2009 increased 180% to $267.1 million from $95.2 million for the year-ended December 31, 2008. This increase in product revenues resulted from increased sales volume which was generated from our new Devens facility which began shipping product in the third quarter of 2008. Product revenue for most of 2008 was generated from our now closed Marlboro facility. During the year ended December 31, 2009 we shipped approximately 103.7 MW compared to 26.4 MW for the year ended December 31, 2008. This increase in volume was offset by lower selling prices which have declined, on average, by approximately 28% from 2008 as a result of continued pricing pressures in the market place in addition to a stronger U.S. dollar during 2009. In addition, we believe that 2009 sales were negatively impacted by the credit constraints that began with the 2008 worldwide economic downturn. Royalty revenue and marketing and selling fees earned from Sovello for the year ended December 31, 2009 were $4.7 million, a decrease of 72% or $12.0 million from $16.7 million for the year ended December 31, 2008. The decrease in royalty revenue and marketing and selling fees from Sovello was due mainly to substantially lower sales volume at Sovello which was down approximately 49%. In addition, we did not recognize royalty revenue during the fourth quarter of 2009 due to the substantial doubt that existed at that time regarding Sovello’s ability to settle the amount.
International product revenues accounted for 74% and 42% of total product revenues for the years ended December 31, 2009 and 2008, respectively. The increase in our capacity, driven by the completion of our Devens facility, allowed us to continually adjust our distribution strategy as the markets for solar energy rapidly developed and changed.
46
Table of Contents
The following table summarizes the concentration of our product revenues by geography and customer:
| 2008 | 2009 | |||||||
| By geography: |
||||||||
| United States |
58 | % | 26 | % | ||||
| Germany |
28 | % | 52 | % | ||||
| All other |
14 | % | 22 | % | ||||
| 100 | % | 100 | % | |||||
| By customer: |
||||||||
| IBC Solar AG |
4 | % | 17 | % | ||||
| Ralos Vertriebs GmbH |
15 | % | 15 | % | ||||
| Wagner & Co. Solartechnik GmbH |
1 | % | 14 | % | ||||
| SunPower Corporation |
31 | % | — | |||||
| All other |
49 | % | 54 | % | ||||
| 100 | % | 100 | % | |||||
Cost of product revenues and gross margin. Our cost of product revenues for the year ended December 31, 2009 was approximately $253.5 million, an increase of approximately $160.4 million, from $93.1 million for the year ended December 31, 2008. Gross margin for the year ended December 31, 2009 was 6.8% as compared to 16.9% for the year ended December 31, 2008. The decrease in gross margin primarily resulted from the significant decline in average selling prices that began during the early part of 2009. To a lesser extent, gross margins were negatively impacted by higher costs associated with initial production at our Devens facility, the level of fixed costs in relation to our sales volumes as we ramped capacity at Devens during 2009, and lower royalty and selling fees from Sovello. The higher initial production costs experienced at our Devens facility resulted from inefficiencies we anticipated during the early stages of our significant capacity expansion.
Research and development expenses. Our research and development expenses for the year ended December 31, 2009 were approximately $18.1 million a decrease of approximately $4.0 million, or 18%, from $22.0 million for the year ended December 31, 2008. The decrease is primarily attributable to lower depreciation expense of approximately $1.9 million resulting from the write-off of research and development equipment in December 2008 that supported now-obsolete technologies, lower allocated manufacturing support costs of approximately $1.1 million, lower professional fees of approximately $286,000 and lower travel costs of approximately $112,000.
Selling, general and administrative expenses. Our selling, general and administrative expenses for the year ended December 31, 2009 were approximately $26.3 million, an increase of $2.4 million, or 10%, from $23.9 million for the year ended December 31, 2008. In general, our selling, general and administrative costs have increased as a result of our overall expansion of operations. These increases were primarily attributable to increased compensation and related costs of approximately $928,000 associated with additional personnel, higher incentive compensation accruals and the inclusion of Devens related general and administrative support personnel which in the prior year were partially classified within facility start-up costs. These compensation increases were partially offset by an organization wide salary reduction which was effective during the second and third quarters of 2009. In addition, we incurred higher trade show and customer support costs of approximately $421,000, including sales commissions associated with higher commissionable sales, increased information technology costs of approximately $597,000 to support the growth of our operations, higher insurance costs of $380,000 associated with our expanded facilities and workforce, increased depreciation of $225,000 related to additional equipment needed to support additional personnel, and higher legal costs of $188,000 in support of our on-going operations. These increases were partially offset by lower travel related costs of $198,000.
Write-off of loan receivable from silicon supplier. During December 2007, we entered into a multi-year silicon supply agreement with Silicium De Provence (“Silpro”) which provided the general terms and conditions
47
Table of Contents
pursuant to which Silpro would supply us with specified annual quantities of silicon at fixed prices beginning in 2010 and continuing through 2019. In connection with this supply agreement, we loaned Silpro 30 million Euros, which was scheduled to be repaid in the first quarter of 2013. The loan carried an interest rate of 3.0% compounded annually. In April 2009 as a result of its inability to obtain additional financing to continue construction of its factory, Silpro announced that the French commercial court ordered the filing for judicial settlement proceedings (redressement judiciaire), a process similar to bankruptcy proceedings in the United States. As a result, the loan receivable and the related interest from Silpro will not be repaid; and we recognized a non-cash charge of $43.9 million. In August 2009, the court ordered liquidation proceedings (liquidation judiciaire) due to Silpro’s inability to secure further financing.
Equipment write-offs. In our continuing efforts to streamline our operations, we incurred charges of approximately $6.0 million during the year ended December 31, 2009 as a result of the write-off of certain Devens equipment in addition to development equipment that was discontinued in the fourth quarter.
Facility start-up. In preparing for the operations of our Devens, Massachusetts, Midland, Michigan and Wuhan, China facilities we incurred costs during the year ended December 31, 2009 of approximately $10.1 million, a decrease of $20.5 million from $30.6 million in 2008. Start-up costs include salaries and personnel related costs, consulting costs, consumable material costs, utilities and miscellaneous other costs associated with preparing and qualifying these facilities for production. Construction of the facility in Devens began in September 2007, and the first solar panels were produced in the third quarter of 2008. Construction of the facility in Midland began during the third quarter of 2008 with the first production runs beginning in the fourth quarter of 2009. Planning for our facility in China, which started preliminary operations during July 2010, began during the second quarter of 2009.
Restructuring charges. We recorded a restructuring charge to continuing operations of approximately $11.9 million for the year ended December 31, 2009. A substantial portion of these charges related to the acceleration of our strategic initiative to focus on our unique wafer manufacturing technology and transition our Devens based panel assembly to China as was approved in the fourth quarter of 2009. We expect to reduce manufacturing costs associated with panel assembly once the transition is completed. The charges associated with beginning this transition were comprised primarily of accelerated depreciation. In addition to the charges for panel assembly, we incurred on-going costs, including rent, depreciation, utilities, supplies and professional fees associated with closing our Marlboro, Massachusetts pilot manufacturing facility in December 2008, part of our ongoing efforts to lower overhead costs and reduce overall cash requirements. We continued to incur occupancy, support and moving costs through the end of the lease term which expired during 2010.
For the year ended December 31, 2008 we recorded a charge to continuing operations, principally non-cash, of approximately $30.4 million associated with closing Marlboro. Nearly all of the Marlboro pilot manufacturing facility employees transferred to the Devens manufacturing facility to fill open positions associated with its second phase. The charges we recorded were comprised primarily of leasehold improvements and other related building costs of $5.4 million, equipment of approximately $20.9 million, inventory and spare parts of $3.9 million, and salaries and personal related costs associated with severance of approximately $0.2 million.
Other income (expense) net. Other net expense of $20.6 million for the year ended December 31, 2009 was comprised of approximately $28.0 million in interest expense offset by approximately $4.7 million in interest income and approximately $2.7 million of net foreign exchange gains. Other expense, net, of $141 million for the year ended December 31, 2008 was comprised of approximately $140.7 million associated with the loss on our share lending agreement (see Note 10 of our consolidated financial statements), approximately $4.1 million of net foreign exchange losses and approximately $8.9 million in interest expense, offset by approximately $12.7 million in interest income. The increase in net foreign exchange gains was due to the mark-to-market adjustment on our Euro denominated loan to a silicon supplier during the first quarter 2009 in addition to the timing of our Euro denominated transactions. The decrease in interest income is attributable to lower interest rates in addition to our lower average cash balances that resulted from our use of cash for the construction of the Devens and
48
Table of Contents
Midland facilities, and our operational requirements driven by the growth of our business. The higher interest expense is attributable to our higher convertible debt obligations which increased by approximately $284 million during the third quarter of 2008 and lower capitalized interest costs that resulted from the substantial completion of the Devens facility. This increase was partially offset by a slightly lower interest rate on the new borrowings. In addition to our convertible debt, we incurred interest expense on the loans we received from HSTIC during the third and fourth quarters of 2009 associated with our expansion into China.
Equity income (loss) from interest in Sovello AG and impairment of investment. The equity loss from our interest in Sovello for the year ended December 31, 2009, excluding the impairment charge, was approximately $29.7 million compared to equity income of $8.4 million, net of withholding taxes, for the year ended December 31, 2008. The decrease in Sovello’s operating results was primarily due to the substantial decrease in its sales volume. In addition, for the year ended December 31, 2009 we recorded an impairment charge of approximately $126.1 million related to our aggregate investment in Sovello, including advances, as a result of the significant deterioration in Sovello’s operations, due in part to the on-going deterioration in world-wide pricing for their products, and their continued difficulties in renegotiating their bank financing.
During the year ended December 31, 2009 we recorded an $8.1 million income tax benefit in our statement of operations as a result of the impairment charge recorded against the book basis of our investment in Sovello. This income tax benefit arose from the reversal of a previously recorded deferred income tax liability.
Net loss. As a result of the foregoing, our net loss was $266.2 million for the year ended December 31, 2009 ($8.51 net loss per share, basic and diluted) compared to a net loss of $228.6 million for the year ended December 31, 2008 ($10.50 net loss per share, basic and diluted).
LIQUIDITY AND CAPITAL RESOURCES
We have historically financed our operations and met our capital expenditure requirements primarily through sales of our capital stock, issuance of convertible debt and, to a lesser extent, product and royalty revenues. At December 31, 2010, we had working capital of $159.8 million, including cash and cash equivalents of $61.6 million.
Net cash used in operating activities was $65.9 million, $37.1 million and $47.9 million for the years ended December 31, 2008, 2009 and 2010, respectively. The use of cash from operating activities for the year ended December 31, 2010 was primarily due to negative cash flow recognized from our operations of approximately $18.0 million, after adjusting for non-cash charges, an increase in accounts receivable of approximately $29.5 million associated with the significant increase in our product revenues and for wafers utilized by Jiawei in conjunction with our subcontract arrangement, an increase in inventory of $6.7 million, including prepaid cost of inventory, associated with higher production volumes at Devens and the start-up of our operations at our facility in China, and an increase in other current assets of $3.8 million primarily the result of VAT on China equipment purchases offset by lower spare parts inventory. These uses were offset by an increase in interest payable of approximately $4.2 million and an increase in accounts payable and accrued expenses of approximately $6.5 million due to volumes and the timing of payments.
The use of cash from operating activities for the year ended December 31, 2009 was primarily due to increases in accounts receivable of approximately $19.2 million associated with the increase in our sales volume in addition to slightly longer customer payment cycles, an increase in inventory of $13.5 million, including the prepaid cost of inventory, as we ramped up capacity at Devens during 2009, and a reduction in accounts payable and accrued expense of $22.0 million due to timing of payments including amounts related to Sovello. These uses were offset by the positive cash flow recognized from our operations of approximately $10.1 million, after adjusting for non-cash charges, and an increase in our interest payable of approximately $6.3 million.
Net cash used in operating activities in the year ended December 31, 2008 was due primarily to losses from our operations of $27.8 million, net of non-cash charges, increases in inventory levels of $15.4 million as we
49
Table of Contents
began to scale Devens, increases in prepaid cost of inventory of $43.0 million which was mainly the result of nonrefundable payments required under our silicon supply agreements, and increases in our accounts receivable of approximately $26.2 million associated with our increase in revenue. These uses were offset by the receipt of $19.9 million of grants, an increase in accounts payable and accrued expenses of $15.9 million due to the timing of payments, and a decrease in other current assets of $8.3 million, the majority of which relates to the refund of VAT taxes.
Net cash used in investing activities was $355.4 million, $57.2 million and $79.1 million for the years ended December 31, 2008, 2009 and 2010, respectively. The net cash used in investing activities for the year ended December 31, 2010 was primarily for capital expenditures of approximately $48.0 million, a substantial portion of which was for construction and equipment for our Wuhan, China manufacturing facility, and to a lesser extent our Devens, Massachusetts and Midland, Michigan facilities. We also advanced approximately $12.8 million to Jiawei, our Chinese manufacturing partner, as part of our loan agreement with them which provided Jiawei with financing flexibility to establish their cell and panel manufacturing facility as well as for working capital requirements as they rapidly ramped their operations to support the contract manufacturing relationship we established with them during 2009. In addition, we segregated net cash of approximately $3.7 million, the majority of which is required by our bank to be maintained in our operating cash account as part of our secured note offering completed during 2010. Lastly, in conjunction with the Sovello guarantee and subsequent sale, we made payments of approximately $14.8 million.
The net cash used in investing activities for the year ended December 31, 2009 of approximately $57.2 million was mainly for expenditures of approximately $110.8 million associated with the construction of our Devens, Massachusetts, Midland, Michigan and Wuhan, China manufacturing facilities. Additional advances of approximately $20.7 million were made to Sovello along with REC and Q-Cells, our former Sovello joint venture partners. In addition, payments of approximately $2.9 million were made to cash collateralize various letters of credit. These uses were offset by the proceeds from the sale and maturity of marketable securities of $76.7 million.
Net cash used in investing activities for the year ended December 31, 2008 was primarily for construction of our manufacturing facility in Devens and related equipment, and to a lesser extent our new high temperature filament manufacturing facility in Midland, Michigan. In addition, two loans totaling $23.8 million were advanced to Sovello in conjunction with a shareholder agreement entered into with them along with REC and Q-cells. Also, as part of our silicon supply agreement with Silpro we provided to them a loan of Euro 30 million. The second installment of approximately $22.2 million was advanced to them during 2008, all of which has since been written off (see Write-off of loan receivable from silicon supplier above). We also purchased marketable securities of approximately $98.5 million. These use of funds were offset by proceeds from the sale and maturity of marketable securities.
As of December 31, 2010, we had outstanding commitments for capital expenditures of approximately $4.4 million. Most of our commitments for capital expenditures are associated with our Midland facility and, to a lesser extent, our Wuhan facility.
Net cash provided by financing activities was $492.8 million, $105.8 million and $76.2 million for the years ended December 31, 2008, 2009 and 2010, respectively. During 2010 we received proceeds from our 13% convertible secured debt offering of approximately $158.6 million, net of offering costs, offset by the early redemption of a portion of our 4% senior convertible debt of $82.4 million, net of redemption costs. During 2009 we sold 7.1 million shares of our common stock in a public offering at $10.80 per share which closed on May 28, 2009 and resulted in net proceeds of approximately $72.4 million. In addition, we received a loan of approximately $33.0 million from the Chinese government as part of the financing for our Wuhan, China manufacturing facility. Net cash provided by financing activities for the year ended December 31, 2008 of approximately $492.8 resulted primarily from the net proceeds of $364.0 million from the issuance of our senior convertible debt, and the net proceeds from 3.1 million shares of our common stock sold in a public offering at
50
Table of Contents
$57.00 per share. The proceeds from these transactions were offset by the up-front initial premium payment of $39.5 million associated with the capped call transaction which was entered into concurrent with the senior convertible debt offering.
Notes Offering
In June 2005, we issued convertible subordinated notes (“Notes”) in the aggregate principal amount of $90.0 million with interest on the Notes payable semiannually at an annual rate of 4.375%. We had received proceeds of $86.9 million, net of offering costs of approximately $3.1 million. All of the Notes were converted to shares of our common stock; and we issued 2,029,768 shares of common stock to the note holders on July 22, 2008.
Senior Notes Offering
On June 26, 2008, we entered into an underwriting agreement for the sale to the public of $325.0 million aggregate principal amount of 4% Senior Convertible Notes due 2013 (“Senior Notes”). We granted to the underwriters a 30-day option to purchase up to an additional $48.75 million aggregate principal amount of Senior Notes. On July 2, 2008, we completed the public offering of $373.8 million aggregate principal amount of Senior Notes which includes the underwriter’s exercise of their option. Net proceeds to us from the offering, including the cost of the capped call transaction, were approximately $325.8 million. Our financing costs associated with the Senior Notes are being amortized over the five year term.
In connection with our Senior Notes offering, we entered into a capped call transaction with respect to our common stock with an affiliate of Lehman Brothers, Inc., the lead underwriter, in order to reduce the dilution that would otherwise occur as a result of new common stock issuances upon conversion of the Senior Notes. The capped call transaction was designed to reduce the potential dilution resulting from the conversion of the Senior Notes into shares of our common stock. The total premium for the capped call transaction was approximately $68.1 million of which $39.5 million was paid contemporaneously with the closing of the Senior Notes offering and the remaining $28.6 million was required to be paid in nine equal semi annual installments beginning January 15, 2009. In addition, we entered into a common stock lending agreement with a second affiliate of the lead underwriter pursuant to which we loaned 5,142,757 shares of our common stock to this affiliate. These shares were considered issued and outstanding for corporate law purposes at the time they were loaned; however, at the time of the loan they were not considered outstanding for the purpose of computing and reporting earnings per share because these shares were to be returned to us no later than July 15, 2013, the maturity date of the Senior Notes.
On September 15, 2008 and October 3, 2008, respectively, Lehman Brothers Holdings Inc., the parent company of lead underwriter, and the lead underwriter’s affiliate that entered into the capped call transaction with us filed for protection under Chapter 11 of the federal Bankruptcy Code. The lead underwriter’s second affiliate that was party to the stock lending agreement was placed into administration in the United Kingdom shortly thereafter.
The bankruptcy filings represented events of default under the capped call transaction. As a result of the defaults, our obligations under the agreement were suspended and the remaining premium liability was reversed against equity. In the event the defaults are cured, the remaining premium liability would be owed pursuant to the installment payment schedule. Unless we choose to implement a new capped call arrangement or the defaults are cured and we do not terminate the capped call transaction as we believe we are entitled to under the terms of the capped call transaction, the dilutive impact of conversion of the Senior Notes may be greater, based on the actual conversion price of $72.68 per share. The bankruptcy filing and the placement of the lead underwriter’s second affiliate into administration in the United Kingdom also contractually required the lead underwriter’s second affiliate to return to us the shares loaned under the common stock lending agreement. We later demanded the immediate return of all outstanding borrowed shares, however, the shares have not yet been returned. While
51
Table of Contents
we are exercising all of our legal remedies, including litigation against various Lehman Brothers entities and Barclays entities which the bankruptcy court recently dismissed, we have included these shares in our per share calculation on a weighted average basis due to the uncertainty surrounding the recovery of the shares.
Convertible Senior Secured Notes Offering
On April 26, 2010 we issued $165 million aggregate principal amount of 13% Convertible Senior Secured Notes due 2015 (“Secured Notes”) in a private placement to Piper Jaffray & Co. who subsequently placed the Secured Notes to investors in accordance with Rule 144A of the Securities Act of 1933, as amended. The Secured Notes are senior secured obligations and are fully and unconditionally guaranteed on a senior secured basis by each of our existing and future direct and indirect wholly owned domestic subsidiaries, subject to certain exceptions. The Secured Notes are secured with a first-priority lien on substantially all of our owned assets and the guarantors, subject to certain exceptions. Interest is payable semi-annually in arrears, and the Secured Notes are convertible into shares of our common stock. Holders have the right to require us to purchase their Secured Notes for cash on April 15, 2013 if more than $50 million in principal amount of our 4% senior convertible notes remain outstanding, subject to certain conditions, at a purchase price equal to 100% of the principal amount of the Secured Notes plus accrued and unpaid interest to, but excluding the purchase date. The Secured Notes are convertible into shares of our common stock at an initial conversion rate of 87.5410 shares of common stock per $1,000 principal amount of Secured Notes (which is equivalent to an initial conversion price of approximately $11.42 per share), subject to adjustment upon occurrence of certain events.
Concurrent with the closing of this offering we used approximately $82.4 million of the net proceeds from this offering for the purchase of $124.5 million aggregate principal amount of our Senior Notes due 2013 and are using the remainder of the net proceeds of approximately $75 million for general corporate purposes, working capital and capital expenditures for further expansion in China.
As of December 31, 2010 we have approximately $447.2 million of debt. After giving effect to the issuance of $165 million of Secured Notes and redemption of $124.5 million of the Senior Notes our estimated annual cash interest expense increased from approximately $18 million to $34 million including the interest on our China loan which is not payable until the end of the loan term.
Senior Notes Exchange
On February 14, 2011 we announced the expiration and results of our offer to exchange (i) an aggregate principal amount of up to $100,000,000 of new 4.0% Convertible Subordinated Additional Cash Notes due 2020 (the “New Subordinated Notes”) for an aggregate principal amount of up to $200,000,000 of our existing Senior Notes due 2013, and (ii) an aggregate principal amount of up to $165,000,000 of new 7.5% Convertible Senior Secured Notes due 2017 (the “New Secured Notes”) for an aggregate principal amount of up to $165,000,000 of our existing Secured Notes due 2015, and the related consent solicitation.
As of February 11, 2011, the expiration date, holders of approximately $45.4 million aggregate principal amount of the existing Senior Notes had tendered, and not withdrawn, existing Senior Notes for exchange. Because the total principal amount of the Senior Notes tendered was less than the maximum amount we would accept in the exchange offer for the Senior Notes, all of the existing Senior Notes validly tendered and not withdrawn were accepted for exchange pursuant to the terms of this exchange offer. Based on the modified “Dutch auction” process described in our Prospectus filed with the Securities and Exchange Commission on February 9, 2011, the clearing exchange ratio for this exchange offer is $500 principal amount of New Subordinated Notes per $1,000 principal amount of exiting Senior Notes. An aggregate principal amount of approximately $203.8 million of existing Senior Notes remains outstanding following the consummation of the exchange offer, and approximately $22.7 million in principal amount of New Subordinated Notes have been issued to holders whose existing Senior Notes were accepted for exchange. The aggregate principal amount of New Subordinated Notes issued to any holder was rounded down to the nearest $1,000 and any fractional portion of New Subordinated Notes was paid in cash. On February 17, 2011 we settled the 4% exchange offer and paid in
52
Table of Contents
cash all accrued and unpaid interest on the existing Senior Notes accepted for exchange to but excluding the settlement date. We will no longer pay interest on any existing Senior Notes that were accepted for exchange, and interest will begin to accrue on the New Subordinated Notes commencing on the settlement date.
Less than $50,000,000 aggregate principal amount of the existing Secured Notes were tendered in this exchange offer. Because the minimum tender and consent conditions were not met, we did not accept any existing Secured Notes for exchange and will not amend the indenture governing the existing Secured Notes.
Sovello AG
On March 23, 2010, we and the other shareholders of Sovello entered into an agreement to sell all of our related interests in Sovello to Ventizz; and on April 21, 2010 all of the required closing conditions were met in order to complete the sale. Pursuant to the agreement, we paid to Sovello approximately EUR 2.4 million (approximately $3.2 million) on April 21, 2010, net of receipt of remaining royalty payments and product payments for 2009 of approximately EUR 4.1 million (approximately $5.6 million). This amount was in addition to EUR 5.8 million (approximately $8.1 million) which we paid during the first quarter of 2010 in conjunction with a guarantee made to Sovello’s banking syndicate. Upon the completion of the sale, the Master Joint Venture Agreement among us and Sovello’s other shareholders, dated November 5, 2008, was terminated and Sovello’s banking syndicate released us from all of our obligations to Sovello’s banking syndicate pursuant to the Undertaking dated October 6, 2008. In connection with the closing of the sale, our existing technology license agreements with Sovello were terminated and a new technology license agreement was entered into, allowing Sovello to continue using our wafer manufacturing technology to produce String Ribbon® solar panels. Under the terms of the new license agreement, Sovello agreed to pay us $2 million in royalties in 2010 and $3 million in each of the subsequent 2 years for its existing capacity.
Liquidity Risk and Uncertainty
At December 31, 2010, we had approximately $61.6 million of cash and cash equivalents. We are subject to risks common to companies in the high-technology and energy industries including, but not limited to, development by us or our competitors of new technological innovations, dependence on key personnel, dependence on key or sole source suppliers for materials, protection of proprietary technology and compliance with government regulations. Any delay in our plan to implement our business strategy may result in increased costs and could impair business operations.
We believe that our business plan will provide sufficient liquidity to fund our operating needs for the next 12 months. While our business plan anticipates certain levels of potential risk, particularly in light of the difficult and uncertain current economic environment and the continuing reduction of industry panel pricing caused by competition, especially from China, and the resulting excess capacity, we are exposed to additional particular risks and uncertainties including, but not limited to:
| • | the need for our Wuhan manufacturing facility to ramp to 75 MW of capacity and achieve its target manufacturing cost of $1.25 per watt by mid 2012; |
| • | our need to continue to make progress on the development of our planned industry standard wafer expansion program allowing us further opportunities for growth, including establishing relationships with potential partners and customers for our wafers; |
| • | continued significant fluctuation of the Euro against the U.S. dollar, as a substantial portion of our sales are denominated in Euros; and |
| • | the ability of Jiawei to effectively manage production and manufacturing costs which has an indirect impact on the pricing charged to us. |
Although our current business plan indicates we have adequate liquidity to operate under expected operating conditions, the risks noted above could result in liquidity uncertainty. Our plan with regard to this uncertainty
53
Table of Contents
includes, among other actions, monitoring our operating results against expectations and, if required, further restricting operating costs and capital spending if events warrant, and if market conditions allow, possibly accessing the capital markets to meet liquidity and capital expenditure requirements.
If additional capital is needed and does not become available on acceptable terms, our ability to fund operations, further develop and expand our manufacturing operations, particularly with respect to the development of our wide wafer production capacity, and distribution network or otherwise respond to competitive pressures would be significantly limited. In addition, although our long-term debt does not begin to mature until April 2013 (see Note 7 of our consolidated financial statements), we will actively work to identify sources of liquidity to assist in our ability to repay the debt when it becomes due. There is no assurance that such additional sources of liquidity to repay long-term debt can be obtained on terms acceptable to us, or at all.
Contractual Obligations
The following table summarizes our contractual obligations as of December 31, 2010 and the effect such obligations are expected to have on our liquidity and cash flow in future periods (in thousands):
| Total Years | Less than 1 Year |
1-3 Years | 4-5 Years | After 5 Years | ||||||||||||||||
| Non-cancelable operating leases |
$ | 3,762 | $ | 1,347 | $ | 1,845 | $ | 219 | $ | 351 | ||||||||||
| Maturity of Senior Notes |
249,207 | — | 249,207 | — | — | |||||||||||||||
| Maturity of Secured Notes |
165,000 | — | — | 165,000 | — | |||||||||||||||
| Interest expense associated with Senior Notes |
29,905 | 9,968 | 19,937 | — | — | |||||||||||||||
| Interest expense associated with Secured Notes |
96,525 | 21,450 | 64,350 | 10,725 | — | |||||||||||||||
| Maturity of China loan |
47,376 | — | — | 47,376 | — | |||||||||||||||
| Capital expenditure commitments |
9,206 | 9,206 | — | — | — | |||||||||||||||
| Raw material purchase commitments |
416,758 | 29,083 | 327,663 | 49,691 | 10,321 | |||||||||||||||
| Total contractual cash obligations |
$ | 1,017,739 | $ | 71,054 | $ | 663,002 | $ | 273,011 | $ | 10,672 | ||||||||||
During 2007, we entered into four multi-year polysilicon supply agreements with various terms and conditions. Following is a brief summary of each of the remaining three agreements.
On April 17, 2007, we entered into a multi-year polysilicon supply agreement with OCI Company Ltd., formerly DC Chemical Co., Ltd. (“OCI”) under which OCI will supply us with polysilicon at fixed prices that began in late 2008 and continues through 2014.
On July 24, 2007, we entered into a multi-year polysilicon supply agreement with Wacker Chemie AG (“Wacker”). This supply agreement provides the general terms and conditions pursuant to which Wacker will supply us with specified annual quantities of polysilicon at fixed prices beginning in 2010 and continuing through 2018. In connection with the agreement we made a payment of approximately 9.0 million Euros to Wacker.
On October 24, 2007, we entered into a multi-year polysilicon supply agreement with Solaricos Trading, LTD (“Nitol”). This supply agreement provides the general terms and conditions pursuant to which Nitol will supply us with specified annual quantities of polysilicon at fixed prices that began in 2009 and continue through 2014. In connection with the agreement we made a $10.0 million prepayment to Nitol in 2007. An additional prepayment of $5.0 million was made in 2008.
In January 2008, we entered into a second multi-year silicon supply agreement with OCI. The supply agreement provides the general terms and conditions pursuant to which OCI will supply us with specified annual quantities of silicon at fixed prices which began in 2009 and continues through 2015. We made non-refundable prepayments totaling approximately $36.5 million in connection with this agreement.
Each of the above prepayments is included in the balance sheet in Prepaid Cost of Inventory.
54
Table of Contents
RECENT ACCOUNTING PRONOUNCEMENTS
Recent accounting pronouncements not included below are not expected to have a material impact on the Company’s consolidated financial position and results of operations.
In January 2010, an update was made to the Fair Value Measurements and Disclosures topic of the FASB codification that requires new disclosures for fair value measurements and provides clarification for existing disclosure requirements. More specifically, this update will require (a) an entity to disclose separately the amounts of significant transfers into and out of Level 1 and 2 fair value measurements and to describe the reasons for the transfers; and (b) information about purchases, sales, issuances, and settlements to be presented separately on a gross basis in the reconciliation of Level 3 fair value measurements. This update was effective for fiscal years beginning after December 15, 2009 except for Level 3 reconciliation disclosures which are effective for fiscal years beginning after December 15, 2010. The portion of the update which was effective for fiscal years beginning after December 15, 2009 did not have an impact on our consolidated financial statements. The portion of the update which is effective for fiscal years beginning after December 15, 2010 is not expected to have an impact on our consolidated financial statements.
55
Table of Contents
| ITEM 7A. | QUANTITATIVE AND QUALITATIVE DISCLOSURES ABOUT MARKET RISK |
INTEREST RATE RISK
We do not use derivative financial instruments to manage interest rate risk. Interest income earned on any cash and investments is subject to interest rate fluctuations, but we believe that the impact of these fluctuations will not have a material effect on our financial position due to the liquid and short-term nature of these financial instruments. For these reasons, a hypothetical 100-basis point adverse change in interest rates would not have a material effect on our consolidated financial position, results of operations or cash flows.
FOREIGN CURRENCY EXCHANGE RATE RISK
As we continue to expand our manufacturing operations and distribution network internationally, our exposure to fluctuations in currency exchange rates may increase. We endeavor to denominate the purchase price of our equipment and materials and the selling price for our products in U.S. dollars but are not always successful in doing so. To the extent that our purchases or sales are made in foreign currency, we will be exposed to currency gains or losses.
For the year ended December 31, 2010, approximately 84% of our product revenues were denominated in Euros. Although a significant portion of our product revenues continue to be denominated in Euros, the portion of our sales that are denominated in Euros can vary widely in any one period. As of the year ended December 31, 2010, we have two active multi-year solar panel supply agreements which we entered into in 2008 and are denominated in Euros. The combined current estimated sales value remaining under these two agreements is approximately $630.8 million at December 31, 2010 exchange rates. These panel supply agreements provide the general terms and conditions pursuant to which certain customers will purchase from us specified annual quantities of solar panels which began in the second half of 2008 and continue through 2013.
From time to time, we purchase equipment and materials internationally with delivery dates as much as six to twelve months or more in the future. There have been significant currency fluctuations in recent periods. To the extent that any purchase obligations are denominated in foreign currency, we would be exposed to potential increased costs if the U.S. dollar currency loses value relative to the applicable foreign currency, which will adversely impact our future financial condition and results of operations.
To date, we have not entered into any hedging transactions in an effort to reduce our exposure to foreign currency exchange risk. While we may enter into hedging transactions in the future, given that the availability and effectiveness of these transactions may be limited, we may not be able to successfully hedge our exposure.
| ITEM 8. | FINANCIAL STATEMENTS AND SUPPLEMENTARY DATA. |
Our Financial Statements and related Notes and the Report of the Independent Registered Public Accounting Firm are included beginning on page F-1 of this Annual Report on Form 10-K.
56
Table of Contents
| ITEM 9A. | CONTROLS AND PROCEDURES. |
Evaluation of Disclosure Controls and Procedures
Under the supervision and with the participation of our management, including our Chief Executive Officer and Chief Financial Officer, we evaluated the effectiveness of the design and operation of our disclosure controls and procedures (as defined in Exchange Act Rule 13a-15(e)) as of December 31, 2010. In designing and evaluating our disclosure controls and procedures, we and our management recognize that any controls and procedures, no matter how well designed and operated, can provide only reasonable assurance of achieving the desired control objectives, and our management necessarily was required to apply its judgement in evaluating and implementing possible controls and procedures. Based upon that evaluation, the Chief Executive Officer and Chief Financial Officer concluded that, as of the end of the period covered by this report, our disclosure controls and procedures were effective to provide reasonable assurance.
The term “disclosure controls and procedures,” as defined in Rules 13a-15(e) and 15d-15(e) under the Exchange Act, means controls and other procedures of a company that are designed to ensure that information required to be disclosed by a company in the reports that it files or submits under the Exchange Act is recorded, processed, summarized and reported, within the time periods specified in the SEC’s rules and forms. Disclosure controls and procedures include, without limitation, controls and procedures designed to ensure that information required to be disclosed by a company in the reports that it files or submits under the Exchange Act is accumulated and communicated to the company’s management, including its principal executive and principal financial officers, as appropriate to allow timely decisions regarding required disclosure.
Internal Control Over Financial Reporting
During the fiscal quarter ended December 31, 2010, there has been no change in our internal control over financial reporting (as defined in Rule 13a-15(f) under the Exchange Act) that has materially affected, or is reasonably likely to materially affect, our internal control over financial reporting.
Management’s Report on Internal Control Over Financial Reporting.
Our management is responsible for establishing and maintaining adequate internal control over financial reporting, as such term is defined in Exchange Act Rule 13a-15(f). Our internal control system was designed to provide reasonable assurance regarding the reliability of financial reporting and the preparation and fair presentation of published financial statements.
Under the supervision and with the participation of our management, including our Chief Executive Officer and Chief Financial Officer, we conducted an evaluation of the effectiveness of our internal control over financial reporting based on the framework in Internal Control—Integrated Framework issued by the Committee of Sponsoring Organizations of the Treadway Commission. Based on our evaluation under the framework in Internal Control—Integrated Framework, our management concluded that our internal control over financial reporting was effective as of December 31, 2010.
Because of its inherent limitations, internal control over financial reporting may not prevent or detect misstatements. Also, projections of any evaluation of effectiveness to future periods are subject to the risk that controls may become inadequate because of changes in conditions and that the degree of compliance with the policies or procedures may deteriorate.
Our internal control over financial reporting as of December 31, 2010 has been audited by PricewaterhouseCoopers LLP, an independent registered public accounting firm, as stated in their report which is included herein.
57
Table of Contents
| ITEM 9B. | OTHER INFORMATION. |
On February 9, 2011 we held a special meeting of stockholders in Marlboro, Massachusetts. At the special meeting, the stockholders approved an amendment to our certificate of incorporation to increase our authorized common shares to 240,000,000 from 120,000,000.
We expect to hold our 2011 Annual Meeting of Stockholders on or about July 26, 2011.
58
Table of Contents
| ITEM 10. | DIRECTORS, EXECUTIVE OFFICERS AND CORPORATE GOVERNANCE. |
Information required by this Item 10 relating to our directors, executive officers and corporate governance is incorporated by reference herein from our proxy statement in connection with our 2011 annual meeting of stockholders, which proxy statement will be filed with the Securities and Exchange Commission not later than 120 days after the close of our fiscal year ended December 31, 2010.
| ITEM 11. | EXECUTIVE COMPENSATION. |
Information required by this Item 11 relating to remuneration of directors and executive officers and other transactions involving management is incorporated by reference herein from our proxy statement in connection with 2011 annual meeting of stockholders, which proxy statement will be filed with the Securities and Exchange Commission not later than 120 days after the close of our fiscal year ended December 31, 2010.
| ITEM 12. | SECURITY OWNERSHIP OF CERTAIN BENEFICIAL OWNERS AND MANAGEMENT AND RELATED STOCKHOLDER MATTERS. |
Certain information required by this Item 12 relating to security ownership of certain beneficial owners and management is incorporated by reference herein from our proxy statement in connection with our 2011 annual meeting of stockholders, which proxy statement will be filed with the Securities and Exchange Commission not later than 120 days after the close of our fiscal year ended December 31, 2010. For information on securities authorized for issuance under equity compensation plans, see the section entitled “Market for Registrant’s Common Equity and Related Stockholders Matters” in Part II, Item 5. in this Annual Report on Form 10-K.
| ITEM 13. | CERTAIN RELATIONSHIPS AND RELATED TRANSACTIONS, AND DIRECTOR INDEPENDENCE. |
Information required by this Item 13 relating to certain relationships and related transactions, and director independence is incorporated by reference herein from our proxy statement in connection with our 2011 annual meeting of stockholders, which proxy statement will be filed with the Securities and Exchange Commission not later than 120 days after the close of our fiscal year ended December 31, 2010.
| ITEM 14. | PRINCIPAL ACCOUNTING FEES AND SERVICES. |
Information required by this Item 14 regarding principal accounting fees and services is incorporated by reference herein from our proxy statement in connection with our 2011 annual meeting of stockholders, which proxy statement will be filed with the Securities and Exchange Commission not later than 120 days after the close of our fiscal year ended December 31, 2010.
59
Table of Contents
| ITEM 15. | EXHIBITS, FINANCIAL STATEMENT SCHEDULE. |
(a) The following documents are filed as part of this Annual Report on Form 10-K:
1. Financial Statements. The financial statements which appear beginning on page F-1 of this Annual Report on Form 10-K.
2. Index to Financial Statements and Schedule. Certain financial statement schedules are omitted as the information is included in the Consolidated Financial Statements and notes which appear beginning on page F-1 of this Annual Report on Form 10-K. Schedules not listed in the index are omitted because they are not required or because the required information is given in the consolidated financial statements or notes thereto.
3. Exhibits. Exhibits are as set forth in the section entitled “Exhibit Index” which follows the section entitled “Signatures” in this Annual Report on Form 10-K. Exhibits which are incorporated herein by reference can be inspected and copied at the public reference rooms maintained by the Securities and Exchange Commission in Washington, D.C., New York, New York, and Chicago, Illinois. Please call the Securities and Exchange Commission at 1-800-SEC-0330 for further information on the public reference rooms. Securities and Exchange Commission filings are also available to the public from commercial document retrieval services and at the Web site maintained by the Securities and Exchange Commission at http://www.sec.gov.
60
Table of Contents
LIST OF FINANCIAL STATEMENTS AND FINANCIAL STATEMENT SCHEDULE
F-1
Table of Contents
Report of Independent Registered Public Accounting Firm
To the Board of Directors and Shareholders of
Evergreen Solar, Inc.:
In our opinion, the consolidated financial statements listed in the accompanying index present fairly, in all material respects, the financial position of Evergreen Solar, Inc. and its subsidiaries at December 31, 2010 and 2009, and the results of their operations and their cash flows for each of the three years in the period ended December 31, 2010 in conformity with accounting principles generally accepted in the United States of America. Also, in our opinion, the Company maintained, in all material respects, effective internal control over financial reporting as of December 31, 2010, based on criteria established in Internal Control—Integrated Framework issued by the Committee of Sponsoring Organizations of the Treadway Commission (COSO). The Company’s management is responsible for these financial statements and financial statement schedule, for maintaining effective internal control over financial reporting and for its assessment of the effectiveness of internal control over financial reporting, included in Management’s Report on Internal Control over Financial Reporting appearing under Item 9A. Our responsibility is to express opinions on these financial statements, on the financial statement schedule, and on the Company’s internal control over financial reporting based on our integrated audits. We conducted our audits in accordance with the standards of the Public Company Accounting Oversight Board (United States). Those standards require that we plan and perform the audits to obtain reasonable assurance about whether the financial statements are free of material misstatement and whether effective internal control over financial reporting was maintained in all material respects. Our audits of the financial statements included examining, on a test basis, evidence supporting the amounts and disclosures in the financial statements, assessing the accounting principles used and significant estimates made by management, and evaluating the overall financial statement presentation. Our audit of internal control over financial reporting included obtaining an understanding of internal control over financial reporting, assessing the risk that a material weakness exists, and testing and evaluating the design and operating effectiveness of internal control based on the assessed risk. Our audits also included performing such other procedures as we considered necessary in the circumstances. We believe that our audits provide a reasonable basis for our opinions.
As discussed in Note 2 to the consolidated financial statements, the Company changed the manner in which it accounts for own-share lending agreements effective January 1, 2010.
A company’s internal control over financial reporting is a process designed to provide reasonable assurance regarding the reliability of financial reporting and the preparation of financial statements for external purposes in accordance with generally accepted accounting principles. A company’s internal control over financial reporting includes those policies and procedures that (i) pertain to the maintenance of records that, in reasonable detail, accurately and fairly reflect the transactions and dispositions of the assets of the company; (ii) provide reasonable assurance that transactions are recorded as necessary to permit preparation of financial statements in accordance with generally accepted accounting principles, and that receipts and expenditures of the company are being made only in accordance with authorizations of management and directors of the company; and (iii) provide reasonable assurance regarding prevention or timely detection of unauthorized acquisition, use, or disposition of the company’s assets that could have a material effect on the financial statements.
Because of its inherent limitations, internal control over financial reporting may not prevent or detect misstatements. Also, projections of any evaluation of effectiveness to future periods are subject to the risk that controls may become inadequate because of changes in conditions, or that the degree of compliance with the policies or procedures may deteriorate.
/s/ PricewaterhouseCoopers LLP
PricewaterhouseCoopers LLP
Boston, Massachusetts
March 9, 2011
F-2
Table of Contents
CONSOLIDATED BALANCE SHEETS
(In thousands, except share data)
| December 31, | ||||||||
| 2009 | 2010 | |||||||
| Assets |
||||||||
| Current assets: |
||||||||
| Cash and cash equivalents |
$ | 112,368 | $ | 61,574 | ||||
| Accounts receivable, net of allowance for doubtful accounts of $80 and $6,463 at December 31, 2009 and December 31, 2010, respectively |
53,295 | 76,484 | ||||||
| Inventory |
34,890 | 54,941 | ||||||
| Prepaid cost of inventory |
25,634 | 13,093 | ||||||
| Other current assets |
11,451 | 11,092 | ||||||
| Total current assets |
237,638 | 217,184 | ||||||
| Restricted cash |
3,134 | 6,810 | ||||||
| Deferred financing costs |
8,312 | 9,527 | ||||||
| Loan receivable from Jiawei and related interest |
— | 13,615 | ||||||
| Prepaid cost of inventory |
147,573 | 60,483 | ||||||
| Fixed assets, net |
430,681 | 116,546 | ||||||
| Other assets |
295 | 305 | ||||||
| Total assets |
$ | 827,633 | $ | 424,470 | ||||
| Liabilities and stockholders’ equity (deficit) |
||||||||
| Current liabilities: |
||||||||
| Accounts payable and accrued expenses |
$ | 31,420 | $ | 39,559 | ||||
| Due to Sovello AG and related guarantees |
17,544 | — | ||||||
| Accrued employee compensation |
7,287 | 4,718 | ||||||
| Accrued interest |
7,004 | 9,157 | ||||||
| Accrued warranty |
2,368 | 3,921 | ||||||
| Total current liabilities |
65,623 | 57,355 | ||||||
| Convertible notes, net of discount |
323,276 | 389,083 | ||||||
| Loan and related interest payable |
34,152 | 37,957 | ||||||
| Deferred income taxes |
5,396 | 1,204 | ||||||
| Total liabilities |
428,447 | 485,599 | ||||||
| Commitments and Contingencies (Note 8) |
||||||||
| Stockholders’ equity (deficit): |
||||||||
| Common stock, $0.01 par value, 120,000,000 shares authorized, 34,634,987 and 34,787,413 shares issued and outstanding at December 31, 2009 and December 31, 2010, respectively |
346 | 348 | ||||||
| Additional paid-in capital |
1,029,965 | 1,034,699 | ||||||
| Accumulated deficit |
(631,119 | ) | (1,096,556 | ) | ||||
| Accumulated other comprehensive income (loss) |
(6 | ) | 380 | |||||
| Total stockholders’ equity (deficit) |
399,186 | (61,129 | ) | |||||
| Total liabilities and stockholders’ equity (deficit) |
$ | 827,633 | $ | 424,470 | ||||
The accompanying notes are an integral part of these consolidated financial statements.
F-3
Table of Contents
CONSOLIDATED STATEMENTS OF OPERATIONS
(In thousands, except per share data)
| For the Years Ended December 31, | ||||||||||||
| 2008 | 2009 | 2010 | ||||||||||
| Product revenues |
$ | 95,245 | $ | 267,112 | $ | 334,382 | ||||||
| Royalty and fee revenues |
16,714 | 4,736 | 4,403 | |||||||||
| Total revenues |
111,959 | 271,848 | 338,785 | |||||||||
| Cost of revenues |
93,073 | 253,484 | 319,429 | |||||||||
| Impairment of prepaid inventory |
— | — | 74,544 | |||||||||
| Total cost of revenues |
93,073 | 253,484 | 393,973 | |||||||||
| Gross profit (loss) |
18,886 | 18,364 | (55,188 | ) | ||||||||
| Operating expenses: |
||||||||||||
| Research and development |
22,039 | 18,058 | 19,453 | |||||||||
| Selling, general and administrative |
23,868 | 26,260 | 36,495 | |||||||||
| Write-off of loan receivable from silicon supplier |
— | 43,882 | — | |||||||||
| Equipment write-offs |
8,034 | 6,008 | 410 | |||||||||
| Facility start-up |
30,623 | 10,107 | 18,446 | |||||||||
| Impairment of long-lived assets |
— | — | 302,979 | |||||||||
| Restructuring charges |
30,413 | 11,940 | 18,343 | |||||||||
| Total operating expenses |
114,977 | 116,255 | 396,126 | |||||||||
| Operating loss |
(96,091 | ) | (97,891 | ) | (451,314 | ) | ||||||
| Other income (expense): |
||||||||||||
| Foreign exchange gains (losses), net |
(4,078 | ) | 2,650 | (3,819 | ) | |||||||
| Interest income |
12,695 | 4,728 | 1,993 | |||||||||
| Interest expense |
(8,874 | ) | (27,992 | ) | (40,301 | ) | ||||||
| Loss on share lending |
(140,706 | ) | — | — | ||||||||
| Gain on early extinguishment of debt |
— | — | 24,777 | |||||||||
| Other income (expense), net |
(140,963 | ) | (20,614 | ) | (17,350 | ) | ||||||
| Loss before equity income (loss) from interest in Sovello AG, (impairment) recovery of equity investment and income tax benefit |
(237,054 | ) | (118,505 | ) | (468,664 | ) | ||||||
| Equity income (loss) from interest in Sovello AG |
8,435 | (29,748 | ) | — | ||||||||
| Impairment and other charges associated with equity investment in Sovello AG |
— | (126,057 | ) | — | ||||||||
| Recovery of impairment charges associated with Sovello AG |
— | — | 3,227 | |||||||||
| Income tax benefit |
— | (8,090 | ) | — | ||||||||
| Net loss |
$ | (228,619 | ) | $ | (266,220 | ) | $ | (465,437 | ) | |||
| Net loss per share (basic and diluted) |
$ | (10.50 | ) | $ | (8.51 | ) | $ | (13.59 | ) | |||
| Weighted average shares used in computing basic and diluted net loss per share |
21,780 | 31,297 | 34,237 | |||||||||
The accompanying notes are an integral part of these consolidated financial statements.
F-4
Table of Contents
CONSOLIDATED STATEMENTS OF STOCKHOLDERS’ EQUITY (DEFICIT)
(In thousands)
| Common Stock | Additional Paid-In Capital |
Accumulated Deficit |
Accumulated Other Comprehensive Income (Loss) |
Total Stockholders' Equity (Deficit) |
Comprehensive Loss |
|||||||||||||||||||||||
| Shares | Amount | |||||||||||||||||||||||||||
| Balance at January 1, 2008 |
17,042 | $ | 171 | $ | 522,548 | $ | (136,280) | $ | 6,855 | $ | 393,293 | |||||||||||||||||
| Issuance of common stock pursuant to exercise of options |
74 | 1 | 1,015 | 1,016 | ||||||||||||||||||||||||
| Issuance of common stock in connection with public offering, net of offering costs |
3,067 | 31 | 166,695 | 166,726 | ||||||||||||||||||||||||
| Compensation expense associated with equity compensation plans, including restricted share grants |
106 | 1 | 7,692 | 7,693 | ||||||||||||||||||||||||
| Shares of common stock issued under ESPP |
19 | 621 | 621 | |||||||||||||||||||||||||
| Deferred tax associated with gains on investment in Sovello AG |
(7,059 | ) | (7,059 | ) | ||||||||||||||||||||||||
| Shares loaned in connection with share lending agreement |
5,143 | 51 | (48 | ) | 3 | |||||||||||||||||||||||
| Debt redemption, net of deferred financing costs write-off |
2,030 | 20 | 88,239 | 88,259 | ||||||||||||||||||||||||
| Capped call premium, net of financing costs |
(64,950 | ) | (64,950 | ) | ||||||||||||||||||||||||
| Capped call reversal |
24,237 | 24,237 | ||||||||||||||||||||||||||
| Adoption of Debt topic guidance of FASB codification |
211,643 | 211,643 | ||||||||||||||||||||||||||
| Comprehensive loss: |
||||||||||||||||||||||||||||
| Net loss |
(228,619 | ) | (228,619 | ) | $ | (228,619 | ) | |||||||||||||||||||||
| Unrealized losses on marketable securities |
(34 | ) | (34 | ) | (34 | ) | ||||||||||||||||||||||
| Foreign currency translation adjustment, net of deferred taxes |
(5,191 | ) | (5,191 | ) | (5,191 | ) | ||||||||||||||||||||||
| Comprehensive loss |
$ | (233,844 | ) | |||||||||||||||||||||||||
| Balance at December 31, 2008 |
27,481 | 275 | 950,632 | (364,899 | ) | 1,630 | 587,638 | |||||||||||||||||||||
| Issuance of common stock pursuant to exercise of options |
5 | — | 50 | 50 | ||||||||||||||||||||||||
| Issuance of common stock in connection with public offering, net of offering costs |
7,092 | 71 | 72,384 | 72,455 | ||||||||||||||||||||||||
| Compensation expense associated with equity compensation plans, including restricted share grants |
33 | 6,795 | 6,795 | |||||||||||||||||||||||||
| Shares of common stock issued under ESPP |
27 | 282 | 282 | |||||||||||||||||||||||||
| Costs of authorized shares increase |
(178 | ) | (178 | ) | ||||||||||||||||||||||||
| Comprehensive loss: |
||||||||||||||||||||||||||||
| Net loss |
(266,220 | ) | (266,220 | ) | $ | (266,220 | ) | |||||||||||||||||||||
| Unrealized losses on marketable securities |
(26 | ) | (26 | ) | (26 | ) | ||||||||||||||||||||||
| Foreign currency translation adjustment, net of deferred taxes |
(1,610 | ) | (1,610 | ) | (1,610 | ) | ||||||||||||||||||||||
| Comprehensive loss |
$ | (267,856 | ) | |||||||||||||||||||||||||
| Balance at December 31, 2009 |
34,638 | 346 | 1,029,965 | (631,119 | ) | (6 | ) | 399,186 | ||||||||||||||||||||
| Release of restriction on common stock issued to OCI |
959 | 959 | ||||||||||||||||||||||||||
| Debt redemption associated with 4% senior notes |
(645 | ) | (645 | ) | ||||||||||||||||||||||||
| Compensation expense associated with equity compensation plans, including restricted share grants |
101 | 2 | 4,324 | 4,326 | ||||||||||||||||||||||||
| Shares of common stock issued under ESPP |
21 | 96 | 96 | |||||||||||||||||||||||||
| Impact of share rounding on 1-for-6 reverse stock split |
27 | — | ||||||||||||||||||||||||||
| Comprehensive loss: |
||||||||||||||||||||||||||||
| Net loss |
(465,437 | ) | (465,437 | ) | $ | (465,437 | ) | |||||||||||||||||||||
| Foreign currency translation adjustment, net of deferred taxes |
386 | 386 | 386 | |||||||||||||||||||||||||
| Comprehensive loss |
$ | (465,051 | ) | |||||||||||||||||||||||||
| Balance at December 31, 2010 |
34,787 | $ | 348 | $ | 1,034,699 | $ | (1,096,556 | ) | $ | 380 | $ | (61,129 | ) | |||||||||||||||
The accompanying notes are an integral part of these consolidated financial statements.
F-5
Table of Contents
CONSOLIDATED STATEMENTS OF CASH FLOWS
(In thousands)
| For the Years Ended December 31, | ||||||||||||
| 2008 | 2009 | 2010 | ||||||||||
| Cash flows from operating activities: |
||||||||||||
| Net loss |
$ | (228,619 | ) | $ | (266,220 | ) | $ | (465,437 | ) | |||
| Adjustments to reconcile net loss to net cash used in operating activities: |
||||||||||||
| Depreciation expense |
18,156 | 46,086 | 63,048 | |||||||||
| Impairment of long-lived assets and prepaid inventory |
— | — | 370,816 | |||||||||
| Loss on share lending |
140,706 | — | — | |||||||||
| Gain on early extinguishment of debt |
— | — | (24,777 | ) | ||||||||
| Bad debt expense |
(7 | ) | 45 | 6,389 | ||||||||
| Imputed interest and accretion of bond premiums |
(2,472 | ) | (478 | ) | — | |||||||
| Amortization of prepaid cost of inventory |
3,694 | 11,240 | 12,721 | |||||||||
| Equity (income) loss from Sovello AG and impairment of investment |
(8,435 | ) | 155,805 | — | ||||||||
| Amortization of deferred debt financing costs |
1,367 | 2,394 | 2,696 | |||||||||
| Loss on loan receivable from silicon supplier |
— | 43,882 | — | |||||||||
| Loss on disposal of fixed assets |
34,496 | 5,719 | 750 | |||||||||
| Provision for warranty |
585 | 1,335 | 1,682 | |||||||||
| Accretion of capped call discount |
345 | — | — | |||||||||
| Amortization of debt discount |
5,148 | 11,744 | 9,813 | |||||||||
| Provision for deferred income taxes |
— | (8,090 | ) | — | ||||||||
| Compensation expense associated with employee equity awards |
7,246 | 6,669 | 4,326 | |||||||||
| Changes in operating assets and liabilities: |
||||||||||||
| Accounts receivable |
(26,168 | ) | (19,170 | ) | (29,548 | ) | ||||||
| Grants receivable |
19,908 | — | — | |||||||||
| Inventory and related prepaid cost of inventory |
(58,418 | ) | (13,487 | ) | (6,726 | ) | ||||||
| Other current assets |
8,253 | (4,986 | ) | (3,833 | ) | |||||||
| Accounts payable and accrued expenses |
15,902 | (22,019 | ) | 6,486 | ||||||||
| Interest payable |
(237 | ) | 6,253 | 4,209 | ||||||||
| Other |
2,669 | 6,184 | (488 | ) | ||||||||
| Net cash used in operating activities |
(65,881 | ) | (37,094 | ) | (47,873 | ) | ||||||
| Cash flows from investing activities: |
||||||||||||
| Purchases of fixed assets and deposits on fixed assets under construction |
(345,256 | ) | (110,820 | ) | (47,955 | ) | ||||||
| Proceeds from the disposal of fixed assets |
12 | 503 | 150 | |||||||||
| Decrease (increase) in restricted cash |
41,178 | (2,914 | ) | (3,667 | ) | |||||||
| Increase in Sovello AG loan |
(23,774 | ) | (11,750 | ) | — | |||||||
| Capital contribution to Sovello AG |
— | (8,914 | ) | — | ||||||||
| Payments associated with Sovello AG |
— | — | (14,804 | ) | ||||||||
| Increase in other loans |
(22,164 | ) | — | (12,800 | ) | |||||||
| Purchases of marketable securities |
(98,500 | ) | — | — | ||||||||
| Proceeds from sale and maturity of marketable securities |
93,059 | 76,716 | — | |||||||||
| Net cash used in investing activities |
(355,445 | ) | (57,179 | ) | (79,076 | ) | ||||||
| Cash flows from financing activities: |
||||||||||||
| Proceeds from issuances of common stock, net of offering costs |
166,726 | 72,421 | — | |||||||||
| Proceeds from China government loan |
— | 33,000 | — | |||||||||
| Proceeds from issuance of senior convertible debt, net of offering costs |
363,963 | — | — | |||||||||
| Proceeds from the issuance of convertible secured debt, net of offering costs |
— | — | 158,557 | |||||||||
| Early redemption of senior convertible debt, net of redemption costs |
— | — | (82,354 | ) | ||||||||
| Payment associated with share increase |
— | — | (144 | ) | ||||||||
| Payment of capped call up-front premium |
(39,543 | ) | — | — | ||||||||
| Proceeds from share lending agreement |
3 | — | — | |||||||||
| Proceeds from exercise of stock options and warrants, and shares purchased under Employee Stock Purchase Plan |
1,637 | 332 | 96 | |||||||||
| Net cash provided by financing activities |
492,786 | 105,753 | 76,155 | |||||||||
| Net increase (decrease) in cash and cash equivalents |
71,460 | 11,480 | (50,794 | ) | ||||||||
| Cash and cash equivalents at beginning of year |
29,428 | 100,888 | 112,368 | |||||||||
| Cash and cash equivalents at end of year |
$ | 100,888 | $ | 112,368 | $ | 61,574 | ||||||
| Supplemental cash flow information: |
||||||||||||
| Interest paid |
— | 12,858 | 23,849 | |||||||||
The accompanying notes are an integral part of these consolidated financial statements.
F-6
Table of Contents
NOTES TO CONSOLIDATED FINANCIAL STATEMENTS
| 1. | NATURE OF BUSINESS |
Evergreen Solar, Inc. (the “Company”), incorporated in August 1994, develops, manufactures and markets solar power products, including solar cells, panels (or modules) and systems. In April 1997, the Company commenced product sales. The Company has incurred losses since inception and has an accumulated deficit. The Company has historically financed its operations and met its capital expenditure requirements primarily through sales of its capital stock, issuance of debt and, to a lesser extent, product revenues.
In January 2005, the Company entered into a strategic partnership agreement with Q-Cells AG (“Q-Cells”). The agreement provided for the organization and capitalization of EverQ GmbH (“EverQ”), a limited liability company incorporated under the laws of Germany. In November 2005, Q-Cells and the Company entered into an agreement with Renewable Energy Corporation ASA (“REC”), whereby REC acquired from the Company and Q-Cells a 15% ownership position in EverQ. In December 2006, REC and Q-Cells purchased additional shares of EverQ which resulted in a reduction in the Company’s ownership interest in EverQ to one-third. In November 2008, EverQ was converted into a German stock corporation and changed its name to Sovello AG (“Sovello”). The purpose of Sovello was to operate facilities to manufacture, market and sell solar products based on the Company’s proprietary wafer manufacturing technology.
Until December 31, 2008, the Company marketed and sold all solar panels manufactured by Sovello under the Evergreen Solar brand, and managed customer relationships and contracts related to the sale of Sovello manufactured product. In connection with the sale of Sovello manufactured product, the Company received a selling fee from Sovello and did not report gross revenue or cost of goods sold that resulted from these sales. Beginning in 2009, the Company, Q-Cells and REC agreed to have Sovello begin marketing and selling its products under its own brand. Sovello continued to manufacture some Evergreen Solar-branded product but, with its independent sales and marketing team then in place, the Company’s involvement in marketing and selling Sovello product ceased. In light of the sales transition, the Company’s selling fee for Sovello product sold under the Evergreen Solar brand was reduced to 0.5% for 2009 from 1.6% in 2008. The Company also receives royalty payments for its ongoing technology contributions to Sovello.
During the third and fourth quarters of 2009, due to Sovello’s significant financial difficulties at that time, the Company wrote-off its aggregate investment in Sovello in addition to recording charges associated with its bank guarantee and for estimated payments relating to undertakings with Sovello’s bank. As a result, the Company’s 2010 consolidated statement of operations and consolidated statement of cash flows do not include its one-third share of Sovello’s results of operations for the period prior to the Company’s sale of its shares in Sovello. On April 21, 2010, all of the outstanding shares of Sovello were sold to Rolling Hills S.à.r.l, an affiliate of Ventizz Capital Fund IV, L.P (“Ventizz”) (see Note 5).
On December 29, 2008, as part of ongoing efforts to lower overhead costs and reduce overall cash requirements, management committed the Company to a plan to cease production at its pilot manufacturing facility in Marlboro, Massachusetts. Production at the facility ceased on December 31, 2008. Almost all of the Marlboro pilot manufacturing facility employees transferred to the Company’s Devens manufacturing facility to fill open positions associated with the second phase of Devens. Advanced manufacturing piloting activities were also transitioned to its Devens facility. As a result of the cessation of manufacturing in Marlboro, the Company recorded restructuring costs, principally non-cash charges, of approximately $30.4 million associated with the write-off of manufacturing and development equipment, inventory and leasehold improvements of the Marlboro pilot facility. The Company also incurred occupancy, location restoration and moving costs through the expiration of the lease in 2010.
As part of its strategy of long-term growth and focusing on its core wafer manufacturing technology, on July 30, 2009, the Company announced that it had finalized its agreements with Jiawei Solarchina Co., Ltd.
F-7
Table of Contents
(“Jiawei”), and Hubei Science & Technology Investment Co., Ltd., an investment fund sponsored by the government of Hubei, China (“HSTIC”) to expand its manufacturing operations into China. Pursuant to an Increase Registered Capital and Enlarge Shares Agreement (the “Investment Agreement”) with HSTIC, HSTIC invested the Chinese RMB equivalent of $33 million in Evergreen Solar (China) Co., Ltd. (“Evergreen Wuhan”) in exchange for 66% of Evergreen Wuhan’s shares. The Company invested approximately $17 million in cash and equipment for the remaining 34% of Evergreen Wuhan’s shares. Immediately upon HSTIC’s investment, the Company agreed to purchase HSTIC’s shares and is required to pay for the shares no later than July 2014. This payment obligation will require the Company to pay to HSTIC for its shares in Evergreen Wuhan an amount equal to HSTIC’s aggregate investment of $33 million plus interest of 7.5% compounded annually.
Despite significant improvements in costs at the Company’s Devens manufacturing facility during 2009, solar panel selling prices have fallen precipitously since mid-2008, making it very difficult for manufacturers located in high-cost regions, including the Company, to remain price competitive. As a result, on October 30, 2009, the Board of Directors of the Company committed to a plan to transition the Company’s panel assembly operations from its manufacturing facility in Devens, Massachusetts to China. The transition, which began in 2010, was anticipated to be completed by mid-to-late 2011, subject to market conditions; and the Company estimated that it would recognize aggregate non-cash charges of up to approximately $44 million associated with the depreciation of panel assembly equipment, including accelerated depreciation, which were expected to be recognized ratably over the transition period and began in the fourth quarter of 2009. While production costs at the Devens facility decreased steadily during 2010, and are now significantly below originally planned levels, on January 10, 2011, the Company’s Board of Directors and management committed the Company to implement a plan to shut down operations at its Devens facility completely. The decision was based on the impact of continued deteriorating average selling prices in December 2010. The Company experienced an unexpected 10% decrease in average selling prices from those at the beginning of the fourth quarter and expects continuing pressure on selling prices throughout 2011. The Company intends for production at the Devens facility to cease by the end of the first quarter of 2011. The Company will continue to operate its wafer facility with approximately 75 megawatts (“MW”) of installed wafer capacity in Wuhan and will continue to supply its outsourcing partner, Jiawei, with wafers for conversion into Evergreen Solar branded solar panels. As a result of the planned cessation of manufacturing in Devens, the Company recorded non-cash charges of approximately $303 million associated primarily with the impairment of the existing Devens building, facilities and equipment and estimates it will incur approximately $15 to $20 million of cash costs associated with employee severance and out placement services, facility decommissioning and other costs required to close the facility (see Note 14).
At December 31, 2010, the Company had approximately $61.6 million of cash and cash equivalents. The Company is subject to risks common to companies in the high-technology and energy industries including, but not limited to, development by the Company or its competitors of new technological innovations, dependence on key personnel, dependence on key or sole source suppliers for materials, protection of proprietary technology and compliance with government regulations. Any delay in the Company’s plan to implement its business strategy may result in increased costs and could impair business operations.
The Company believes that its business plan will provide sufficient liquidity to fund its operating needs for the next 12 months. While its business plan anticipates certain levels of potential risk, particularly in light of the difficult and uncertain current economic environment and the continuing reduction of industry panel pricing caused by competition, especially from China, and the resulting excess capacity in the industry, the Company is exposed to additional particular risks and uncertainties including, but not limited to:
| • | the need for its Wuhan manufacturing facility to ramp to 75 MW of capacity and achieve its target manufacturing cost of $1.25 per watt by mid 2012; |
| • | the need for the Company to continue to make progress on the development of its planned industry standard wafer expansion program allowing further opportunities for growth, including establishing relationships with potential partners and customers for the Company’s wafers; |
F-8
Table of Contents
| • | continued significant fluctuation of the Euro against the U.S. dollar, as a substantial portion of the Company’s sales are denominated in Euros; |
| • | the ability of Jiawei to effectively manage production and manufacturing costs which has an indirect impact on the pricing charged to the Company; and |
| • | the ability of the Company to maintain the costs associated with the shutdown of its Devens facility to within expectations. |
Although the Company’s current business plan indicates it has adequate liquidity to operate under expected operating conditions, the risks noted above could result in liquidity uncertainty. The Company’s plan with regard to this uncertainty includes, among other actions, monitoring its operating results against expectations and, if required, further restricting operating costs and capital spending if events warrant, and if market conditions allow, possibly accessing the capital markets to meet liquidity and capital expenditure requirements.
If additional capital is needed and does not become available on acceptable terms, the Company’s ability to fund operations, further develop and expand its manufacturing operations, particularly with respect to the development of its wide wafer production capacity, and distribution network or otherwise respond to competitive pressures would be significantly limited. In addition, although the Company’s long-term debt does not begin to mature until April 2013 (see Note 7), the Company will actively work to identify sources of liquidity to assist in its ability to repay the debt when it becomes due. There is no assurance that such additional sources of liquidity to repay long-term debt can be obtained on terms acceptable to the Company, or at all.
| 2. | SUMMARY OF SIGNIFICANT ACCOUNTING POLICIES |
A summary of the major accounting policies followed by the Company in the preparation of the accompanying financial statements is set forth below.
BASIS OF PRESENTATION
The consolidated financial statements include the accounts of the Company’s wholly owned subsidiaries. All intercompany accounts and transactions have been eliminated. Operating results of its foreign subsidiaries are translated into U.S. dollars at the average rates of exchange during the period, and assets and liabilities are translated into U.S. dollars at the period-end rate of exchange. Evergreen Solar operates as one reportable segment.
Prior to its disposition of Sovello on April 21, 2010, the Company applied the equity method of accounting for its one-third ownership share of Sovello’s operating results in accordance with the Investments—Equity Method and Joint Ventures topic of the FASB codification. Therefore, the Company’s Consolidated Statements of Operations and Consolidated Statements of Cash Flows for the years ended December 31, 2008 and 2009 include its one-third share of Sovello’s results of operations. During the third and fourth quarters of 2009 the Company wrote-off its aggregate investment in Sovello due to Sovello’s significant financial difficulties at that time. As a result, the Company’s 2010 consolidated statement of operations and consolidated statement of cash flows do not include its one-third share of Sovello’s results of operations (see Note 5).
In conjunction with the Investment Agreement entered into between the Company and HSTIC, the Company agreed to purchase HSTIC’s shares and is required to pay for the shares no later than the end of the five-year period after the investment is received by Evergreen Wuhan. This payment obligation will require the Company to pay to HSTIC for its shares in Evergreen Wuhan an amount equal to HSTIC’s aggregate investment of $33 million plus interest of 7.5% compounded annually, resulting in a debt-like instrument. Accordingly, the Company has treated its payment obligation as indebtedness of the Company and fully consolidates Evergreen Wuhan which it considers to be wholly-owned. The functional currency of Evergreen Wuhan is the RMB.
The Company’s preparation of financial statements in conformity with generally accepted accounting principles requires management to make estimates and assumptions that affect the reported amount of assets and
F-9
Table of Contents
liabilities and disclosures of contingent assets and liabilities at the dates of the financial statements and the reported amounts of revenue and expenses during the reported periods. Estimates are used when accounting for the collectability of receivables, valuing deferred tax assets, provisions for warranty claims, inventory obsolescence and determining the net realizable value of impaired assets among other instances.
ACCOUNTING CHANGES
In October 2009, the FASB issued updated guidance for convertible debt instruments. As required by the Debt topic of the FASB codification, an entity that enters into an equity-classified share lending agreement, utilizing its own shares, in contemplation of a convertible debt issuance or other financing must initially measure the share lending arrangement at fair value and treat it as a cost of the financing. In addition, if it becomes probable that the counterparty to the arrangement will default, the issuer shall recognize an expense for the fair value of the unreturned shares, net of probable recoveries. This new guidance was effective January 1, 2010 and required adjustment of prior periods to conform to current accounting.
On July 27, 2010, at the annual meeting of the Company’s stockholders, holders of a majority of its outstanding shares of common stock approved a proposal to permit the Company’s Board of Directors to amend its certificate of incorporation to authorize a 1-for-6 reverse stock split of the Company’s issued and outstanding common stock and a reduction in the number of its authorized shares of common stock from 450,000,000 to 120,000,000. On December 29, 2010, the Company filed an amendment to its certificate of incorporation to implement the 1-for-6 reverse split. The reverse split became effective at 12:01 a.m. Eastern Standard Time, on Saturday, January 1, 2011. The reverse split, which has been retrospectively applied, reduced the number of outstanding shares of the Company’s common stock from approximately 209 million shares to approximately 35 million shares.
CASH EQUIVALENTS
The Company considers all highly liquid investments with maturities of three months or less from the date of purchase and whose carrying amount approximates fair value to be cash equivalents.
CONCENTRATION OF CREDIT RISK AND SIGNIFICANT CUSTOMERS
Financial instruments that potentially subject the Company to significant concentrations of credit risk consist principally of cash and cash equivalents, and accounts receivable. The Company places its cash and cash equivalents and foreign exchange contracts, when applicable, with high quality financial institutions. With respect to accounts receivable, such receivables are primarily from distributors and integrators in the solar power industry located throughout the world and from Jiawei for wafers utilized under our subcontract arrangement. The Company performs initial credit evaluations of its customers´ financial conditions. The Company has historically relied on a small number of customers for a substantial portion of its business and generally does not require collateral or other security against its accounts receivable; however, when deemed necessary it maintains reserves for potential credit losses and such losses have historically been within management’s expectations. This customer concentration increases the Company’s exposure to credit risk since the financial insolvency of any of these customers could have a significant impact on its liquidity and results of operations.
The table below summarizes the Company’s concentration of accounts receivable at December 31:
| December 31, | ||||||||
| 2009 | 2010 | |||||||
| % of accounts receivable |
||||||||
| IBC Solar AG |
— | 28 | % | |||||
| NWT a.s. |
5 | % | 18 | % | ||||
| Jiawei Solar |
— | 16 | % | |||||
| Ralos Vertriebs GmbH |
29 | % | 6 | % | ||||
| Solar City |
12 | % | 1 | % | ||||
| Sun & Kim Co., Ltd. |
12 | % | — | |||||
| Top 5 customers |
67 | % | 74 | % | ||||
F-10
Table of Contents
In addition, since April 2007 the Company has entered into multi-year silicon supply agreements with four suppliers, one of which has since filed for bankruptcy. Under the remaining silicon supply agreements with OCI Company Ltd., formerly DC Chemical Co., Ltd. (“OCI”), Wacker Chemie AG (“Wacker”) and Solaricos Trading, LTD (“Nitol”), the Company has committed to purchase over 6,000 metric tons of silicon through 2018 at pre-determined prices.
INVENTORY
Inventory is valued at the lower of cost or market determined on a first-in, first-out basis. Certain factors may impact the net realizable value of the Company’s inventory including, but not limited to, technological changes, market demand, changes in product mix strategy, new product introductions and significant changes to its cost structure. Estimates of reserves are made for obsolescence based on the current product mix on hand and its expected net realizable value. If actual market conditions are less favorable or other factors arise that are significantly different than those anticipated by management, additional inventory write-downs or increases in obsolescence reserves may be required.
During 2007 and 2008, the Company entered into multi-year polysilicon supply agreements with several suppliers, most of which required a prepayment under the contract. These prepayments, which are included on the balance sheet in Prepaid Cost of Inventory, are not refundable and would be difficult to recover if a supplier defaults on its obligations. The amount of prepayments classified as short-term is based upon the value of the silicon contracted to be delivered during the upcoming year.
The Company considers lower of cost or market adjustments and reserves as an adjustment to the cost basis of the underlying inventory and prepaid cost of inventory. Accordingly, favorable changes in market conditions are not recorded to inventory in subsequent periods. See Note 3 for a non-cash charge recorded by the Company in 2010 for a partial impairment under an existing silicon contract.
GUARANTOR ARRANGEMENTS
Letters of Credit
The Company maintains letters of credit primarily as collateral for several equipment lease obligations in addition to the Company’s corporate credit card program. In connection with these arrangements, the Company invested in certificates of deposit pledged to several commercial banks which are classified as restricted cash in the accompanying balance sheets.
FIXED ASSETS
Fixed assets are recorded at cost. Provisions for depreciation are based on their estimated useful lives using the straight-line method over a period of three to seven years for all laboratory and manufacturing equipment, computers, and office equipment, and forty years for buildings. The costs for constructing assets are recorded in assets under construction and are depreciated from the date these assets are put into use. For those assets requiring a period of time to get them ready for their intended use, the Company capitalizes a portion of its interest costs as part of the historical cost of acquiring the asset. Leasehold improvements are depreciated over the shorter of the remainder of the lease term or the estimated life of the improvements. Upon retirement or disposal, the cost of the disposed asset and the related accumulated depreciation are removed from the accounts and any gain or loss is reflected in net income or loss.
Expenditures for repairs and maintenance are expensed as incurred.
F-11
Table of Contents
IMPAIRMENT OF LONG-LIVED ASSETS
The Company’s policy regarding long-lived assets is to evaluate the recoverability or usefulness of these assets when the facts and circumstances suggest that these assets may be impaired. This analysis relies on a number of factors, including changes in strategic direction, business plans, regulatory developments, economic and budget projections, technological improvements, and operating results. The test of recoverability or usefulness is a comparison of the asset value to the undiscounted cash flow over the asset’s remaining useful life. If such a test indicates that impairment exists, then the asset is written down to its estimated fair value. Any write-downs would be treated as permanent reductions in the carrying amounts of the assets and an operating loss would be recognized (see Note 14).
REVENUE RECOGNITION AND ALLOWANCE FOR DOUBTFUL ACCOUNTS
The Company recognizes product revenue if there is persuasive evidence of an agreement with the customer, shipment has occurred, risk of loss has transferred to the customer, the sales price is fixed or determinable, and collectability is reasonably assured. The market for solar power products continues to emerge and rapidly evolve. The Company currently sells its solar power products primarily to distributors, system integrators and other value-added resellers within and outside of North America, who typically resell these products to end users throughout the world. The Company has not offered rights to return its products other than for normal warranty conditions. For new customers requesting credit, the Company evaluates creditworthiness based on credit applications, feedback from provided references, and credit reports from independent agencies. For existing customers, the Company evaluates creditworthiness based on payment history and known changes in their financial condition. Through the third quarter of 2009 royalty and fee revenue were recognized at contractual rates upon sale of product by Sovello. The Company did not recognize any royalty revenue in the fourth quarter of 2009 or the first quarter of 2010 due to Sovello’s financial condition. Beginning in the second quarter of 2010, upon entering a new agreement, royalty revenue from Sovello is recognized based upon a flat royalty rate (see Note 5).
The Company maintains allowances for doubtful accounts when deemed necessary for estimated losses resulting from the inability of its customers to make required payments. If the financial condition of the Company’s customers were to deteriorate, such that their ability to make payments was impaired, additional allowances could be required.
RESEARCH AND DEVELOPMENT
Research and development costs are expensed as incurred.
INCOME TAXES
The Company accounts for income taxes under the liability method, which requires recognition of deferred tax assets, subject to valuation allowances, and liabilities for the expected future tax consequences of events that have been included in the financial statements or tax returns. Deferred income taxes reflect the net tax effects of temporary differences between the carrying amounts of assets and liabilities for financial reporting and income tax purposes. A valuation allowance is established if it is more likely than not that all or a portion of the net deferred tax assets will not be realized.
VALUE-ADDED TAXES
The Company accounts for foreign value-added taxes on a net basis which excludes the amounts from revenues and costs. Value-added tax receivables and payables are presented net on the balance sheet based upon jurisdiction.
F-12
Table of Contents
COMPREHENSIVE LOSS
Other comprehensive loss consists of unrealized gains and losses on available-for-sale securities and cumulative foreign currency translation adjustments. Other comprehensive income or loss is reflected in the Consolidated Statement of Stockholder’s Equity.
STOCK-BASED COMPENSATION
In accordance with the Stock Compensation topic of the FASB codification, the Company measures compensation cost arising from the grant of share-based payments to employees at fair value and recognizes such cost in operations over the period during which the employee is required to provide service in exchange for the award, usually the vesting period. Stock-based compensation cost is measured at the grant date based on the fair value of the award and is recognized as expense on a straight-line basis over the awards’ service periods, which are the vesting periods, less estimated forfeitures. See Note 11 for further information regarding the Company’s stock-based compensation assumptions and expenses.
NET LOSS PER COMMON SHARE
The Company computes net loss per common share in accordance with the Earning Per Share topic of the FASB codification. Under the guidance, basic net loss per common share is computed by dividing net loss by the weighted average number of common shares outstanding during the period. The calculation of diluted net loss per common share for the years ended December 31, 2008, 2009 and 2010 does not include approximately 6.4 million, 6.3 million and 18.7 million potential shares of common stock equivalents outstanding at December 31, 2008, 2009 and 2010, respectively, as their inclusion would be anti-dilutive. Common stock equivalents include outstanding common stock options, unvested restricted stock awards, common stock warrants (in 2008 and 2009) and common stock issuable upon conversion of debt.
In connection with the sale to the public of $373.8 million of 4% Senior Convertible Notes due 2013 (the “Senior Notes”) on June 26, 2008, the Company entered into a common stock lending agreement with an affiliate of Lehman Brothers, Inc., the lead underwriter, pursuant to which the Company loaned 5,142,757 shares of its common stock to the affiliate (see Note 10). These shares were considered issued and outstanding for corporate law purposes at the time they were loaned; however, at the time of the loan they were not considered outstanding for the purpose of computing and reporting earnings per share because these shares were to be returned to the Company no later than July 15, 2013, the maturity date of the notes. On September 15, 2008 and October 3, 2008, respectively, the parent company of the lead underwriter, Lehman Brothers Holdings Inc., and the lead underwriter’s affiliate that entered into the capped call transaction (Note 7) filed for protection under Chapter 11 of the federal Bankruptcy Code. The lead underwriter’s affiliate that entered into the stock lending agreement with the Company was placed into administration in the United Kingdom shortly thereafter. As a result of the bankruptcy filing, the lead underwriter’s affiliate was contractually required to return the shares to the Company. The Company has since demanded the immediate return of all outstanding borrowed shares, however, the shares have not yet been returned. While the Company believes it is exercising all of its legal remedies, it has included these shares in its per share calculation on a weighted average basis due to the uncertainty regarding the recovery of the borrowed shares.
SEGMENT REPORTING
The Segment Reporting topic of the FASB codification establishes standards for reporting information about operating segments. The information in this report is provided in accordance with the requirements of this guidance and is consistent with how business results are reported internally to management. The Company currently operates as one segment.
F-13
Table of Contents
USE OF ESTIMATES
The preparation of financial statements in conformity with generally accepted accounting principals requires management to make estimates and assumptions that affect the reported amounts of assets and liabilities, disclosure of contingent assets and liabilities at the date of the financial statements and the reported amounts of revenue and expenses during the reporting period. Actual results could differ from those estimates. The Company bases its estimates on historical experience and various other factors believed to be reasonable under the circumstances, the results of which form the basis for making judgments about the carrying value of assets and liabilities that are not readily apparent from other sources. Some of these estimates can be subjective and complex and, consequently, actual results may differ from these estimates under different assumptions or conditions. For any given estimate or assumption made by the Company’s management, there may be other estimates or assumptions that are as reasonable. The Company believes that, given the current facts and circumstances, it is unlikely that applying any such other reasonable estimate or assumption would materially impact the financial statements.
FAIR VALUE OF FINANCIAL INSTRUMENTS
Financial instruments, including cash equivalents, accounts receivable and accounts payable are carried in the consolidated financial statements at amounts that approximate fair value at December 31, 2009 and 2010. Fair values are based on market prices and assumptions concerning the amount and timing of estimated future cash flows and assumed discount rates, reflecting varying degrees of perceived risk.
RECENT ACCOUNTING PRONOUNCEMENTS
Recent accounting pronouncements, not included below, are not expected to have a material impact on the Company’s consolidated financial position and results of operations.
In January 2010, an update was made to the Fair Value Measurements and Disclosures topic of the FASB codification that requires new disclosures for fair value measurements and provides clarification for existing disclosure requirements. More specifically, this update will require (a) an entity to disclose separately the amounts of significant transfers into and out of Level 1 and 2 fair value measurements and to describe the reasons for the transfers; and (b) information about purchases, sales, issuances, and settlements to be presented separately on a gross basis in the reconciliation of Level 3 fair value measurements. This update was effective for fiscal years beginning after December 15, 2009 except for Level 3 reconciliation disclosures which are effective for fiscal years beginning after December 15, 2010. The portion of the update which was effective for fiscal years beginning after December 15, 2009 did not have an impact on the Company’s consolidated financial statements. The portion of the update which is effective for fiscal years beginning after December 15, 2010 is not expected to have an impact on the Company’s consolidated financial statements.
| 3. | INVENTORY |
Inventory consisted of the following at December 31 (in thousands):
| December 31, | ||||||||
| 2009 | 2010 | |||||||
| Raw materials |
$ | 18,327 | $ | 28,257 | ||||
| Work-in-process |
7,643 | 8,176 | ||||||
| Finished goods |
8,920 | 18,508 | ||||||
| $ | 34,890 | $ | 54,941 | |||||
| Prepaid cost of inventory |
$ | 173,207 | $ | 73,576 | ||||
| Less: current portion |
25,634 | 13,093 | ||||||
| Noncurrent portion |
$ | 147,573 | $ | 60,483 | ||||
F-14
Table of Contents
The Company has entered into multiple multi-year silicon supply agreements, several of which required advanced funding under the contract. These prepayments, which are non-refundable, are presented on the balance sheet in Prepaid Cost of Inventory and will be amortized as an additional cost of inventory as silicon is delivered and utilized by the Company. Prepayments are classified as short-term based upon the value of silicon contracted to be delivered during the next twelve months. The Company carries these prepayments on its balance sheet at cost and periodically evaluates the vendor’s ability to fulfill the silicon contract. In connection with one of the OCI contracts, the Company issued shares of its common stock to the supplier valued at $121 million. This amount was accounted for as an intangible asset (“prepaid inventory”) in the Company’s balance sheet and is being amortized as an additional cost of inventory over the life of the contract as silicon is purchased. As a result of the shutdown of the Devens facility, and the corresponding substantial reduction in the Company’s expected silicon requirements, the silicon purchases over which this intangible asset is being amortized have been significantly reduced, resulting in projected excess contractually required purchases of silicon compared to the Company’s expected usage. While the Company expects to be able to sell excess quantities for prices approximately equal to the weighted average contractual purchase prices, the excess quantities require a write down of the asset to reflect the value not expected to be recovered. Consequently, a non-cash charge of $74.5M was recorded in the 2010 fourth quarter representing the write down of this asset. Additional write-downs could occur if the excess quantities are not sold at the weighted average contractual purchase prices
On December 7, 2007, the Company entered into a multi-year silicon supply agreement with Silpro. This supply agreement provided the general terms and conditions pursuant to which Silpro would supply the Company with specified annual quantities of silicon at fixed prices beginning in 2010 and continuing through 2019. In connection with the supply agreement, the Company loaned Silpro 30 million Euros at an interest rate of 3.0% compounded annually. The difference between this rate and prevailing market rates at that time was recorded as an adjustment to the cost of inventory. In April 2009 as a result of its inability to obtain additional financing to continue construction of its factory, Silpro announced that the French commercial court ordered the filing for judicial settlement proceedings (redressement judiciaire), a process similar to bankruptcy proceedings in the United States. As a result, the loan receivable from Silpro and the related interest will not be repaid and the Company recognized a non-cash charge of $43.9 million. In August 2009, the court ordered liquidation proceedings (liquidation judiciaire) due to Silpro’s inability to secure further financing.
| 4. | FIXED ASSETS |
Fixed assets consisted of the following at December 31 (in thousands):
| Useful Life |
December 31, | |||||||||||
| 2009 | 2010 | |||||||||||
| Land |
$ | 119 | $ | 119 | ||||||||
| Buildings |
40 years | 208,909 | 217,029 | |||||||||
| Laboratory and manufacturing equipment |
3-7 years | 257,186 | 289,071 | |||||||||
| Computer and office equipment |
3-7 years | 5,890 | 8,130 | |||||||||
| Leasehold improvements |
Lesser of 15 to 20 | 16,418 | 7,138 | |||||||||
| years or lease term | ||||||||||||
| Assets under construction |
34,297 | 19,969 | ||||||||||
| 522,819 | 541,456 | |||||||||||
| Less: Accumulated depreciation |
(92,138 | ) | (424,910 | ) | ||||||||
| $ | 430,681 | $ | 116,546 | |||||||||
During 2007, the Commonwealth of Massachusetts support program awarded the Company $20.0 million in grants towards the construction of its Devens, Massachusetts manufacturing facility, virtually all of which has been received. The grants have been capitalized as a reduction of the construction costs. The funds granted are
F-15
Table of Contents
subject to repayment by the Company if, among other conditions, the Devens manufacturing facility does not create and maintain 350 new jobs in Massachusetts through November 20, 2014. The repayment of the grants, if any, will be proportional to the targeted number of jobs per annum that are not created. The grant monies received are being amortized over the same period as the underlying assets to which they relate.
On October 30, 2009, the Board of Directors of the Company committed it to a plan to transition its panel assembly from its manufacturing facility in Devens, Massachusetts to China. The transition, which began in 2010, was initially anticipated to be completed by mid-2011, subject to market conditions. However, on January 10, 2011, the Company’s Board of Directors and management committed the Company to implement a plan to shut down all operations at its Devens facility by the end of the first quarter of 2011. The Company will continue to operate its high temperature filament plant in Midland, Michigan and its wafer facility with approximately 75 MW of installed wafer capacity in Wuhan, China and will continue to supply its outsourcing partner with wafers for conversion into Evergreen Solar branded solar panels. In conjunction with its decision, the Company initiated an evaluation of the recoverability of its Devens, Midland and Wuhan facilities and related equipment. As a result of this assessment, the Company recorded an impairment charge of approximately $303 million on its long-lived assets. The Company estimates it will recognize cash charges of approximately $15 million to $20 million, principally severance, facility decommissioning, the potential reimbursement to the Commonwealth of Massachusetts for a portion of the grant monies received and other costs required to close the facility (see Note 14).
In conjunction with the closing of the Company’s Marlboro, Massachusetts pilot manufacturing facility in December 2008, the Company recorded write-offs of leasehold improvements and other related building costs with a net book value of approximately $5.4 million and equipment of approximately $20.9 million. In addition to the closure of Marlboro, the Company recorded charges of approximately $8.0 million for the write-off R&D equipment in 2008 that supported now-obsolete technologies.
Depreciation expense for the years ended December 31, 2008, 2009 and 2010 was $18.2 million, $46.1 million and $63.0 million, respectively, exclusive of the write downs noted above. The 2010 amounts include accelerated depreciation associated with the transition of panel assembly to China.
As of December 31, 2010, the Company had outstanding commitments for capital expenditures of approximately $4.4 million, primarily for the construction and equipment for its Midland, Michigan facility and to a lesser extent its Wuhan, China facility.
| 5. | INVESTMENT IN AND SALE OF SOVELLO AG |
The Company applied the equity method of accounting for its one-third share of Sovello’s operating results in accordance with the guidance provided by the Equity Method and Joint Ventures topic of the FASB Codification. During 2009, Sovello’s business faced significant financial difficulties as a result of the overwhelming market downturn in demand and pricing for its products. As a result, Sovello defaulted under its bank loan agreement. In light of this and other financial difficulties, including the on-going deterioration in world-wide pricing for Sovello’s products, the Company recorded an impairment charge of approximately $126.1 million during the second half of 2009 related to its aggregate investment in Sovello.
On April 21, 2010, the Company and Sovello’s other shareholders sold all of the outstanding shares of Sovello to Ventizz. The sale of the shares to Ventizz resulted in a new license agreement between the Company and Ventizz for the license of the Company’s Gemini and Quad wafer manufacturing technology. The license agreement replaced the Company’s existing license agreements with Sovello and calls for royalty payments from Sovello of $2.0 million in 2010 and $3.0 million in each of the subsequent 2 years for the capacity that exists at Sovello.
Pursuant to a Share Purchase Agreement between Ventizz and Sovello’s other shareholders, the Company paid to Sovello approximately EUR 2.4 million (approximately $3.2 million at applicable exchange rates) on April 21, 2010, net of receipt of remaining royalty payments and product payments for 2009 of approximately
F-16
Table of Contents
EUR 4.1 million (approximately $5.6 million). This amount was in addition to EUR 5.8 million (approximately $8.1 million at applicable exchange rates) paid by the Company in the first quarter in conjunction with a guarantee made to Sovello’s banking syndicate. Of the approximately EUR 4.1 million received, approximately $2.4 million related to royalties owed for the fourth quarter of 2009. The majority of the approximately $3.2 million remaining was for royalties owed for the second and third quarters of 2009. During the fourth quarter of 2009, as a result of the substantial doubt that existed at that time about Sovello’s ability to settle these obligations, the Company did not recognize the $2.4 million as royalty revenue and wrote-off the $3.2 million receivable as part of the 2009 impairment charge. As a result of Sovello’s settlement payment, the Company recognized the $2.4 million as royalty revenue and reversed $3.2 million of the 2009 impairment charge. In connection with the closing of the sale, the Master Joint Venture Agreement among the shareholders and Sovello, dated November 5, 2008, was terminated and the Company satisfied its remaining obligations pursuant to the Undertaking, dated October 6, 2008, it made to Sovello’s banking syndicate.
The financial information for Sovello for the years ended December 31, 2008 and 2009 and the period from January 1, 2010 to April 21, 2010 is as follows (in thousands):
| For the Years Ended December 31, |
For the Period from January 1, 2010 to April 21, 2010 |
|||||||||||
| 2008 | 2009 | |||||||||||
| Revenue |
$ | 323,911 | $ | 158,113 | $ | 75,500 | ||||||
| Cost of goods sold |
247,567 | 181,312 | 85,824 | |||||||||
| Other expenses |
50,034 | 67,049 | 46,795 | |||||||||
| Net income (loss) |
26,310 | (90,248 | ) | (57,119 | ) | |||||||
| December 31, 2009 |
April 21, 2010 |
|||||||
| Current assets |
$ | 138,925 | $ | 115,062 | ||||
| Non-current assets |
431,941 | 359,174 | ||||||
| Current liabilities |
412,110 | 356,707 | ||||||
| Non-current liabilities |
67,067 | 59,565 | ||||||
| 6. | LOAN RECEIVABLE FROM JIAWEI |
On March 26, 2010, Evergreen Wuhan entered into a loan agreement with Jiawei pursuant to which a loan of RMB 34.1 million was provided to Jiawei (approximately $5.2 million at December 31, 2010 exchange rates) at an interest rate of 7.5% compounded semi-annually. The principal and accrued interest is due no later than March 30, 2015. In addition, on April 29, 2010, the Company entered into an additional loan agreement with Jiawei’s parent company pursuant to which a $7.8 million loan was made to Jiawei at an interest rate of 7.5% compounded semi-annually. The principal and accrued interest is due no later than April 30, 2015. The Company has the option to convert up to $5.0 million of this loan into stock or other securities of Jiawei at any time prior to repayment of the loan and related interest. These loans were made to Jiawei to provide it with sufficient financing flexibility to establish its cell and panel manufacturing facility as well as for working capital requirements as Jiawei rapidly ramps its operations to support its contract manufacturing relationship with the Company which was established during 2009. As of December 31, 2010 the combined amount of $13.6 million is reported as “loan receivable from Jiawei and related interest” on the balance sheet.
F-17
Table of Contents
| 7. | DEBT |
The Company’s convertible debt consisted of the following at December 31 (in thousands):
| December 31, | ||||||||
| 2009 | 2010 | |||||||
| Senior convertible notes |
$ | 373,750 | $ | 249,207 | ||||
| Debt discount |
50,474 | 25,124 | ||||||
| Senior convertible notes, net of discount |
323,276 | 224,083 | ||||||
| Convertible senior secured notes |
— | 165,000 | ||||||
| Total convertible notes, net of discount |
$ | 323,276 | $ | 389,083 | ||||
Convertible Subordinated Notes
On June 29, 2005, the Company issued 4.375% convertible subordinated notes due 2012 (“Notes”) in the aggregate principal amount of $90.0 million with interest on the Notes payable semiannually. The Company received proceeds, net of offering costs, of $86.9 million a portion of which was used to (1) fund research and development spending on next generation technologies, (2) explore further expansion opportunities and (3) fulfill its commitments with Sovello. On July 7, 2008, the Company notified the holders of the Notes that on July 22, 2008 (the “Redemption Date”) it would redeem all the outstanding Notes at a redemption price of 100% of the principal amount thereof, plus accrued and unpaid interest to the Redemption Date. In lieu of redemption, all of the Notes were converted to common stock of the Company and the Company issued 2,029,768 shares of common stock to the note holders on July 22, 2008.
Senior Convertible Notes
On July 2, 2008, the Company completed a public offering of $373.8 million aggregate principal amount of its 4% Senior Convertible Notes. Net proceeds to the Company from the Senior Notes offering, including the cost of the capped call transaction (see Capped Call), were approximately $325.8 million. The Company’s financing costs associated with the Senior Notes are being amortized over the five year term which concludes in July 2013. During the second quarter of 2010, the Company repurchased approximately $124.5 million aggregate principal amount of the Senior Notes (see Convertible Senior Secured Notes below), recognizing a gain of approximately $24.8 million on the early extinguishment, and leaving a remaining balance of approximately $249.2 million as of December 31, 2010.
The Senior Notes bear cash interest at the rate of 4% per year, payable semi-annually in arrears on January 15 and July 15 of each year, beginning on January 15, 2009, with an effective interest cost of approximately 8.8% as a result of the adoption of the guidance required by the Debt topic of the FASB codification relating to accounting for convertible debt instruments that may be settled in cash upon conversion (including partial cash settlement), in addition to the impact of accounting for equity classified own shares lending arrangements as described in Note 2. The Senior Notes were originally accounted for as traditional convertible debt, with no bifurcation of the conversion feature recognized as a separate asset or liability. However, effective January 1, 2009, in accordance with the Debt topic of the FASB codification, the Company has separately accounted for the liability and equity components (approximately $65.9 million) of the instrument in a manner that reflects the issuer’s nonconvertible debt borrowing rate. The Senior Notes will mature on July 15, 2013 unless previously repurchased by the Company or converted in accordance with their terms prior to such date. The Senior Notes are not redeemable at the Company’s option prior to the stated maturity date. If certain fundamental changes occur at any time prior to maturity, holders of the Senior Notes may require the Company to repurchase their Senior Notes in whole or in part for cash equal to 100% of the principal amount of the Senior Notes to be repurchased, plus accrued and unpaid interest to, but excluding, the date of repurchase. The fair value of the Company’s Senior Notes is estimated based on quoted market prices which approximated 37.2% of par value as of December 31, 2010, or approximately $92.7 million.
F-18
Table of Contents
At maturity and upon certain other events, including a change of control and when the trading price of the Company’s common stock exceeds 130% of the then effective conversion price, the Senior Notes are convertible into cash up to their principal amount and shares of the Company’s common stock for the remainder, if any, of the conversion value in excess of such principal amount at the initial conversion rate of 13.7599 shares of common stock per $1,000 principal amount of Senior Notes (equivalent to an initial conversion price of $72.675 per share). Subject to certain exceptions and limitations, the holder of a note for $1,000 principal amount that is converted when the Company’s common stock is trading at the conversion price of $72.675 (or lower) would receive $1,000 (or less) in cash, and the holder of a note for $1,000 principal amount that is converted when the Company’s common stock is trading above the conversion price of $72.675 would receive $1,000 in cash and shares of the Company’s common stock to the extent that the market value of the Company’s common stock multiplied by the conversion rate, which is initially 13.7599, exceeds $1,000. If a non-stock change of control occurs and a holder elects to convert Senior Notes in connection with such non-stock change of control, such holder may be entitled to an increase in the conversion rate. The conversion rate may also be adjusted under certain other circumstances, including, but not limited to, the issuance of stock dividends and payment of cash dividends.
Capped Call
In connection with the Company’s Senior Notes offering on June 26, 2008, the Company entered into a capped call transaction with respect to the Company’s common stock with Lehman Brothers OTC Derivatives Inc. (“LOTC”), an affiliate of Lehman Brothers Inc., the lead underwriter for the offering, in order to reduce the dilution that would otherwise occur as a result of new common stock issuances upon conversion of the Senior Notes. The capped call transaction has an initial strike price of $72.675 per share, subject to certain adjustments, which matches the initial conversion price of the Senior Notes, and has a cap price of $114.00 per share.
The capped call transaction was designed to reduce the potential dilution resulting from the conversion of the Senior Notes into shares of common stock, and effectively increase the conversion price of the Senior Notes for the Company to $114.00 per share from the actual conversion price to the note holders of $72.68 per share. The total premium to be paid by the Company for the capped call was approximately $68.1 million, of which $39.5 million was paid contemporaneously with the closing of the Senior Notes offering and the remaining $28.6 million was required to be paid in nine equal semi annual installments beginning January 15, 2009. In accordance with the guidance in Distinguishing Liability from Equity topic of the FASB codification and the Derivative and Hedging topic of the FASB codification, the capped call instrument was classified as equity and therefore the up-front capped call premium plus the present value of the future installments were recorded in additional paid-in capital. As this instrument does not qualify as a derivative under the Derivatives and Hedging topic of the FASB codification, it is not be subject to mark-to-market adjustments in subsequent periods.
On September 15, 2008 and October 3, 2008, respectively, the parent company of the lead underwriter, Lehman Brothers Holdings Inc. and LOTC filed for protection under Chapter 11 of the federal Bankruptcy Code, each an event of default under the capped call transaction. As a result of the defaults, the affiliate is not expected to perform its obligations if such obligations were to be triggered and the Company’s obligations under the agreement have been suspended. The Company believes it has the right to terminate the capped call transaction based on the defaults that have occurred. Accordingly the remaining premium liability under the capped call transaction was reversed against equity.
On September 9, 2009, the Company received notification from LOTC purporting to terminate the capped call transaction based on the Company’s failure to pay additional installment payments under the capped call transaction. On September 25, 2009, the Company received a letter from the same party requesting payment of $19,992,487 (plus $340,673 in interest) as payment for the termination of the capped call transaction. More recently, LOTC increased its demand to no less than $23,643,902 (plus interest). Despite the letter received, the Company rejects any assertions that (i) LOTC has the right to terminate the capped call transaction, (ii) that the Company has defaulted on any payment obligations under the capped call transaction and (iii) that any amounts
F-19
Table of Contents
are currently due and payable to LOTC under the capped call transaction. The Company intends to vigorously defend against all such claims by the lead underwriter’s affiliate and any related parties should they be asserted and if the dispute cannot be otherwise resolved.
In connection with the sale of the Senior Notes, the Company also entered into a common stock lending agreement (see Common Stock Lending Agreement within Note 10).
Convertible Senior Secured Notes
On April 26, 2010, the Company completed a private placement of $165 million aggregate principal amount of its 13% Convertible Senior Secured Notes due 2015 (the “Secured Notes”) to Piper Jaffray & Co. (the “Initial Purchaser”) who subsequently placed the Secured Notes to investors in accordance with Rule 144A of the Securities Act of 1933, as amended. The Secured Notes were issued pursuant to an indenture (the “Indenture”), dated as of April 26, 2010, among the Company, the guarantors named therein (the “Guarantors”) and U.S. Bank National Association, as trustee. The Company used approximately $82.4 million of the $158.6 million net proceeds from this offering for the purchase of approximately $124.5 million aggregate principal amount of its Senior Notes and is using the remainder of the net proceeds of approximately $75 million for general corporate purposes, working capital and capital expenditures for further expansion in China. As a result of these financing transactions, the Company’s annual cash interest expense increased from approximately $18 million to $34 million.
The Secured Notes bear interest at the rate of 13% per year, payable semi-annually in arrears on April 15 and October 15 of each year, beginning on October 15, 2010. The Secured Notes will mature on April 15, 2015 unless previously repurchased by the Company or converted in accordance with their terms prior to such date. If certain fundamental change transactions occur at any time prior to maturity or if more than $50 million in principal amount of the Company’s Senior Notes remain outstanding on April 15, 2013, holders of the Secured Notes may require the Company to repurchase their Secured Notes in whole or in part for cash equal to 100% of the principal amount of the Secured Notes to be repurchased, plus accrued and unpaid interest to, but excluding, the date of repurchase. The fair value of the Secured Notes is estimated based on quoted market prices which approximated 76.2% of par value as of December 31, 2010, or approximately $125.7 million.
The Secured Notes are fully and unconditionally guaranteed on a senior secured basis by each of the Company’s existing and future direct and indirect wholly owned domestic subsidiaries, subject to certain exceptions. Pursuant to the terms of the Indenture, the Pledge and Security Agreement, dated as of April 26, 2010, among the Company, the Guarantors and U.S. Bank National Association, as collateral agent, and the Collateral Trust Agreement, dated as of April 26, 2010, among the Company, the Guarantors and U.S. Bank National Association, as collateral agent, the Secured Notes and the guarantees are secured by a first-priority lien on substantially all of the assets owned by the Company and the Guarantors, subject to certain exceptions.
The Secured Notes are convertible into shares of the Company’s common stock at an initial conversion rate of 87.5410 shares of common stock per $1,000 principal amount of Secured Notes (which is equivalent to an initial conversion price of approximately $11.42 per share), subject to adjustment upon occurrence of certain events. The initial conversion price represents a conversion premium of approximately 52% relative to $7.50, which was the last reported sale price of the Company’s common stock on the Nasdaq Global Market on April 20, 2010.
For the years ended December 31, 2008, 2009 and 2010, the Company recorded approximately $16.1 million, $29.3 million and $38.8 million, respectively, in interest expense associated with its Notes, Senior Notes and Secured Notes (which includes non-cash interest of approximately $5.7 million, $12.8 million and $12.5 million in 2008, 2009 and 2010, respectively, associated with the guidance of the Debt topic of the FASB codification). For the years ended December 31, 2008, 2009 and 2010, the Company capitalized interest of approximately $7.5 million, $2.6 million and $77,000, respectively.
F-20
Table of Contents
Loan Payable
Pursuant to the Investment Agreement, HSTIC invested the RMB equivalent of $33 million in Evergreen Wuhan in exchange for 66% of Evergreen Wuhan’s shares. This payment obligation will require the Company to pay to HSTIC for its shares in Evergreen Wuhan an amount equal to HSTIC’s aggregate investment of $33 million plus interest of 7.5% compounded annually no later than 2014, the end of the five year period after receipt of the investment. The fair value of the loan approximates book value.
The Investment Agreement also sets forth certain negative and affirmative covenants that must be complied with to avoid accelerating the Company’s obligation to pay for HSTIC’s shares. Covenants include, but are not limited to, reporting obligations and approval requirements for certain affiliate transactions and other extraordinary business activities. The Company was in compliance with these covenants at December 31, 2010. If the Company fails to meet its obligation to pay for HSTIC’s shares at the end of five years, or upon the possible acceleration of the payment term, the Company will be required to relinquish its Board and management control over Evergreen Wuhan.
Interest incurred on the loan for the years ended December 31, 2009 and 2010, which is payable in conjunction with the loan repayment, was approximately RMB 7.4 million and RMB 17.4 million, respectively ($1.1 million and $2.6 million for the year ended December 31, 2009 and 2010 at applicable exchange rates). Of these amounts approximately RMB 256,000 and RMB 6.1 million for the years ended December 31, 2009 and 2010, respectively, were capitalized ($38,000 and $896,000 at December 31, 2009 and 2010 applicable exchange rates). The combined loan and related interest amounts have been included in “loan and related interest payable” on the balance sheet.
Letters of Credit
As of December 31, 2010, the Company has approximately $2.8 million of outstanding letters of credit, most of which are required to secure several equipment leases and the Company’s corporate credit card program. The Company has segregated cash to collateralize these outstanding letters of credit which is included in “restricted cash” on the balance sheet.
| 8. | COMMITMENTS AND CONTINGENCIES |
Potential Litigation with Lehman Brothers.
On September 25, 2009, the Company received a letter from LOTC requesting payment of $19,992,487 (plus $340,673 in interest) as payment for the termination of the capped call transaction (see Note 7) which LOTC believes it has the right to terminate and purported to terminate in a letter received by the Company on September 9, 2009. More recently, LOTC increased its demand to no less than $23,643,902 (plus interest). Despite the demand for payment and purported termination letter received, the Company rejects LOTC’s assertions that (i) it has the right to terminate the capped call transaction, (ii) that the Company has defaulted on any payment obligations under the capped call transaction and (iii) that any amounts are currently due and payable to LOTC under the capped call transaction. The Company intends to vigorously defend against all such claims by LOTC and any related parties should they be asserted and if the dispute cannot be otherwise resolved. In addition, the Company continues to pursue its related claims in bankruptcy in the U.S., and in administration in the U.K., against Lehman Brothers, Inc. and certain of its affiliates.
Product Warranty
The Company’s current standard product warranty includes a ten-year warranty period for defects in material and workmanship, effective for product sold beginning on January 1, 2011, and a 25-year warranty period for declines in power performance which are standard in the solar industry. The Company currently accrues a liability of approximately 0.5%, on average, of current product revenues for the estimated future costs of meeting it warranty obligations, the levels of which are consistent with industry ranges. The Company makes
F-21
Table of Contents
and revises this estimate based on the number of solar panels shipped and its historical experience with warranty claims. During 2008, the Company re-evaluated potential warranty exposure as a result of the substantial increase in production volumes at its Devens, Massachusetts manufacturing facility. The Company also evaluated the quality of the panels produced by its outsourcing partner in China. The Company continually monitors the quality of its product.
The Company engages in product quality programs and processes, including monitoring and evaluating the quality of component suppliers, in an effort to ensure the quality of its products and reduce its warranty exposure. Its warranty obligation will be affected not only by its product failure rates, but also the costs to repair or replace failed products and potential service and delivery costs incurred in correcting a product failure. If the Company’s actual product failure rates, repair or replacement costs, or service or delivery costs differ from these estimates, accrued warranty costs would be adjusted in the period that such events or costs become known.
The following table summarizes the Company’s warranty accrual activity for the years ended December 31, 2009 and 2010 (in thousands):
| 2009 | 2010 | |||||||
| Balance at beginning of year |
$ | 1,182 | $ | 2,368 | ||||
| Warranty costs accrued |
1,335 | 1,682 | ||||||
| Warranty costs incurred |
(149 | ) | (129 | ) | ||||
| Balance at end of year |
$ | 2,368 | $ | 3,921 | ||||
Other
As of December 31, 2010, the Company had outstanding commitments for capital expenditures of approximately $4.4 million, expected to be fulfilled in 2011, primarily for the construction and equipment for its Midland, Michigan facility and to a lesser extent equipment and construction for its Wuhan, China facility. Additionally, the Company had approximately $416.8 million in commitments for raw material purchases over the next 8 years as of December 31, 2010.
| 9. | FAIR VALUE MEASUREMENTS |
The Company follows the guidance of the Fair Value Measurements and Disclosures topic of the FASB codification. This statement defines fair value, establishes a framework for measuring fair value and expands the related disclosure requirements. This statement applies under other accounting pronouncements that require or permit fair value measurements. The statement indicates, among other things, that a fair value measurement assumes that the transaction to sell an asset or transfer a liability occurs in the principal market for the asset or liability or, in the absence of a principal market, the most advantageous market for the asset or liability. The guidance defines fair value based upon an exit price model.
Valuation Hierarchy
The Fair Value Measurements and Disclosures topic of the FASB codification, establishes a valuation hierarchy for disclosure of the inputs to valuation used to measure fair value. This hierarchy prioritizes the inputs into three broad levels as follows:
Level 1-Inputs are unadjusted quoted prices in active markets for identical assets or liabilities that the Company has the ability to access at the measurement date.
Level 2-Inputs include quoted prices for similar assets and liabilities in active markets, quoted prices for identical or similar assets or liabilities in markets that are not active, inputs other than quoted prices that are observable for the asset or liability (i.e., interest rates, yield curves, etc.), and inputs that are derived principally from or corroborated by observable market data by correlation or other means (market corroborated inputs).
F-22
Table of Contents
Level 3-Unobservable inputs that reflect the Company’s views about the assumptions that market participants would use in pricing the asset or liability. The Company develops these inputs based on the best information available, including third party appraisals of property, prices for similar assets utilizing highest and best use assumptions for the various components in addition to its own data.
A financial asset or liability’s classification within the hierarchy is determined based on the lowest level input that is significant to the fair value measurement.
The following table provides the assets and liabilities carried at fair value measured on a recurring basis as of December 31 (in thousands):
| December 31, 2009 | ||||||||||||||||
| Total Carrying Value |
Quoted Prices in Active Markets (Level 1) |
Using Significant Other Observable Inputs (Level 2) |
Using
Significant Unobservable Inputs (Level 3) |
|||||||||||||
| Money markets |
$ | 20,007 | $ | 20,007 | $ | — | $ | — | ||||||||
| December 31, 2010 | ||||||||||||||||
| Total Carrying Value |
Quoted Prices in Active Markets (Level 1) |
Using Significant Other Observable Inputs (Level 2) |
Using Significant Unobservable Inputs (Level 3) |
|||||||||||||
| Money markets |
$ | 10,001 | $ | 10,001 | $ | — | $ | — | ||||||||
Valuation Techniques
Money Market funds are measured at fair value using unadjusted quoted prices in active markets for identical securities and are classified within Level 1 of the valuation hierarchy.
| 10. | STOCKHOLDER’S EQUITY |
The Company has two classes of capital stock: common and preferred. As of December 31, 2008, the Company had 41,666,667 shares of common stock authorized and 27,227,668 shares of preferred stock authorized, of which 26,227,668 shares were designated Series A convertible preferred stock. At the Company’s special shareholders’ meeting on December 9, 2009, an amendment was approved to the Company’s Third Amended and Restated Certificate of Incorporation to increase the authorized shares of its common stock from 41,666,667 to 75,000,000, the amount reflected on the Company’s balance sheets as of December 31, 2009 and 2010. At December 31, 2010, 3,691,667 shares of common stock were authorized for issuance under the Company’s Amended and Restated 2000 Stock Option and Incentive Plan.
On April 17, 2007, the Company entered into a multi-year polysilicon supply agreement with OCI under which OCI will supply the Company with polysilicon at fixed prices which began in late 2008 and continuing through 2014. Concurrent with the execution of the silicon supply agreement, OCI purchased 500,000 shares of the Company’s common stock at the then current market value. In addition the company issued an additional 1.79 million shares of transfer restricted common stock. The restrictions on the common stock would lapse upon the delivery of 500 metric tons of silicon to the Company by OCI. Issuance of the restricted shares represented a prepayment of inventory cost valued at approximately $119.9 million, based on the issuance date market price of the Company’s common shares adjusted for a discount to reflect the transfer restriction, and is being amortized as an additional cost of inventory as silicon is delivered by OCI and utilized by the Company. During the first quarter of 2010, OCI surpassed the 500 metric ton milestone at which time the restriction lapsed. In conjunction with the lapse the Company recorded an additional cost of inventory of approximately $1.0 million equal to the value of the discount associated with the restriction.
F-23
Table of Contents
On February 15, 2008, the Company closed a public offering of 3.1 million shares of its common stock, which included the exercise of an underwriter’s option to purchase 400,000 additional shares. The shares of common stock were sold at a per share price of $57.00 (before underwriting discounts). The net proceeds to the Company from the public offering were approximately $166.7 million.
On May 28, 2009, the Company completed a public offering of 7.1 million shares of its common stock. The shares of common stock were sold at a per share price of $10.80 (before underwriting discounts). Proceeds to the Company from the public offering were approximately $72.4 million, net of reimbursed legal fees and the underwriter’s discount of approximately $3.7 million.
Common Stock Lending Agreement
Concurrent with the offering and sale of the Senior Notes on June 26, 2008, the Company entered into a common stock lending agreement (the “Common Stock Lending Agreement”) with Lehman Brothers International (Europe) (the “Common Stock Borrower”), an affiliate of the lead underwriter for the Senior Notes offering, pursuant to which the Company loaned 5,142,757 shares of its common stock (the “Borrowed Shares”) to the Common Stock Borrower. The Common Stock Borrower offered the 5,142,757 shares in a separate registered offering. The Common Stock Borrower received all of the proceeds from the sale of the borrowed common stock. In consideration for the issuance of the Borrowed Shares, the Common Stock Borrower paid the Company a nominal loan fee. In the Common Stock Lending Agreement, the Common Stock Borrower agreed to deliver to the Company 5,142,757 shares of its common stock upon the earliest of (i) July 15, 2013, (ii) the Company’s election, at such time that the entire principal amount of the Senior Notes ceases to be outstanding, (iii) the mutual agreement of the Company and the Common Stock Borrower, (iv) the Company’s election, upon a default by the Common Stock Borrower, and (v) the Common Stock Borrower’s election, at any time. The obligations of the Common Stock Borrower under the Common Stock Lending Agreement are guaranteed by the parent company of the lead underwriter, Lehman Brothers Holdings Inc.
These shares were considered issued and outstanding for corporate law purposes at the time they were loaned; however, at the time of the loan they were not considered outstanding for the purpose of computing and reporting earnings per share because these shares were to be returned to the Company no later than July 15, 2013, the maturity date of the Senior Notes. On September 15, 2008, the parent company of the lead underwriter filed for protection under Chapter 11 of the federal Bankruptcy Code and the Common Stock Borrower was placed into administration proceeding in the United Kingdom shortly thereafter. As a result of the bankruptcy filing and the administration proceeding, the Common Stock Lending Agreement automatically terminated and the Common Stock Borrower was contractually required to return the shares to the Company or the value of the shares in cash. The Company has since demanded the immediate return of all outstanding borrowed shares or the cash equivalent value, however, the shares have not yet been returned and no payment has been made.
In October 2009, the FASB updated the Debt topic of the FASB codification that amends the topic to expand accounting and reporting guidance for own-share lending arrangements issued in contemplation of the issuance of convertible debt. The guidance requires an entity that enters into an equity-classified share lending agreement, utilizing its own shares, in contemplation of a convertible debt issuance or other financing to initially measure the share lending arrangement at fair value and treat it as a cost of the financing. This issuance cost would be amortized over the term of the underlying financing arrangement as interest cost. Upon the adoption of this guidance effective January 1, 2010, the Company was required to retrospectively recognize issuance costs of approximately $5.1 million which are being amortized over the five year period of the Senior Notes.
Also under the new guidance, shares loaned in a share lending arrangement would be excluded from the issuer’s calculation of basic and diluted earnings per share unless a default of the share lending arrangement occurs at which time the loaned shares would be included in the earnings per share calculation. If it becomes probable that the counterparty to the arrangement will default, the issuer shall recognize an expense for the fair value of the unreturned shares, net of probable recoveries, with an offset to additional paid in capital. While the
F-24
Table of Contents
Company believes it is exercising all of its legal remedies, it has included the 5,142,757 shares in its per share calculation on a weighted average basis due to the uncertainty regarding the recovery of the borrowed shares and recorded a retrospective charge of approximately $140.7 million for the period ended September 27, 2008 with a corresponding offset to additional paid-in capital.
| 11. | STOCK BASED COMPENSATION |
The following table presents stock-based compensation expense included in the Company’s consolidated statements of operations for the years ended December 31 (in thousands):
| For the Years ended December 31, | ||||||||||||
| 2008 | 2009 | 2010 | ||||||||||
| Cost of revenue |
$ | 1,214 | $ | 1,785 | $ | 844 | ||||||
| Research and development expenses |
1,538 | 1,415 | 695 | |||||||||
| Selling, general and administrative expenses |
3,548 | 3,167 | 2,209 | |||||||||
| Facility start-up |
946 | 302 | 578 | |||||||||
| $ | 7,246 | $ | 6,669 | $ | 4,326 | |||||||
Stock-based compensation costs capitalized as part of the construction costs of the Company’s Devens manufacturing facility were approximately $447,000, $112,000 and $0 for the years ended December 31, 2008, 2009 and 2010, respectively.
Stock Incentive Plans
The Company is authorized to issue up to 3,691,667 shares of common stock pursuant to its Amended and Restated 2000 Stock Option and Incentive Plan (the “2000 Plan”), of which 2,185,151 shares are available for future issuance or future grant as of December 31, 2010. The purpose is to incent employees and other individuals who render services to the Company by providing opportunities to own stock in the Company. The 2000 Plan authorizes the issuance of incentive stock options, nonqualified stock options, restricted stock awards, stock appreciation rights, performance units and performance shares. All awards granted will expire 10 years from their date of issuance. Incentive stock options and restricted stock awards generally have a four-year vesting period from their date of issuance and nonqualified options generally vest immediately upon their issuance.
Stock option activity under the 2000 Plan is summarized as follows:
| Shares | Weighted- Average Exercise Price |
|||||||
| (in thousands) | ||||||||
| Outstanding at January 1, 2008 |
698 | $ | 26.58 | |||||
| Granted |
— | — | ||||||
| Exercised |
(74 | ) | 14.28 | |||||
| Forfeited |
(10 | ) | 38.64 | |||||
| Outstanding at December 31, 2008 |
614 | 27.90 | ||||||
| Granted |
146 | 13.44 | ||||||
| Exercised |
(5 | ) | 10.86 | |||||
| Forfeited |
(73 | ) | 25.20 | |||||
| Outstanding at December 31, 2009 |
682 | 25.20 | ||||||
| Granted |
42 | 7.38 | ||||||
| Exercised |
— | — | ||||||
| Forfeited |
(448 | ) | 20.34 | |||||
| Outstanding at December 31, 2010 |
276 | $ | 30.42 | |||||
F-25
Table of Contents
The following table summarizes information about stock options outstanding at December 31, 2010:
| Range
of |
Number Outstanding |
Options Outstanding | Options Exercisable | |||||||||||||||||||||
| Weighted Average Remaining Contractual Life (Years) |
Weighted Average Exercise Price |
Number Exercisable |
Weighted Average Exercise Price |
|||||||||||||||||||||
| (in thousands) | (in thousands) | |||||||||||||||||||||||
| $ 7.14 |
$ | 10.08 | 24 | 8.41 | $ | 7.44 | 9 | $ | 7.92 | |||||||||||||||
| 12.00 |
12.00 | 45 | 2.88 | 12.00 | 45 | 12.00 | ||||||||||||||||||
| 12.48 |
12.60 | 1 | 2.79 | 12.54 | 1 | 12.54 | ||||||||||||||||||
| 13.44 |
13.44 | 74 | 8.41 | 13.44 | 19 | 13.44 | ||||||||||||||||||
| 13.92 |
20.16 | 30 | 3.12 | 17.40 | 30 | 17.40 | ||||||||||||||||||
| 25.02 |
43.80 | 36 | 3.98 | 36.72 | 36 | 36.72 | ||||||||||||||||||
| 45.54 |
56.22 | 29 | 4.75 | 52.44 | 29 | 52.44 | ||||||||||||||||||
| 60.00 |
75.90 | 17 | 4.52 | 70.32 | 17 | 70.32 | ||||||||||||||||||
| 83.82 |
83.82 | 2 | 5.07 | 83.82 | 2 | 83.82 | ||||||||||||||||||
| 90.54 |
90.54 | 25 | 5.15 | 90.54 | 25 | 90.54 | ||||||||||||||||||
| 283 | 5.49 | $ | 30.42 | 213 | $ | 36.78 | ||||||||||||||||||
There was no aggregate intrinsic value of vested outstanding options as of December 31, 2009 or 2010. The aggregate intrinsic value of outstanding options as of December 31, 2008 was $3.2 million, all of which relates to options that were vested. The intrinsic value of options exercised during the years ended December 31, 2008, 2009 and 2010 were approximately $4.3 million, $18,000 and $0, respectively. The weighted average grant-date fair value of stock options granted during the years ended December 31, 2009 and 2010 was $11.16 and $7.38, respectively. No options were granted during 2008. As of December 31, 2010, there was $505,000 of total unrecognized compensation cost related to unvested stock options granted under the Company’s stock plans. That cost is expected to be recognized over a weighted-average period of 2.3 years. Total cash received from the exercise of stock options was approximately $1.1 million, $50,000 and $0 for the years ended December 31, 2008, 2009 and 2010, respectively.
The Company estimates the fair value of stock options using the Black-Scholes valuation model. Key input assumptions used to estimate the fair value of stock options include the exercise price of the award, the expected option term, the expected volatility of the Company’s stock over the option’s expected term, the risk-free interest rate over the stock option’s expected term, and the Company’s expected annual dividend yield. The Company believes that the valuation technique and the approach utilized to develop the underlying assumptions are appropriate in calculating the fair values of the Company’s stock options granted for the fiscal years ended December 31, 2009 and 2010. Estimates of fair value are not intended to predict actual future events or the value ultimately realized by persons who receive equity awards. The fair value of each stock option grant is estimated on the date of grant using the Black-Scholes option valuation model with the following assumptions:
| 2009 |
2010 | |||
| Expected options term (years) |
4.5-9.25 | 9.0 | ||
| Risk-free interest rate |
1.31% - 2.08% | 3.80% - 3.91% | ||
| Expected dividend yield |
None | None | ||
| Volatility |
102% - 127% | 104% |
The Company’s expected option term assumption was determined using historical activity for estimating the expected option life. The expected stock volatility factor was determined using historical daily price changes of the Company’s common stock. The Company bases the risk-free interest rate that is used in the stock option valuation model on U.S. Treasury securities issued with maturities similar to the expected term of the options. The Company does not anticipate paying any cash dividends in the foreseeable future and therefore uses an
F-26
Table of Contents
expected dividend yield of zero in the option valuation model. The Company estimates forfeitures at the time of grant and revises those estimates in subsequent periods if actual forfeitures differ from those estimates. There were 41,667 options granted for the year ended December 31, 2010.
The Company values restricted stock units and restricted stock awards at the grant date fair value of the underlying shares, adjusted for expected forfeitures. Restricted stock activity is summarized as follows:
| Shares | Weighted- Average Grant Date Fair Value |
|||||||
| (in thousands) | ||||||||
| Outstanding at January 1, 2008 |
473 | $ | 66.12 | |||||
| Granted |
116 | 55.26 | ||||||
| Vested |
(57 | ) | 48.72 | |||||
| Forfeited |
(11 | ) | 63.84 | |||||
| Outstanding at December 31, 2008 |
521 | 65.64 | ||||||
| Granted |
144 | 11.58 | ||||||
| Vested |
(82 | ) | 10.44 | |||||
| Forfeited |
(111 | ) | 50.28 | |||||
| Outstanding at December 31, 2009 |
472 | 62.34 | ||||||
| Granted |
424 | 4.62 | ||||||
| Vested |
(92 | ) | 6.42 | |||||
| Forfeited |
(324 | ) | 42.12 | |||||
| Outstanding at December 31, 2010 |
480 | $ | 35.82 | |||||
Included in the outstanding restricted shares are 66,667 shares of performance-based restricted stock. The Company granted an additional 20,834 shares of performance-based restricted stock to a Company executive officer in July 2010 which were since reacquired by the Company upon the officer’s resignation.
The Company granted 133,334 shares of performance-based restricted stock to the Company’s executive officers in February 2007 and 16,667 to an executive officer in July 2007 which immediately vest upon the achievement of (a) $400 million in annual revenue, such revenue to include 100% of the Company’s revenue and the Company’s pro rata share of any joint venture revenue, (b) 35% gross margin and (c) 10% net income, as adjusted for the results of any joint venture, achieved in one fiscal year prior to January 1, 2012. Of the performance-based restricted stock issued in 2007, 83,334 shares were since reacquired by the Company upon employee terminations.
Also, in February 2006, the Company granted 133,334 shares of performance-based restricted stock to the Company’s executive officers which would have immediately vested upon the achievement of (a) $300 million in annual revenue, such revenue to include 100% of the Company’s revenue and the Company’s pro rata share of any joint venture revenue, (b) 35% gross margin and (c) 7% net income, as adjusted for the results of any joint venture, achieved in one fiscal year prior to January 1, 2011. All of the 2006 performance-based restricted shares have since been reacquired by the Company as a result of employee terminations and expiration of the performance period.
As of December 31, 2010, the Company has assumed that none of the remaining performance-based awards will vest and accordingly has not provided for compensation expense associated with the awards. The Company periodically evaluates the likelihood of reaching the performance requirements and will be required to recognize $3.4 million of compensation expense associated with these performance-based awards if such remaining awards should vest.
F-27
Table of Contents
As of December 31, 2010, there was $3.5 million of unrecognized compensation expense related to unvested restricted stock awards (excluding performance-based awards that the Company has assumed will not vest) under the Company’s stock plans which is expected to be recognized over a weighted-average period of 1.1 years. The aggregate intrinsic value of outstanding restricted stock awards, including performance based awards, as of December 31, 2010 was $1.7 million. During the years ended December 31, 2008, 2009, and 2010, approximately 56,500, 81,334 and 91,667 shares of restricted stock vested, respectively, with an aggregate vest-date fair value of approximately $2.8 million, $849,000 and $589,000, respectively.
| 12. | WRITE-OFF OF LOAN RECEIVABLE FROM SILICON SUPPLIER |
On December 7, 2007, the Company entered into a multi-year silicon supply agreement with Silpro. This supply agreement provided the general terms and conditions pursuant to which Silpro would supply the Company with specified annual quantities of silicon at fixed prices beginning in 2010 and continuing through 2019. In connection with the supply agreement, the Company agreed to loan Silpro 30 million Euros at an interest rate of 3.0% compounded annually. The difference between this rate and prevailing market rates at that time was recorded as an adjustment to the cost of inventory. In April 2009, as a result of its inability to obtain additional financing to continue construction of its factory, Silpro announced that the French commercial court ordered the filing for judicial settlement proceedings (redressement judiciaire), a process similar to bankruptcy proceedings in the United States. As a result, the loan receivable from Silpro and the related interest will not be repaid and the Company recognized a non-cash charge of $43.9 million. In August 2009, the court ordered liquidation proceedings (liquidation judiciaire) due to Silpro’s inability to secure further financing.
The supply agreement with Silpro was dependent upon the construction of a silicon production plant by Silpro which would have allowed it to deliver silicon to the Company under the terms of the agreement. As a result of the court ordered liquidation proceedings, the Company does not believe that Silpro has the ability to perform under the agreement (i.e., produce and deliver silicon to the Company) which the Company believes effectively eliminated any of its future obligations under this agreement.
| 13. | FACILITY START-UP COSTS |
In preparing for the operations of its Devens, Massachusetts, Midland, Michigan and Wuhan, China facilities, the Company incurred start-up costs of approximately $30.6 million, $10.1 million and $18.4 million for the years ended December 31, 2008, 2009 and 2010, respectively. Facility start-up costs include salaries and personnel related costs, consulting costs, consumable material costs, and other miscellaneous costs associated with preparing and qualifying the facilities for production. Construction on the facility in Devens began in September 2007 with the first solar panels produced late in the third quarter of 2008. Construction of the facility in Midland began during the third quarter of 2008 with the first production runs beginning in the fourth quarter of 2009. Planning for its facility in China, which started preliminary operations during July 2010, began during the second quarter of 2009.
| 14. | ASSET IMPAIRMENTS AND RESTRUCTURING CHARGES |
Impairment of Prepaid Inventory and Long-Lived Assets
Although production costs at the Company’s Devens facility have steadily declined, the Company experienced significant decreases in the average selling prices of its products during the latter part of December 2010, and associated negative gross margin. Further price declines are projected for 2011 and beyond, and the Company does not believe it will be able to reduce its Devens production costs enough to assure profitable sales from this facility. Consequently, as discussed in Note 1, the Company announced its decision to close the Devens facility completely by the end of the 2011 first quarter. As a result of the announced shutdown of the Devens facility, the Company performed an impairment analysis for all of its long-lived assets. The Company has determined that, for purposes of determining whether an impairment exists, all long-lived assets should be considered together since cash flows from those assets are not separately identifiable and independent. The
F-28
Table of Contents
impairment analysis requires the Company to compare its asset values to the undiscounted net operating cash flow over the assets’ remaining useful lives. If such a test indicates that an impairment exists, then the assets are written down to their estimated fair value which is treated as a permanent reduction in the carrying amount of the assets and an operating loss recognized. In determining fair value, the Company referred to a combination of third party appraisals, estimates from brokers, estimates of scrap value and other value measures consistent with the highest and best use for the various assets. This represents the Company’s best estimate of fair value and is subject to change based on the final disposition of the assets. The Company plans to continue utilizing the Wuhan and Midland facilities; and based on the fact that they were only recently completed, the Company has concluded that the current carrying values for these facilities approximates fair value. Based on the analysis, the Company recorded an impairment charge of approximately $303 million.
In addition, the Company recorded an incremental non-cash charge of approximately $74.5 million in the fourth quarter of 2010 related to accelerated amortization of a portion of its prepaid cost of inventory (see Note 3).
Restructuring Charges
On December 31, 2008, the Company ceased production at its Marlboro pilot manufacturing facility as part of its restructuring plan to lower overhead costs and reduce overall cash requirements. Ongoing R&D activities continue to be performed at the Company’s research and development facility in Marlboro. At that time, the Marlboro pilot manufacturing facility employees were transferred to the Devens manufacturing facility. Charges recorded for the year ended December 31, 2008 were comprised of leasehold improvements and other related building costs of $5.4 million, equipment of approximately $20.9 million, inventory and spare parts of $3.9 million, and salaries and personal costs associated with severance of approximately $0.2 million.
During the fourth quarter of 2009, the Company’s Board of Directors approved a plan to accelerate the Company’s strategic initiative of focusing on its unique wafer manufacturing technology by transitioning its Devens, Massachusetts based panel assembly to China beginning in 2010. The Company expects to reduce manufacturing costs associated with panel assembly once the transition is completed. For the year ended December 31, 2009 the Company recorded costs of approximately $11.9 million primarily for accelerated depreciation of its panel assembly equipment in addition to severance to terminated employees, rent and utilities, and professional fees and support costs associated with closure of the Marlboro facility. The Company continued to incur occupancy, support and moving costs through the end of the lease term which expired during the third quarter of 2010.
For the year ended December 31, 2010 the Company recorded costs of approximately $18.3 million comprised primarily of accelerated depreciation of panel assembly equipment and, to a lesser extent, professional fees and on-going occupancy and support costs for its Marlboro pilot manufacturing facility.
| 15. | INCOME TAXES |
Income taxes computed using the federal statutory income tax rate differ from the Company’s effective tax rate primarily due to the following for the years ended December 31 (in thousands):
| 2008 | 2009 | 2010 | ||||||||||
| Income tax benefit at U.S. federal statutory tax rate |
$ | (77,781 | ) | $ | (93,265 | ) | $ | (158,185 | ) | |||
| State income taxes, net of federal tax effect |
(18,487 | ) | (20,949 | ) | (24,209 | ) | ||||||
| Permanent items |
57,690 | 284 | 4,345 | |||||||||
| Other items—tax credits, expiration of NOL's, other |
(288 | ) | 2,591 | (360 | ) | |||||||
| Change in deferred tax asset valuation allowance |
38,866 | 103,249 | 178,409 | |||||||||
| $ | — | $ | (8,090 | ) | $ | — | ||||||
F-29
Table of Contents
As of December 31, 2010, the Company had federal and state net operating loss carryforwards of approximately $474.2 million and $406.8 million, respectively, available to reduce future taxable income which begin to expire in 2011. In addition, the Company has excess tax deductions related to equity compensation of approximately $24.4 million of which the benefit will be realized when it results in a reduction of taxable income in accordance with the Stock Compensation topic of the FASB codification. The Company also had federal and state research and development tax credit carryforwards of approximately $3.4 million and $1.7 million, respectively, which begin to expire in 2011 and 2018, and state investment tax credit carryforwards of approximately $13.0 million which begin to expire in 2011, available to reduce future tax liabilities. The Company’s state investment tax credits are subject to reduction if the underlying assets that generated the credits are either disposed or sold during the assets’ useful life which ranges from 4 years to 15 years.
Under the provisions of Section 382 of the Internal Revenue Code, certain substantial changes in the Company’s ownership could result in an ownership change, as defined. Such changes, which could include a recapitalization of the Company, may result in a limitation on the amount of net operating loss carryforwards, research and development credit carryforwards and certain other tax attributes that can be used in future years to offset taxable income.
Management of the Company has evaluated the positive and negative evidence bearing upon the realization of its deferred tax assets. Management has considered the Company’s history of losses and, in accordance with the applicable accounting standards, has fully reserved the deferred tax asset.
Deferred tax assets consist of the following at December 31, 2009 and 2010, respectively (in thousands):
| 2009 | 2010 | |||||||
| Gross deferred tax assets |
||||||||
| Net operating loss carryforwards |
$ | 138,877 | $ | 182,834 | ||||
| Research and development credit carryforwards |
11,629 | 11,129 | ||||||
| Capitalized R&D expenses |
19,995 | 17,834 | ||||||
| Accrued expenses and deferred compensation |
4,547 | 5,300 | ||||||
| Basis difference in capped call |
12,453 | 10,380 | ||||||
| Reserve on receivables from Sovello AG |
21,323 | — | ||||||
| Depreciation |
— | 96,984 | ||||||
| China net operating loss carryforwards |
— | 3,608 | ||||||
| FTC, China withholding tax |
— | 138 | ||||||
| Capital loss carryforwards |
— | 4,157 | ||||||
| Other, net |
4,146 | 35,144 | ||||||
| Total gross deferred tax assets |
212,970 | 367,508 | ||||||
| Less: gross deferred tax liabilities |
||||||||
| Depreciation |
(15,885 | ) | — | |||||
| Basis difference in convertible debt |
(22,399 | ) | (10,941 | ) | ||||
| Deferred tax asset valuation allowance |
(174,686 | ) | (356,567 | ) | ||||
| Net deferred tax assets |
$ | — | $ | — | ||||
On January 1, 2007 the Company adopted the provisions related to uncertain tax positions under the Income Tax topic of the FASB codification. As a result of the implementation of this guidance, there was no adjustment to accumulated deficit or the liability for uncertain tax positions. The Company has approximately $2.3 million of reserves related to uncertain tax positions on research and development tax credits as of December 31, 2010. The Company is in the process of completing a study of its research and development tax credits which could result in additional charges to these credits. Since a full valuation allowance has been provided against these carryforwards, any adjustment to the carry forwards upon completion of the study would be offset by a corresponding reduction to the valuation allowance.
F-30
Table of Contents
A reconciliation of the Company’s gross changes to uncertain tax positions for the years ended December 31 is as follows (in thousands):
| 2008 | 2009 | 2010 | ||||||||||
| Balance at beginning of year |
$ | — | $ | 1,995 | $ | 2,095 | ||||||
| Additions based on current year tax positions |
141 | 80 | 73 | |||||||||
| Additions based on prior year tax positions |
1,854 | 20 | 88 | |||||||||
| Balance at end of year |
$ | 1,995 | $ | 2,095 | $ | 2,256 | ||||||
Interest and penalty charges, if any, related to unrecognized tax benefits would be classified as income tax expense in the accompanying statement of operations. At December 31, 2009 and December 31, 2010 the Company had no accrued interest or penalties related to uncertain tax positions. In many cases, the Company’s uncertain tax positions are related to tax years that remain subject to examination by relevant tax authorities. Since the Company is in a loss carryforward position, the Company is generally subject to examination by the U.S. federal, state and local income tax authorities for all tax years in which a loss carryforward is available.
In prior periods as a result of additional investments made in Sovello by the Company’s strategic partners in 2006 and 2007, the Company recorded a deferred income tax liability of $7.4 million associated with the gains recognized from these additional investments, in addition to cumulative translation adjustments. The corresponding amounts were included in shareholders equity. During the year ended December 31, 2009 the Company recorded a $8.1 million income tax benefit in its statement of operations as a result of the impairment charge recorded against the book basis of its investment in Sovello (see Note 5). This income tax benefit arose from the reversal of the previously recorded deferred income tax liability.
| 16. | NET LOSS PER COMMON SHARE |
The Company computes net loss per common share in accordance with the Earning Per Share topic of the FASB codification. Under the guidance, basic net loss per common share is computed by dividing net loss by the weighted average number of common shares outstanding during the period. The calculation of diluted net loss per common share for the years ended December 31, 2008, 2009 and 2010 does not include approximately 6.4 million, 6.3 million and 18.7 million potential shares of common stock equivalents outstanding at December 31, 2008, 2009 and 2010, respectively, as their inclusion would be anti-dilutive. Common stock equivalents include outstanding common stock options, unvested restricted stock awards, common stock warrants and convertible debt.
In connection with the sale of Senior Notes on June 26, 2008, the Company entered into a common stock lending agreement with an affiliate of the lead underwriter pursuant to which the Company loaned 5,142,757 shares of its common stock to the affiliate (see Note 10). These shares were considered issued and outstanding for corporate law purposes at the time they were loaned; however, at the time of the loan they were not considered outstanding for the purpose of computing and reporting earnings per share because these shares were to be returned to the Company no later than July 15, 2013, the maturity date of the Senior Notes. On September 15, 2008 and October 3, 2008, respectively, Lehman Brothers Holdings Inc., the parent company of the lead underwriter filed for protection under Chapter 11 of the federal Bankruptcy Code and the lead underwriter’s affiliate was placed into administration in the United Kingdom. As a result of the bankruptcy filing and the administration, the lead underwriter’s affiliate was contractually required to return the shares to the Company. The Company has since demanded the immediate return of all outstanding borrowed shares, however, the shares have not yet been returned. While the Company believes it is exercising all of its legal remedies, it has included these shares in its basic and diluted per share calculation on a weighted average basis due to the uncertainty regarding the recovery of the borrowed shares.
F-31
Table of Contents
| 17. | GEOGRAPHICAL AND CUSTOMER CONCENTRATION OF INFORMATION |
Product revenues are attributed to regions based on the location of customers purchasing the products directly from the Company. The company has historically relied on a small number of customers for a substantial portion of its business and generally does not require collateral or other security against its accounts receivable; however, when deemed necessary it maintains reserves for potential credit losses. This customer concentration increases the Company’s exposure to credit risk since the financial insolvency of any of these customers could have a significant impact on the Company’s liquidity and results of operations. The following table summarizes the Company’s geographical and customer concentration of total product revenue for the years ended December 31:
| For the Years Ended December 31, |
||||||||||||
| 2008 | 2009 | 2010 | ||||||||||
| By geography: |
||||||||||||
| United States |
58 | % | 26 | % | 15 | % | ||||||
| Germany |
28 | % | 52 | % | 61 | % | ||||||
| Czechoslovakia |
— | 2 | % | 12 | % | |||||||
| All other |
14 | % | 20 | % | 12 | % | ||||||
| 100 | % | 100 | % | 100 | % | |||||||
| By customer: |
||||||||||||
| IBC Solar AG |
4 | % | 17 | % | 26 | % | ||||||
| Ralos Vertriebs GmbH |
15 | % | 15 | % | — | |||||||
| Wagner & Co. Solartechnik GmbH |
1 | % | 14 | % | 15 | % | ||||||
| SunPower Corporation |
31 | % | — | — | ||||||||
| Donauer Solartechnik Vertriebs GmbH |
— | 5 | % | 12 | % | |||||||
| NWT a.s. |
— | 2 | % | 12 | % | |||||||
| All other |
49 | % | 47 | % | 35 | % | ||||||
| 100 | % | 100 | % | 100 | % | |||||||
| 18. | RELATED PARTY TRANSACTIONS |
As a result of the Company’s sale of its investment in Sovello on April 21, 2010, neither Sovello nor REC are considered related parties subsequent to that date. In the normal course of business, the Company purchases silicon from REC and OCI under existing supply agreements. For the years ended December 31, 2008, 2009 and 2010 the Company purchased silicon from REC for approximately $3.2 million, $3.6 million and $792,000, respectively. For the years ended December 31, 2008, 2009 and 2010 the Company purchased silicon from OCI for approximately $9.2 million, $29.2 million and $33.0 million, respectively. As of December 31, 2009 and 2010 the Company had $360,000 and $0 outstanding to REC. As of December 31, 2009 and 2010 the Company had $1.4 million and $4.8 million outstanding to OCI, respectively.
Prior to 2010, the Company earned fees from Sovello for its marketing and sale of Sovello panels, as well as management of customer relationships and contracts, and royalty payments for its technology contribution to Sovello, which combined totaled approximately $16.7 million and $4.7 million for the years ended December 31, 2008 and 2009. The Company also received payments from Sovello as a reimbursement of certain research and development and other support costs it incurred that benefited Sovello. For the year ended December 31, 2008 and 2009, these costs totaled $384,000 and $17,000, respectively. In addition, during the normal course of operations, the Company may have purchased from or sold materials to Sovello. For the years ended December 31, 2008 and 2009 the Company purchased $280,000 and $134,000, in materials from Sovello, respectively, and sold $425,000 and $38,000, in materials to Sovello, respectively. At December 31, 2009 amounts due to Sovello of $17.5 million (including amounts associated with certain guarantees and undertakings)
F-32
Table of Contents
are included in the accompanying consolidated balance sheet. In connection with the closing of the sale of Sovello to Ventizz in April 2010, the Company satisfied its remaining obligations (see Note 5).
As part of the sale of the Company’s one-third investment in Sovello during the second quarter of 2010, it negotiated a new license agreement under which Sovello agreed to pay the Company $2.0 million in royalties in 2010 and approximately $3.0 million in each of the subsequent 2 years for the capacity that exists at Sovello. As a result, the Company has recognized $2.0 million of royalty revenue for the year ended December 31, 2010. In addition, as part of the settlement of the sale of Sovello, the Company received approximately $2.4 million of royalty payments associated with the fourth quarter of 2009 which were not previously recognized due to the substantial doubt that existed at that time regarding Sovello’s ability to settle the amount.
| 19. | EMPLOYEE STOCK PURCHASE PLAN |
In September 2000, the Company’s Board of Directors adopted an Employee Stock Purchase Plan (“the ESPP”). Under the ESPP, eligible employees of the Company who elect to participate are granted options to purchase common stock at a 15% discount from the market value of such stock. At its 2005 Annual Meeting of Stockholders held on July 15, 2005, the Company’s stockholders approved a resolution which amended the ESPP to include the following material changes: (i) an increase to 83,334 in the number of shares of the Company’s common stock that may be issued under the 2000 ESPP, (ii) the elimination of the 5-share purchase limitation for each participant for a Purchase Period and the addition of a provision that instead would allow the Compensation Committee to establish a limit for each Purchase Period in its discretion and (iii) addition of a provision to give the Compensation Committee discretion to prospectively increase the discount to purchase shares under the 2000 ESPP. In February 2009, the Compensation Committee established a limit for each Purchase Period of 84 shares per employee which was in effect for both 2009 Purchase Periods. At its 2010 Annual Meeting of Stockholders held on July 27, 2010, the Company’s stockholders approved a resolution which amended the ESPP to increase the number of shares of the Company’s common stock that may be issued under the 2000 ESPP to 250,000 shares.
During the year ended December 31, 2010, employees paid the company approximately $96,000 to purchase approximately 20,500 shares of common stock and the Company recognized approximately $34,000 of compensation expense related to this ESPP activity. Compensation expense was calculated using the fair value of the employees’ purchase rights under the Black-Scholes valuation model. As of December 31, 2010, there were approximately 84,167 shares issued under the ESPP since its inception and approximately 165,834 shares of common stock available and reserved for future issuance or future grant under the ESPP.
| 20. | WARRANTS |
In connection with the Company’s Common Stock Private Placement consummated on June 21, 2004, the Company issued warrants to purchase up to 383,142 shares of its common stock to the investors participating in the financing as well as a warrant to purchase 20,834 shares of common stock to CRT Capital Group LLC, as compensation for CRT Capital Group’s services as the placement agent for the Common Stock Private Placement. The terms of the placement agent warrant are identical to the terms of the warrants issued to the investors participating in the Common Stock Private Placement. The warrants entitled the holders to shares of the Company’s common stock at an exercise price of $20.04. The warrants were exercisable at any time prior to June 22, 2009. During the period ended December 31, 2009, no holders of warrants associated with the Company’s Common Stock Private Placement exercised their warrants to purchase shares of the Company’s common stock. No warrants remain exercisable.
| 21. | EMPLOYEES’ SAVINGS PLAN |
The Company established a 401(k) plan in 1996 for eligible employees. Under the provisions of the plan, eligible employees may voluntarily contribute a portion of their compensation up to the statutory limit. The Company’s 401(k) plan provides a matching contribution of 100% of participating employee contributions, up to
F-33
Table of Contents
a maximum of $750 per year. The Company made matching contributions of $219,000, $233,000 and $259,000 to participating employees during the fiscal years ended December 31, 2008, 2009, and 2010, respectively.
| 22. | LEASES |
On March 13, 2000, the Company entered into a ten year lease commencing July 1, 2000, for office and manufacturing space in Marlboro, Massachusetts. Pursuant to the terms of the lease agreement, the Company paid annual rent ranging from $464,000 in the first year to $534,000 during the last year of the lease which expired during 2010 and was not renewed.
On January 24, 2004, the Company entered into a six and one-half year lease for additional office and warehouse space in Marlboro, Massachusetts. The lease was amended in December 2004 and September 2007 to assume more office space beginning in 2005 and 2007, respectively, in consideration for a small increase in rent. In November 2010, the office lease was extended for an additional thirty six months and the Company was released from all obligations under the warehouse lease. Pursuant to the terms of the new lease agreement, the Company will pay annual rent of approximately $81,000.
In January 2006, the Company entered into a seven year lease for additional space dedicated mainly to research and development in Marlboro, Massachusetts. Pursuant to the terms of the lease agreement, the Company will pay annual rent ranging from $94,000 in the first year to $171,000 during the last year of the lease. In connection with leasing this additional space, the landlord agreed to provide the Company with an incentive towards build-out costs of approximately $400,000 which the Company has included as a deferred credit to be amortized over the remaining term of the lease.
In July 2006, the Company entered into a six and one-half year lease for expansion of additional space dedicated mainly to research and development in Marlboro, Massachusetts. Pursuant to the terms of the lease agreement, the Company will pay annual rent ranging from $138,000 in the first year to $172,000 during the last year of the lease.
In November 2007, the Company entered into a thirty year lease agreement with the Massachusetts Development Finance Agency to lease approximately 23 acres of land located in Devens, Massachusetts for the construction of a manufacturing facility. The base rent for the property is one dollar per year. The Company may extend the lease term for two ten-year periods at the original base rent and also has the option to purchase the property at any time during the initial 30-year term. On or prior to November 20, 2012, the purchase price shall be $2.7 million. After November 20, 2012, the purchase price will be the greater of $2.7 million or the appraised fair market value of the property.
In February 2009, the Company entered into a five year lease agreement for office space in Berlin, Germany. Pursuant to the terms of the lease agreement, the Company will pay annual rent of approximately 64,000 Euros (approximately $85,000 at December 31, 2010 exchange rates).
In November 2009, the Company entered into a two year lease agreement for office space in Wuhan, China. Pursuant to the terms of the lease agreement, the Company will pay annual rent of approximately 191,000 RMB (approximately $29,000 at December 31, 2010 exchange rates).
In February 2010, the Company entered into a ten year lease agreement for manufacturing and warehouse space in Wuhan, China. Pursuant to the terms of the lease agreement, the Company will pay annual rent of approximately 722,000 RMB (approximately $109,000 at December 31, 2010 exchange rates). The annual rent amount will be reviewed every two years and adjusted based upon market conditions, if applicable.
F-34
Table of Contents
The following is a schedule, by year, of future minimum rental payments required under all leases that have remaining non-cancelable lease terms as of December 31, 2010 (in thousands):
| 2011 |
$ | 1,347 | ||
| 2012 |
1,158 | |||
| 2013 |
568 | |||
| 2014 |
118 | |||
| 2015 |
110 | |||
| Thereafter |
461 | |||
| Total |
$ | 3,762 | ||
The Company recognizes rent expense using a straight-line convention. Occupancy expense, which includes rent, property taxes, and other operating expenses associated with all of the Company’s locations, was $1.5 million, $1.5 million and $1.3 million for the years ended December 31, 2008, 2009, and 2010, respectively.
F-35
Table of Contents
| 23. | UNAUDITED QUARTERLY RESULTS |
The following table sets forth unaudited selected financial information for the periods indicated. This information has been derived from unaudited consolidated condensed financial statements, which, in the opinion of management, include all adjustments (consisting only of normal recurring adjustments) necessary for a fair presentation of such information. The Company’s independent auditors have not audited this information. The results of operations for any quarter are not necessarily indicative of the results to be expected for any future period.
QUARTERLY STATEMENT OF OPERATIONS
(In thousands, except per share data)
Unaudited
| Apr 4, 2009 |
Jul 4, 2009 |
Oct 3, 2009 |
Dec 31, 2009 |
Apr 3, 2010 |
Jul 3, 2010 |
Oct 2, 2010 |
Dec 31, 2010 |
|||||||||||||||||||||||||
| Product revenues |
$ | 54,439 | $ | 62,697 | $ | 75,450 | $ | 74,526 | $ | 78,473 | $ | 81,117 | $ | 86,026 | $ | 88,766 | ||||||||||||||||
| Royalty and fee revenues |
1,367 | 1,141 | 2,208 | 20 | — | 3,411 | 497 | 495 | ||||||||||||||||||||||||
| Total revenues |
55,806 | 63,838 | 77,658 | 74,546 | 78,473 | 84,528 | 86,523 | 89,261 | ||||||||||||||||||||||||
| Cost of revenues |
55,122 | 62,628 | 70,092 | 65,642 | 72,424 | 77,292 | 80,009 | 89,704 | ||||||||||||||||||||||||
| Impairment of prepaid inventory |
— | — | — | — | — | — | — | 74,544 | ||||||||||||||||||||||||
| Total cost of revenues |
55,122 | 62,628 | 70,092 | 65,642 | 72,424 | 77,292 | 80,009 | 164,248 | ||||||||||||||||||||||||
| Gross profit (loss) |
684 | 1,210 | 7,566 | 8,904 | 6,049 | 7,236 | 6,514 | (74,987 | ) | |||||||||||||||||||||||
| Operating expenses: |
||||||||||||||||||||||||||||||||
| Research and development |
4,446 | 4,444 | 4,417 | 4,751 | 4,736 | 5,241 | 5,101 | 4,375 | ||||||||||||||||||||||||
| Selling, general and administrative |
6,376 | 6,742 | 5,872 | 7,270 | 7,692 | 7,349 | 13,672 | 7,782 | ||||||||||||||||||||||||
| Write-off of loan receivable from silicon supplier |
43,882 | — | — | — | — | — | — | — | ||||||||||||||||||||||||
| Equipment write-offs |
— | — | — | 6,008 | — | — | — | 410 | ||||||||||||||||||||||||
| Facility start-up |
3,459 | 687 | 2,493 | 3,468 | 3,730 | 5,242 | 5,509 | 3,965 | ||||||||||||||||||||||||
| Impairment of long-lived assets |
— | — | — | — | — | — | — | 302,979 | ||||||||||||||||||||||||
| Restructuring charges |
1,792 | 825 | 777 | 8,546 | 3,981 | 4,874 | 4,925 | 4,563 | ||||||||||||||||||||||||
| Total operating expenses |
59,955 | 12,698 | 13,559 | 30,043 | 20,139 | 22,706 | 29,207 | 324,074 | ||||||||||||||||||||||||
| Operating loss |
(59,271 | ) | (11,488 | ) | (5,993 | ) | (21,139 | ) | (14,090 | ) | (15,470 | ) | (22,693 | ) | (399,061 | ) | ||||||||||||||||
| Other income (expense), net |
||||||||||||||||||||||||||||||||
| Foreign exchange gains (losses), net |
(699 | ) | 1,681 | 2,478 | (810 | ) | (2,244 | ) | (6,935 | ) | 6,334 | (974 | ) | |||||||||||||||||||
| Interest income |
2,213 | 1,341 | 118 | 1,056 | 139 | 1,093 | 380 | 381 | ||||||||||||||||||||||||
| Interest expense |
(5,633 | ) | (6,785 | ) | (7,683 | ) | (7,891 | ) | (7,743 | ) | (10,030 | ) | (11,229 | ) | (11,299 | ) | ||||||||||||||||
| Gain on early extinguishment of debt |
— | — | — | — | — | 24,777 | — | — | ||||||||||||||||||||||||
| Other income (expense), net |
(4,119 | ) | (3,763 | ) | (5,087 | ) | (7,645 | ) | (9,848 | ) | 8,905 | (4,515 | ) | (11,892 | ) | |||||||||||||||||
| Loss before equity income (loss) from interest in Sovello AG, impairment of equity investment and income tax benefit |
(63,390 | ) | (15,251 | ) | (11,080 | ) | (28,784 | ) | (23,938 | ) | (6,565 | ) | (27,208 | ) | (410,953 | ) | ||||||||||||||||
| Equity loss from interest in Sovello AG |
(1,152 | ) | (5,340 | ) | (9,710 | ) | (13,546 | ) | — | — | — | — | ||||||||||||||||||||
| Impairment and other charges associated with equity investment in Sovello AG |
— | — | (69,713 | ) | (56,344 | ) | — | — | — | — | ||||||||||||||||||||||
| Recovery of impairment charges associated with Sovello AG |
— | — | — | — | — | 3,227 | — | — | ||||||||||||||||||||||||
| Income tax benefit |
— | — | (7,805 | ) | (285 | ) | — | — | — | — | ||||||||||||||||||||||
| Net loss |
$ | (64,542 | ) | $ | (20,591 | ) | $ | (82,698 | ) | $ | (98,389 | ) | $ | (23,938 | ) | $ | (3,338 | ) | $ | (27,208 | ) | $ | (410,953 | ) | ||||||||
| Net loss per share basic and diluted |
$ | (2.39 | ) | $ | (0.68 | ) | $ | (2.42 | ) | $ | (2.88 | ) | $ | (0.70 | ) | $ | (0.10 | ) | $ | (0.79 | ) | $ | (11.99 | ) | ||||||||
| Weighted average shares used in computing basic and diluted net loss per share |
26,982 | 30,125 | 34,132 | 34,153 | 34,189 | 34,243 | 34,251 | 34,269 | ||||||||||||||||||||||||
F-36
Table of Contents
| 24. | VALUATION AND QUALIFYING ACCOUNTS |
The following table sets forth activity in the Company’s valuation and qualifying accounts (in thousands):
| Description |
Balance at Beginning of Period |
Charged to Operations |
Deductions | Adoption of New Accounting Standard |
Balance at End of Period |
|||||||||||||||
| Year ended December 31, 2008 |
||||||||||||||||||||
| Reserves and allowances deducted from asset accounts: |
||||||||||||||||||||
| Income tax valuation allowance |
43,390 | 37,731 | 22,567 | (27,907 | ) | 75,781 | ||||||||||||||
| Allowance for doubtful accounts |
85 | (5 | ) | — | — | 80 | ||||||||||||||
| Year ended December 31, 2009 |
||||||||||||||||||||
| Reserves and allowances deducted from asset accounts: |
||||||||||||||||||||
| Income tax valuation allowance |
75,781 | 102,842 | (4,344 | ) | 407 | 174,686 | ||||||||||||||
| Allowance for doubtful accounts |
80 | 45 | (45 | ) | — | 80 | ||||||||||||||
| Year ended December 31, 2010 |
||||||||||||||||||||
| Reserves and allowances deducted from asset accounts: |
||||||||||||||||||||
| Income tax valuation allowance |
174,686 | 178,409 | 3,472 | — | 356,567 | |||||||||||||||
| Allowance for doubtful accounts |
80 | 6,389 | (6 | ) | — | 6,463 | ||||||||||||||
| 25. | SUBSEQUENT EVENTS |
On February 14, 2011 the Company announced the expiration and results of its offer to exchange (i) an aggregate principal amount of up to $100,000,000 of new 4.0% Convertible Subordinated Additional Cash Notes due 2020 (the “New Subordinated Notes”) for an aggregate principal amount of up to $200,000,000 of its existing Senior Notes due 2013, and (ii) an aggregate principal amount of up to $165,000,000 of new 7.5% Convertible Senior Secured Notes due 2017 (the “New Secured Notes”) for an aggregate principal amount of up to $165,000,000 of its existing Secured Notes due 2015, and the related consent solicitation. The exchange offers and consent solicitation expired at 5:00 p.m., New York City time, on February 11, 2011.
As of the expiration date, holders of approximately $45.4 million aggregate principal amount of the existing Senior Notes had tendered, and not withdrawn, existing Senior Notes for exchange. Because the total principal amount of the Senior Notes tendered was less than the maximum amount the Company would accept in the exchange offer for the Senior Notes, all of the existing Senior Notes validly tendered and not withdrawn were accepted for exchange pursuant to the terms of this exchange offer. Based on the modified “Dutch auction” process described in the Company’s Prospectus filed with the Securities and Exchange Commission on February 9, 2011, the clearing exchange ratio for this exchange offer is $500 principal amount of New Subordinated Notes per $1,000 principal amount of exiting Senior Notes. An aggregate principal amount of approximately $203.8 million of existing Senior Notes remains outstanding following the consummation of the exchange offer, and approximately $22.7 million in principal amount of New Subordinated Notes have been issued to holders whose existing Senior Notes were accepted for exchange. The aggregate principal amount of New Subordinated Notes issued to any holder was rounded down to the nearest $1,000 and any fractional portion of New Subordinated Notes was paid in cash. On February 17, 2011 the Company settled the 4% exchange offer and paid in cash all accrued and unpaid interest on the existing Senior Notes accepted for exchange to but excluding the settlement date. The Company will no longer pay interest on any existing Senior Notes that were accepted for exchange, and interest will begin to accrue on the New Subordinated Notes commencing on the settlement date.
Less than $50,000,000 aggregate principal amount of the existing Secured Notes were tendered in this exchange offer. Because the minimum tender and consent conditions were not met, the Company did not accept any existing Secured Notes for exchange and will not amend the indenture governing the existing Secured Notes.
Since the issuance of the New Subordinated Notes, approximately $10.1 million of the New Subordinated Notes have been converted by the holders into approximately 3.9 million shares of the Company’s common stock.
On February 9, 2011 the Company held a special meeting of stockholders at which the stockholders approved an amendment to the Company’s certificate of incorporation to increase its authorized common shares to 240,000,000 from 120,000,000.
F-37
Table of Contents
Pursuant to the requirements of Section 13 or 15(d) of the Securities Exchange Act of 1934, the registrant has duly caused this report to be signed on its behalf by the undersigned on this 9th day of March, 2011, thereunto duly authorized.
| EVERGREEN SOLAR, INC. | ||
| By: |
/s/ MICHAEL EL-HILLOW | |
| Michael El-Hillow | ||
| President, Chief Executive Officer and Director (Principal Executive Officer) | ||
Table of Contents
POWER OF ATTORNEY
KNOW ALL PERSONS BY THERE PRESENTS, that each person whose signature appears below constitutes and appoints Michael El-Hillow and Donald W. Reilly, and each of them his attorneys-in-fact, each with the power of substitution, for him and in his name, place and stead, in any and all capacities, to sign any and all amendments to this Annual Report on Form 10-K with all exhibits thereto and all documents in connection therewith, with the Securities and Exchange Commission, granting unto said attorneys-in-fact and agents, and each of them, full power and authority to do and perform each and every act and thing requisite and necessary to be done in and about the premises, as fully to all intents and purposes as he might or could do in person, hereby ratifying and confirming all that such attorneys-in-fact and agents or any of them, or his or their substitute or substitutes, may lawfully do or cause to be done by virtue hereof.
Pursuant to the requirements of the Securities Exchange Act of 1934, this report has been signed below by the following persons on behalf of the registrant and in the capacities and on the dates indicated.
| Name | Title | Date | ||
| /s/ MICHAEL EL-HILLOW Michael El-Hillow |
President, Chief Executive Officer and Director (Principal Executive Officer) |
March 9, 2011 | ||
| /s/ DONALD W. REILLY Donald W. Reilly |
Chief Financial Officer (Principal Financial and Accounting Officer) |
March 9, 2011 | ||
| /s/ ALLAN H. COHEN Allan H. Cohen |
Director | March 9, 2011 | ||
| /s/ EDWARD C. GRADY Edward C. Grady |
Director | March 9, 2011 | ||
| /s/ DR. PETER W. COWDEN Dr. Peter W. Cowden |
Director | March 9, 2011 | ||
| /s/ TOM L. CADWELL Tom L. Cadwell |
Director | March 9, 2011 | ||
| /s/ DR. SUSAN F. TIERNEY Dr. Susan F. Tierney |
Director | March 9, 2011 | ||
Table of Contents
| Number |
Description |
Incorporation by Reference | ||
| 3.1 | Third Amended and Restated Certificate of Incorporation | Exhibit 3.2 to the Registrant’s Registration Statement on Form S-1/A, filed on October 3, 2000 | ||
| 3.2 | Certificate of Amendment of Third Amended and Restated Certificate of Incorporation | * | ||
| 3.3 | Second Amended and Restated By-laws | Exhibit 3.4 to the Registrant’s Registration Statement on Form S-1/A, filed on October 3, 2000 | ||
| 3.4 | Amendment No. 1 to Second Amended and Restated By-laws | Exhibit 3.1 to the Registrant’s Current Report on Form 8-K, dated February 4, 2009 and filed on February 5, 2009 | ||
| 4.1 | Indenture between the Registrant and U.S. Bank National Association, as Trustee, dated July 2, 2008 | Exhibit 4.1 to the Registrant’s Current Report on Form 8-K, dated July 2, 2008 and filed on July 7, 2008 | ||
| 4.2 | First Supplemental Indenture between the Registrant and U.S. Bank National Association, as Trustee, dated July 2, 2008 | Exhibit 4.2 to the Registrant’s Current Report on Form 8-K, dated July 2, 2008 and filed on July 7, 2008 | ||
| 4.3 | Form of 4% Senior Convertible Note due 2013 | Exhibit 4.2 to the Registrant’s Current Report on Form 8-K, dated July 2, 2008 and filed on July 7, 2008 | ||
| 4.4 | Indenture among the Registrant, the Guarantors and U.S. Bank National Association, as Trustee, dated April 26, 2010 | Exhibit 4.1 to Registrant’s Current Report on Form 8-K, dated April 21, 2010 and filed on April 27, 2010 | ||
| 4.5 | Pledge and Security Agreement among the Registrant, the Guarantors and U.S. Bank National Association, as Collateral Agent, dated April 26, 2010 | Exhibit 4.2 to Registrant’s Current Report on Form 8-K, dated April 21, 2010 and filed on April 27, 2010 | ||
| 4.6 | Collateral Trust Agreement among the Registrant, the Guarantors and U.S. Bank National Association, as Collateral Agent, dated April 26, 2010 | Exhibit 4.3 to Registrant’s Current Report on Form 8-K, dated April 21, 2010 and filed on April 27, 2010 | ||
| 4.7 | Indenture for Subordinated Debt Securities between the Registrant and U.S. Bank National Association, as Trustee, dated February 17, 2011 | Exhibit 4.1 to Registrant’s Current Report on Form 8-K, dated February 17, 2011 and filed on February 17, 2011 | ||
| 4.8 | First Supplemental Indenture between the Registrant and U.S. Bank National Association, as Trustee, dated February 17, 2011 | Exhibit 4.2 to Registrant’s Current Report on Form 8-K, dated February 17, 2011 and filed on February 17, 2011 | ||
| 4.9 | Form of Global New 4% Notes | Exhibit 4.3 to Registrant’s Current Report on Form 8-K, dated February 17, 2011 and filed on February 17, 2011 | ||
| 10.1§ | 1994 Stock Option Plan | Exhibit 10.1 to the Registrant’s Registration Statement on Form S-1, filed on August 4, 2000 | ||
Table of Contents
| Number |
Description |
Incorporation by Reference | ||
| 10.2§ | Amended and Restated 2000 Stock Option and Incentive Plan, effective July 27, 2010 | Exhibit 10.1 to Registrant’s Current Report on Form 8-K, dated July 27, 2010 and filed on August 2, 2010 | ||
| 10.3§ | Amended and Restated 2000 Employee Stock Purchase Plan, effective July 27, 2010 | Exhibit 10.2 to Registrant’s Current Report on Form 8-K, dated July 27, 2010 and filed on August 2, 2010 | ||
| 10.4 | Form of Indemnification Agreement between Registrant and each of its directors and certain executive officers | Exhibit 10.9 to the Registrant’s Registration Statement on Form S-1, filed on August 4, 2000 | ||
| 10.5 | Stockholders Agreement between the Registrant and OCI, dated April 17, 2007 | Exhibit 10.2 to the Registrant’s Current Report on Form 8-K, dated April 17, 2007 and filed on April 17, 2007 | ||
| 10.6† | Supply Agreement between the Registrant and OCI, dated April 17, 2007 | Exhibit 10.3 to the Registrant’s Current Report on Form 8-K/A, dated April 17, 2007 and filed on April 23, 2007 | ||
| 10.7† | Supply Agreement between the Registrant and Wacker Chemie AG, effective August 31, 2007 | Exhibit 10.1 to the Registrant’s Quarterly Report on Form 10-Q for the period ended September 30, 2007, filed on November 8, 2007 | ||
| 10.8† | Supply Agreement between the Registrant and Solaricos Trading Ltd., dated October 24, 2007 | Exhibit 10.34 to the Registrant’s Annual Report on Form 10-K for the period ended December 31, 2007, filed on February 27, 2008 | ||
| 10.9 | Lease Agreement between the Registrant and the Massachusetts Development Finance Agency (“MDFA”), dated November 20, 2007 | Exhibit 10.36 to the Registrant’s Annual Report on Form 10-K for the period ended December 31, 2007, filed on February 27, 2008 | ||
| 10.10 | Project Grant Agreement between the Registrant and MDFA, dated November 20, 2007 | Exhibit 10.37 to the Registrant’s Annual Report on Form 10-K for the period ended December 31, 2007, filed on February 27, 2008 | ||
| 10.11 | Project Grant Agreement between the Registrant and Massachusetts Technology Park Corporation, dated November 20, 2007 | Exhibit 10.38 to the Registrant’s Annual Report on Form 10-K for the period ended December 31, 2007, filed on February 27, 2008 | ||
| 10.12† | Supply Agreement between the Registrant and OCI, dated January 30, 2008 | Exhibit 10.41 to the Registrant’s Annual Report on Form 10-K/A for the period ended December 31, 2007, filed on August 8, 2008 | ||
| 10.13† | Master Supply Agreement between the Registrant and Ralos Vertriebs GmbH, dated May 21, 2008 | Exhibit 10.1 to the Registrant’s Quarterly Report on Form 10-Q for the period ended June 28, 2008, filed on August 4, 2008 | ||
| 10.14† | Master Supply Agreement between the Registrant and Wagner & Co Solartechnik GmbH, dated June 18, 2008 | Exhibit 10.2 to the Registrant’s Quarterly Report on Form 10-Q for the period ended June 28, 2008, filed on August 4, 2008 | ||
| 10.15 | Share Lending Agreement between the Registrant and Lehman Brothers International (Europe), through Lehman Brothers Inc., dated June 26, 2008 | Exhibit 10.5 to the Registrant’s Quarterly Report on Form 10-Q for the period ended June 28, 2008, filed on August 4, 2008 | ||
| 10.16 | Capped Call Transaction Agreement between the Registrant and Lehman Brothers OTC Derivatives Inc., dated June 26, 2008 | Exhibit 10.6 to the Registrant’s Quarterly Report on Form 10-Q for the period ended June 28, 2008, filed on August 4, 2008 | ||
Table of Contents
| Number |
Description |
Incorporation by Reference | ||
| 10.17† | Master Supply Agreement between the Registrant and IBC Solar AG, dated July 14, 2008 | Exhibit 10.32 to the Registrant’s Annual Report on Form 10-K for the period ended December 31, 2008, filed on March 2, 2009 | ||
| 10.18† | Amended and Restated Sales Representative Agreement between the Registrant and Sovello, dated October 6, 2008 | Exhibit 10.33 to the Registrant’s Annual Report on Form 10-K for the period ended December 31, 2008, filed on March 2, 2009 | ||
| 10.19§ | Form of Amended and Restated Change of Control Severance Agreement between the Registrant and Michael El-Hillow | Exhibit 10.39 to the Registrant’s Annual Report on Form 10-K for the period ended December 31, 2008, filed on March 2, 2009 | ||
| 10.20§ | Form of Amended and Restated Change of Control Severance Agreement between the Registrant and each of Richard G. Chleboski and Lawrence Felton | Exhibit 10.40 to the Registrant’s Annual Report on Form 10-K for the period ended December 31, 2008, filed on March 2, 2009 | ||
| 10.21† | PV License Agreement between ESLR1, LLC and TISICS Ltd., dated September 5, 2007 | Exhibit 10.42 to the Registrant’s Annual Report on Form 10-K for the period ended December 31, 2008, filed on March 2, 2009 | ||
| 10.22 | Frame Agreement among the Registrant, Jiawei Solar (Wuhan) Co., Ltd. (“Jiawei Wuhan”) and the Wuhan Donghu New Technology Development Zone Management Committee, dated April 30, 2009 | Exhibit 10.3 to the Registrant’s Quarterly Report on Form 10-Q for the period ended July 4, 2009, filed on August 12, 2009 | ||
| 10.22† | Relationship Agreement among Jiawei Solarchina Co., Ltd. (“Jiawei China”), Jiawei Wuhan, the Registrant and Evergreen Solar (China) Co., Ltd. (“Evergreen Wuhan”), dated July 14, 2009 | Exhibit 10.1 to the Registrant’s Quarterly Report on Form 10-Q for the period ended October 3, 2009, filed on November 10, 2009 | ||
| 10.23† | Manufacturing Services Agreement among Jiawei China, Jiawei Wuhan, the Registrant and Evergreen Wuhan, dated July 14, 2009 | Exhibit 10.2 to the Registrant’s Quarterly Report on Form 10-Q for the period ended October 3, 2009, filed on November 10, 2009 | ||
| 10.24 | Increase Registered Capital and Enlarge Shares Agreement between Hubei Science & Technology Investment Co., Ltd. and the Registrant on Evergreen Wuhan, dated July 24, 2009 | Exhibit 10.3 to the Registrant’s Quarterly Report on Form 10-Q for the period ended October 3, 2009, filed on November 10, 2009 | ||
| 10.25 | Equity Transfer Agreement among the Registrant, HSTIC and various other parties, dated July 24, 2009 and delivered September 22, 2009 | Exhibit 10.4 to the Registrant’s Quarterly Report on Form 10-Q for the period ended October 3, 2009, filed on November 10, 2009 | ||
| 10.26† | Amendment made on August 3, 2009 to Master Supply Agreement between the Registrant and Wagner & Co Solartechnik GmbH, dated June 18, 2008 | Exhibit 10.6 to the Registrant’s Quarterly Report on Form 10-Q for the period ended October 3, 2009, filed on November 10, 2009 | ||
| 10.27† | Amendment, dated on or about October 1, 2009, to Master Supply Agreement between the Registrant and IBC Solar AG, dated July 14, 2008 | Exhibit 10.41 to Registrant’s Annual Report on Form 10-K for the year ended December 31, 2009, filed on March 9, 2010 | ||
Table of Contents
| Number |
Description |
Incorporation by Reference | ||
| 10.28† | First Amendment entered into October 2, 2009 to the Supply Agreement between the Registrant and Solaricos Trading, Ltd., dated October 24, 2007 | Exhibit 10.42 to Registrant’s Annual Report on Form 10-K for the year ended December 31, 2009, filed on March 9, 2010 | ||
| 10.29† | First Amendment entered into January 1, 2010 to the Supply Agreement between OCI and the Registrant, dated April 17, 2007 | Exhibit 10.43 to Registrant’s Annual Report on Form 10-K for the year ended December 31, 2009, filed on March 9, 2010 | ||
| 10.30† | First Amendment entered into January 1, 2010 to the Supply Agreement between OCI and the Registrant, dated January 30, 2008 | Exhibit 10.44 to Registrant’s Annual Report on Form 10-K for the year ended December 31, 2009, filed on March 9, 2010 | ||
| 10.31 | Loan Agreement, between Evergreen Wuhan and Jiawei Wuhan, dated March 26, 2010 | Exhibit 10.3 to Registrant’s Quarterly Report on Form 10-Q for the period ended April 3, 2010, filed on May 13, 2010 | ||
| 10.32 | Promissory Note made by Jiawei China to the Registrant, dated April 30, 2010 | Exhibit 10.4 to Registrant’s Quarterly Report on Form 10-Q for the period ended April 3, 2010, filed on May 13, 2010 | ||
| 10.33§ | Management Incentive Plan | Exhibit 10.5 to Registrant’s Quarterly Report on Form 10-Q for the period ended April 3, 2010, filed on May 13, 2010 | ||
| 10.34 | Lease Contract between Evergreen Solar (China) Co. and Jiawei Wuhan, dated May 14, 2010 | Exhibit 10.2 to Registrant’s Quarterly Report on Form 10-Q for the period ended July 3, 2010, filed on August 11, 2010 | ||
| 10.35 | First Amendment to Ground Lease between the Registrant and Massachusetts Development Finance Agency, dated June 10, 2010 | Exhibit 10.3 to Registrant’s Quarterly Report on Form 10-Q for the period ended July 3, 2010, filed on August 11, 2010 | ||
| 10.36 | Offer letter between the Registrant and Donald W. Reilly dated November 3, 2010 | * | ||
| 10.37 | Letter Agreement between the Registrant and Brown F. Williams dated November 15, 2010 | * | ||
| 10.38† | Share Purchase Agreement between Q-Cells SE, Renewable Energy Corporation and the Registrant and Rolling Hills S.à.r.l dated March 22, 2010 | Exhibit 10.1 to the Registrant’s Current Report on Form 8-K dated March 23, 2010 and filed on September 14, 2010 | ||
| 21.1 | List of Subsidiaries | * | ||
| 23.1 | Consent of PricewaterhouseCoopers LLP, an Independent Registered Public Accounting Firm | * | ||
| 31.1 | Certification of the Chief Executive Officer pursuant to Rule 13a-14(a) and Rule 15d-14(a) of the Securities Exchange Act of 1934, as adopted pursuant to Section 302 of the Sarbanes-Oxley Act of 2002 | * | ||
Table of Contents
| Number |
Description |
Incorporation by Reference | ||
| 31.2 | Certification of the Chief Financial Officer pursuant to Rule 13a-14(a) and Rule 15d-14(a) of the Securities Exchange Act of 1934, as adopted pursuant to Section 302 of the Sarbanes-Oxley Act of 2002 | * | ||
| 32.1 | Certification of the Chief Executive Officer pursuant to Rule 13a-14(d) and Rule 15d-14(d) of the Securities Exchange Act of 1934, as adopted pursuant to Section 906 of the Sarbanes-Oxley Act of 2002 | * | ||
| 32.2 | Certification of the Chief Financial Officer pursuant to Rule 13a-14(d) and Rule 15d-14(d) of the Securities Exchange Act of 1934, as adopted pursuant to Section 906 of the Sarbanes-Oxley Act of 2002 | * | ||
| † | Confidential treatment granted as to certain portions. |
| § | Indicates a management contract or compensatory plan, contract or arrangement. |
| * | Not applicable (filed herewith) |