Attached files
| file | filename |
|---|---|
| 8-K - FORM 8-K - PIONEER ENERGY SERVICES CORP | d8k.htm |
 Stephens Fall Investment Conference
November 16, 2010
(NYSE AMEX: PDC)
www.pioneerdrlg.com
Exhibit 99.1 |
 2
Forward-looking Statements
This presentation contains various forward-looking statements and information that are based on
management’s current expectations and assumptions
about future events. Forward-looking statements are generally accompanied by words such as “estimate,” “project,”
“predict,” “expect,”
“anticipate,” “plan,”
“intend,” “seek,”
“will,” “should,”
“goal,” and
other words that convey the uncertainty of future events and outcomes. Forward-looking information
includes , among other matters, statements regarding the
Company’s anticipated growth, quality of assets, rig utilization rate, capital
spending by oil and gas companies, production rates, the Company's growth strategy, and the Company's
international operations. Although the Company believes that the expectations and assumptions
reflected in such forward-looking statements are reasonable, it can give no assurance that
such expectations and assumptions will prove to have been correct. Such statements are subject to
certain risks, uncertainties and assumptions, including, among others: general and regional
economic conditions and industry trends; the continued strength of the contract land drilling industry in
the geographic areas where the Company operates; decisions about onshore exploration and development
projects to be made by oil and gas companies; the highly competitive nature of the contract land
drilling business; the Company’s future financial
performance, including availability, terms and deployment of capital; the continued availability of
qualified personnel; changes in governmental regulations, including those relating to the environment;
the political, economic and other uncertainties encountered in the Company's international
operations and other risks, contingencies and uncertainties, most of which are difficult to
predict and many of which are beyond our control. Should one or more of these risks,
contingencies or uncertainties materialize, or should underlying assumptions prove incorrect, actual
results may vary materially from those expected. Many of these factors have been discussed in more
detail in the Company's annual report on Form 10-K for the fiscal year ended December 31,
2009 and Form 10-Q for the three months ended, March 31, 2010 and September 30, 2010.
Unpredictable or unknown factors that the Company has not discussed in this presentation or in
its filings with the Securities and Exchange Commission could also have material adverse effects
on actual results of matters that are the subject of the forward-looking statements. All forward-looking
statements speak only as the date on which they are made and the Company undertakes no duty to update or
revise any forward-looking statements. We advise our shareholders to use caution and common
sense when considering our forward looking statements. |
 Overview
Ticker Symbol:
PDC
Market Cap:
$374 million (November 11, 2010)
Stock price:
$6.91 (November 11, 2010)
Average 3-month daily
trading volume:
452,000 shares
Public float:
Approximately 54 million shares
Employees:
2,444
Headquarters:
San Antonio, Texas
3 |
 4
Pioneer Drilling Overview |
 Investment Considerations
Rig fleet trading at a significant discount to replacement value
Focused on protecting cash flow from natural gas price uncertainty
Approximately 70% of working rigs on term contracts
(1)
Approximately 60% of working rigs in shale plays
(1)
Approximately
60%
of
our
working
drilling
rigs
and
workover
rigs
are
operating on wells targeting oil
(1)
Recent bond offering combined with credit facility provides ample
flexibility and liquidity
Continued growth opportunities in core businesses: land drilling, well
services and wireline
5
(1) Based on information provided in 3rd quarter 2010 conference call;
company research as of November 4, 2010 |
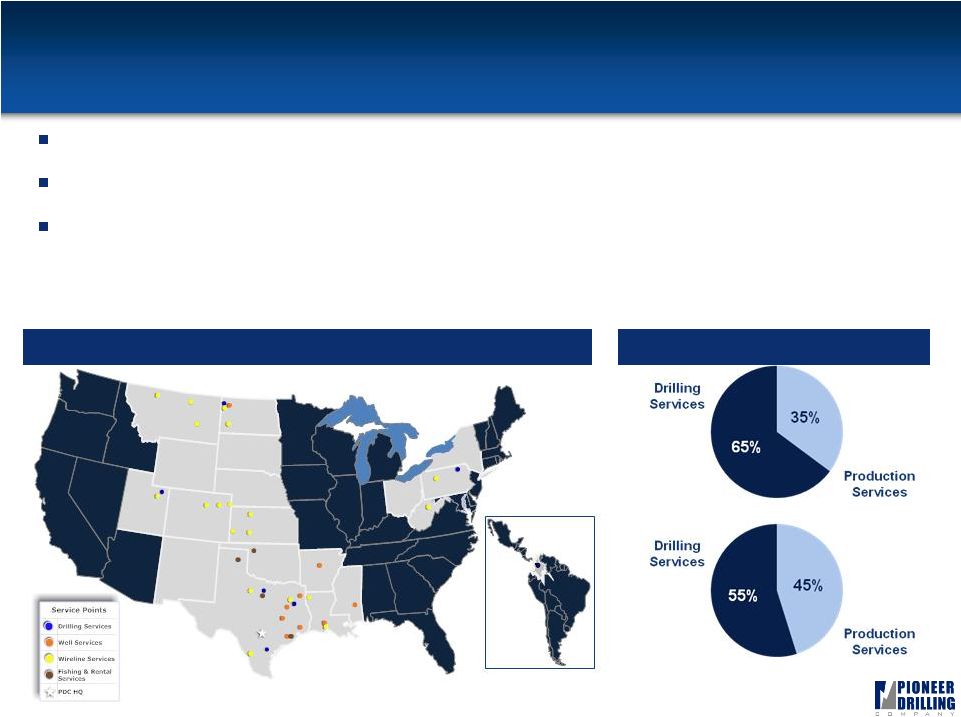 6
Overview of Pioneer
71 land drilling rigs (approximately 9
largest contract driller)
74 well service rigs (approximately 6
largest well service provider)
82 wireline
units (65 cased hole, 17 open hole)
Diversified Energy Services Provider
TTM September 30, 2010
Total Revenue: $420 million
Total Segment Margin: $125 million
6
Colombia
th
th |
 Corporate Strategy
Focused on value-added organic growth in core businesses: land
drilling, well services and wireline
Maintaining emphasis on new-build equipment and state-of-the-art
technology
Continuing to pursue further international expansion
Maintain leadership position in accident-free work environment
7 |
 Recent Developments
8
Locking in drilling rig utilization with term contracts
Increased term contracts from 4 to 32 since beginning of year, including
All seven rigs drilling in the Marcellus,
Eight rigs drilling in Bakken,
Six rigs drilling in Eagle Ford,
One rig drilling in South Texas,
Two rigs drilling in Uintah Basin, and
All eight rigs drilling in Colombia |
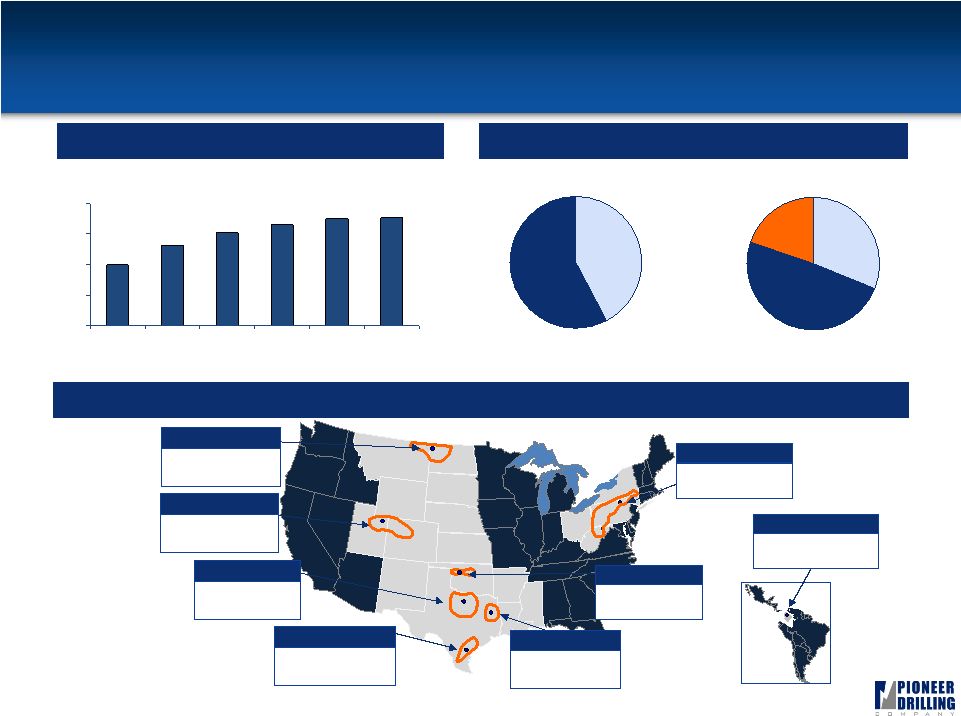 Drilling Services-Segment Overview
9
Historical Fleet Growth
Locations
Current Rig Fleet Mix
Note:
Rig
counts
for
2004,
2005
and
2006
represent
fiscal
years
ended
March
31,
2004,
2005
and
2006
while
2007,
2008
and
2009
represent
fiscal
years
ended
December
31,
2007,
2008
and
2009.
* Cold-stacked
19 rigs
Avg
HP: 1,084
South Texas
16 rigs
Avg
HP: 931
East Texas
58%
42%
49%
31%
20%
Electric
Mechanical
550-999
HP
1,000-1,499
HP
1,500-2,000
HP
9 rigs
Avg
HP: 1,222
North Dakota
3 rigs
Avg
HP: 850
North Texas
3 rigs
Avg
HP: 1000
Utah
7 rigs
Avg
HP: 1,000
Appalachia
8 rigs
Avg
HP: 1,375
Colombia
6 rigs
Avg
HP: 600
Oklahoma*
40
52
61
66
70
71
0
20
40
60
80
2004
2005
2006
2007
2008
2009 |
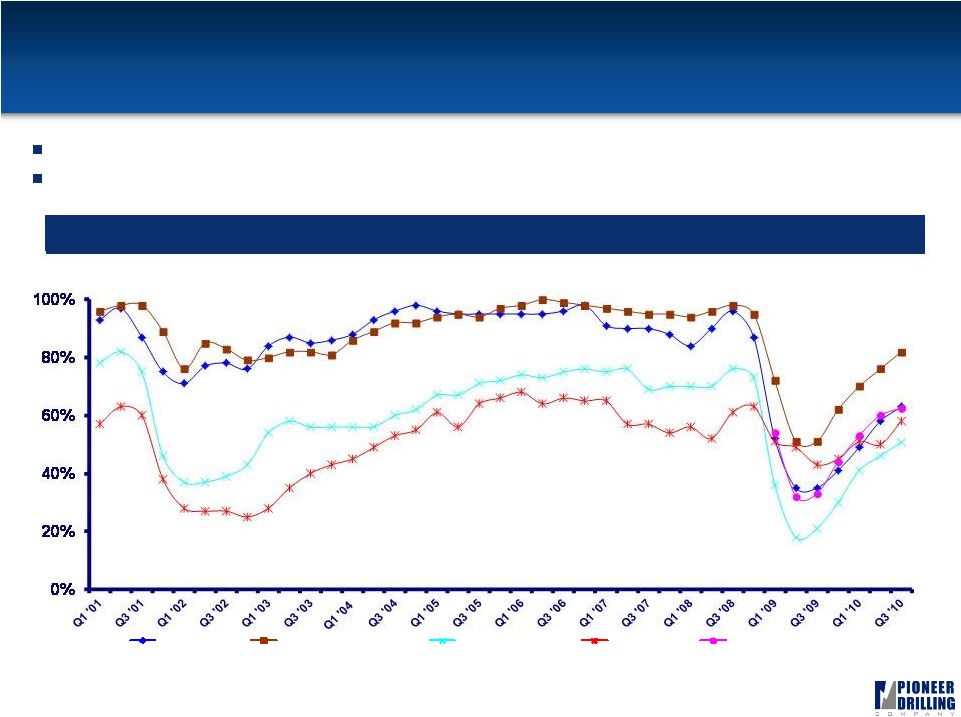 10
Strong Utilization Through the Cycles
Averaged 85% utilization through cycles since 2001, comparing favorably to
peers Utilization has rebounded from a monthly low of 33% in June 2009
to 63% currently
(1)
Comparable Utilization Rates
Pioneer
Helmerich
& Payne
Patterson-UTI
Nabors
Precision (U.S.)
Source: Helmerich & Payne, Patterson-UTI, & Precision Drilling data consists of U.S.
domestic utilization rates derived from Form 10-K, Form 10-Q reports, & press releases. Nabors utilization rates for
worldwide land fleet obtained from public documents and industry analysts. Helmerich & Payne
Q3 2010 only estimated based on analyst reports. Pioneer Drilling utilization rates include Colombian
operations beginning Q3 2007.
(1) PDC utilization for Q3 2010.
|
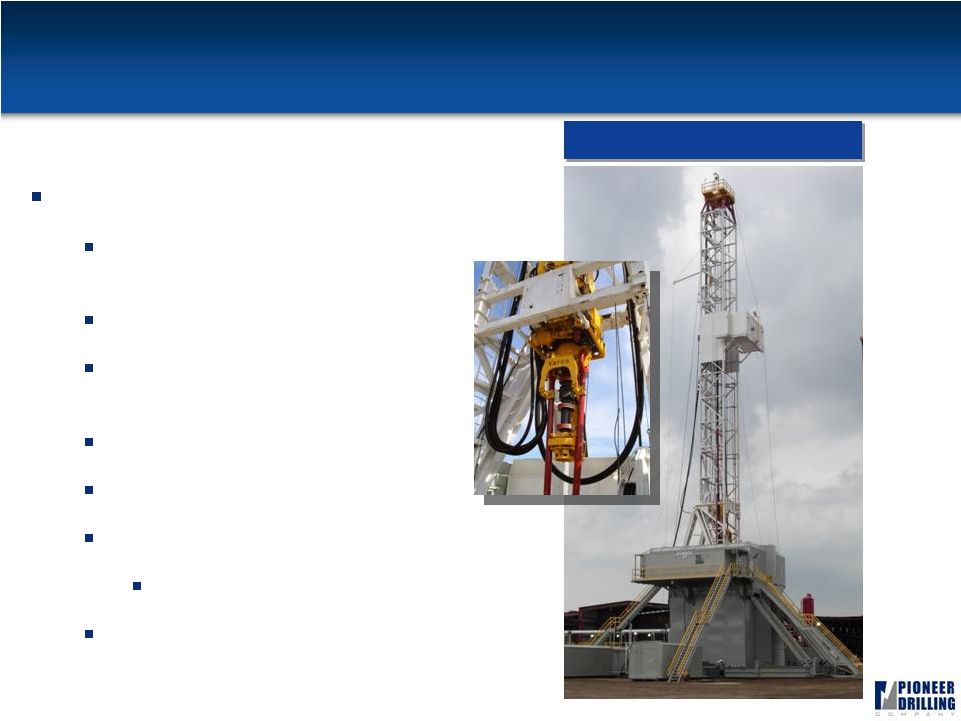 11
Modern, Efficient Drilling Fleet
Over 75% of fleet is shale capable
31 new builds (44%) since 2001 with
most
constructed
during
2004
-
2006
69%
with
1,000
HP
-
2,000 HP
35 rigs working with top drives (49%
of fleet)
63% with iron roughnecks
42% electric
12 walking/skidding systems on rigs
3 more installed in Q4
33 pairs of 1300/1600 HP mud pumps
50 Series Rig |
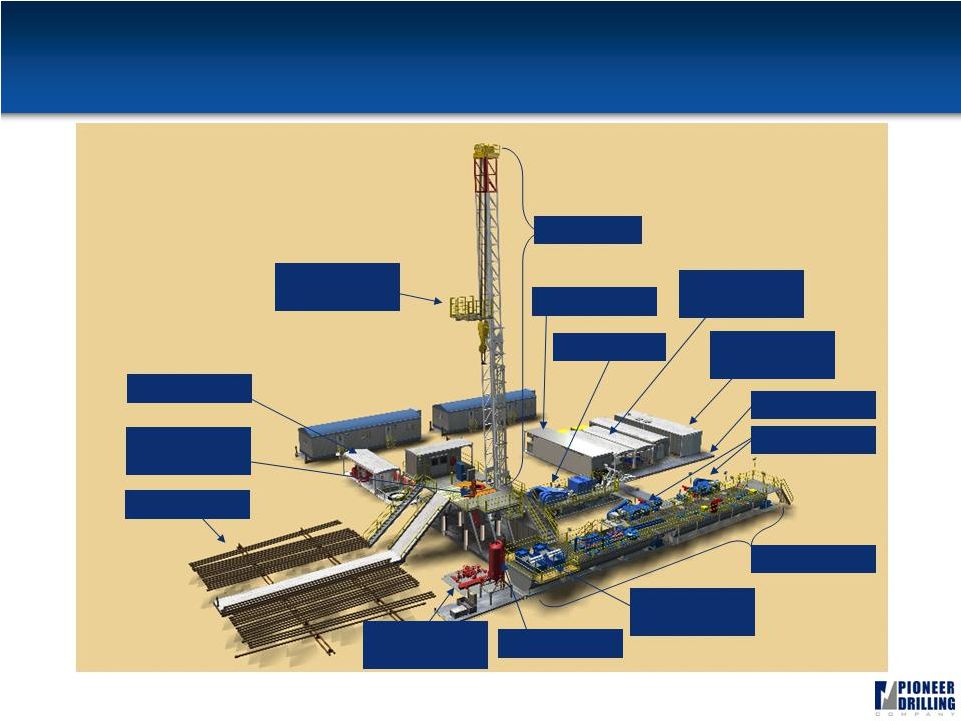 60
Series Rig 12
Mast
Traveling
Equipment
Mud Tanks
Handling
Equipment
Drawworks
Mud Pumps
Mud Cleaning
Equipment
Pipe Racks
Accumulator
Gas Buster
Choke
Manifold
SCR House
Fuel-Water
Tank
Power
Package
Suitcases |
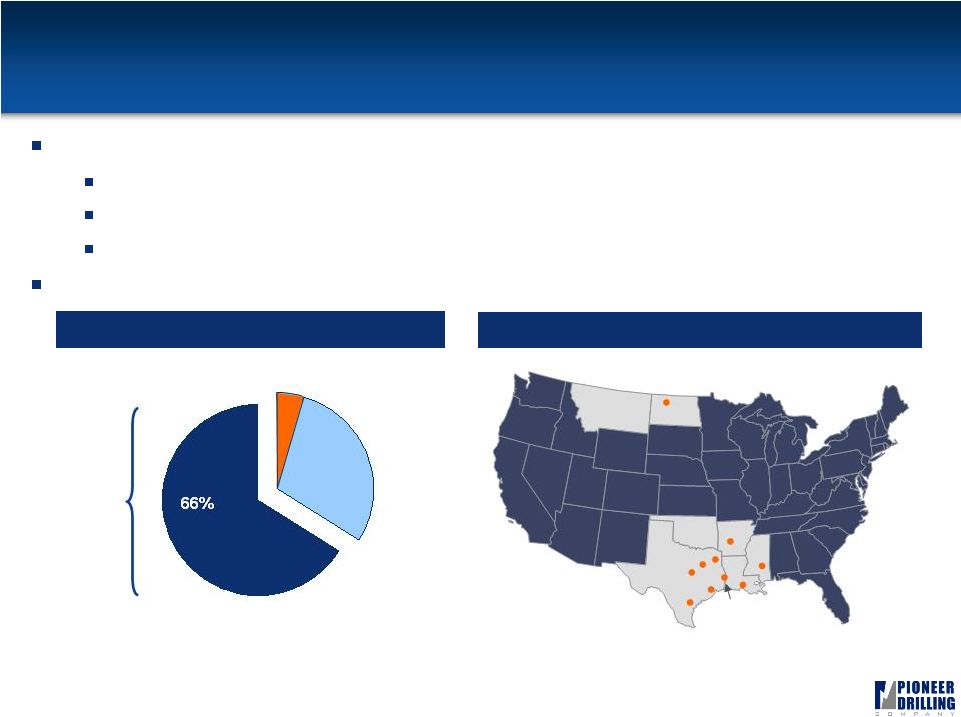 Well Service Fleet Overview
13
One of the newest and most highly capable well service fleets in
the industry
Sixty-nine 550 HP rigs
Four 600 HP rigs
One 400 HP rig
Established in the Bakken, Fayetteville, Haynesville and Eagle Ford shales
Well Service Fleet Age
Well Service Locations
Average year in service: 2007
66%
2007 or
newer
31%
3%
Williston
Bryan
Palestine
Longview
New Iberia
El Campo
Liberty
Kenedy
Conway
Laurel
2005-2006
2002-2004 |
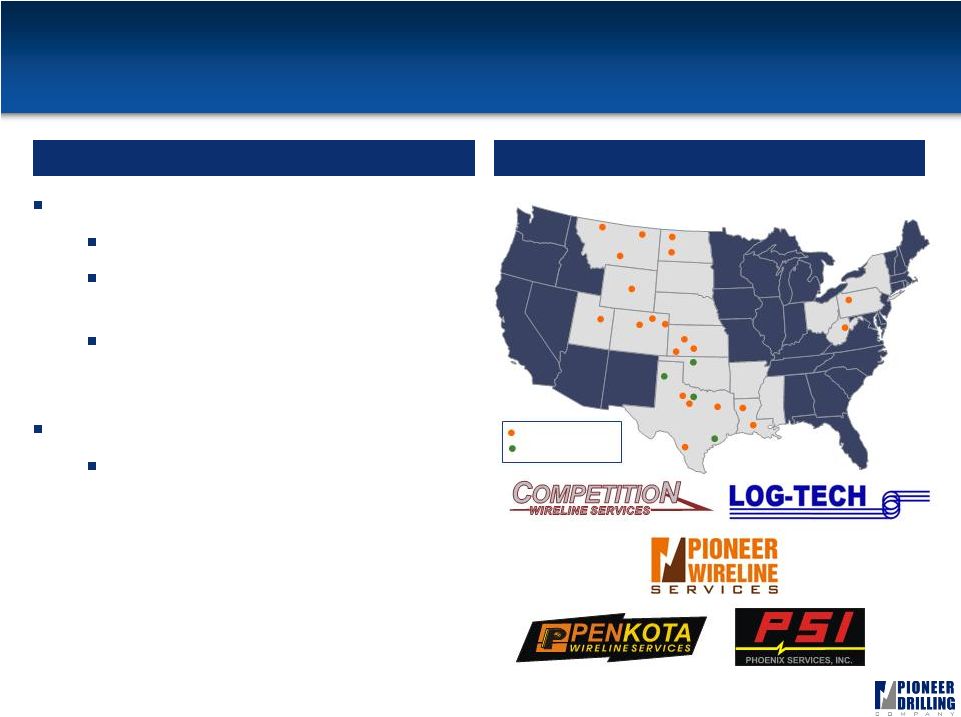 Wireline
and Fishing & Rental Overview
14
Wireline
Services
Open
and
cased-hole
wireline
services
82 wireline
units with an average age
of less than 5 years
Established in the Bakken, Barnett,
Marcellus, Haynesville, Niobrara and
Eagle Ford shales
Fishing & Rental Services
Range of specialized services and
equipment that are utilized on a non-
routine basis for both drilling and well
servicing operations
Overview
Locations
Williston
Dickinson
Cut Bank
Billings
Havre
Tyler
Bossier City
Broussard
Graham
Alvarado
Roosevelt
Pratt
Liberal
Hays
Casper
Buckhannon
Punxsutawney
Ft. Morgan
Brighton
Wray
Woodward
Pampa
Springtown
El Campo
Wireline
Fishing & Rental
Laredo |
 15
Industry and Market Conditions |
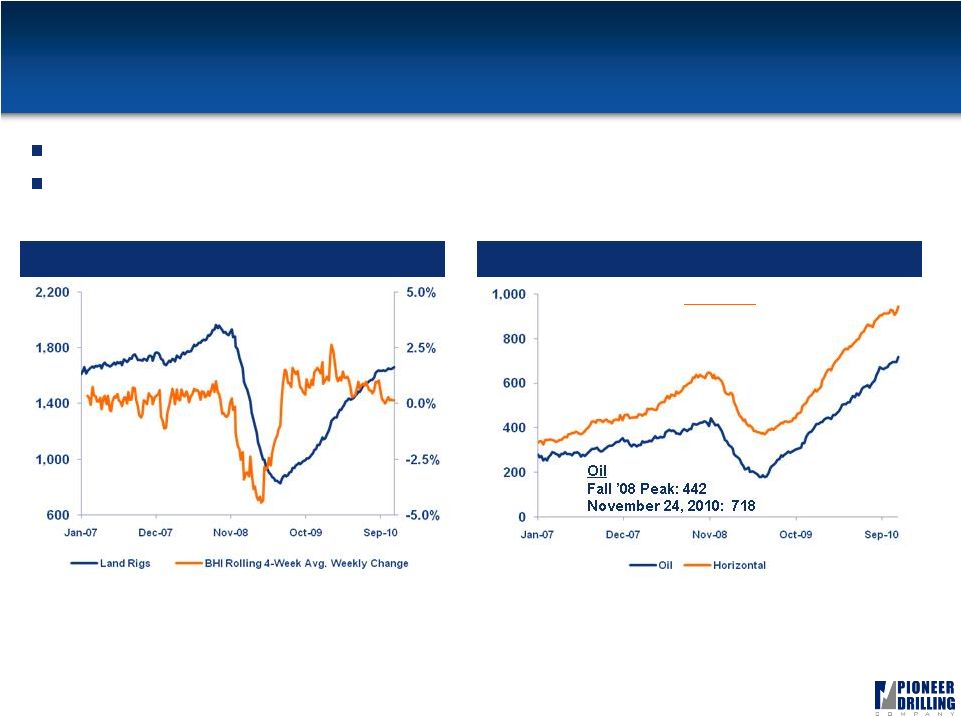 Recovery in U.S. Land Rig Count
1
16
Steady rig count improvement during the second half of 2009 and 2010 YTD
Horizontal and oil rig counts have surpassed Fall 2008 peak levels
Land Rig Count
Horizontal & Oil Rig Count
Source: Baker Hughes.
Source: Baker Hughes.
Horizontal
Fall ’08 Peak: 650
November 5, 2010: 943
16 |
 30
35
40
45
50
55
60
65
70
Base Production (all sources)
Unconventional
Alaska
LNG imports
Benefits of Growing Shale Plays
1
17
Oilfield service companies stand to benefit from shale production due to its
lower risk development and increased service intensity (up to 3 -
5x
conventional)
Reintroduction
of
the
Majors
in
the
U.S.
market
should
result
in
greater
activity levels
Recent U.S. Shale Investments
Source:
Base
production,
Alaska,
and
LNG
import
data
–
EIA
AEO
2010.
Growing Importance of Shale
$Millions
$40,991
12/14/2009
$4,700
5/28/2010
$3,375
11/11/2008
$3,200
11/9/2010
$2,250
12/30/2009
$1,900
9/2/2008
$1,050
6/30/2009 |
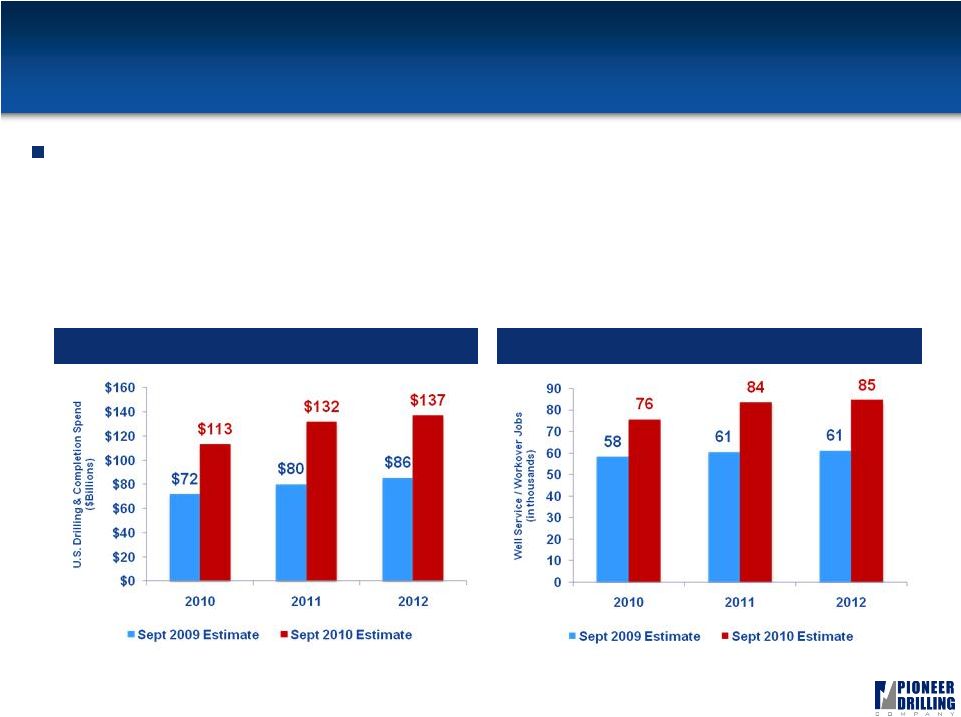 Conclusion: Improving Oil Service Outlook
1
18
North American capital spending outlook much improved
Upstream Spending Outlook
Well Service / Workover
Jobs Outlook
Source: Spears & Associates.
Source: Spears & Associates.
18 |
 19
Financials |
 Capitalization
20
($ in millions)
September 30, 2010
Cash
$
16.9
Revolving Credit Facility ($225)
(1)
39.8
Sr. Unsecured Notes
239.9
Other
3.3
Total Debt
$
283.0
Stockholders' Equity
398.6
Total Capitalization
$
681.6
LTM EBITDA
$
79.5
Debt / LTM EBITDA
(2)
3.44x
Debt / Total Book Capitalization
41.5%
(1) Excludes $9.2 million of LCs
outstanding.
(2) Total consolidated leverage ratio as reported in form 10Q for the third
quarter 2010. |
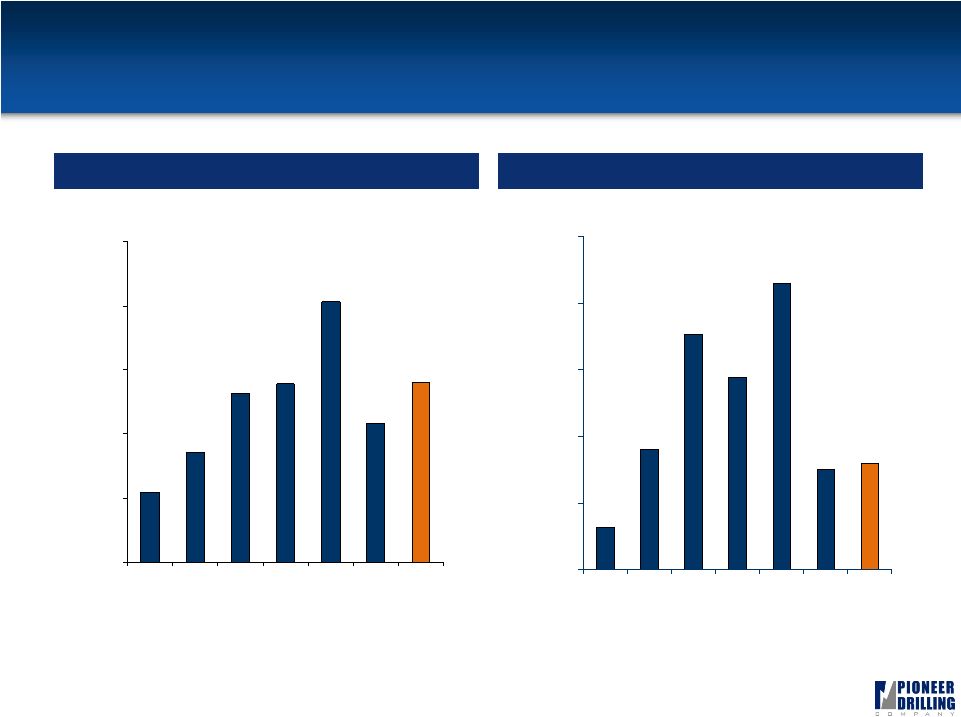 21
$163
$257
$396
$417
$610
$326
$420
$0
$150
$300
$450
$600
$750
2004
2005
2006
2007
2008
2009
TTM
$32
$90
$177
$145
$215
$75
$80
$0
$50
$100
$150
$200
$250
2004
2005
2006
2007
2008
2009
TTM
Consolidated Revenue & EBITDA
Revenue ($ millions)
EBITDA ($ millions)
(1)
(1)
Note: Fiscal year end was changed from March 31 to December 31 effective on December 31, 2007; all data
points reflect calendar year and trailing twelve months information derived from 10K and 10Q
filings. (1) As of September 30, 2010. |
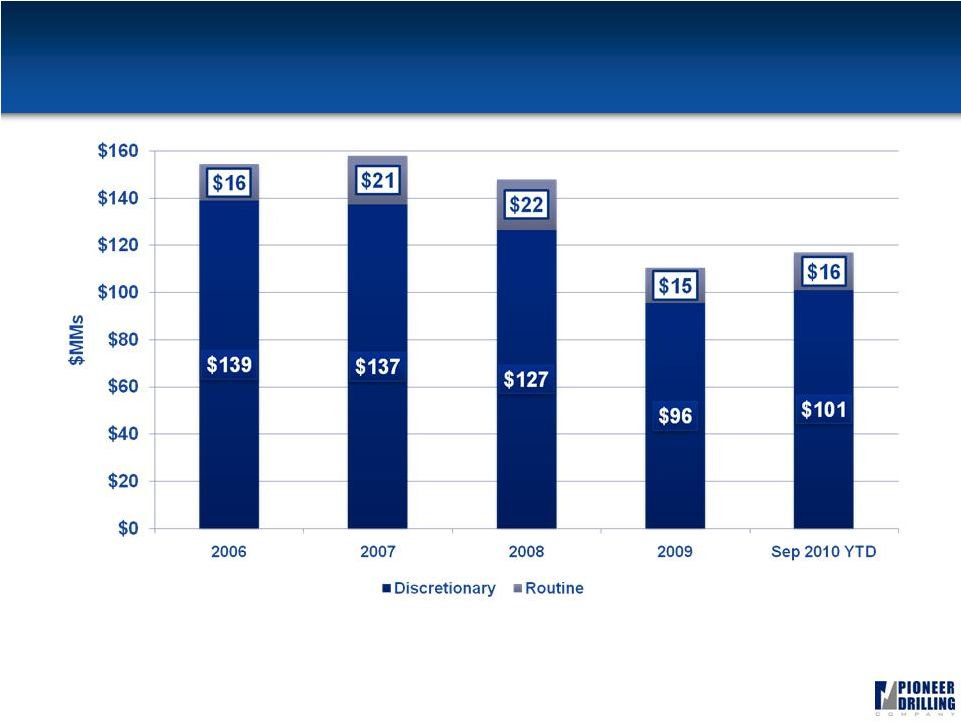 Capital Expenditures
22 |
 23
Appendix |
 24
Reconciliation of EBITDA to Net Income
Year ended December 31,
($ in millions)
2004
2005
2006
2007
2008
2009
EBITDA
31.7
90.3
176.6
144.5
214.8
74.9
Depreciation & Amortization
(20.6)
(30.8)
(47.6)
(63.6)
(88.1)
(106.2)
Net Interest
(1.9)
0.8
3.6
3.3
(11.8)
(8.9)
Impairment Expense
-
-
-
-
(171.5)
-
Income Tax (Expense) Benefit
(3.4)
(22.1)
(47.7)
(27.3)
(6.1)
17.0
Net Income (Loss)
5.7
38.1
84.8
56.9
(62.7)
(23.2)
TTM
($ in millions)
Q4
2009
Q1
2010
Q2
2010
Q3
2010
TTM
EBITDA
14.1
9.2
22.0
34.2
79.5
Depreciation & Amortization
(27.7)
(28.9)
(29.6)
(30.8)
(117.0)
Net Interest
(3.6)
(4.1)
(7.1)
(7.6)
(22.3)
Impairment Expense
-
-
-
-
-
Income Tax (Expense) Benefit
8.8
9.2
4.5
1.6
24.1
Net Income (Loss)
(8.4)
(14.5)
(10.1)
(2.6)
(35.7)
We define EBITDA as earnings (loss) before interest income (expense), taxes, depreciation,
amortization and impairments. Although not prescribed under GAAP, we believe the presentation
of EBITDA is relevant and useful because it helps our investors understand our operating
performance and makes it easier to compare our results with those of other companies that have
different financing, capital or tax structures. EBITDA should not be considered in isolation
from or as a substitute for net earnings (loss) as an indication of operating performance or cash
flows from operating activities or as a measure of liquidity. A reconciliation of net earnings (loss)
to EBITDA is included in the table below. EBITDA, as we calculate it, may not be comparable to
EBITDA measures reported by other companies. In addition, EBITDA does not represent funds
available for discretionary use. |
 25 |