Attached files
| file | filename |
|---|---|
| 8-K - CURRENT REPORT - TFS Financial CORP | d8k.htm |
 Sandler O'Neill
East Coast Financial Services Conference
November 10-12, 2010
Exhibit 99.1 |
 2
Forward-Looking Statements
This presentation contains forward-looking statements, which can be identified
by the use of such words as estimate, project, believe, intend, anticipate,
plan, seek, expect and similar expressions. These forward-looking statements
include:
Statements of our goals, intentions and expectations;
Statements regarding our business plans and prospects and growth and operating
strategies; Statements concerning trends in our provision for loan losses
and charge-offs; Statements regarding the asset quality of our loan
portfolio; and Estimates of our risks and future costs and benefits.
These
forward-looking
statements
are
subject
to
significant
risks,
assumptions
and
uncertainties,
including,
among
other things, the following important factors that could affect the actual outcome
of future events: Significantly increased competition among depository and
other financial institutions; Inflation and changes in the interest rate
environment that reduce our interest margins or reduce the fair value of financial instruments;
General
economic
conditions,
either
nationally
or
in
our
market
areas,
including
employment
prospects
and
conditions
that
are
worse
than
expected;
Decreased demand for our products and services and lower revenue and earnings
because of a recession; Adverse changes and volatility in credit
markets; Legislative or regulatory changes that adversely affect our
business; Changes in consumer spending, borrowing and savings habits;
Changes
in
accounting
policies
and
practices,
as
may
be
adopted
by
the
bank
regulatory
agencies,
the
Financial
Accounting
Standards
Board
and the Public Company Accounting Oversight Board;
Changes
in
laws
or
governmental
regulations
affecting
financial
institutions,
including
changes
in
regulatory
costs
and
capital
requirements;
The timing and the amount of revenue that we may recognize;
Changes
in
expense
trends
(including,
but
not
limited
to
trends
affecting
non-performing
assets,
charge
offs
and
provisions
for
loan
losses);
Changes in consumer spending, borrowing and spending habits;
The impact of the current governmental effort to restructure the U.S. Financial and
regulatory system; Inability of third-party providers to perform their
obligations to us; Adverse changes and volatility in real estate
markets; The strength or weakness of the real estate markets and of the
consumer and commercial credit sectors and its impact on the credit quality of
our loans and other assets.
Because of these and other uncertainties, our actual future results may be
materially different from the results indicated by these forward- looking
statements. |
 3
Organized in 1997 as the mid-tier stock holding company for Third
Federal Savings & Loan Association of Cleveland (“Thrift”), which
was founded in 1938 by Ben and Gerome Stefanski
Completed first step IPO conversion in April 2007
TFSL (NASDAQ)
Financials at 9/30/2010:
Assets:
$11.1B
Deposits:
$ 8.9B
Equity:
$ 1.8B
Market Cap: $ 2.7B
As of September 30, 2010, there were 308.3 million shares
outstanding, of which 73.7% were held by the Mutual Holding
Company
Overview of TFS Financial Corporation |
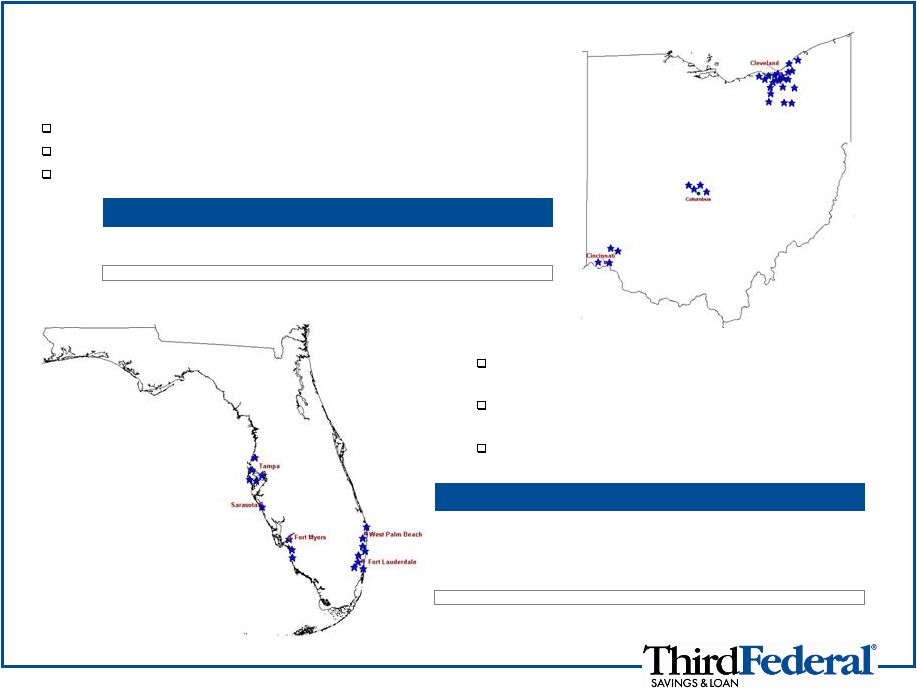 Ohio
22 full service branches in Northeast Ohio
4 loan production offices in the Columbus area (Central Ohio)
4 loan production offices in the Cincinnati area (Southwestern Ohio)
Markets of Operation
Florida
Organic, de novo expansion into Florida started in
2000
9 full service branches along the West Coast from
New Port Richey to Naples
8 full-service branches along the East Coast from
Palm Gardens to Hallandale
Source: SNL Financial
Deposits as of June 30, 2010
Deposits
Market
Market
MSA
Branches
($M)
Share (%)
Rank
Cleveland-Elyria-Mentor, OH
19
5,782
11.51
2
Akron, OH
3
499
4.33
8
Ohio Totals
22
6,281
2.79
9
Deposits
Market
Market
MSA
Branches
($M)
Share (%)
Rank
Tampa-St.Petersburg-Clearwater, FL
5
1,090
2.21
7
Miami-Fort Lauderdale, FL
8
1,064
0.68
26
Cape Coral-Fort Myers, FL
2
251
2.15
13
North Port-Bradenton-Sarasota, FL
1
248
1.47
15
Naples-Marco Island, FL
1
123
1.12
17
Florida Totals
17
2,776
0.69
23
4 |
 5
Strategic Overview
Our business model is to originate and service first mortgage loans and continue to
service existing home equity loans and lines which we fund with core retail
deposits Thrift stopped accepting applications of new home equity
loans and lines in June 2010 Thrift introduced and is originating new
adjustable rate mortgages product to replace home equity lines
–
$1B in loan applications from 7/1/10 to 9/30/10 have been ARM products
The ARM will act as an interest-rate hedge for the balance sheet
First mortgage loans and retail deposits have been generated primarily from the
market areas defined by where we have full service branches and loan
production offices Large deposits per branch ($227 million at
9/30/10) helps keep us a low cost provider In generating mortgage loans and
home equity loans and lines, only non-commissioned Thrift associates
were used to gather applications, underwrite and process the requests First
mortgage originations continue to be made using stringent, conservative
lending standards
Historically, prudent capital management has supplemented shareholder
returns. Repurchased
24.1
million
of
TFSL
stock
(approximately
23%
of
the
public
float)
since
the
IPO
in April 2007
Dividends of $49 million paid to public common shareholders since IPO
|
 6
Financial Highlights
(Dollars in Thousands)
At or for the year ended,
9/30/08
9/30/09
9/30/10
Balance Sheet
Assets ($)
10,786,451
10,598,840
11,076,027
Net Loans ($)
9,208,736
9,219,585
9,181,749
Deposits ($)
8,261,101
8,570,506
8,851,941
Common Equity ($)
1,843,652
1,745,865
1,752,897
Balance Sheet Ratios
Loans/ Deposits (%)
111.5
107.6
103.7
TCE / TA (%)
17.0
16.4
15.8
Thrift Only Ratios:
Core Capital Ratio (%)
12.1
12.5
12.1
Tier 1 Risk Based Ratio (%)
17.3
17.3
18.0
Total Risk Based Capital Ratio (%)
17.6
18.2
19.2
Profitability
Net Interest income ($)
219,862
230,075
227,506
Provision for loan losses ($)
(34,500)
(115,000)
(106,000)
Net Interest income after provision for loan losses ($)
185,362
115,075
121,506
Non-interest income ($)
47,780
67,384
58,638
Non-interest expense ($)
(151,447)
(162,388)
(161,929)
Income before income taxes ($)
81,695
20,071
18,215
Income tax expense ($)
(27,205)
(5,676)
(6,877)
Net income ($)
54,490
14,395
11,338
Net interest margin (%)
2.18
2.20
2.16
Efficiency Ratio (%)
56.6
54.6
56.6
Asset Quality
NPAs/ Assets (%)
1.7
2.6
2.7
NCOs/ Avg
Loans (%)
0.2
0.7
0.7
Reserves/ Loans (%)
0.5
1.0
1.4
Texas Ratio (NPAs
& TDRs
/ TCE & LLR) (%)
10.0
17.4
21.0 |
 7
Loan and Deposit Balances
*About
Home
Today:
An
affordable
housing
program
targeted
toward
low
and
moderate
income
home
buyers
that
is
designed to
teach the essential skills needed for successful homeownership. Most loans
supported by PMI. Cumulative loan originations under this
program
have
been
less
than
$20
million
over
the
last
three
years.
(negligible)
80% of 1-4 family in Ohio
Also service $7B in loans for others
No brokered deposits
Deposits increased 3.3% from prior year
Deposit Data 9/30/10
71%
11%
18%
0%
Certificates of Deposit
Negotiable Order of
Withdrawal
Savings
Accrued Interest
Gross Loan Balances 9/30/10
66%
3%
30%
1%
Residential non-Home
Today
Residential Home
Today
Equity loans and lines
of credit
Other |
 8
Capital Position as of September 30, 2010*
15.75%
12.14%
18.00%
19.17%
10.92%
9.68%
16.20%
17.46%
0.00%
5.00%
10.00%
15.00%
20.00%
Tangible Common
Equity Ratio (TFSL)
Core Capital Ratio
(Thrift)
Tier 1 Risk-based Ratio
(Thrift)
Total Risk-Based
Capital Ratio (Thrift)
Well Capitalized
Source: SNL Financial
Peers include: ISBC, CFFN, BNCL, KRNY, NFBK, WSBF, EBSB and RCKB
6.00%
10.00%
5.00%
Peers
TFSL/Thrift
* Peer data is as of 6/30/10 |
 9
Loan Delinquencies and Charge-offs
Dollars in millions
Loan
Delinquencies
Net Charge-offs for FYE
Balances
9/30/2009
9/30/2010
9/30/2009
9/30/2010
Residential non-Home Today
Ohio and Kentucky
$4,970
1.8%
1.8%
Florida
1,168
3.8%
5.1%
Total
$6,138
2.2%
2.5%
$7
$12
Residential Home Today
Ohio and Kentucky
$270
38.3%
34.7%
Florida
11
30.2%
32.1%
Total
$281
37.9%
34.6%
$4
$5
Home Equity Loans and Lines of Credit
Ohio
$1,146
2.5%
2.0%
Florida
798
4.0%
4.1%
California
325
1.8%
1.5%
Other
580
2.7%
2.4%
Total
$2,849
2.9%
2.6%
$51
$49
Overall Total
$9,375
3.6%
3.5%
$64
$68
$5
2
$5
7
$4
-0-
$5
-0-
$6
35
5
5
$7
33
4
5
Other
$107
12.9%
$2
$2
3.9% |
 10
Memorandum of Understanding
On August 16, 2010, the Thrift received a Memorandum of Understanding from
the OTS. Key elements of the MOU:
Provide the OTS a written report from a consulting firm assessing the home
equity lending portfolio
Develop a plan to reduce the concentration limits for home equity loans and lines
relative to tier 1 core capital and ALLL
Enhance policies and procedures with respect to home equity lending and credit
risk management
Submit an updated business plan addressing all corrective actions
Monitor the Thrift’s performance against the business plan
|
 11
Promontory Financial Group (“PFG”)
PFG (a premier financial consulting group made up primarily of former regulators)
was engaged to provide an assessment of the home equity portfolio and
lending practices Report was completed and submitted to the OTS in September
2010 The report had several key findings:
Thrift has controlled credit risk through selection of higher quality of
borrowers Thrift has employed generally conservative underwriting
practices Thrift capital position can withstand significant economic stress,
and maintains a substantive
cushion
over
statutory
“well-capitalized”
standards
Thrift should actively manage home equity lending exposure down
Thrift has opportunities to enhance risk management and to mitigate home equity
concentrations including line cancellations/suspensions and improved
programs, policies and practices |
 12
Summary of Home Equity Portfolio
(charts available in appendix)
The
ratio
of
home
equity
portfolio
and
open
commitments
relative
to
Tier
1
(Core)
Capital
plus
ALLL,
has
ranged
between
288%
to
544%
over
the
past
seven
years.
Balance
at
September
2010
is
350%,
with
a
plan
to
reduce
to
260%
by
December,
2011
Customers have maintained strong credit scores with 85% of existing credit limits
associated with current credit scores over 700
Loans seriously delinquent (either >90 days past due or in bankruptcy or
foreclosure) is under 3% –
very little delinquency occurs in credit scores over 700
While CLTVs
(combined loan to value) have slipped from origination, the portion of
loans with >100% CLTV have delinquencies under 5%
72% of customers with negative equity have credit scores of 700 or better
70% of customers have used the same or less of their credit line, regardless of
change in property value, indicating they are not using their equity lines
to stay current on their obligations. |
 13
The Reduction plan effectively began with the suspension of all new home equity
loan and line originations, increases and extensions beginning in June
2010. The
formal
plan
submitted
to
the
OTS
in
September
2010,
included
3
key
elements:
Line Reduction
–
From June 30, 2010, through December 2011, a reduction of $1
billion of commitments including $300 million in outstanding balances
–
The
plan
does
not
include
selling
any
existing
home
equity
loans
or
lines
Process
and
Procedure
Management
-
Implementation
of
expanded
line
management, account management and collection processes recommended by PFG
–
These procedures will assist in the ongoing management of the risk in our current
portfolio as individual customer situations change and as larger economic
trends evolve Down streaming of Capital
–
Down stream $150 million into the Thrift from the
holding company in October 2010.
–
Holding
Company
has
approximately
$400
million
of
equity
capital
separate
from
the
Thrift
at
9/30/10
Home Equity Lending Reduction Plan |
 14
Current Status of Plan:
The Thrift believes the requirements of the MOU for the submission of
documents have been met. However the OTS has neither approved nor
disapproved the plan, and therefore the plan is subject to revision. The OTS
has the ultimate authority as to how long the MOU will remain in
effect.
Reduction is being accomplished in a variety of ways:
The Thrift is asking customers to voluntarily close their lines of credit and/or
close their second mortgage as a part of a refinance
In early October, the Thrift began suspending lines of credit for customers with a
significant decline in equity
As of September 30, 2010:
Home equity balances have been reduced $47 million from June 30,
2010
Commitments have been reduced $102 million from June 30, 2010
Home Equity Lending Reduction Plan |
 15
Cash Dividends and Stock Repurchases
TFS Financial must provide the OTS 45 days prior written notice of
the Company’s intent to declare and pay dividends to its
stockholders or repurchase any of its outstanding stock.
The Company understands and shares the view of the importance to
shareholders of dividends and stock repurchases, however, the
Company does not intend to declare or pay a dividend, or to
repurchase any of its outstanding common stock until the OTS’
concerns are resolved. |
 16
Summary
Working diligently to resolve the MOU with the OTS
Focus on our core competency of originating high credit quality 1-4 family
residential mortgages in our banking footprint including the introduction of
new products like our new ARM loans
TFSL has a strong capital position and flexibility at the holding company
We have many means at our disposal by which to achieve our desired
reduction in home equity loans and commitments
Focused on returning to shareholder enhancing activities
Dividends
Share Buybacks |
 Appendix: Home Equity Lines of Credit |
 18
Home Equity Lines of Credit
History of Equity Portfolio Exposure
Calculations include only capital at Thrift level and excludes additional capital
maintained at TFSL Home Equity Portfolio and Open Commitments Relative to Thrift Tier 1 (Core)
Plus ALLL 350%
387%
375%
288%
414%
449%
544%
0%
100%
200%
300%
400%
500%
600%
September 30, 2004
September 30, 2005
September 30, 2006
September 30, 2007
September 30, 2008
September 30, 2009
September 30, 2010 |
 19
*
Seriously
delinquent:
Lines
90
days
or
more
past
due,
or
are
reported
either
in
bankruptcy
or
foreclosure
regardless
of
payment
status.
Where
credit
is
not
available,
balances
are
included
in
the
<600
category
Credit Extended is the credit limit on any lines open to draw and the principal
balance on lines suspended or in repayment. 0.00%
74%
58%
1%
60%
70%
750 and higher %
of total
0.14%
94%
79%
4%
81%
85%
700 and higher %
of total
2.88%
$2,198
$2,748
$79
$2,668
$4,946
Total
0.03%
$953
$379
$0
$379
$1,332
800-850
0.03%
$908
$1,215
$0
$1,215
$2,123
750-799
0.46%
$200
$565
$3
$563
$766
700-749
6.02%
$91
$384
$23
$361
$475
600-699
25.87%
$45
$205
$53
$152
$250
< 600
% Seriously
Delinquent
Unused
Balances
Total
Balances
Seriously
Delinquent*
Current
Credit
Extended
Credit
Score
Home Equity Lines of Credit
Credit
Extended, Balances and Delinquencies by Credit Score
As of July 2010, dollars in millions |
 20
2.86%
$79
$2,676
$4,976
$4,977
Total
4.72%
$37
$739
$1,188
$8
>100
2.47%
$7
$277
$482
$6
90-100
1.96%
$7
$355
$657
$1,459
81-89%
1.67%
$18
$1,051
$2,171
$3,321
<=80%
3.90%
$10
$254
$478
$183
Not Available
% Seriously
Delinquent
Seriously
Delinquent*
Current
Extended $s
as of June
2010
Extended $s
at Origination
CLTV
Home Equity Lines of Credit
Credit
Extended and Balances by Refreshed Property Values
As of June 2010, dollars in millions
*
Seriously delinquent: Lines 90 days or more past due, or are reported either in
bankruptcy or foreclosure regardless of payment status.
|
 21
Home Equity Lines of Credit
Customers not Using Lines to Maintain Credit Score
Data as of June 2010
0%
100%
0%
100%
81-100%
22%
78%
20%
80%
61-80%
27%
73%
23%
77%
41-60%
26%
74%
23%
77%
21-40%
21%
79%
22%
78%
1-20%
17%
83%
15%
85%
0%
Utilization Percent as
of June 2010 is
Higher than
Oct. 2009
Utilization Percent as
of June 2010 is the
Same or Lower
than Oct. 2009
Utilization Percent as
of June 2010 is
Higher than
Oct. 2009
Utilization Percent as
of June 2010 is the
Same or Lower
than Oct. 2009
Utilization as of
Oct. 2009
Accounts in a Negative Equity Position
All Accounts
Customers who've maintained a 700 Credit Score
More than 70% of customers have used the same or less of their credit line,
regardless of change in property value |
 22
Home Equity Lines of Credit
Negative Equity by Credit Score
As of July 2010, dollars in millions
Negative equity is the
updated property value,
less the original senior lien
balance, less the credit
exposure
72% of customers with
negative equity have credit
scores 700 or better.
4.57%
$35
$737
$744
Total
0.00%
$0
$68
$106
800-850
0.03%
$0
$303
$282
750-799
0.52%
$1
$174
$150
700-749
7.54%
$11
$130
$128
600-699
27.49%
$24
$63
$78
< 600
% Seriously
Delinquent
Seriously
Delinquent*
Current
Negative
Equity $s
*
Seriously delinquent: Lines 90 days or more past due, or are reported either in
bankruptcy or foreclosure regardless of payment status.
|