Attached files
| file | filename |
|---|---|
| 8-K - 8-K - ROSETTA STONE INC | a10-21000_18k.htm |
| EX-99.3 - EX-99.3 - ROSETTA STONE INC | a10-21000_1ex99d3.htm |
| EX-99.1 - EX-99.1 - ROSETTA STONE INC | a10-21000_1ex99d1.htm |
|
|
Q3 2010 Financial Results November 10, 2010 |
|
|
These slides and accompanying oral presentation contain forward-looking statements including our guidance for the fourth quarter and full year 2010, the anticipated impact of Rosetta Stone Version 4 TOTALe on our industry, our plans for development and release of new products, and our plans to expand internationally. These statements relate to future events or to future financial performance and involve known and unknown risks, uncertainties, and other factors that may cause our actual results, levels of activity, performance, or achievements to be materially different from any future results, levels of activity, performance, or achievements expressed or implied by these forward-looking statements. In some cases, you can identify forward-looking statements by the use of words such as “may,” “could,” “expect,” “intend,” “plan,” “seek,” “anticipate,” “believe,” “estimate,” “predict,” “potential,” or “continue” or the negative of these terms or other comparable terminology. You should not place undue reliance on forward-looking statements because they involve known and unknown risks, uncertainties and other factors that are, in some cases, beyond our control and that could materially affect actual results, levels of activity, performance, or achievements. Factors that could materially affect actual results, levels of activity, performance or achievements include those listed under the caption “Risk Factors” of Rosetta Stone’s Form 10-K dated March 10, 2010. If any of these risks or uncertainties materialize, or if our underlying assumptions prove to be incorrect, actual results may vary significantly from what we projected. Any forward-looking statement you see or hear during this presentation reflects our current views with respect to future events and is subject to these and other risks, uncertainties, and assumptions relating to our operations, results of operations, growth strategy, and liquidity. We assume no obligation to publicly update or revise these forward-looking statements for any reason, whether as a result of new information, future events, or otherwise. Safe Harbor Summary |
|
|
This presentation contains the following non-GAAP financial measures: non-GAAP net income, non-GAAP net income per share, Adjusted EBITDA, Operating EBITDA and non-GAAP operating income. These measures differ from GAAP in that they exclude amortization, primarily related to acquired intangibles, and stock-based compensation expenses. Adjusted EBITDA is GAAP net income or loss plus interest expense, income tax expense, depreciation, amortization and stock-based compensation expenses. Operating EBITDA is Adjusted EBITDA plus the change in deferred revenue. An additional non-GAAP financial measure in this presentation is total sales bookings, which represents executed sales contracts received by the company that are either recorded immediately as revenue or as deferred revenue. Management believes that these non-GAAP measures of financial results provide useful information to investors regarding certain financial and business trends relating to the company’s financial condition and results of operations. Management uses these non-GAAP measures to compare the company's performance to that of prior periods for trend analyses, for purposes of determining executive incentive compensation, and for budgeting and planning purposes. These measures are used in monthly financial reports prepared for management and in quarterly financial reports presented to the company's Board of Directors. Management believes that the use of these non-GAAP financial measures provides an additional tool for investors to use in evaluating ongoing operating results and trends and in comparing the company's financial measures with other software companies, many of which present similar non-GAAP financial measures to investors Use of Non-GAAP Measures . |
|
|
Tom Adams President and CEO November 10, 2010 |
|
|
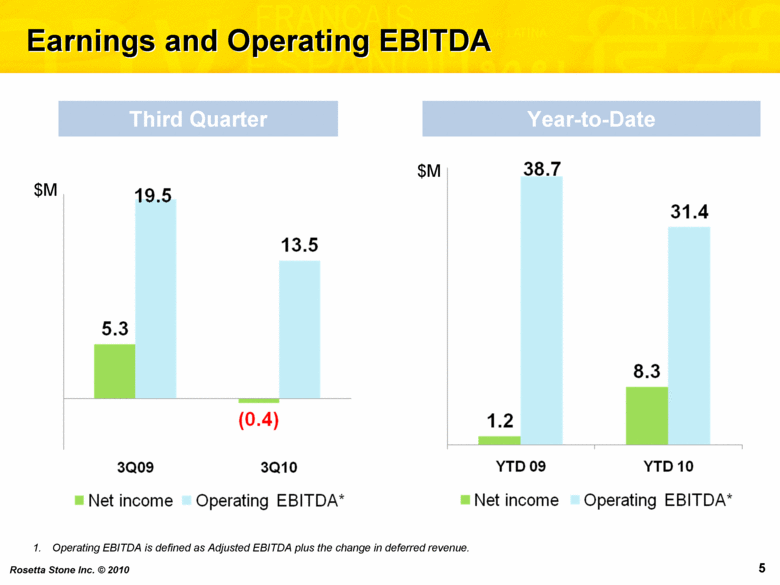
Rosetta Stone Inc. © 2010 5 Earnings and Operating EBITDA $M 1. Operating EBITDA is defined as Adjusted EBITDA plus the change in deferred revenue. Third Quarter Year-to-Date $M 5.3 (0.4) 19.5 13.5 3Q09 3Q10 Net income Operating EBITDA* 1.2 8.3 38.7 31.4 YTD 09 YTD 10 Net income Operating EBITDA* |
|
|
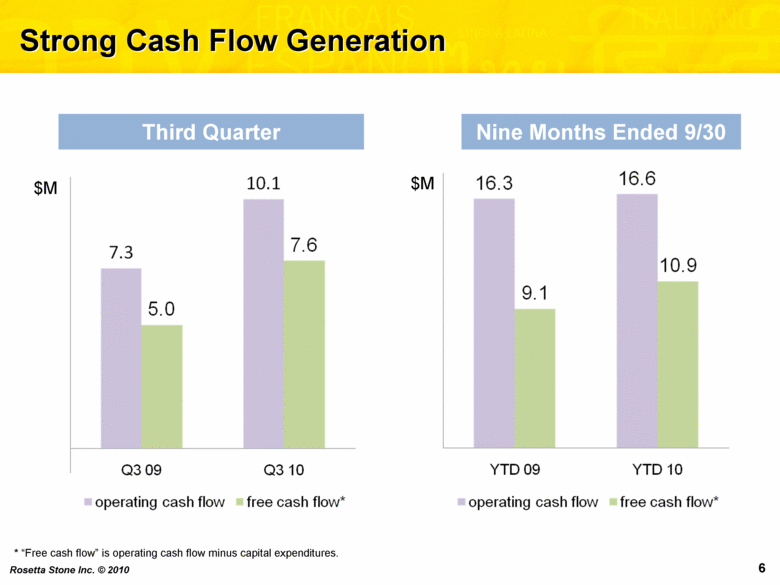
Rosetta Stone Inc. © 2010 6 Strong Cash Flow Generation $M * “Free cash flow” is operating cash flow minus capital expenditures. $M Third Quarter Nine Months Ended 9/30 7.3 10.1 5.0 7.6 Q3 09 Q3 10 operating cash flow free cash flow* 16.3 16.6 9.1 10.9 YTD 09 YTD 10 operating cash flow free cash flow*
|
|
|
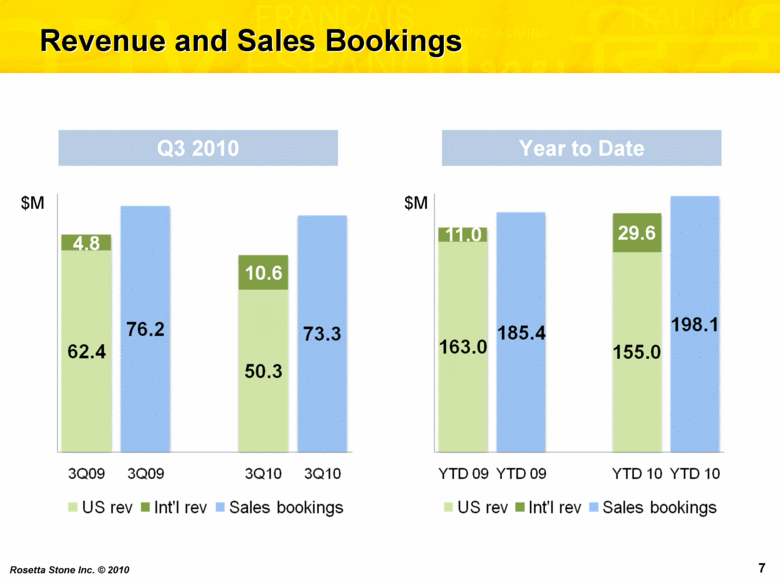
Rosetta Stone Inc. © 2010 7 Revenue and Sales Bookings $M $M Q3 2010 Year to Date 62.4 50.3 4.8 10.6 76.2 73.3 3Q09 3Q09 3Q10 3Q10 US rev Int'l rev Sales bookings 163.0 155.0 11.0 29.6 185.4 198.1 YTD 09 YTD 09 YTD 10 YTD 10 US rev Int'l rev Sales bookings
|
|
|
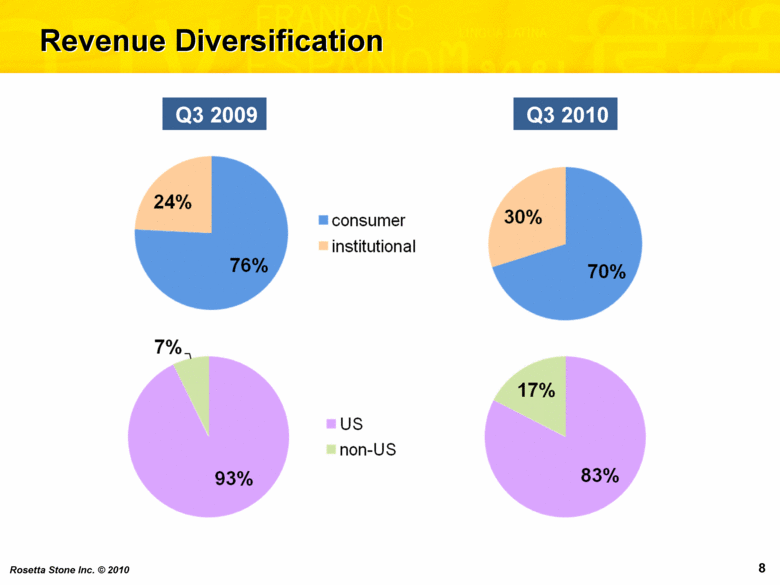
Rosetta Stone Inc. © 2010 8 Revenue Diversification Q3 2009 Q3 2010 76% 24% consumer institutional 93% 7% US non-US 70% 30% 83% 17%
|
|
|
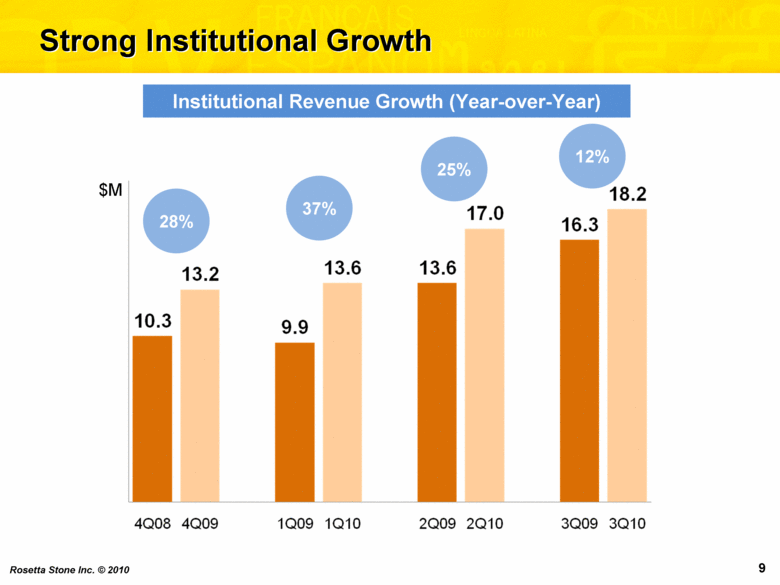
Rosetta Stone Inc. © 2010 9 Strong Institutional Growth $M 28% 37% 12% 25% Institutional Revenue Growth (Year-over-Year) 10.3 13.2 9.9 13.6 13.6 17.0 16.3 18.2 4Q08 4Q09 1Q09 1Q10 2Q09 2Q10 3Q09 3Q10
|
|
|
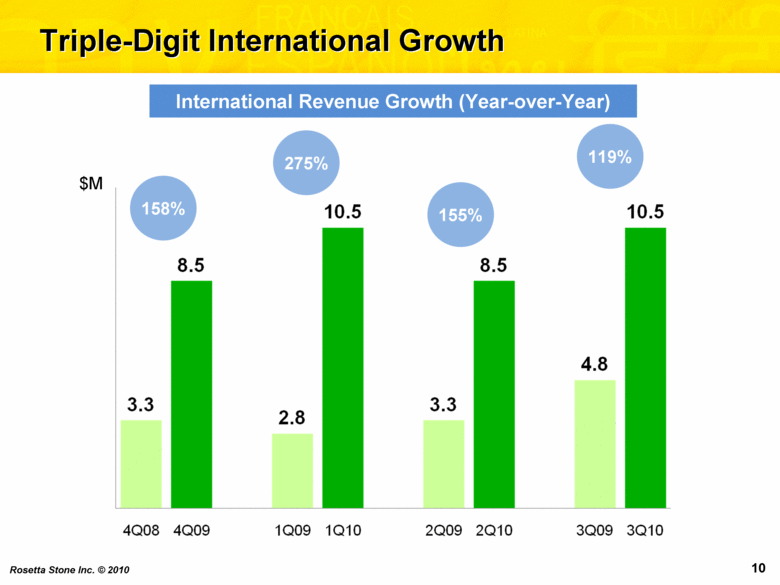
Rosetta Stone Inc. © 2010 10 Triple-Digit International Growth $M 158% 275% 119% 155% International Revenue Growth (Year-over-Year) 3.3 8.5 2.8 10.5 3.3 8.5 4.8 10.5 4Q08 4Q09 1Q09 1Q10 2Q09 2Q10 3Q09 3Q10
|
|
|
Matt Sysak Controller November 10, 2010 |
|
|
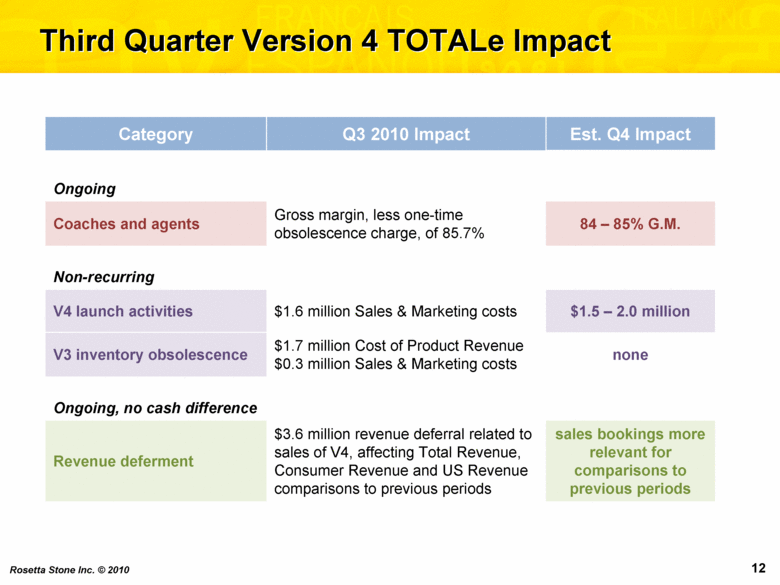
Third Quarter Version 4 TOTALe Impact Category Q3 2010 Impact Est. Q4 Impact Ongoing Coaches and agents Gross margin, less one-time obsolescence charge, of 85.7% 84 – 85% G.M. Non-recurring V4 launch activities $1.6 million Sales & Marketing costs $1.5 – 2.0 million V3 inventory obsolescence $1.7 million Cost of Product Revenue $0.3 million Sales & Marketing costs none Ongoing, no cash difference Revenue deferment $3.6 million revenue deferral related to sales of V4, affecting Total Revenue, Consumer Revenue and US Revenue comparisons to previous periods sales bookings more relevant for comparisons to previous periods |
|
|
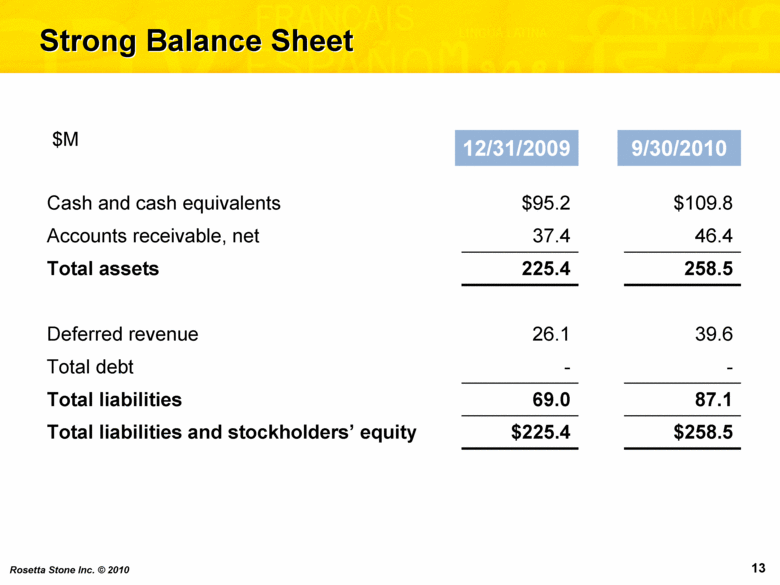
Strong Balance Sheet 12/31/2009 9/30/2010 Cash and cash equivalents $95.2 $109.8 Accounts receivable, net 37.4 46.4 Total assets 225.4 258.5 Deferred revenue 26.1 39.6 Total debt - - Total liabilities 69.0 87.1 Total liabilities and stockholders’ equity $225.4 $258.5 $M |
|
|
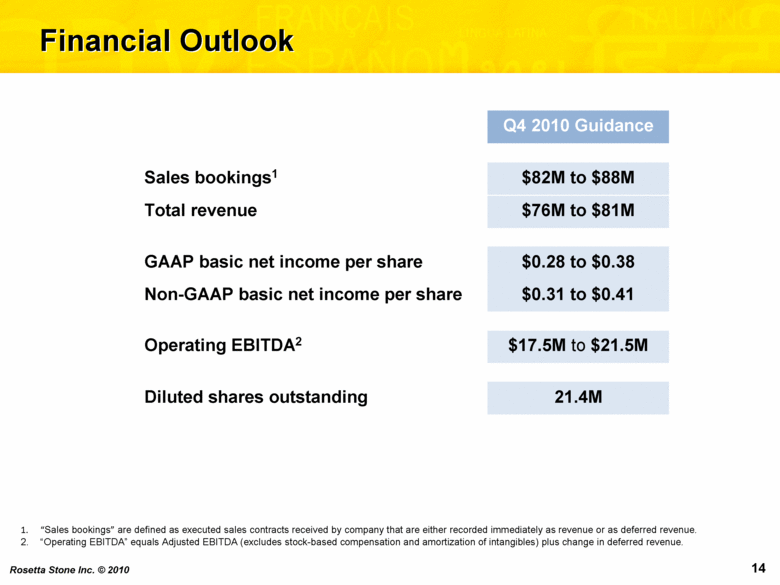
Financial Outlook Q4 2010 Guidance Sales bookings1 $82M to $88M Total revenue $76M to $81M GAAP basic net income per share $0.28 to $0.38 Non-GAAP basic net income per share $0.31 to $0.41 Operating EBITDA2 $17.5M to $21.5M Diluted shares outstanding 21.4M “Sales bookings” are defined as executed sales contracts received by company that are either recorded immediately as revenue or as deferred revenue. “Operating EBITDA” equals Adjusted EBITDA (excludes stock-based compensation and amortization of intangibles) plus change in deferred revenue. |
|
|
Tom Adams President and CEO November 10, 2010 |


