Attached files
Table of Contents
UNITED STATES
SECURITIES AND EXCHANGE COMMISSION
Washington, D.C. 20549
FORM 10-Q
| x | QUARTERLY REPORT PURSUANT TO SECTION 13 OR 15(d) OF THE SECURITIES EXCHANGE ACT OF 1934 |
For the quarterly period ended September 30, 2010
OR
| ¨ | TRANSITION REPORT PURSUANT TO SECTION 13 OR 15(d) OF THE SECURITIES EXCHANGE ACT OF 1934 |
For the transition period from to
Commission File No.: 0-51952
ALLIANCE HOLDINGS GP, L.P.
(Exact name of registrant as specified in its charter)
| Delaware | 03-0573898 | |
| (State or other jurisdiction of incorporation or organization) |
(IRS Employer Identification No.) |
1717 South Boulder Avenue, Suite 400, Tulsa, Oklahoma 74119
(Address of principal executive offices and zip code)
(918) 295-1415
(Registrant’s telephone number, including area code)
Indicate by check mark whether the registrant (1) has filed all reports required to be filed by Section 13 or 15(d) of the Securities Exchange Act of 1934 during the preceding 12 months (or for such shorter period that the registrant was required to file such reports), and (2) has been subject to such filing requirements for the past 90 days. x Yes ¨ No
Indicate by check mark whether the registrant has submitted electronically and posted on its corporate Web site, if any, every Interactive Data File required to be submitted and posted pursuant to Rule 405 of Regulation S-T during the preceding 12 months (or for such shorter period that the registrant was required to submit and post such files). ¨ Yes ¨ No
Indicate by check mark whether the registrant is a large accelerated filer, an accelerated filer, a non-accelerated filer, or a smaller reporting company. See definitions of “large accelerated filer,” “accelerated filer” and “smaller reporting company” in Rule 12b-2 of the Exchange Act. (check one)
| Large Accelerated Filer | ¨ | Accelerated Filer | x | |||
| Non-Accelerated Filer | ¨ (Do not check if smaller reporting company) | Smaller Reporting Company | ¨ | |||
Indicate by check mark whether the registrant is a shell company (as defined in Rule 12b-2 of the Exchange Act). ¨ Yes x No
As of November 8, 2010, 59,863,000 common units are outstanding.
Table of Contents
| PART I | ||||||
| FINANCIAL INFORMATION | ||||||
| Page | ||||||
| ITEM 1. |
Financial Statements (Unaudited) | |||||
| ALLIANCE HOLDINGS GP, L.P. AND SUBSIDIARIES | ||||||
| Condensed Consolidated Balance Sheets as of September 30, 2010 and December 31, 2009 | 1 | |||||
| Condensed Consolidated Statements of Income for the three and nine months ended September 30, 2010 and 2009 | 2 | |||||
| Condensed Consolidated Statements of Cash Flows for the nine months ended September 30, 2010 and 2009 | 3 | |||||
| Notes to Condensed Consolidated Financial Statements | 4 | |||||
| ITEM 2. |
Management’s Discussion and Analysis of Financial Condition and Results of Operations | 19 | ||||
| ITEM 3. |
Quantitative and Qualitative Disclosures about Market Risk | 41 | ||||
| ITEM 4. |
Controls and Procedures | 41 | ||||
| Forward-Looking Statements | 42 | |||||
| PART II | ||||||
| OTHER INFORMATION | ||||||
| ITEM 1. |
Legal Proceedings | 44 | ||||
| ITEM 1A. |
Risk Factors | 44 | ||||
| ITEM 2. |
Unregistered Sales of Equity Securities and Use of Proceeds | 46 | ||||
| ITEM 3. |
Defaults upon Senior Securities | 46 | ||||
| ITEM 4. |
Reserved | 46 | ||||
| ITEM 5. |
Other Information | 46 | ||||
| ITEM 6. |
Exhibits | 50 | ||||
(i)
Table of Contents
PART I
FINANCIAL INFORMATION
| ITEM 1. | FINANCIAL STATEMENTS |
ALLIANCE HOLDINGS GP, L.P. AND SUBSIDIARIES
CONDENSED CONSOLIDATED BALANCE SHEETS
(In thousands, except unit data)
(Unaudited)
| September 30, 2010 |
December 31, 2009 |
|||||||
| ASSETS |
||||||||
| CURRENT ASSETS: |
||||||||
| Cash and cash equivalents |
$ | 22,622 | $ | 24,361 | ||||
| Trade receivables |
128,038 | 91,223 | ||||||
| Other receivables |
2,628 | 3,159 | ||||||
| Due from affiliates |
1,676 | — | ||||||
| Inventories |
41,125 | 64,357 | ||||||
| Advance royalties |
1,952 | 3,629 | ||||||
| Prepaid expenses and other assets |
809 | 8,889 | ||||||
| Total current assets |
198,850 | 195,618 | ||||||
| PROPERTY, PLANT AND EQUIPMENT: |
||||||||
| Property, plant and equipment, at cost |
1,566,865 | 1,378,914 | ||||||
| Less accumulated depreciation, depletion and amortization |
(642,585 | ) | (556,370 | ) | ||||
| Total property, plant and equipment, net |
924,280 | 822,544 | ||||||
| OTHER ASSETS: |
||||||||
| Advance royalties |
29,532 | 26,802 | ||||||
| Other long-term assets |
25,914 | 9,303 | ||||||
| Total other assets |
55,446 | 36,105 | ||||||
| TOTAL ASSETS |
$ | 1,178,576 | $ | 1,054,267 | ||||
| LIABILITIES AND PARTNERS’ CAPITAL |
||||||||
| CURRENT LIABILITIES: |
||||||||
| Accounts payable |
$ | 70,206 | $ | 63,496 | ||||
| Due to affiliates |
433 | 27 | ||||||
| Accrued taxes other than income taxes |
15,379 | 10,792 | ||||||
| Accrued payroll and related expenses |
28,974 | 22,101 | ||||||
| Accrued interest |
6,543 | 2,918 | ||||||
| Workers’ compensation and pneumoconiosis benefits |
10,046 | 9,886 | ||||||
| Current capital lease obligation |
302 | 324 | ||||||
| Other current liabilities |
16,523 | 11,205 | ||||||
| Current maturities, long-term debt |
18,000 | 18,000 | ||||||
| Total current liabilities |
166,406 | 138,749 | ||||||
| LONG-TERM LIABILITIES: |
||||||||
| Long-term debt, excluding current maturities |
404,000 | 422,000 | ||||||
| Pneumoconiosis benefits |
35,547 | 34,344 | ||||||
| Accrued pension benefit |
19,127 | 19,696 | ||||||
| Workers’ compensation |
65,989 | 53,845 | ||||||
| Asset retirement obligations |
54,254 | 53,116 | ||||||
| Due to affiliates |
591 | 314 | ||||||
| Long-term capital lease obligation |
240 | 460 | ||||||
| Other liabilities |
11,094 | 9,043 | ||||||
| Total long-term liabilities |
590,842 | 592,818 | ||||||
| Total liabilities |
757,248 | 731,567 | ||||||
| COMMITMENTS AND CONTINGENCIES |
||||||||
| PARTNERS’ CAPITAL: |
||||||||
| Alliance Holdings GP, L.P. (“AHGP”) Partners’ Capital: |
||||||||
| Limited Partners – Common Unitholders 59,863,000 units outstanding |
312,680 | 269,742 | ||||||
| Accumulated other comprehensive loss |
(6,404 | ) | (7,465 | ) | ||||
| Total AHGP Partners’ Capital |
306,276 | 262,277 | ||||||
| Noncontrolling interests |
115,052 | 60,423 | ||||||
| Total Partners’ Capital |
421,328 | 322,700 | ||||||
| TOTAL LIABILITIES AND PARTNERS’ CAPITAL |
$ | 1,178,576 | $ | 1,054,267 | ||||
See notes to condensed consolidated financial statements.
1
Table of Contents
ALLIANCE HOLDINGS GP, L.P. AND SUBSIDIARIES
CONDENSED CONSOLIDATED STATEMENTS OF INCOME
(In thousands, except unit and per unit data)
(Unaudited)
| Three Months
Ended September 30, |
Nine Months
Ended September 30, |
|||||||||||||||
| 2010 | 2009 | 2010 | 2009 | |||||||||||||
| SALES AND OPERATING REVENUES: |
||||||||||||||||
| Coal sales |
$ | 396,655 | $ | 281,628 | $ | 1,146,719 | $ | 881,508 | ||||||||
| Transportation revenues |
7,111 | 11,663 | 25,637 | 35,347 | ||||||||||||
| Other sales and operating revenues |
6,590 | 6,246 | 18,866 | 15,671 | ||||||||||||
| Total revenues |
410,356 | 299,537 | 1,191,222 | 932,526 | ||||||||||||
| EXPENSES: |
||||||||||||||||
| Operating expenses (excluding depreciation, depletion and amortization) |
264,388 | 204,840 | 750,357 | 605,693 | ||||||||||||
| Transportation expenses |
7,111 | 11,663 | 25,637 | 35,347 | ||||||||||||
| Outside coal purchases |
5,736 | 517 | 12,122 | 5,709 | ||||||||||||
| General and administrative |
16,327 | 10,370 | 39,353 | 30,060 | ||||||||||||
| Depreciation, depletion and amortization |
37,587 | 28,145 | 109,560 | 83,767 | ||||||||||||
| Total operating expenses |
331,149 | 255,535 | 937,029 | 760,576 | ||||||||||||
| INCOME FROM OPERATIONS |
79,207 | 44,002 | 254,193 | 171,950 | ||||||||||||
| Interest expense (net of interest capitalized for the three and nine months ended September 30, 2010 and 2009 of $67, $310, $758 and $857, respectively) |
(7,633 | ) | (7,675 | ) | (22,667 | ) | (23,464 | ) | ||||||||
| Interest income |
47 | 121 | 148 | 1,065 | ||||||||||||
| Other income |
460 | 126 | 614 | 554 | ||||||||||||
| INCOME BEFORE INCOME TAXES |
72,081 | 36,574 | 232,288 | 150,105 | ||||||||||||
| INCOME TAX EXPENSE |
995 | 585 | 1,586 | 811 | ||||||||||||
| NET INCOME |
71,086 | 35,989 | 230,702 | 149,294 | ||||||||||||
| LESS: NET INCOME ATTRIBUTABLE TO NONCONTROLLING INTERESTS |
(31,602 | ) | (12,300 | ) | (103,956 | ) | (61,070 | ) | ||||||||
| NET INCOME ATTRIBUTABLE TO ALLIANCE HOLDINGS GP, L.P. (“NET INCOME OF AHGP”) |
$ | 39,484 | $ | 23,689 | $ | 126,746 | $ | 88,224 | ||||||||
| BASIC AND DILUTED NET INCOME OF AHGP PER LIMITED PARTNER UNIT |
$ | 0.66 | $ | 0.40 | $ | 2.12 | $ | 1.47 | ||||||||
| DISTRIBUTIONS PAID PER LIMITED PARTNER UNIT |
$ | 0.4825 | $ | 0.4275 | $ | 1.40 | $ | 1.245 | ||||||||
| WEIGHTED AVERAGE NUMBER OF UNITS OUTSTANDING-BASIC AND DILUTED |
59,863,000 | 59,863,000 | 59,863,000 | 59,863,000 | ||||||||||||
See notes to condensed consolidated financial statements.
2
Table of Contents
ALLIANCE HOLDINGS GP, L.P. AND SUBSIDIARIES
CONDENSED CONSOLIDATED STATEMENTS OF CASH FLOWS
(In thousands)
(Unaudited)
| Nine Months Ended September 30, |
||||||||
| 2010 | 2009 | |||||||
| CASH FLOWS PROVIDED BY OPERATING ACTIVITIES |
$ | 391,213 | $ | 236,881 | ||||
| CASH FLOWS FROM INVESTING ACTIVITIES: |
||||||||
| Property, plant and equipment: |
||||||||
| Capital expenditures |
(233,773 | ) | (251,453 | ) | ||||
| Changes in accounts payable and accrued liabilities |
(6,298 | ) | 5,084 | |||||
| Proceeds from sale of property, plant and equipment |
353 | 1 | ||||||
| Purchase of marketable securities |
— | (4,527 | ) | |||||
| Receipts of prior advances on Gibson rail project |
1,597 | 1,828 | ||||||
| Net cash used in investing activities |
(238,121 | ) | (249,067 | ) | ||||
| CASH FLOWS FROM FINANCING ACTIVITIES: |
||||||||
| Borrowings under revolving credit facilities |
95,000 | — | ||||||
| Payments under revolving credit facilities |
(95,000 | ) | — | |||||
| Payments on capital lease obligation |
(242 | ) | (261 | ) | ||||
| Payment on long-term debt |
(18,000 | ) | (18,000 | ) | ||||
| Net settlement of employee withholding taxes on vesting of ARLP Long-Term Incentive Plan |
(1,265 | ) | (791 | ) | ||||
| Distributions paid by consolidated partnership to noncontrolling interests |
(51,242 | ) | (47,010 | ) | ||||
| Distributions paid to Partners |
(83,808 | ) | (74,529 | ) | ||||
| Net cash used in financing activities |
(154,557 | ) | (140,591 | ) | ||||
| EFFECT OF CURRENCY TRANSLATION ON CASH |
(274 | ) | 187 | |||||
| NET CHANGE IN CASH AND CASH EQUIVALENTS |
(1,739 | ) | (152,590 | ) | ||||
| CASH AND CASH EQUIVALENTS AT BEGINNING OF PERIOD |
24,361 | 246,708 | ||||||
| CASH AND CASH EQUIVALENTS AT END OF PERIOD |
$ | 22,622 | $ | 94,118 | ||||
| SUPPLEMENTAL CASH FLOW INFORMATION: |
||||||||
| Cash paid for interest |
$ | 19,354 | $ | 20,734 | ||||
| Cash paid for income taxes |
$ | 888 | $ | 225 | ||||
| NON-CASH INVESTING AND FINANCING ACTIVITY: |
||||||||
| Accounts payable for purchase of property, plant and equipment |
$ | 14,521 | $ | 20,176 | ||||
| Market value of ARLP common units vested in ARLP’s Long-Term Incentive Plan before minimum statutory tax withholding requirements |
$ | 3,396 | $ | 2,333 | ||||
See notes to condensed consolidated financial statements.
3
Table of Contents
ALLIANCE HOLDINGS GP, L.P. AND SUBSIDIARIES
NOTES TO CONDENSED CONSOLIDATED FINANCIAL STATEMENTS
(Unaudited)
| 1. | ORGANIZATION AND PRESENTATION |
Significant Relationships Referenced in Notes to Condensed Consolidated Financial Statements
| • | References to “we,” “us,” “our” or “AHGP” mean Alliance Holdings GP, L.P., individually as the parent company, and not on a consolidated basis. |
| • | References to “AHGP Partnership” mean the business and operations of Alliance Holdings GP, L.P., the parent company, as well as its consolidated subsidiaries, which include Alliance Resource Management GP, LLC and Alliance Resource Partners, L.P. and its consolidated subsidiaries. |
| • | References to “AGP” mean Alliance GP, LLC, the general partner of Alliance Holdings GP, L.P., also referred to as our general partner. |
| • | References to “ARLP Partnership” mean the business and operations of Alliance Resource Partners, L.P., the parent company, as well as its consolidated subsidiaries. |
| • | References to “ARLP” mean Alliance Resource Partners, L.P., individually as the parent company, and not on a consolidated basis. |
| • | References to “MGP” mean Alliance Resource Management GP, LLC, the managing general partner of Alliance Resource Partners, L.P. |
| • | References to “SGP” mean Alliance Resource GP, LLC, the special general partner of Alliance Resource Partners, L.P. |
| • | References to “Intermediate Partnership” mean Alliance Resource Operating Partners, L.P., the intermediate partnership of Alliance Resource Partners, L.P. |
| • | References to “Alliance Coal” mean Alliance Coal, LLC, the holding company for the operations of Alliance Resource Operating Partners, L.P. |
Organization and Formation
We are a Delaware limited partnership listed on the NASDAQ Global Select Market under the ticker symbol “AHGP.” We own directly and indirectly 100% of the members’ interest in MGP, ARLP’s managing general partner. The ARLP Partnership is a diversified producer and marketer of coal to major United States (“U.S.”) utilities and industrial users. ARLP conducts substantially all of its business through its wholly-owned subsidiary, the Intermediate Partnership. ARLP and the Intermediate Partnership were formed in May 1999, to acquire, upon completion of ARLP’s initial public offering on August 19, 1999, certain coal and marketing assets of Alliance Resource Holdings, Inc. (“ARH”), a Delaware Corporation. We and ARH, through its wholly-owned subsidiary, SGP, maintain general partner interests in ARLP and the Intermediate Partnership. In June 2006, ARH and its parent company became wholly-owned, directly and indirectly, by Joseph W. Craft III, the Chairman, President and Chief Executive Officer of AGP and a Director and the President and Chief Executive Officer of MGP.
We are owned 100% by limited partners. Our general partner, AGP, has a non-economic interest in us and is owned by Mr. Craft.
4
Table of Contents
Basis of Presentation
The accompanying condensed consolidated financial statements include the accounts and operations of the AHGP Partnership and present our financial position as of September 30, 2010 and December 31, 2009, results of our operations for the three and nine months ended September 30, 2010 and 2009 and cash flows for the nine months ended September 30, 2010 and 2009. All of our intercompany transactions and accounts have been eliminated. Net income attributable to Alliance Holdings GP, L.P. from within our accompanying condensed consolidated financial statements will be described as “Net Income of AHGP.”
Since we own MGP, our condensed consolidated financial statements reflect the consolidated results of the ARLP Partnership. The earnings of the ARLP Partnership allocated to its limited partners’ interests not owned by us and allocated to SGP’s general partner interest in ARLP are reflected as net income attributable to noncontrolling interest on our condensed consolidated statement of income and Partners’ Capital and as noncontrolling interest on our condensed consolidated balance sheets. Our consolidated financial statements do not differ materially from those of the ARLP Partnership. The differences between our financial statements and those of the ARLP Partnership are primarily attributable to (a) amounts reported as noncontrolling interests and (b) additional general and administrative costs and taxes attributable to us. The additional general and administrative costs principally consist of costs incurred by us as a result of being a publicly traded partnership, amounts billed by, and reimbursed to, Alliance Coal under an administrative services agreement and amounts billed by, and reimbursed to, AGP under our partnership agreement.
These condensed consolidated financial statements and notes are unaudited. However, in the opinion of management, these financial statements reflect all adjustments (which include only normal recurring adjustments) necessary for a fair presentation of the results for the periods presented. Results for interim periods are not necessarily indicative of results for a full year.
These condensed consolidated financial statements and notes are prepared pursuant to the rules and regulations of the Securities and Exchange Commission for interim reporting and should be read in conjunction with the consolidated financial statements and notes included in our Annual Report on Form 10-K for the year ended December 31, 2009.
Use of Estimates
The preparation of AHGP Partnership’s condensed consolidated financial statements in conformity with generally accepted accounting principles (“GAAP”) of the U.S. requires management to make estimates and assumptions that affect the reported amounts and disclosures in our condensed consolidated financial statements. Actual results could differ from those estimates.
| 2. | NEW ACCOUNTING STANDARDS |
New Accounting Standards Issued and Adopted
In December 2009, the Financial Accounting Standards Board (“FASB”) issued Accounting Standards Update (“ASU”) 2009-17, Improvements to Financial Reporting by Enterprises Involved with Variable Interest Entities (“ASU 2009-17”). ASU 2009-17 codified Statement of Financial Accounting Standards No. 167, Amendments to FASB Interpretation No. 46(R)), which changed the consolidation guidance applicable to a variable interest entity (“VIE”). ASU 2009-17 updated the guidance governing the determination of whether an enterprise is the primary beneficiary of a VIE, and is, therefore, required to consolidate such VIE, by requiring a qualitative analysis rather than a quantitative analysis. The
5
Table of Contents
qualitative analysis includes, among other things, consideration of whether the enterprise has the power to direct the activities of the entity that most significantly impact the entity’s economic performance and has the obligation to absorb losses or the right to receive benefits of the VIE that could potentially be significant to the VIE. ASU 2009-17 also requires continuous reassessments of whether an enterprise is the primary beneficiary of a VIE. Previously, FASB Accounting Standards Codification (“ASC”) 810, Consolidation, required reconsideration of whether an enterprise was the primary beneficiary of a VIE only when specific events had occurred. Qualifying special purpose entities, which were previously exempt from the application of this standard, are now subject to the provisions of ASU 2009-17. In addition, ASU 2009-17 also requires enhanced disclosures about an enterprise’s involvement with a VIE. The provisions of ASU 2009-17 were effective as of the beginning of interim and annual reporting periods that began after November 15, 2009. Based on our evaluation of ASU 2009-17, the ARLP Partnership deconsolidated Mid-America Carbonates, LLC (“MAC”) upon adoption, effective January 1, 2010 (Note 8). The deconsolidation of MAC did not have a material impact on our condensed consolidated financial statements.
In January 2010, the FASB issued ASU 2010-06, Improving Disclosures About Fair Value Measurements (“ASU 2010-06”). ASU 2010-06 amended guidance on certain aspects of FASB ASC 820, Fair Value Measurements and Disclosures, to add new requirements for disclosures of transfers into and out of Level 1 and 2 measurements and separate disclosures about purchases, sales, issuances, and settlements relating to Level 3 measurements, all on a gross basis. ASU 2010-06 also clarifies existing fair value disclosures regarding the level of disaggregation and the inputs and valuation techniques used to measure fair value. The provisions of ASU 2010-06 were effective for the first reporting period beginning after December 15, 2009, except for the requirement to provide Level 3 activity of purchases, sales, issuances, and settlements on a gross basis, which will be effective for fiscal years beginning after December 15, 2010. The adoption of ASU 2010-06 did not have an impact on our condensed consolidated financial statements.
| 3. | CONTINGENCIES |
We are not engaged in any material litigation. The ARLP Partnership is involved in various lawsuits, claims and regulatory proceedings incidental to its business. The ARLP Partnership records an accrual for a potential loss related to these matters when, in management’s opinion, such loss is probable and reasonably estimable. Based on known facts and circumstances, the ARLP Partnership believes the ultimate outcome of these outstanding lawsuits, claims and regulatory proceedings will not have a material adverse effect on its financial condition, results of operations or liquidity. However, if the results of these matters were different from management’s current opinion and in amounts greater than the ARLP Partnership’s accruals, then they could have a material adverse effect.
The matters referenced in the previous paragraph include, but are not limited to, the George W. Rector v. White County Coal, LLC lawsuit, which is a royalty dispute involving certain coal leases that had been previously terminated. Plaintiffs have alleged damages of $33 million or more and have also asserted a claim for punitive damages. A bench trial of this case was concluded in November 2009 and closing arguments were heard on February 10, 2010, but we have not received a written decision from the court. The ARLP Partnership believes plaintiffs’ claims are without merit, have accrued no loss and is vigorously defending the litigation.
6
Table of Contents
| 4. | PATTIKI VERTICAL HOIST CONVEYOR SYSTEM FAILURE |
On May 13, 2010, White County Coal, LLC’s (“White County Coal”) Pattiki mine was temporarily idled following the failure of the vertical hoist conveyor system used in conveying raw coal out of the mine. On July 19, 2010, White County Coal’s efforts to repair the vertical hoist conveyor system had progressed sufficiently to allow resumption of limited production operations. The ARLP Partnership’s operating expenses for the nine months ended September 30, 2010 includes $1.2 million for retirement of certain assets related to the failed vertical hoist conveyor system in addition to other repair and clean-up expenses that were not significant on a consolidated or segment basis. The ARLP Partnership is conducting a final review of its commercial property (including business interruption) insurance policies, which at the time of the equipment failure provided for self-retention, various deductibles and 22% co-insurance for the first $50 million in coverage. As the loss on the vertical hoist conveyor system did not exceed its deductible for property damage, the ARLP Partnership currently believes recovery is unlikely under such policies.
While the Pattiki mine was temporarily idled, the ARLP Partnership expanded coal production at its other coal mines in the region, including the addition of the seventh and eighth production units at the River View Coal, LLC’s (“River View”) mine, to partially offset the loss of production from the Pattiki mine. Consequently, the temporary idling of the Pattiki mine did not have a material adverse impact on the ARLP Partnership’s results of operations and cash flows. On July 19, 2010, the Pattiki mine resumed limited production while White County Coal continues to assess the effectiveness and reliability of the repaired vertical hoist conveyor system until such time it determines the system can be operated at full capacity. The ARLP Partnership is now operating six unit shifts at Pattiki and plans to add two more unit shifts during the quarter ending December 31, 2010, bringing Pattiki back to full capacity by the end of the year.
| 5. | FAIR VALUE MEASUREMENTS |
We apply the provisions of FASB ASC 820, Fair Value Measurements and Disclosures, which, among other things, defines fair value, requires enhanced disclosures about assets and liabilities carried at fair value and establishes a hierarchal disclosure framework based upon the quality of inputs used to measure fair value.
Valuation techniques are based upon observable and unobservable inputs. Observable inputs reflect market data obtained from independent sources, while unobservable inputs reflect our own market assumptions. These two types of inputs create the following fair value hierarchy:
| • | Level 1 – Quoted prices for identical instruments in active markets. |
| • | Level 2 – Quoted prices for similar instruments in active markets; quoted prices for identical or similar instruments in markets that are not active; and model derived valuations whose inputs are observable or whose significant value drivers are observable. |
| • | Level 3 – Instruments whose significant value drivers are unobservable. |
The carrying amounts for accounts receivable and accounts payable approximate fair value because of the short maturity of those instruments. At September 30, 2010 and December 31, 2009, the estimated fair value of the ARLP Partnership’s fixed rate term debt, including current maturities, was approximately $482.1 million and $460.7 million, respectively, based on interest rates that it believes is currently available to it for issuance of debt with similar terms and remaining maturities (Note 6).
7
Table of Contents
| 6. | LONG-TERM DEBT |
Long-term debt consists of the following, (in thousands):
| September 30, 2010 |
December 31, 2009 |
|||||||
| AHGP credit facility |
$ | — | $ | — | ||||
| ARLP revolving credit facility |
— | — | ||||||
| ARLP senior notes |
72,000 | 90,000 | ||||||
| ARLP series A senior notes |
205,000 | 205,000 | ||||||
| ARLP series B senior notes |
145,000 | 145,000 | ||||||
| 422,000 | 440,000 | |||||||
| Less current maturities |
(18,000 | ) | (18,000 | ) | ||||
| Total long-term debt |
$ | 404,000 | $ | 422,000 | ||||
The Intermediate Partnership has a $150.0 million revolving credit facility (“ARLP Credit Facility”), $72.0 million in senior notes and $205.0 million in Series A and $145.0 million in Series B senior notes (collectively, the “ARLP Debt Arrangements”), which are guaranteed by all of the direct and indirect subsidiaries of the Intermediate Partnership. The ARLP Debt Arrangements contain various covenants affecting the Intermediate Partnership and its subsidiaries restricting, among other things, the amount of distributions by the Intermediate Partnership, the incurrence of additional indebtedness and liens, the sale of assets, the making of investments, the entry into mergers and consolidations and the entry into transactions with affiliates, in each case subject to various exceptions. The ARLP Debt Arrangements also require the Intermediate Partnership to remain in control of a certain amount of mineable coal reserves relative to its annual production. In addition, the ARLP Debt Arrangements require the Intermediate Partnership to maintain the following: (i) debt to cash flow ratio of not more than 3.0 to 1.0, (ii) cash flow to interest expense ratio of not less than 4.0 to 1.0, in each case, during the four most recently ended fiscal quarters and (iii) maximum annual capital expenditures, excluding acquisitions, of $471.8 million for 2010. The debt to cash flow ratio and cash flow to interest expense ratio were 0.77 to 1.0 and 17.5 to 1.0, respectively, for the trailing twelve months ended September 30, 2010. Actual capital expenditures were $233.8 million for the nine months ended September 30, 2010. The ARLP Partnership was in compliance with the covenants of the ARLP Debt Arrangements as of September 30, 2010.
We have a $2.0 million revolving credit facility (“AHGP Credit Facility”) with C-Holdings, LLC, which owns 100% of the members’ interest of our general partner, AGP, and is controlled by Joseph W. Craft, III, Chairman, President and Chief Executive Officer of AGP. There are no material operating restrictions, financial restrictions or covenants in the AHGP Credit Facility.
Lehman Commercial Paper, Inc. (“Lehman”), a subsidiary of Lehman Brothers Holding, Inc., held a 5%, or $7.5 million, commitment in the $150 million ARLP Credit Facility. On February 11, 2010, the ARLP Partnership gave its lenders a notice of borrowing under the ARLP Credit Facility and, in response to that notice, Lehman notified the ARLP Partnership that it would not fund its proportionate share of the borrowing. As a result, as of February 11, 2010, Lehman became a defaulting lender and on October 6, 2010, was removed as a commitment holder under the ARLP Credit Facility. Consequently, availability for borrowing under the ARLP Credit Facility was reduced by $7.5 million.
8
Table of Contents
At September 30, 2010, the ARLP Partnership had $11.6 million of letters of credit outstanding with $130.9 million available for borrowing and it had no borrowings outstanding under the ARLP Credit Facility. The ARLP Partnership incurs an annual commitment fee of 0.375% on the undrawn portion of the ARLP Credit Facility.
| 7. | NONCONTROLLING INTERESTS |
We apply the provisions of FASB ASC 810, Consolidation, which were amended on January 1, 2010 by ASU 2009-17 (Note 2). As required by FASB ASC 810, our noncontrolling ownership interest in consolidated subsidiaries is presented in the consolidated balance sheet within partners’ capital as a separate component from the parent’s equity. In addition, consolidated net income includes earnings attributable to both the parent and the noncontrolling interests.
The noncontrolling interests balance is comprised of non-affiliate and affiliate ownership interests in the net assets of the ARLP Partnership that we consolidate (Note 1) and prior to January 1, 2010, a third-party ownership interest in MAC. The following table summarizes the components of noncontrolling interests recorded in Partners’ Capital for the periods indicated (in thousands):
| September
30, 2010 |
December
31, 2009 |
|||||||
| Noncontrolling interests reflected in Partners’ Capital: |
||||||||
| Affiliate (SGP) |
$ | (303,820 | ) | $ | (303,830 | ) | ||
| Non-Affiliates (ARLP’s non-affiliate limited partners) |
427,200 | 372,820 | ||||||
| MAC |
— | 1,117 | ||||||
| Accumulated other comprehensive loss attributable to noncontrolling interests |
(8,328 | ) | (9,684 | ) | ||||
| Total noncontrolling interests |
$ | 115,052 | $ | 60,423 | ||||
The noncontrolling interest designated as Affiliate represents SGP’s 0.01% general partner interest in ARLP and 0.01% general partner interest in the Intermediate Partnership.
The noncontrolling interest designated as Non-Affiliates represents the limited partners’ interest in ARLP controlled through the common unit ownership, excluding the 15,544,169 common units of ARLP held by us. The total obligation associated with ARLP’s Long-Term Incentive Plan (“ARLP LTIP”) is also included in the Non-Affiliates component of noncontrolling interest (Note 10).
For the quarter ending September 30, 2009, the noncontrolling interest designated as MAC represents a 50% third-party interest in MAC. The ARLP Partnership deconsolidated MAC on January 1, 2010 (Note 8).
9
Table of Contents
The following table summarizes net income attributable to each component of the noncontrolling interests for the periods indicated (in thousands):
| Three Months
Ended September 30, |
Nine Months
Ended September 30, |
|||||||||||||||
| 2010 | 2009 | 2010 | 2009 | |||||||||||||
| Net income attributable to noncontrolling interest: |
||||||||||||||||
| Affiliate (SGP) |
$ | 11 | $ | 5 | $ | 37 | $ | 22 | ||||||||
| Non-Affiliates (ARLP’s non-affiliate limited partners) |
31,591 | 12,242 | 103,919 | 60,816 | ||||||||||||
| MAC |
— | 53 | — | 232 | ||||||||||||
| $ | 31,602 | $ | 12,300 | $ | 103,956 | $ | 61,070 | |||||||||
The following table summarizes cash distributions paid by ARLP to each component of the noncontrolling interests for the periods indicated (in thousands):
| Nine Months
Ended September 30, |
||||||||
| 2010 | 2009 | |||||||
| Distributions paid to noncontrolling interests: |
||||||||
| Affiliate (SGP) (1) |
$ | 27 | $ | 24 | ||||
| Non-Affiliates (ARLP’s non-affiliate limited partners) (1) |
51,215 | 46,986 | ||||||
| MAC |
— | — | ||||||
| $ | 51,242 | $ | 47,010 | |||||
| (1) | Distributions paid to noncontrolling interests, in the table above, represent ARLP’s quarterly distributions in accordance with the ARLP partnership agreement. |
The Affiliate component of noncontrolling interest represents SGP’s cumulative investment basis in the net assets of the ARLP Partnership. After the consummation of the various transactions associated with the ARLP Partnership’s formation and initial public offering transaction in 1999 (which included the contribution of net assets by SGP to the ARLP Partnership, the retention by SGP of debt borrowings assumed by ARLP and a distribution by ARLP to SGP), SGP’s investment basis in ARLP totaled $(303.9) million. SGP’s investment basis as of September 30, 2010 and December 31, 2009 also reflects the cumulative amount of nominal ARLP income allocations and distributions to SGP and nominal contributions by SGP to ARLP and the Intermediate Partnership to maintain its general partner interests.
10
Table of Contents
The following tables present the change in Partners’ Capital for the nine months ended September 30, 2010 and 2009 (in thousands):
| Alliance Holdings GP, L.P. | ||||||||||||||||
| Limited Partners’ Capital |
Accumulated Other Comprehensive Income (Loss) |
Noncontrolling Interest |
Total Partners’ Capital |
|||||||||||||
| Balance at January 1, 2010 |
$ | 269,742 | $ | (7,465 | ) | $ | 60,423 | $ | 322,700 | |||||||
| Net income |
126,746 | — | 103,956 | 230,702 | ||||||||||||
| Other comprehensive income |
— | 1,061 | 1,356 | 2,417 | ||||||||||||
| Deconsolidation of MAC (Note 8) |
— | — | (1,117 | ) | (1,117 | ) | ||||||||||
| Vesting of ARLP Long-Term Incentive Plan |
— | — | (1,265 | ) | (1,265 | ) | ||||||||||
| Common unit-based compensation under ARLP Long-Term Incentive Plan |
— | — | 2,941 | 2,941 | ||||||||||||
| Distributions on ARLP common unit-based compensation |
— | — | (973 | ) | (973 | ) | ||||||||||
| Distributions to AHGP Partners |
(83,808 | ) | — | — | (83,808 | ) | ||||||||||
| Distributions paid by consolidated partnership to noncontrolling interest |
— | — | (50,269 | ) | (50,269 | ) | ||||||||||
| Balance at September 30, 2010 |
$ | 312,680 | $ | (6,404 | ) | $ | 115,052 | $ | 421,328 | |||||||
| Alliance Holdings GP, L.P. | ||||||||||||||||
| Limited Partners’ Capital |
Accumulated Other Comprehensive Income (Loss) |
Noncontrolling Interest |
Total Partners’ Capital |
|||||||||||||
| Balance at January 1, 2009 |
$ | 256,395 | $ | (8,673 | ) | $ | 43,450 | $ | 291,172 | |||||||
| Net income |
88,224 | — | 61,070 | 149,294 | ||||||||||||
| Other comprehensive income |
— | 660 | 831 | 1,491 | ||||||||||||
| Vesting of ARLP Long-Term Incentive Plan |
— | — | (791 | ) | (791 | ) | ||||||||||
| Common unit-based compensation under ARLP Long-Term Incentive Plan |
— | — | 2,676 | 2,676 | ||||||||||||
| Distributions on ARLP common unit-based compensation |
— | — | (773 | ) | (773 | ) | ||||||||||
| Distributions to AHGP Partners |
(74,529 | ) | — | — | (74,529 | ) | ||||||||||
| Distributions paid by consolidated partnership to noncontrolling interest |
— | — | (46,237 | ) | (46,237 | ) | ||||||||||
| Balance at September 30, 2009 |
$ | 270,090 | $ | (8,013 | ) | $ | 60,226 | $ | 322,303 | |||||||
| 8. | MID-AMERICA CARBONATES |
We apply the provisions of FASB ASC 810, Consolidation, which were amended on January 1, 2010 (Note 2). Based on our evaluation of these amendments, the ARLP Partnership deconsolidated MAC effective January 1, 2010.
White County Coal and Alexander J. House (“House”) entered into a limited liability company agreement in 2006 to form MAC, which manufactures and sells rock dust. Consistent with prior years, the ARLP Partnership has a 50% ownership interest in MAC. Previously, the ARLP Partnership consolidated MAC’s financial results in accordance with FASB ASC 810. However, based on the
11
Table of Contents
provisions of ASU 2009-17, the ARLP Partnership concluded that we are no longer the primary beneficiary of MAC and thus deconsolidated MAC as House has the power to direct the activities that most significantly impact the entity’s economic performance.
We adopted the amendments to FASB ASC 810 on January 1, 2010. As a result, we reclassified $1.1 million from noncontrolling interest in partners’ capital to other long-term assets in our condensed consolidated balance sheets. We did not retrospectively apply the provisions of ASU 2009-17 as allowed by the amendments. The ARLP Partnership’s equity investment in MAC is $1.3 million at September 30, 2010.
MAC has a $1.75 million Revolving Credit Agreement (“Revolver”) with ARLP. On November 17, 2009, MAC entered into Amendment No. 2, effective September 30, 2009, which increased the Revolver to $1.75 million from $1.5 million. The Revolver is scheduled to expire on December 31, 2010. At September 30, 2010, MAC owed ARLP $1.7 million under the Revolver, which is classified as Due from Affiliates on our condensed consolidated balance sheets.
| 9. | WORKERS’ COMPENSATION AND PNEUMOCONIOSIS (“BLACK LUNG”) |
The changes in the workers’ compensation liability (including current and long-term liability balances) for each of the periods presented were as follows (in thousands):
| Three Months
Ended September 30, |
Nine Months
Ended September 30, |
|||||||||||||||
| 2010 | 2009 | 2010 | 2009 | |||||||||||||
| Beginning balance |
$ | 70,050 | $ | 63,082 | $ | 63,220 | $ | 56,671 | ||||||||
| Accruals increase |
5,120 | 4,703 | 14,931 | 13,850 | ||||||||||||
| Payments |
(2,494 | ) | (3,459 | ) | (7,312 | ) | (9,412 | ) | ||||||||
| Interest accretion |
833 | 864 | 2,499 | 2,592 | ||||||||||||
| Valuation loss |
2,015 | 3,193 | 2,186 | 4,682 | ||||||||||||
| Ending balance |
$ | 75,524 | $ | 68,383 | $ | 75,524 | $ | 68,383 | ||||||||
Pneumoconiosis
The Patient Protection and Affordable Care Act, which was signed into law by President Obama in March 2010, amended previous legislation related to coal workers’ Black Lung providing automatic extension of awarded lifetime benefits to surviving spouses and providing changes to the legal criteria used to assess and award claims. The ARLP Partnership is not presently able to estimate the impact of this legislation on its obligations and its future service period charges related to future claims due to uncertainty about the number of claims that will be filed, how the new award criteria will impact these claim populations and the effect of regulations relating to the retroactive application of certain criteria. The ARLP Partnership expects to complete an evaluation of the obligation by the end of fiscal year 2010 assuming regulations are issued by that time. For more information, please read “Part I. Item 2. Management’s Discussion and Analysis of Financial Condition and Results of Operations—Health Care Reform” of this Quarterly Report on Form 10-Q.
12
Table of Contents
| 10. | COMPENSATION PLANS |
ARLP Partnership
The ARLP Partnership maintains the ARLP LTIP for certain employees and officers of MGP and its affiliates who perform services for the ARLP Partnership. The ARLP LTIP awards are grants of non-vested notional units, which upon satisfaction of vesting requirements entitle the ARLP LTIP participant to receive ARLP common units. On January 26, 2010, the compensation committee (“MGP Compensation Committee”) of the board of directors of MGP (“MGP Board of Directors”) determined that the vesting requirements for the 2007 grants of 88,975 units (which are net of 4,500 forfeitures) had been satisfied as of January 1, 2010. As a result of this vesting, on February 12, 2010, the ARLP Partnership issued 55,826 unrestricted common units to the ARLP LTIP participants. The remaining units were settled in cash to satisfy the individual tax withholding obligations for the ARLP LTIP participants. On February 1, 2010, the MGP Compensation Committee authorized additional grants up to 143,145 restricted units, of which 138,130 were granted during the nine months ended September 30, 2010, all of which will vest on January 1, 2013 subject to satisfaction of certain financial tests. The fair value of these 2010 grants is equal to the intrinsic value at the date of grant, which was $39.59 per unit on a weighted average basis. ARLP LTIP expense was $1.0 million, $0.9 million, $2.9 million and $2.7 million for the three and nine months ended September 30, 2010 and 2009, respectively. On October 23, 2009, ARLP unitholders approved the third amendment (“Third Amendment”) to the ARLP LTIP. The Third Amendment was previously authorized by the MGP Board of Directors, subject to unitholder approval. The Third Amendment increased the number of units available for issuance under the ARLP LTIP from 1.2 million to 3.6 million, providing 2.4 million units for satisfaction of future awards. After consideration of the January 1, 2010 vesting and subsequent issuance of 55,826 common units, approximately 2.3 million units remain available for issuance in the future, assuming all grants issued in 2008, 2009 and 2010 currently outstanding are settled with common units and no future forfeitures occur.
As of September 30, 2010, there was $5.9 million in total unrecognized compensation expense related to the non-vested ARLP LTIP grants that are expected to vest. That expense is expected to be recognized over a weighted-average period of 1.4 years. As of September 30, 2010, the intrinsic value of the non-vested ARLP LTIP grants was $22.1 million. As of September 30, 2010, the total obligation associated with the ARLP LTIP was $6.5 million and is included in the noncontrolling interests line item in our condensed consolidated balance sheets.
As provided under the distribution equivalent rights provisions of the ARLP LTIP, all non-vested grants include contingent rights to receive quarterly cash distributions in an amount equal to the cash distributions ARLP makes to its unitholders during the vesting period.
AHGP Partnership
We have also adopted a Long-Term Incentive Plan (the “AHGP LTIP”) for employees, directors and consultants of our general partner and its affiliates, including the ARLP Partnership. Grants under the AHGP LTIP are to be made in AHGP restricted units, which are “phantom” units that entitle the grantee to receive either a common unit or equivalent amount of cash upon the vesting of the phantom units. The aggregate number of common units reserved for issuance under the AHGP LTIP is 5,215,000. There have been no grants under the AHGP LTIP as of September 30, 2010.
13
Table of Contents
| 11. | COMPONENTS OF PENSION PLAN NET PERIODIC BENEFIT COSTS |
Eligible employees at certain of the ARLP Partnership’s mining operations participate in a defined benefit plan (the “Pension Plan”) sponsored by the ARLP Partnership. The benefit formula for the Pension Plan is a fixed dollar unit based on years of service. Components of the net periodic benefit cost for each of the periods presented are as follows (in thousands):
| Three Months
Ended September 30, |
Nine Months
Ended September 30, |
|||||||||||||||
| 2010 | 2009 | 2010 | 2009 | |||||||||||||
| Service cost |
$ | 713 | $ | 667 | $ | 2,139 | $ | 2,001 | ||||||||
| Interest cost |
839 | 755 | 2,519 | 2,264 | ||||||||||||
| Expected return on plan assets |
(922 | ) | (608 | ) | (2,768 | ) | (1,824 | ) | ||||||||
| Amortization of net loss |
269 | 355 | 806 | 1,066 | ||||||||||||
| Net periodic benefit cost |
$ | 899 | $ | 1,169 | $ | 2,696 | $ | 3,507 | ||||||||
We previously disclosed in our financial statements for the year ended December 31, 2009 that the ARLP Partnership expected to contribute $9.8 million to the Pension Plan in 2010 for the 2009 plan year. During 2010, the ARLP Partnership received a final funding report for the 2009 plan year, which included updated assumptions on expected retirement patterns, interest rate analysis and asset value method. The finalization of these assumptions significantly decreased the ARLP Partnership’s required funding in 2010 for the 2009 plan year. During the nine months ended September 30, 2010, the ARLP Partnership made contribution payments of $1.1 million and $1.4 million for the 2009 and 2010 plan years, respectively. No further contribution payments are required for the 2009 plan year.
14
Table of Contents
| 12. | COMPREHENSIVE INCOME |
Total comprehensive income for the three and nine months ended September 30, 2010 and 2009, respectively, is as follows (in thousands):
| Three Months
Ended September 30, |
Nine Months
Ended September 30, |
|||||||||||||||
| 2010 | 2009 | 2010 | 2009 | |||||||||||||
| Net income |
$ | 71,086 | $ | 35,989 | $ | 230,702 | $ | 149,294 | ||||||||
| Other comprehensive income: |
||||||||||||||||
| Unrealized (loss)/gain on marketable securities |
— | (142 | ) | — | 425 | |||||||||||
| Actuarially determined long-term liability adjustments |
1,879 | 355 | 2,417 | 1,066 | ||||||||||||
| Total other comprehensive income |
1,879 | 213 | 2,417 | 1,491 | ||||||||||||
| Total comprehensive income |
72,965 | 36,202 | 233,119 | 150,785 | ||||||||||||
| Less comprehensive income attributable to noncontrolling interests: |
||||||||||||||||
| Net income |
(31,602 | ) | (12,300 | ) | (103,956 | ) | (61,070 | ) | ||||||||
| Unrealized loss/(gain) on marketable securities |
— | 80 | — | (240 | ) | |||||||||||
| Actuarially determined long-term liability adjustments |
(1,063 | ) | (200 | ) | (1,356 | ) | (591 | ) | ||||||||
| Comprehensive income attributable to AHGP |
$ | 40,300 | $ | 23,782 | $ | 127,807 | $ | 88,884 | ||||||||
Comprehensive income differs from net income due to unrealized (loss)/gain on the ARLP Partnership’s available for sale marketable securities resulting from valuation changes (2009 only) and net amortization of actuarial gains and losses associated with adoption of amendments to FASB ASC 715, Compensation – Retirement Benefits.
| 13. | SEGMENT INFORMATION |
The ARLP Partnership operates in the eastern U.S. as a producer and marketer of coal to major utilities and industrial users. We have four reportable segments: Illinois Basin, Central Appalachia, Northern Appalachia and Other and Corporate. The first three segments correspond to the three major coal producing regions in the eastern U.S. Coal quality, coal seam height, mining and transportation methods and regulatory issues are similar within each of these three segments.
The Illinois Basin segment is comprised of Webster County Coal, LLC’s Dotiki mining complex, Gibson County Coal, LLC’s Gibson North mining complex, Hopkins County Coal, LLC’s Elk Creek mining complex, White County Coal’s Pattiki mining complex, Warrior Coal, LLC’s mining complex, River View’s mining complex, which initiated operations in 2009, the Sebree Mining, LLC (“Sebree”) property, the Gibson County Coal (South), LLC (“Gibson South”) property and certain properties of Alliance Resource Properties, LLC (“Alliance Resource Properties”) and its wholly-owned subsidiary, ARP Sebree, LLC. The ARLP Partnership is in the process of permitting the Gibson South property and the Sebree property for future mine development.
15
Table of Contents
The Central Appalachian segment is comprised of Pontiki Coal, LLC’s and MC Mining, LLC’s mining complexes.
The Northern Appalachian segment is comprised of Mettiki Coal, LLC’s mining complex, Mettiki Coal (WV) LLC’s Mountain View mining complex, two small third-party mining operations (one of which was idled in May 2009 and restarted in February 2010), a mining complex currently under construction at Tunnel Ridge, LLC (“Tunnel Ridge”) and the Penn Ridge Coal, LLC (“Penn Ridge”) property. In May 2010, incidental production began from mine development activities at Tunnel Ridge; longwall production is not anticipated until late 2011. The ARLP Partnership is in the process of permitting the Penn Ridge property for future mine development.
Other and Corporate includes the ARLP Partnership and AHGP’s marketing and administrative expenses, Matrix Design Group, LLC (“Matrix Design”), Alliance Design Group, LLC (“Alliance Design”) (collectively, Matrix Design and Alliance Design are referred to as the “Matrix Group”), the Mt. Vernon Transfer Terminal, LLC (“Mt. Vernon”) dock activities, coal brokerage activity, the ARLP Partnership’s equity investment in MAC and certain properties of Alliance Resource Properties. Segment results for the three and nine months ended September 30, 2010 and 2009 are presented below:
| Illinois Basin |
Central Appalachia |
Northern Appalachia |
Other and Corporate |
Elimination (1) |
Consolidated | |||||||||||||||||||
| (in thousands) | ||||||||||||||||||||||||
| Operating segment results for the three months ended September 30, 2010: |
||||||||||||||||||||||||
| Total revenues (2) |
$ | 304,292 | $ | 41,499 | $ | 57,248 | $ | 12,610 | $ | (5,293 | ) | $ | 410,356 | |||||||||||
| Segment Adjusted EBITDA Expense (3) |
185,183 | 33,175 | 46,268 | 10,331 | (5,293 | ) | 269,664 | |||||||||||||||||
| Segment Adjusted EBITDA (4) |
114,215 | 8,307 | 8,781 | 2,278 | — | 133,581 | ||||||||||||||||||
| Capital expenditures |
35,611 | 3,389 | 19,512 | 413 | — | 58,925 | ||||||||||||||||||
| Operating segment results for the three months ended September 30, 2009: |
||||||||||||||||||||||||
| Total revenues (2) |
$ | 217,128 | $ | 41,401 | $ | 36,041 | $ | 9,382 | $ | (4,415 | ) | $ | 299,537 | |||||||||||
| Segment Adjusted EBITDA Expense (3) |
137,579 | 34,839 | 30,650 | 6,298 | (4,135 | ) | 205,231 | |||||||||||||||||
| Segment Adjusted EBITDA (4) |
70,090 | 6,517 | 3,234 | 3,082 | (280 | ) | 82,643 | |||||||||||||||||
| Capital expenditures |
54,274 | 3,845 | 17,589 | 1,060 | — | 76,768 | ||||||||||||||||||
| Operating segment results for the nine months ended September 30, 2010: |
||||||||||||||||||||||||
| Total revenues (2) |
$ | 895,878 | $ | 122,189 | $ | 156,223 | $ | 33,818 | $ | (16,886 | ) | $ | 1,191,222 | |||||||||||
| Segment Adjusted EBITDA Expense (3) |
532,626 | 97,921 | 119,855 | 28,349 | (16,886 | ) | 761,865 | |||||||||||||||||
| Segment Adjusted EBITDA (4) |
344,216 | 24,141 | 29,892 | 5,471 | — | 403,720 | ||||||||||||||||||
| Total assets |
753,987 | 84,505 | 299,812 | 45,673 | (5,401 | ) | 1,178,576 | |||||||||||||||||
| Capital expenditures |
119,000 | 7,909 | 105,503 | 1,361 | — | 233,773 | ||||||||||||||||||
| Operating segment results for the nine months ended September 30, 2009: |
||||||||||||||||||||||||
| Total revenues (2) |
$ | 675,441 | $ | 137,739 | $ | 106,898 | $ | 27,108 | $ | (14,660 | ) | $ | 932,526 | |||||||||||
| Segment Adjusted EBITDA Expense (3) |
410,103 | 106,784 | 88,934 | 19,325 | (14,298 | ) | 610,848 | |||||||||||||||||
| Segment Adjusted EBITDA (4) |
237,860 | 29,486 | 11,571 | 7,776 | (362 | ) | 286,331 | |||||||||||||||||
| Total assets |
684,823 | 90,141 | 178,259 | 119,956 | (119 | ) | 1,073,060 | |||||||||||||||||
| Capital expenditures |
186,678 | 11,555 | 49,910 | 3,310 | — | 251,453 | ||||||||||||||||||
16
Table of Contents
| (1) | The elimination column represents the elimination of intercompany transactions and is primarily comprised of sales from the Matrix Group and MAC (for 2009 only; see Note 8) to the ARLP Partnership’s mining operations. |
| (2) | Revenues included in the Other and Corporate column are primarily attributable to the Matrix Group revenues, Mt. Vernon transloading revenues, MAC rock dust revenues (for 2009 only; see Note 8) and brokerage sales. |
| (3) | Segment Adjusted EBITDA Expense (a non-GAAP financial measure) includes operating expenses, outside coal purchases and other income. Transportation expenses are excluded as these expenses are passed through to the ARLP Partnership’s customers and consequently it does not realize any gain or loss on transportation revenues. We review Segment Adjusted EBITDA Expense per ton for cost trends. |
The following is a reconciliation of consolidated Segment Adjusted EBITDA Expense to operating expense (excluding depreciation, depletion and amortization), the most comparable GAAP financial measure (in thousands):
| Three Months Ended September 30, |
Nine Months Ended September 30, |
|||||||||||||||
| 2010 | 2009 | 2010 | 2009 | |||||||||||||
| Segment Adjusted EBITDA Expense |
$ | 269,664 | $ | 205,231 | $ | 761,865 | $ | 610,848 | ||||||||
| Outside coal purchases |
(5,736 | ) | (517 | ) | (12,122 | ) | (5,709 | ) | ||||||||
| Other income |
460 | 126 | 614 | 554 | ||||||||||||
| Operating expense (excluding depreciation, depletion and amortization) |
$ | 264,388 | $ | 204,840 | $ | 750,357 | $ | 605,693 | ||||||||
| (4) | Segment Adjusted EBITDA (a non-GAAP financial measure) is defined as net income (prior to the allocation of noncontrolling interest) before income taxes, net interest expense, depreciation, depletion and amortization, and general and administrative expenses. Management therefore is able to focus solely on the evaluation of segment operating profitability as it relates to the ARLP Partnership’s revenues and operating expenses, which are primarily controlled by our segments. Consolidated Segment Adjusted EBITDA is reconciled to net income the most comparable GAAP financial measure, as follows (in thousands): |
| Three Months Ended September 30, |
Nine Months Ended September 30, |
|||||||||||||||
| 2010 | 2009 | 2010 | 2009 | |||||||||||||
| Segment Adjusted EBITDA |
$ | 133,581 | $ | 82,643 | $ | 403,720 | $ | 286,331 | ||||||||
| General and administrative |
(16,327 | ) | (10,370 | ) | (39,353 | ) | (30,060 | ) | ||||||||
| Depreciation, depletion and amortization |
(37,587 | ) | (28,145 | ) | (109,560 | ) | (83,767 | ) | ||||||||
| Interest expense, net |
(7,586 | ) | (7,554 | ) | (22,519 | ) | (22,399 | ) | ||||||||
| Income tax expense |
(995 | ) | (585 | ) | (1,586 | ) | (811 | ) | ||||||||
| Net income |
$ | 71,086 | $ | 35,989 | $ | 230,702 | $ | 149,294 | ||||||||
17
Table of Contents
| 14. | SUBSEQUENT EVENTS |
On October 27, 2010, we declared a quarterly distribution for the quarter ended September 30, 2010, of $0.50 per unit on all common units outstanding, totaling approximately $29.9 million, payable on November 19, 2010 to all unitholders of record as of November 12, 2010.
Effective October 1, 2010, the ARLP Partnership completed its annual property and casualty insurance renewal for various insurance coverages. The aggregate maximum limit in the commercial property program is $75.0 million per occurrence excluding a $1.5 million deductible for property damage, a 60-day waiting period for business interruption and a $10.0 million overall aggregate deductible.
18
Table of Contents
| ITEM 2. | MANAGEMENT’S DISCUSSION AND ANALYSIS OF FINANCIAL CONDITION AND RESULTS OF OPERATIONS |
Significant relationships referenced in this management’s discussion and analysis of financial condition and results of operations include the following:
| • | References to “we,” “us,” “our” or “AHGP” mean Alliance Holdings GP, L.P., individually as the parent company, and not on a consolidated basis. |
| • | References to “AHGP Partnership” mean the business and operations of Alliance Holdings GP, L.P., the parent company, as well as its consolidated subsidiaries, which include Alliance Resource Management GP, LLC and Alliance Resource Partners, L.P. and its consolidated subsidiaries. |
| • | References to “AGP” mean Alliance GP, LLC, the general partner of Alliance Holdings GP, L.P., also referred to as our general partner. |
| • | References to “ARLP Partnership” mean the business and operations of Alliance Resource Partners, L.P., the parent company, as well as its consolidated subsidiaries. |
| • | References to “ARLP” mean Alliance Resource Partners, L.P., individually as the parent company, and not on a consolidated basis. |
| • | References to “MGP” mean Alliance Resource Management GP, LLC, the managing general partner of Alliance Resource Partners, L.P. |
| • | References to “SGP” mean Alliance Resource GP, LLC, the special general partner of Alliance Resource Partners, L.P. |
| • | References to “Intermediate Partnership” mean Alliance Resource Operating Partners, L.P., the intermediate partnership of Alliance Resource Partners, L.P. |
| • | References to “Alliance Coal” mean Alliance Coal, LLC, the holding company for the operations of Alliance Resource Operating Partners, L.P. |
Summary
We have no operating activities apart from those conducted by the ARLP Partnership, and our cash flows currently consist primarily of distributions from ARLP for our ARLP partnership interests, including the incentive distribution rights that we own. We reflect our ownership interest in the ARLP Partnership on a consolidated basis, which means that our financial results are combined with the ARLP Partnership’s financial results and the results of our other subsidiaries. The earnings of the ARLP Partnership allocated to its limited partners’ interest not owned by us and allocated to SGP’s general partner interest in ARLP are reflected as a noncontrolling interest in our consolidated statement of income and balance sheet. In addition to the ARLP Partnership, our historical consolidated results of operations include the results of operations of MGP, our wholly-owned subsidiary.
The AHGP Partnership’s results of operations principally reflect the results of operations of the ARLP Partnership adjusted for noncontrolling partners’ interest in the ARLP Partnership’s net income. Accordingly, the discussion of our financial position and results of operations in this “Management’s Discussion and Analysis of Financial Condition and Results of Operations” reflects the operating activities and results of operations of the ARLP Partnership.
The ARLP Partnership is a diversified producer and marketer of coal primarily to major United States (“U.S.”) utilities and industrial users. The ARLP Partnership began mining operations in 1971 and, since then, has grown through acquisitions and internal development to become what it believes to be the fifth largest coal producer in the eastern U.S. The ARLP Partnership operates nine mining complexes in
19
Table of Contents
Illinois, Indiana, Kentucky, Maryland and West Virginia. The ARLP Partnership is constructing a new mining complex in West Virginia. The ARLP Partnership also operates a coal loading terminal on the Ohio River at Mt. Vernon, Indiana. As is customary in the coal industry, the ARLP Partnership has entered into long-term coal supply agreements with many of its customers.
We have four reportable segments: Illinois Basin, Central Appalachia, Northern Appalachia and Other and Corporate. The first three segments correspond to the three major coal producing regions in the eastern U.S. Coal quality, coal seam height, mining and transportation methods and regulatory issues are similar within each of these three segments.
| • | Illinois Basin segment is comprised of Webster County Coal, LLC’s Dotiki mining complex (“Dotiki”), Gibson County Coal, LLC’s Gibson North mining complex (“Gibson”), Hopkins County Coal, LLC’s Elk Creek mining complex (“Hopkins”), White County Coal, LLC’s Pattiki mine (“Pattiki”), Warrior Coal, LLC’s (“Warrior”) mining complex, River View Coal, LLC’s (“River View”) mining complex, which initiated operations in 2009, the Sebree Mining, LLC (“Sebree”) property, the Gibson County Coal (South), LLC (“Gibson South”) property and certain properties of Alliance Resource Properties, LLC (“Alliance Resource Properties”) and its wholly-owned subsidiary, ARP Sebree, LLC. The ARLP Partnership is in the process of permitting the Gibson South property and the Sebree property for future mine development. |
| • | Central Appalachian segment is comprised of Pontiki Coal, LLC’s (“Pontiki”) and MC Mining, LLC’s mining complexes. |
| • | Northern Appalachian segment is comprised of Mettiki Coal, LLC’s mining complex, (“Mettiki”), Mettiki Coal (WV), LLC’s Mountain View mining complex, two small third-party mining operations (one of which was idled in May 2009 and restarted in February 2010), a mining complex currently under construction at Tunnel Ridge, LLC (“Tunnel Ridge”) and the Penn Ridge Coal, LLC (“Penn Ridge”) property. In May 2010, incidental production began from mine development activities at Tunnel Ridge; longwall production is not anticipated until late 2011. The ARLP Partnership is in the process of permitting the Penn Ridge property for future mine development. |
| • | Other and Corporate segment includes marketing and administrative expenses, Matrix Design Group, LLC (“Matrix Design”), Alliance Design Group, LLC (collectively, Matrix Design and Alliance Design Group, LLC are referred to as the “Matrix Group”), the Mt. Vernon Transfer Terminal, LLC (“Mt. Vernon”) dock activities, coal brokerage activity, the ARLP Partnership’s equity investment in Mid-America Carbonates, LLC (“MAC”) and certain properties of Alliance Resource Properties. |
Health Care Reform
On March 23, 2010, President Obama signed into law the Patient Protection and Affordable Care Act. Additionally, on March 30, 2010, President Obama signed into law a reconciliation measure, the Health Care and Education Reconciliation Act of 2010. The passage of the Patient Protection and Affordable Care Act and the Health Care and Education Reconciliation Act (collectively, the “Health Care Act”) will result in comprehensive changes to health care in the U.S. Implementation of this legislation is planned to occur in phases, with standard plan changes taking effect beginning in 2010, but to a greater extent with the 2011 benefit plan year and extending through 2018.
20
Table of Contents
The Health Care Act has both short-term and long-term implications on benefit plan eligibility, coverage requirements, and benefit standards and limitations. In the short term, the ARLP Partnership’s health care costs are expected to increase due to raising the maximum age and easing of eligibility limitations for covered dependents. The Health Care Act also prevents the group health plan from limiting benefit payments for participants who meet or exceed annual or lifetime dollar limits per covered individual. The ARLP Partnership does not currently expect raising the maximum age and easing of eligibility limitations for covered dependents to significantly increase its annual health care costs beginning in 2011. In addition, the ARLP Partnership currently expects removing the lifetime maximum to have an additional impact on it that the ARLP Partnership is unable to reasonably estimate at this time. While historically few participants have reached the plan lifetime maximum limit of $1 million, future federal and state mandates are expected to impact large claims costs and make this a potentially greater risk variable in the future. In the long term, the ARLP Partnership plan’s health care costs are expected to increase for various reasons due to the Health Care Act, including the potential impact of an excise tax on “high cost” plans (beginning in 2018), among other standard requirements. The ARLP Partnership has chosen not to “grandfather” its health care plan as allowed under the Health Care Act. Maintaining “grandfather” status prevents the plan from making plan benefit modifications that encourage participants to use high value, lower cost medical care options such as on-site medical services, generic preferred medications, and urgent care centers instead of emergency rooms.
The ARLP Partnership anticipates that certain government agencies will provide additional regulations or interpretations concerning the application of the Health Care Act and reporting required thereunder. Until these regulations or interpretations are published, the ARLP Partnership is unable to reasonably estimate the further impact of such federal mandate requirements on its future health care costs.
The ARLP Partnership will continue to evaluate the potential impact of the legislation on its self-insured long term disability plan, pneumoconiosis (“Black Lung”) liabilities, results of operations and internal controls as governmental agencies issue interpretations regarding the meaning and scope of the Health Care Act. However, the ARLP Partnership believes it is likely that its costs will increase as a result of these provisions, which may have an adverse impact on its results of operations and cash flows.
The Dodd-Frank Act
On July 21, 2010, President Obama signed into law the Dodd-Frank Wall Street Reform and Consumer Protection Act (“Dodd-Frank Act”). The Dodd-Frank Act gives regulators new resolution authority, creates a new council to monitor and address systemic risk, changes the mandate of the Federal Reserve, imposes significant new regulations on banking organizations, makes significant changes to the rules that affect the process of financing business enterprises and creates a new governmental authority, the Bureau of Consumer Financial Protection, to regulate retail financial products and services, among many other provisions.
The additional regulations imposed by the Dodd-Frank Act on financial institutions may result in increased costs associated with future borrowings and decreased availability of credit. However, we are presently unable to determine the significance of any potential increase in our borrowing costs or potential liquidity constraints, if any. The Dodd-Frank Act also requires public mining companies to report certain safety information in each periodic report filed with the SEC and to file current reports on Form 8-K for certain safety matters. We are continuing to evaluate the effect of the Dodd-Frank Act on the Partnership’s operations.
21
Table of Contents
Three Months Ended September 30, 2010 Compared to Three Months Ended September 30, 2009
We reported record net income of $71.1 million for the three months ended September 30, 2010 (“2010 Quarter”) compared to $36.0 million for the three months ended September 30, 2009 (“2009 Quarter”). This increase of $35.1 million was principally due to record tons sold and improved pricing resulting in a record quarterly average coal sales price of $51.68 per ton sold, as compared to $45.58 per ton sold for the 2009 Quarter. The ARLP Partnership had record tons sold of 7.7 million tons and higher tons produced of 7.1 million tons in the 2010 Quarter, compared to 6.2 million tons sold and 6.3 million tons produced in the 2009 Quarter. This increase in produced tons primarily reflects increased production from the ARLP Partnership’s new River View mine. Higher operating expenses during the 2010 Quarter resulted primarily from increased sales and production volumes, which particularly impacted materials and supplies expenses, sales-related expenses and labor and labor-related expenses. Increased operating expenses also reflect the new incidental production at the ARLP Partnership’s Tunnel Ridge mine development project and higher Northern Appalachia third-party contract mining costs.
| Three Months Ended September 30, | ||||||||||||||||
| 2010 | 2009 | 2010 | 2009 | |||||||||||||
| (in thousands) | (per ton sold) | |||||||||||||||
| Tons sold |
7,676 | 6,179 | N/A | N/A | ||||||||||||
| Tons produced |
7,124 | 6,304 | N/A | N/A | ||||||||||||
| Coal sales |
$ | 396,655 | $ | 281,628 | $ | 51.68 | $ | 45.58 | ||||||||
| Operating expenses and outside coal purchases |
$ | 270,124 | $ | 205,357 | $ | 35.19 | $ | 33.23 | ||||||||
Coal sales. Coal sales for the 2010 Quarter increased 40.8% to $396.7 million from $281.6 million for the 2009 Quarter. The increase of $115.1 million in coal sales reflected the benefit of record tons sold (contributing $68.2 million in coal sales) and record average coal sales prices (contributing $46.9 million in additional coal sales). Average coal sales prices in the 2010 Quarter increased $6.10 per ton sold to $51.68 per ton in the 2010 Quarter compared to $45.58 per ton in the 2009 Quarter primarily as a result of improved contract pricing across all regions.
Operating expenses. Operating expenses increased 29.1% to $264.4 million for the 2010 Quarter from $204.8 million for the 2009 Quarter primarily due to record coal sales and increased production volumes. Increased River View production and Tunnel Ridge development combined to increase certain operating expenses $32.5 million during the 2010 Quarter over the 2009 Quarter and are generally included in the variances discussed further below. Operating expenses were impacted by various other factors, the most significant of which are also discussed below:
| • | Labor and benefit expenses per ton produced, excluding workers’ compensation, increased 0.3% to $11.07 per ton in the 2010 Quarter from $11.04 per ton in the 2009 Quarter. This increase of $0.03 per ton was primarily due to increased mine development labor at the ARLP Partnership’s Tunnel Ridge mine and increased regulatory oversight, particularly at the Central Appalachian mines, partially offset by lower labor cost per ton resulting from production at the ARLP Partnership’s new River View mine; |
| • | Workers’ compensation expenses per ton produced decreased to $1.31 per ton in the 2010 Quarter from $1.64 per ton in the 2009 Quarter. The decrease of $0.33 per ton produced resulted primarily from a non-cash charge during the 2009 Quarter due to a discount rate change, which increased the accrued liabilities for the present value of estimated future claim payments, partially offset by unfavorable reserve adjustments for new claims incurred during the 2010 Quarter; |
22
Table of Contents
| • | Material and supplies expenses per ton produced increased 15.4% to $11.07 per ton in the 2010 Quarter from $9.59 per ton in the 2009 Quarter. The increase of $1.48 per ton produced resulted from an increase in cost for certain products and services, primarily outside services expenses (increase of $0.39 per ton), roof support (increase of $0.37 per ton), power and fuel used in the mining process (increase of $0.23 per ton), preparation plant cost (increase of $0.21 per ton), ventilation (increase of $0.17 per ton) and rock dust (increase of $0.11 per ton); |
| • | Maintenance expenses per ton produced increased 5.6% to $3.75 per ton in the 2010 Quarter from $3.55 per ton in the 2009 Quarter. The increase of $0.20 per ton produced resulted primarily from higher maintenance costs for the ARLP Partnership’s mine development project at Tunnel Ridge and increased maintenance costs at its Warrior mine, primarily related to continuous miners, partially offset by the benefit of newer equipment and increased production at the ARLP Partnership’s new River View mine; |
| • | Mine administration expenses increased $4.2 million for the 2010 Quarter compared to the 2009 Quarter, primarily due to higher costs resulting from increased Matrix Design product sales and higher mine administration expense at River View and the ARLP Partnership’s mine development project at Tunnel Ridge. In addition, increased estimated regulatory costs were incurred during the 2010 Quarter; |
| • | Contract mining expenses increased $3.4 million for the 2010 Quarter compared to the 2009 Quarter. The increase primarily reflects the restart of a third-party mining operation in the ARLP Partnership’s Northern Appalachian region during February 2010 that was previously idled in May 2009 and increased production from existing contract mining operations in Northern Appalachia, both in response to increased demand in the export coal market; |
| • | Production taxes and royalties expenses (which were incurred as a percentage of coal sales prices and volumes) increased $0.62 per produced ton sold in the 2010 Quarter compared to the 2009 Quarter primarily as a result of increased average coal sales prices across all regions; and |
| • | Operating expenses increased due to significant reduction in coal inventory for the 2010 Quarter reflecting higher coal sales, whereas the 2009 Quarter experienced an increase in coal inventory. The significant reduction in coal inventory was partially offset by the benefit of lower cost per ton beginning coal inventory for the 2010 Quarter, particularly at the Illinois Basin and Central Appalachian regions. |
General and administrative. General and administrative expenses for the 2010 Quarter increased to $16.3 million compared to $10.4 million in the 2009 Quarter. The increase of $5.9 million was primarily due to increases in retirement plan expense, incentive compensation expense and contributions to certain industry and advocacy groups.
Other sales and operating revenues. Other sales and operating revenues are principally comprised of Mt. Vernon transloading revenues, products and services provided by MAC (in the 2009 Quarter only), Matrix Design, and other outside services. Other sales and operating revenues increased to $6.6 million for the 2010 Quarter from $6.2 million for the 2009 Quarter. The increase of $0.4 million was primarily attributable to increased Matrix Design product sales, partially offset by decreased rock dust revenues reflecting the deconsolidation of MAC. For more information about MAC, please read “Part I. Item 1. Financial Statements (Unaudited) – Note 8. Mid-America Carbonates” of this Quarterly Report on Form 10-Q.
23
Table of Contents
Outside coal purchases. Outside coal purchases increased to $5.7 million for the 2010 Quarter compared to $0.5 million in the 2009 Quarter. The increase of $5.2 million was primarily attributable to increased outside coal purchases related to the ARLP Partnership’s Northern Appalachian region due to increased demand in the export coal markets as well as increased coal brokerage activity.
Depreciation, depletion and amortization. Depreciation, depletion and amortization expense increased to $37.6 million for the 2010 Quarter from $28.1 million for the 2009 Quarter. The increase of $9.5 million was attributable to additional depreciation expense associated with the ARLP Partnership’s River View mine and its Tunnel Ridge development project in addition to continuing capital expenditures related to various infrastructure improvements and efficiency projects.
Interest expense. Interest expense, net of capitalized interest, decreased to $7.6 million for the 2010 Quarter from $7.7 million for the 2009 Quarter. The decrease of $0.1 million was principally attributable to reduced interest expense resulting from the ARLP Partnership’s August 2010 principal repayment of $18.0 million of its original senior notes issued in 1999, partially offset by increased interest expense for borrowings on the ARLP Partnership’s $150.0 million revolving credit facility (“ARLP Credit Facility”) during the 2010 Quarter, each of which are discussed in more detail below under “–Debt Obligations.”
Transportation revenues and expenses. Transportation revenues and expenses were $7.1 million and $11.7 million for the 2010 and 2009 Quarters, respectively. The decrease of $4.6 million was primarily attributable to reduced tonnage for which the ARLP Partnership arranges transportation from its Warrior, Hopkins and Pattiki mines. The cost of transportation services are passed through to the ARLP Partnership’s customers. Consequently, the ARLP Partnership does not realize any gain or loss on transportation revenues.
Income tax expense. Income tax expense was $1.0 million for the 2010 Quarter compared to $0.6 million for the 2009 Quarter. Income taxes are primarily due to the operations of Matrix Design, which is owned by the ARLP Partnership’s subsidiary, Alliance Service, Inc. Increased taxes reflect higher net income in the 2010 Quarter from Matrix Design’s operation.
Net income attributable to noncontrolling interests. The noncontrolling interests balance is comprised of non-affiliate and affiliate ownership interests in the net assets of the ARLP Partnership that we consolidate and a third-party ownership interest in MAC (for the 2009 Quarter only). The noncontrolling interest designated as Affiliate represents SGP’s 0.01% general partner interest in ARLP and 0.01% general partner interest in the Intermediate Partnership. The noncontrolling interest designated as Non-Affiliates represents the limited partners’ interest in ARLP controlled through the common unit ownership, excluding the 15,544,169 common units of ARLP held by us. The noncontrolling interest designated as MAC in the 2009 Quarter represents a 50% third-party interest in MAC. The net income attributable to noncontrolling interest was $31.6 million and $12.3 million for the 2010 and 2009 Quarters, respectively. The increase in net income attributable to noncontrolling interest is due to an increase in the consolidated net income of the ARLP Partnership resulting from the changes in revenues and expenses described above. For more information about MAC, please read “Part I. Item 1. Financial Statements (Unaudited) – Note 8. Mid-America Carbonates” of this Quarterly Report on Form 10-Q.
24
Table of Contents
Segment Adjusted EBITDA. Our 2010 Quarter Segment Adjusted EBITDA increased $50.9 million, or 61.6%, to $133.6 million from the 2009 Quarter Segment Adjusted EBITDA of $82.6 million. Segment Adjusted EBITDA, tons sold, coal sales, other sales and operating revenues and Segment Adjusted EBITDA Expense by segment are (in thousands):
| Three Months
Ended September 30, |
||||||||||||||||
| 2010 | 2009 | Increase/(Decrease) | ||||||||||||||
| Segment Adjusted EBITDA |
||||||||||||||||
| Illinois Basin |
$ | 114,215 | $ | 70,090 | $ | 44,125 | 63.0 | % | ||||||||
| Central Appalachia |
8,307 | 6,517 | 1,790 | 27.5 | % | |||||||||||
| Northern Appalachia |
8,781 | 3,234 | 5,547 | (1 | ) | |||||||||||
| Other and Corporate |
2,278 | 3,082 | (804 | ) | 26.1 | % | ||||||||||
| Elimination |
— | (280 | ) | 280 | (1 | ) | ||||||||||
| Total Segment Adjusted EBITDA (2) |
$ | 133,581 | $ | 82,643 | $ | 50,938 | 61.6 | % | ||||||||
| Tons sold |
||||||||||||||||
| Illinois Basin |
6,276 | 4,925 | 1,351 | 27.4 | % | |||||||||||
| Central Appalachia |
531 | 604 | (73 | ) | (12.1 | )% | ||||||||||
| Northern Appalachia |
837 | 650 | 187 | 28.8 | % | |||||||||||
| Other and Corporate |
32 | — | 32 | (1 | ) | |||||||||||
| Elimination |
— | — | — | — | ||||||||||||
| Total tons sold |
7,676 | 6,179 | 1,497 | 24.2 | % | |||||||||||
| Coal sales |
||||||||||||||||
| Illinois Basin |
$ | 299,161 | $ | 207,410 | $ | 91,751 | 44.2 | % | ||||||||
| Central Appalachia |
41,481 | 41,357 | 124 | 0.3 | % | |||||||||||
| Northern Appalachia |
54,126 | 32,861 | 21,265 | 64.7 | % | |||||||||||
| Other and Corporate |
1,887 | — | 1,887 | (1 | ) | |||||||||||
| Elimination |
— | — | — | — | ||||||||||||
| Total coal sales |
$ | 396,655 | $ | 281,628 | $ | 115,027 | 40.8 | % | ||||||||
| Other sales and operating revenues |
||||||||||||||||
| Illinois Basin |
$ | 238 | $ | 257 | $ | (19 | ) | (7.4 | )% | |||||||
| Central Appalachia |
— | — | — | — | ||||||||||||
| Northern Appalachia |
923 | 1,024 | (101 | ) | (9.9 | )% | ||||||||||
| Other and Corporate |
10,722 | 9,380 | 1,342 | 14.3 | % | |||||||||||
| Elimination |
(5,293 | ) | (4,415 | ) | (878 | ) | (19.9 | )% | ||||||||
| Total other sales and operating revenues |
$ | 6,590 | $ | 6,246 | $ | 344 | 5.5 | % | ||||||||
| Segment Adjusted EBITDA Expense |
||||||||||||||||
| Illinois Basin |
$ | 185,183 | $ | 137,579 | $ | 47,604 | 34.6 | % | ||||||||
| Central Appalachia |
33,175 | 34,839 | (1,664 | ) | (4.8 | )% | ||||||||||
| Northern Appalachia |
46,268 | 30,650 | 15,618 | 51.0 | % | |||||||||||
| Other and Corporate |
10,331 | 6,298 | 4,033 | 64.0 | % | |||||||||||
| Elimination |
(5,293 | ) | (4,135 | ) | (1,158 | ) | (28.0 | )% | ||||||||
| Total Segment Adjusted EBITDA Expense (3) |
$ | 269,664 | $ | 205,231 | $ | 64,433 | 31.4 | % | ||||||||
| (1) | Percentage change was greater than or equal to 100%. |
25
Table of Contents
| (2) | Segment Adjusted EBITDA (a non-GAAP financial measure) is defined as EBITDA, excluding general and administrative expense. EBITDA is defined as net income (prior to the allocation of noncontrolling interest) before net interest expense, income taxes, and depreciation, depletion and amortization. Segment Adjusted EBITDA is a key component of consolidated EBITDA, which is used as a supplemental financial measure by management and by external users of our financial statements such as investors, commercial banks, research analysts and others, to assess: |
| • | the financial performance of the ARLP Partnership’s assets without regard to financing methods, capital structure or historical cost basis; |
| • | the ability of the ARLP Partnership’s assets to generate cash sufficient to pay interest costs and support its indebtedness; |
| • | the ARLP Partnership’s operating performance and return on investment as compared to those of other companies in the coal energy sector, without regard to financing or capital structures; and |
| • | the viability of acquisitions and capital expenditure projects and the overall rates of return on alternative investment opportunities. |
Segment Adjusted EBITDA is also used as a supplemental financial measure by our management for reasons similar to those stated in the above explanation of EBITDA. In addition, the exclusion of corporate general and administrative expenses from Segment Adjusted EBITDA allows management to focus solely on the evaluation of segment operating profitability as it relates to our revenues and operating expenses, which are primarily controlled by our segments.
The following is a reconciliation of consolidated Segment Adjusted EBITDA to net income, the most comparable GAAP financial measures (in thousands):
| Three Months Ended | ||||||||
| September 30, | ||||||||
| 2010 | 2009 | |||||||
| Segment Adjusted EBITDA |
$ | 133,581 | $ | 82,643 | ||||
| General and administrative |
(16,327 | ) | (10,370 | ) | ||||
| Depreciation, depletion and amortization |
(37,587 | ) | (28,145 | ) | ||||
| Interest expense, net |
(7,586 | ) | (7,554 | ) | ||||
| Income tax expense |
(995 | ) | (585 | ) | ||||
| Net income |
$ | 71,086 | $ | 35,989 | ||||
| (3) | Segment Adjusted EBITDA Expense (a non-GAAP financial measure) includes operating expenses, outside coal purchases and other income. Transportation expenses are excluded as these expenses are passed through to the ARLP Partnership’s customers and, consequently, it does not realize any gain or loss on transportation revenues. Segment Adjusted EBITDA Expense is used as a supplemental financial measure by the ARLP Partnership’s management to assess the operating performance of the segments. Segment Adjusted EBITDA Expense is a key component of EBITDA in addition to coal sales and other sales and operating revenues. The exclusion of corporate general and administrative expenses from Segment Adjusted EBITDA Expense allows management to focus solely on the evaluation of segment operating performance as it primarily relates to the ARLP Partnership’s operating expenses. Outside coal purchases are included in Segment Adjusted EBITDA Expense because tons sold and coal sales include sales from outside coal purchases. |
26
Table of Contents
The following is a reconciliation of consolidated Segment Adjusted EBITDA Expense to operating expense, the most comparable GAAP financial measure (in thousands):
| Three Months Ended September 30, |
||||||||
| 2010 | 2009 | |||||||
| Segment Adjusted EBITDA Expense |
$ | 269,664 | $ | 205,231 | ||||
| Outside coal purchases |
(5,736 | ) | (517 | ) | ||||
| Other income |
460 | 126 | ||||||
| Operating expense (excluding depreciation, depletion and amortization) |
$ | 264,388 | $ | 204,840 | ||||
Illinois Basin – Segment Adjusted EBITDA increased 63.0% to $114.2 million in the 2010 Quarter from $70.1 million in the 2009 Quarter. The increase of $44.1 million was primarily attributable to a 27.4% increase in tons sold to 6.3 million tons in the 2010 Quarter, as well as strong contract pricing reflecting a higher average coal sales price of $47.67 per ton sold during the 2010 Quarter compared to $42.11 per ton sold for the 2009 Quarter. Coal sales increased 44.2% to $299.2 million in the 2010 Quarter compared to $207.4 million in the 2009 Quarter. The increase of $91.8 million primarily reflects increased sales from the ARLP Partnership’s new River View mine (which commenced operations in August 2009 and continued to expand production during 2010). Total Segment Adjusted EBITDA Expense for the 2010 Quarter increased 34.6% to $185.2 million from $137.6 million in the 2009 Quarter and increased $1.58 per ton sold to $29.51 from $27.93 per ton sold, primarily as a result of certain cost increases described above under consolidated operating expenses, as well as ongoing production restrictions related to the failure of the vertical hoist system at the Pattiki mine and a two week production disruption at the ARLP Partnership’s Gibson mine due to a roof fall on the main belt line. For more information on the Pattiki mine, please read “Part I. Item 1. Financial Statements (Unaudited) – Note 4. Pattiki Vertical Hoist Conveyor System Failure” of this Quarterly Report on Form 10-Q.
Central Appalachia – Segment Adjusted EBITDA increased 27.5% to $8.3 million for the 2010 Quarter compared to $6.5 million in the 2009 Quarter. The increase of $1.8 million was primarily attributable to strong contract pricing reflecting a higher average coal sales price of $78.18 per ton sold during the 2010 Quarter compared to $68.43 per ton sold for the 2009 Quarter, partially offset by lower sales volumes as a result of reduced production due to the impact of heightened regulatory oversight, lower clean coal recovery due to mining conditions and the continued impact of idling one mining unit at Pontiki in July 2009. Segment Adjusted EBITDA Expense per ton sold during the 2010 Quarter increased to $62.52 compared to $57.64 per ton sold in the 2009 Quarter, an increase of $4.88 per ton sold reflecting certain cost increases described above under consolidated operating expenses, as well as lower production volumes described above. Although Segment Adjusted EBITDA Expense per ton sold increased in the 2010 Quarter, Segment Adjusted EBITDA Expense for the 2010 Quarter decreased 4.8% to $33.2 million from $34.8 million in the 2009 Quarter primarily as a result of lower coal sales volumes offset in part by higher expenses per ton as described above.
Northern Appalachia – Segment Adjusted EBITDA increased to $8.8 million for the 2010 Quarter as compared to $3.2 million in the 2009 Quarter. This increase of $5.6 million was primarily attributable to strong contract pricing reflecting a higher average sales price of $64.63 per ton sold for the 2010 Quarter compared to $50.58 per ton sold for the 2009 Quarter, as well as higher tons sold which increased 28.8% to 0.8 million tons in the 2010 Quarter, both resulting from improved demand in the export coal markets, partially offset by increased coal sales of lower priced incidental production from the ARLP Partnership’s Tunnel Ridge development project. Total Segment Adjusted EBITDA Expense for
27
Table of Contents
the 2010 Quarter increased 51.0% to $46.3 million from $30.7 million in the 2009 Quarter and increased $8.07 per ton sold to $55.25 from $47.18 per ton sold, primarily as a result of higher coals sales volumes, higher costs associated with producing metallurgical quality coal, lower coal recoveries due to adverse geologic conditions, as well as the other cost increases described above under consolidated operating expenses, including non-capitalized costs incurred related to the ARLP Partnership’s Tunnel Ridge mine development project, increased coal purchases, the resumption in February 2010 of a third-party mining operation that had been idled in May 2009 and increased production from the ARLP Partnership’s other third-party mining operation. Increased outside coal purchases and third-party mining production were both in response to improved demand in the export market, as noted above.
Other and Corporate – Segment Adjusted EBITDA decreased to $2.3 million in the 2010 Quarter from $3.1 million in the 2009 Quarter. The decrease of $0.8 million was primarily attributable to the impact of the deconsolidation of MAC effective January 1, 2010, lower EBITDA associated with Matrix Group safety equipment sales to the ARLP Partnership’s other subsidiaries (which are eliminated upon consolidation) and lower Mt. Vernon outside transloading revenues, partially offset by higher coal brokerage sales and higher EBITDA resulting from increased third-party safety equipment sales and services revenue at Matrix Design. Other sales and operating revenues increased 14.3% to $10.7 million for the 2010 Quarter compared to $9.4 million for the 2009 Quarter. The increase of $1.3 million was primarily attributable to increased services revenue and sales of mine safety equipment by the Matrix Group. Segment Adjusted EBITDA Expense increased 64.0% to $10.3 million for the 2010 Quarter, primarily due to increased expenses associated with higher services revenue and safety equipment sales by the Matrix Group and higher coal brokerage expenses.
Nine Months Ended September 30, 2010 Compared to Nine Months Ended September 30, 2009
We reported record net income of $230.7 million for the nine months ended September 30, 2010 (“2010 Period”) compared to $149.3 million for the nine months ended September 30, 2009 (“2009 Period”). This increase of $81.4 million was principally due to increased tons sold and improved contract pricing resulting in an average coal sales price of $50.86 per ton sold, as compared to $46.76 per ton sold for the 2009 Period. The ARLP Partnership had tons sold of 22.5 million and tons produced of 21.6 million for the 2010 Period compared to 18.9 million tons sold and 19.5 million tons produced for the 2009 Period. This increase in produced tons primarily reflects increased production from the ARLP Partnership’s new River View mine and resulted in higher operating expenses during the 2010 Period, particularly impacting materials and supplies expenses, sales-related expenses and labor and labor-related expenses. Expenses were further impacted by increased depreciation, depletion and amortization.
| Nine Months Ended September 30, | ||||||||||||||||
| 2010 | 2009 | 2010 | 2009 | |||||||||||||
| (in thousands) | (per ton sold) | |||||||||||||||
| Tons sold |
22,545 | 18,853 | N/A | N/A | ||||||||||||
| Tons produced |
21,585 | 19,500 | N/A | N/A | ||||||||||||
| Coal sales |
$ | 1,146,719 | $ | 881,508 | $ | 50.86 | $ | 46.76 | ||||||||
| Operating expenses and outside coal purchases |
$ | 762,479 | $ | 611,402 | $ | 33.82 | $ | 32.43 | ||||||||
Coal sales. Coal sales for the 2010 Period increased 30.1% to $1.1 billion from $881.5 million for the 2009 Period. The increase of $265.2 million in coal sales reflected the benefit of increased tons sold (contributing $172.7 million in coal sales) and higher average coal sales prices (contributing $92.5 million in additional coal sales). Average coal sales prices increased $4.10 per ton sold to $50.86 per ton in the 2010 Period as compared to the 2009 Period, primarily as a result of improved contract pricing across all regions.
28
Table of Contents
Operating expenses. Operating expenses increased 23.9% to $750.4 million for the 2010 Period from $605.7 million for the 2009 Period primarily due to record coal sales and production volumes. Increased River View production and Tunnel Ridge development combined to increase certain operating expenses $87.0 million during the 2010 Period over the 2009 Period and are generally included in the variances discussed further below. In addition to the impact of record volumes, operating expenses were impacted by various other factors, the most significant of which are also discussed below:
| • | Labor and benefit expenses per ton produced, excluding workers’ compensation, decreased to $10.78 per ton in the 2010 Period from $10.90 per ton in the 2009 Period. The decrease of $0.12 per ton was primarily attributable to lower labor cost per ton resulting from production at the ARLP Partnership’s new River View mine and a decrease in the cost of training new employees in the Illinois Basin, partially offset by increased mine development labor at it’s Tunnel Ridge mine, heightened regulatory oversight, particularly at the Central Appalachian mines, and production disruptions at the ARLP Partnership’s Dotiki, Gibson and Pattiki mines during the 2010 Period; |
| • | Workers’ compensation expenses per ton produced decreased to $1.10 per ton in the 2010 Period from $1.31 per ton in the 2009 Period. The decrease of $0.21 per ton produced resulted primarily from non-cash charges during the 2009 Period due to discount rate changes, which increased the accrued liabilities for the present value of estimated future claim payments, partially offset by unfavorable reserve adjustments for new claims incurred during the 2010 Period; |
| • | Material and supplies expenses per ton produced increased 9.0% to $10.32 per ton in the 2010 Period from $9.47 per ton in the 2009 Period. The increase of $0.85 per ton produced resulted from increased costs for certain products and services, primarily outside services expenses (increase of $0.28 per ton), roof support (increase of $0.25 per ton), power and fuel used in the mining process (increase of $0.18 per ton) and rock dust (increase of $0.09 per ton); |
| • | Maintenance expenses per ton produced decreased 2.7% to $3.56 per ton in the 2010 Period from $3.66 per ton in the 2009 Period. The decrease of $0.10 per ton produced resulted primarily from the benefit of newer equipment and increased production at the ARLP Partnership’s new River View mining complex, partially offset by adverse geologic conditions at its Mettiki mine and higher maintenance costs for its mine development project at Tunnel Ridge; |
| • | Mine administration expenses increased $7.8 million for the 2010 Period compared to the 2009 Period, primarily due to higher costs resulting from increased Matrix Design third-party product sales by Matrix Design and increased estimated regulatory costs; |
| • | Contract mining expenses increased $3.0 million for the 2010 Period compared to the 2009 Period. The increase primarily reflects the restart of a third-party mining operation in the Northern Appalachian region during February 2010 that was previously idled in May 2009 (due to weak demand in the export and spot coal markets) and increased production from other existing contract mining operations in Northern Appalachia, both in response to increased demand in the export coal market; |
29
Table of Contents
| • | Production taxes and royalties expenses (which were incurred as a percentage of coal sales prices and volumes) increased $0.41 per produced ton sold in the 2010 Period compared to the 2009 Period primarily as a result of increased average coal sales prices across all regions; |
| • | Operating expenses per ton also increased in the 2010 Period due to 1.3 million tons sold from higher cost beginning of the year coal inventory compared to 261,000 tons sold from beginning coal inventory in the 2009 Period; and |
| • | Operating expenses for the 2010 Period included $1.2 million for the retirement of certain assets resulting from the failure of the vertical hoist conveyor system at the ARLP Partnership’s Pattiki mine. For more information, please read “Part I. Item 1. Financial Statements (Unaudited) – Note 4. Pattiki Vertical Hoist Conveyor System Failure” of this Quarterly Report on Form 10-Q. |
General and administrative. General and administrative expenses for the 2010 Period increased to $39.4 million compared to $30.1 million in the 2009 Period. The increase of $9.3 million was primarily due to increased incentive compensation expenses, retirement plan expense and contributions to certain industry and advocacy groups.
Other sales and operating revenues. Other sales and operating revenues are principally comprised of Mt. Vernon transloading revenues, products and services provided by MAC (in the 2009 Period only), Matrix Design and other outside services. Other sales and operating revenues increased to $18.9 million for the 2010 Period from $15.7 million for the 2009 Period. The increase of $3.2 million was primarily attributable to increased Matrix Design product sales, partially offset by lower transloading revenues and decreased rock dust revenues reflecting the deconsolidation of MAC. For more information about MAC, please read “Part I. Item 1. Financial Statements (Unaudited) – Note 8. Mid-America Carbonates” of this Quarterly Report on Form 10-Q.
Outside coal purchases. Outside coal purchases increased to $12.1 million for the 2010 Period from $5.7 million in the 2009 Period. The increase of $6.4 million was primarily attributable to an increase in outside coal purchases related to the Northern Appalachian region in response to improved demand in export coal markets as well as increased coal brokerage activity, partially offset by decreased outside coal purchases in the Central Appalachian region due to the lack of attractive sales opportunities in the coal spot markets that were available in the first quarter of 2009.
Depreciation, depletion and amortization. Depreciation, depletion and amortization expense increased to $109.6 million for the 2010 Period from $83.8 million for the 2009 Period. The increase of $25.8 million was primarily attributable to additional depreciation expense associated with the River View mine in addition to continuing capital expenditures related to infrastructure improvements and efficiency projects.
Interest expense. Interest expense, net of capitalized interest, decreased to $22.7 million for the 2010 Period from $23.5 million for the 2009 Period. The decrease of $0.8 million was principally attributable to reduced interest expense resulting from the ARLP Partnership’s annual principal repayments made during August 2010 and 2009 of $18.0 million on its original senior notes issued in 1999, partially offset by increased interest expense for borrowings on the ARLP Credit Facility during the 2010 Period, each of which are discussed in more detail below under “–Debt Obligations.”
Interest income. Interest income decreased to $0.1 million for the 2010 Period from $1.1 million for the 2009 Period. The decrease of $1.0 million resulted from decreased interest income earned on short-term investments purchased with proceeds from the 2008 financing activities in the 2009 Period, which were substantially liquidated throughout 2009.
30
Table of Contents
Transportation revenues and expenses. Transportation revenues and expenses each decreased to $25.6 million for the 2010 Period compared to $35.3 million for the 2009 Period. The decrease of $9.7 million was primarily attributable to reduced tonnage in the 2010 Period for which the ARLP Partnership arranged the transportation compared to the 2009 Period, as well as a decrease in average transportation rates of $0.27 per ton in the 2010 Period compared to the 2009 Period reflecting in part lower fuel costs. The cost of transportation services are passed through to the ARLP Partnership’s customers. Consequently, the ARLP Partnership does not realize any gain or loss on transportation revenues.
Income tax expense. Income tax expense increased to $1.6 million for the 2010 Period compared to $0.8 million for the 2009 Period. The increase of $0.8 million was primarily due to differences in the forecasted annual operating income for 2010 as compared to 2009 for Matrix Design; thus, increased taxes reflect higher net income in the 2010 Period from the Matrix Design operation.
Net income attributable to noncontrolling interests. The noncontrolling interests balance is comprised of non-affiliate and affiliate ownership interests in the net assets of the ARLP Partnership that we consolidate and a third-party ownership interest in MAC (for the 2009 Period only). The noncontrolling interest designated as Affiliate represents SGP’s 0.01% general partner interest in ARLP and 0.01% general partner interest in the Intermediate Partnership. The noncontrolling interest designated as Non-Affiliates represents the limited partners’ interest in ARLP controlled through the common unit ownership, excluding the 15,544,169 common units of ARLP held by us. The noncontrolling interest designated as MAC in the 2009 Period represents a 50% third-party interest in MAC. The net income attributable to noncontrolling interest was $104.0 million and $61.1 million for the 2010 Period and the 2009 Period, respectively. The increase in net income attributable to noncontrolling interest is due to an increase in the consolidated net income of the ARLP Partnership resulting from the changes in revenues and expenses described above. For more information about MAC, please read “Part I. Item 1. Financial Statements (Unaudited) – Note 8. Mid-America Carbonates” of this Quarterly Report on Form 10-Q.
31
Table of Contents
Segment Adjusted EBITDA. Our 2010 Period Segment Adjusted EBITDA increased $117.4 million, or 41.0%, to $403.7 million from the 2009 Period Segment Adjusted EBITDA of $286.3 million. Segment Adjusted EBITDA, tons sold, coal sales, other sales and operating revenues and Segment Adjusted EBITDA Expense by segment are (in thousands):
| Nine Months
Ended September 30, |
||||||||||||||||
| 2010 | 2009 | Increase/(Decrease) | ||||||||||||||
| Segment Adjusted EBITDA |
||||||||||||||||
| Illinois Basin |
$ | 344,216 | $ | 237,860 | $ | 106,356 | 44.7 | % | ||||||||
| Central Appalachia |
24,141 | 29,486 | (5,345 | ) | (18.1 | )% | ||||||||||
| Northern Appalachia |
29,892 | 11,571 | 18,321 | (1 | ) | |||||||||||
| Other and Corporate |
5,471 | 7,776 | (2,305 | ) | (29.6 | )% | ||||||||||
| Elimination |
— | (362 | ) | 362 | (1 | ) | ||||||||||
| Total Segment Adjusted EBITDA (2) |
$ | 403,720 | $ | 286,331 | $ | 117,389 | 41.0 | % | ||||||||
| Tons sold |
||||||||||||||||
| Illinois Basin |
18,465 | 14,950 | 3,515 | 23.5 | % | |||||||||||
| Central Appalachia |
1,680 | 1,983 | (303 | ) | (15.3 | )% | ||||||||||
| Northern Appalachia |
2,368 | 1,920 | 448 | 23.3 | % | |||||||||||
| Other and Corporate |
32 | — | 32 | (1 | ) | |||||||||||
| Elimination |
— | — | — | — | ||||||||||||
| Total tons sold |
22,545 | 18,853 | 3,692 | 19.6 | % | |||||||||||
| Coal sales |
||||||||||||||||
| Illinois Basin |
$ | 875,805 | $ | 646,901 | $ | 228,904 | 35.4 | % | ||||||||
| Central Appalachia |
121,947 | 136,143 | (14,196 | ) | (10.4 | )% | ||||||||||
| Northern Appalachia |
147,066 | 98,007 | 49,059 | 50.1 | % | |||||||||||
| Other and Corporate |
1,901 | 457 | 1,444 | (1 | ) | |||||||||||
| Elimination |
— | — | — | — | ||||||||||||
| Total coal sales |
$ | 1,146,719 | $ | 881,508 | $ | 265,211 | 30.1 | % | ||||||||
| Other sales and operating revenues |
||||||||||||||||
| Illinois Basin |
$ | 1,038 | $ | 1,061 | $ | (23 | ) | (2.2 | )% | |||||||
| Central Appalachia |
114 | 128 | (14 | ) | (10.9 | )% | ||||||||||
| Northern Appalachia |
2,681 | 2,499 | 182 | 7.3 | % | |||||||||||
| Other and Corporate |
31,919 | 26,643 | 5,276 | 19.8 | % | |||||||||||
| Elimination |
(16,886 | ) | (14,660 | ) | (2,226 | ) | 15.2 | % | ||||||||
| Total other sales and operating revenues |
$ | 18,866 | $ | 15,671 | $ | 3,195 | 20.4 | % | ||||||||
| Segment Adjusted EBITDA Expense |
||||||||||||||||
| Illinois Basin |
$ | 532,626 | $ | 410,103 | $ | 122,523 | 29.9 | % | ||||||||
| Central Appalachia |
97,921 | 106,784 | (8,863 | ) | (8.3 | )% | ||||||||||
| Northern Appalachia |
119,855 | 88,934 | 30,921 | 34.8 | % | |||||||||||
| Other and Corporate |
28,349 | 19,325 | 9,024 | 46.7 | % | |||||||||||
| Elimination |
(16,886 | ) | (14,298 | ) | (2,588 | ) | (18.1 | )% | ||||||||
| Total Segment Adjusted EBITDA Expense (3) |
$ | 761,865 | $ | 610,848 | $ | 151,017 | 24.7 | % | ||||||||
| (1) | Percentage change was greater than or equal to 100%. |
32
Table of Contents
| (2) | Segment Adjusted EBITDA (a non-GAAP financial measure) is defined as net EBITDA, excluding general and administrative expense. EBITDA is defined as net income (prior to the allocation of noncontrolling interest) before net interest expense, income taxes, and depreciation, depletion and amortization. Segment Adjusted EBITDA is a key component of consolidated EBITDA, which is used as a supplemental financial measure by management and by external users of our financial statements such as investors, commercial banks, research analysts and others, to assess: |
| • | the financial performance of the ARLP Partnership’s assets without regard to financing methods, capital structure or historical cost basis; |
| • | the ability of the ARLP Partnership’s assets to generate cash sufficient to pay interest costs and support its indebtedness; |
| • | the ARLP Partnership’s operating performance and return on investment as compared to those of other companies in the coal energy sector, without regard to financing or capital structures; and |
| • | the viability of acquisitions and capital expenditure projects and the overall rates of return on alternative investment opportunities. |
Segment Adjusted EBITDA is also used as a supplemental financial measure by our management for reasons similar to those stated in the above explanation of EBITDA. In addition, the exclusion of corporate general and administrative expenses from Segment Adjusted EBITDA allows management to focus solely on the evaluation of segment operating profitability as it relates to our revenues and operating expenses which are primarily controlled by our segments.
The following is a reconciliation of consolidated Segment Adjusted EBITDA to net income, the most comparable GAAP financial measures (in thousands):
| Nine Months Ended September 30, |
||||||||
| 2010 | 2009 | |||||||
| Segment Adjusted EBITDA |
$ | 403,720 | $ | 286,331 | ||||
| General and administrative |
(39,353 | ) | (30,060 | ) | ||||
| Depreciation, depletion and amortization |
(109,560 | ) | (83,767 | ) | ||||
| Interest expense, net |
(22,519 | ) | (22,399 | ) | ||||
| Income tax expense |
(1,586 | ) | (811 | ) | ||||
| Net income |
$ | 230,702 | $ | 149,294 | ||||
| (3) | Segment Adjusted EBITDA Expense (a non-GAAP financial measure) includes operating expenses, outside coal purchases and other income. Transportation expenses are excluded as these expenses are passed through to the ARLP Partnership’s customers, and consequently it does not realize any gain or loss on transportation revenues. Segment Adjusted EBITDA Expense is used as a supplemental financial measure by the ARLP Partnership’s management to assess the operating performance of the ARLP Partnership’s segments. Segment Adjusted EBITDA Expense is a key component of EBITDA in addition to coal sales and other sales and operating revenues. The exclusion of corporate general and administrative expenses from Segment Adjusted EBITDA Expense allows management to focus solely on the evaluation of segment operating performance as it primarily relates to our operating expenses. Outside coal purchases are included in Segment Adjusted EBITDA Expense because tons sold and coal sales include sales from outside coal purchases. |
33
Table of Contents
The following is a reconciliation of consolidated Segment Adjusted EBITDA Expense to operating expense, the most comparable GAAP financial measure (in thousands):
| Nine Months Ended September 30, |
||||||||
| 2010 | 2009 | |||||||
| Segment Adjusted EBITDA Expense |
$ | 761,865 | $ | 610,848 | ||||
| Outside coal purchases |
(12,122 | ) | (5,709 | ) | ||||
| Other income |
614 | 554 | ||||||
| Operating expense (excluding depreciation, depletion and amortization) |
$ | 750,357 | $ | 605,693 | ||||
Illinois Basin – Segment Adjusted EBITDA increased 44.7% to $344.2 million for the 2010 Period from $237.9 million for the 2009 Period. The increase of $106.3 million was primarily attributable to increased tons sold, which increased 23.5% to 18.5 million tons sold in the 2010 Period, as well as improved contract pricing resulting in a higher average coal sales price of $47.43 per ton during the 2010 Period compared to $43.27 per ton for the 2009 Period. Coal sales increased 35.4% to $875.8 million in the 2010 Period compared to $646.9 million in the 2009 Period. The increase of $228.9 million primarily reflects increased sales from the ARLP Partnership’s new River View mine (which commenced operations in August of 2009 and continued to expand production during the 2010 Period) and the negative impact of weather disruptions in the 2009 Period at the ARLP Partnership’s Dotiki, Warrior and Elk Creek mines, partially offset by production disruptions at its Dotiki, Gibson and Pattiki mines during the 2010 Period. Total Segment Adjusted EBITDA Expense for the 2010 Period increased 29.9% to $532.6 million from $410.1 million in the 2009 Period and increased $1.41 per ton sold to $28.84 from $27.43 per ton sold, primarily as a result of certain cost increases described above under consolidated operating expenses as well as a $1.2 million loss on the retirement of certain assets related to the failure of the vertical hoist conveyor system at the ARLP Partnership’s Pattiki mine and the aforementioned production disruptions at the ARLP Partnership’s Dotiki, Gibson and Pattiki mines. For more information on the Pattiki mine, please read “Part I. Item 1. Financial Statements (Unaudited) – Note 4. Pattiki Vertical Hoist Conveyor System Failure” of this Quarterly Report on Form 10-Q.
Central Appalachia – Segment Adjusted EBITDA decreased $5.4 million, or 18.1%, to $24.1 million for the 2010 Period, compared to $29.5 million for the 2009 Period. The decrease was primarily the result of lower sales volumes due to reduced coal demand in the spot market during the 2010 Period, the impact of heightened regulatory oversight, lower clean coal recovery due to mining conditions and the continued impact of idling one mining unit at Pontiki in July 2009, partially offset by improved contract pricing in the 2010 Period that resulted in an increase in the average coal sales price of $3.94 per ton to $72.59 per ton in the 2010 Period, as compared to $68.65 per ton in the 2009 Period. Segment Adjusted EBITDA Expense per ton sold during the 2010 Period increased to $58.29 compared to $53.85 per ton sold, an increase of $4.44 per ton sold, reflecting certain cost increases described above under consolidated operating expenses, as well as the impact of lower coal sales volumes and decreased coal production in response to lower spot market demand and lower productivity due to Pontiki’s transition from the depleted Pond Creek coal seam into the thinner Van Lear coal seam during the 2009 Period. Although Segment Adjusted EBITDA Expense per ton sold increased, Segment Adjusted EBITDA Expense for the 2010 Period decreased 8.3% to $97.9 million from $106.8 million in the 2009 Period primarily as a result of lower coal sales offset in part by higher expenses per ton as described above.
Northern Appalachia – Segment Adjusted EBITDA increased to $29.9 million for the 2010 Period, compared to $11.6 million for the 2009 Period. The increase of $18.3 million was primarily
34
Table of Contents
attributable to strong contract pricing reflecting a higher average sales price of $62.11 per ton sold for the 2010 Period compared to $51.05 per ton sold for the 2009 Period, as well as increased tons sold which increased 23.3% to 2.4 million tons in the 2010 Period, both resulting from improved demand in the export coal markets, as well as the benefit of increased production days and additional contract miner production. Segment Adjusted EBITDA Expense for the 2010 Period increased 34.8% to $119.9 million from $88.9 million in the 2009 Period and increased $4.30 on a per ton sold basis to $50.62 from $46.32 per ton sold, primarily as a result higher coal sales volumes, higher costs associated with producing metallurgical quality coal, lower coal recoveries due to adverse geologic conditions, as well as other cost increases described above under consolidated operating expenses, including non-capitalized costs incurred related to the ARLP Partnership’s Tunnel Ridge mine development project.
Other and Corporate – Segment Adjusted EBITDA decreased to $5.5 million in the 2010 Period from $7.8 million in the 2009 Period. The decrease of $2.3 million was primarily attributable to the impact of the deconsolidation of MAC effective January 1, 2010, lower EBITDA associated with Matrix Group safety equipment sales to the ARLP Partnership’s other subsidiaries (which are eliminated upon consolidation), a loss in the 2010 Period compared to a gain in the 2009 Period associated with United Kingdom (“UK”) currency previously held for future equipment purchases from a UK supplier and lower Mt. Vernon outside transloading revenues and affiliate administrative service revenues, partially offset by higher EBITDA resulting from increased third-party safety equipment sales and services revenue at Matrix Design. For more information about MAC, please read “Part I. Item 1. Financial Statements (Unaudited) – Note 8. Mid-America Carbonates” of this Quarterly Report on Form 10-Q. Other sales and operating revenues increased 19.8% to $31.9 million for the 2010 Period compared to $26.6 million for the 2009 Period. The increase of $5.3 million was primarily attributable to increased services revenue and sales of mine safety equipment by the Matrix Group. Segment Adjusted EBITDA Expense increased 46.7% to $28.3 million for the 2010 Period, primarily due to increased expenses associated with higher services revenue and safety equipment sales by the Matrix Group, higher coal brokerage expenses associated with increased brokerage coal sales offset in part by the impact of the deconsolidation of MAC mentioned above.
Liquidity and Capital Resources
Liquidity
Our only cash generating assets are limited partnership and general partnership interests in the ARLP Partnership, including incentive distribution rights, from which we receive quarterly distributions. We currently have no independent operations separate from those of the ARLP Partnership. We rely on distributions from the ARLP Partnership to fund our cash requirements.
The ARLP Partnership has historically satisfied its working capital requirements and funded its capital expenditures and debt service obligations from cash generated from operations, cash provided by the issuance of debt or equity and borrowings under revolving credit facilities. The ARLP Partnership believes that the current cash on hand, cash generated from operations, cash from borrowings under the ARLP Credit Facility and cash provided from the issuance of debt or equity will be sufficient to meet its working capital requirements, anticipated capital expenditures, scheduled debt payments and distribution payments. The ARLP Partnership’s ability to satisfy its obligations and planned expenditures will depend upon its future operating performance and access to and cost of financing sources, which will be affected by prevailing economic conditions generally and in the coal industry specifically, which are beyond its control. Based on the ARLP Partnership’s recent operating results, current cash position, anticipated future cash flows and sources of financing that it expects to have available, it does not anticipate any significant liquidity constraints in the foreseeable future. However, to the extent operating cash flow or access to and cost of financing sources are materially different than expected, future liquidity may be adversely affected. Please read “Item 1A. Risk Factors” in the Annual Report on Form 10-K for the year ended December 31, 2009.
35
Table of Contents
Cash Flows
Cash provided by operating activities was $391.2 million for the 2010 Period compared to $236.9 million for the 2009 Period. The increase in cash provided by operating activities was principally attributable to higher net income, increases in certain operating liabilities, such as accrued taxes other than income taxes, accrued payroll and related expenses and a reduction in coal inventory costs during the 2010 Period as compared to a significant increase during the 2009 Period. These increases in cash provided by operating activities were partially offset by increases in certain operating assets, such as accounts receivable.
Net cash used in investing activities was $238.1 million for the 2010 Period compared to $249.1 million for the 2009 Period. The decrease in cash used for investing activities was primarily attributable to decreased capital expenditures due to the completion of the River View mine development during the 2009 Quarter and Warrior’s infrastructure additions during the second quarter of 2009, partially offset by an increase in Tunnel Ridge capital expenditures and timing differences in accounts payable and accrued liabilities compared to the 2009 Period.
Net cash used in financing activities was $154.6 million for the 2010 Period compared to $140.6 million for the 2009 Period. The increase in cash used in financing activities was primarily attributable to increased distributions paid to partners in the 2010 Period.
Capital Expenditures
Capital expenditures decreased to $233.8 million in the 2010 Period from $251.5 million in the 2009 Period. See “—Cash Flows” above for additional information regarding capital expenditures.
The ARLP Partnership’s anticipated total capital expenditures for the year ending December 31, 2010 are estimated in a range of $285 to $325 million. Management anticipates funding remaining 2010 capital requirements with the ARLP Partnership’s cash and cash equivalents ($20.3 million as of September 30, 2010), cash flows provided by operations, borrowing available under the ARLP Credit Facility and, as necessary, by accessing the debt or equity capital markets. The availability and cost of additional capital will depend upon prevailing market conditions, the market price of ARLP common units and several other factors over which the ARLP Partnership has limited control, as well as its financial condition and results of operations.
Debt Obligations
AHGP Partnership
We have a $2.0 million revolving credit facility (“AHGP Credit Facility”) with C-Holdings, LLC (“C-Holdings”), which owns 100% of the members’ interest of our general partner, AGP, and is controlled by Joseph W. Craft, III, Chairman, President and Chief Executive Officer of AGP. The AHGP Credit Facility matures March 31, 2011 and is available for general partnership purposes. Any borrowings under the facility bear interest at the London Interbank Offered Rate (“LIBOR”) plus 2.0%. We are not required to pay a commitment fee to C-Holdings on the unused portion of the facility. At September 30, 2010, we had no borrowings outstanding under the AHGP Credit Facility. There are no material operating and financial restrictions and covenants in the AHGP Credit Facility. C-Holdings may terminate the facility and demand payment of any amounts outstanding in the event we have a change of control.
36
Table of Contents
ARLP Partnership
ARLP Credit Facility. The Intermediate Partnership maintains the ARLP Credit Facility, a $150.0 million revolving credit facility that matures September 25, 2012. On September 30, 2009, the Intermediate Partnership entered into Amendment No. 2 (the “Credit Amendment”) to the ARLP Credit Facility. The Credit Amendment increased the annual capital expenditure limits under the ARLP Credit Facility. The new limits are $471.8 million for 2010, $350.0 million for 2011 and $250.0 million for 2012. The amount of any annual limit in excess of actual capital expenditures for that year carries forward and is added to the annual limit for the subsequent year.
At September 30, 2010, the ARLP Partnership had $11.6 million of letters of credit outstanding with $130.9 million available for borrowing under the ARLP Credit Facility. The ARLP Partnership had no borrowings outstanding under the ARLP Credit Facility as of September 30, 2010. The ARLP Partnership incurs an annual commitment fee of 0.375% on the undrawn portion of the ARLP Credit Facility.
Lehman Commercial Paper, Inc. (“Lehman”), a subsidiary of Lehman Brothers Holding, Inc., held a 5%, or $7.5 million, commitment in the $150 million ARLP Credit Facility. On February 11, 2010, the ARLP Partnership gave its lenders a notice of borrowing under the ARLP Credit Facility and, in response to that notice, Lehman notified the ARLP Partnership that it would not fund its proportionate share of the borrowing. As a result, as of February 11, 2010, Lehman became a defaulting lender and on October 6, 2010, was removed as a commitment holder under the ARLP Credit Facility. Consequently, availability for borrowing under the ARLP Credit Facility was reduced by $7.5 million.
Senior Notes. The Intermediate Partnership has $72.0 million principal amount of 8.31% senior notes due August 20, 2014, payable in four remaining equal annual installments of $18.0 million with interest payable semi-annually (“ARLP Senior Notes”).
Series A Senior Notes. On June 26, 2008, the Intermediate Partnership entered into a Note Purchase Agreement (the “2008 Note Purchase Agreement”) with a group of institutional investors in a private placement offering. The Intermediate Partnership issued $205.0 million of Series A Senior Notes, which bear interest at 6.28% and mature on June 26, 2015 with interest payable semi-annually.
Series B Senior Notes. On June 26, 2008, the Intermediate Partnership issued under the 2008 Note Purchase Agreement $145.0 million of Series B Senior Notes, which bear interest at 6.72% and mature on June 26, 2018 with interest payable semi-annually.
The ARLP Partnership incurred debt issuance costs of approximately $0.3 million in 2009 associated with the ARLP Credit Facility, which have been deferred and are being amortized as a component of interest expense over the term of the respective notes.
The ARLP Credit Facility, ARLP Senior Notes and Series A and Series B Senior Notes (collectively, “ARLP Debt Arrangements”) are guaranteed by all of the direct and indirect subsidiaries of the Intermediate Partnership. The ARLP Debt Arrangements contain various covenants affecting the Intermediate Partnership and its subsidiaries restricting, among other things, the amount of distributions by the Intermediate Partnership, the incurrence of additional indebtedness and liens, the sale of assets, the making of investments, the entry into mergers and consolidations and the entry into transactions with affiliates, in each case subject to various exceptions. The ARLP Debt Arrangements also require the Intermediate Partnership to remain in control of a certain amount of mineable coal reserves relative to its annual production. In addition, the ARLP Debt Arrangements require the Intermediate Partnership to
37
Table of Contents
maintain the following: (i) debt to cash flow ratio of not more than 3.0 to 1.0, (ii) cash flow to interest expense ratio of not less than 4.0 to 1.0, in each case, during the four most recently ended fiscal quarters and (iii) maximum annual capital expenditures, excluding acquisitions, of $471.8 million for the year ending December 31, 2010. The debt to cash flow ratio and cash flow to interest expense ratio were 0.77 to 1.0 and 17.5 to 1.0, respectively, for the trailing twelve months ended September 30, 2010. Actual capital expenditures were $233.8 million for the 2010 Period. The ARLP Partnership was in compliance with the covenants of the ARLP Debt Arrangements as of September 30, 2010.
Other. In addition to the letters of credit available under the ARLP Credit Facility discussed above, the ARLP Partnership also has agreements with two banks to provide additional letters of credit in an aggregate amount of $31.1 million to maintain surety bonds to secure certain asset retirement obligations and its obligations for workers’ compensation benefits. At September 30, 2010, the ARLP Partnership had $30.7 million in letters of credit outstanding under agreements with these two banks. SGP guarantees $5.0 million of these outstanding letters of credit.
Related-Party Transactions
MAC has a $1.75 million Revolving Credit Agreement (“Revolver”) with ARLP. On November 17, 2009, MAC entered into Amendment No. 2, effective June 30, 2009, which increased the Revolver to $1.75 million from $1.5 million. The Revolver is scheduled to expire on December 31, 2010. At September 30, 2010, MAC owed ARLP $1.7 million under the Revolver, which is classified as Due from Affiliates on our condensed consolidated balance sheets.
The ARLP Partnership has continuing related-party transactions with us, SGP and our respective affiliates. These related-party transactions relate principally to the provision of administrative services to us and Alliance Resource Holdings II, Inc. (“ARH II”) and our respective affiliates, a time sharing agreement concerning use of aircraft and mineral and equipment leases with SGP and its affiliates and guarantees from the SGP for certain letters of credit. The board of directors of MGP and its conflicts committee review each of these transactions to determine that they reflect market-clearing terms and conditions customary in the coal industry. Based on these reviews, the board of directors of MGP and its conflicts committee approved each such transaction, including the transactions noted below, as fair and reasonable to the ARLP Partnership and its limited partners.
In August 2010, the coal lease agreement between Tunnel Ridge and SGP was amended to include additional coal reserves in the Pittsburgh No. 8 coal seam located in Ohio County, West Virginia and Washington County, Pennsylvania. This lease amendment added approximately 33.0 million tons of clean recoverable coal reserves to the proven and probable categories.
On April 1, 2010, effective January 1, 2010, we entered into an Amended and Restated Administrative Services Agreement (the “Agreement”) with ARLP, MGP, the Intermediate Partnership, our general partner AGP, and ARH II, the indirect parent of SGP. The Agreement supersedes the Administrative Services Agreement signed in connection with our initial public offering in 2006. Under the Agreement, certain employees of ARLP, including some executive officers, provide administrative services to AHGP and ARH II and their respective affiliates. ARLP is reimbursed for services rendered by its employees on behalf of these affiliates as provided under the Agreement. Administrative services provided to us by the ARLP Partnership have been eliminated in our condensed consolidated financial statements.
38
Table of Contents
Because the Agreement is a related-party transaction for us, it was also reviewed by the board of directors of AGP and its conflicts committee to determine that the Agreement reflects market-clearing terms and conditions. Based on this review, the board of directors of AGP and its conflicts committee approved the Agreement as fair and reasonable to us and our limited partners.
Please read our Annual Report on Form 10-K for the year ended December 31, 2009, “Item 7. Management’s Discussion and Analysis of Financial Condition and Results of Operations – Related-Party Transactions” for additional information concerning related-party transactions.
New Accounting Standards
New Accounting Standards Issued and Adopted
In December 2009, the Financial Accounting Standards Board (“FASB”) issued Accounting Standards Update (“ASU”) 2009-17, Improvements to Financial Reporting by Enterprises Involved with Variable Interest Entities (“ASU 2009-17”). ASU 2009-17 codified Statement of Financial Accounting Standards No. 167, Amendments to FASB Interpretation No. 46(R)), which changed the consolidation guidance applicable to a variable interest entity (“VIE”). ASU 2009-17 updated the guidance governing the determination of whether an enterprise is the primary beneficiary of a VIE, and is, therefore, required to consolidate such VIE, by requiring a qualitative analysis rather than a quantitative analysis. The qualitative analysis includes, among other things, consideration of whether the enterprise has the power to direct the activities of the entity that most significantly impact the entity’s economic performance and has the obligation to absorb losses or the right to receive benefits of the VIE that could potentially be significant to the VIE. ASU 2009-17 also requires continuous reassessments of whether an enterprise is the primary beneficiary of a VIE. Previously, FASB Accounting Standards Codification (“ASC”) 810, Consolidation, required reconsideration of whether an enterprise was the primary beneficiary of a VIE only when specific events had occurred. Qualifying special purpose entities, which were previously exempt from the application of this standard, are now subject to the provisions of ASU 2009-17. In addition, ASU 2009-17 also requires enhanced disclosures about an enterprise’s involvement with a VIE. The provisions of ASU 2009-17 were effective as of the beginning of interim and annual reporting periods that began after November 15, 2009. Based on our evaluation of ASU 2009-17, the ARLP Partnership deconsolidated Mid-America Carbonates, LLC (“MAC”) upon adoption, effective January 1, 2010. For more information about MAC, please read “Part I. Item 1. Financial Statements (Unaudited) – Note 8. Mid-America Carbonates” of this Quarterly Report on Form 10-Q. The deconsolidation of MAC did not have a material impact on our condensed consolidated financial statements.
In January 2010, the FASB issued ASU 2010-06, Improving Disclosures About Fair Value Measurements (“ASU 2010-06”). ASU 2010-06 amended guidance on certain aspects of FASB ASC 820, Fair Value Measurements and Disclosures, to add new requirements for disclosures of transfers into and out of Level 1 and 2 measurements and separate disclosures about purchases, sales, issuances, and settlements relating to Level 3 measurements, all on a gross basis. ASU 2010-06 also clarifies existing fair value disclosures regarding the level of disaggregation and the inputs and valuation techniques used to measure fair value. The provisions of ASU 2010-06 were effective for the first reporting period beginning after December 15, 2009, except for the requirement to provide Level 3 activity of purchases, sales, issuances, and settlements on a gross basis, which will be effective for fiscal years beginning after December 15, 2010. The adoption of ASU 2010-06 did not have an impact on our condensed consolidated financial statements.
39
Table of Contents
Other
Pattiki Vertical Hoist Conveyor System Failure
On May 13, 2010, White County Coal’s Pattiki mine was temporarily idled following the failure of the vertical hoist conveyor system used in conveying raw coal out of the mine. On July 19, 2010, White County Coal’s efforts to repair the vertical hoist conveyor system had progressed sufficiently to allow resumption of limited production operations. The ARLP Partnership’s operating expenses for the nine months ended September 30, 2010 includes $1.2 million for retirement of certain assets related to the failed vertical hoist conveyor system in addition to other repair and clean-up expenses that were not significant on a consolidated or segment basis. The ARLP Partnership is conducting a final review of its commercial property (including business interruption) insurance policies, which at the time of the equipment failure provided for self-retention, various deductibles and 22% co-insurance for the first $50 million in coverage. As the loss on the vertical hoist conveyor system did not exceed its deductible for property damage, the ARLP Partnership currently believes recovery is unlikely under such policies.
While the Pattiki mine was temporarily idled, the ARLP Partnership expanded coal production at its other coal mines in the region, including the addition of the seventh and eighth production units at the River View mine, to partially offset the loss of production from the Pattiki mine. Consequently, the temporary idling of the Pattiki mine did not have a material adverse impact on the ARLP Partnership’s results of operations and cash flows. On July 19, 2010, the Pattiki mine resumed limited production while White County Coal continues to assess the effectiveness and reliability of the repaired vertical hoist conveyor system until such time it determines the system can be operated at full capacity. The ARLP Partnership is now operating six unit shifts at Pattiki and plans to add two more unit shifts during the quarter ending December 31, 2010, bringing Pattiki back to full capacity by the end of the year.
Insurance
During September 2010, the ARLP Partnership completed its annual property and casualty insurance renewal with various insurance coverages effective October 1, 2010. The aggregate maximum limit in the commercial property program is $75.0 million per occurrence excluding a $1.5 million deductible for property damage, a 60-day waiting period for business interruption and a $10.0 million overall aggregate deductible. The aforementioned property and casualty insurance coverages, effective October 1, 2010, replaced the ARLP Partnership’s prior year 14.7% participation rate with the deductibles mentioned above. The ARLP Partnership can make no assurances that it will not experience significant insurance claims in the future that could have a material adverse effect on its business, financial condition, results of operations and ability to purchase property insurance in the future.
40
Table of Contents
| ITEM 3. | QUANTITATIVE AND QUALITATIVE DISCLOSURES ABOUT MARKET RISK |
The ARLP Partnership has significant long-term coal supply agreements. Virtually all of the long-term coal supply agreements are subject to price adjustment provisions, which permit an increase or decrease periodically in the contract price principally to reflect changes in specified price indices or items such as taxes, royalties or actual production costs.
Almost all of the ARLP Partnership’s transactions are denominated in U.S. dollars and, as a result, neither we nor the ARLP Partnership have material exposure to currency exchange-rate risks. During 2009, the ARLP Partnership entered into a contract to purchase longwall shields for its Tunnel Ridge mine from a foreign supplier for approximately £10.2 million. The ARLP Partnership paid £10.2 million to this foreign supplier through September 30, 2010, thus fulfilling its obligation. The ARLP Partnership does not have any interest rate or commodity price-hedging transactions outstanding.
Borrowings under the ARLP and AHGP Credit Facilities are at variable rates and, as a result, we have interest rate exposure. Historically, our earnings have not been materially affected by changes in interest rates. There were no borrowings outstanding under the ARLP Credit Facility or the AHGP Credit Facility at September 30, 2010.
As of September 30, 2010, the estimated fair value of the ARLP Senior Notes and the Series A and Series B Senior Notes was approximately $482.1 million. The fair values of long-term debt are estimated using discounted cash flow analyses, based upon the ARLP Partnership’s current incremental borrowing rates for similar types of borrowing arrangements as of September 30, 2010. There were no other significant changes in our quantitative and qualitative disclosures about market risk as set forth in our Annual Report on Form 10-K for the year ended December 31, 2009.
| ITEM 4. | CONTROLS AND PROCEDURES |
We maintain controls and procedures designed to ensure that information required to be disclosed in the reports we file with the U.S. Securities and Exchange Commission (“SEC”) is recorded, processed, summarized and reported within the time periods specified in the rules and forms of the SEC and that such information is accumulated and communicated to our management, including our Chief Executive Officer and Chief Financial Officer, as appropriate, to allow for timely decisions regarding required disclosure. An evaluation of the effectiveness of the design and operation of our disclosure controls and procedures (as defined in Rule 13a-15(e) or Rule 15d-15(e) of the Securities Exchange Act) was performed as of September 30, 2010. This evaluation was performed by our management, with the participation of our Chief Executive Officer and Chief Financial Officer. Based on this evaluation, our Chief Executive Officer and Chief Financial Officer concluded that these controls and procedures are effective to ensure that the AHGP Partnership is able to collect, process and disclose the information it is required to disclose in the reports it files with the SEC within the required time periods, and during the quarterly period ended September 30, 2010, there have not been any changes in our internal control over financial reporting (as defined in Rule 13a-15(f) under the Securities Exchange Act of 1934) identified in connection with this evaluation that have materially affected, or are reasonably likely to materially affect, our internal control over financial reporting.
41
Table of Contents
This Quarterly Report on Form 10-Q contains forward-looking statements within the meaning of Section 27A of the Securities Act of 1933 and Section 21E of the Securities Exchange Act of 1934 that are intended to come within the safe harbor protection provided by those sections. These statements are based on our beliefs as well as assumptions made by, and information currently available to, us. When used in this document, the words “anticipate,” “believe,” “continue,” “estimate,” “expect,” “forecast,” “may,” “project,” “will,” and similar expressions identify forward-looking statements. Without limiting the foregoing, all statements relating to our future outlook, anticipated capital expenditures, future cash flows and borrowings and sources of funding are forward-looking statements. These statements reflect our current views with respect to future events and are subject to numerous assumptions that we believe are reasonable, but are open to a wide range of uncertainties and business risks, and actual results may differ materially from those discussed in these statements. Among the factors that could cause actual results to differ from those in the forward-looking statements are:
| • | increased competition in coal markets and the ARLP Partnership’s ability to respond to the competition; |
| • | decreases in coal prices, which could adversely affect the ARLP Partnership’s operating results and cash flows; |
| • | risks associated with the ARLP Partnership’s expansion of its operations and properties; |
| • | the impact of recent federal health care legislation; |
| • | deregulation of the electric utility industry or the effects of any adverse change in the coal industry, electric utility industry, or general economic conditions; |
| • | dependence on significant customer contracts, including renewing customer contracts upon expiration of existing contracts; |
| • | weakness in global economic conditions or in industries in which our customers operate; |
| • | liquidity constraints, including those resulting from the cost or unavailability of financing due to current capital market conditions; |
| • | customer bankruptcies, cancellations or breaches to existing contracts, or other failures to perform; |
| • | customer delays, failure to take coal under contracts or defaults in making payments; |
| • | adjustments made in price, volume or terms to existing coal supply agreements; |
| • | fluctuations in coal demand, prices and availability due to labor and transportation costs and disruptions, equipment availability, governmental regulations, including those related to carbon dioxide emissions, and other factors; |
| • | legislation, regulatory and court decisions and interpretations thereof, including issues related to climate change and miner health and safety; |
| • | the ARLP Partnership’s productivity levels and margins it earns on coal sales; |
| • | greater than expected increases in raw material costs; |
| • | greater than expected shortage of skilled labor; |
| • | the ARLP Partnership’s ability to maintain satisfactory relations with its employees; |
| • | any unanticipated increases in labor costs, adverse changes in work rules, or unexpected cash payments associated with post-mine reclamation and workers’ compensation claims; |
| • | any unanticipated increases in transportation costs and risk of transportation delays or interruptions; |
| • | greater than expected environmental regulation, costs and liabilities; |
| • | a variety of operational, geologic, permitting, labor and weather-related factors; |
| • | risks associated with major mine-related accidents, such as mine fires, or interruptions; |
| • | results of litigation, including claims not yet asserted; |
42
Table of Contents
| • | difficulty maintaining the ARLP Partnership’s surety bonds for mine reclamation as well as workers’ compensation and black lung benefits; |
| • | difficulty in making accurate assumptions and projections regarding pension, black lung benefits and other post-retirement benefit liabilities; |
| • | coal market’s share of electricity generation, including as a result of environmental concerns related to coal mining and combustion and the cost and perceived benefits of alternative sources of energy, such as natural gas, nuclear energy and renewable fuels; |
| • | replacement of coal reserves; |
| • | a loss or reduction of benefits from certain tax credits; |
| • | difficulty obtaining commercial property insurance, and risks associated with the ARLP Partnership’s participation (excluding any applicable deductible) in its commercial insurance property program; and |
| • | other factors, including those discussed in “Part II. Item 1A. Risk Factors” and “Part II. Item 1. Legal Proceedings” of this Quarterly Report on Form 10-Q. |
If one or more of these or other risks or uncertainties materialize, or should underlying assumptions prove incorrect, our actual results may differ materially from those described in any forward-looking statement. When considering forward-looking statements, you should also keep in mind the risks described in “Risk Factors” below. These risks could also cause our actual results to differ materially from those contained in any forward-looking statement. We disclaim any obligation to update the above list or to announce publicly the result of any revisions to any of the forward-looking statements to reflect future events or developments.
You should consider the information above when reading or considering any forward-looking statements contained in:
| • | this Quarterly Report on Form 10-Q; |
| • | other reports filed by us with the SEC; |
| • | our press releases; and |
| • | written or oral statements made by us or any of our officers or other authorized persons acting on our behalf. |
43
Table of Contents
PART II
OTHER INFORMATION
| ITEM 1. | LEGAL PROCEEDINGS |
The information in Note 3. Contingencies to the Unaudited Condensed Consolidated Financial Statements included in “Part I. Item 1. Financial Statements (Unaudited)” of this Quarterly Report on Form 10-Q herein is hereby incorporated by reference. See also “Item 3. Legal Proceedings” of the Annual Report on Form 10-K for the year ended December 31, 2009 and “Part II. Item 1. Legal Proceedings” of the Quarterly Reports on Form 10-Q for the quarters ended March 31, 2010 and June 30, 2010.
On April 24, 2006, the ARLP Partnership was served with a complaint from Mr. Ned Comer, et al. (the “Plaintiffs”) alleging that approximately 40 oil and coal companies, including the ARLP Partnership, (the “Defendants”) is liable to the Plaintiffs for tortuously causing damage to Plaintiffs’ property in Mississippi. The Plaintiffs allege that the Defendants’ greenhouse gas emissions caused global warming and resulted in the increase in the destructive capacity of Hurricane Katrina. On August 30, 2007, the trial court dismissed the Plaintiffs’ complaint. On September 17, 2007, Plaintiffs filed a notice of appeal of that dismissal to the U.S. Court of Appeals for the Fifth Circuit. On October 16, 2009, the Fifth Circuit overturned the trial court’s dismissal of the Plaintiffs’ private nuisance, trespass and negligence claims, finding Article III constitutional standing and no political question. The Fifth Circuit remanded these claims to the trial court for further proceedings. By order filed February 26, 2010, the Fifth Circuit granted the Defendants’ petition for rehearing en banc, with oral argument scheduled for May 24, 2010. On May 28, 2010, the Fifth Circuit Court of Appeals dismissed the appeal because the court did not have a quorum after one of the judges hearing the appeal recused herself. The court ruled that, without a quorum, it could not decide the appeal nor could it reinstate the earlier ruling by a three judge panel that would have reversed the District Courts decision dismissing the case. On August 26, 2010, Plaintiffs petitioned the U.S. Supreme Court seeking a Writ of Mandamus ordering the Fifth Circuit to reinstate the appeal. Defendants’ response to the petition is due November 24, 2010. The ARLP Partnership believes this complaint is without merit and it does not believe that an adverse decision in this litigation matter, if any, based on the ARLP Partnership’s status as a defendant, will have a material adverse effect on its business, financial position or results of operations. If, however, tort claims brought in this and other cases against corporate defendants for liability arising from greenhouse gas emissions are successful, demand for the ARLP Partnership’s coal could be adversely impacted.
| ITEM 1A. | RISK FACTORS |
We are subject to a variety of risks, including, but not limited to those referenced under the heading “Health Care Reform” of “Part I. Item 2. Management’s Discussion and Analysis of Financial Condition and Results of Operations” of this Quarterly Report on Form 10-Q and those referenced herein to other Items contained in our Annual Report on Form 10-K for the year ended December 31, 2009, including “Item 1. Business”, “Item 1A. Risk Factors”, “Item 3. Legal Proceedings” and “Item 7. Management’s Discussion and Analysis of Financial Condition and Results of Operations.” Except as set forth under “—Health Care Reform” and elsewhere under “Part I. Item 2. Management’s Discussion and Analysis of Financial Condition and Results of Operations” of this Quarterly Report on Form 10-Q, we do not believe there have been any material changes to the risk factors previously disclosed in our Annual Report on Form 10-K for the year ended December 31, 2009 and our Quarterly Report on Form 10-Q for the quarterly period ended June 30, 2010, except as follows.
44
Table of Contents
Recent legislation regarding health care may adversely impact our results of operations.
On March 23, 2010, President Obama signed into law the Patient Protection and Affordable Care Act. Additionally, on March 30, 2010, President Obama signed into law a reconciliation measure, the Health Care and Education Reconciliation Act of 2010. The passage of the Patient Protection and Affordable Care Act and the Health Care and Education Reconciliation Act (collectively, the “Health Care Act”) will result in comprehensive changes to health care in the U.S. Implementation of this legislation is planned to occur in phases, with standard plan changes taking effect beginning in 2010, but to a greater extent with the 2011 benefit plan year and extending through 2018.
The Health Care Act has both short-term and long-term implications on benefit plan eligibility, coverage requirements, and benefit standards and limitations. In the short term, the ARLP Partnership’s health care costs are expected to increase due to raising the maximum age and easing of eligibility limitations for covered dependents. The Health Care Act also prevents the group health plan from limiting benefit payments for participants who meet or exceed annual or lifetime dollar limits per covered individual. The ARLP Partnership does not currently expect raising the maximum age and easing of eligibility limitations for covered dependents to significantly increase its annual health care costs beginning in 2011. In addition, the ARLP Partnership currently expects removing the lifetime maximum to have an additional impact on it that the ARLP Partnership is unable to reasonably estimate at this time. While historically few participants have reached the plan lifetime maximum limit of $1 million, future federal and state mandates are expected to impact large claims costs and make this a potentially greater risk variable in the future. In the long term, the ARLP Partnership plan’s health care costs are expected to increase for various reasons due to the Health Care Act, including the potential impact of an excise tax on “high cost” plans (beginning in 2018), among other standard requirements. The ARLP Partnership has chosen not to “grandfather” its health care plan as allowed under the Health Care Act. Maintaining “grandfather” status prevents the plan from making plan benefit modifications that encourage participants to use high value, lower cost medical care options such as on-site medical services, generic preferred medications, and urgent care centers instead of emergency rooms.
The ARLP Partnership anticipates that certain government agencies will provide additional regulations or interpretations concerning the application of the Health Care Act and reporting required thereunder. Until these regulations or interpretations are published, the ARLP Partnership is unable to reasonably estimate the further impact of such federal mandate requirements on its future health care costs.
The ARLP Partnership will continue to evaluate the potential impact of the legislation on its self-insured long term disability plan, Black Lung liabilities, results of operations and internal controls as governmental agencies issue interpretations regarding the meaning and scope of the Health Care Act. However, the ARLP Partnership believes it is likely that its costs will increase as a result of these provisions, which may have an adverse impact on its results of operations and cash flows.
Recent health care legislation has generally made it easier for claimants to assert and prosecute Black Lung claims, which could increase the ARLP Partnership’s exposure to Black Lung benefit liabilities.
The recently enacted Health Care Act includes a Black Lung provision that creates a rebuttable presumption that a miner with at least 15 years of service, with totally disabling pulmonary or respiratory lung impairment and negative radiographic chest x-ray evidence, would be disabled due to pneumoconiosis and be eligible for Black Lung benefits. The new Health Care Act also makes it easier for widows of miners to become eligible for benefits, as it amended previous legislation related to coal workers’ Black Lung benefits by providing automatic extensions of awarded lifetime benefits to surviving spouses and providing changes to the legal criteria used to assess and award claims, effective for claims filed or pending after January 1, 2005. As a result of this new legislation, the number of claimants who are awarded benefits and the ARLP Partnership’s future payments of Black Lung benefits could increase, which may have an adverse impact on the ARLP Partnership’s results of operations and cash flows.
45
Table of Contents
| ITEM 2. | UNREGISTERED SALES OF EQUITY SECURITIES AND USE OF PROCEEDS |
None.
| ITEM 3. | DEFAULTS UPON SENIOR SECURITIES |
None.
| ITEM 4. | RESERVED |
| ITEM 5. | OTHER INFORMATION |
Federal Mine Safety and Health Act Information
Workplace safety is fundamental to the ARLP Partnership’s culture. The ARLP Partnership’s operating subsidiaries empower their employees to be actively involved in continuous efforts to prevent accidents. By providing a work environment that rewards safety and encourages employee participation in the safety process, the ARLP Partnership’s mining operations strive to be the leaders in safety performance in its industry.
The ARLP Partnership is also a leader in developing and implementing new technologies to improve safety throughout the industry. For example, the ARLP Partnership’s subsidiary Matrix Design recently announced the development of two innovative technologies designed to improve safety in underground mining operations – a portable, wireless communication and electronic tracking system designed to allow surface personnel the ability to communicate with and locate underground mining personnel and a proximity detection system designed to improve the safety of continuous mining units used in underground operations. Matrix Design has completed installation of its communication and tracking system at all of the ARLP Partnership’s operating subsidiaries and has either installed or received orders to install this vital safety system at over half of the operating underground coal mines in the U.S. In addition, Matrix Design has installed and is conducting field tests on eleven of its proximity detection systems at eight of the ARLP Partnership’s operating subsidiaries’ underground coal mines.
46
Table of Contents
Our industry is focused on improving employee safety and its safety performance is continuously monitored, including through the mining industry standard of “non-fatal days lost”, or “NFDL”, which reflects both the frequency and severity of injuries incurred and, the ARLP Partnership believes, is a better measure of safety performance than compliance statistics. As indicated in the chart below, these efforts have resulted in significant safety improvements as the industry average NFDL, as reported(a) by the Mine Safety and Health Administration (“MSHA”), has decreased approximately 60% since 1998.
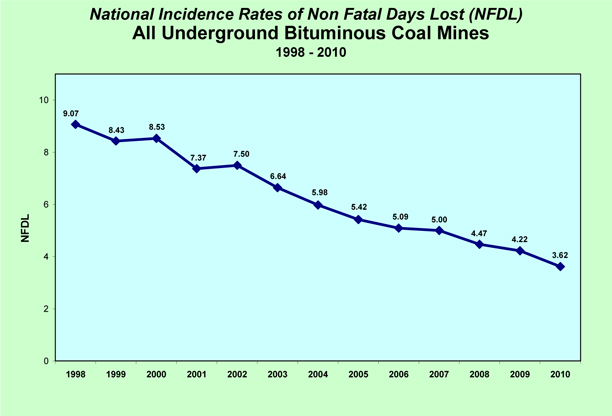
| (a) | Data compiled for all U.S. underground bituminous coal mines and related surface facilities from the MSHA report “Mine Injury and Worktime, Quarterly Closeout Edition.” Data for 1998 through 2009 reflects the “January – December, Final” report for each year. Data for 2010 reflects the “January – June, Preliminary” report for the first six months of 2010. |
During this same time period, the combined NFDL rating of the ARLP Partnership’s operating subsidiaries has averaged approximately one-third better than the industry average. The average NFDL rating of the ARLP Partnership’s operating subsidiaries through September 30, 2010 has positioned it to achieve its best annual NFDL results in its history.
The ARLP Partnership’s mining operations are subject to extensive and stringent compliance standards established pursuant to the Federal Mine Safety and Health Act of 1977, as amended by the Federal Mine Improvement and New Emergency Response Act of 2006 (as amended, the “Mine Act”). MSHA monitors and rigorously enforces compliance with these standards, and the ARLP Partnership’s mining operations are inspected frequently. During the three months ended September 30, 2010, the ARLP Partnership’s mines were subject to 1,598 MSHA inspection days, with an average of only 0.19 “significant and substantial”, or “S&S”, citations written per inspection day.
47
Table of Contents
The ARLP Partnership endeavors to comply at all times with all Mine Act regulations. However, the Mine Act has been construed as authorizing MSHA to issue citations and orders pursuant to the legal doctrine of strict liability, or liability without fault. If, in the opinion of an MSHA inspector, a condition that violates the Mine Act or regulations promulgated pursuant to it exists, then a citation or order will be issued regardless of whether the ARLP Partnership had any knowledge of, or fault in, the existence of that condition. Many of the Mine Act standards include one or more subjective elements, so that issuance of a citation often depends on the opinions or experience of the MSHA inspector involved and the frequency of citations will vary from inspector to inspector.
The number of citations issued also is affected by the size of the mine, in that the number of citations issued generally increases with the size of the mine. The ARLP Partnership mines typically are larger in scale than most underground coal mines in the U.S. in terms of area, production and employee hours.
The ARLP Partnership takes all allegations of violations of Mine Act standards seriously, and if it disagrees with the assertions of an MSHA inspector, the ARLP Partnership exercises its right to challenge those findings by “contesting” the citation or order pursuant to the procedures established by the Mine Act and its regulations. During 2010,, the ARLP Partnership’s operating subsidiaries have contested approximately 25% of all citations and the majority of S&S citations issued by MSHA inspectors. These contest proceedings frequently result in the dismissal or modification of previously issued citations, substantial reductions in the penalty amounts originally assessed by MSHA, or both.
The recently enacted Dodd-Frank requires issuers to include in periodic reports filed with the SEC certain information relating to citations or orders for violations of standards under the Mine Act. Responding to that legislation, we report that, for the three months ended September 30, 2010, none of the ARLP Partnership’s operating subsidiaries (a) received any violations under section 110(b)(2) of the Mine Act for failure to make reasonable efforts to eliminate a known violation of a mandatory safety or health standard that substantially proximately caused, or reasonably could have been expected to cause, death or serious bodily injury, (b) received any MSHA written notice under Mine Act section 104(e) of a pattern of violations of mandatory health or safety standards or the potential to have such a pattern, (c) had any fatalities or (d) had any legal proceedings (i.e. appeals before the Federal Mine Safety and Health Review Commission (the “Commission”)) pending. The ARLP Partnership has 264 contests pending before administrative law judges of the Commission that were initiated during the quarter and that involve all types of citations (i.e., not just S&S citations).
48
Table of Contents
The following chart sets out additional information responding to the Dodd-Frank Act for the three months ended September 30, 2010:
| Subsidiary Name (1) |
Section 104(a) Citations(2) |
Section 104(b) Orders(3) |
Section 104(d) Citations and Orders(4) |
Section 107(a) Orders(5) |
Total
Proposed Assessments (in thousands)(6) |
|||||||||||||||
| Illinois Basin Operations |
||||||||||||||||||||
| Webster County Coal, LLC (KY) |
51 | — | 3 | — | $ | 103.3 | ||||||||||||||
| Warrior Coal, LLC (KY) |
61 | — | 1 | — | $ | 28.6 | ||||||||||||||
| Hopkins County Coal, LLC (KY) |
30 | — | — | — | $ | 17.5 | ||||||||||||||
| River View Coal, LLC (KY) |
22 | — | — | — | $ | 2.3 | ||||||||||||||
| White County Coal, LLC (IL) |
8 | — | 1 | — | $ | — | ||||||||||||||
| Gibson County Coal, LLC (IN) |
33 | — | 1 | — | $ | 33.7 | ||||||||||||||
| Central Appalachian Operations |
||||||||||||||||||||
| Pontiki Coal, LLC (KY) |
29 | — | 1 | — | $ | 52.6 | ||||||||||||||
| MC Mining, LLC (KY) |
28 | 2 | — | — | $ | 50.9 | ||||||||||||||
| Northern Appalachian Operations |
||||||||||||||||||||
| Mettiki Coal, LLC (MD) |
1 | — | — | — | $ | 0.3 | ||||||||||||||
| Mettiki Coal (WV), LLC |
27 | — | — | — | $ | 4.3 | ||||||||||||||
| Tunnel Ridge, LLC (PA/WV) |
10 | — | — | — | $ | 1.0 | ||||||||||||||
| (1) | The statistics reported for each subsidiary of the ARLP Partnership listed above include all components of the mining complex involved and therefore may involve multiple MSHA identification numbers. Any S&S citations or orders issued to the ARLP Partnership’s subsidiary, Excel Mining, LLC, are included in the statistics for either Pontiki Coal, LLC or MC Mining, LLC, depending on the mining complex involved. |
| (2) | Mine Act section 104(a) citations shown above are for alleged violations of health or safety standards that could significantly and substantially contribute to a serious injury if left unabated. |
| (3) | Mine Act section 104(b) orders are for alleged failures to totally abate a citation within the period of time specified in the citation. |
| (4) | Mine Act section 104(d) citations and orders are for an alleged unwarrantable failure (i.e. aggravated conduct constituting more than ordinary negligence) to comply with a mining safety standard or regulation. |
| (5) | Mine Act section 107(a) orders are for alleged conditions or practices which could reasonably be expected to cause death or serious physical harm before such condition or practice can be abated. |
| (6) | Amounts shown include assessments proposed by MSHA during the three months ended September 30, 2010 on the citations and orders reflected in this chart. |
49
Table of Contents
| ITEM 6. | EXHIBITS |
| Incorporated by Reference | ||||||||||||||||||||||
| Exhibit |
Exhibit Description |
Form | SEC File No. and Film No. |
Exhibit | Filing Date |
Filed Herewith* |
||||||||||||||||
| 31.1 | Certification of Joseph W. Craft, III, President and Chief Executive Officer of Alliance GP, LLC, the general partner of Alliance Holdings GP, L.P., dated November 8, 2010, pursuant to Section 302 of the Sarbanes-Oxley Act of 2002. | þ | ||||||||||||||||||||
| 31.2 | Certification of Brian L. Cantrell, Senior Vice President and Chief Financial Officer of Alliance GP, LLC, the general partner of Alliance Holdings GP, L.P., dated November 8, 2010, pursuant to Section 302 of the Sarbanes-Oxley Act of 2002. | þ | ||||||||||||||||||||
| 32.1 | Certification of Joseph W. Craft III, President and Chief Executive Officer of Alliance GP, LLC, the general partner of Alliance Holdings GP, L.P., dated November 8, 2010, pursuant to Section 906 of the Sarbanes-Oxley Act of 2002. | þ | ||||||||||||||||||||
| 32.2 | Certification of Brian L. Cantrell, Senior Vice President and Chief Financial Officer of Alliance GP, LLC, the general partner of Alliance Holdings GP, L.P., dated November 8, 2010, pursuant to Section 906 of the Sarbanes-Oxley Act of 2002. | þ | ||||||||||||||||||||
| * | Or furnished, in the case of Exhibits 32.1 and 32.2. |
50
Table of Contents
SIGNATURES
Pursuant to the requirements of the Securities Exchange Act of 1934, the registrant has duly caused this report to be signed on its behalf by the undersigned thereunto duly authorized, in Tulsa, Oklahoma, on November 8, 2010.
| ALLIANCE HOLDINGS GP, L.P. | ||
| By: |
Alliance GP, LLC | |
| its general partner | ||
| /s/ Joseph W. Craft, III | ||
| Joseph W. Craft, III | ||
| President, Chief Executive Officer and Director, duly authorized to sign on behalf of the registrant | ||
| /s/ Brian L. Cantrell | ||
| Brian L. Cantrell | ||
| Senior Vice President and Chief Financial Officer | ||
51