Attached files
| file | filename |
|---|---|
| 8-K - FORM 8-K - Ally Financial Inc. | v200597_8k.htm |
| EX-99.1 - EXHIBIT 99.1 - Ally Financial Inc. | v200597_ex99-1.htm |
 Ally Financial Inc.
3Q10 Earnings Review
November 3, 2010
Contact Ally Investor Relations at (866) 710-4623 or investor.relations@ally.com
Ally Financial Inc.
3Q10 Earnings Review
November 3, 2010
Contact Ally Investor Relations at (866) 710-4623 or investor.relations@ally.com
 Forward-Looking Statements and Additional Information
The following should be read in conjunction with the financial statements, notes and other information contained in the Company’s 2009 Annual
Forward-Looking Statements and Additional Information
The following should be read in conjunction with the financial statements, notes and other information contained in the Company’s 2009 Annual
Report on Form 10-K, Quarterly Reports on Form 10-Q, and Current
Reports on Form 8-K.
This information is preliminary and based on company data available at the time of the presentation
In the presentation that follows and related comments by Ally Financial Inc. (“Ally”) management, the use of the words “expect,” “anticipate,”
“estimate,” “forecast,”
“initiative,” “objective,” “plan,” “goal,” “project,” “outlook,” “priorities,” “target,” “intend,” “evaluate,” “pursue,” “seek,” “may,”
“would,” “could,” “should,” “believe,” “potential,” “continue,” or similar expressions is intended to identify forward-looking statements. All statements
herein and in related management comments,
other than statements of historical fact, including without limitation, statements about future events
and financial performance, are forward-looking statements that involve certain risks and uncertainties. While these statements represent our
current
judgment on what the future may hold, and we believe these judgments are reasonable, these statements are not guarantees of any
events or financial results, and Ally’s actual results may differ materially due to numerous important factors that are
described in the most recent
reports on SEC Forms 10-K and 10-Q for Ally, each of which may be revised or supplemented in subsequent reports on SEC Forms 10-Q and 8-
K. Such factors include, among others, the following: our inability to repay our outstanding
obligations to the U.S. Department of the Treasury, or to
do so in a timely fashion and without disruption to our business; uncertainty of Ally's ability to enter into transactions or execute strategic
alternatives to realize the value of its Residential
Capital, LLC (“ResCap”) operations; our inability to successfully accommodate the additional risk
exposure relating to providing wholesale and retail financing to Chrysler dealers and customers and the resulting impact to our financial stability;
uncertainty related to Chrysler’s and GM’s recent exits from bankruptcy; uncertainty related to the new financing arrangement between Ally and
Chrysler; securing low cost funding for Ally and ResCap and maintaining the mutually beneficial
relationship between Ally and GM, and Ally and
Chrysler; our ability to maintain an appropriate level of debt and capital; the profitability and financial condition of GM and Chrysler; our ability to
realize the anticipated benefits associated with
our conversion to a bank holding company, and the increased regulation and restrictions that we
are now subject to; continued challenges in the residential mortgage and capital markets; the potential for deterioration in the residual value of off-
lease
vehicles; the continuing negative impact on ResCap of the decline in the U.S. housing market; any impact resulting from delayed foreclosure
sales or related matters; changes in U.S. government-sponsored mortgage programs or disruptions in the markets in
which our mortgage
subsidiaries operate; disruptions in the market in which we fund Ally’s and ResCap’s operations, with resulting negative impact on our liquidity;
changes in our accounting assumptions that may require or that result from
changes in the accounting rules or their application, which could result
in an impact on earnings; changes in the credit ratings of ResCap, Ally, Chrysler or GM; changes in economic conditions, currency exchange rates
or political stability in the markets
in which we operate; and changes in the existing or the adoption of new laws, regulations, policies or other
activities of governments, agencies and similar organizations (including as a result of the recently enacted financial regulatory reform bill).
Investors
are cautioned not to place undue reliance on forward-looking statements. Ally undertakes no obligation to update publicly or otherwise
revise any forward-looking statements except where expressly required by law. Reconciliation of non-GAAP financial measures
included within
this presentation are provided in this presentation.
Use of the term “loans” describes products associated with direct and indirect lending activities of Ally’s global operations. The specific products
include retail installment sales
contracts, loans, lines of credit, leases or other financing products. The term “originate” refers to Ally’s purchase,
acquisition or direct origination of various “loan” products.
2
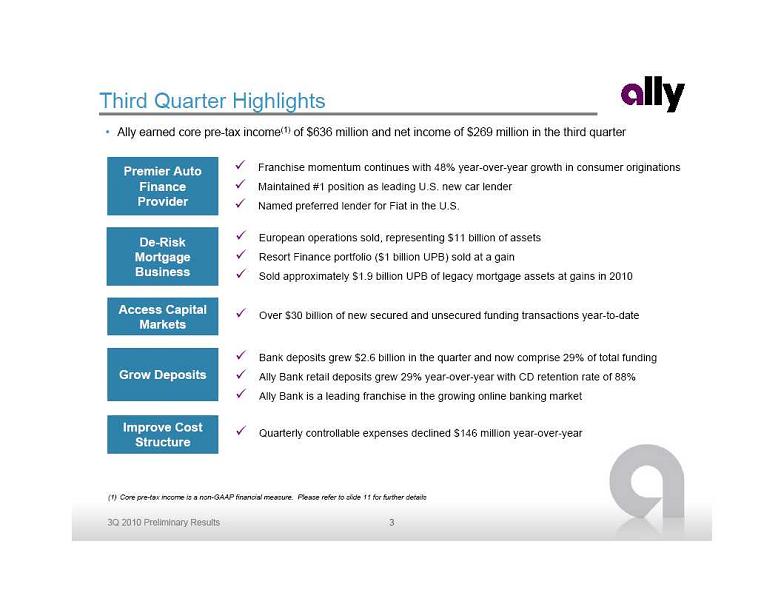 Third Quarter Highlights
Ally earned core pre-tax income(1) of $636 million and net income of $269 million in the
third quarter
Premier Auto
Third Quarter Highlights
Ally earned core pre-tax income(1) of $636 million and net income of $269 million in the
third quarter
Premier Auto
Finance
Provider
Access Capital
Markets
Improve Cost
Structure
Franchise momentum continues with 48% year-over-year growth in consumer originations
Maintained #1 position as leading U.S. new car lender
Named preferred lender for Fiat in the U.S.
Over $30 billion of new secured and unsecured funding transactions year-to-date
Quarterly controllable expenses declined $146 million year-over-year
Bank deposits grew $2.6 billion in the quarter and now comprise 29% of total funding
Ally Bank retail deposits grew 29% year-over-year with CD retention rate of 88%
Ally Bank is a leading franchise in the growing online banking market
(1) Core pre-tax income is a non-GAAP financial measure. Please refer to slide 11 for further details
De-Risk
Mortgage
Business
European operations sold, representing $11 billion of assets
Resort Finance portfolio ($1 billion UPB)
sold at a gain
Sold approximately $1.9 billion UPB of legacy mortgage assets at gains in 2010
Grow Deposits
3
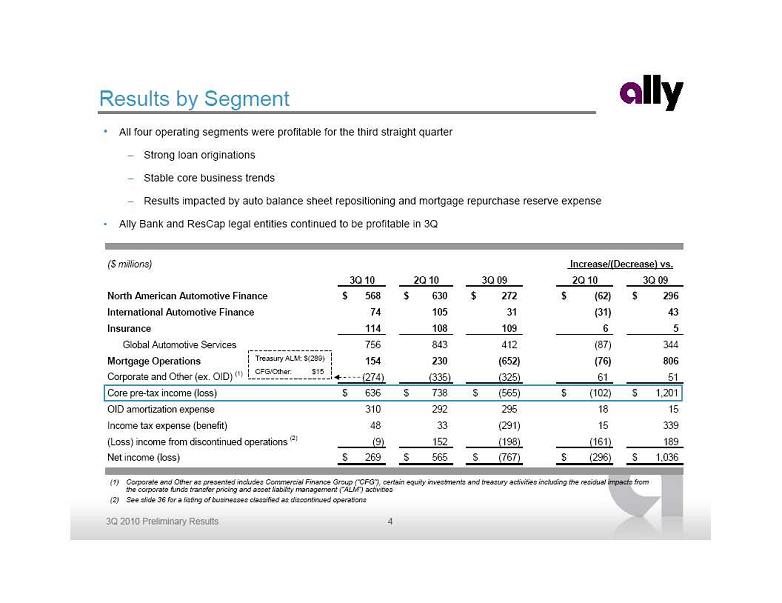 Results by Segment
All four operating segments were profitable for the third straight quarter
Strong loan originations
Stable core business trends
Results impacted by auto balance sheet repositioning and mortgage repurchase reserve expense
Ally Bank and ResCap legal entities continued to be profitable in 3Q
(1) Corporate and Other as presented includes Commercial Finance Group (“CFG”), certain equity investments and treasury activities including the residual impacts from
Results by Segment
All four operating segments were profitable for the third straight quarter
Strong loan originations
Stable core business trends
Results impacted by auto balance sheet repositioning and mortgage repurchase reserve expense
Ally Bank and ResCap legal entities continued to be profitable in 3Q
(1) Corporate and Other as presented includes Commercial Finance Group (“CFG”), certain equity investments and treasury activities including the residual impacts from
the corporate funds transfer pricing
and asset liability management (“ALM”) activities
(2) See slide 36 for a listing of businesses classified as discontinued operations
Treasury ALM: $(289)
CFG/Other: $15
($ millions)
3Q 10
2Q 10
3Q 09
2Q 10
3Q 09
North American Automotive Finance
568
$
630
$
272
$
(62)
$
296
$
International Automotive Finance
74
105
31
(31)
43
Insurance
114
108
109
6
5
Global Automotive Services
756
843
412
(87)
344
Mortgage Operations
154
230
(652)
(76)
806
Corporate and Other (ex. OID)
(1)
(274)
(335)
(325)
61
51
Core pre-tax income (loss)
636
$
738
$
(565)
$
(102)
$
1,201
$
OID amortization expense
310
292
295
18
15
Income tax expense (benefit)
48
33
(291)
15
339
(Loss) income from discontinued operations
(2)
(9)
152
(198)
(161)
189
Net income (loss)
269
$
565
$
(767)
$
(296)
$
1,036
$
Increase/(Decrease) vs.
4
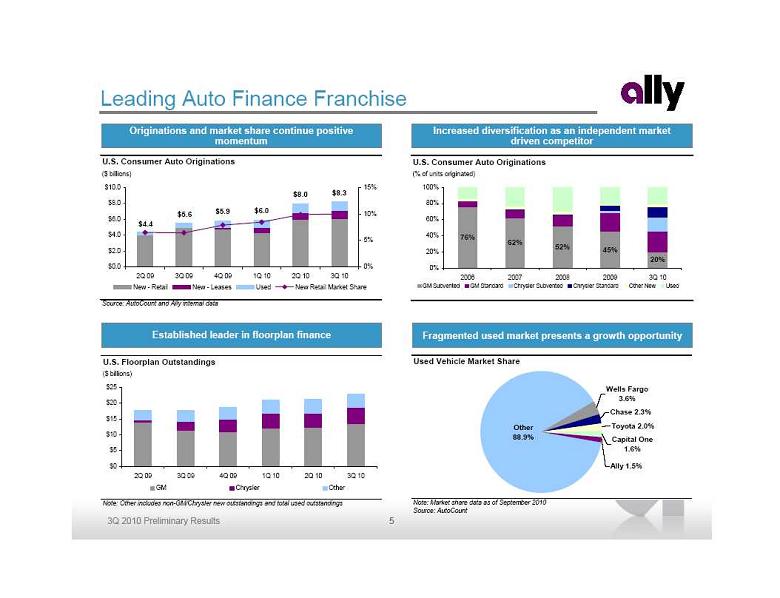 Leading Auto Finance Franchise
Established leader in floorplan finance
Increased diversification as an independent market
Leading Auto Finance Franchise
Established leader in floorplan finance
Increased diversification as an independent market
driven competitor
Originations and market share continue positive
momentum
Fragmented used market presents a growth opportunity
U.S. Consumer Auto Originations
($ billions)
Source: AutoCount and Ally internal data
$5.9
$6.0
$8.0
$8.3
$4.4
$5.6
$0.0
$2.0
$4.0
$6.0
$8.0
$10.0
2Q 09
3Q 09
4Q 09
1Q 10
2Q 10
3Q 10
0%
5%
10%
15%
New - Retail
New - Leases
Used
New Retail Market Share
U.S. Consumer Auto Originations
(% of units originated)
76%
62%
52%
45%
20%
0%
20%
40%
60%
80%
100%
2006
2007
2008
2009
3Q 10
GM Subvented
GM Standard
Chrysler Subvented
Chrysler Standard
Other New
Used
U.S. Floorplan Outstandings
($ billions)
Note: Other includes non-GM/Chrysler new outstandings and total used outstandings
$0
$5
$10
$15
$20
$25
2Q 09
3Q 09
4Q 09
1Q 10
2Q 10
3Q 10
GM
Chrysler
Other
Used Vehicle Market Share
Note: Market share data as of September 2010
Source: AutoCount
Other
88.9%
Wells Fargo
3.6%
Chase 2.3%
Toyota 2.0%
Capital One
1.6%
Ally 1.5%
5
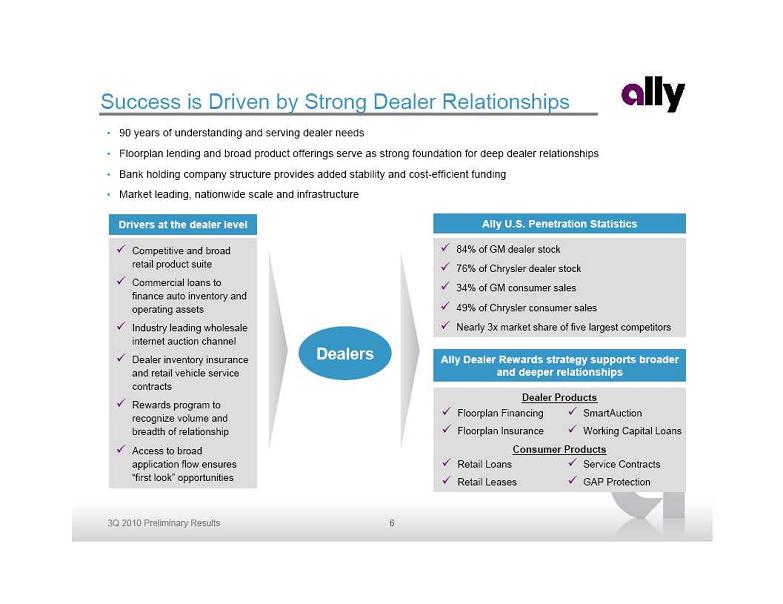 Success is Driven by Strong Dealer Relationships
90 years of understanding and serving dealer needs
Floorplan lending and broad product offerings serve as strong foundation for deep dealer relationships
Bank holding company structure provides added stability and cost-efficient funding
Market leading, nationwide scale and infrastructure
Drivers at the dealer level
84% of GM dealer stock
76% of Chrysler dealer stock
34% of GM consumer sales
49% of Chrysler consumer sales
Nearly 3x market share of five largest competitors
Ally U.S. Penetration Statistics
Dealers
Ally Dealer Rewards strategy supports broader
Success is Driven by Strong Dealer Relationships
90 years of understanding and serving dealer needs
Floorplan lending and broad product offerings serve as strong foundation for deep dealer relationships
Bank holding company structure provides added stability and cost-efficient funding
Market leading, nationwide scale and infrastructure
Drivers at the dealer level
84% of GM dealer stock
76% of Chrysler dealer stock
34% of GM consumer sales
49% of Chrysler consumer sales
Nearly 3x market share of five largest competitors
Ally U.S. Penetration Statistics
Dealers
Ally Dealer Rewards strategy supports broader
and deeper relationships
Competitive and broad
retail product suite
Commercial loans to
finance auto inventory and
operating assets
Industry leading wholesale
internet auction channel
Dealer inventory insurance
and retail vehicle service
contracts
Rewards program to
recognize volume and
breadth of relationship
Access to broad
application flow ensures
“first look” opportunities
Dealer Products
Consumer Products
Floorplan Financing
Floorplan Insurance
SmartAuction
Working Capital Loans
Retail Loans
Retail Leases
Service Contracts
GAP Protection
6
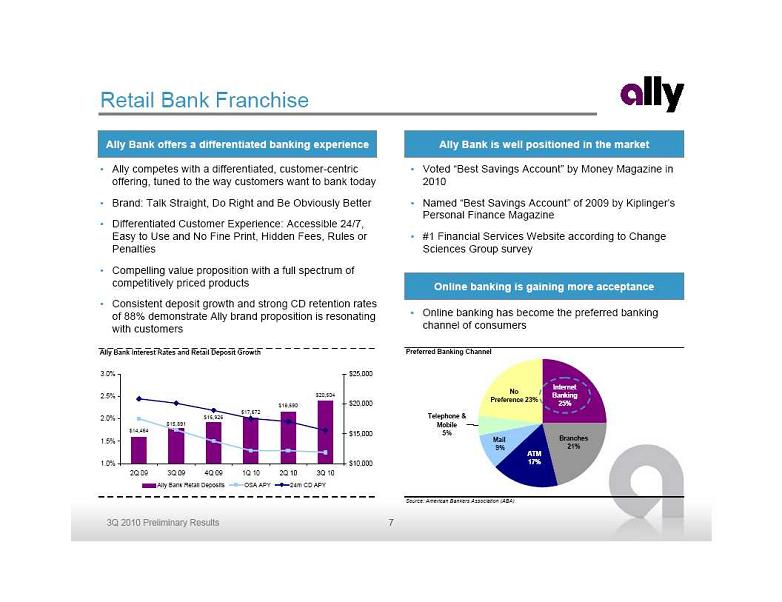 Retail Bank Franchise
Ally Bank offers a differentiated banking experience
Ally competes with a differentiated, customer-centric
Retail Bank Franchise
Ally Bank offers a differentiated banking experience
Ally competes with a differentiated, customer-centric
offering, tuned to the way customers want to bank today
Brand: Talk Straight, Do Right and Be Obviously Better
Differentiated Customer Experience: Accessible 24/7,
Easy to Use and No Fine Print, Hidden Fees, Rules or
Penalties
Compelling value proposition with a full spectrum of
competitively priced products
Consistent deposit growth and strong CD retention rates
of 88% demonstrate Ally brand proposition is resonating
with customers
Voted “Best Savings Account” by Money Magazine in
2010
Named “Best Savings Account” of 2009 by Kiplinger’s
Personal Finance Magazine
#1 Financial Services Website according to Change
Sciences Group survey
Ally Bank is well positioned in the market
Online banking has become the preferred banking
channel of consumers
Online banking is gaining more acceptance
Ally Bank Interest Rates and Retail Deposit Growth
$14,464
$17,672
$18,690
$20,504
$16,926
$15,891
1.0%
1.5%
2.0%
2.5%
3.0%
2Q 09
3Q 09
4Q 09
1Q 10
2Q 10
3Q 10
$10,000
$15,000
$20,000
$25,000
Ally Bank Retail Deposits
OSA APY
24m CD APY
Preferred Banking Channel
Source: American Bankers Association (ABA)
Telephone &
Mobile
5%
Mail
9%
ATM
17%
Branches
21%
No
Preference 23%
Internet
Banking
25%
7
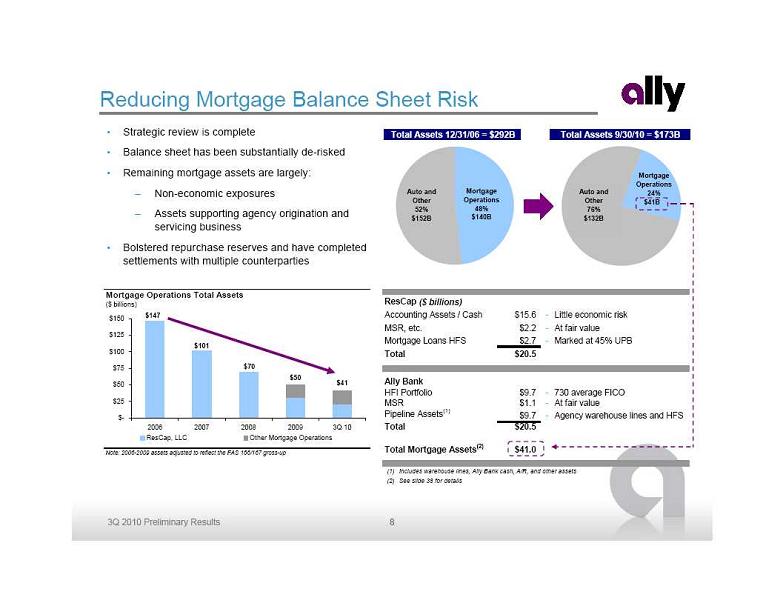 Reducing Mortgage Balance Sheet Risk
Strategic review is complete
Balance sheet has been substantially de-risked
Remaining mortgage assets are largely:
Non-economic exposures
Assets supporting agency origination and
Reducing Mortgage Balance Sheet Risk
Strategic review is complete
Balance sheet has been substantially de-risked
Remaining mortgage assets are largely:
Non-economic exposures
Assets supporting agency origination and
servicing business
Bolstered repurchase reserves and have completed
settlements with multiple counterparties
(1) Includes warehouse lines, Ally Bank cash, A/R, and other assets
(2) See slide 38 for details
Total Assets 12/31/06 = $292B
Total Assets 9/30/10 = $173B
Mortgage
Operations
48%
$140B
Auto and
Other
52%
$152B
Auto and
Other
76%
$132B
Mortgage
Operations
24%
$41B
ResCap
($ billions)
Accounting Assets / Cash
$15.6
-
Little economic risk
MSR, etc.
$2.2
-
At fair value
Mortgage Loans HFS
$2.7
-
Marked at 45% UPB
Total
$20.5
Ally Bank
HFI Portfolio
$9.7
-
730 average FICO
MSR
$1.1
-
At fair value
Pipeline Assets
(1)
$9.7
-
Agency warehouse lines and HFS
Total
$20.5
Total Mortgage Assets
(2)
$41.0
Mortgage Operations Total Assets
($ billions)
Note: 2006-2009 assets adjusted to reflect the FAS 166/167 gross-up
$101
$70
$50
$41
$-
$25
$50
$75
$100
$125
$150
2006
2007
2008
2009
3Q 10
ResCap, LLC
Other Mortgage Operations
#REF!
#REF!
#REF!
#REF!
#REF!
#REF!
#REF!
#REF!
#REF!
#REF!
#REF!
#REF!
#REF!
$147
8
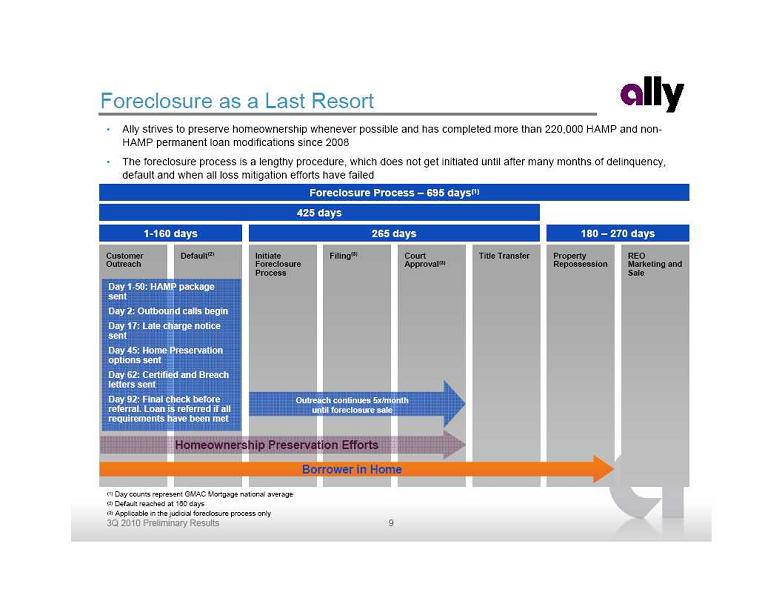 Default(2)
Initiate
Foreclosure
Process
Filing(3)
Court
Default(2)
Initiate
Foreclosure
Process
Filing(3)
Court
Approval(3)
Title Transfer
Property
Repossession
REO
Marketing and
Sale
Customer
Outreach
Borrower in Home
Homeownership Preservation Efforts
265 days
180 – 270 days
(1) Day counts represent GMAC Mortgage national average
(2) Default reached at 160 days
(3) Applicable in the judicial foreclosure process only
425 days
1-160 days
Foreclosure Process – 695 days(1)
Outreach continues 5x/month
until foreclosure sale
Day 1-50: HAMP package
sent
Day 2: Outbound calls begin
Day 17: Late charge notice
sent
Day 45: Home Preservation
options sent
Day 62: Certified and Breach
letters sent
Day 92: Final check before
referral. Loan is referred if all
requirements have been met
Foreclosure as a Last Resort
Ally strives to preserve homeownership whenever possible and has completed more than 220,000 HAMP and non-
HAMP permanent loan modifications since 2008
The foreclosure process is a lengthy procedure, which does not get initiated until after many months of delinquency,
default and when all loss mitigation efforts have failed
9
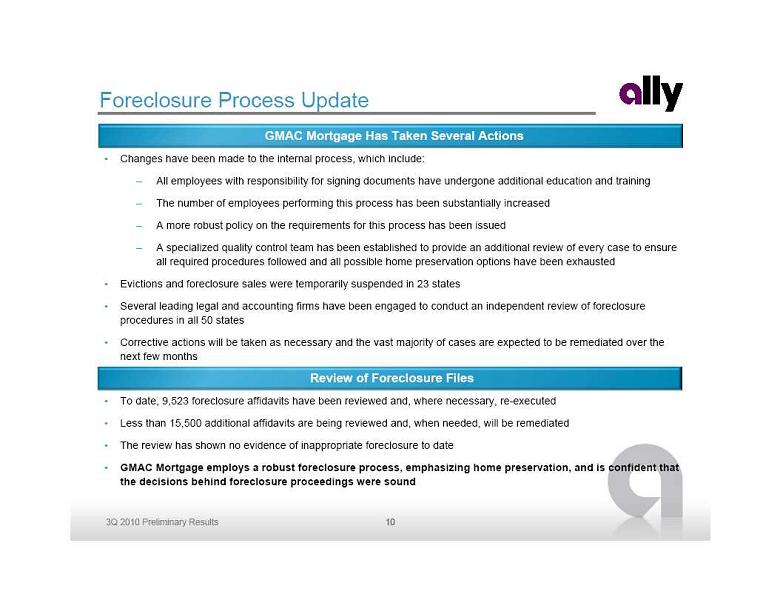 Foreclosure Process Update
Changes have been made to the internal process, which include:
All employees with responsibility for signing documents have undergone additional education and training
The number of employees performing this process has been substantially increased
A more robust policy on the requirements for this process has been issued
A specialized quality control team has been established to provide an additional review of every case to ensure
Foreclosure Process Update
Changes have been made to the internal process, which include:
All employees with responsibility for signing documents have undergone additional education and training
The number of employees performing this process has been substantially increased
A more robust policy on the requirements for this process has been issued
A specialized quality control team has been established to provide an additional review of every case to ensure
all required procedures followed and all possible home preservation options have been exhausted
Evictions and foreclosure sales were temporarily suspended in 23 states
Several leading legal and accounting firms have been engaged to conduct an independent review of foreclosure
procedures in all 50 states
Corrective actions will be taken as necessary and the vast majority of cases are expected to be remediated over the
next few months
To date, 9,523 foreclosure affidavits have been reviewed and, where necessary, re-executed
Less than 15,500 additional affidavits are being reviewed and, when needed, will be remediated
The review has shown no evidence of inappropriate foreclosure to date
GMAC Mortgage employs a robust foreclosure process, emphasizing home preservation, and is confident that
the decisions behind foreclosure proceedings were sound
GMAC Mortgage Has Taken Several Actions
Review of Foreclosure Files
10
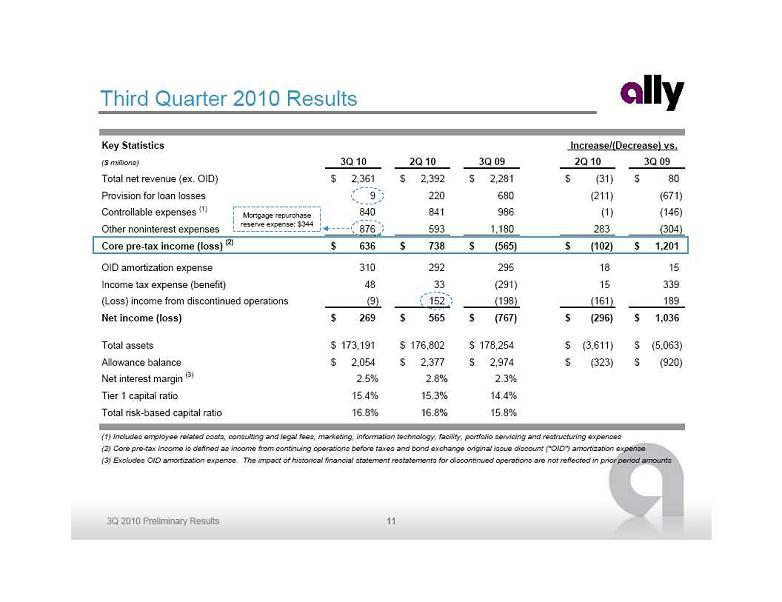 Third Quarter 2010 Results
Mortgage repurchase
Third Quarter 2010 Results
Mortgage repurchase
reserve expense: $344
Key Statistics
($ millions)
3Q 10
2Q 10
3Q 09
2Q 10
3Q 09
Total net revenue (ex. OID)
2,361
$
2,392
$
2,281
$
(31)
$
80
$
Provision for loan losses
9
220
680
(211)
(671)
Controllable expenses
(1)
840
841
986
(1)
(146)
Other noninterest expenses
876
593
1,180
283
(304)
Core pre-tax income (loss)
(2)
636
$
738
$
(565)
$
(102)
$
1,201
$
OID amortization expense
310
292
295
18
15
Income tax expense (benefit)
48
33
(291)
15
339
(Loss) income from discontinued operations
(9)
152
(198)
(161)
189
Net income (loss)
269
$
565
$
(767)
$
(296)
$
1,036
$
Total assets
173,191
$
176,802
$
178,254
$
(3,611)
$
(5,063)
$
Allowance balance
2,054
$
2,377
$
2,974
$
(323)
$
(920)
$
Net interest margin
(3)
2.5%
2.8%
2.3%
Tier 1 capital ratio
15.4%
15.3%
14.4%
Total risk-based capital ratio
16.8%
16.8%
15.8%
(1) Includes employee related costs, consulting and legal fees, marketing, information technology, facility, portfolio servicing and restructuring expenses
(2) Core pre-tax income is defined as income from continuing operations before taxes and bond exchange original issue discount ("OID") amortization expense
(3) Excludes OID amortization expense. The impact of historical financial statement restatements for discontinued operations are not reflected in prior period amounts
Increase/(Decrease) vs.
11
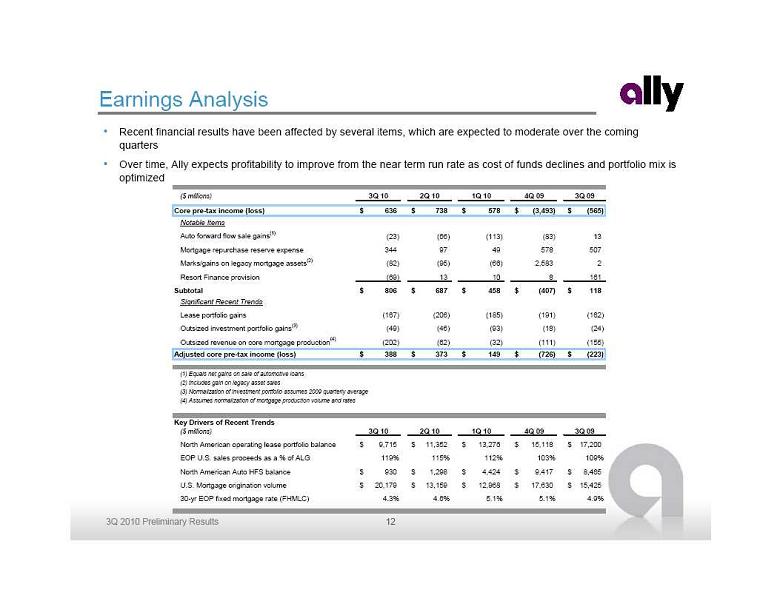 Earnings Analysis
Recent financial results have been affected by several items, which are expected to moderate over the coming
Earnings Analysis
Recent financial results have been affected by several items, which are expected to moderate over the coming
quarters
Over time, Ally expects profitability to improve from the near term run rate as cost of funds declines and portfolio mix is
optimized
($ millions)
3Q 10
2Q 10
1Q 10
4Q 09
3Q 09
Core pre-tax income (loss)
636
$
738
$
578
$
(3,493)
$
(565)
$
Notable Items
Auto forward flow sale gains
(1)
(23)
(66)
(113)
(83)
13
Mortgage repurchase reserve expense
344
97
49
578
507
Marks/gains on legacy mortgage assets
(2)
(82)
(95)
(66)
2,583
2
Resort Finance provision
(69)
13
10
8
161
Subtotal
806
$
687
$
458
$
(407)
$
118
$
Significant Recent Trends
Lease portfolio gains
(167)
(206)
(185)
(191)
(162)
Outsized investment portfolio gains
(3)
(49)
(46)
(93)
(18)
(24)
Outsized revenue on core mortgage production
(4)
(202)
(62)
(32)
(111)
(155)
Adjusted core pre-tax income (loss)
388
$
373
$
149
$
(726)
$
(223)
$
(1) Equals net gains on sale of automotive loans
(2) Includes gain on legacy asset sales
(3) Normalization of investment portfolio assumes 2009 quarterly average
(4) Assumes normalization of mortgage production volume and rates
Key Drivers of Recent Trends
($ millions)
3Q 10
2Q 10
1Q 10
4Q 09
3Q 09
North American operating lease portfolio balance
9,715
$
11,352
$
13,276
$
15,118
$
17,200
$
EOP U.S. sales proceeds as a % of ALG
119%
115%
112%
103%
109%
North American Auto HFS balance
930
$
1,298
$
4,424
$
9,417
$
8,465
$
U.S. Mortgage origination volume
20,179
$
13,159
$
12,968
$
17,630
$
15,425
$
30-yr EOP fixed mortgage rate (FHMLC)
4.3%
4.6%
5.1%
5.1%
4.9%
12
 Balance Sheet Repositioning
Repositioning of the auto balance sheet is impacting
Balance Sheet Repositioning
Repositioning of the auto balance sheet is impacting
financial results:
Higher quality, lower yielding originations,
particularly in 2009
Lease portfolio runoff with all time high used car
values is resulting in meaningful gains to book
value
More assets held for investment
While asset quality has improved significantly, this has
resulted in a lower yielding portfolio composition
Over time, a more balanced asset mix is expected
Global Auto Delinquencies - Managed Retail Contract Amount
$ Amount of Accruing Contracts Greater than 30 Days Past Due (millions)
3.27%
3.46%
3.48%
2.87%
2.93%
2.26%
$0
$500
$1,000
$1,500
$2,000
$2,500
2Q 09
3Q 09
4Q 09
1Q 10
2Q 10
3Q 10
0.00%
0.50%
1.00%
1.50%
2.00%
2.50%
3.00%
3.50%
Delinquent Contract $
% of Retail Contract $ Outstanding
U.S. Auto Originations by Type
0%
20%
40%
60%
80%
100%
2006
2007
2008
2009
3Q10
Loan
Lease
U.S. Retail Auto Originations by Credit Tier
Note: Excludes Nuvell and contracts with no credit score
0%
20%
40%
60%
80%
100%
2006
2007
2008
2009
3Q10
Superprime
Prime
Nearprime
Non/Subprime
13
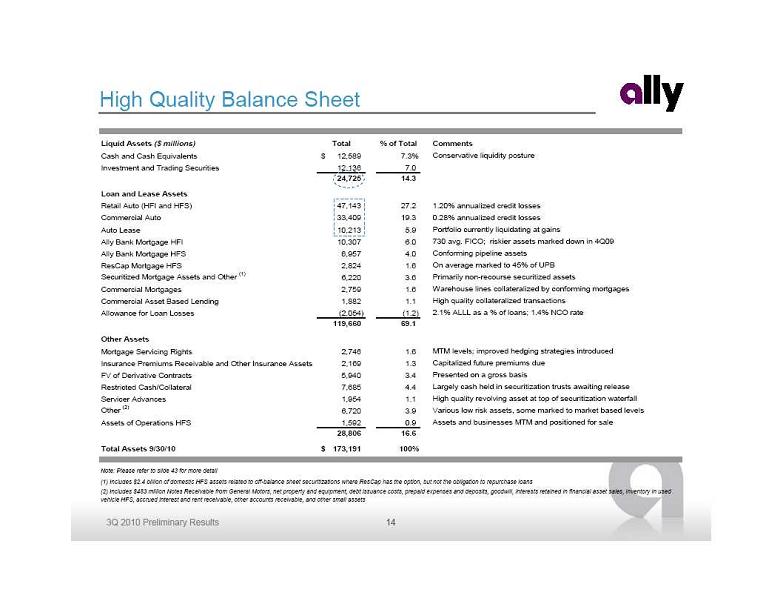 High Quality Balance Sheet
Liquid Assets
($ millions)
Total
% of Total
Comments
Cash and Cash Equivalents
12,589
$
7.3%
Conservative liquidity posture
Investment and Trading Securities
12,136
7.0
24,725
14.3
Loan and Lease Assets
Retail Auto (HFI and HFS)
47,143
27.2
1.20% annualized credit losses
Commercial Auto
33,409
19.3
0.28% annualized credit losses
Auto Lease
10,213
5.9
Portfolio currently liquidating at gains
Ally Bank Mortgage HFI
10,307
6.0
730 avg. FICO; riskier assets marked down in 4Q09
Ally Bank Mortgage HFS
6,957
4.0
Conforming pipeline assets
ResCap Mortgage HFS
2,824
1.6
On average marked to 45% of UPB
Securitized Mortgage Assets and Other
(1)
6,220
3.6
Primarily non-recourse securitized assets
Commercial Mortgages
2,759
1.6
Warehouse lines collateralized by conforming mortgages
Commercial Asset Based Lending
1,882
1.1
High quality collateralized transactions
Allowance for Loan Losses
(2,054)
(1.2)
2.1% ALLL as a % of loans; 1.4% NCO rate
119,660
69.1
Other Assets
Mortgage Servicing Rights
2,746
1.6
MTM levels; improved hedging strategies introduced
Insurance Premiums Receivable and Other Insurance Assets
2,169
1.3
Capitalized future premiums due
FV of Derivative Contracts
5,940
3.4
Presented on a gross basis
Restricted Cash/Collateral
7,685
4.4
Largely cash held in securitization trusts awaiting release
Servicer Advances
1,954
1.1
High quality revolving asset at top of securitization waterfall
Other
(2)
6,720
3.9
Various low risk assets, some marked to market based levels
Assets of Operations HFS
1,592
0.9
Assets and businesses MTM and positioned for sale
28,806
16.6
Total Assets 9/30/10
173,191
$
100%
(1) Includes $2.4 billion of domestic HFS assets related to off-balance sheet securitizations where ResCap has the option, but not the obligation to repurchase loans
(2) Includes $483 million Notes Receivable from General Motors, net property and equipment, debt issuance costs, prepaid expenses and deposits, goodwill, interests retained in financial asset sales, inventory
in used
vehicle HFS, accrued interest and rent receivable, other accounts receivable, and other small assets
Note: Please refer to slide 43 for more detail
14
High Quality Balance Sheet
Liquid Assets
($ millions)
Total
% of Total
Comments
Cash and Cash Equivalents
12,589
$
7.3%
Conservative liquidity posture
Investment and Trading Securities
12,136
7.0
24,725
14.3
Loan and Lease Assets
Retail Auto (HFI and HFS)
47,143
27.2
1.20% annualized credit losses
Commercial Auto
33,409
19.3
0.28% annualized credit losses
Auto Lease
10,213
5.9
Portfolio currently liquidating at gains
Ally Bank Mortgage HFI
10,307
6.0
730 avg. FICO; riskier assets marked down in 4Q09
Ally Bank Mortgage HFS
6,957
4.0
Conforming pipeline assets
ResCap Mortgage HFS
2,824
1.6
On average marked to 45% of UPB
Securitized Mortgage Assets and Other
(1)
6,220
3.6
Primarily non-recourse securitized assets
Commercial Mortgages
2,759
1.6
Warehouse lines collateralized by conforming mortgages
Commercial Asset Based Lending
1,882
1.1
High quality collateralized transactions
Allowance for Loan Losses
(2,054)
(1.2)
2.1% ALLL as a % of loans; 1.4% NCO rate
119,660
69.1
Other Assets
Mortgage Servicing Rights
2,746
1.6
MTM levels; improved hedging strategies introduced
Insurance Premiums Receivable and Other Insurance Assets
2,169
1.3
Capitalized future premiums due
FV of Derivative Contracts
5,940
3.4
Presented on a gross basis
Restricted Cash/Collateral
7,685
4.4
Largely cash held in securitization trusts awaiting release
Servicer Advances
1,954
1.1
High quality revolving asset at top of securitization waterfall
Other
(2)
6,720
3.9
Various low risk assets, some marked to market based levels
Assets of Operations HFS
1,592
0.9
Assets and businesses MTM and positioned for sale
28,806
16.6
Total Assets 9/30/10
173,191
$
100%
(1) Includes $2.4 billion of domestic HFS assets related to off-balance sheet securitizations where ResCap has the option, but not the obligation to repurchase loans
(2) Includes $483 million Notes Receivable from General Motors, net property and equipment, debt issuance costs, prepaid expenses and deposits, goodwill, interests retained in financial asset sales, inventory
in used
vehicle HFS, accrued interest and rent receivable, other accounts receivable, and other small assets
Note: Please refer to slide 43 for more detail
14
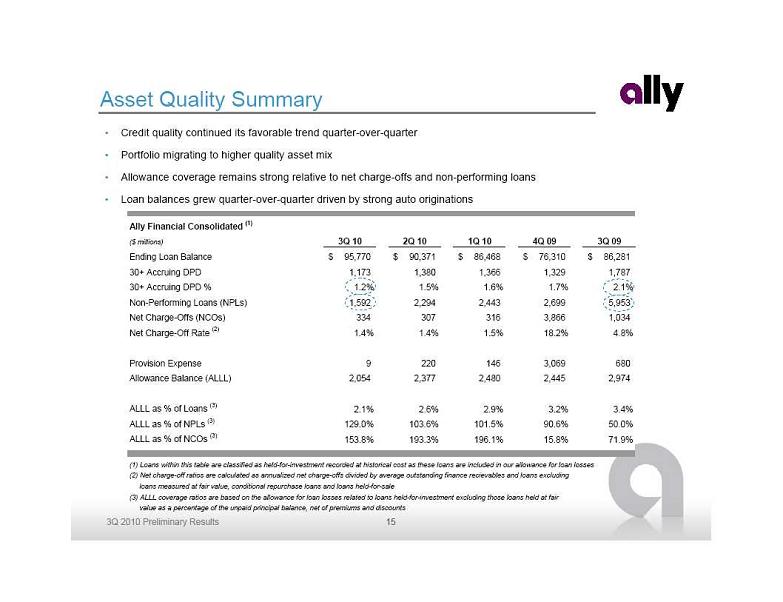 Asset Quality Summary
Credit quality continued its favorable trend quarter-over-quarter
Portfolio migrating to higher quality asset mix
Allowance coverage remains strong relative to net charge-offs and non-performing loans
Loan balances grew quarter-over-quarter driven by strong auto originations
Ally Financial Consolidated
(1)
($ millions)
3Q 10
2Q 10
1Q 10
4Q 09
3Q 09
Ending Loan Balance
95,770
$
90,371
$
86,468
$
76,310
$
86,281
$
30+ Accruing DPD
1,173
1,380
1,366
1,329
1,787
30+ Accruing DPD %
1.2%
1.5%
1.6%
1.7%
2.1%
Non-Performing Loans (NPLs)
1,592
2,294
2,443
2,699
5,953
Net Charge-Offs (NCOs)
334
307
316
3,866
1,034
Net Charge-Off Rate
(2)
1.4%
1.4%
1.5%
18.2%
4.8%
Provision Expense
9
220
146
3,069
680
Allowance Balance (ALLL)
2,054
2,377
2,480
2,445
2,974
ALLL as % of Loans
(3)
2.1%
2.6%
2.9%
3.2%
3.4%
ALLL as % of NPLs
(3)
129.0%
103.6%
101.5%
90.6%
50.0%
ALLL as % of NCOs
(3)
153.8%
193.3%
196.1%
15.8%
71.9%
(1) Loans within this table are classified as held-for-investment recorded at historical cost as these loans are included in our allowance for loan losses
(2) Net charge-off ratios are calculated as annualized net charge-offs divided by average outstanding finance recievables and loans excluding
loans measured at fair value, conditional repurchase loans and loans held-for-sale
(3) ALLL coverage ratios are based on the allowance for loan losses related to loans held-for-investment excluding those loans held at fair
value as a percentage of the unpaid principal balance, net of premiums and discounts
15
Asset Quality Summary
Credit quality continued its favorable trend quarter-over-quarter
Portfolio migrating to higher quality asset mix
Allowance coverage remains strong relative to net charge-offs and non-performing loans
Loan balances grew quarter-over-quarter driven by strong auto originations
Ally Financial Consolidated
(1)
($ millions)
3Q 10
2Q 10
1Q 10
4Q 09
3Q 09
Ending Loan Balance
95,770
$
90,371
$
86,468
$
76,310
$
86,281
$
30+ Accruing DPD
1,173
1,380
1,366
1,329
1,787
30+ Accruing DPD %
1.2%
1.5%
1.6%
1.7%
2.1%
Non-Performing Loans (NPLs)
1,592
2,294
2,443
2,699
5,953
Net Charge-Offs (NCOs)
334
307
316
3,866
1,034
Net Charge-Off Rate
(2)
1.4%
1.4%
1.5%
18.2%
4.8%
Provision Expense
9
220
146
3,069
680
Allowance Balance (ALLL)
2,054
2,377
2,480
2,445
2,974
ALLL as % of Loans
(3)
2.1%
2.6%
2.9%
3.2%
3.4%
ALLL as % of NPLs
(3)
129.0%
103.6%
101.5%
90.6%
50.0%
ALLL as % of NCOs
(3)
153.8%
193.3%
196.1%
15.8%
71.9%
(1) Loans within this table are classified as held-for-investment recorded at historical cost as these loans are included in our allowance for loan losses
(2) Net charge-off ratios are calculated as annualized net charge-offs divided by average outstanding finance recievables and loans excluding
loans measured at fair value, conditional repurchase loans and loans held-for-sale
(3) ALLL coverage ratios are based on the allowance for loan losses related to loans held-for-investment excluding those loans held at fair
value as a percentage of the unpaid principal balance, net of premiums and discounts
15
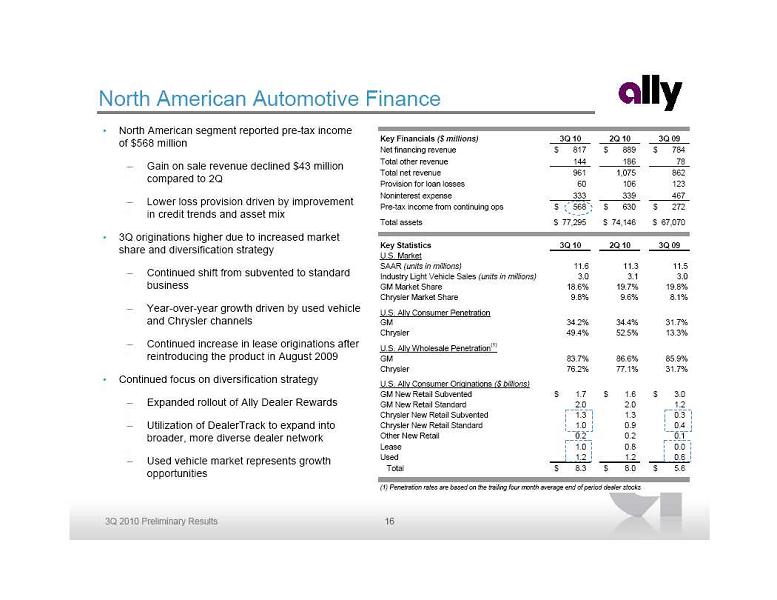 North American segment reported pre-tax income
of $568 million
Gain on sale revenue declined $43 million
compared to 2Q
Lower loss provision driven by improvement
in credit trends and asset mix
3Q originations higher due to increased market
share and diversification strategy
Continued shift from subvented to standard
business
Year-over-year growth driven by used vehicle
and Chrysler channels
Continued increase in lease originations after
reintroducing the product in August 2009
Continued focus on diversification strategy
Expanded rollout of Ally Dealer Rewards
Utilization of DealerTrack to expand into
broader, more diverse dealer network
Used vehicle market represents growth
opportunities
North American Automotive Finance
Key Financials
($ millions)
3Q 10
2Q 10
3Q 09
Net financing revenue
817
$
889
$
784
$
Total other revenue
144
186
78
Total net revenue
961
1,075
862
Provision for loan losses
60
106
123
Noninterest expense
333
339
467
Pre-tax income from continuing ops
568
$
630
$
272
$
Total assets
77,295
$
74,146
$
67,070
$
Key Statistics
3Q 10
2Q 10
3Q 09
U.S. Market
SAAR
(units in millions)
11.6
11.3
11.5
Industry Light Vehicle Sales
(units in millions)
3.0
3.1
3.0
GM Market Share
18.6%
19.7%
19.8%
Chrysler Market Share
9.8%
9.6%
8.1%
U.S. Ally Consumer Penetration
GM
34.2%
34.4%
31.7%
Chrysler
49.4%
52.5%
13.3%
U.S. Ally Wholesale Penetration
(1)
GM
83.7%
86.6%
85.9%
Chrysler
76.2%
77.1%
31.7%
U.S. Ally Consumer Originations
($ billions)
GM New Retail Subvented
1.7
$
1.6
$
3.0
$
GM New Retail Standard
2.0
2.0
1.2
Chrysler New Retail Subvented
1.3
1.3
0.3
Chrysler New Retail Standard
1.0
0.9
0.4
Other New Retail
0.2
0.2
0.1
Lease
1.0
0.8
0.0
Used
1.2
1.2
0.6
Total
8.3
$
8.0
$
5.6
$
(1) Penetration rates are based on the trailing four month average end of period dealer stocks
16
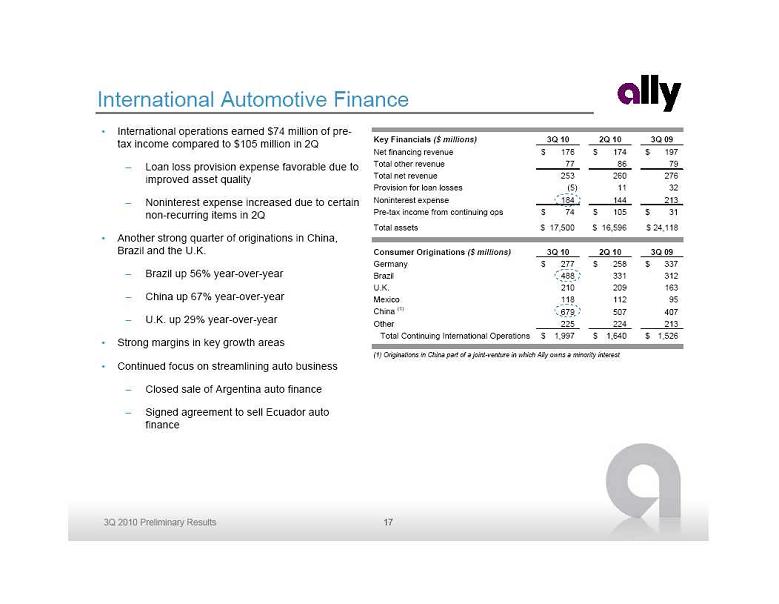 International operations earned $74 million of pre-
tax income compared to $105 million in 2Q
Loan loss provision expense favorable due to
improved asset quality
Noninterest expense increased due to certain
non-recurring items in 2Q
Another strong quarter of originations in China,
Brazil and the U.K.
Brazil up 56% year-over-year
China up 67% year-over-year
U.K. up 29% year-over-year
Strong margins in key growth areas
Continued focus on streamlining auto business
Closed sale of Argentina auto finance
Signed agreement to sell Ecuador auto
finance
International Automotive Finance
Key Financials
($ millions)
3Q 10
2Q 10
3Q 09
Net financing revenue
176
$
174
$
197
$
Total other revenue
77
86
79
Total net revenue
253
260
276
Provision for loan losses
(5)
11
32
Noninterest expense
184
144
213
Pre-tax income from continuing ops
74
$
105
$
31
$
Total assets
17,500
$
16,596
$
24,118
$
Consumer Originations
($ millions)
3Q 10
2Q 10
3Q 09
Germany
277
$
258
$
337
$
Brazil
488
331
312
U.K.
210
209
163
Mexico
118
112
95
China
(1)
679
507
407
Other
225
224
213
Total Continuing International Operations
1,997
$
1,640
$
1,526
$
(1) Originations in China part of a joint-venture in which Ally owns a minority interest
17
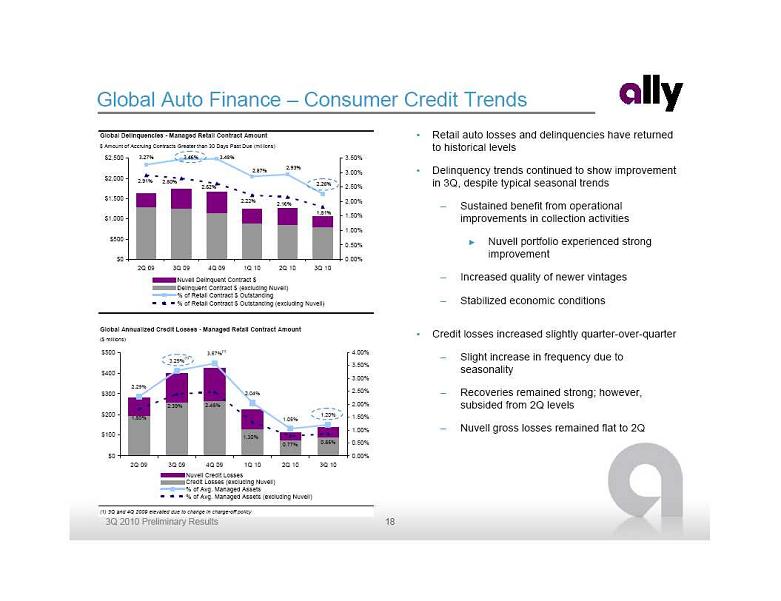 Global Auto Finance – Consumer Credit Trends
Retail auto losses and delinquencies have returned
Global Auto Finance – Consumer Credit Trends
Retail auto losses and delinquencies have returned
to historical levels
Delinquency trends continued to show improvement
in 3Q, despite typical seasonal trends
Sustained benefit from operational
improvements in collection activities
Nuvell portfolio experienced strong
improvement
Increased quality of newer vintages
Stabilized economic conditions
Credit losses increased slightly quarter-over-quarter
Slight increase in frequency due to
seasonality
Recoveries remained strong; however,
subsided from 2Q levels
Nuvell gross losses remained flat to 2Q
Global Delinquencies - Managed
Retail Contract Amount
$ Amount of Accruing Contracts Greater than 30 Days Past Due (millions)
2.91%
2.80%
2.62%
2.22%
2.16%
1.81%
2.26%
2.93%
2.87%
3.48%
3.46%
3.27%
$0
$500
$1,000
$1,500
$2,000
$2,500
2Q 09
3Q 09
4Q 09
1Q 10
2Q 10
3Q 10
0.00%
0.50%
1.00%
1.50%
2.00%
2.50%
3.00%
3.50%
Nuvell Delinquent Contract $
Delinquent Contract $ (excluding Nuvell)
% of Retail Contract $ Outstanding
% of Retail Contract $ Outstanding (excluding Nuvell)
Global Annualized Credit Losses - Managed Retail Contract Amount
($ millions)
(1) 3Q and 4Q 2009 elevated due to change in charge-off policy
2.29%
3.29%
3.57%
2.04%
1.05%
1.20%
0.85%
0.77%
1.30%
2.48%
2.39%
1.80%
$0
$100
$200
$300
$400
$500
2Q 09
3Q 09
4Q 09
1Q 10
2Q 10
3Q 10
0.00%
0.50%
1.00%
1.50%
2.00%
2.50%
3.00%
3.50%
4.00%
Nuvell Credit Losses
Credit Losses (excluding Nuvell)
% of Avg. Managed Assets
% of Avg. Managed Assets (excluding Nuvell)
(1)
(1)
18
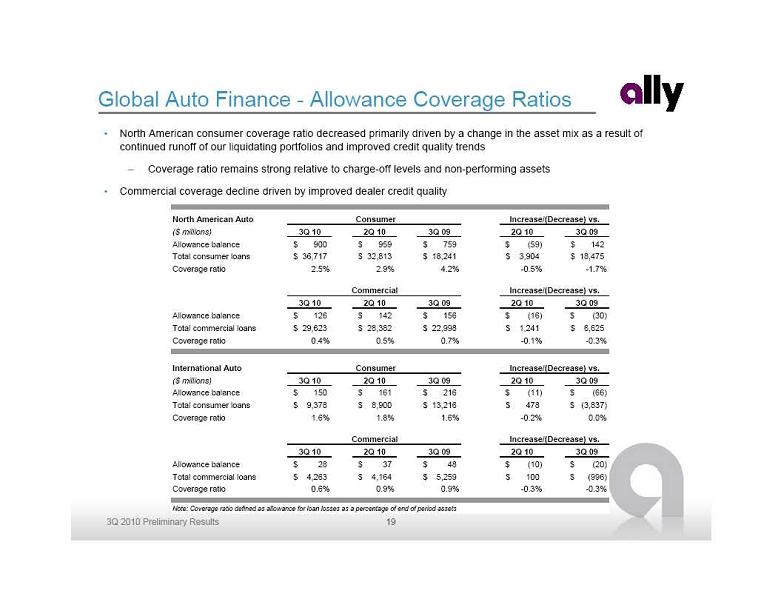 Global Auto Finance - Allowance Coverage Ratios
North American consumer coverage ratio decreased primarily driven by a change in the asset mix as a result of
Global Auto Finance - Allowance Coverage Ratios
North American consumer coverage ratio decreased primarily driven by a change in the asset mix as a result of
continued runoff of our liquidating portfolios and improved credit quality trends
Coverage ratio remains strong relative to charge-off levels and non-performing assets
Commercial coverage decline driven by improved dealer credit quality
North American Auto
Consumer
($ millions)
3Q 10
2Q 10
3Q 09
2Q 10
3Q 09
Allowance balance
900
$
959
$
759
$
(59)
$
142
$
Total consumer loans
36,717
$
32,813
$
18,241
$
3,904
$
18,475
$
Coverage ratio
2.5%
2.9%
4.2%
-0.5%
-1.7%
Commercial
3Q 10
2Q 10
3Q 09
2Q 10
3Q 09
Allowance balance
126
$
142
$
156
$
(16)
$
(30)
$
Total commercial loans
29,623
$
28,382
$
22,998
$
1,241
$
6,625
$
Coverage ratio
0.4%
0.5%
0.7%
-0.1%
-0.3%
International Auto
Consumer
($ millions)
3Q 10
2Q 10
3Q 09
2Q 10
3Q 09
Allowance balance
150
$
161
$
216
$
(11)
$
(66)
$
Total consumer loans
9,378
$
8,900
$
13,216
$
478
$
(3,837)
$
Coverage ratio
1.6%
1.8%
1.6%
-0.2%
0.0%
Commercial
3Q 10
2Q 10
3Q 09
2Q 10
3Q 09
Allowance balance
28
$
37
$
48
$
(10)
$
(20)
$
Total commercial loans
4,263
$
4,164
$
5,259
$
100
$
(996)
$
Coverage ratio
0.6%
0.9%
0.9%
-0.3%
-0.3%
Note: Coverage ratio defined as allowance for loan losses as a percentage of end of period assets
Increase/(Decrease) vs.
Increase/(Decrease) vs.
Increase/(Decrease) vs.
Increase/(Decrease) vs.
19
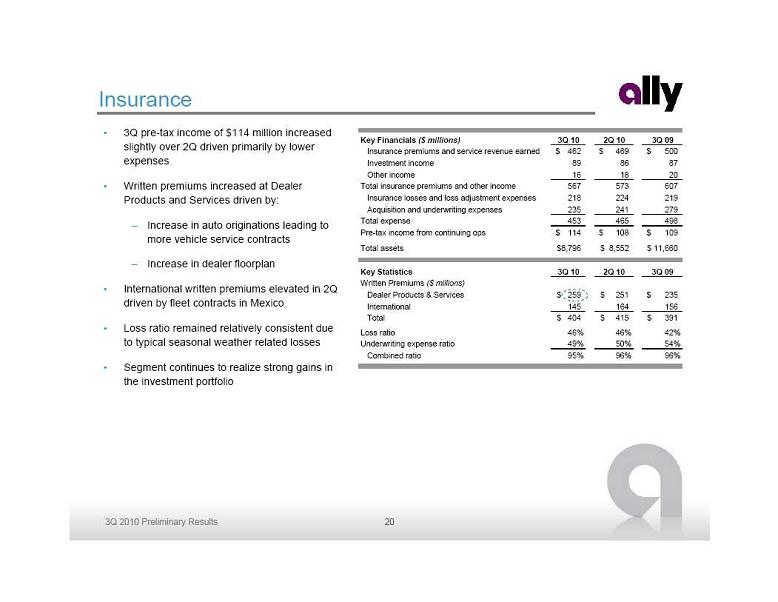 Insurance
3Q pre-tax income of $114 million increased
Insurance
3Q pre-tax income of $114 million increased
slightly over 2Q driven primarily by lower
expenses
Written premiums increased at Dealer
Products and Services driven by:
Increase in auto originations leading to
more vehicle service contracts
Increase in dealer floorplan
International written premiums elevated in 2Q
driven by fleet contracts in Mexico
Loss ratio remained relatively consistent due
to typical seasonal weather related losses
Segment continues to realize strong gains in
the investment portfolio
Key Financials
($ millions)
3Q 10
2Q 10
3Q 09
Insurance premiums and service revenue earned
462
$
469
$
500
$
Investment income
89
86
87
Other income
16
18
20
Total insurance premiums and other income
567
573
607
Insurance losses and loss adjustment expenses
218
224
219
Acquisition and underwriting expenses
235
241
279
Total expense
453
465
498
Pre-tax income from continuing ops
114
$
108
$
109
$
Total assets
8,796
$
8,552
$
11,660
$
Key Statistics
3Q 10
2Q 10
3Q 09
Written Premiums
($ millions)
Dealer Products & Services
259
$
251
$
235
$
International
145
164
156
Total
404
$
415
$
391
$
Loss ratio
46%
46%
42%
Underwriting expense ratio
49%
50%
54%
Combined ratio
95%
96%
96%
20
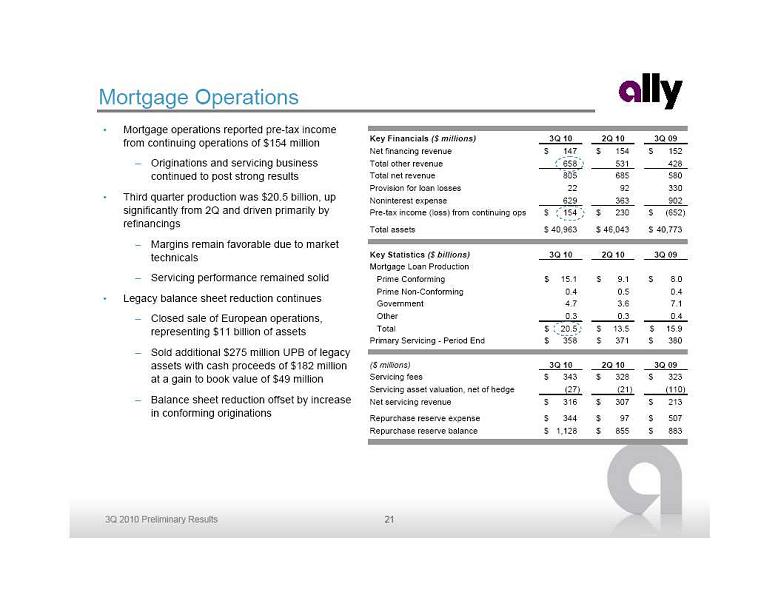 Mortgage Operations
Mortgage operations reported pre-tax income
Mortgage Operations
Mortgage operations reported pre-tax income
from continuing operations of $154 million
Originations and servicing business
continued to post strong results
Third quarter production was $20.5 billion, up
significantly from 2Q and driven primarily by
refinancings
Margins remain favorable due to market
technicals
Servicing performance remained solid
Legacy balance sheet reduction continues
Closed sale of European operations,
representing $11 billion of assets
Sold additional $275 million UPB of legacy
assets with cash proceeds of $182 million
at a gain to book value of $49 million
Balance sheet reduction offset by increase
in conforming originations
Key Financials
($ millions)
3Q 10
2Q 10
3Q 09
Net financing revenue
147
$
154
$
152
$
Total other revenue
658
531
428
Total net revenue
805
685
580
Provision for loan losses
22
92
330
Noninterest expense
629
363
902
Pre-tax income (loss) from continuing ops
154
$
230
$
(652)
$
Total assets
40,963
$
46,043
$
40,773
$
Key Statistics
($ billions)
3Q 10
2Q 10
3Q 09
Mortgage Loan Production
Prime Conforming
15.1
$
9.1
$
8.0
$
Prime Non-Conforming
0.4
0.5
0.4
Government
4.7
3.6
7.1
Other
0.3
0.3
0.4
Total
20.5
$
13.5
$
15.9
$
Primary Servicing - Period End
358
$
371
$
380
$
($ millions)
3Q 10
2Q 10
3Q 09
Servicing fees
343
$
328
$
323
$
Servicing asset valuation, net of hedge
(27)
(21)
(110)
Net servicing revenue
316
$
307
$
213
$
Repurchase reserve expense
344
$
97
$
507
$
Repurchase reserve balance
1,128
$
855
$
883
$
21
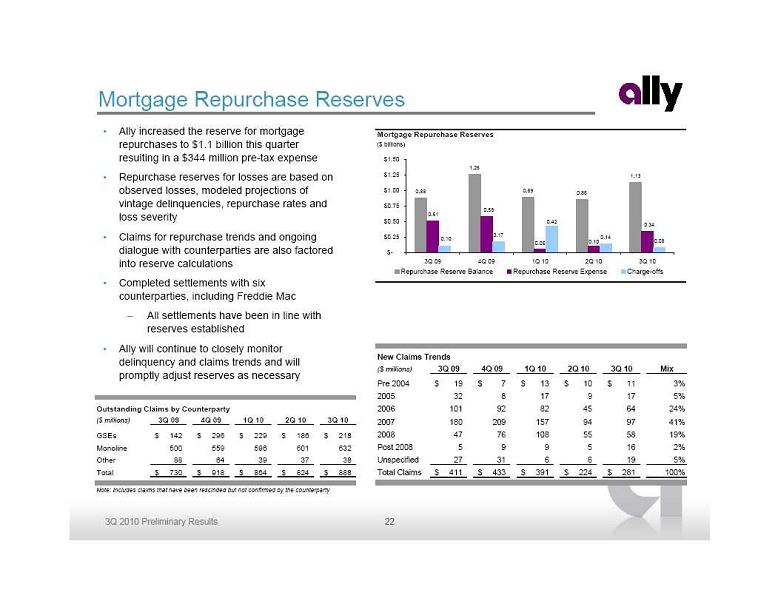 Mortgage Repurchase Reserves
Ally increased the reserve for mortgage
Mortgage Repurchase Reserves
Ally increased the reserve for mortgage
repurchases to $1.1 billion this quarter
resulting in a $344 million pre-tax expense
Repurchase reserves for losses are based on
observed losses, modeled projections of
vintage delinquencies, repurchase rates and
loss severity
Claims for repurchase trends and ongoing
dialogue with counterparties are also factored
into reserve calculations
Completed settlements with six
counterparties, including Freddie Mac
All settlements have been in line with
reserves established
Ally will continue to closely monitor
delinquency and claims trends and will
promptly adjust reserves as necessary
Mortgage Repurchase Reserves
($ billions)
0.88
1.26
0.89
0.86
1.13
0.05
0.17
0.14
0.08
0.34
0.10
0.58
0.51
0.42
0.10
$-
$0.25
$0.50
$0.75
$1.00
$1.25
$1.50
3Q 09
4Q 09
1Q 10
2Q 10
3Q 10
Repurchase Reserve Balance
Repurchase Reserve Expense
Charge-offs
New Claims Trends
($ millions)
3Q 09
4Q 09
1Q 10
2Q 10
3Q 10
Mix
Pre 2004
19
$
7
$
13
$
10
$
11
$
3%
2005
32
8
17
9
17
5%
2006
101
92
82
45
64
24%
2007
180
209
157
94
97
41%
2008
47
76
108
55
58
19%
Post 2008
5
9
9
5
16
2%
Unspecified
27
31
6
6
19
5%
Total Claims
411
$
433
$
391
$
224
$
281
$
100%
Outstanding Claims by Counterparty
($ millions)
3Q 09
4Q 09
1Q 10
2Q 10
3Q 10
GSEs
142
$
296
$
229
$
186
$
218
$
Monoline
500
559
596
601
632
Other
88
64
39
37
38
Total
730
$
918
$
864
$
824
$
888
$
Note: Includes claims that have been rescinded but not confirmed by the counterparty
22
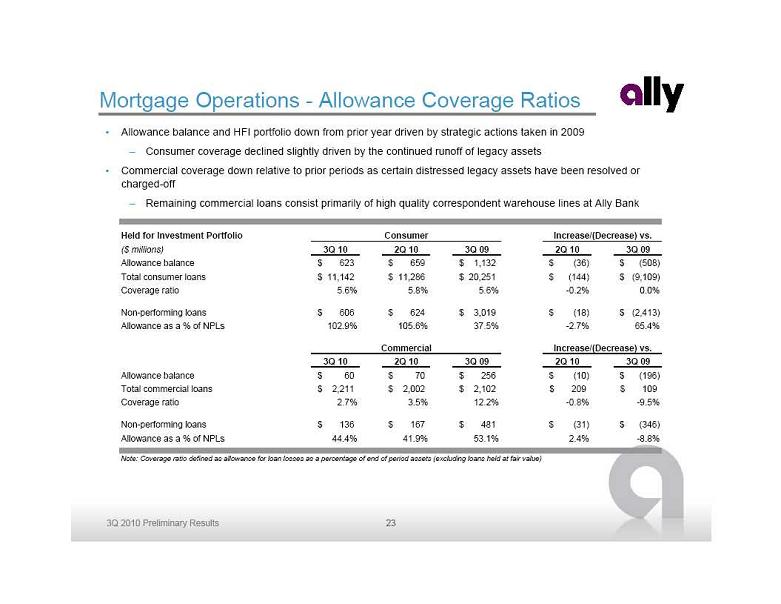 Mortgage Operations - Allowance Coverage Ratios
Allowance balance and HFI portfolio down from prior year driven by strategic actions taken in 2009
Consumer coverage declined slightly driven by the continued runoff of legacy assets
Commercial coverage down relative to prior periods as certain distressed legacy assets have been resolved or
Mortgage Operations - Allowance Coverage Ratios
Allowance balance and HFI portfolio down from prior year driven by strategic actions taken in 2009
Consumer coverage declined slightly driven by the continued runoff of legacy assets
Commercial coverage down relative to prior periods as certain distressed legacy assets have been resolved or
charged-off
Remaining commercial loans consist primarily of high quality correspondent warehouse lines at Ally Bank
Held for Investment Portfolio
Consumer
($ millions)
3Q 10
2Q 10
3Q 09
2Q 10
3Q 09
Allowance balance
623
$
659
$
1,132
$
(36)
$
(508)
$
Total consumer loans
11,142
$
11,286
$
20,251
$
(144)
$
(9,109)
$
Coverage ratio
5.6%
5.8%
5.6%
-0.2%
0.0%
Non-performing loans
606
$
624
$
3,019
$
(18)
$
(2,413)
$
Allowance as a % of NPLs
102.9%
105.6%
37.5%
-2.7%
65.4%
Commercial
3Q 10
2Q 10
3Q 09
2Q 10
3Q 09
Allowance balance
60
$
70
$
256
$
(10)
$
(196)
$
Total commercial loans
2,211
$
2,002
$
2,102
$
209
$
109
$
Coverage ratio
2.7%
3.5%
12.2%
-0.8%
-9.5%
Non-performing loans
136
$
167
$
481
$
(31)
$
(346)
$
Allowance as a % of NPLs
44.4%
41.9%
53.1%
2.4%
-8.8%
Note: Coverage ratio defined as allowance for loan losses as a percentage of end of period assets (excluding loans held at fair value)
Increase/(Decrease) vs.
Increase/(Decrease) vs.
23
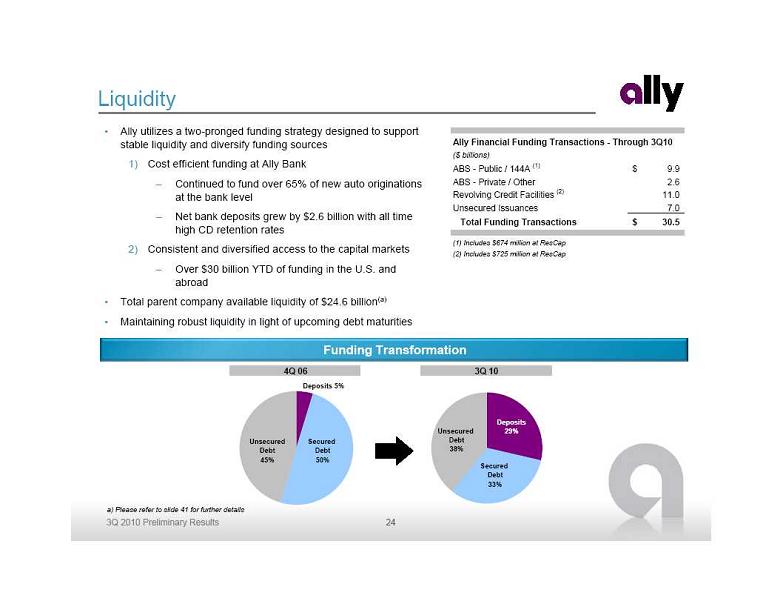 Liquidity
Ally utilizes a two-pronged funding strategy designed to support
Liquidity
Ally utilizes a two-pronged funding strategy designed to support
stable liquidity and diversify funding sources
1) Cost efficient funding at Ally Bank
Continued to fund over 65% of new auto originations
at the bank level
Net bank deposits grew by $2.6 billion with all time
high CD retention rates
2) Consistent and diversified access to the capital markets
Over $30 billion YTD of funding in the U.S. and
abroad
Total parent company available liquidity of $24.6 billion(a)
Maintaining robust liquidity in light of upcoming debt maturities
Funding Transformation
a) Please refer to slide 41 for further details
Ally Financial Funding Transactions - Through 3Q10
($ billions)
ABS - Public / 144A
(1)
9.9
$
ABS - Private / Other
2.6
Revolving Credit Facilities
(2)
11.0
Unsecured Issuances
7.0
Total Funding Transactions
30.5
$
(1) Includes $674 million at ResCap
(2) Includes $725 million at ResCap
4Q 06
3Q 10
Deposits 5%
Secured
Debt
50%
Unsecured
Debt
45%
Unsecured
Debt
38%
Secured
Debt
33%
Deposits
29%
24
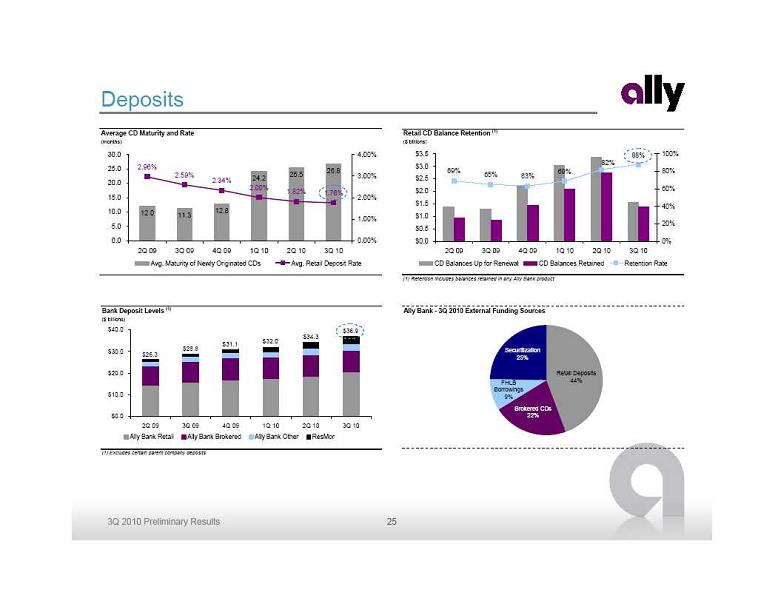 Deposits
Average CD Maturity and Rate
(months)
12.0
11.3
12.8
24.2
25.5
26.8
2.96%
2.59%
2.34%
2.00%
1.82%
1.76%
0.0
5.0
10.0
15.0
20.0
25.0
30.0
2Q 09
3Q 09
4Q 09
1Q 10
2Q 10
3Q 10
0.00%
1.00%
2.00%
3.00%
4.00%
Avg. Maturity of Newly Originated CDs
Avg. Retail Deposit Rate
Retail CD Balance Retention
(1)
($ billions)
(1) Retention includes balances retained in any Ally Bank product
69%
65%
63%
69%
88%
82%
$0.0
$0.5
$1.0
$1.5
$2.0
$2.5
$3.0
$3.5
2Q 09
3Q 09
4Q 09
1Q 10
2Q 10
3Q 10
0%
20%
40%
60%
80%
100%
CD Balances Up for Renewal
CD Balances Retained
Retention Rate
Bank Deposit Levels
(1)
($ billions)
(1) Excludes certain parent company deposits
$36.9
$34.3
$32.0
$31.1
$28.8
$26.3
$0.0
$10.0
$20.0
$30.0
$40.0
2Q 09
3Q 09
4Q 09
1Q 10
2Q 10
3Q 10
Ally Bank Retail
Ally Bank Brokered
Ally Bank Other
ResMor
Ally Bank - 3Q 2010 External Funding Sources
Securitization
25%
Brokered CDs
22%
Retail Deposits
44%
FHLB
Borrowings
9%
25
Deposits
Average CD Maturity and Rate
(months)
12.0
11.3
12.8
24.2
25.5
26.8
2.96%
2.59%
2.34%
2.00%
1.82%
1.76%
0.0
5.0
10.0
15.0
20.0
25.0
30.0
2Q 09
3Q 09
4Q 09
1Q 10
2Q 10
3Q 10
0.00%
1.00%
2.00%
3.00%
4.00%
Avg. Maturity of Newly Originated CDs
Avg. Retail Deposit Rate
Retail CD Balance Retention
(1)
($ billions)
(1) Retention includes balances retained in any Ally Bank product
69%
65%
63%
69%
88%
82%
$0.0
$0.5
$1.0
$1.5
$2.0
$2.5
$3.0
$3.5
2Q 09
3Q 09
4Q 09
1Q 10
2Q 10
3Q 10
0%
20%
40%
60%
80%
100%
CD Balances Up for Renewal
CD Balances Retained
Retention Rate
Bank Deposit Levels
(1)
($ billions)
(1) Excludes certain parent company deposits
$36.9
$34.3
$32.0
$31.1
$28.8
$26.3
$0.0
$10.0
$20.0
$30.0
$40.0
2Q 09
3Q 09
4Q 09
1Q 10
2Q 10
3Q 10
Ally Bank Retail
Ally Bank Brokered
Ally Bank Other
ResMor
Ally Bank - 3Q 2010 External Funding Sources
Securitization
25%
Brokered CDs
22%
Retail Deposits
44%
FHLB
Borrowings
9%
25
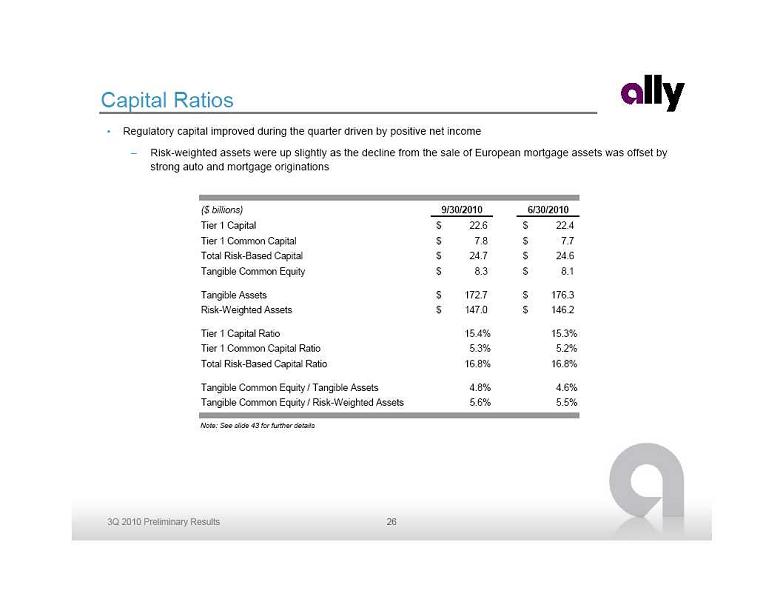 Capital Ratios
Note: See slide 43 for further details
Regulatory capital improved during the quarter driven by positive net income
Risk-weighted assets were up slightly as the decline from the sale of European mortgage assets was offset by
Capital Ratios
Note: See slide 43 for further details
Regulatory capital improved during the quarter driven by positive net income
Risk-weighted assets were up slightly as the decline from the sale of European mortgage assets was offset by
strong auto and mortgage originations
($ billions)
9/30/2010
6/30/2010
Tier 1 Capital
22.6
$
22.4
$
Tier 1 Common Capital
7.8
$
7.7
$
Total Risk-Based Capital
24.7
$
24.6
$
Tangible Common Equity
8.3
$
8.1
$
Tangible Assets
172.7
$
176.3
$
Risk-Weighted Assets
147.0
$
146.2
$
Tier 1 Capital Ratio
15.4%
15.3%
Tier 1 Common Capital Ratio
5.3%
5.2%
Total Risk-Based Capital Ratio
16.8%
16.8%
Tangible Common Equity / Tangible Assets
4.8%
4.6%
Tangible Common Equity / Risk-Weighted Assets
5.6%
5.5%
26
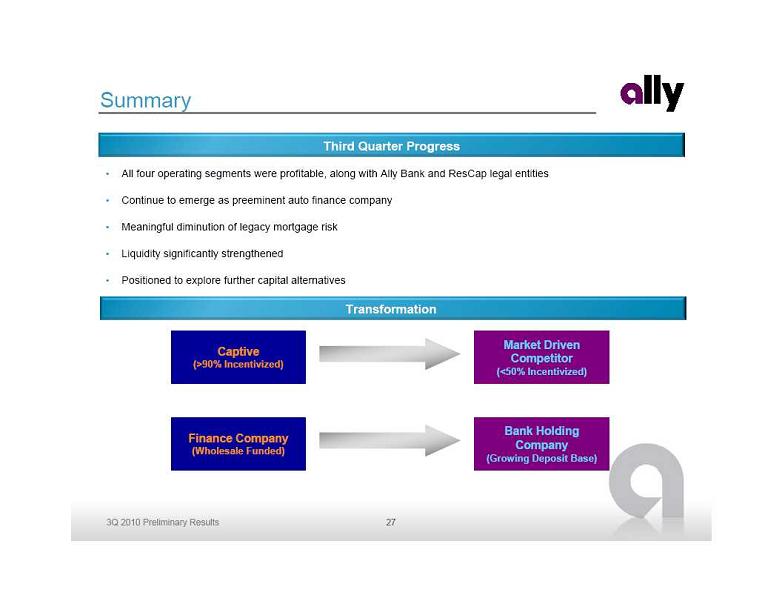 Summary
All four operating segments were profitable, along with Ally Bank and ResCap legal entities
Continue to emerge as preeminent auto finance company
Meaningful diminution of legacy mortgage risk
Liquidity significantly strengthened
Positioned to explore further capital alternatives
Third Quarter Progress
Captive
(>90% Incentivized)
Finance Company
(Wholesale Funded)
Market Driven
Summary
All four operating segments were profitable, along with Ally Bank and ResCap legal entities
Continue to emerge as preeminent auto finance company
Meaningful diminution of legacy mortgage risk
Liquidity significantly strengthened
Positioned to explore further capital alternatives
Third Quarter Progress
Captive
(>90% Incentivized)
Finance Company
(Wholesale Funded)
Market Driven
Competitor
(<50% Incentivized)
Bank Holding
Company
(Growing Deposit Base)
Transformation
27
 Supplemental Charts
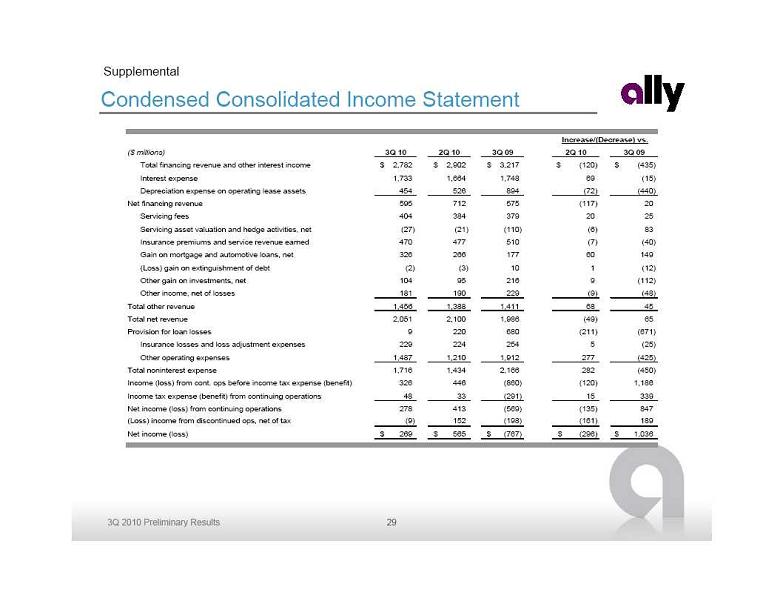 Condensed Consolidated Income Statement
Supplemental
($ millions)
3Q 10
2Q 10
3Q 09
2Q 10
3Q 09
Total financing revenue and other interest income
2,782
$
2,902
$
3,217
$
(120)
$
(435)
$
Interest expense
1,733
1,664
1,748
69
(15)
Depreciation expense on operating lease assets
454
526
894
(72)
(440)
Net financing revenue
595
712
575
(117)
20
Servicing fees
404
384
379
20
25
Servicing asset valuation and hedge activities, net
(27)
(21)
(110)
(6)
83
Insurance premiums and service revenue earned
470
477
510
(7)
(40)
Gain on mortgage and automotive loans, net
326
266
177
60
149
(Loss) gain on extinguishment of debt
(2)
(3)
10
1
(12)
Other gain on investments, net
104
95
216
9
(112)
Other income, net of losses
181
190
229
(9)
(48)
Total other revenue
1,456
1,388
1,411
68
45
Total net revenue
2,051
2,100
1,986
(49)
65
Provision for loan losses
9
220
680
(211)
(671)
Insurance losses and loss adjustment expenses
229
224
254
5
(25)
Other operating expenses
1,487
1,210
1,912
277
(425)
Total noninterest expense
1,716
1,434
2,166
282
(450)
Income (loss) from cont. ops before income tax expense (benefit)
326
446
(860)
(120)
1,186
Income tax expense (benefit) from continuing operations
48
33
(291)
15
339
Net income (loss) from continuing operations
278
413
(569)
(135)
847
(Loss) income from discontinued ops, net of tax
(9)
152
(198)
(161)
189
Net income (loss)
269
$
565
$
(767)
$
(296)
$
1,036
$
Increase/(Decrease) vs.
29
Condensed Consolidated Income Statement
Supplemental
($ millions)
3Q 10
2Q 10
3Q 09
2Q 10
3Q 09
Total financing revenue and other interest income
2,782
$
2,902
$
3,217
$
(120)
$
(435)
$
Interest expense
1,733
1,664
1,748
69
(15)
Depreciation expense on operating lease assets
454
526
894
(72)
(440)
Net financing revenue
595
712
575
(117)
20
Servicing fees
404
384
379
20
25
Servicing asset valuation and hedge activities, net
(27)
(21)
(110)
(6)
83
Insurance premiums and service revenue earned
470
477
510
(7)
(40)
Gain on mortgage and automotive loans, net
326
266
177
60
149
(Loss) gain on extinguishment of debt
(2)
(3)
10
1
(12)
Other gain on investments, net
104
95
216
9
(112)
Other income, net of losses
181
190
229
(9)
(48)
Total other revenue
1,456
1,388
1,411
68
45
Total net revenue
2,051
2,100
1,986
(49)
65
Provision for loan losses
9
220
680
(211)
(671)
Insurance losses and loss adjustment expenses
229
224
254
5
(25)
Other operating expenses
1,487
1,210
1,912
277
(425)
Total noninterest expense
1,716
1,434
2,166
282
(450)
Income (loss) from cont. ops before income tax expense (benefit)
326
446
(860)
(120)
1,186
Income tax expense (benefit) from continuing operations
48
33
(291)
15
339
Net income (loss) from continuing operations
278
413
(569)
(135)
847
(Loss) income from discontinued ops, net of tax
(9)
152
(198)
(161)
189
Net income (loss)
269
$
565
$
(767)
$
(296)
$
1,036
$
Increase/(Decrease) vs.
29
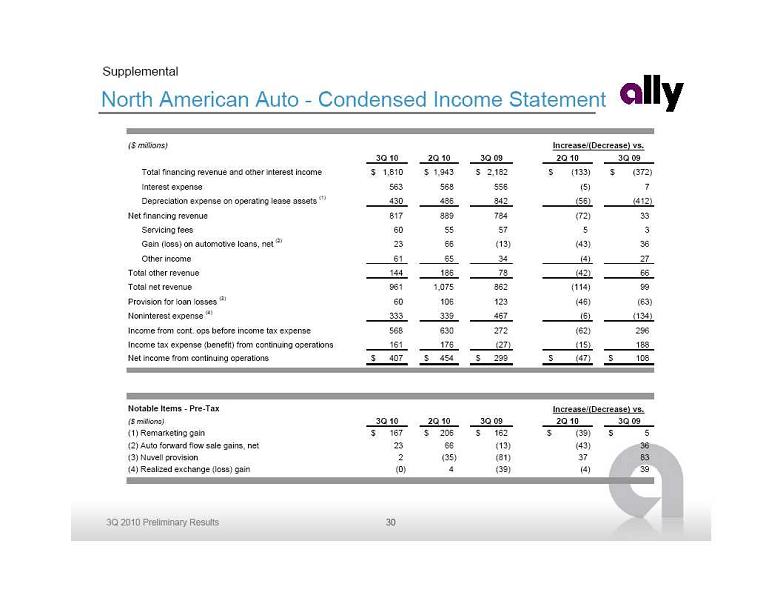 North American Auto - Condensed Income Statement
Supplemental
($ millions)
3Q 10
2Q 10
3Q 09
2Q 10
3Q 09
Total financing revenue and other interest income
1,810
$
1,943
$
2,182
$
(133)
$
(372)
$
Interest expense
563
568
556
(5)
7
Depreciation expense on operating lease assets
(1)
430
486
842
(56)
(412)
Net financing revenue
817
889
784
(72)
33
Servicing fees
60
55
57
5
3
Gain (loss) on automotive loans, net
(2)
23
66
(13)
(43)
36
Other income
61
65
34
(4)
27
Total other revenue
144
186
78
(42)
66
Total net revenue
961
1,075
862
(114)
99
Provision for loan losses
(3)
60
106
123
(46)
(63)
Noninterest expense
(4)
333
339
467
(6)
(134)
Income from cont. ops before income tax expense
568
630
272
(62)
296
Income tax expense (benefit) from continuing operations
161
176
(27)
(15)
188
Net income from continuing operations
407
$
454
$
299
$
(47)
$
108
$
Notable Items - Pre-Tax
($ millions)
3Q 10
2Q 10
3Q 09
2Q 10
3Q 09
(1) Remarketing gain
167
$
206
$
162
$
(39)
$
5
$
(2) Auto forward flow sale gains, net
23
66
(13)
(43)
36
(3) Nuvell provision
2
(35)
(81)
37
83
(4) Realized exchange (loss) gain
(0)
4
(39)
(4)
39
Increase/(Decrease) vs.
Increase/(Decrease) vs.
30
North American Auto - Condensed Income Statement
Supplemental
($ millions)
3Q 10
2Q 10
3Q 09
2Q 10
3Q 09
Total financing revenue and other interest income
1,810
$
1,943
$
2,182
$
(133)
$
(372)
$
Interest expense
563
568
556
(5)
7
Depreciation expense on operating lease assets
(1)
430
486
842
(56)
(412)
Net financing revenue
817
889
784
(72)
33
Servicing fees
60
55
57
5
3
Gain (loss) on automotive loans, net
(2)
23
66
(13)
(43)
36
Other income
61
65
34
(4)
27
Total other revenue
144
186
78
(42)
66
Total net revenue
961
1,075
862
(114)
99
Provision for loan losses
(3)
60
106
123
(46)
(63)
Noninterest expense
(4)
333
339
467
(6)
(134)
Income from cont. ops before income tax expense
568
630
272
(62)
296
Income tax expense (benefit) from continuing operations
161
176
(27)
(15)
188
Net income from continuing operations
407
$
454
$
299
$
(47)
$
108
$
Notable Items - Pre-Tax
($ millions)
3Q 10
2Q 10
3Q 09
2Q 10
3Q 09
(1) Remarketing gain
167
$
206
$
162
$
(39)
$
5
$
(2) Auto forward flow sale gains, net
23
66
(13)
(43)
36
(3) Nuvell provision
2
(35)
(81)
37
83
(4) Realized exchange (loss) gain
(0)
4
(39)
(4)
39
Increase/(Decrease) vs.
Increase/(Decrease) vs.
30
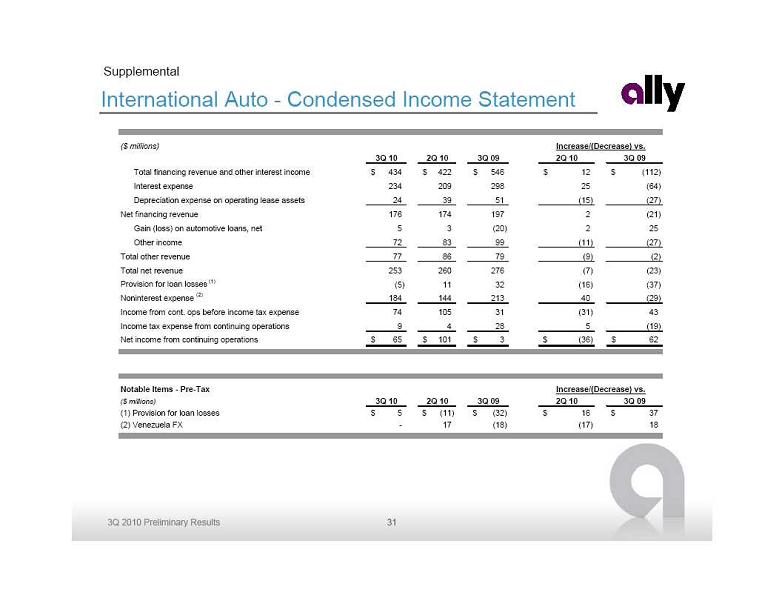 International Auto - Condensed Income Statement
Supplemental
($ millions)
3Q 10
2Q 10
3Q 09
2Q 10
3Q 09
Total financing revenue and other interest income
434
$
422
$
546
$
12
$
(112)
$
Interest expense
234
209
298
25
(64)
Depreciation expense on operating lease assets
24
39
51
(15)
(27)
Net financing revenue
176
174
197
2
(21)
Gain (loss) on automotive loans, net
5
3
(20)
2
25
Other income
72
83
99
(11)
(27)
Total other revenue
77
86
79
(9)
(2)
Total net revenue
253
260
276
(7)
(23)
Provision for loan losses
(1)
(5)
11
32
(16)
(37)
Noninterest expense
(2)
184
144
213
40
(29)
Income from cont. ops before income tax expense
74
105
31
(31)
43
Income tax expense from continuing operations
9
4
28
5
(19)
Net income from continuing operations
65
$
101
$
3
$
(36)
$
62
$
Notable Items - Pre-Tax
($ millions)
3Q 10
2Q 10
3Q 09
2Q 10
3Q 09
(1) Provision for loan losses
5
$
(11)
$
(32)
$
16
$
37
$
(2) Venezuela FX
-
17
(18)
(17)
18
Increase/(Decrease) vs.
Increase/(Decrease) vs.
31
International Auto - Condensed Income Statement
Supplemental
($ millions)
3Q 10
2Q 10
3Q 09
2Q 10
3Q 09
Total financing revenue and other interest income
434
$
422
$
546
$
12
$
(112)
$
Interest expense
234
209
298
25
(64)
Depreciation expense on operating lease assets
24
39
51
(15)
(27)
Net financing revenue
176
174
197
2
(21)
Gain (loss) on automotive loans, net
5
3
(20)
2
25
Other income
72
83
99
(11)
(27)
Total other revenue
77
86
79
(9)
(2)
Total net revenue
253
260
276
(7)
(23)
Provision for loan losses
(1)
(5)
11
32
(16)
(37)
Noninterest expense
(2)
184
144
213
40
(29)
Income from cont. ops before income tax expense
74
105
31
(31)
43
Income tax expense from continuing operations
9
4
28
5
(19)
Net income from continuing operations
65
$
101
$
3
$
(36)
$
62
$
Notable Items - Pre-Tax
($ millions)
3Q 10
2Q 10
3Q 09
2Q 10
3Q 09
(1) Provision for loan losses
5
$
(11)
$
(32)
$
16
$
37
$
(2) Venezuela FX
-
17
(18)
(17)
18
Increase/(Decrease) vs.
Increase/(Decrease) vs.
31
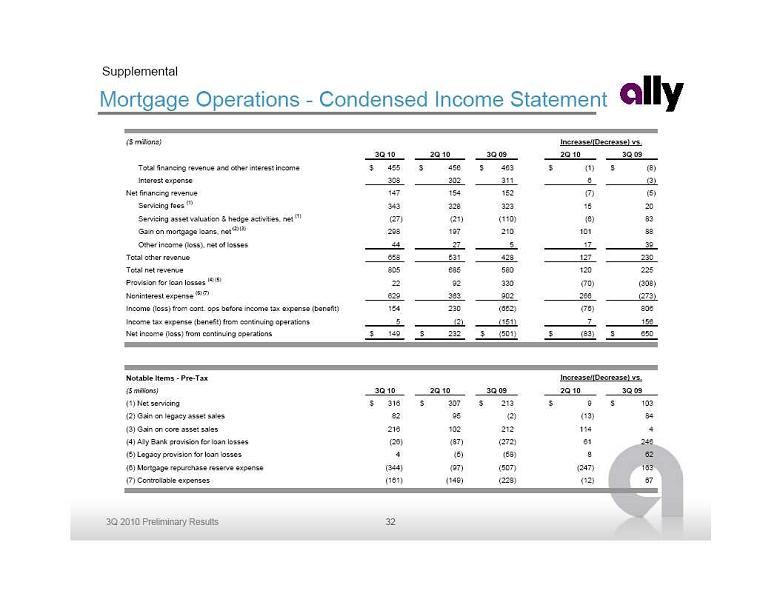 Mortgage Operations - Condensed Income Statement
Supplemental
($ millions)
3Q 10
2Q 10
3Q 09
2Q 10
3Q 09
Total financing revenue and other interest income
455
$
456
$
463
$
(1)
$
(8)
$
Interest expense
308
302
311
6
(3)
Net financing revenue
147
154
152
(7)
(5)
Servicing fees
(1)
343
328
323
15
20
Servicing asset valuation & hedge activities, net
(1)
(27)
(21)
(110)
(6)
83
Gain on mortgage loans, net
(2) (3)
298
197
210
101
88
Other income (loss), net of losses
44
27
5
17
39
Total other revenue
658
531
428
127
230
Total net revenue
805
685
580
120
225
Provision for loan losses
(4) (5)
22
92
330
(70)
(308)
Noninterest expense
(6) (7)
629
363
902
266
(273)
Income (loss) from cont. ops before income tax expense (benefit)
154
230
(652)
(76)
806
Income tax expense (benefit) from continuing operations
5
(2)
(151)
7
156
Net income (loss) from continuing operations
149
$
232
$
(501)
$
(83)
$
650
$
Notable Items - Pre-Tax
($ millions)
3Q 10
2Q 10
3Q 09
2Q 10
3Q 09
(1) Net servicing
316
$
307
$
213
$
9
$
103
$
(2) Gain on legacy asset sales
82
95
(2)
(13)
84
(3) Gain on core asset sales
216
102
212
114
4
(4) Ally Bank provision for loan losses
(26)
(87)
(272)
61
246
(5) Legacy provision for loan losses
4
(5)
(58)
8
62
(6) Mortgage repurchase reserve expense
(344)
(97)
(507)
(247)
163
(7) Controllable expenses
(161)
(149)
(228)
(12)
67
Increase/(Decrease) vs.
Increase/(Decrease) vs.
32
Mortgage Operations - Condensed Income Statement
Supplemental
($ millions)
3Q 10
2Q 10
3Q 09
2Q 10
3Q 09
Total financing revenue and other interest income
455
$
456
$
463
$
(1)
$
(8)
$
Interest expense
308
302
311
6
(3)
Net financing revenue
147
154
152
(7)
(5)
Servicing fees
(1)
343
328
323
15
20
Servicing asset valuation & hedge activities, net
(1)
(27)
(21)
(110)
(6)
83
Gain on mortgage loans, net
(2) (3)
298
197
210
101
88
Other income (loss), net of losses
44
27
5
17
39
Total other revenue
658
531
428
127
230
Total net revenue
805
685
580
120
225
Provision for loan losses
(4) (5)
22
92
330
(70)
(308)
Noninterest expense
(6) (7)
629
363
902
266
(273)
Income (loss) from cont. ops before income tax expense (benefit)
154
230
(652)
(76)
806
Income tax expense (benefit) from continuing operations
5
(2)
(151)
7
156
Net income (loss) from continuing operations
149
$
232
$
(501)
$
(83)
$
650
$
Notable Items - Pre-Tax
($ millions)
3Q 10
2Q 10
3Q 09
2Q 10
3Q 09
(1) Net servicing
316
$
307
$
213
$
9
$
103
$
(2) Gain on legacy asset sales
82
95
(2)
(13)
84
(3) Gain on core asset sales
216
102
212
114
4
(4) Ally Bank provision for loan losses
(26)
(87)
(272)
61
246
(5) Legacy provision for loan losses
4
(5)
(58)
8
62
(6) Mortgage repurchase reserve expense
(344)
(97)
(507)
(247)
163
(7) Controllable expenses
(161)
(149)
(228)
(12)
67
Increase/(Decrease) vs.
Increase/(Decrease) vs.
32
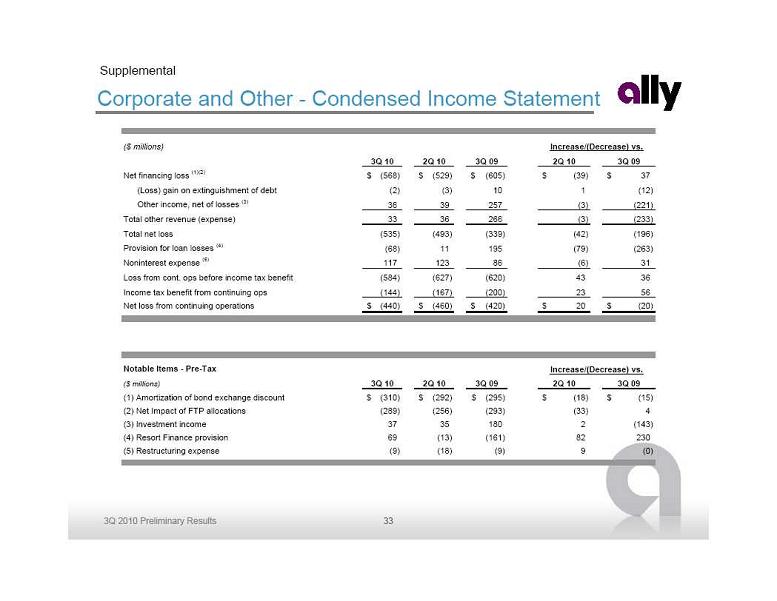 Corporate and Other - Condensed Income Statement
Supplemental
($ millions)
3Q 10
2Q 10
3Q 09
2Q 10
3Q 09
Net financing loss
(1)(2)
(568)
$
(529)
$
(605)
$
(39)
$
37
$
(Loss) gain on extinguishment of debt
(2)
(3)
10
1
(12)
Other income, net of losses
(3)
36
39
257
(3)
(221)
Total other revenue (expense)
33
36
266
(3)
(233)
Total net loss
(535)
(493)
(339)
(42)
(196)
Provision for loan losses
(4)
(68)
11
195
(79)
(263)
Noninterest expense
(5)
117
123
86
(6)
31
Loss from cont. ops before income tax benefit
(584)
(627)
(620)
43
36
Income tax benefit from continuing ops
(144)
(167)
(200)
23
56
Net loss from continuing operations
(440)
$
(460)
$
(420)
$
20
$
(20)
$
Notable Items - Pre-Tax
($ millions)
3Q 10
2Q 10
3Q 09
2Q 10
3Q 09
(1) Amortization of bond exchange discount
(310)
$
(292)
$
(295)
$
(18)
$
(15)
$
(2) Net Impact of FTP allocations
(289)
(256)
(293)
(33)
4
(3) Investment income
37
35
180
2
(143)
(4) Resort Finance provision
69
(13)
(161)
82
230
(5) Restructuring expense
(9)
(18)
(9)
9
(0)
Increase/(Decrease) vs.
Increase/(Decrease) vs.
33
Corporate and Other - Condensed Income Statement
Supplemental
($ millions)
3Q 10
2Q 10
3Q 09
2Q 10
3Q 09
Net financing loss
(1)(2)
(568)
$
(529)
$
(605)
$
(39)
$
37
$
(Loss) gain on extinguishment of debt
(2)
(3)
10
1
(12)
Other income, net of losses
(3)
36
39
257
(3)
(221)
Total other revenue (expense)
33
36
266
(3)
(233)
Total net loss
(535)
(493)
(339)
(42)
(196)
Provision for loan losses
(4)
(68)
11
195
(79)
(263)
Noninterest expense
(5)
117
123
86
(6)
31
Loss from cont. ops before income tax benefit
(584)
(627)
(620)
43
36
Income tax benefit from continuing ops
(144)
(167)
(200)
23
56
Net loss from continuing operations
(440)
$
(460)
$
(420)
$
20
$
(20)
$
Notable Items - Pre-Tax
($ millions)
3Q 10
2Q 10
3Q 09
2Q 10
3Q 09
(1) Amortization of bond exchange discount
(310)
$
(292)
$
(295)
$
(18)
$
(15)
$
(2) Net Impact of FTP allocations
(289)
(256)
(293)
(33)
4
(3) Investment income
37
35
180
2
(143)
(4) Resort Finance provision
69
(13)
(161)
82
230
(5) Restructuring expense
(9)
(18)
(9)
9
(0)
Increase/(Decrease) vs.
Increase/(Decrease) vs.
33
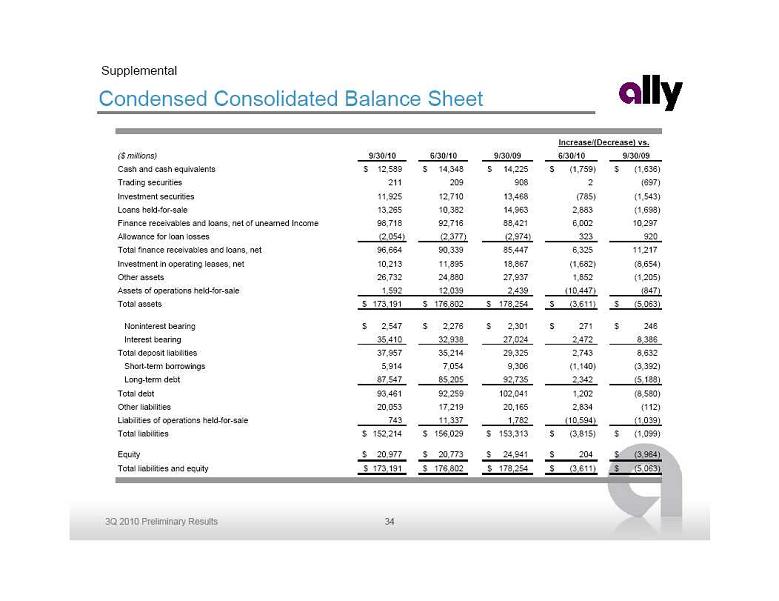 Condensed Consolidated Balance Sheet
Supplemental
($ millions)
9/30/10
6/30/10
9/30/09
6/30/10
9/30/09
Cash and cash equivalents
12,589
$
14,348
$
14,225
$
(1,759)
$
(1,636)
$
Trading securities
211
209
908
2
(697)
Investment securities
11,925
12,710
13,468
(785)
(1,543)
Loans held-for-sale
13,265
10,382
14,963
2,883
(1,698)
Finance receivables and loans, net of unearned Income
98,718
92,716
88,421
6,002
10,297
Allowance for loan losses
(2,054)
(2,377)
(2,974)
323
920
Total finance receivables and loans, net
96,664
90,339
85,447
6,325
11,217
Investment in operating leases, net
10,213
11,895
18,867
(1,682)
(8,654)
Other assets
26,732
24,880
27,937
1,852
(1,205)
Assets of operations held-for-sale
1,592
12,039
2,439
(10,447)
(847)
Total assets
173,191
$
176,802
$
178,254
$
(3,611)
$
(5,063)
$
Noninterest bearing
2,547
$
2,276
$
2,301
$
271
$
246
$
Interest bearing
35,410
32,938
27,024
2,472
8,386
Total deposit liabilities
37,957
35,214
29,325
2,743
8,632
Short-term borrowings
5,914
7,054
9,306
(1,140)
(3,392)
Long-term debt
87,547
85,205
92,735
2,342
(5,188)
Total debt
93,461
92,259
102,041
1,202
(8,580)
Other liabilities
20,053
17,219
20,165
2,834
(112)
Liabilities of operations held-for-sale
743
11,337
1,782
(10,594)
(1,039)
Total liabilities
152,214
$
156,029
$
153,313
$
(3,815)
$
(1,099)
$
Equity
20,977
$
20,773
$
24,941
$
204
$
(3,964)
$
Total liabilities and equity
173,191
$
176,802
$
178,254
$
(3,611)
$
(5,063)
$
Increase/(Decrease) vs.
34
Condensed Consolidated Balance Sheet
Supplemental
($ millions)
9/30/10
6/30/10
9/30/09
6/30/10
9/30/09
Cash and cash equivalents
12,589
$
14,348
$
14,225
$
(1,759)
$
(1,636)
$
Trading securities
211
209
908
2
(697)
Investment securities
11,925
12,710
13,468
(785)
(1,543)
Loans held-for-sale
13,265
10,382
14,963
2,883
(1,698)
Finance receivables and loans, net of unearned Income
98,718
92,716
88,421
6,002
10,297
Allowance for loan losses
(2,054)
(2,377)
(2,974)
323
920
Total finance receivables and loans, net
96,664
90,339
85,447
6,325
11,217
Investment in operating leases, net
10,213
11,895
18,867
(1,682)
(8,654)
Other assets
26,732
24,880
27,937
1,852
(1,205)
Assets of operations held-for-sale
1,592
12,039
2,439
(10,447)
(847)
Total assets
173,191
$
176,802
$
178,254
$
(3,611)
$
(5,063)
$
Noninterest bearing
2,547
$
2,276
$
2,301
$
271
$
246
$
Interest bearing
35,410
32,938
27,024
2,472
8,386
Total deposit liabilities
37,957
35,214
29,325
2,743
8,632
Short-term borrowings
5,914
7,054
9,306
(1,140)
(3,392)
Long-term debt
87,547
85,205
92,735
2,342
(5,188)
Total debt
93,461
92,259
102,041
1,202
(8,580)
Other liabilities
20,053
17,219
20,165
2,834
(112)
Liabilities of operations held-for-sale
743
11,337
1,782
(10,594)
(1,039)
Total liabilities
152,214
$
156,029
$
153,313
$
(3,815)
$
(1,099)
$
Equity
20,977
$
20,773
$
24,941
$
204
$
(3,964)
$
Total liabilities and equity
173,191
$
176,802
$
178,254
$
(3,611)
$
(5,063)
$
Increase/(Decrease) vs.
34
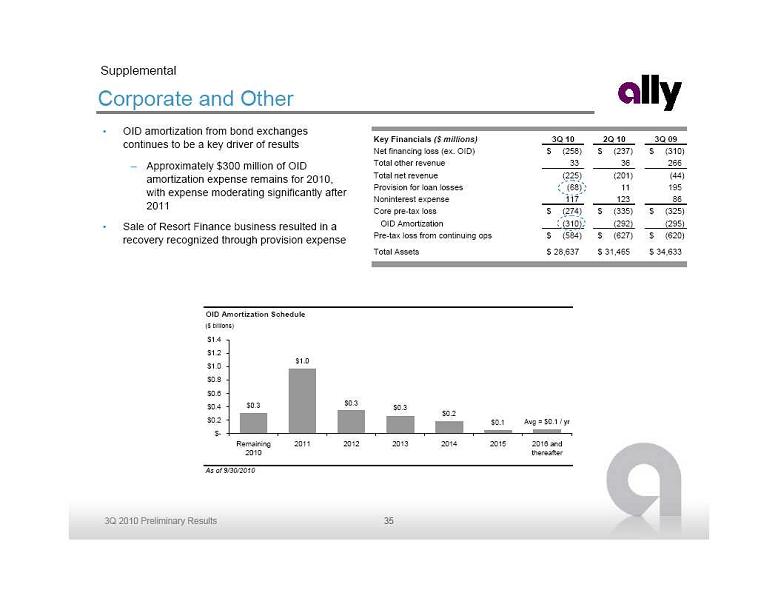 Corporate and Other
OID amortization from bond exchanges
Corporate and Other
OID amortization from bond exchanges
continues to be a key driver of results
Approximately $300 million of OID
amortization expense remains for 2010,
with expense moderating significantly after
2011
Sale of Resort Finance business resulted in a
recovery recognized through provision expense
Supplemental
OID Amortization Schedule
($ billions)
As of 9/30/2010
$0.3
$1.0
$0.3
$0.2
$0.1
Avg = $0.1 / yr
$0.3
$-
$0.2
$0.4
$0.6
$0.8
$1.0
$1.2
$1.4
Remaining
2010
2011
2012
2013
2014
2015
2016 and
thereafter
Key Financials
($ millions)
3Q 10
2Q 10
3Q 09
Net financing loss (ex. OID)
(258)
$
(237)
$
(310)
$
Total other revenue
33
36
266
Total net revenue
(225)
(201)
(44)
Provision for loan losses
(68)
11
195
Noninterest expense
117
123
86
Core pre-tax loss
(274)
$
(335)
$
(325)
$
OID Amortization
(310)
(292)
(295)
Pre-tax loss from continuing ops
(584)
$
(627)
$
(620)
$
Total Assets
28,637
$
31,465
$
34,633
$
35
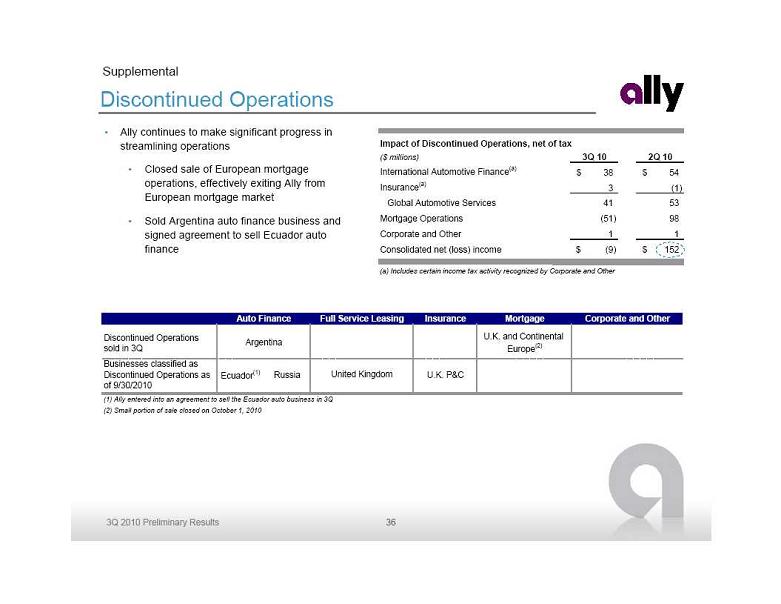 Discontinued Operations
Ally continues to make significant progress in
Discontinued Operations
Ally continues to make significant progress in
streamlining operations
Closed sale of European mortgage
operations, effectively exiting Ally from
European mortgage market
Sold Argentina auto finance business and
signed agreement to sell Ecuador auto
finance
Supplemental
Impact of Discontinued Operations, net of tax
($ millions)
3Q 10
2Q 10
International Automotive Finance
(a)
38
$
54
$
Insurance
(a)
3
(1)
Global Automotive Services
41
53
Mortgage Operations
(51)
98
Corporate and Other
1
1
Consolidated net (loss) income
(9)
$
152
$
(a) Includes certain income tax activity recognized by Corporate and Other
Insurance
Mortgage
Corporate and Other
Discontinued Operations
sold in 3Q
U.K. and Continental
Europe
(2)
Businesses classified as
Discontinued Operations as
of 9/30/2010
Ecuador
(1)
Russia
U.K. P&C
(1) Ally entered into an agreement to sell the Ecuador auto business in 3Q
(2) Small portion of sale closed on October 1, 2010
United Kingdom
Auto Finance
Full Service Leasing
Argentina
36
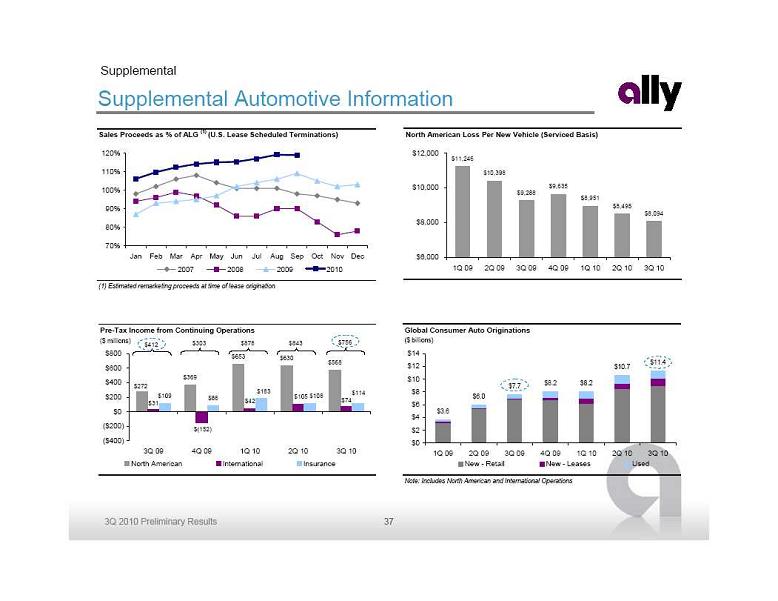 Supplemental Automotive Information
$303
$878
$412
$756
$843
Supplemental
Sales Proceeds as % of ALG
(1)
(U.S. Lease Scheduled Terminations)
(1) Estimated remarketing proceeds at time of lease origination
70%
80%
90%
100%
110%
120%
Jan
Feb
Mar
Apr
May
Jun
Jul
Aug
Sep
Oct
Nov
Dec
2007
2008
2009
2010
North American Loss Per New Vehicle (Serviced Basis)
$11,246
$10,398
$9,288
$9,635
$8,951
$8,495
$8,094
$6,000
$8,000
$10,000
$12,000
1Q 09
2Q 09
3Q 09
4Q 09
1Q 10
2Q 10
3Q 10
Pre-Tax Income from Continuing Operations
($ millions)
$369
$653
$630
$568
$42
$109
$86
$272
$105
$(152)
$31
$74
$108
$183
$114
($400)
($200)
$0
$200
$400
$600
$800
3Q 09
4Q 09
1Q 10
2Q 10
3Q 10
North American
International
Insurance
Global Consumer Auto Originations
($ billions)
Note: Includes North American and International Operations
$3.6
$6.0
$7.7
$8.2
$8.2
$10.7
$11.4
$0
$2
$4
$6
$8
$10
$12
$14
1Q 09
2Q 09
3Q 09
4Q 09
1Q 10
2Q 10
3Q 10
New - Retail
New - Leases
Used
37
Supplemental Automotive Information
$303
$878
$412
$756
$843
Supplemental
Sales Proceeds as % of ALG
(1)
(U.S. Lease Scheduled Terminations)
(1) Estimated remarketing proceeds at time of lease origination
70%
80%
90%
100%
110%
120%
Jan
Feb
Mar
Apr
May
Jun
Jul
Aug
Sep
Oct
Nov
Dec
2007
2008
2009
2010
North American Loss Per New Vehicle (Serviced Basis)
$11,246
$10,398
$9,288
$9,635
$8,951
$8,495
$8,094
$6,000
$8,000
$10,000
$12,000
1Q 09
2Q 09
3Q 09
4Q 09
1Q 10
2Q 10
3Q 10
Pre-Tax Income from Continuing Operations
($ millions)
$369
$653
$630
$568
$42
$109
$86
$272
$105
$(152)
$31
$74
$108
$183
$114
($400)
($200)
$0
$200
$400
$600
$800
3Q 09
4Q 09
1Q 10
2Q 10
3Q 10
North American
International
Insurance
Global Consumer Auto Originations
($ billions)
Note: Includes North American and International Operations
$3.6
$6.0
$7.7
$8.2
$8.2
$10.7
$11.4
$0
$2
$4
$6
$8
$10
$12
$14
1Q 09
2Q 09
3Q 09
4Q 09
1Q 10
2Q 10
3Q 10
New - Retail
New - Leases
Used
37
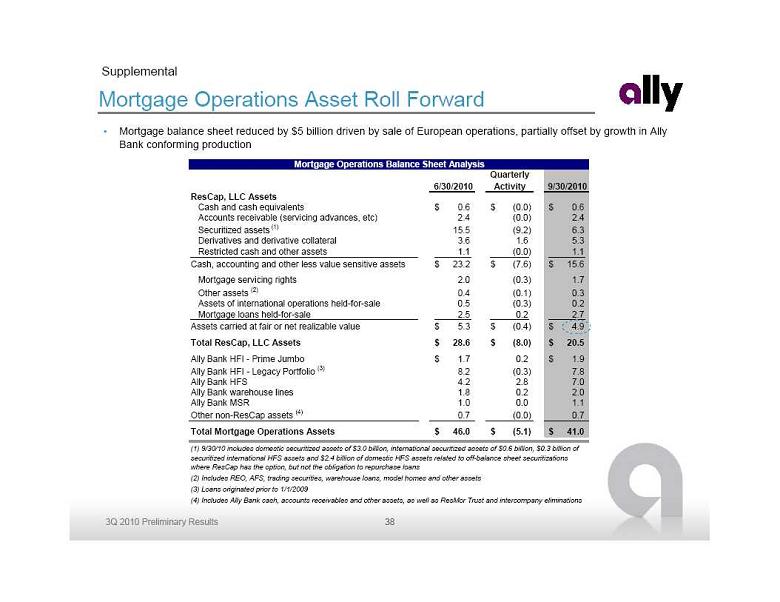 Mortgage Operations Asset Roll Forward
Mortgage balance sheet reduced by $5 billion driven by sale of European operations, partially offset by growth in Ally
Mortgage Operations Asset Roll Forward
Mortgage balance sheet reduced by $5 billion driven by sale of European operations, partially offset by growth in Ally
Bank conforming production
Supplemental
6/30/2010
Quarterly
Activity
9/30/2010
ResCap, LLC Assets
Cash and cash equivalents
0.6
$
(0.0)
$
0.6
$
Accounts receivable (servicing advances, etc)
2.4
(0.0)
2.4
Securitized assets
(1)
15.5
(9.2)
6.3
Derivatives and derivative collateral
3.6
1.6
5.3
Restricted cash and other assets
1.1
(0.0)
1.1
Cash, accounting and other less value sensitive assets
23.2
$
(7.6)
$
15.6
$
Mortgage servicing rights
2.0
(0.3)
1.7
Other assets
(2)
0.4
(0.1)
0.3
Assets of international operations held-for-sale
0.5
(0.3)
0.2
Mortgage loans held-for-sale
2.5
0.2
2.7
Assets carried at fair or net realizable value
5.3
$
(0.4)
$
4.9
$
Total ResCap, LLC Assets
28.6
$
(8.0)
$
20.5
$
Ally Bank HFI - Prime Jumbo
1.7
$
0.2
1.9
$
Ally Bank HFI - Legacy Portfolio
(3)
8.2
(0.3)
7.8
Ally Bank HFS
4.2
2.8
7.0
Ally Bank warehouse lines
1.8
0.2
2.0
Ally Bank MSR
1.0
0.0
1.1
Other non-ResCap assets
(4)
0.7
(0.0)
0.7
Total Mortgage Operations Assets
46.0
$
(5.1)
$
41.0
$
(4) Includes Ally Bank cash, accounts receivables and other assets, as well as ResMor Trust and intercompany eliminations
Mortgage Operations Balance Sheet Analysis
(1) 9/30/10 includes domestic securitized assets of $3.0 billion, international securitized assets of $0.6 billion, $0.3 billion of
securitized international HFS assets and $2.4 billion of domestic HFS assets related to off-balance sheet securitizations
where ResCap has the option, but not the obligation to repurchase loans
(2) Includes REO, AFS, trading securities, warehouse loans, model homes and other assets
(3) Loans originated prior to 1/1/2009
38
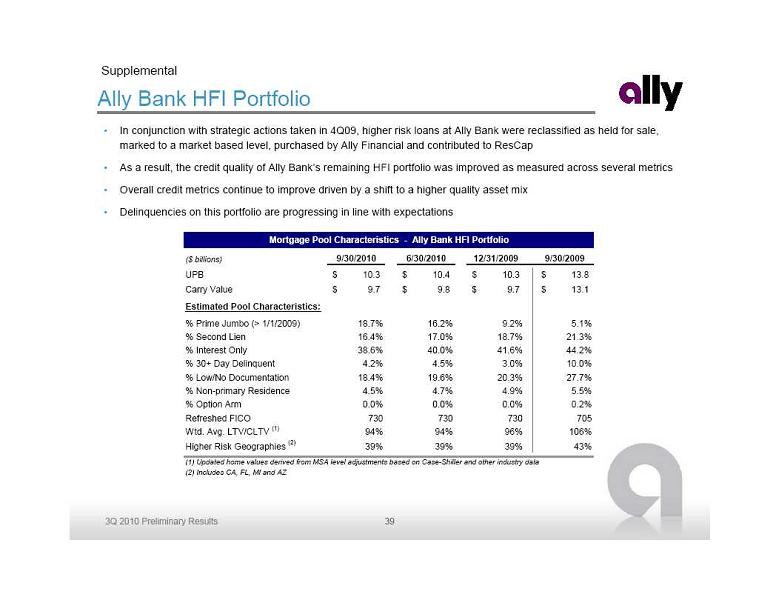 Ally Bank HFI Portfolio
In conjunction with strategic actions taken in 4Q09, higher risk loans at Ally Bank were reclassified as held for sale,
Ally Bank HFI Portfolio
In conjunction with strategic actions taken in 4Q09, higher risk loans at Ally Bank were reclassified as held for sale,
marked to a market based level, purchased by Ally Financial and contributed to ResCap
As a result, the credit quality of Ally Bank’s remaining HFI portfolio was improved as measured across several metrics
Overall credit metrics continue to improve driven by a shift to a higher quality asset mix
Delinquencies on this portfolio are progressing in line with expectations
Supplemental
($ billions)
9/30/2010
6/30/2010
12/31/2009
9/30/2009
UPB
10.3
$
10.4
$
10.3
$
13.8
$
Carry Value
9.7
$
9.8
$
9.7
$
13.1
$
Estimated Pool Characteristics:
% Prime Jumbo (> 1/1/2009)
18.7%
16.2%
9.2%
5.1%
% Second Lien
16.4%
17.0%
18.7%
21.3%
% Interest Only
38.6%
40.0%
41.6%
44.2%
% 30+ Day Delinquent
4.2%
4.5%
3.0%
10.0%
% Low/No Documentation
18.4%
19.6%
20.3%
27.7%
% Non-primary Residence
4.5%
4.7%
4.9%
5.5%
% Option Arm
0.0%
0.0%
0.0%
0.2%
Refreshed FICO
730
730
730
705
Wtd. Avg. LTV/CLTV
(1)
94%
94%
96%
106%
Higher Risk Geographies
(2)
39%
39%
39%
43%
(1) Updated home values derived from MSA level adjustments based on Case-Shiller and other industry data
(2) Includes CA, FL, MI and AZ
Mortgage Pool Characteristics - Ally Bank HFI Portfolio
39
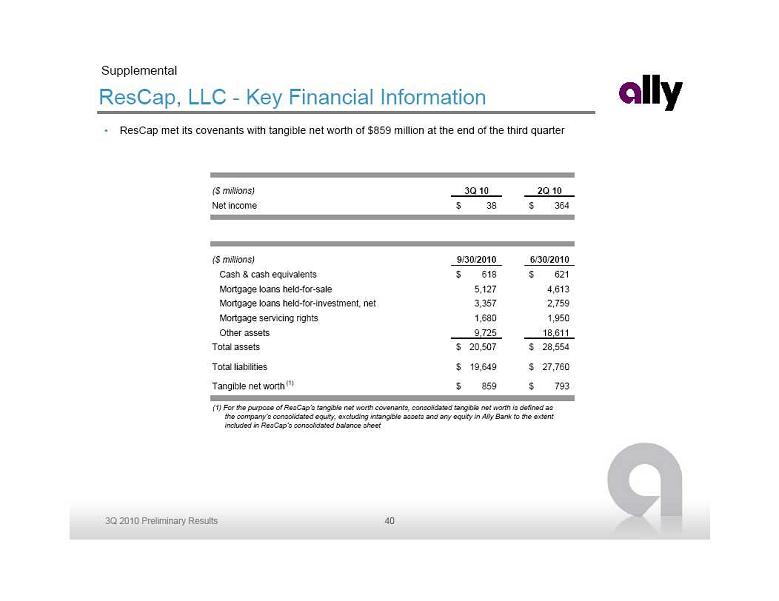 ResCap, LLC - Key Financial Information
ResCap met its covenants with tangible net worth of $859 million at the end of the third quarter
(1) For the purpose of ResCap’s tangible net worth covenants, consolidated tangible net worth is defined as
ResCap, LLC - Key Financial Information
ResCap met its covenants with tangible net worth of $859 million at the end of the third quarter
(1) For the purpose of ResCap’s tangible net worth covenants, consolidated tangible net worth is defined as
the company’s consolidated equity, excluding intangible assets and any equity in Ally
Bank to the extent
included in ResCap’s consolidated balance sheet
Supplemental
($ millions)
3Q 10
2Q 10
Net income
38
$
364
$
($ millions)
9/30/2010
6/30/2010
Cash & cash equivalents
618
$
621
$
Mortgage loans held-for-sale
5,127
4,613
Mortgage loans held-for-investment, net
3,357
2,759
Mortgage servicing rights
1,680
1,950
Other assets
9,725
18,611
Total assets
20,507
$
28,554
$
Total liabilities
19,649
$
27,760
$
Tangible net worth
(1)
859
$
793
$
40
 Liquidity and Unsecured Debt Maturity Profile
Supplemental
Available Liquidity
9/30/2010
6/30/2010
($ billions)
Parent
(1)
Ally Bank
Parent
(1)(2)
Ally Bank
Cash and Cash Equivalents
7.2
$
4.1
$
10.3
$
2.6
$
Unencumbered Securities
(3)
0.5
3.3
1.1
3.8
Current Secured Committed Unused Capacity
(4)
10.9
5.6
10.3
6.9
Current Unsecured Committed Unused Capacity
0.1
-
0.1
-
Whole Loan Forward Flow Agreements
0.9
-
1.5
-
Total Available Liquidity
19.6
$
13.0
$
23.3
$
13.3
$
Ally Bank Intercompany Loan
(5)
5.0
(5.0)
-
-
Adjusted Total Available Liquidity
24.6
$
8.0
$
23.3
$
13.3
$
(1)
Parent defined as Ally Consolidated less Ally Bank, ResCap (not shown) and Insurance (not shown)
(2)
Includes overnight funds placed at Ally Bank at quarter-end
(3)
Includes UST, Agency debt and Agency MBS
(4)
Includes equal allocation of shared capacity totaling $3.75 billion in 3Q and $3.0 billion in 2Q, which can be used by the Parent or Ally Bank
(5)
To optimize use of cash and secured facility capacity between entities, Ally Financial lends cash to Ally Bank from time to time under an intercompany
loan agreement. Amounts outstanding on this loan are repayable to Ally Financial at any time, subject to 5 days notice.
Ally Financial Inc. Consolidated Unsecured Long-Term Debt Maturity Profile
($ billions)
$23
$2
$2
$12
$10
$1
$-
$5
$10
$15
$20
$25
$30
Remaining 2010
2011
2012
2013
2014
2015 and
thereafter
41
Liquidity and Unsecured Debt Maturity Profile
Supplemental
Available Liquidity
9/30/2010
6/30/2010
($ billions)
Parent
(1)
Ally Bank
Parent
(1)(2)
Ally Bank
Cash and Cash Equivalents
7.2
$
4.1
$
10.3
$
2.6
$
Unencumbered Securities
(3)
0.5
3.3
1.1
3.8
Current Secured Committed Unused Capacity
(4)
10.9
5.6
10.3
6.9
Current Unsecured Committed Unused Capacity
0.1
-
0.1
-
Whole Loan Forward Flow Agreements
0.9
-
1.5
-
Total Available Liquidity
19.6
$
13.0
$
23.3
$
13.3
$
Ally Bank Intercompany Loan
(5)
5.0
(5.0)
-
-
Adjusted Total Available Liquidity
24.6
$
8.0
$
23.3
$
13.3
$
(1)
Parent defined as Ally Consolidated less Ally Bank, ResCap (not shown) and Insurance (not shown)
(2)
Includes overnight funds placed at Ally Bank at quarter-end
(3)
Includes UST, Agency debt and Agency MBS
(4)
Includes equal allocation of shared capacity totaling $3.75 billion in 3Q and $3.0 billion in 2Q, which can be used by the Parent or Ally Bank
(5)
To optimize use of cash and secured facility capacity between entities, Ally Financial lends cash to Ally Bank from time to time under an intercompany
loan agreement. Amounts outstanding on this loan are repayable to Ally Financial at any time, subject to 5 days notice.
Ally Financial Inc. Consolidated Unsecured Long-Term Debt Maturity Profile
($ billions)
$23
$2
$2
$12
$10
$1
$-
$5
$10
$15
$20
$25
$30
Remaining 2010
2011
2012
2013
2014
2015 and
thereafter
41
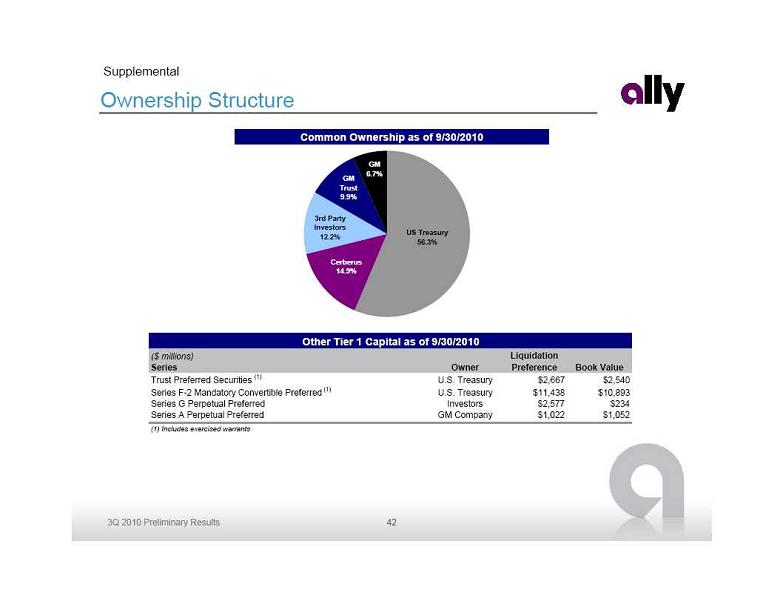 Ownership Structure
Supplemental
Common Ownership as of 9/30/2010
GM
6.7%
GM
Trust
9.9%
3rd Party
Investors
12.2%
Cerberus
14.9%
US Treasury
56.3%
($ millions)
Series
Owner
Liquidation
Preference
Book Value
Trust Preferred Securities
(1)
U.S. Treasury
$2,667
$2,540
Series F-2 Mandatory Convertible Preferred
(1)
U.S. Treasury
$11,438
$10,893
Series G Perpetual Preferred
Investors
$2,577
$234
Series A Perpetual Preferred
GM Company
$1,022
$1,052
(1) Includes exercised warrants
Other Tier 1 Capital as of 9/30/2010
42
Ownership Structure
Supplemental
Common Ownership as of 9/30/2010
GM
6.7%
GM
Trust
9.9%
3rd Party
Investors
12.2%
Cerberus
14.9%
US Treasury
56.3%
($ millions)
Series
Owner
Liquidation
Preference
Book Value
Trust Preferred Securities
(1)
U.S. Treasury
$2,667
$2,540
Series F-2 Mandatory Convertible Preferred
(1)
U.S. Treasury
$11,438
$10,893
Series G Perpetual Preferred
Investors
$2,577
$234
Series A Perpetual Preferred
GM Company
$1,022
$1,052
(1) Includes exercised warrants
Other Tier 1 Capital as of 9/30/2010
42
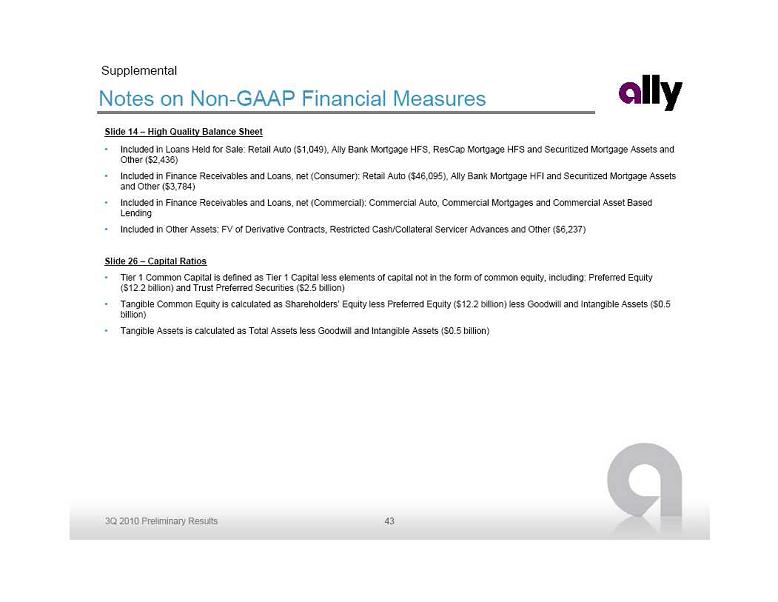 Notes on Non-GAAP Financial Measures
Supplemental
Slide 14 – High Quality Balance Sheet
Included in Loans Held for Sale: Retail Auto ($1,049), Ally Bank Mortgage HFS, ResCap Mortgage HFS and Securitized Mortgage Assets and
Notes on Non-GAAP Financial Measures
Supplemental
Slide 14 – High Quality Balance Sheet
Included in Loans Held for Sale: Retail Auto ($1,049), Ally Bank Mortgage HFS, ResCap Mortgage HFS and Securitized Mortgage Assets and
Other ($2,436)
Included in Finance Receivables and Loans, net (Consumer): Retail Auto ($46,095), Ally Bank Mortgage HFI and Securitized Mortgage Assets
and Other ($3,784)
Included in Finance Receivables and Loans, net (Commercial): Commercial Auto, Commercial Mortgages and Commercial Asset Based
Lending
Included in Other Assets: FV of Derivative Contracts, Restricted Cash/Collateral Servicer Advances and Other ($6,237)
Slide 26 – Capital Ratios
Tier 1 Common Capital is defined as Tier 1 Capital less elements of capital not in the form of common equity, including: Preferred Equity
($12.2 billion) and Trust Preferred Securities ($2.5 billion)
Tangible Common Equity is calculated as Shareholders’ Equity less Preferred Equity ($12.2 billion) less Goodwill and Intangible Assets ($0.5
billion)
Tangible Assets is calculated as Total Assets less Goodwill and Intangible Assets ($0.5 billion)
43