Attached files
| file | filename |
|---|---|
| 8-K - FORM 8-K - BANC OF CALIFORNIA, INC. | d8k.htm |
 First PacTrust
Bancorp, Inc.
October 2010
Exhibit 99.1 |
 2
Important Disclosures
Forward-Looking Statements
These materials contain various forward-looking statements that are based on assumptions and
describe our future plans and strategies and our expectations. These forward-looking
statements are generally identified by words such as “believe,” “expect,” “intend,” “anticipate,” “estimate,” “project,” or similar words. Our
ability to predict results or the actual effect of future plans or strategies is uncertain. Factors
which could cause actual results to differ materially from those estimated include, but are not
limited to the possibility that the potential private placement transaction referred to herein will not be completed within the time frame
anticipated or at all; continuation or worsening of current recessionary conditions, as well as
continued turmoil in the financial markets; our ability to implement our acquisition strategy
and the applicability of the FDIC Statement of Policy on Qualifications for Failed Bank Acquisitions to us; the credit risks of lending activities,
which may be affected by further deterioration in the real estate market, may lead to decreased loan
delinquencies, losses and nonperforming assets in our loan portfolios, and may result in our
allowance for loan losses not being adequate to cover actual losses, and require us to materially increase our reserves; changes
in general economic conditions, either nationally or in our market area; changes in the levels of
general interest rates, and the relative differences between short- and long-term
interest rates, deposit interest rates, our net interest margin and funding sources; fluctuations in the demand for loans, the number of unsold homes
and other properties and fluctuations in commercial and residential real estate values in our market
area; results of examinations of us by the Office of Thrift Supervision or by other regulatory
authorities, including our compliance with our Memorandum of Understanding and the possibility that any such regulatory
authority may, among other things, require us to increase our allowance for loan losses,
write-down asset values, increase our capital levels, or affect our ability to borrow funds
or maintain or increase deposits, which could adversely affect our liquidity and earnings; legislative or regulatory changes that adversely affect our
business, including changes in the interpretation of regulatory capital or other rules; our ability to
control operating costs and expenses; our ability to successfully integrate any assets,
liabilities, customers, systems, and management personnel we have acquired or may in the future acquire into our operations and our ability
to realize related revenue synergies and cost savings within expected time frames and any goodwill
charges related thereto; staffing fluctuations in response to product demand or the
implementation of corporate strategies that affect our work force and potential associated charges; errors in our estimates in determining
fair value of certain of our assets, which may result in significant declines in valuation; the
network and computer systems on which we depend could fail or experience a security breach; our
ability to retain key members of our senior management team; costs and effects of litigation, including settlements and
judgments; increased competitive pressures among financial services companies; changes in consumer
spending, borrowing and savings habits; adverse changes in the securities markets; earthquake,
fire or other natural disasters affecting the condition of real estate collateral; the availability of resources to address changes
in laws, rules, or regulations or to respond to regulatory actions; inability of key third-party
providers to perform their obligations to us; changes in accounting policies and practices, as
may be adopted by the financial institution regulatory agencies or the Financial Accounting Standards Board or their application to our
business or final audit adjustments, including additional guidance and interpretation on accounting
issues and details of the implementation of new accounting methods; war or terrorist
activities; other economic, competitive, governmental, regulatory, and technological factors affecting our operations, pricing, products,
and services and the other risks described as detailed in the Company’s reports filed with the
SEC, including our Annual Report on Form 10-K for the fiscal year ended December 31, 2009
and subsequently filed Quarterly Reports on Form 10-Q and Current Reports on Form 8-K. |
 3
Important Disclosures (Cont’d)
Financial Projections
This presentation contains projections of financial performance. Such projections are, by nature,
based on anticipating future events that cannot be predicted with accuracy and there is no
assurance that the projections can or will be achieved. Such projections are also based on certain assumptions made at the time such
projections were formulated and may not necessarily be updated for any subsequent developments.
Actual results will be dependent upon a number of factors that are beyond the control of the
Company and the Bank. Accordingly, the projections should not be viewed as an estimate, prediction or representation as to
future results and should not be relied on in making an investment decision. Actual results may differ
substantially from the projections. The information contained in this document is for
information purposes only and based solely on information and data supplied by the Company and other third party sources. While the
information contained in this document is based on sources believed to be reliable, neither the
Company nor its representatives have independently verified the facts, assumptions, and
estimates contained in this document. Accordingly, no representation or warranty, expressed or implied, is made to, and no reliance
should be placed on, the fairness, accuracy, completeness or correctness of the information and
opinions contained in this document. Investment results may vary substantially over time and
from period to period based on many factors and an investor could lose its entire investment. Past performance is not necessarily
indicative of future performance. Prospective investors should consult with their financial, legal,
and tax advisors before making any investment decisions. Additional Information
The potential private placement transaction referred to herein will involve the sale of securities of
the Company in a transaction that will not be registered under the Securities Act of 1933, as
amended, and will be subject to the resale restrictions thereunder. Such securities may not be offered or sold absent registration or an
applicable exemption from registration. This document does not constitute an offer to sell or a
solicitation of an offer to buy any securities, nor shall there be any sale of securities in any
state or jurisdiction in which such an offer, solicitation or sale would be unlawful prior to registration or qualification under the securities
laws of any such state or jurisdiction.
As used herein, the “Company,” “we,” “us” and “our” refer to
First PacTrust Bancorp, Inc. and the “Bank” refers to Pacific Trust Bank, a wholly owned subsidiary of
the Company. |
 4
Ranking for Largest Community Bank Franchises in San Diego by Assets *
NAME (CHARTER TYPE)
12/31/2007
12/31/2008
12/31/2009
MOST
RECENT
California Bank & Trust (STATE)
1
1
1
1
Pacific Western Bank (STATE)
2
2
2
2
Imperial Capital Bank (STATE)
3
3
FAIL
FAIL
La Jolla Bank (FEDERAL)
4
4
3
FAIL
San Diego National Bank (FEDERAL)
5
5
FAIL
FAIL
Bank of Internet USA (FEDERAL)
6
6
4
3
PACIFIC TRUST BANK (FEDERAL)
7
7
6
5
Torrey Pines Bank (STATE)
8
8
5
4
1st Pacific Bank of California (STATE)
9
10
9
FAIL
Metro United Bank (STATE)
10
9
7
6
Regents Bank (FEDERAL)
11
12
10
7
Silvergate
Bank
(STATE)
12
11
8
8
Balboa Thrift and Loan Association (STATE)
13
13
12
11
Discovery Bank (STATE)
14
16
NA
NA
Security Business Bank of S.D. (STATE)
15
14
13
12
Home Bank of California (STATE)
16
17
14
15
California Community Bank (STATE)
17
15
11
10
Neighborhood National Bank (FEDERAL)
18
18
16
14
San Diego Trust Bank (STATE)
19
NA
15
13
Rancho Santa Fe Thrift & Loan (STATE)
20
20
NA
NA
Borrego Springs Bank (FEDERAL)
NA
19
20
16
San Diego Private Bank (STATE)
NA
NA
17
17
First Business Bank (FEDERAL)
NA
NA
18
18
Seacoast Commerce Bank (STATE)
NA
NA
19
19
Coronado First Bank (STATE)
NA
NA
NA
20
Deep Community Roots
Chartered by the U.S. Office of Thrift Supervision
Insured by the FDIC
Founded in 1941 with 69 years of continuous operations
(public since 2002)
Former credit union for Rohr, Inc.
99 employees and 18,000 depository relationships
Valuable Branch Network
9 banking locations, including 6 full service branches
Member of CU Service Center Network with over 4,100
shared branch locations throughout the U.S.
1.12% cost of deposits as of 9/30/10 with no brokered funds
Disciplined Credit Team
Average FICO score at origination of 739 (as of 12/31/09)
Average LTV at origination of 58% (as of 12/31/09)
No construction or subprime loans and limited land loans
Attractive Assets
84% of loan portfolio is 1-4 unit residential mortgages
Mortgages focused in beach cities throughout the San Diego
area (i.e., La Jolla, Coronado, Rancho Santa Fe, Del Mar
and Carlsbad)
Approximately 1,000 residential mortgage loans (Average
size $600,000) (as of 12/31/09)
6% home price appreciation in San Diego since 12/31/09
Positioned for Growth
Balance sheet is strong with capacity to originate meaningful
volumes of commercial real estate and small business (C&I)
loans
Growth plans are complimentary with regulatory goals
San Diego’s Largest Federally Chartered Community Bank
*Source: FDIC Website as of 6/30/2010. |
 5
First PacTrust
Announced Transformational Private
Placement To Pursue Growth
Enhanced management team better enables the
Bank to pursue a robust commercial banking
strategy, expanding into more profitable loan
categories (i.e. CRE, C&I) and business lines (i.e.
small business banking, servicing, asset
management, secondary portfolio acquisitions)
Gregory Mitchell, former CEO of California National
Bank, to assume role as CEO of First PacTrust
following the closing of the private placement (Q4
2010)
Bank planning to hire following roles/positions:
chief retail officer, chief administrative officer, loan
and core deposit production personnel, a
commercial lending team, a risk officer, and capital
markets personnel
Through the infusion of $60 million at
$11.00 per share and the introduction of
additional management support, Pacific
Trust Bank should strengthen its market
position in San Diego and expand its
footprint throughout Southern California
Failures of San Diego National Bank,
Imperial Capital Bank, 1
Pacific Bank of
California and La Jolla Bank have
provided a significant void in the San
Diego community banking market while
failures and distress in Orange and Los
Angeles counties provide additional
growth opportunities
Distress and lack of core profitability
experienced by subscale community
banks in Southern California presents
attractive acquisition candidates
Proceeds of the recapitalization expected to be
used to repay TARP and pursue growth in the
Bank’s target markets
Strong regulatory capital ratios along with
enhanced management team better position the
Bank for robust organic growth and other strategic
opportunities, including acquisitions
Enhance Management Team
Growth Capital
The First PacTrust
Opportunity
Private Placement Overview
Offering Size:
$60 million
Price:
$11.00 / share (58.5% of current tangible book)
(78.5% of pro forma tangible book)
Lead Investors:
TCW Shared Opportunity Fund V, COR Capital LLC
Anticipated Completion:
4th
Quarter 2010
st |
 6
First PacTrust
Has A Three-Part Growth Strategy
Strengthen management and
commence growth strategy within
the Bank’s primary footprint
Locate and open new retail
banking locations and staff
with well known community
bankers to attract core
deposits
Enhance loan and deposit
product set
Establish high quality C&I
and community banking
relationships
Diversify portfolio and prudently
deploy capital by originating high
quality commercial real estate and
C&I loans
Very high market demand
with limited supply of
lenders in Southern
California
Strengthens balance sheet
and reduces concentration
risk
1. Organic Growth
Selectively explore traditional
acquisitions
Focus on banks with the
following characteristics
Privately held or limited
trading liquidity
Subscale (< $1.5 billion
in assets)
Broken business
models
Strategic benefits to franchise
development
Markets
Products
People
2. Traditional M&A
Pursue strategic transactions
with FDIC assistance
FDIC will typically provide
downside protection for
approximately 80% of certain
loan losses
Right to assume or rescind all
contracts of the failed bank (i.e.
leases)
Focus on smaller banks (i.e.,
$500 million in assets and less)
in attractive markets
FDIC’s troubled list is currently
over 800 banks
3. FDIC-Assisted M&A |
 7
•
$14.01 Tangible Common Equity per share
•
$135.9 million
Tangible
Common
Equity
(1)
•
20.29%
Tier
1
Risk-Based
(est)
(3)
•
21.54%
Total
Risk-Based
(est)
(3)
•
$107 million market cap ($11.00 stock price)
•
Growth targets emphasizing diversification into CRE
and C&I loans
•
Ability to secure performing loan portfolios from
distressed sellers
•
Pacific Trust Bank plans to expand its management
team to include a group led by Gregory Mitchell, a
former regulator, investment banker and most recently
CEO of California National Bank
•
4.5% target net interest margin from improving mix of
loans and deposits
•
Target after-tax 15% ROE and 1.5% ROA
•
Increase DDA and other core accounts through de
novo branching and hiring of skilled community
bankers focused on building out commercial banking
strategy
•
Enhance liquidity
ASSETS
CAPITAL
MANAGEMENT
•
$18.79
Tangible
Common
Equity
per
share
(1)
•
$78.4 million
Tangible
Common
Equity
(1)
•
12.90% Tier 1 Risk-Based
•
14.15% Total Risk-Based
•
$50 million market cap
•
$704.7 million loan portfolio
•
2.49% Reserves / Loans
•
2.9% NPL / Assets
(2)
•
84% of loans 1-4 unit residential mortgages
•
Since its formation in 1941 (and its 2002
conversion to a publicly traded thrift), Pacific Trust
Bank has maintained a solid and disciplined
approach to lending
•
Net interest margin 4.13% for the quarter ended
9/30/2010
•
2010 YTD core (pre-tax, pre-provision) earnings
estimate $15.8 million; est. core earnings ROE
19.8%, est. core earnings ROA 1.83%
(1)
•
1.8% dividend yield at price in private placement
•
$685 million retail deposits
•
No brokered deposits
•
1.12% cost of deposits
•
$111 million in cash and securities
As of 9/30/10
Pro Forma
Pacific Trust Bank’s CAMEL Summary
EARNINGS
LIQUIDITY
(1)
See “Non-GAAP Financial Information.” Core earnings projection per 8-K released on
July 27, 2010. (2)
Excluding TDRs.
(3)
Pro forma capital ratios shown above represent levels if all proceeds are downstreamed to the Bank;
however, current plans include $11.0 million in proceeds to be downstreamed to the Bank upon
close of the transaction with the remaining proceeds to stay at the holding company. The additional
proceeds will be downstreamed to the Bank as necessary. |
 8
Third Quarter Highlights
Company reported net income of $3.0 million and
EPS of $0.66
Net interest margin increased to 4.13%, up from
3.45% in the second quarter
Cost of deposits down to 1.12%
Loan loss provision for the quarter decreased to
$781k from $5.6 million the previous quarter
Core earnings of $12.9 million YTD
Efficiency ratio of 44.8%
Return on average assets of 1.40%
Tangible book value per share increased to
$18.79 / share
Net REO balance decreased to $7.8 million from
$8.3 million the preceding quarter
Non-performing loans have decreased to $25.4
million from $29.3 million the preceding quarter
Reserve levels as a % of loans increased to
2.49% despite significant decrease in the loan
loss provision
Income
Assets |
 9
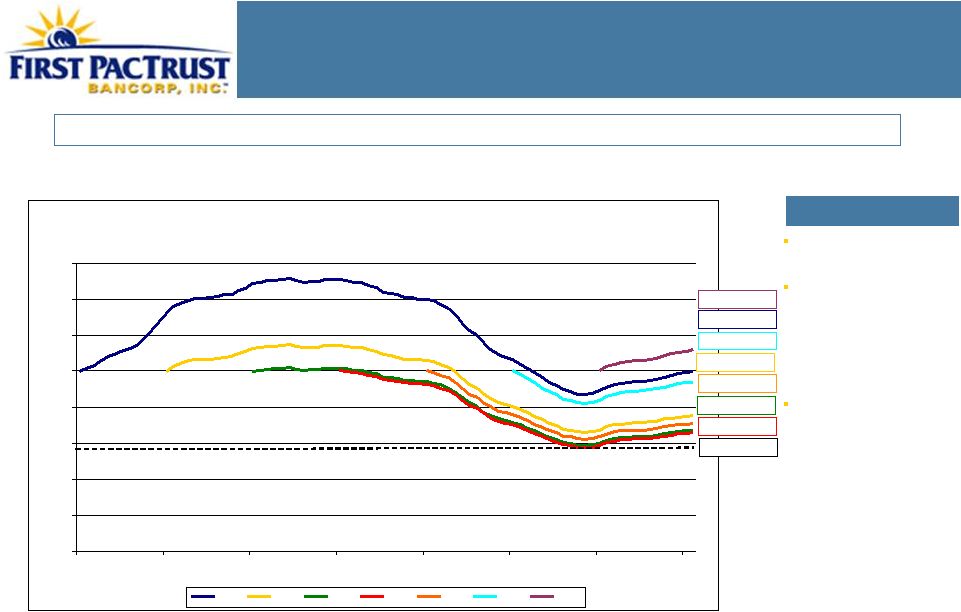
Bank’s Primary Market Area Recovering
(1)
Source: S&P Case Shiller
Home Price Index for San Diego County.
First
PacTrust’s
primary
market
area
of
San
Diego
has
exhibited
strong
recovery
rates
in
home
prices.
Leading Southern
California recovery
3
highest home
price increase (14%)
since 2009 as
measured by S&P
Case Shiller
Home
Price index
Stable economy with
vast and growing
military presence and
robust tech industry
San Diego Market
San Diego County Home Prices
(1)
0%
20%
40%
60%
80%
100%
120%
140%
160%
2003
2004
2005
2006
2007
2008
2009
2010
2003
2004
2005
2006
2007
2008
2009
58% Avg
LTV
2009: 112%
2003: 100%
2008: 94%
2004: 76%
2007: 71%
2005: 67%
2006: 66%
rd |
  10
Current Stock Price Relative to Peers
FPTB’s
offering price is at a significant discount to peers at 3.0x core earnings and 59%
of current tangible book value.
(1) Source: SNL. Core earnings defined as pre-tax,
pre-provision earnings and 2010 projection is per 8-k released on July 27, 2010. Stock prices as of 10/22/10.
Market
Valuation
of
Comparable
Banks
(1)
Dividend Paying Banks, < $2.5b in Assets, Raised > $30m since 1/2009
Company Name
Ticker
State
Stock
Price
TBV
Price /
TBV
2010E Core
Earn's ($mm)
Core P/E
Tower Bancorp, Inc.
TOBC
PA
22.19
$21.06
105%
$19.2
8.2x
Orrstown Financial Services, Inc.
ORRF
PA
25.00
17.20
145%
32.7
6.1
Univest Corporation of Pennsylvania
UVSP
PA
19.09
12.99
147%
NA
NA
First of Long Island Corporation
FLIC
NY
25.13
17.61
143%
26.2
8.3
CNB Financial Corporation
CCNE
PA
13.77
8.75
157%
19.9
8.4
Lakeland Financial Corporation
LKFN
IN
19.12
14.99
128%
61.3
5.0
Sterling Bancorp
STL
NY
9.26
6.17
150%
41.4
6.0
MidSouth Bancorp, Inc.
MSL
LA
13.61
11.00
124%
11.1
11.9
Bank of Commerce Holdings
BOCH
CA
3.81
4.71
81%
18.3
3.5
Pacific Continental Corporation
PCBK
OR
8.80
8.15
108%
23.2
7.0
Washington Banking Company
WBCO
WA
13.74
8.98
153%
29.1
7.2
CenterState Banks, Inc.
CSFL
FL
8.60
7.64
113%
18.4
14.0
Cardinal Financial Corporation
CFNL
VA
10.18
7.33
139%
41.2
7.1
Average
130%
7.7x
Median
139%
7.2
First Pacific Trust (Offering Price)
Status Quo TBV
FPTB
CA
$11.00
$18.79
59%
$15.8
3.0x
Pro Forma TBV
11.00
14.01
79% |
 11
Transaction Improves Bank’s Capital Markets Exposure
PRE RECAPITALIZATION
1. Limited Information to Investor Community
No analyst coverage
No earnings conference calls
2. Limited Trading Liquidity
Limited trading liquidity which reduces the Bank’s
appeal to larger investors
Stock trades at a liquidity discount
Limited capital markets activities
3. Limited Growth Capital and Capabilities
With its historical capital levels and strategic focus,
the Bank has not been perceived as a high growth
institution or market consolidator
Absence of robust commercial real estate or C&I
lending capabilities has created market perception of
Bank as an SFR portfolio lender, unable to take
advantage of lending opportunities
First PacTrust
is addressing each of these issues and seeks to narrow its valuation gap from its
peers evidenced by the enhanced trading volume and information to the
investor community to-date. POST RECAPITALIZATION
1. Enhanced Information to Investor Community
Pursue sell-side analyst coverage and increase
investor communications. For instance, analyst
research coverage initiated by Baird & Co. (OW, $15
PT)
2. Enhanced Trading Liquidity
Recap will more than double the Bank’s share count
and increase liquidity. For instance, month-to-date
average daily volume is over 70,000 shares
compared to 5,900 shares traded YTD preceding
announcement of transaction
3. Enhanced Growth Capital and Capabilities
With an over-capitalized balance sheet and an
enhanced management team, the Bank is in a better
position to take advantage of market opportunities
It is expected that the new management personnel
will bring significant CRE and C&I lending and risk
management capabilities |
 Appendix
12 |
 Franchise Map and Branches
Chula Vista Main Branch
Chula Vista Admin Center
El Cajon Branch
Balboa Branch
Rancho Bernardo Branch
Temecula Branch
Riverside Branch
Chula Vista
Riverside
Mini Branches
13 |
 Pacific Trust Bank Loan Composition
Pacific Trust Bank’s loan portfolio consists predominantly of 1-4 family
loans making up 84% of the Bank’s gross loans.
Loan Locations
Loan Breakdown as of 9/30/10
Construction
0.0%
Consumer
1.6%
C&I
0.1%
1-4 Family
83.7%
Multi Family
4.8%
Commercial RE
7.4%
Land
2.5%
14 |
 15
Strong Capital Position
First
PacTrust’s
capital
ratios
exceed
“well-capitalized”
levels
and
will
be
further
enhanced
due
to
the
private placement.
Regulatory Ratios
5.00%
6.00%
10.00%
9.24%
9.80%
12.90%
14.15%
14.59%
20.29%
21.54%
15.10%
0.0%
2.5%
5.0%
7.5%
10.0%
12.5%
15.0%
17.5%
20.0%
22.5%
25.0%
Tier 1 Leverage Ratio
Tier 1 Risk-Based Capital
Total Risk-Based Captial
TCE Ratio
Well Capitalized Min
Status Quo
Pro Forma
Note: Ratios as of 9/30/10. Pro forma capital ratios shown above represent levels if all
proceeds are downstreamed to the Bank; however, current plans include $11.0 million in
proceeds to be downstreamed to the Bank upon close of the transaction with remaining proceeds to stay
at the holding company. The additional proceeds will be downstreamed to the Bank as
necessary. |
 16
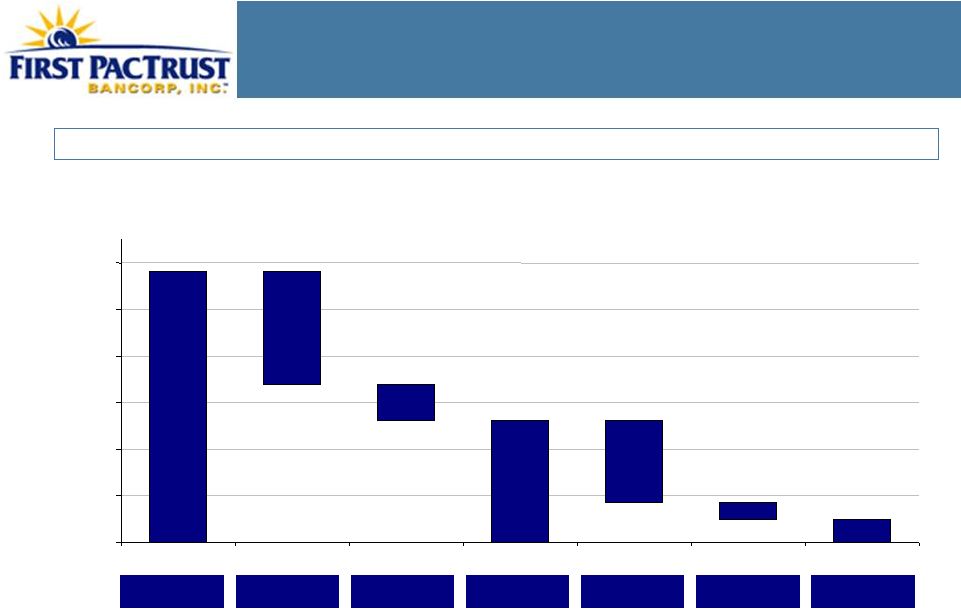
Non-Performing Asset Overview
(1)
Non-performing Assets (NPA) = Non-performing Loans (NPLs) + OREOs.
(2)
Net NPL Exposure is NPLs
net of loan loss reserves and tax adjustment.
Of the
$58.1
million
in
NPAs,
nearly
43%
are
TDRs
and
the
$7.8
million
in
REOs
consist
of
6
properties.
(1)
Non-Performing Asset Analysis
Current Non-
Non-
Loan Loss
Tax
Net NPL
Perf Assets
TDRs
OREOs
Perf Loans
Reserves
Adjustment
Exposure
(2)
$5.0m
($3.6m)
($17.6m)
(2.01%)
$25.4m
3.34%
($7.8m)
(0.94%)
($24.9m)
(2.75%)
$58.1m
7.02%
$0.0
$10.0
$20.0
$30.0
$40.0
$50.0
$60.0 |
 17
Non-Performing Loans (NPLs)
Pacific Trust Bank has 37 credits that
are currently non-performing for a total
balance of $25.4 million
Pacific Trust Bank completes an
impairment analysis on all non-
performing loans and establishes
reserves or completes charge-offs to
reduce the net carrying value of each
asset to no more than 90% of the most
recent value
Non-Performing Loans (NPLs)
Loan Type
# of
Loans
Book Value
Average Loan
Size
1-4 Family Subtotal
25
15,536,740
621,470
Multi-Family Subtotal
6
1,976,639
329,440
CRE Subtotal
1
1,392,107
1,392,107
C&I Subtotal
-
-
-
Land Subtotal
3
6,461,700
2,153,900
Other Subtotal
2
6,364
3,182
Total
37
25,373,550
685,772
Note: Troubled debt restructurings not included, however, see next slide for
breakdown. |
 Troubled Debt Restructurings (TDRs)
Pacific Trust Bank has completed
troubled debt restructurings (TDRs)
for 28 properties valued at $24.9
million
Most
TDRs
are
performing
as
agreed, however, they must do so
for 6-12 consecutive months in
order to be removed from the NPA
category
All
TDRs
have
been
recently
appraised with net loan balance
(net of specific reserves or charge-
offs) of no more than 90% of
appraised value
Non-Performing Loans (NPLs)
Loan Type
# of
Loans
Book Value
Average Loan
Size
1-4 Family Subtotal
20
10,309,914
515,496
Multi-Family Subtotal
2
8,501,677
4,250,839
CRE Subtotal
-
-
-
C&I Subtotal
-
-
-
Land Subtotal
3
5,948,400
1,982,800
Other Subtotal
3
150,256
50,086
Total
28
24,910,247
889,652
18 |
 OREOs
Pacific Trust Bank holds 6 OREO assets with a net value
of $7.8 million
5 REO assets are for SFR (all have been appraised in
2010)
4 SFR are located in San Diego and 1 is located in
Rancho Santa Fe
2 SFR are currently in escrow to be sold, an
another one is leased through May 2011
1 REO asset is a construction loan
Asset has been charged-off / reserved to a level
equal to 36% of the bank’s initial loan amount
All OREO is carried at
levels no more than 90% of
the most recent appraised
value.
19 |
 20
Securities Overview
Investment Portfolio @ 09/30/2010
Lowest
Maturity
Est. Avg
Original
Coupon
Par/Principal
Purchase
Book
Current
CUSIP #
Investment
Rating
Date
Life
Face Value
Rate
Value
Price
Yield
Book Value
Pacific Trust Bank Security Portfolio (Bank)
Government/Agency Securities:
3128X7MN1
FHLMC Note
AAA
05/05/2011
0.6 Years
5,000,000
3.500%
5,000,000
104.2180
1.372%
5,062,747
Total Government/Agency Notes
5,000,000
3.500%
5,000,000
1.372%
5,062,747
Mortgage-Backed Securities:
22944BDK1
CSMC 2007-5 7A2
BBB
10/25/2024
3.5 Years
2,300,000
5.000%
1,223,668
97.0000
5.943%
1,186,958
02640CAE5
AGFMT 2009-1 A5
AA
09/25/2048
2.8 Years
5,000,000
5.750%
5,000,000
102.0000
5.001%
5,094,478
76110HTX7
RALI 2004-QS7 A3
AAA
05/25/2034
2.7 Years
2,000,000
5.500%
1,152,685
100.6250
5.208%
1,159,322
05948KCR8
BOAA 2003-5 2A1
A
07/25/2018
3.0 Years
3,800,000
5.000%
1,027,453
100.6250
4.730%
1,033,491
12667FU45
CWALT 2005-J1 4A1
B+
08/25/2017
2.2 Years
20,000,000
6.000%
2,364,034
100.9063
5.474%
2,384,827
74958EAA4
RFMSI 2006-S12 1A1
B+
12/25/2021
2.8 Years
5,160,000
5.500%
1,483,021
102.1563
4.093%
1,514,337
12643CCA7
CSMC 2010-1R 17A1
AAA
06/27/2036
0.7 Years
3,758,000
4.750%
2,749,287
101.2500
1.928%
2,767,931
2254W0PE9
CSFB 2005-11 8A1
B
12/25/2035
1.4 Years
3,000,000
5.250%
1,463,863
97.5000
6.322%
1,432,647
12643CGA3
CSMC 2010-1R 49A1
AAA
07/27/2036
1.2 Years
2,559,000
4.750%
2,118,160
101.3750
2.508%
2,136,766
46633PAJ1
JPMRR 2009-7 5A1
AAA
02/27/2037
2.0 Years
3,335,000
6.000%
2,652,886
98.1406
6.547%
2,607,553
74928QAT3
RBSSP 2009-9 8A4
AAA
10/26/2037
2.7 Years
1,296,444
6.000%
1,115,909
95.1875
7.812%
1,066,740
12642JCG0
CSMC 2009-11R 3A1
AAA
10/26/2037
2.6 Years
4,990,000
6.500%
3,962,975
96.9375
7.778%
3,848,657
92922F4A3
WAMU 2005-AR14 1A1
BB-
12/25/2035
0.7 Years
4,050,000
4.771%
977,351
81.5000
13.401%
853,451
07384YMB9
BSABS 2003-AC5 A2
AAA
10/25/2033
4.8 Years
11,460,000
5.000%
2,522,618
83.2500
8.382%
2,114,770
05955EAK9
BAFC 2009-R4A 2A4
AAA
07/26/2035
1.4 Years
2,910,438
5.250%
1,342,058
87.5000
9.757%
1,214,191
74928FAD2
RBSSP 2009-3 1A4
AAA
11/26/2035
1.2 Years
3,000,000
5.500%
1,607,486
86.7500
9.482%
1,434,188
74928EAC7
RBSSP 2009-2 2A1
AAA
05/26/2036
1.4 Years
5,000,000
5.500%
3,133,116
89.2500
11.453%
2,822,240
12667GQS5
CWALT 2005-20CB 4A1
B-
07/25/2020
3.3 Years
12,000,000
5.250%
4,432,339
81.5000
12.044%
3,670,692
743873BK6
PFMLT 2005-2 1A1A
BB-
10/25/2035
6.3 Years
9,000,000
2.820%
2,347,782
78.7500
10.142%
1,851,873
74928DAG0
RBSSP 2009-1 4A1
AAA
10/26/2035
1.1 Years
2,500,000
5.500%
1,218,327
90.5000
10.683%
1,135,481
12669D2Z0
CWHL 2003-HYB2 2A1
AAA
07/19/2033
2.0 Years
20,000,000
3.964%
1,664,899
81.0000
10.535%
1,350,411
05954XAJ1
BAFC 2008-R3 3A4
AAA
01/25/2037
2.1 Years
6,000,000
6.000%
4,309,242
87.8125
10.455%
3,864,017
32051GFV2
FHAMS 2005-FA1 2A1
B+
02/25/2020
3.5 Years
22,376,000
5.000%
8,355,534
81.8750
11.212%
6,989,137
863576CE2
SASC 2005-6 4A1
B
05/25/2035
3.6 Years
6,595,000
5.000%
2,514,862
69.5000
13.633%
1,761,574
Total Non-Agency CMOs/REMICs
162,089,882
5.296%
60,739,555
8.262%
55,295,731
38374VQ77
GNR 2009-50 A
AAA
08/20/2036
1.2 Years
9,950,000
5.500%
6,051,177
104.5625
2.400%
6,298,346
31358LV94
FNMA REMIC 1992-30 F
AAA
03/25/2022
3.4 Years
2,000,000
0.781%
3,144
99.9688
0.786%
3,144
362095HK0
GNMA 62334
AAA
07/15/2013
0.8 Years
100,000
12.000%
379
100.0000
12.000%
379
Total Agency MBS/CMO/REMICs
12,050,000
5.498%
6,054,699
2.400%
6,301,869
Total Mortgage Backed Securities
5.314%
66,794,254
7.662%
61,597,600
Total Negotiable Securities
5.188%
71,794,254
7.185%
66,660,347
First Pactrust Bancorp Securities Portfolio (Holding Company)
Re-REMIC Accural Tranches:
05955EAJ2
BAFC 2009-R4 2A3
NR
07/26/2035
3.0 Years
359,718
5.250%
390,812
0.5000
0.000%
0
74928FAC4
RBSSP 2009-3 1A3
NR
11/26/2035
3.3 Years
409,090
5.500%
444,187
0.5000
0.000%
0
74928EAD5
RBSSP 2009-2 2A2
NR
05/26/2036
3.7 Years
1,896,551
5.500%
2,077,977
0.5000
0.000%
0
74928DAH8
RBSSP 2009-1 4A2
NR
10/26/2035
2.7 Years
277,777
5.500%
305,768
0.5000
0.000%
0
05954XAN2
BFAC 2008-R3 3A3
NR
01/25/2037
10.4 Years
3,230,769
6.000%
3,605,405
0.5000
0.000%
0
Total Re-REMIC Z Tranches
6,173,905
5.750%
6,824,148
0.000%
0
Total Mortgage Backed Securities
5.750%
6,824,148
0.000%
0
Total Negotiable Securities
5.750%
6,824,148
0.000%
0 |
 21
Non-GAAP Financial Information
This presentation contains certain financial information determined by methods
other than in accordance with accounting principles generally accepted in
the United States (“GAAP”). These non-GAAP financial measures include tangible
common equity, tangible common equity per share and core (pre-tax,
pre-provision) earnings. Tangible common equity and tangible common
equity per share are calculated by excluding preferred equity from
stockholders’
equity and excluding any intangible assets (of which we currently have none) from
assets. We believe that this is consistent with the treatment by the
Office of Thrift Supervision, our regulatory agency, which excludes any
intangible assets from the calculation of risk-based capital ratios.
Accordingly, management believes that these non-GAAP financial measures
provide information to investors that is useful in understanding the basis of our risk-based capital ratios.
Core (pre-tax, pre-provision) earnings are calculated by adding provision
for loan losses to income before income taxes. Management believes that
presenting core (pre-tax, pre-provision) earnings is useful in assessing our core performance
and trends, particularly during periods of economic stress.
Reconciliations of the non-GAAP measures to the comparable GAAP measures are
provided below. The
following
table
presents
a
reconciliation
of
tangible
common
equity
to
stockholders’
equity
(dollars
in
thousands):
As of 9/30/10
Pro Forma
(1)
Stockholders’
equity:
$
98,867
$
135,869
Less: Intangible assets
0
0
Tangible equity
98,867
135,869
Less: Preferred equity
(19,123)
0
Tangible common equity
$
79,744
$
135,869
Non-GAAP Financial Information
(1)
Giving effect to estimated net proceeds from private placement of $56.15
million. Assumes net proceeds used in part to redeem TARP preferred stock. |
 The
following
table
presents
a
reconciliation
of
tangible
common
equity
per
share
to
stockholders’
equity
per
share:
As of 9/30/10
Pro Forma
(1)
Stockholders’
equity per share:
$
23.29
$
14.01
Less: Effect of intangible assets
0.00
0.00
Tangible equity per share
23.29
14.01
Less: Preferred equity
(4.50)
0.00
Tangible common equity per share
$
18.79
$
14.01
Non-GAAP Financial Information (Cont.)
(1)
Giving effect to estimated net proceeds from private placement of $56.15
million. Assumes net proceeds are used in part to redeem TARP preferred stock.
22 |
 The following table presents the derivation of the estimated return on equity (ROE)
utilizing the estimated 2010 core earnings and the September 30, 2010 equity
balance: 2010
projected
core
earnings
(1)
$15.765m
Equity as of September 30, 2010
$79.7m
Core Earnings ROE
19.8%
The following table presents the derivation of the estimated return on assets (ROA)
utilizing the 2010 estimated core earnings and the September 30, 2010
asset balance: 2010
projected
core
earnings
(1)
$15.765m
Assets as of September 30, 2010
$862.7m
Core Earnings ROA
1.83%
Non-GAAP Financial Information (Cont.)
(1)
Core earnings projection per 8-K released on July 27, 2010. See footnote 2 on
prior page. 23 |