Attached files
| file | filename |
|---|---|
| 8-K - FORM 8-K - NEW YORK COMMUNITY BANCORP INC | d8k.htm |
 Third Quarter
2010 Investor Presentation
Exhibit 99.1
*
*
*
*
*
*
*
* |
 New
York Community Bancorp, Inc. Page 2
Forward-looking Statements and Associated Risk
Factors
Safe Harbor Provisions of the Private Securities Litigation Reform Act of 1995
This presentation, like many written and oral communications presented by New York Community Bancorp,
Inc. and our authorized officers, may contain certain forward-looking statements regarding
our prospective performance and strategies within the meaning of Section 27A of the Securities Act of
1933, as amended, and Section 21E of the Securities Exchange Act of 1934, as amended. We intend
such forward-looking statements to be covered by the safe harbor provisions for forward-looking statements contained in the Private Securities Litigation Reform Act of 1995, and are including
this statement for purposes of said safe harbor provisions.
Forward-looking statements, which are based on certain assumptions and describe future plans,
strategies, and expectations of the Company, are generally identified by use of the words
“anticipate,” “believe,” “estimate,” “expect,”
“intend,” “plan,” “project,” “seek,” “strive,” “try,” or future or conditional verbs such as “will,” “would,” “should,” “could,” “may,” or
similar expressions. Our ability to predict results or the actual effects of our plans or
strategies is inherently uncertain. Accordingly, actual results may differ materially from anticipated results.
There are a number of factors, many of which are beyond our control, that could cause actual
conditions, events, or results to differ significantly from those described in the forward-looking
statements. These factors include, but are not limited to: general economic conditions, either
nationally or in some or all of the areas in which we and our customers conduct our respective
businesses; conditions in the securities markets and real estate markets or the banking industry;
changes in interest rates, which may affect our net income, prepayment penalty income, and other
future cash flows, or the market value of our assets, including our investment securities; changes in
deposit flows and wholesale borrowing facilities; changes in the demand for deposit, loan, and
investment products and other financial services in the markets we serve; changes in our credit
ratings or in our ability to access the capital markets; changes in our customer base or in the financial
or operating performances of our customers’ businesses; changes in real estate values, which
could impact the quality of the assets securing the loans in our portfolio; changes in the quality or
composition of our loan or securities portfolios; changes in competitive pressures among financial
institutions or from non-financial institutions; the ability to successfully integrate any assets,
liabilities, customers, systems, and management personnel we may acquire, including those acquired in
the AmTrust Bank and Desert Hills Bank transactions, into our operations and our ability to
realize related revenue synergies and cost savings within expected time frames; our use of derivatives
to mitigate our interest rate exposure; our ability to retain key members of management; our
timely development of new lines of business and competitive products or services in a changing
environment, and the acceptance of such products or services by our customers; any breach in
performance by the Community Bank under our loss sharing agreements with the FDIC; any interruption or
breach of security resulting in failures or disruptions in customer account management, general
ledger, deposit, loan, or other systems; any interruption in customer service due to circumstances beyond our control; potential exposure to unknown or contingent liabilities of companies we
have acquired or target for acquisition, including those of AmTrust Bank and Desert Hills Bank; the
outcome of pending or threatened litigation, or of other matters before regulatory agencies,
whether currently existing or commencing in the future; changes in our estimates of future reserves
based upon the periodic review thereof under relevant regulatory and accounting requirements;
changes in our capital management policies, including those regarding business combinations,
dividends, and share repurchases, among others; changes in legislation, regulation, policies, or
administrative practices, whether by judicial, governmental, or legislative action, including, but not
limited to, the effect of final rules amending Regulation E that prohibit financial institutions from
assessing overdraft fees on ATM and one-time debit card transactions without a consumer’s
affirmative consent, the impact of the Dodd-Frank Wall Street Reform and Consumer Protection Act, and
other changes pertaining to banking, securities, taxation, rent regulation and housing, environmental
protection, and insurance, and the ability to comply with such changes in a timely manner;
additional FDIC special assessments or required assessment prepayments; changes in accounting
principles, policies, practices, or guidelines; environmental conditions that exist or may exist on
properties owned by, leased by, or mortgaged to the Company; operational issues stemming from, and/or
capital spending necessitated by, the potential need to adapt to industry changes in
information technology systems, on which we are highly dependent; the ability to keep pace with, and
implement on a timely basis, technological changes; changes in the monetary and fiscal policies
of the U.S. Government, including policies of the U.S. Department of the Treasury and the Board of
Governors of the Federal Reserve System; war or terrorist activities; and other economic,
competitive, governmental, regulatory, and geopolitical factors affecting our operations, pricing, and
services. For a discussion of these and other risks that may cause actual results to differ from expectations,
please refer to our Annual Report on Form 10-K for the year ended December 31, 2009, including
the section entitled “Risk Factors,” on file with the U.S. Securities and Exchange
Commission (the “SEC”). In addition, it should be noted that we routinely evaluate opportunities to expand through acquisition
and frequently conduct due diligence activities in connection with such opportunities. As a result,
acquisition discussions and, in some cases, negotiations, may take place at any time, and acquisitions
involving cash, debt, or equity securities may occur. Furthermore, the timing and occurrence or non-occurrence of events may be subject to circumstances
beyond our control. Readers are cautioned not to place undue reliance on the forward-looking statements contained
herein, which speak only as of the date of this presentation. Except as required by applicable law or
regulation, we undertake no obligation to update these forward-looking statements to reflect
events or circumstances that occur after the date on which such statements were made. |
 New
York Community Bancorp, Inc. Page 3
We rank among the top 25 bank holding companies
in the U.S.
With
assets
of
$41.7
billion
at
9/30/10,
we
are
the
22nd
largest
bank
holding
company
in
the nation.
With
deposits
of
$22.2
billion
at
9/30/10
and
277
branches
in
Metro
New
York,
New
Jersey,
Ohio,
Florida,
and
Arizona,
we
rank
24th
among
the
nation’s
largest
depositories.
We rank among the top three thrift depositories in eight attractive markets: Queens,
Staten Island,
and
Long
Island
in
New
York;
Essex
County
in
New
Jersey;
Broward
and
Palm
Beach
Counties
in
Florida;
greater
Cleveland
in
Ohio;
and
greater
Phoenix
in
Arizona.
With a portfolio of $16.8 billion at the end of September, we are a leading producer
of multi-family loans in New York City.
With a market cap of $7.3 billion at 10/26/10, we rank 16th among the nation’s
publicly traded banks and thrifts.
Note: Except as otherwise indicated, all industry data was provided by SNL
Financial as of 10/26/10. |
 New
York Community Bancorp, Inc. Page 4
We have a consistent business model that focuses
on building value while building the Company.
(a)
Please see page 34 for a reconciliation of our GAAP and operating efficiency
ratios. Our total return to shareholders increased at a CAGR of 33.1% from
11/23/93 to 10/26/10. Multi-family Lending
$27.4 billion of multi-family loans have been originated since
2000, including $1.5
billion in the first nine months of 2010.
Strong Credit Standards/
Superior Asset Quality
Net charge-offs represented 0.16% of average loans in the
first nine months of 2010, as compared to 2.09% for the SNL
Bank and Thrift Index.
Efficient Operation
Our operating efficiency ratio has consistently ranked in the
top 3% of all banks and thrifts, and was 36.12% in 3Q 2010.
(a)
Growth through
Acquisitions
We completed ten acquisitions from 2000 to 2010, including
our FDIC-assisted acquisitions of AmTrust Bank on December
4, 2009 and Desert Hills Bank on March 26th. |
  3rd
Quarter 2010 Performance Highlights
*
*
*
* |
 New
York Community Bancorp, Inc. Page 6
Our 3Q 2010 performance reflects the merits of our
business model.
(a)
Please see page 36 for a reconciliation of our GAAP and operating earnings.
(b)
Please see page 37 for a reconciliation of our GAAP and operating non-interest
income and our GAAP and operating revenues. (c)
Please see page 34 for a reconciliation of our GAAP and operating efficiency
ratios. (dollars in thousands, except per share data)
|
 New
York Community Bancorp, Inc. Page 7
Our balance sheet has been strengthened over the
past nine months. |
 New
York Community Bancorp, Inc. Page 8
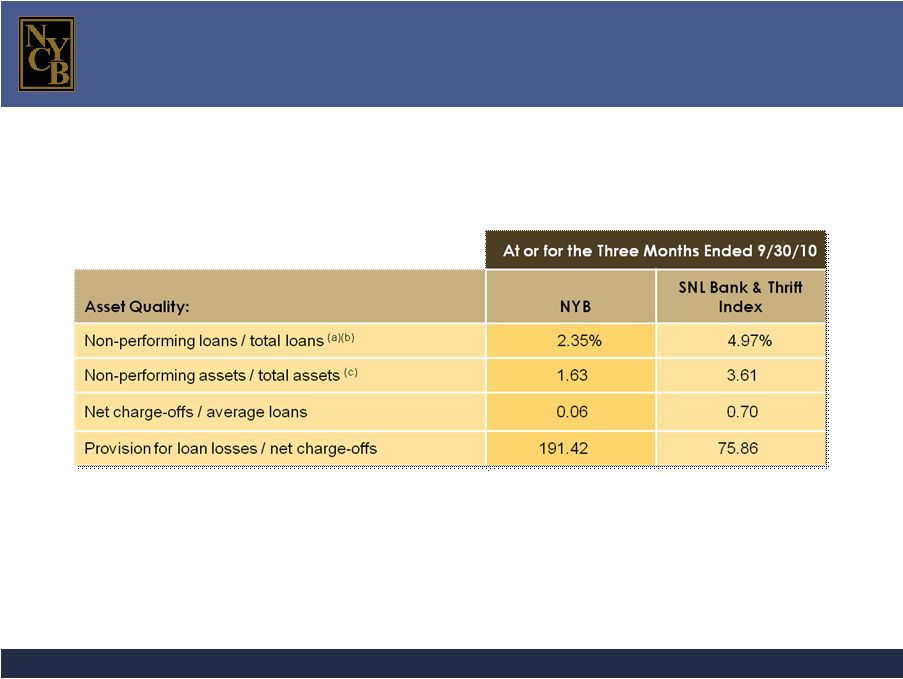
Our asset quality measures continued to compare
favorably with those of our industry as a whole. (a)
Non-performing loans are defined as non-accrual loans and loans 90 days or
more past due but still accruing interest. (b)
Non-performing loans exclude covered loans.
(c)
Non-performing assets exclude covered assets. |
 New
York Community Bancorp, Inc. Page 9
(a)
Please see page 38 for a reconciliation of our GAAP and non-GAAP capital
measures. Our capital strength reflects the growth of our earnings
and our ability to access the capital markets.
Our dividend has been a significant component of our total return to shareholders
since our first year of public life.
In October 2010, we declared our 27th consecutive quarterly cash
dividend of $0.25
per share. |
  Our
Business Model: Growth through Acquisitions
*
*
*
* |
 New
York Community Bancorp, Inc. Page 11
We have completed 10 acquisitions since 2000.
Note:
The number of branches indicated reflects the number of branches in our current
franchise that stemmed from each transaction. Transaction Type:
Savings Bank
Commercial Bank
Branch
FDIC |
 New
York Community Bancorp, Inc. Page 12
As a result of our acquisitions, we rank among the
top 25 financial institutions in the nation.
(in thousands)
DEPOSITS
Rank
Company
Total Deposits
1
Bank of America Corporation
$977,322,000
2
JPMorgan Chase & Co.
903,138,000
3
Citigroup Inc.
850,095,000
4
Wells Fargo & Company
814,512,000
5
U.S. Bancorp
187,406,000
6
PNC Financial Services Group, Inc.
179,183,000
7
Bank of New York Mellon Corporation
148,981,000
8
SunTrust Banks, Inc.
120,344,178
9
Capital One Financial Corporation
119,212,000
10
BB&T Corporation
106,419,000
11
State Street Corporation
105,034,000
12
Regions Financial Corporation
94,978,000
13
Fifth Third Bancorp
81,362,000
14
KeyCorp
61,418,000
15
Northern Trust Corporation
58,445,800
16
M&T Bank Corporation
48,654,623
17
Huntington Bancshares Incorporated
41,072,371
18
Zions Bancorporation
40,960,140
19
Comerica Incorporated
40,631,000
20
Marshall & Ilsley Corporation
38,201,000
21
Popular, Inc.
27,740,000
22
Synovus Financial Corp.
25,236,225
23
Hudson City Bancorp, Inc.
24,914,621
24
New York Community Bancorp, Inc.
22,227,391
25
City National Corporation
18,413,606
ASSETS
Rank
Company
Total Assets
1
Bank of America Corporation
$2,327,811,000
2
JPMorgan Chase & Co.
2,141,595,000
3
Citigroup Inc.
1,983,280,000
4
Wells Fargo & Company
1,220,784,000
5
U.S. Bancorp
290,654,000
6
PNC Financial Services Group, Inc.
260,133,000
7
Bank of New York Mellon Corporation
254,157,000
8
Capital One Financial Corporation
196,933,000
9
SunTrust Banks, Inc.
174,702,690
10
State Street Corporation
172,964,000
11
BB&T Corporation
157,230,000
12
Regions Financial Corporation
133,498,000
13
Fifth Third Bancorp
112,322,000
14
KeyCorp
94,043,000
15
Northern Trust Corporation
80,723,400
16
M&T Bank Corporation
68,246,837
17
Hudson City Bancorp, Inc.
60,616,632
18
Comerica Incorporated
55,004,000
19
Huntington Bancshares Incorporated
53,246,776
20
Marshall & Ilsley Corporation
51,887,000
21
Zions Bancorporation
51,047,776
22
New York Community Bancorp, Inc.
41,706,438
23
Popular, Inc.
40,821,000
24
Synovus Financial Corp.
30,954,761
25
First Horizon National Corporation
25,384,181
Balance sheet data as of 9/30/10. Market data as of 10/26/10.
MARKET CAPITALIZATION
Rank
Company
Market Cap
1
JPMorgan Chase & Co.
$146,039.8
2
Wells Fargo & Company
135,881.8
3
Citigroup Inc.
121,427.3
4
Bank of America Corporation
113,380.9
5
U.S. Bancorp
45,916.9
6
Bank of New York Mellon Corporation
31,048.6
7
PNC Financial Services Group, Inc.
28,404.0
8
State Street Corporation
20,555.2
9
Capital One Financial Corporation
17,094.7
10
BB&T Corporation
15,605.1
11
SunTrust Banks, Inc.
12,798.8
12
Northern Trust Corporation
12,247.8
13
Fifth Third Bancorp
10,180.5
14
M&T Bank Corporation
8,972.8
15
Regions Financial Corporation
8,138.9
16
New York Community Bancorp, Inc.
7,312.8
17
KeyCorp
7,086.6
18
Comerica Incorporated
6,265.2
19
Hudson City Bancorp, Inc.
6,035.2
20
People's United Financial, Inc.
4,638.9
21
Huntington Bancshares Incorporated
4,026.7
22
Zions Bancorporation
3,797.5
23
Marshall & Ilsley Corporation
3,210.1
24
Cullen/Frost Bankers, Inc.
3,183.2
25
BOK Financial Corporation
3,077.3 |
 New
York Community Bancorp, Inc. Page 13
Largely reflecting our acquisition strategy, we
currently have 277 locations in five states.
Metro New York
157 Branches
Ohio
29 Branches
New Jersey
52 Branches
Florida
25 Branches
Arizona
14 Branches |
 New
York Community Bancorp, Inc. Page 14
Our FDIC-assisted AmTrust
transaction has enhanced our
franchise, our balance sheet, and our earnings capacity.
AmTrust
Transaction
Franchise Expansion:
Added 29 branches in Ohio, 25 in Florida, and 11 in Arizona
Improved Funding Mix:
Provided deposits of $8.2 billion in December 2009
Enhanced Liquidity:
Provided cash and cash equivalents of $4.0 billion, and $760.0
million of available-for-sale securities
Stronger Tangible Capital:
Raised $864.9 million through a secondary common stock
offering in December to capitalize the acquisition; resulted in
a 27% linked-quarter increase in tangible book value per share
in 4Q 2009
Meaningful Revenue Growth:
The mortgage banking operation generated revenues of $143.5
million in the first nine months of 2010, including $76.5 million
in the third quarter.
Enhanced Earnings Capacity:
Immediately beneficial to our 4Q 2009 earnings; contributed
significantly to year-over-year earnings growth in the first nine
months of 2010 |
 New
York Community Bancorp, Inc. Page 15
Our FDIC-assisted Desert Hills transaction strengthened our
franchise in Arizona, as well as our efficiency and product mix.
Desert Hills Transaction
Franchise Expansion:
Added six more branches to our Arizona franchise and
increased our deposit market share
Greater Efficiency:
Three of the six branches acquired were consolidated into
neighboring AmTrust branches, resulting in a more efficient
franchise.
Enhanced Liquidity:
Provided cash and cash equivalents of $140.9 million
Stronger Tangible Capital:
Raised $28.9 million through our DRP to capitalize the
acquisition, further enhancing our tangible book value per
share
Enhanced Product Mix:
Provided the opportunity to introduce business banking
solutions throughout our Arizona market |
 New
York Community Bancorp, Inc. Page 16
We have a meaningful share of deposits in several of the
markets we serve. |
 New
York Community Bancorp, Inc. Page 17
Total deposits: 32.4% CAGR
Core deposits: 38.3% CAGR
Demand deposits: 43.4% CAGR
(in millions)
CDs
NOW, MMAs, and Savings
Demand deposits
Deposits
Total Deposits:
$12,168
$12,694
$13,236
$14,376
Our deposit growth has been largely acquisition-
driven.
$22,316
$1,086
$22,227 |
 New
York Community Bancorp, Inc. Page 18
(in millions)
Non-Covered Loan Portfolio
Multi-family
CRE
All Other Loans (includes loans held for sale)
Covered Loan Portfolio
Loans Outstanding
$1,611
$17,029
$19,653
Total Loans:
$677
$6,332
$4,971
Total Originations:
(a)
$29,447
$20,363
$4,853
While acquisitions have contributed to the growth of our loan
portfolio, the bulk of our loan growth has been organic.
$22,192
$5,881
$28,393
$4,280
(a)
Originations of loans held for sale totaled $888.5 million in 2009 and $6.9 billion
in the first nine months of 2010. Multi-family loans: 26.5% CAGR
Total loans: 31.0% CAGR
$9,761 |
 New
York Community Bancorp, Inc. Page 19
As a result of our acquisition of AmTrust’s
mortgage banking operation, we
have
become
a
leading
aggregator
of
agency-conforming
one-
to
four-
family residential loans.
Funded 1-4 Family
Loan Production
YTD Total: $6.9 billion
(in millions)
Page 19
New York Community Bancorp, Inc. |
  Our
Business Model: Multi-family Loan Production
*
*
*
* |
 New
York Community Bancorp, Inc. Page 21
(in millions)
Multi-family Loan Portfolio
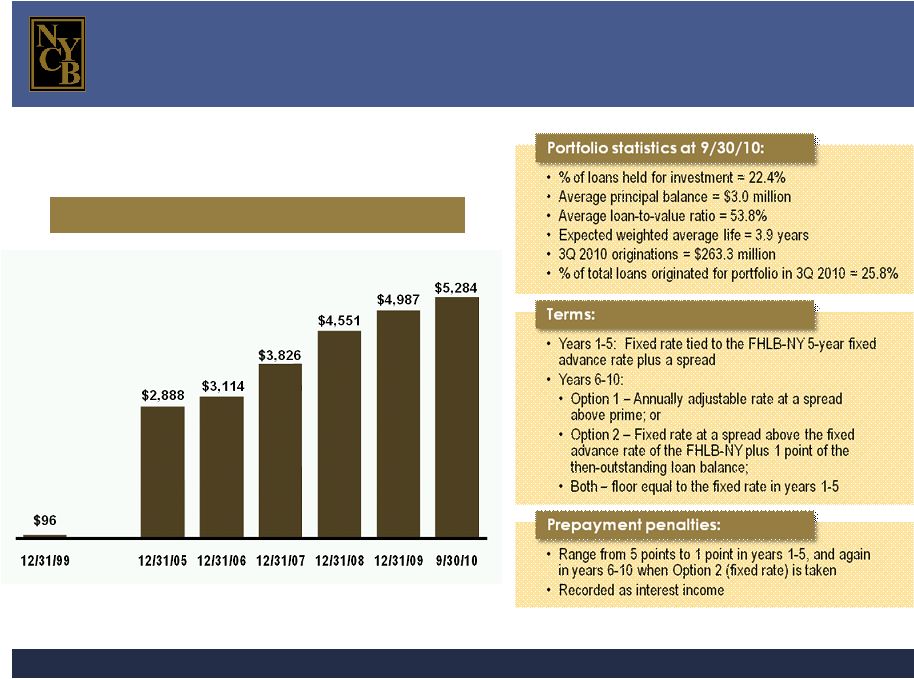
Multi-family loans have grown at a CAGR of 26.5%
since 12/31/99.
|
 New
York Community Bancorp, Inc. Page 22
(in millions)
Commercial Real Estate Loan Portfolio
Our commercial real estate loans feature the same
structure as our multi-family loans.
|
  Our
Business Model: Asset Quality
*
*
*
*
*
* |
 New
York Community Bancorp, Inc. Page 24
Both historically and currently, we have been
distinguished by our low level of net charge-offs.
Net Charge-offs / Average Loans
NYB
SNL Bank and Thrift Index
48-Month Total
NYB: 0.17%
SNL Bank and Thrift Index: 4.86%
45-Month Total
NYB: 0.32%
SNL Bank and Thrift Index: 7.25% |
 New
York Community Bancorp, Inc. Page 25
The quality of our loan portfolio continues to exceed
that of our industry, as it has in the past.
NYB
SNL Bank and Thrift Index
Non-performing Loans / Total Loans
(a)
(a)
Non-performing loans are defined as non-accrual loans and loans 90 days or
more past due but still accruing interest. (b)
Non-performing loans exclude covered loans. |
 New
York Community Bancorp, Inc. Page 26
Historically and currently, few of our non-performing loans
have resulted in charge-offs.
(a)
Non-performing loans are defined as non-accrual loans and loans 90 days or
more past due but still accruing interest. (b)
Non-performing loans exclude covered loans.
At or for the 12 Months Ended December 31,
At or for the
3 Months Ended
Last Credit Cycle
Current Credit Cycle
1990
1991
1992
1993
2007
2008
2009
9/30/2010
NPLs / Total Loans
(a)(b)
2.48%
2.10%
2.83%
1.51%
0.11%
0.51%
2.04%
2.35%
NCOs / Average Loans
0.00%
0.04%
0.07%
0.06%
0.00%
0.03%
0.13%
0.06%
Difference
248 bp
206 bp
276 bp
145 bp
11 bp
48 bp
191 bp
229 bp |
 New
York Community Bancorp, Inc. Page 27
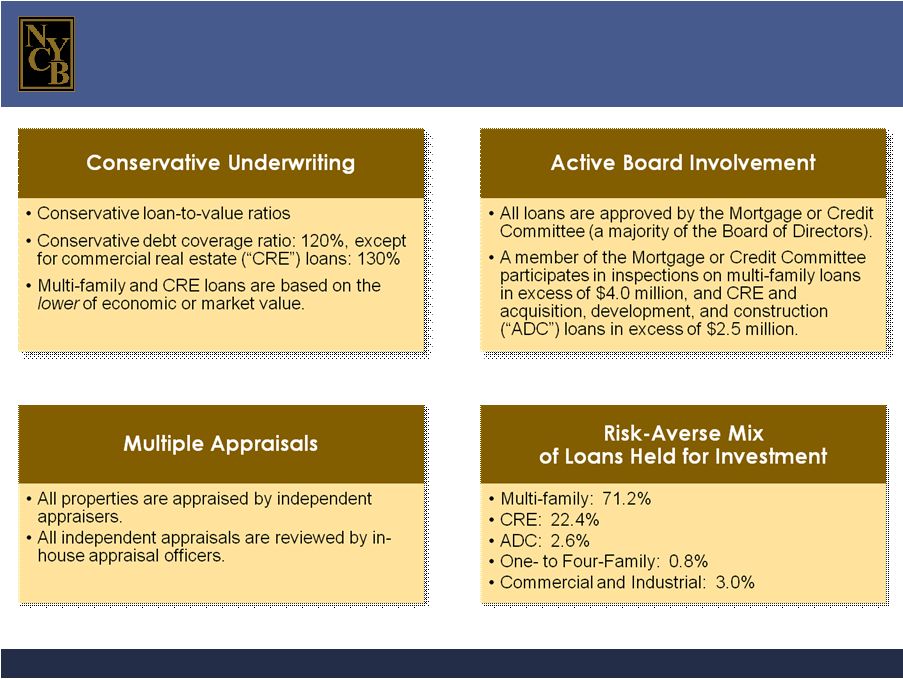
The quality of our assets reflects the nature of our multi-family
lending niche and our strong underwriting standards. |
 New
York Community Bancorp, Inc. Page 28
All the loans acquired in the AmTrust and Desert Hills transactions are
covered by FDIC loss sharing agreements, thus mitigating credit risk.
(in millions)
Total covered assets: $4.5 billion
Covered Assets
9/30/10
1-4 Family
$4,012.7
Other Loans
$461.0
(a)
Includes covered OREO as well as covered loans.
Percent of total assets: 10.9%
OREO
$56.9 |
  Our
Business Model: Efficiency
*
*
*
*
*
* |
 New
York Community Bancorp, Inc. Page 30
Our operating efficiency ratio was 36.12%
in 3Q 2010, well below
the SNL Bank and Thrift Index efficiency ratio of 59.44%.
(a)
Please see pages 34 and 35 for a reconciliation of our GAAP and operating
efficiency ratios. NYB
(a)
SNL Bank and Thrift Index
NYB Rank
Among Public
Banks and Thrifts
#3
#7
#9
#16
#15
#5 |
  Total
Return on Investment *
*
*
*
*
* |
 New
York Community Bancorp, Inc. Page 32
Total Return on Investment
NYB
(b)
(a)
SNL Financial
(b)
Bloomberg
As a result of nine stock splits in a span of 10 years, our charter shareholders
have 2,700 shares of NYB stock for each 100 shares originally
purchased. SNL
Bank
&
Thrift
Index
(a)
We are committed to building value for our
investors. |
 New
York Community Bancorp, Inc. Page 33
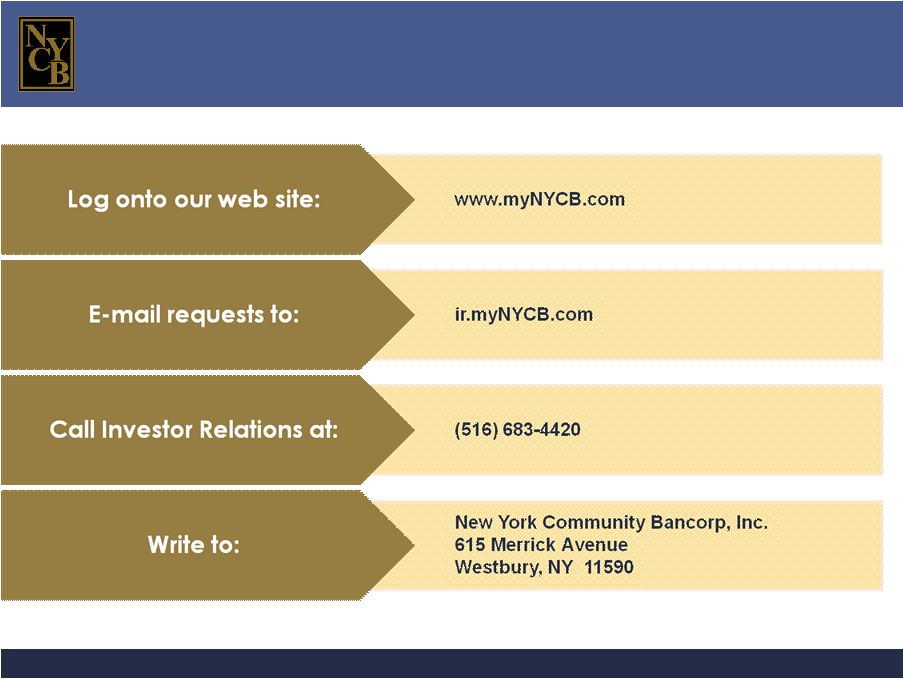
11/1/2010
For More Information |
 New
York Community Bancorp, Inc. Page 34
For the Three Months Ended
September 30, 2010
June 30, 2010
September 30, 2009
(dollars in thousands)
GAAP
Operating
GAAP
Operating
GAAP
Operating
Total non-interest income and net interest income
$393,291
$393,291
$374,614
$374,614
$241,432
$241,432
Adjustments:
Gain on debt exchange
--
(2,441)
--
--
--
(5,717)
Loss on other-than-temporary impairment of securities
--
--
--
--
--
13,275
Gain on business acquisition
--
--
--
(10,780)
--
--
Adjusted total non-interest income and net interest income
$393,291
$390,850
$374,614
$363,834
$241,432
$248,990
Operating expenses
$143,271
$143,271
$133,488
$133,488
$ 90,067
$ 90,067
Adjustments:
FDIC special assessment
--
--
--
--
--
(801)
Acquisition-related expenses
--
(2,090)
--
(456)
--
--
Adjusted operating expenses
$143,271
$141,181
$133,488
$133,032
$ 90,067
$ 89,266
Efficiency ratio
36.43%
36.12%
35.63%
36.56%
37.31%
35.85%
Reconciliation of GAAP and Operating Efficiency
Ratios
The following table presents reconciliations of the Company’s GAAP and
operating efficiency ratios for the three months ended September 30, 2010,
June 30, 2010, and September 30, 2009. |
 New
York Community Bancorp, Inc. Page 35
Reconciliation of GAAP and Operating Efficiency
Ratios
The following table presents reconciliations of the Company’s GAAP and
operating efficiency ratios for the years ended December 31, 2005, 2006,
2007, 2008, and 2009.
For the Years Ended December 31,
2009
2008
2007
2006
2005
(dollars in thousands)
GAAP
Operating
GAAP
Operating
GAAP
Operating
GAAP
Operating
GAAP
Operating
Total net interest income and
non-interest income
$1,062,964
$1,062,964
$691,024
$691,024
$727,622
$727,622
$650,556
$650,556
$693,068
$693,068
Adjustments:
Gain on debt repurchases and exchange
--
(10,054)
--
--
--
--
--
--
--
--
Gain on AmTrust
transaction
--
(139,607)
--
--
--
--
--
--
--
--
Gain on termination of servicing hedge
--
(3,078)
--
--
--
--
--
--
--
--
Visa-related gain
--
--
--
(1,647)
--
--
--
--
--
--
Net gain on sale of securities
--
--
--
--
--
(1,888)
--
--
--
--
Loss on mark-to-market of interest rate swaps
--
--
--
--
--
--
--
6,071
--
--
(Gain) loss on debt redemption
--
--
--
(16,962)
--
1,848
--
1,859
--
--
Loss on other-than-temporary impairment of
securities
--
96,533
--
104,317
--
56,958
--
--
--
--
Balance sheet repositioning charge
--
--
--
39,647
--
--
--
--
--
--
Gain on sale of bank-owned property /
branches
--
--
--
--
--
(64,879)
--
--
--
--
Adjusted
total
net
interest
income
and
non-
interest income
$1,062,964
$1,006,758
$691,024
$816,379
$727,622
$719,661
$650,556
$658,486
$693,068
$693,068
Operating expenses
$384,003
$384,003
$320,818
$320,818
$299,575
$299,575
$256,362
$256,362
$236,621
$236,621
Adjustments:
FDIC special assessment
--
(14,753)
--
--
--
--
--
--
--
--
Acquisition-related costs
--
(5,185)
--
--
--
--
--
--
--
--
Merger-related charge
--
--
--
--
--
(2,245)
--
(5,744)
--
(36,588)
VISA litigation charge
--
--
--
(3,365)
--
(1,000)
--
--
--
--
Retirement charge
--
--
--
--
--
--
--
(3,072)
--
--
Adjusted operating expenses
$384,003
$364,065
$320,818
$317,453
$299,575
$296,330
$256,362
$247,546
$236,621
$200,033
Efficiency ratio
36.13%
36.16%
46.43%
38.89%
41.17%
41.18%
39.41%
37.59%
34.14%
28.86% |
 New
York Community Bancorp, Inc. Page 36
The following table presents reconciliations of the Company’s GAAP and
operating earnings for the three months ended September 30, 2010, June 30,
2010, and September 30, 2009.
Reconciliation of GAAP and Operating Earnings
For the Three Months Ended
September 30,
June 30,
September 30,
(in thousands, except per share data)
2010
2010
2009
GAAP Earnings
$135,609
$136,258
$ 98,573
Adjustments to GAAP earnings:
Gain on debt repurchases/exchange
(2,441)
--
(5,717)
Acquisition-related costs
2,090
456
--
Gain on business acquisition
--
(10,780)
--
Loss on OTTI of securities
--
--
13,275
FDIC special assessment
--
--
801
Resolution of tax audits
--
--
(13,316)
Income tax effect
(838)
4,008
(3,401)
Operating earnings
$134,420
$129,942
$ 90,215
Diluted GAAP Earnings per Share
$0.31
$ 0.31
$ 0.28
Adjustments to diluted GAAP earnings per share:
Gain on debt repurchases/exchange
--
--
(0.01)
Acquisition-related costs
--
--
--
Gain on business acquisition
--
(0.01)
--
Loss on OTTI of securities
--
--
0.02
FDIC special assessment
--
--
--
Resolution of tax audits
--
--
(0.04)
Diluted operating earnings per share
$0.31
$ 0.30
$ 0.26 |
 New
York Community Bancorp, Inc. Page 37
The following table presents reconciliations of the Company’s GAAP and
operating non-interest income and its GAAP and operating revenues for the
three months ended September 30, 2010, June 30, 2010, and September 30, 2009.
Reconciliation of GAAP and Operating Non-Interest
Income and GAAP and Operating Revenues
For the Three Months Ended
September 30, 2010
June 30, 2010
September 30, 2009
(in thousands)
GAAP
Operating
GAAP
Operating
GAAP
Operating
Non-interest income
$107,103
$107,103
$ 80,413
$ 80,413
$ 15,072
$ 15,072
Exclude:
Gain on debt repurchases/exchange
--
(2,441)
--
--
--
(5,717)
Gain on business acquisition
--
--
--
(10,780)
--
--
Add back:
Loss on OTTI of securities
--
--
--
--
--
13,275
Adjusted non-interest income
$107,103
$104,662
$ 80,413
$ 69,633
$ 15,072
$ 22,630
Net interest income
$286,188
$286,188
$294,201
$294,201
$226,360
$226,360
Revenues
$393,291
$390,850
$374,614
$363,834
$241,432
$248,990 |
 New
York Community Bancorp, Inc. Page 38
Reconciliation of GAAP and Non-GAAP Capital
Measures
September 30,
June 30,
September 30,
(dollars in thousands)
2010
2010
2009
Total stockholders’
equity
$ 5,495,298
$ 5,446,434
$ 4,340,539
Less: Goodwill
(2,436,325)
(2,436,327)
(2,436,401)
Core deposit intangibles
(85,407)
(93,226)
(71,205)
Tangible stockholders’
equity
$ 2,973,566
$ 2,916,881
$ 1,832,933
Total assets
$41,706,438
$42,010,747
$32,884,468
Less: Goodwill
(2,436,325)
(2,436,327)
(2,436,401)
Core deposit intangibles
(85,407)
(93,226)
(71,205)
Tangible assets
$39,184,706
$39,481,194
$30,376,862
Stockholders’
equity to total assets
13.18%
12.96%
13.20%
Tangible stockholders’
equity to tangible assets
7.59%
7.39%
6.03%
Tangible stockholders’
equity
$2,973,566
$2,916,881
$1,832,933
Accumulated other comprehensive loss, net of tax
35,611
52,805
68,394
Adjusted tangible stockholders’
equity
$3,009,177
$2,969,686
$1,901,327
Tangible assets
$39,184,706
$39,481,194
$30,376,862
Accumulated other comprehensive loss, net of tax
35,611
52,805
68,394
Adjusted tangible assets
$39,220,317
$39,533,999
$30,445,256
Adjusted tangible stockholders’
equity to adjusted
tangible assets
7.67%
7.51%
6.25%
The
following
table
presents
reconciliations
of
the
Company’s
stockholders’
equity,
tangible
stockholders’
equity,
and
adjusted
tangible
stockholders’
equity;
total
assets,
tangible
assets,
and
adjusted
tangible
assets;
and
the
related
capital
measures
at
September
30,
2010,
June
30,
2010,
and
September
30,
2009. |