Attached files
| file | filename |
|---|---|
| EX-32.0 - EX-32.0 - NEW YORK COMMUNITY BANCORP INC | d516467dex320.htm |
| EX-31.2 - EX-31.2 - NEW YORK COMMUNITY BANCORP INC | d516467dex312.htm |
| EX-31.1 - EX-31.1 - NEW YORK COMMUNITY BANCORP INC | d516467dex311.htm |
| EX-23.0 - EX-23.0 - NEW YORK COMMUNITY BANCORP INC | d516467dex230.htm |
| EX-12.0 - EX-12.0 - NEW YORK COMMUNITY BANCORP INC | d516467dex120.htm |
| EX-3.4 - EX-3.4 - NEW YORK COMMUNITY BANCORP INC | d516467dex34.htm |
Table of Contents
UNITED STATES
SECURITIES AND EXCHANGE COMMISSION
Washington, D.C. 20549
FORM 10-K
Annual Report Pursuant to Section 13 or 15(d)
of the Securities Exchange Act of 1934
| For the fiscal year ended: December 31, 2016 | Commission File Number 1-31565 |
NEW YORK COMMUNITY BANCORP, INC.
(Exact name of registrant as specified in its charter)
| Delaware | 06-1377322 | |
| (State or other jurisdiction of incorporation or organization) |
(I.R.S. Employer Identification No.) |
615 Merrick Avenue, Westbury, New York 11590
(Address of principal executive offices) (Zip code)
(Registrant’s telephone number, including area code) (516) 683-4100
Securities registered pursuant to Section 12(b) of the Act:
| Common Stock, $0.01 par value and Bifurcated Option Note Unit SecuritiESSM |
New York Stock Exchange | |
| (Title of Class) | (Name of exchange on which registered) |
Securities registered pursuant to Section 12(g) of the Act: None
Indicate by check mark if the registrant is a well-known seasoned issuer, as defined in Rule 405 of the Securities Act. Yes ☒ No ☐
Indicate by check mark if the registrant is not required to file reports pursuant to Section 13 or 15(d) of the Act. Yes ☐ No ☒
Indicate by check mark whether the registrant (1) has filed all reports required to be filed by Section 13 or 15(d) of the Securities Exchange Act of 1934 during the preceding 12 months (or for such shorter period that the registrant was required to file such reports), and (2) has been subject to such filing requirements for the past 90 days. Yes ☒ No ☐
Indicate by check mark if disclosure of delinquent filers pursuant to Item 405 of Regulation S-K (§229.405 of this chapter) is not contained herein, and will not be contained, to the best of the registrant’s knowledge, in definitive proxy or information statements incorporated by reference in Part III of this Form 10-K or any amendment to this Form 10-K. ☐
Indicate by check mark whether the registrant has submitted electronically and posted on its corporate Web site, if any, every Interactive Data File required to be submitted and posted pursuant to Rule 405 of Regulation S-T (§232.405 of this chapter) during the preceding 12 months (or for such shorter period that the registrant was required to submit and post such files). Yes ☒ No ☐
Indicate by check mark whether the registrant is a large accelerated filer, an accelerated filer, a non-accelerated filer, or a smaller reporting company. See the definitions of “accelerated filer,” “large accelerated filer,” and “smaller reporting company” in Rule 12b-2 of the Exchange Act.
| Large Accelerated Filer | ☒ | Accelerated Filer | ☐ | |||
| Non-Accelerated Filer | ☐ | Smaller Reporting Company | ☐ | |||
Indicate by check mark whether the registrant is a shell company (as defined in Rule 12b-2 of the Act). Yes ☐ No ☒
As of June 30, 2016, the aggregate market value of the shares of common stock outstanding of the registrant was $7.1 billion, excluding 12,693,918 shares held by all directors and executive officers of the registrant. This figure is based on the closing price of the registrant’s common stock on June 30, 2016, $14.99 per share, as reported by the New York Stock Exchange.
The number of shares of the registrant’s common stock outstanding as of February 21, 2017 was 488,462,117 shares.
Documents Incorporated by Reference
Portions of the definitive Proxy Statement for the Annual Meeting of Shareholders to be held on June 6, 2017 are incorporated by reference into Part III.
Table of Contents
| Page | ||||||
| 1 | ||||||
| 3 | ||||||
| Item 1. |
6 | |||||
| Item 1A. |
20 | |||||
| Item 1B. |
30 | |||||
| Item 2. |
30 | |||||
| Item 3. |
30 | |||||
| Item 4. |
31 | |||||
| Item 5. |
32 | |||||
| Item 6. |
35 | |||||
| Item 7. |
Management’s Discussion and Analysis of Financial Condition and Results of Operations |
36 | ||||
| Item 7A. |
84 | |||||
| Item 8. |
88 | |||||
| Item 9. |
Changes in and Disagreements with Accountants on Accounting and Financial Disclosure |
159 | ||||
| Item 9A. |
159 | |||||
| Item 9B. |
160 | |||||
| Item 10. |
160 | |||||
| Item 11. |
160 | |||||
| Item 12. |
Security Ownership of Certain Beneficial Owners and Management, and Related Stockholder Matters |
160 | ||||
| Item 13. |
Certain Relationships and Related Transactions, and Director Independence |
161 | ||||
| Item 14. |
161 | |||||
| Item 15. |
161 | |||||
| 164 | ||||||
| Certifications |
||||||
Table of Contents
For the purpose of this Annual Report on Form 10-K, the words “we,” “us,” “our,” and the “Company” are used to refer to New York Community Bancorp, Inc. and our consolidated subsidiaries, including New York Community Bank and New York Commercial Bank (the “Community Bank” and the “Commercial Bank,” respectively, and collectively, the “Banks”).
CAUTIONARY STATEMENT REGARDING FORWARD-LOOKING LANGUAGE
This report, like many written and oral communications presented by New York Community Bancorp, Inc. and our authorized officers, may contain certain forward-looking statements regarding our prospective performance and strategies within the meaning of Section 27A of the Securities Act of 1933, as amended, and Section 21E of the Securities Exchange Act of 1934, as amended. We intend such forward-looking statements to be covered by the safe harbor provisions for forward-looking statements contained in the Private Securities Litigation Reform Act of 1995, and are including this statement for purposes of said safe harbor provisions.
Forward-looking statements, which are based on certain assumptions and describe future plans, strategies, and expectations of the Company, are generally identified by use of the words “anticipate,” “believe,” “estimate,” “expect,” “intend,” “plan,” “project,” “seek,” “strive,” “try,” or future or conditional verbs such as “will,” “would,” “should,” “could,” “may,” or similar expressions. Although we believe that our plans, intentions, and expectations as reflected in these forward-looking statements are reasonable, we can give no assurance that they will be achieved or realized.
Our ability to predict results or the actual effects of our plans and strategies is inherently uncertain. Accordingly, actual results, performance, or achievements could differ materially from those contemplated, expressed, or implied by the forward-looking statements contained in this report.
There are a number of factors, many of which are beyond our control, that could cause actual conditions, events, or results to differ significantly from those described in our forward-looking statements. These factors include, but are not limited to:
| • | general economic conditions, either nationally or in some or all of the areas in which we and our customers conduct our respective businesses; |
| • | conditions in the securities markets and real estate markets or the banking industry; |
| • | changes in real estate values, which could impact the quality of the assets securing the loans in our portfolio; |
| • | changes in interest rates, which may affect our net income, prepayment penalty income, mortgage banking income, and other future cash flows, or the market value of our assets, including our investment securities; |
| • | changes in the quality or composition of our loan or securities portfolios; |
| • | changes in our capital management policies, including those regarding business combinations, dividends, and share repurchases, among others; |
| • | potential increases in costs if the Company is designated a “Systemically Important Financial Institution” under the Dodd-Frank Wall Street Reform and Consumer Protection Act of 2010 (the “Dodd-Frank Act”); |
| • | heightened regulatory focus on CRE concentration and related limits that have been, or may in the future be, imposed by regulators; |
| • | our use of derivatives to mitigate our interest rate exposure; |
| • | changes in competitive pressures among financial institutions or from non-financial institutions; |
| • | changes in deposit flows and wholesale borrowing facilities; |
| • | changes in the demand for deposit, loan, and investment products and other financial services in the markets we serve; |
| • | our timely development of new lines of business and competitive products or services in a changing environment, and the acceptance of such products or services by our customers; |
| • | our ability to obtain timely shareholder and regulatory approvals of any merger transactions we may propose; |
| • | our ability to successfully integrate any assets, liabilities, customers, systems, and management personnel we may acquire into our operations, and our ability to realize related revenue synergies and cost savings within expected time frames; |
| • | potential exposure to unknown or contingent liabilities of companies we have acquired, may acquire, or target for acquisition; |
| • | failure to obtain applicable regulatory approvals for the payment of future dividends; |
| • | the ability to pay future dividends at currently expected rates; |
1
Table of Contents
| • | the ability to hire and retain key personnel; |
| • | the ability to attract new customers and retain existing ones in the manner anticipated; |
| • | changes in our customer base or in the financial or operating performances of our customers’ businesses; |
| • | any interruption in customer service due to circumstances beyond our control; |
| • | the outcome of pending or threatened litigation, or of matters before regulatory agencies, whether currently existing or commencing in the future; |
| • | environmental conditions that exist or may exist on properties owned by, leased by, or mortgaged to the Company; |
| • | any interruption or breach of security resulting in failures or disruptions in customer account management, general ledger, deposit, loan, or other systems; |
| • | operational issues stemming from, and/or capital spending necessitated by, the potential need to adapt to industry changes in information technology systems, on which we are highly dependent; |
| • | the ability to keep pace with, and implement on a timely basis, technological changes; |
| • | changes in legislation, regulation, policies, or administrative practices, whether by judicial, governmental, or legislative action, including, but not limited to, the Dodd-Frank Act, and other changes pertaining to banking, securities, taxation, rent regulation and housing, financial accounting and reporting, environmental protection, and insurance, and the ability to comply with such changes in a timely manner; |
| • | changes in the monetary and fiscal policies of the U.S. Government, including policies of the U.S. Department of the Treasury and the Board of Governors of the Federal Reserve System; |
| • | changes in accounting principles, policies, practices, or guidelines; |
| • | a material breach in performance by the Community Bank under our loss sharing agreements with the FDIC; |
| • | changes in our estimates of future reserves based upon the periodic review thereof under relevant regulatory and accounting requirements; |
| • | changes in regulatory expectations relating to predictive models we use in connection with stress testing and other forecasting or in the assumptions on which such modeling and forecasting are predicated; |
| • | changes in our credit ratings or in our ability to access the capital markets; |
| • | natural disasters, war, or terrorist activities; and |
| • | other economic, competitive, governmental, regulatory, technological, and geopolitical factors affecting our operations, pricing, and services. |
In addition, the timing and occurrence or non-occurrence of events may be subject to circumstances beyond our control.
Furthermore, we routinely evaluate opportunities to expand through acquisitions and conduct due diligence activities in connection with such opportunities. As a result, acquisition discussions and, in some cases, negotiations, may take place at any time, and acquisitions involving cash or our debt or equity securities may occur.
See Item 1A, “Risk Factors” in this annual report and in our other SEC filings for a further discussion of important risk factors that could cause actual results to differ materially from our forward-looking statements.
Readers should not place undue reliance on these forward-looking statements, which reflect our expectations only as of the date of this report. We do not assume any obligation to revise or update these forward-looking statements except as may be required by law.
2
Table of Contents
BASIS POINT
Throughout this filing, the year-over-year changes that occur in certain financial measures are reported in terms of basis points. Each basis point is equal to one hundredth of a percentage point, or 0.01%.
BOOK VALUE PER SHARE
Book value per share refers to the amount of stockholders’ equity attributable to each outstanding share of common stock, and is calculated by dividing total stockholders’ equity at the end of a period by the number of shares outstanding at the same date.
BROKERED DEPOSITS
Refers to funds obtained, directly or indirectly, by or through deposit brokers that are then deposited into one or more deposit accounts at a bank.
CHARGE-OFF
Refers to the amount of a loan balance that has been written off against the allowance for losses on non-covered loans.
COMMERCIAL REAL ESTATE (“CRE”) LOAN
A mortgage loan secured by either an income-producing property owned by an investor and leased primarily for commercial purposes or, to a lesser extent, an owner-occupied building used for business purposes. The CRE loans in our portfolio are typically secured by office buildings, retail shopping centers, light industrial centers with multiple tenants, or mixed-use properties.
COST OF FUNDS
The interest expense associated with interest-bearing liabilities, typically expressed as a ratio of interest expense to the average balance of interest-bearing liabilities for a given period.
COVERED LOANS AND OTHER REAL ESTATE OWNED (“OREO”)
Refers to the loans and OREO we acquired in our AmTrust Bank (“AmTrust”) and Desert Hills Bank (“Desert Hills”) acquisitions, which are “covered” by loss sharing agreements with the FDIC. See the definition of “Loss Sharing Agreements” that appears later in this glossary.
DEBT SERVICE COVERAGE RATIO (“DSCR”)
An indication of a borrower’s ability to repay a loan, the DSCR generally measures the cash flows available to a borrower over the course of a year as a percentage of the annual interest and principal payments owed during that time.
DERIVATIVE
A term used to define a broad base of financial instruments, including swaps, options, and futures contracts, whose value is based upon, or derived from, an underlying rate, price, or index (such as interest rates, foreign currency, commodities, or prices of other financial instruments such as stocks or bonds).
DIVIDEND PAYOUT RATIO
The percentage of our earnings that is paid out to shareholders in the form of dividends. It is determined by dividing the dividend paid per share during a period by our diluted earnings per share during the same period of time.
EFFICIENCY RATIO
Measures total operating expenses as a percentage of the sum of net interest income and non-interest income.
GOODWILL
Refers to the difference between the purchase price and the fair value of an acquired company’s assets, net of the liabilities assumed. Goodwill is reflected as an asset on the balance sheet and is tested at least annually for impairment.
3
Table of Contents
GOVERNMENT-SPONSORED ENTERPRISES (“GSEs”)
Refers to a group of financial services corporations that were created by the United States Congress to enhance the availability, and reduce the cost, of credit to certain targeted borrowing sectors, including home finance. The GSEs include, but are not limited to, the Federal National Mortgage Association (“Fannie Mae”), the Federal Home Loan Mortgage Corporation (“Freddie Mac”), and the Federal Home Loan Banks (the “FHLBs”).
GSE OBLIGATIONS
Refers to GSE mortgage-related securities (both certificates and collateralized mortgage obligations) and GSE debentures.
INTEREST RATE LOCK COMMITMENTS (“IRLCs”)
Refers to commitments we have made to originate new one-to-four family loans at specific (i.e., locked-in) interest rates. The volume of IRLCs at the end of a period is a leading indicator of loans to be originated in the near future.
INTEREST RATE SENSITIVITY
Refers to the likelihood that the interest earned on assets and the interest paid on liabilities will change as a result of fluctuations in market interest rates.
INTEREST RATE SPREAD
The difference between the yield earned on average interest-earning assets and the cost of average interest-bearing liabilities.
LOAN-TO-VALUE RATIO (“LTV”)
Measures the balance of a loan as a percentage of the appraised value of the underlying property.
LOSS SHARING AGREEMENTS
Refers to the agreements we entered into with the FDIC in connection with the loans and OREO we acquired in our AmTrust and Desert Hills acquisitions. The agreements call for the FDIC to reimburse us for 80% of any losses (and share in 80% of any recoveries) up to specified thresholds and to reimburse us for 95% of any losses (and share in 95% of any recoveries) beyond those thresholds with respect to the acquired assets for specified periods of time. The loss sharing agreements with respect to the one-to-four family loans and home equity loans we acquired in these transactions extend for a period of ten years from the respective dates of acquisition and are still in effect. Such loans are referred to as “covered loans.”
MORTGAGE BANKING INCOME
Refers to the income generated through our mortgage banking business, which is recorded in non-interest income. Mortgage banking income has two components: income generated from the origination of one-to-four family loans for sale (“income from originations”) and income generated by servicing such loans (“servicing income”).
MORTGAGE SERVICING RIGHTS (“MSRs”)
The right to service mortgage loans for others is recognized as an asset, and recorded at fair value, when our loans are sold or securitized, servicing retained.
MULTI-FAMILY LOAN
A mortgage loan secured by a rental or cooperative apartment building with more than four units.
NET INTEREST INCOME
The difference between the interest income generated by loans and securities and the interest expense produced by deposits and borrowed funds.
NET INTEREST MARGIN
Measures net interest income as a percentage of average interest-earning assets.
4
Table of Contents
NON-ACCRUAL LOAN
A loan generally is classified as a “non-accrual” loan when it is 90 days or more past due or when it is deemed to be impaired because we no longer expect to collect all amounts due according to the contractual terms of the loan agreement. When a loan is placed on non-accrual status, we cease the accrual of interest owed, and previously accrued interest is reversed and charged against interest income. A loan generally is returned to accrual status when the loan is current and we have reasonable assurance that the loan will be fully collectible.
NON-COVERED LOANS AND OREO
Refers to all of the loans and OREO in our portfolio that are not covered by our loss sharing agreements with the FDIC.
NON-PERFORMING LOANS AND ASSETS
Non-performing loans consist of non-accrual loans and loans that are 90 days or more past due and still accruing interest. Non-performing assets consist of non-performing loans and OREO.
RENT-REGULATED APARTMENTS
In New York City, where the vast majority of the properties securing our multi-family loans are located, the amount of rent that tenants may be charged on the apartments in certain buildings is restricted under certain “rent-control” and “rent-stabilization” laws. Rent-control laws apply to apartments in buildings that were constructed prior to February 1947. An apartment is said to be “rent-controlled” if the tenant has been living continuously in the apartment for a period of time beginning prior to July 1971. When a rent-controlled apartment is vacated, it typically becomes “rent-stabilized.” Rent-stabilized apartments are generally located in buildings with six or more units that were built between February 1947 and January 1974. Rent-controlled and -stabilized (together, “rent-regulated”) apartments tend to be more affordable to live in because of the applicable regulations, and buildings with a preponderance of such rent-regulated apartments are therefore less likely to experience vacancies in times of economic adversity.
REPURCHASE AGREEMENTS
Repurchase agreements are contracts for the sale of securities owned or borrowed by the Banks with an agreement to repurchase those securities at an agreed-upon price and date. The Banks’ repurchase agreements are primarily collateralized by GSE obligations and other mortgage-related securities, and are entered into with either the FHLBs or various brokerage firms.
SYSTEMICALLY IMPORTANT FINANCIAL INSTITUTION (“SIFI”)
A bank holding company with total consolidated assets that average more than $50 billion over the four most recent quarters is designated a “Systemically Important Financial Institution” under the Dodd-Frank Wall Street Reform and Consumer Protection Act (the “Dodd-Frank Act”) of 2010.
WHOLESALE BORROWINGS
Refers to advances drawn by the Banks against their respective lines of credit with the FHLBs, their repurchase agreements with the FHLBs and various brokerage firms, and federal funds purchased.
YIELD
The interest income associated with interest-earning assets, typically expressed as a ratio of interest income to the average balance of interest-earning assets for a given period.
5
Table of Contents
| ITEM 1. | BUSINESS |
General
New York Community Bancorp, Inc. is organized under Delaware Law as a multi-bank holding company with two primary subsidiaries: New York Community Bank and New York Commercial Bank (hereinafter referred to as the “Community Bank” and the “Commercial Bank,” respectively, and collectively as the “Banks”). The Community Bank currently has 225 branches in Metro New York, New Jersey, Ohio, Florida, and Arizona, and the Commercial Bank currently has 30 branches in Metro New York.
New York Community Bank
Established in 1859, the Community Bank is a New York State-chartered savings bank with 225 branches that currently operate through seven local divisions. We compete for depositors in these diverse markets by emphasizing service and convenience, with a comprehensive menu of traditional and non-traditional products and services, and access to multiple service channels, including online banking, mobile banking, and banking by phone.
In New York, we currently serve our Community Bank customers through Roslyn Savings Bank, with 44 branches on Long Island, a suburban market east of New York City comprised of Nassau and Suffolk counties; Queens County Savings Bank, with 38 branches in the New York City borough of Queens; Richmond County Savings Bank, with 20 branches in the borough of Staten Island; and Roosevelt Savings Bank, with seven branches in the borough of Brooklyn. In the Bronx, we currently have two branches that operate directly under the name “New York Community Bank.”
In New Jersey, we serve our Community Bank customers through 45 branches that operate under the name Garden State Community Bank. In Florida and Arizona, where we have 27 and 14 branches, respectively, we serve our customers through the AmTrust Bank division of the Community Bank. In Ohio, we serve our Community Bank customers through 28 branches of Ohio Savings Bank.
We also are a leading producer of multi-family loans in New York City, with an emphasis on non-luxury residential apartment buildings with rent-regulated units that feature below-market rents. In addition to multi-family loans, which are our principal asset, we originate commercial real estate (“CRE”) loans (primarily in New York City, as well as on Long Island) and, to a much lesser extent, acquisition, development, and construction (“ADC”) loans, and commercial and industrial (“C&I”) loans. C&I loans consist of specialty finance loans and leases, and other C&I loans that are typically made to small and mid-size business in Metro New York.
Unlike the aforementioned loans, which are originated for investment, the one-to-four family loans we produce are primarily originated for sale. In 2016, the vast majority of the one-to-four family loans we produced were agency-conforming loans sold to government-sponsored enterprises (“GSEs”), servicing retained.
Although the vast majority of the loans we produce for investment (i.e., for our portfolio) are secured by properties or businesses in New York City and, to a lesser extent, on Long Island, the one-to-four family loans we originate are for the purchase or refinancing of homes throughout the United States.
New York Commercial Bank
The Commercial Bank is a New York State-chartered commercial bank with 30 branches in Manhattan, Queens, Brooklyn, Westchester County, and Long Island, including 18 that operate under the name “Atlantic Bank.”
Established in December 2005, the Commercial Bank competes for customers by emphasizing personal service and by addressing the needs of small and mid-size businesses, professional associations, and government agencies, with a comprehensive menu of business solutions, including installment loans, revolving lines of credit, and cash management services. In addition, the Commercial Bank offers online banking, mobile banking, and banking by phone.
Customers of the Commercial Bank may transact their business at any of our 225 Community Bank branches, and Community Bank customers may transact their business at any of the 30 branches of the Commercial Bank. In addition, customers of the Banks have access to their accounts through our ATMs in all five states.
On September 17, 2015, the Company submitted an application to the Federal Deposit Insurance Corporation (the “FDIC”) and the New York State Department of Financial Services (the “NYSDFS”) requesting approval to merge the Commercial Bank with and
6
Table of Contents
into the Community Bank. The merger was approved by the NYSDFS on September 16, 2016 and, as of the date of this filing, was pending the approval of the FDIC. Upon completion of the pending merger, the 30 Commercial Bank branches will continue operations as branches of the Community Bank.
Online Information about the Company and the Banks
We also serve our customers through three connected websites: www.myNYCB.com, www.NewYorkCommercialBank.com, and www.NYCBfamily.com. In addition to providing our customers with 24-hour access to their accounts, and information regarding our products and services, hours of service, and locations, these websites provide extensive information about the Company for the investment community. Earnings releases, dividend announcements, and other press releases are posted upon issuance to the Investor Relations portion of these websites. In addition, our filings with the U.S. Securities and Exchange Commission (the “SEC”) (including our annual report on Form 10-K; our quarterly reports on Form 10-Q; and our current reports on Form 8-K), and all amendments to those reports filed or furnished pursuant to Section 13(a) or 15(d) of the Securities Exchange Act of 1934, are available without charge, and are posted to the Investor Relations portion of our websites within minutes of being filed. The websites also provide information regarding our Board of Directors and management team, as well as certain Board Committee charters and our corporate governance policies. The content of our websites shall not be deemed to be incorporated by reference into this Annual Report.
Our Market
Our current market for deposits consists of the 26 counties in the five states that are served by our branch network, including all five boroughs of New York City, Nassau and Suffolk Counties on Long Island, and Westchester County in New York; Essex, Hudson, Mercer, Middlesex, Monmouth, Ocean, and Union Counties in New Jersey; Maricopa and Yavapai Counties in Arizona; Cuyahoga, Lake, and Summit Counties in Ohio; and Broward, Collier, Lee, Miami-Dade, Palm Beach, and St. Lucie Counties in Florida.
The market for the loans we produce varies, depending on the type of loan. For example, the vast majority of our multi-family loans are collateralized by rental apartment buildings in New York City, which is also home to the majority of the properties collateralizing our CRE and ADC loans. In contrast, we originate one-to-four family mortgage loans in all 50 states and the District of Columbia, and our specialty finance loans and leases are generally made to large corporate obligors that participate in stable industries nationwide.
Competition for Deposits
The combined population of the 26 counties where our branches are located is approximately 31.4 million, and the number of banks and thrifts we compete with currently exceeds 300. With total deposits of $28.9 billion at December 31, 2016, we ranked eleventh among all bank and thrift depositories serving these 26 counties. We also ranked second among all banks and thrifts in Union County, New Jersey, and third among all banks and thrifts in Richmond, Queens, and Nassau Counties in New York. (Market share information was provided by S&P Global Market Intelligence.) We also compete for deposits with other financial institutions, including credit unions, Internet banks, and brokerage firms.
Our ability to attract and retain deposits is not only a function of short-term interest rates and industry consolidation, but also the competitiveness of the rates being offered by other financial institutions within our marketplace.
Competition for deposits is also influenced by several internal factors, including the opportunity to assume or acquire deposits through business combinations; the cash flows produced through loan and securities repayments and sales; and the availability of attractively priced wholesale funds. In addition, the degree to which we seek to compete for deposits is influenced by the liquidity needed to fund our loan production and other outstanding commitments.
We compete for deposits and customers by placing an emphasis on convenience and service and, from time to time, by offering specific products at highly competitive rates. In addition to our 225 Community Bank branches and 30 Commercial Bank branches, we have 271 ATM locations, including 247 that operate 24 hours a day. Our customers also have 24-hour access to their accounts through our bank-by-phone service, through mobile banking, and online through our three websites, www.myNYCB.com, www.NewYorkCommercialBank.com, and www.NYCBfamily.com. We also offer certain money market accounts, certificates of deposit (“CDs”), and checking accounts through a dedicated website: www.myBankingDirect.com.
7
Table of Contents
We also compete by complementing our broad selection of traditional banking products with an extensive menu of alternative financial services, including annuities, life and long-term care insurance, and mutual funds of various third-party service providers. In addition, customers who come to us seeking a residential mortgage can begin the application process by phone, online, or in any branch.
In addition to checking and savings accounts, Individual Retirement Accounts, and CDs for both businesses and consumers, we offer a suite of cash management products to address the needs of small and mid-size businesses and professional associations.
Another competitive advantage is our strong community presence, with April 14, 2016 having marked the 157th year of service of our forebear, Queens County Savings Bank. We have found that our longevity, as well as our strong capital position, are especially appealing to customers seeking a strong, stable, and service-oriented bank.
Competition for Loans
Our success as a lender is substantially tied to the economic health of the markets where we lend. Local economic conditions have a significant impact on loan demand, the value of the collateral securing our credits, and the ability of our borrowers to repay their loans.
The competition we face for loans also varies with the type of loan we are originating. In New York City, where the majority of the buildings collateralizing our multi-family loans are located, we compete for such loans on the basis of timely service and the expertise that stems from being a specialist in this lending niche. In addition to the money center, regional, and local banks we compete with in this market, we compete with insurance companies and other types of lenders. Certain of the banks we compete with sell the loans they produce to Fannie Mae and Freddie Mac.
Our ability to compete for CRE loans depends on the same factors that impact our ability to compete for multi-family credits, and the degree to which other CRE lenders choose to offer loan products similar to ours.
While we continue to originate one-to-four family, ADC, and C&I loans for investment, such loans represent a small portion of our loan portfolio as compared to multi-family and CRE loans.
We also compete with a significant number of financial and non-financial institutions throughout the nation that originate and aggregate one-to-four family loans for sale.
Environmental Issues
We encounter certain environmental risks in our lending activities and other operations. The existence of hazardous materials may make it unattractive for a lender to foreclose on the properties securing its loans. In addition, under certain conditions, lenders may become liable for the costs of cleaning up hazardous materials found on such properties. We attempt to mitigate such environmental risks by requiring either that a borrower purchase environmental insurance or that an appropriate environmental site assessment be completed as part of our underwriting review on the initial granting of CRE and ADC loans, regardless of location, and of any out-of-state multi-family loans we may produce. Depending on the results of an assessment, appropriate measures are taken to address the identified risks. In addition, we order an updated environmental analysis prior to foreclosing on such properties, and typically hold foreclosed multi-family, CRE, and ADC properties in subsidiaries.
Our attention to environmental risks also applies to the properties and facilities that house our bank operations. Prior to acquiring a large-scale property, a Phase 1 Environmental Property Assessment is typically performed by a licensed professional engineer to determine the integrity of, and/or the potential risk associated with, the facility and the property on which it is built. Properties and facilities of a smaller scale are evaluated by qualified in-house assessors, as well as by industry experts in environmental testing and remediation. This two-pronged approach identifies potential risks associated with asbestos-containing material, above and underground storage tanks, radon, electrical transformers (which may contain PCBs), ground water flow, storm and sanitary discharge, and mold, among other environmental risks. These processes assist us in mitigating environmental risk by enabling us to identify and address potential issues, including by avoiding taking ownership or control of contaminated properties.
8
Table of Contents
Subsidiary Activities
The Community Bank has formed, or acquired through merger transactions, 28 active subsidiary corporations. Of these, 22 are direct subsidiaries of the Community Bank and six are subsidiaries of Community Bank-owned entities.
The 22 direct subsidiaries of the Community Bank are:
| Name |
Jurisdiction of |
Purpose | ||
| DHB Real Estate, LLC | Arizona | Organized to own interests in real estate | ||
| Ferry Development Holding Company | Delaware | Formed to hold and manage investment portfolios for the Company | ||
| Mt. Sinai Ventures, LLC | Delaware | A joint venture partner in the development, construction, and sale of a 177-unit golf course community in Mt. Sinai, NY, all the units of which were sold by December 31, 2006 | ||
| NYCB Mortgage Company, LLC | Delaware | Holding company for Walnut Realty Holding Company, LLC | ||
| NYCB Specialty Finance Company, LLC | Delaware | Originates asset-based, equipment financing, and dealer-floor plan loans. | ||
| Realty Funding Company, LLC | Delaware | Holding company for subsidiaries owning an interest in real estate | ||
| Woodhaven Investments, LLC. | Delaware | Holding company for Ironbound Investment Company, Inc. | ||
| Eagle Rock Investment Corp. | New Jersey | Formed to hold and manage investment portfolios for the Company | ||
| Pacific Urban Renewal, Inc. | New Jersey | Owns a branch building | ||
| Synergy Capital Investments, Inc. | New Jersey | Formed to hold and manage investment portfolios for the Company | ||
| BSR 1400 Corp. | New York | Organized to own interests in real estate | ||
| Bellingham Corp. | New York | Organized to own interests in real estate | ||
| Blizzard Realty Corp. | New York | Organized to own interests in real estate | ||
| CFS Investments, Inc. | New York | Sells non-deposit investment products | ||
| Main Omni Realty Corp. | New York | Organized to own interests in real estate | ||
| NYB Realty Holding Company, LLC | New York | Holding company for subsidiaries owning an interest in real estate | ||
| O.B. Ventures, LLC | New York | A joint venture partner in a 370-unit residential community in Plainview, New York, all the units of which were sold by December 31, 2004 | ||
| RCBK Mortgage Corp. | New York | Organized to own interests in certain multi-family loans | ||
| RSB Agency, Inc. | New York | Sells non-deposit investment products | ||
| Richmond Enterprises, Inc. | New York | Holding company for Peter B. Cannell & Co., Inc. | ||
| Roslyn National Mortgage Corporation | New York | Formerly operated as a mortgage loan originator and servicer and currently holds an interest in its former office space | ||
| 100 Duffy Realty, LLC | New York | Owns a back-office building | ||
9
Table of Contents
The six subsidiaries of Community Bank-owned entities are:
| Name |
Jurisdiction of |
Purpose | ||
| Peter B. Cannell & Co., Inc. | Delaware | Advises high net worth individuals and institutions on the management of their assets | ||
| Roslyn Real Estate Asset Corp. | Delaware | A REIT organized for the purpose of investing in mortgage-related assets | ||
| Walnut Realty Holding Company, LLC | Delaware | Established to own Bank-owned properties | ||
| Your New REO, LLC | Delaware | Owns a website that lists bank-owned properties for sale | ||
| Ironbound Investment Company, LLC. | Florida | A REIT organized for the purpose of investing in mortgage-related assets that also is the principal shareholder of Richmond County Capital Corp. | ||
| 1400 Corp. | New York | Holding company for Roslyn Real Estate Asset Corp. | ||
There are 89 additional entities that are subsidiaries of a Community Bank-owned entity organized to own interests in real estate.
The Commercial Bank has three active subsidiary corporations, two of which are subsidiaries of Commercial Bank-owned entities.
The one direct subsidiary of the Commercial Bank is:
| Name |
Jurisdiction of |
Purpose | ||
| Beta Investments, Inc. | Delaware | Holding company for Omega Commercial Mortgage Corp. and Long Island Commercial Capital Corp. |
The two subsidiaries of Commercial Bank-owned entities are:
| Name |
Jurisdiction of |
Purpose | ||
| Omega Commercial Mortgage Corp. | Delaware | A REIT organized for the purpose of investing in mortgage-related assets | ||
| Long Island Commercial Capital Corp. | New York | A REIT organized for the purpose of investing in mortgage-related assets | ||
There are three additional entities that are subsidiaries of the Commercial Bank that are organized to own interests in real estate.
The Company owns special business trusts that were formed for the purpose of issuing capital and common securities and investing the proceeds thereof in the junior subordinated debentures issued by the Company. See Note 7, “Borrowed Funds,” in Item 8, “Financial Statements and Supplementary Data,” for a further discussion of the Company’s special business trusts.
The Company also has one non-banking subsidiary that was established in connection with the acquisition of Atlantic Bank of New York.
10
Table of Contents
Personnel
At December 31, 2016, the number of full-time equivalent employees was 3,487. Our employees are not represented by a collective bargaining unit, and we consider our relationship with our employees to be good.
Federal, State, and Local Taxation
The Company is subject to federal, state, and local income taxes. See the discussion of “Income Taxes” in “Critical Accounting Policies” in Item 7, “Management’s Discussion and Analysis of Financial Condition and Results of Operations,” later in this annual report.
Regulation and Supervision
General
The Community Bank is a New York State-chartered savings bank and its deposit accounts are insured under the Deposit Insurance Fund (the “DIF”) of the FDIC up to applicable legal limits. The Commercial Bank is a New York State-chartered commercial bank and its deposit accounts also are insured by the DIF up to applicable legal limits. On September 17, 2015, the Company submitted an application to the FDIC and the NYSDFS requesting approval to merge the Commercial Bank with and into the Community Bank. The merger was approved by the NYSDFS on September 16, 2016 and is currently pending the approval of the FDIC.
For the fiscal year ended December 31, 2016, the Community Bank and the Commercial Bank were subject to regulation and supervision by the NYSDFS, as their chartering agency; by the FDIC, as their insurer of deposits; and by the Consumer Financial Protection Bureau (the “CFPB”).
The Banks are required to file reports with the NYSDFS, the FDIC, and the CFPB concerning their activities and financial condition, and are periodically examined by the NYSDFS, the FDIC, and the CFPB to assess compliance with various regulatory requirements, including with respect to safety and soundness and consumer financial protection regulations. The regulatory structure gives the regulatory authorities extensive discretion in connection with their supervisory and enforcement activities and examination policies, including policies with respect to the classification of assets and the establishment of adequate loan loss allowances for regulatory purposes. Changes in such regulations or in banking legislation could have a material impact on the Company, the Banks, and their operations, as well as the Company’s shareholders.
The Company is subject to examination, regulation, and periodic reporting under the Bank Holding Company Act of 1956, as amended (the “BHCA”), as administered by the Board of Governors of the Federal Reserve System (the “FRB”). Furthermore, the Company would be required to obtain the prior approval of the FRB to acquire all, or substantially all, of the assets of any bank or bank holding company.
In addition, the Company is periodically examined by the Federal Reserve Bank of New York (the “FRB-NY”), and is required to file certain reports under, and otherwise comply with, the rules and regulations of the SEC under federal securities laws. Certain of the regulatory requirements applicable to the Community Bank, the Commercial Bank, and the Company are referred to below or elsewhere herein. However, such discussion is not meant to be a complete explanation of all laws and regulations, and is qualified in its entirety by reference to the actual laws and regulations.
The Dodd-Frank Act
Enacted in July 2010, the Dodd-Frank Wall Street Reform and Consumer Protection Act (the “Dodd-Frank Act”) significantly changed the bank regulatory structure and will continue to affect, into the immediate future, the lending and investment activities and general operations of depository institutions and their holding companies. The Dodd-Frank Act is complex and comprehensive legislation that impacts practically all aspects of a banking organization, and represents a significant overhaul of many aspects of the regulation of the financial services industry.
Capital Requirements
In early July 2013, the Federal Reserve Board and the FDIC approved revisions to their capital adequacy guidelines and prompt corrective action rules to implement the revised standards of the Basel Committee on Banking Supervision, commonly called Basel III, and to address relevant provisions of the Dodd-Frank Act. “Basel III” generally refers to two consultative documents released by the Basel Committee on Banking Supervision in
11
Table of Contents
December 2009. The “Basel III Rules” generally refer to the rules adopted by U.S. banking regulators in December 2010 to align U.S. bank capital requirements with Basel III and with the related loss absorbency rules they issued in January 2011, which include significant changes to bank capital, leverage, and liquidity requirements.
The Basel III Rules include new risk-based capital and leverage ratios, which became effective January 1, 2015, and revised the definition of what constitutes “capital” for the purposes of calculating those ratios. Under the Basel III Rules, the Company and the Banks are required to maintain minimum capital in accordance with the following ratios: (i) a common equity tier 1 capital ratio of 4.5%; (ii) a tier 1 capital ratio of 6% (increased from 4%); (iii) a total capital ratio of 8% (unchanged from the prior rules); and (iv) a tier 1 leverage ratio of 4%.
In addition, the Basel III Rules assign higher risk weights to certain assets, such as the 150% risk weighting assigned to exposures that are more than 90 days past due or are on non-accrual status, and to certain commercial real estate facilities that finance the acquisition, development, or construction of real property. The Basel III Rules also eliminate the inclusion of certain instruments, such as trust preferred securities, from tier 1 capital. In addition, tier 2 capital is no longer limited to the amount of tier 1 capital included in total capital. Mortgage servicing rights, certain deferred tax assets, and investments in unconsolidated subsidiaries over designated percentages of common stock will be required, subject to limitation, to be deducted from capital. Finally, tier 1 capital will include accumulated other comprehensive income, which includes all unrealized gains and losses on available-for-sale debt and equity securities.
The Basel III Rules also establish a “capital conservation buffer” (consisting entirely of common equity tier 1 capital) that will be 2.5% above the new regulatory minimum capital requirements when it is fully phased in. The result will be an increase in the minimum common equity tier 1, tier 1, and total capital ratios to 7.0%, 8.5%, and 10.5%, respectively. The phase-in of the new capital conservation buffer requirement began in January 2016 at 0.625% of risk-weighted assets and will increase by that amount each year until fully implemented in January 2019. An institution can be subject to limitations on paying dividends, engaging in share repurchases, and paying discretionary bonuses if its capital levels fall below these amounts. The Basel III Rules also establish a maximum percentage of eligible retained income that can be utilized for such capital distributions.
Prompt Corrective Regulatory Action
Federal law requires, among other things, that federal bank regulatory authorities take “prompt corrective action” with respect to institutions that do not meet minimum capital requirements. For such purposes, the law establishes five capital tiers: well capitalized, adequately capitalized, undercapitalized, significantly undercapitalized, and critically undercapitalized.
As a result of the Basel III Rules, new definitions of the relevant measures for the five capital categories took effect on January 1, 2015. An institution is deemed to be “well capitalized” if it has a total risk-based capital ratio of 10% or greater, a tier 1 risk-based capital ratio of 8% or greater, a common equity tier 1 risk-based capital ratio of 6.5% or greater, and a tier 1 leverage ratio of 5% or greater, and is not subject to a regulatory order, agreement, or directive to meet and maintain a specific capital level for any capital measure.
An institution is deemed to be “adequately capitalized” if it has a total risk-based capital ratio of 8% or greater, a tier 1 risk-based capital ratio of 6% or greater, a common equity tier 1 risk-based capital ratio of 4.5% or greater, and a tier 1 leverage ratio of 4% or greater.
An institution is deemed to be “undercapitalized” if it has a total risk-based capital ratio of less than 8%, a tier 1 risk-based capital ratio of less than 6%, a common equity tier 1 risk-based capital ratio of less than 4.5%, or a tier 1 leverage ratio of less than 4%. An institution is deemed to be “significantly undercapitalized” if it has a total risk-based capital ratio of less than 6%, a tier 1 risk-based capital ratio of less than 4%, a common equity tier 1 risk-based capital ratio of less than 3%, or a tier 1 leverage ratio of less than 3%. An institution is deemed to be “critically undercapitalized” if it has a ratio of tangible equity (as defined in the regulations) to total assets that is equal to or less than 2%.
“Undercapitalized” institutions are subject to growth, capital distribution (including dividend), and other limitations, and are required to submit a capital restoration plan. An institution’s compliance with such a plan is required to be guaranteed by any company that controls the undercapitalized institution in an amount equal to the lesser of 5% of the bank’s total assets when deemed undercapitalized or the amount necessary to achieve the status of adequately capitalized. If an undercapitalized institution fails to submit an acceptable plan, it is treated as if it is “significantly undercapitalized.” Significantly undercapitalized institutions are subject to one or more additional restrictions including, but not limited to, an order by the FDIC to sell sufficient voting stock to become adequately
12
Table of Contents
capitalized; requirements to reduce total assets, cease receipt of deposits from correspondent banks, or dismiss directors or officers; and restrictions on interest rates paid on deposits, compensation of executive officers, and capital distributions by the parent holding company.
Beginning 60 days after becoming “critically undercapitalized,” critically undercapitalized institutions also may not make any payment of principal or interest on certain subordinated debt, extend credit for a highly leveraged transaction, or enter into any material transaction outside the ordinary course of business. In addition, subject to a narrow exception, the appointment of a receiver is required for a critically undercapitalized institution within 270 days after it obtains such status.
Stress Testing
Stress Testing for Banks with Assets of $10 Billion to $50 Billion
FDIC and FRB regulations require certain large insured depository institutions and bank holding companies to conduct annual capital-adequacy stress tests. The rules apply to state non-member banks and bank holding companies with total consolidated assets of more than $10 billion (“covered institutions”).
Under the rules, each covered institution with between $10 billion and $50 billion in assets is required to conduct annual stress tests, using the institution’s financial data as of December 31st of the preceding year, to assess the potential impact of different scenarios on the consolidated earnings and capital and certain related items over a nine-quarter, forward-looking planning horizon, taking into account all relevant exposures and activities. The Community Bank and the Company are required to report the results of the stress tests to the FDIC and the FRB, respectively, on or before July 31st of each year, and to subsequently publish a summary of the results between October 15th and October 31st. The rules prescribe the manner and form for such reports and, based on the information reported as well as other relevant information, the FDIC and FRB are expected to conduct an analysis of the quality of the respective covered institution’s stress test processes and the related results. The FDIC and FRB envision that feedback concerning such analysis would be provided to each covered institution through the supervisory process.
As discussed below, under the FRB’s Comprehensive Capital Analysis and Review (“CCAR”) regime, additional capital stress testing requirements apply to financial institutions whose total consolidated assets average in excess of $50 billion over four consecutive quarters. At December 31, 2016, the four-quarter average of our total consolidated assets was $49.0 billion.
Stress Testing for Systemically Important Financial Institutions
Should the four-quarter average of our total consolidated assets exceed $50.0 billion (the current threshold for a Systemically Important Financial Institution, or “SIFI”), we would become subject to the FRB’s stress testing regulations administered under its CCAR capital planning and supervisory process. Under this regime, in addition to reporting the results of a SIFI’s own capital stress testing, the FRB uses its own models to evaluate whether each SIFI has the capital, on a total consolidated basis, necessary to continue operating under the economic and financial market conditions of stressed macroeconomic scenarios identified by the FRB. The FRB’s analysis includes an assessment of the projected losses, net income, and pro forma capital levels, and the regulatory capital ratio, tier 1 common ratio, and other capital ratios, for the SIFI, and uses such analytical techniques that the FRB determines to be appropriate to identify, measure, and monitor any risks of the SIFI that may affect the financial stability of the United States.
Boards of directors of SIFIs are required to review and approve capital plans before they are submitted to the FRB.
Standards for Safety and Soundness
Federal law requires each federal banking agency to prescribe, for the depository institutions under its jurisdiction, standards that relate to, among other things, internal controls; information and audit systems; loan documentation; credit underwriting; the monitoring of interest rate risk; asset growth; compensation; fees and benefits; and such other operational and managerial standards as the agency deems appropriate. The federal banking agencies adopted final regulations and Interagency Guidelines Establishing Standards for Safety and Soundness (the “Guidelines”) to implement these safety and soundness standards. The Guidelines set forth the safety and soundness standards that the federal banking agencies use to identify and address problems at insured depository institutions before capital becomes impaired. If the appropriate federal banking agency determines that an institution fails to meet any standard prescribed by the Guidelines, the agency may require the institution to provide it with an acceptable plan to achieve compliance with the standard, as required by the Federal Deposit Insurance Act, as amended, (the “FDI Act”).
13
Table of Contents
FDIC Regulations
The discussion that follows pertains to FDIC regulations other than those already discussed on the preceding pages.
Real Estate Lending Standards
The FDIC and the other federal banking agencies have adopted regulations that prescribe standards for extensions of credit that (i) are secured by real estate, or (ii) are made for the purpose of financing construction or improvements on real estate. The FDIC regulations require each institution to establish and maintain written internal real estate lending standards that are consistent with safe and sound banking practices, and appropriate to the size of the institution and the nature and scope of its real estate lending activities. The standards also must be consistent with accompanying FDIC Guidelines, which include loan-to-value limitations for the different types of real estate loans. Institutions are also permitted to make a limited amount of loans that do not conform to the proposed loan-to-value limitations as long as such exceptions are reviewed and justified appropriately. The FDIC Guidelines also list a number of lending situations in which exceptions to the loan-to-value standards are justified.
The FDIC, the Office of the Comptroller of the Currency, and the FRB (collectively, the “Agencies”) also have issued joint guidance entitled “Concentrations in Commercial Real Estate Lending, Sound Risk Management Practices” (the “CRE Guidance”). The CRE Guidance, which addresses land development, construction, and certain multi-family loans, as well as CRE loans, does not establish specific lending limits but, rather, reinforces and enhances the Agencies’ existing regulations and guidelines for such lending and portfolio management. Specifically, the CRE Guidance provides that a bank has a concentration in CRE lending if (1) total reported loans for construction, land development, and other land represent 100% or more of total risk-based capital; or (2) total reported loans secured by multi-family properties, non-farm non-residential properties (excluding those that are owner-occupied), and loans for construction, land development, and other land represent 300% or more of total risk-based capital and the bank’s CRE loan portfolio has increased 50% or more during the prior 36 months. If a concentration is present, management must employ heightened risk management practices that address key elements, including board and management oversight and strategic planning, portfolio management, development of underwriting standards, risk assessment and monitoring through market analysis and stress testing, and maintenance of increased capital levels as needed to support the level of CRE lending.
Throughout this report and others filed by the Company to disclose its consolidated financial condition and results of operations, the Company refers to its loans secured by non-farm non-residential properties as “commercial real estate” or “CRE” loans. In addition, it refers to its loans for construction, land development, and other land as “acquisition, development, and construction” or “ADC” loans.
Dividend Limitations
The FDIC has authority to use its enforcement powers to prohibit a savings bank or commercial bank from paying dividends if, in its opinion, the payment of dividends would constitute an unsafe or unsound practice. Federal law prohibits the payment of dividends that will result in the institution failing to meet applicable capital requirements on a pro forma basis. The Community Bank and the Commercial Bank are also subject to dividend declaration restrictions imposed by, and as later discussed under, “New York State Law.”
Investment Activities
Since the enactment of the Federal Deposit Insurance Corporation Improvement Act of 1991 (“FDICIA”), all state-chartered financial institutions, including savings banks, commercial banks, and their subsidiaries, have generally been limited to such activities as principal and equity investments of the type, and in the amount, authorized for national banks. The Gramm-Leach-Bliley Act of 1999 and FDIC regulations impose certain quantitative and qualitative restrictions on such activities and on a bank’s dealings with a subsidiary that engages in specified activities.
In 1993, the Community Bank received grandfathering authority from the FDIC, which it continues to use, to invest in listed stocks and/or registered shares subject to the maximum permissible investments of 100% of tier 1 capital, as specified by the FDIC’s regulations, or the maximum amount permitted by New York State Banking Law, whichever is less. Such grandfathering authority is subject to termination upon the FDIC’s determination that such investments pose a safety and soundness risk to the Community Bank, or in the event that the Community Bank converts its charter or undergoes a change in control.
14
Table of Contents
Enforcement
The FDIC has extensive enforcement authority over insured banks, including the Community Bank and the Commercial Bank. This enforcement authority includes, among other things, the ability to assess civil money penalties, to issue cease and desist orders, and to remove directors and officers. In general, these enforcement actions may be initiated in response to violations of laws and regulations and unsafe or unsound practices.
Insurance of Deposit Accounts
The deposits of the Community Bank and the Commercial Bank are insured up to applicable limits by the DIF. The maximum deposit insurance provided by the FDIC per account owner is $250,000 for all types of accounts.
Under the FDIC’s risk-based assessment system, insured institutions are assigned to one of four risk categories based upon supervisory evaluations, regulatory capital level, and certain other factors, with less risky institutions paying lower assessments based on the assigned risk levels. An institution’s assessment rate depends upon the category to which it is assigned and certain other factors. Assessment rates range from 1.5 to 40 basis points of the institution’s assessment base, which is calculated as average total assets minus average tangible equity.
In March 2016, the FDIC adopted final rules to impose a surcharge on the quarterly deposit insurance assessments of insured depository institutions with total consolidated assets of $10 billion or more, in order to fund the Dodd-Frank Act-mandated increase in the DIF’s designated reserve ratio from 1.15% to 1.35%. The final rules became effective on July 1, 2016. The surcharge, which equals 4.5 basis points of the institution’s deposit insurance assessment base, is in effect for assessments billed after the designated reserve ratio reaches 1.15%, and will continue until the reserve ratio reaches or exceeds 1.35%, but no later than December 31, 2018.
Insurance of deposits may be terminated by the FDIC upon a finding that an institution has engaged in unsafe or unsound practices, is in an unsafe or unsound condition to continue operations, or has violated any applicable law, regulation, rule, order, or condition imposed by the FDIC. Management does not know of any practice, condition, or violation that would lead to termination of the deposit insurance of either of the Banks.
Holding Company Regulations
Federal Regulation
The Company is currently subject to examination, regulation, and periodic reporting under the BHCA, as administered by the FRB.
The Company is required to obtain the prior approval of the FRB to acquire all, or substantially all, of the assets of any bank or bank holding company. Prior FRB approval would be required for the Company to acquire direct or indirect ownership or control of any voting securities of any bank or bank holding company if, after giving effect to such acquisition, it would, directly or indirectly, own or control more than 5% of any class of voting shares of such bank or bank holding company. In addition, before any bank acquisition can be completed, prior approval thereof may also be required to be obtained from other agencies having supervisory jurisdiction over the bank to be acquired, including the NYSDFS.
FRB regulations generally prohibit a bank holding company from engaging in, or acquiring, direct or indirect control of more than 5% of the voting securities of any company engaged in non-banking activities. One of the principal exceptions to this prohibition is for activities found by the FRB to be so closely related to banking or managing or controlling banks as to be a proper incident thereto. Some of the principal activities that the FRB has determined by regulation to be so closely related to banking are: (i) making or servicing loans; (ii) performing certain data processing services; (iii) providing discount brokerage services; (iv) acting as fiduciary, investment, or financial advisor; (v) leasing personal or real property; (vi) making investments in corporations or projects designed primarily to promote community welfare; and (vii) acquiring a savings and loan association.
The FRB has issued a policy statement regarding the payment of dividends by bank holding companies. In general, the FRB’s policies provide that dividends should be paid only out of current earnings, and only if the prospective rate of earnings retention by the bank holding company appears consistent with the organization’s capital needs, asset quality, and overall financial condition. The FRB’s policies also require that a bank holding company serve as a source of financial strength to its subsidiary banks by standing ready to use available resources to provide adequate capital funds to those banks during periods of financial stress or adversity, and by maintaining the financial flexibility and capital-raising capacity to obtain additional resources for assisting its subsidiary banks
15
Table of Contents
where necessary. The Dodd-Frank Act codified the source of financial strength policy and requires regulations to facilitate its application. Under the prompt corrective action laws, the ability of a bank holding company to pay dividends may be restricted if a subsidiary bank becomes undercapitalized. These regulatory policies could affect the ability of the Company to pay dividends or otherwise engage in capital distributions.
The status of the Company as a registered bank holding company under the BHCA does not exempt it from certain federal and state laws and regulations applicable to corporations generally, including, without limitation, certain provisions of the federal securities laws.
On January 30, 2017, the FRB issued a final rule that modified the CCAR capital plan and stress testing rules applicable to bank holding companies with $50 billion or more in total consolidated assets. The new rule excludes the capital plans of large and noncomplex CCAR firms from CCAR’s qualitative review and provides that the capital plans of large and noncomplex CCAR firms will no longer be subject to potential objection on qualitative grounds. The new rule also expands the transition period for new CCAR bank holding companies by (i) moving from December 31 to September 30 the cutoff date after which a new CCAR bank holding company must submit a capital plan by April 5 of the second year after it crosses the asset threshold (i.e., April 5, 2019 if it crosses the asset threshold after September 30, 2017) and (ii) providing that a new CCAR bank holding company will become subject to the CCAR stress testing rules in the year following the first year in which it submits a capital plan (i.e., 2020 if it crosses the asset threshold after September 30, 2017). As a result of the new rule, the Company may be required to expand its current capital planning beginning in 2019 and will be required to expand its current stress testing in 2020.
New York State Regulation
The Company is subject to regulation as a “multi-bank holding company” under New York State law since it controls two banking institutions. Among other requirements, this means that the Company must receive the approval of the New York State Banking Board prior to the acquisition of 10% or more of the voting stock of another banking institution, or to otherwise acquire a banking institution by merger or purchase.
Transactions with Affiliates
Under current federal law, transactions between depository institutions and their affiliates are governed by Sections 23A and 23B of the Federal Reserve Act and the FRB’s Regulation W promulgated thereunder. Generally, Section 23A limits the extent to which the institution or its subsidiaries may engage in “covered transactions” with any one affiliate to an amount equal to 10% of the institution’s capital stock and surplus, and contains an aggregate limit on all such transactions with all affiliates to an amount equal to 20% of such capital stock and surplus. Section 23A also establishes specific collateral requirements for loans or extensions of credit to, or guarantees or acceptances on letters of credit issued on behalf of, an affiliate. Section 23B requires that covered transactions and a broad list of other specified transactions be on terms substantially the same as, or at least as favorable to, the institution or its subsidiaries as similar transactions with non-affiliates.
The Sarbanes-Oxley Act of 2002 generally prohibits loans by the Company to its executive officers and directors. However, the Sarbanes-Oxley Act contains a specific exemption for loans by an institution to its executive officers and directors in compliance with other federal banking laws. Section 22(h) of the Federal Reserve Act, and FRB Regulation O adopted thereunder, govern loans by a savings bank or commercial bank to directors, executive officers, and principal shareholders.
Community Reinvestment Act
Federal Regulation
Under the Community Reinvestment Act (“CRA”), as implemented by FDIC regulations, an institution has a continuing and affirmative obligation consistent with its safe and sound operation to help meet the credit needs of its entire community, including low and moderate income neighborhoods. The CRA generally does not establish specific lending requirements or programs for financial institutions, nor does it limit an institution’s discretion to develop the types of products and services that it believes are best suited to its particular community, consistent with the CRA. In its most recent FDIC CRA performance evaluation, the Community Bank received overall state ratings of “Satisfactory” for Ohio, Florida, Arizona, and New Jersey, as well as for the New York/New Jersey multi-state region. Furthermore, the most recent overall FDIC CRA ratings for the Community Bank and the Commercial Bank were “Satisfactory.”
16
Table of Contents
New York State Regulation
The Community Bank and the Commercial Bank also are subject to provisions of the New York State Banking Law that impose continuing and affirmative obligations upon a banking institution organized in New York State to serve the credit needs of its local community. Such obligations are substantially similar to those imposed by the CRA. The latest New York State CRA ratings received by the Community Bank and the Commercial Bank were “Outstanding” and “Satisfactory,” respectively.
Bank Secrecy and Anti-Money Laundering
Federal laws and regulations impose obligations on U.S. financial institutions, including banks and broker/dealer subsidiaries, to implement and maintain appropriate policies, procedures, and controls that are reasonably designed to prevent, detect, and report instances of money laundering and the financing of terrorism, and to verify the identity of their customers. In addition, these provisions require the federal financial institution regulatory agencies to consider the effectiveness of a financial institution’s anti-money laundering activities when reviewing bank mergers and bank holding company acquisitions. Failure of a financial institution to maintain and implement adequate programs to combat money laundering and terrorist financing could have serious legal and reputational consequences for the institution.
Office of Foreign Assets Control Regulation
The United States has imposed economic sanctions that affect transactions with designated foreign countries, nationals, and others. These are typically known as the “OFAC” rules, based on their administration by the U.S. Treasury Department Office of Foreign Assets Control (“OFAC”). The OFAC-administered sanctions targeting countries take many different forms. Generally, however, they contain one or more of the following elements: (i) restrictions on trade with, or investment in, a sanctioned country, including prohibitions against direct or indirect imports from, and exports to, a sanctioned country and prohibitions on “U.S. persons” engaging in financial transactions relating to making investments in, or providing investment-related advice or assistance to, a sanctioned country; and (ii) a blocking of assets in which the government or specially designated nationals of the sanctioned country have an interest, by prohibiting transfers of property subject to U.S. jurisdiction (including property in the possession or control of U.S. persons). Blocked assets (e.g., property and bank deposits) cannot be paid out, withdrawn, set off, or transferred in any manner without a license from OFAC. Failure to comply with these sanctions could have serious legal and reputational consequences.
Federal Reserve System
Under FRB regulations, the Community Bank and the Commercial Bank are required to maintain reserves against their transaction accounts (primarily NOW and regular checking accounts). Beginning January 2017, the Banks are required to maintain average daily reserves equal to 3% on aggregate transaction accounts of up to $115.1 million, plus 10% on the remainder, and the first $15.5 million of otherwise reservable balances will both be exempt. These reserve requirements are subject to adjustment by the FRB. The Community Bank and the Commercial Bank currently are in compliance with the foregoing requirements.
Federal Home Loan Bank System
The Community Bank and the Commercial Bank are members of the Federal Home Loan Bank of New York (the “FHLB-NY”). As members of the FHLB-NY, the Community Bank and the Commercial Bank are required to acquire and hold shares of FHLB-NY capital stock. At December 31, 2016, the Community Bank held $574.5 million of FHLB-NY stock and the Commercial Bank held $16.4 million of FHLB-NY stock.
New York State Law
The Community Bank and the Commercial Bank derive their lending, investment, and other authority primarily from the applicable provisions of New York State Banking Law and the regulations of the NYSDFS, as limited by FDIC regulations. Under these laws and regulations, banks, including the Community Bank and the Commercial Bank, may invest in real estate mortgages, consumer and commercial loans, certain types of debt securities (including certain corporate debt securities, and obligations of federal, state, and local governments and agencies), certain types of corporate equity securities, and certain other assets.
17
Table of Contents
Under New York State Banking Law, New York State-chartered stock-form savings banks and commercial banks may declare and pay dividends out of their net profits, unless there is an impairment of capital. Approval of the Superintendent is required if the total of all dividends declared by the bank in a calendar year would exceed the total of its net profits for that year combined with its retained net profits for the preceding two years, less prior dividends paid.
New York State Banking Law gives the Superintendent authority to issue an order to a New York State-chartered banking institution to appear and explain an apparent violation of law, to discontinue unauthorized or unsafe practices, and to keep prescribed books and accounts. Upon a finding by the NYSDFS that any director, trustee, or officer of any banking organization has violated any law, or has continued unauthorized or unsafe practices in conducting the business of the banking organization after having been notified by the Superintendent to discontinue such practices, such director, trustee, or officer may be removed from office after notice and an opportunity to be heard. The Superintendent also has authority to appoint a conservator or a receiver for a savings or commercial bank under certain circumstances.
Interstate Branching
Federal law allows the FDIC, and New York State Banking Law allows the Superintendent, to approve an application by a state banking institution to acquire interstate branches by merger, unless, in the case of the FDIC, the state of the target institution has opted out of interstate branching. New York State Banking Law authorizes savings banks and commercial banks to open and occupy de novo branches outside the state of New York. Pursuant to the Dodd-Frank Act, the FDIC is authorized to approve a state bank’s establishment of a de novo interstate branch if the intended host state allows de novo branching by banks chartered by that state. The Community Bank currently maintains 45 branches in New Jersey, 27 branches in Florida, 28 branches in Ohio, and 14 branches in Arizona, in addition to its 111 branches in New York State.
Acquisition of the Holding Company
Federal Restrictions
Under the Federal Change in Bank Control Act (“CIBCA”), a notice must be submitted to the FRB if any person (including a company), or group acting in concert, seeks to acquire 10% or more of the Company’s shares of outstanding common stock, unless the FRB has found that the acquisition will not result in a change in control of the Company. Under the CIBCA, the FRB generally has 60 days within which to act on such notices, taking into consideration certain factors, including the financial and managerial resources of the acquirer; the convenience and needs of the communities served by the Company, the Community Bank, and the Commercial Bank; and the anti-trust effects of the acquisition. Under the BHCA, any company would be required to obtain approval from the FRB before it may obtain “control” of the Company within the meaning of the BHCA. Control generally is defined to mean the ownership or power to vote 25% or more of any class of voting securities of the Company, the ability to control in any manner the election of a majority of the Company’s directors, or the power to exercise a controlling influence over the management or policies of the Company. Under the BHCA, an existing bank holding company would be required to obtain the FRB’s approval before acquiring more than 5% of the Company’s voting stock. See “Holding Company Regulation” earlier in this report.
New York State Change in Control Restrictions
New York State Banking Law generally requires prior approval of the New York State Banking Board before any action is taken that causes any company to acquire direct or indirect control of a banking institution which is organized in New York.
Federal Securities Law
The Company’s common stock and certain other securities listed on the cover page of this report are registered with the SEC under the Securities Exchange Act of 1934, as amended (the “Exchange Act”). The Company is subject to the information and proxy solicitation requirements, insider trading restrictions, and other requirements under the Exchange Act.
18
Table of Contents
Consumer Protection Regulations
The activities of the Company’s banking subsidiaries, including their lending and deposit gathering activities, are subject to a variety of consumer laws and regulations designed to protect consumers. These laws and regulations mandate certain disclosure requirements, and regulate the manner in which financial institutions must deal with clients and monitor account activity when taking deposits from, making loans to, or engaging in other types of transactions with, such clients. Failure to comply with these laws and regulations could lead to substantial penalties, operating restrictions, and reputational damage to the financial institution.
Applicable consumer protection laws include, but may not be limited to, the Dodd-Frank Act, Truth in Lending Act, Truth in Savings Act, Equal Credit Opportunity Act, Electronic Funds Transfer Act, Fair Housing Act, Home Mortgage Disclosure Act, Fair Debt Collection Practices Act, Fair Credit Reporting Act, Expedited Funds Availability (Regulation CC), Reserve Requirements (Regulation D), Insider Transactions (Regulation O), Privacy of Consumer Information (Regulation P), Margin Stock Loans (Regulation U), Right To Financial Privacy Act, Flood Disaster Protection Act, Homeowners Protection Act, Servicemembers Civil Relief Act, Real Estate Settlement Procedures Act, Telephone Consumer Protection Act, CAN-SPAM Act, Children’s Online Privacy Protection Act, and the John Warner National Defense Authorization Act.
In addition, the Banks and their subsidiaries are subject to certain state laws and regulations designed to protect consumers.
Consumer Financial Protection Bureau
The Banks are subject to oversight by the CFPB within the Federal Reserve System. The CFPB was established under the Dodd-Frank Act to implement rules and regulations under certain federal consumer protection laws with respect to the conduct of providers of certain consumer financial products and services. The CFPB has broad rulemaking authority for a wide range of consumer financial laws that apply to all banks, including, among other things, the authority to prohibit acts and practices that are deemed to be unfair, deceptive, or abusive. Abusive acts or practices are defined as those that (1) materially interfere with a consumer’s ability to understand a term or condition of a consumer financial product or service, or (2) take unreasonable advantage of a consumer’s (a) lack of financial savvy, (b) inability to protect himself in the selection or use of consumer financial products or services, or (c) reasonable reliance on a covered entity to act in the consumer’s interests. The CFPB has the authority to investigate possible violations of federal consumer financial law, hold hearings, and commence civil litigation. The CFPB can issue cease-and-desist orders against banks and other entities that violate consumer financial laws. The CFPB also may institute a civil action against an entity in violation of federal consumer financial law in order to impose a civil penalty or an injunction. The CFPB has examination and enforcement authority over all banks with more than $10 billion in assets, as well as certain of their affiliates.
Enterprise Risk Management
The Company’s and the Banks’ Boards of Directors are actively engaged in the process of overseeing our efforts to identify, measure, monitor, and mitigate risk. We maintain various internal controls to address risks that threaten our ability to achieve our goals and objectives, including with respect to safety and soundness and consumer protection. We have established an Enterprise Risk Management (“ERM”) program, which follows the FRB’s guidance on the adequacy of risk management processes and internal controls. Our risk management controls are designed to conform to the principles set forth in the Internal Control-Integrated Framework (2013) established by the Committee of Sponsoring Organizations of the Treadway Commission (“COSO”).
The Boards are responsible for the approval and oversight of the execution of the ERM Program; setting and revising the Company and the Banks’ risk appetite in conjunction with the goals and objectives set forth in their strategic plans; and reviewing key risk indicators against established risk warning levels and limits, including those identified in reports presented by the Chief Risk Officer.
19
Table of Contents
| ITEM 1A. | RISK FACTORS |
There are various risks and uncertainties that are inherent to our business. Primary among these are (1) interest rate risk, which arises from movements in interest rates; (2) credit risk, which arises from an obligor’s failure to meet the terms of any contract with a bank or to otherwise perform as agreed; (3) liquidity risk, which arises from a bank’s inability to meet its obligations when they come due without incurring unacceptable losses; (4) legal/ compliance risk, which arises from violations of, or non-conformance with, laws, rules, regulations, prescribed practices, or ethical standards; (5) market risk, which arises from changes in the value of portfolios of financial instruments; (6) strategic risk, which arises from adverse business decisions or improper implementation of those business decisions; (7) operational risk, which arises from problems with service or product delivery; and (8) reputational risk, which arises from negative public opinion.
Following is a discussion of the material risks and uncertainties that could have a material adverse impact on our financial condition, results of operations, and the value of our shares. Additional risks that are not currently known to us, or that we currently believe to be immaterial, also may have a material effect on our financial condition and results of operations. This report is qualified in its entirety by those risk factors.
Interest Rate Risks
Changes in interest rates could reduce our net interest income and mortgage banking income, and negatively impact the value of our loans, securities, and other assets. This could have a material adverse effect on our cash flows, financial condition, results of operations, and capital.
Our primary source of income is net interest income, which is the difference between the interest income generated by our interest-earning assets (consisting primarily of loans and, to a lesser extent, securities) and the interest expense produced by our interest-bearing liabilities (consisting primarily of deposits and wholesale borrowings).
The cost of our deposits and short-term wholesale borrowings is largely based on short-term interest rates, the level of which is driven by the Federal Open Market Committee of the FRB. However, the yields generated by our loans and securities are typically driven by intermediate-term (e.g., five-year) interest rates, which are set by the market and generally vary from day to day. The level of our net interest income is therefore influenced by movements in such interest rates, and the pace at which such movements occur. If the interest rates on our interest-bearing liabilities increase at a faster pace than the interest rates on our interest-earning assets, the result could be a reduction in net interest income and, with it, a reduction in our earnings. Our net interest income and earnings would be similarly impacted were the interest rates on our interest-earning assets to decline more quickly than the interest rates on our interest-bearing liabilities.
In addition, such changes in interest rates could affect our ability to originate loans and attract and retain deposits; the fair values of our securities and other financial assets; the fair values of our liabilities; and the average lives of our loan and securities portfolios.
Changes in interest rates also could have an effect on loan refinancing activity which, in turn, would impact the amount of prepayment income we receive on our multi-family and CRE loans, and the amount of mortgage banking income we generate as a result of originating and servicing one-to-four family loans for sale. Because prepayment income is recorded as interest income, the extent to which it increases or decreases during any given period could have a significant impact on the level of net interest income and net income we generate during that time.
In addition, changes in interest rates could have an effect on the slope of the yield curve. If the yield curve were to invert or become flat, our net interest income and net interest margin could contract, adversely affecting our net income and cash flows, and the value of our assets.
Our use of derivative financial instruments to mitigate exposure to the interest rate risk that stems from our mortgage banking business may not be effective, and may adversely affect our mortgage banking income, earnings, and stockholders’ equity.
We are actively engaged in the origination of one-to-four family loans for sale. In accordance with our operating policies, we may use various types of derivative financial instruments, including forward-rate agreements, options, and other derivative transactions, to mitigate or reduce our exposure to losses from adverse changes in interest rates in connection with this business. We vary the scope of these risk mitigation strategies, based on the types of assets we hold, the level and volatility of market interest rates, and other changing market
20
Table of Contents
conditions. However, no strategy can completely insulate us from the interest rate risks to which we are exposed, and there is no guarantee that any strategy we implement will have the desired impact. Furthermore, although derivatives are intended to limit losses, they may actually have an adverse impact on our earnings, which could reduce our capital and the cash available to us for distribution to our shareholders in the form of dividends. Our derivative financial instruments also expose us to counterparty risk, which is the risk that other parties to the instruments will not fulfill their contractual obligations.
Credit Risks
A decline in the quality of our assets could result in higher losses and the need to set aside higher loan loss provisions, thus reducing our earnings and our stockholders’ equity.
The inability of our borrowers to repay their loans in accordance with their terms would likely necessitate an increase in our provision for non-covered loan losses, and therefore reduce our earnings.
The non-covered loans we originate for investment are primarily multi-family loans and, to a lesser extent, CRE loans. Such loans are generally larger, and have higher risk-adjusted returns and shorter maturities, than the one-to-four family mortgage loans we produce for investment and for sale. Our credit risk would ordinarily be expected to increase with the growth of our multi-family and CRE loan portfolios.
Payments on multi-family and CRE loans generally depend on the income generated by the underlying properties which, in turn, depends on their successful operation and management. The ability of our borrowers to repay these loans may be impacted by adverse conditions in the local real estate market and the local economy. While we seek to minimize these risks through our underwriting policies, which generally require that such loans be qualified on the basis of the collateral property’s cash flows, appraised value, and debt service coverage ratio, among other factors, there can be no assurance that our underwriting policies will protect us from credit-related losses or delinquencies.
We also originate ADC and C&I loans for investment, although to a far lesser degree than we originate multi-family and CRE loans. ADC financing typically involves a greater degree of credit risk than longer-term financing on multi-family and CRE properties. Risk of loss on an ADC loan largely depends upon the accuracy of the initial estimate of the property’s value at completion of construction or development, compared to the estimated costs (including interest) of construction. If the estimate of value proves to be inaccurate, the loan may be under-secured. While we seek to minimize these risks by maintaining consistent lending policies and procedures, and rigorous underwriting standards, an error in such estimates, among other factors, could have a material adverse effect on the quality of our ADC loan portfolio, thereby resulting in losses or delinquencies.
To minimize the risks involved in our specialty finance lending and leasing, we participate in syndicated loans that are brought to us, and equipment loans and leases that are assigned to us, by a select group of nationally recognized sources, and generally are made to large corporate obligors, many of which are publicly traded, carry investment grade or near-investment grade ratings, and participate in stable industries nationwide. Each of our credits is secured with a perfected first security interest in the underlying collateral and structured as senior debt or as a non-cancelable lease.
We seek to minimize the risks involved in our other C&I lending by underwriting such loans on the basis of the cash flows produced by the business; by requiring that such loans be collateralized by various business assets, including inventory, equipment, and accounts receivable, among others; and by requiring personal guarantees. However, the capacity of a borrower to repay such a C&I loan is substantially dependent on the degree to which his or her business is successful. In addition, the collateral underlying other C&I loans may depreciate over time, may not be conducive to appraisal, or may fluctuate in value, based upon the results of operations of the business.
Although losses on the non-covered held-for-investment loans we produce have been comparatively limited, even during periods of economic weakness in our markets, we cannot guarantee that this will be our experience in future periods. The ability of our borrowers to repay their loans could be adversely impacted by a decline in real estate values and/or an increase in unemployment, which not only could result in our experiencing losses, but also could necessitate our recording a provision for losses on non-covered loans. Either of these events would have an adverse impact on our net income.
21
Table of Contents
Economic weakness in the New York metropolitan region, where the majority of the properties collateralizing our multi-family, CRE, and ADC loans, and the majority of the businesses collateralizing our other C&I loans, are located could have an adverse impact on our financial condition and results of operations.
Unlike larger national or superregional banks that serve a broader and more diverse geographic region, our business depends significantly on general economic conditions in the New York metropolitan region, where the majority of the buildings and properties securing the multi-family, CRE, and ADC loans we originate for investment, and the businesses of the customers to whom we make our other C&I loans, are located.
Accordingly, the ability of our borrowers to repay their loans, and the value of the collateral securing such loans, may be significantly affected by economic conditions in this region, including changes in the local real estate market. A significant decline in general economic conditions caused by inflation, recession, unemployment, acts of terrorism, extreme weather, or other factors beyond our control, could therefore have an adverse effect on our financial condition and results of operations. In addition, because multi-family and CRE loans represent the majority of the loans in our portfolio, a decline in tenant occupancy or rents due to such factors, or for other reasons, could adversely impact the ability of our borrowers to repay their loans on a timely basis, which could have a negative impact on our net income.
Furthermore, economic or market turmoil could occur in the near or long term. This could negatively affect our business, our financial condition, and our results of operations, as well as our ability to maintain or increase the level of cash dividends we currently pay to our shareholders.
If our covered loan portfolio experiences greater losses than we expected at the time of acquisition, or experiences losses following the expiration of the FDIC loss sharing agreements to which it is subject, or if those agreements are not properly managed, our financial condition and results of operations could be adversely affected.
The credit risk associated with the one-to-four family loans and other loans we acquired in our AmTrust Bank (“AmTrust”) and Desert Hills Bank (“Desert Hills”) acquisitions is largely mitigated by our loss sharing agreements with the FDIC. Nonetheless, these assets are not without risk. Although the loans and other real estate owned we acquired were initially accounted for at fair value, there is no assurance that they will not become impaired, which could require us to charge off such assets and, in doing so, recognize losses. Fluctuations in national, regional, and local economic conditions may increase the level of charge-offs on the loans we acquired in these transactions, and would therefore have an adverse impact on our net income. Such fluctuations are not predictable, cannot be controlled, and may have a material adverse impact on our results of operations and financial condition, even if other favorable events occur.
In addition, although our loss sharing agreements call for the FDIC to bear a significant portion of any losses related to the acquired loan portfolios, we are not protected from all losses resulting from charge-offs with respect to the acquired loans.
Furthermore, our FDIC loss sharing agreements are limited in their duration: The remaining agreements pertaining to the covered loans we acquired in connection with our AmTrust and Desert Hills acquisitions are scheduled to expire in December 2019 and March 2020, respectively.
Our allowance for losses on non-covered loans might not be sufficient to cover our actual losses, which would adversely impact our financial condition and results of operations.
In addition to mitigating credit risk through our underwriting processes, we attempt to mitigate such risk through the establishment of an allowance for losses on non-covered loans. The process of determining whether or not this allowance is sufficient to cover potential non-covered loan losses is based on the methodology described in detail under “Critical Accounting Policies” in Item 7, “Management’s Discussion and Analysis of Financial Condition and Results of Operations” in this report.
If the judgments and assumptions we make with regard to the allowance are incorrect, our allowance for losses on such loans might not be sufficient, and additional non-covered loan loss provisions might need to be made. Depending on the amount of such loan loss provisions, the adverse impact on our earnings could be material.
In addition, growth in our portfolio of non-covered loans held for investment may require us to increase the allowance for losses on such loans by making additional provisions, which would reduce our net income. Furthermore, bank regulators have the authority to require us to make provisions for non-covered loan losses or otherwise recognize loan charge-offs following their periodic review of our held-for-investment loan portfolio, our
22
Table of Contents
underwriting procedures, and our allowance for losses on such loans. Any increase in the non-covered loan loss allowance or loan charge-offs as required by such regulatory authorities could have a material adverse effect on our financial condition and results of operations.
Liquidity Risks
Failure to maintain an adequate level of liquidity could result in an inability to fulfill our financial obligations and also could subject us to material reputational and compliance risk.
“Liquidity” refers to our ability to generate sufficient cash flows to support our operations and to fulfill our obligations, including commitments to originate loans, to repay our wholesale borrowings and other liabilities, and to satisfy the withdrawal of deposits by our customers.
Our primary sources of liquidity are the retail and institutional deposits we gather or acquire in connection with acquisitions, and the brokered deposits we accept; borrowed funds, primarily in the form of wholesale borrowings from the FHLB-NY and various Wall Street brokerage firms; cash flows generated through the repayment and sale of loans; and cash flows generated through the repayment and sale of securities. In addition, and depending on current market conditions, we have the ability to access the capital markets from time to time to generate additional liquidity.
Deposit flows, calls of investment securities and wholesale borrowings, and the prepayment of loans and mortgage-related securities are strongly influenced by such external factors as the direction of interest rates, whether actual or perceived; local and national economic conditions; and competition for deposits and loans in the markets we serve. The withdrawal of more deposits than we anticipate could have an adverse impact on our profitability as this source of funding, if not replaced by similar deposit funding, would need to be replaced with wholesale funding, the sale of interest-earning assets, or a combination of the two. The replacement of deposit funding with wholesale funding could cause our overall cost of funds to increase, which would reduce our net interest income and results of operations. A decline in interest-earning assets would also lower our net interest income and results of operations.
In addition, large-scale withdrawals of brokered or institutional deposits could require us to pay significantly higher interest rates on our retail deposits or on other wholesale funding sources, which would have an adverse impact on our net interest income and net income. Furthermore, changes to the FHLB’s underwriting guidelines for wholesale borrowings or lending policies may limit or restrict our ability to borrow, and therefore could have a significant adverse impact on our liquidity. A decline in available funding could adversely impact our ability to originate loans, invest in securities, and meet our expenses, or to fulfill such obligations as repaying our borrowings or meeting deposit withdrawal demands.
A downgrade of the credit ratings of the Company and the Banks could also adversely affect our access to liquidity and capital, and could significantly increase our cost of funds, trigger additional collateral or funding requirements, and decrease the number of investors and counterparties willing to lend to us or to purchase our securities. This could affect our growth, profitability, and financial condition, including our liquidity.
If we were to defer payments on our trust preferred capital debt securities or were in default under the related indentures, we would be prohibited from paying dividends or distributions on our common stock.
The terms of our outstanding trust preferred capital debt securities prohibit us from (1) declaring or paying any dividends or distributions on our capital stock, including our common stock; or (2) purchasing, acquiring, or making a liquidation payment on such stock, under the following circumstances: (a) if an event of default has occurred and is continuing under the applicable indenture; (b) if we are in default with respect to a payment under the guarantee of the related trust preferred securities; or (c) if we have given notice of our election to defer interest payments but the related deferral period has not yet commenced, or a deferral period is continuing. In addition, without notice to, or consent from, the holders of our common stock, we may issue additional series of trust preferred capital debt securities with similar terms, or enter into other financing agreements, that limit our ability to pay dividends on our common stock.
Legal/Compliance Risks
Inability to fulfill minimum capital requirements could limit our ability to conduct or expand our business, pay a dividend, or result in termination of our FDIC deposit insurance, and thus impact our financial condition, our results of operations, and the market value of our stock.
We are subject to the comprehensive, consolidated supervision and regulation set forth by the FRB. Such regulation includes, among other matters, the level of leverage and risk-based capital ratios we are required to
23
Table of Contents
maintain. Depending on general economic conditions, changes in our capital position could have a materially adverse impact on our financial condition and risk profile, and also could limit our ability to grow through acquisitions or otherwise. Compliance with regulatory capital requirements may limit our ability to engage in operations that require the intensive use of capital and therefore could adversely affect our ability to maintain our current level of business or expand.
Furthermore, it is possible that future regulatory changes could result in more stringent capital or liquidity requirements, including increases in the levels of regulatory capital we are required to maintain and changes in the way capital or liquidity is measured for regulatory purposes, either of which could adversely affect our business and our ability to expand. For example, federal banking regulations adopted under Basel III standards require bank holding companies and banks to undertake significant activities to demonstrate compliance with higher capital requirements. Any additional requirements to increase our capital ratios or liquidity could necessitate our liquidating certain assets, perhaps on terms that are unfavorable to us or that are contrary to our business plans. In addition, such requirements could also compel us to issue additional securities, thus diluting the value of our common stock.
In addition, failure to meet established capital requirements could result in the FRB placing limitations or conditions on our activities and further restricting the commencement of new activities. The failure to meet applicable capital guidelines could subject us to a variety of enforcement remedies available to the federal regulatory authorities, including limiting our ability to pay dividends; issuing a directive to increase our capital; and terminating our FDIC deposit insurance.
Inability to fulfill minimum liquidity requirements could limit our ability to conduct or expand our business, pay a dividend, or result in termination of our FDIC deposit insurance, and thus impact our financial condition, our results of operations, and the market value of our stock.
On September 3, 2014, the FRB and other banking regulators adopted final rules implementing a U.S. version of the Basel Committee’s Liquidity Coverage Ratio (the “LCR”) requirement. The LCR requirement, including the modified version applicable to bank holding companies with $50 billion or more in total consolidated assets that have not opted to use the “advanced approaches” risk-based capital rule, requires a banking organization to maintain an amount of unencumbered “high-quality liquid assets” (“HQLAs”) to be at least equal to the amount of its total projected net cash outflows over a hypothetical 30-day stress period. Under the rule, only specific classes of assets qualify as HQLAs (the numerator of the LCR), with riskier classes of assets subject to haircuts and caps.
The total net cash outflow amount (the denominator of the LCR) is determined under the rule by applying outflow and inflow rates that reflect certain standardized assumptions against the balance of the banking organization’s funding sources, obligations, transactions, and assets over the hypothetical 30-day stress period. Inflows that can be included to offset outflows are limited to 75% of outflows (which effectively means that banking organizations must hold HQLAs equal to 25% of outflows even if outflows perfectly match inflows over the stress period).
On November 20, 2015, the FRB issued a proposed rule that would provide companies that become subject to the modified LCR rule after the rule’s effective date a full year to comply with the rule. The proposed rule was finalized on December 19, 2016.
The modified LCR is a minimum requirement, and the FRB can impose additional liquidity requirements as a supervisory matter.
Should the average of our total consolidated assets over four consecutive quarters pass the current SIFI threshold of $50.0 billion, we would expect to be subject to stricter prudential standards required by the Dodd-Frank Act for large bank holding companies.
Pursuant to the current requirements of the Dodd-Frank Act, a bank holding company whose total consolidated assets average more than $50 billion over the four most recent quarters is determined to be a SIFI, and therefore is subject to stricter prudential standards. In addition to capital and liquidity requirements, these standards primarily include risk-management requirements, dividend limits, and early remediation regimes.
Our results of operations could be materially affected by further changes in bank regulation, or by our ability to comply with certain existing laws, rules, and regulations governing our industry.
We are subject to regulation, supervision, and examination by the following entities: (1) the NYSDFS, the chartering authority for both the Community Bank and the Commercial Bank; (2) the FDIC, as the insurer of the Banks’ deposits; (3) the FRB-NY, in accordance with objectives and standards of the U.S. Federal Reserve System; and (4) the CFPB, which was established in 2011 under the Dodd-Frank Act and given broad authority to regulate financial service providers and financial products.
24
Table of Contents
Such regulation and supervision governs the activities in which a bank holding company and its banking subsidiaries may engage, and are intended primarily for the protection of the DIF, the banking system in general, and bank customers, rather than for the benefit of a company’s stockholders. These regulatory authorities have extensive discretion in connection with their supervisory and enforcement activities, including with respect to the imposition of restrictions on the operation of a bank or a bank holding company, the imposition of significant fines, the ability to delay or deny merger or other regulatory applications, the classification of assets by a bank, and the adequacy of a bank’s allowance for loan losses, among other matters. Changes in such regulation and supervision, or changes in regulation or enforcement by such authorities, whether in the form of policy, regulations, legislation, rules, orders, enforcement actions, ratings, or decisions, could have a material impact on the Company, our subsidiary banks and other affiliates, and our operations. In addition, failure of the Company or the Banks to comply with such regulations could have a material adverse effect on our earnings and capital.
See “Regulation and Supervision” in Part I, Item 1, “Business” earlier in this filing for a detailed description of the federal, state, and local regulations to which the Company and the Banks are subject.
Our enterprise risk management framework may not be effective in mitigating the risks to which we are subject, based upon the size, scope, and complexity of the Company.
As a financial institution, we are subject to a number of risks, including interest rate, credit, liquidity, legal/compliance, market, strategic, operational, and reputational. Our ERM framework is designed to minimize the risks to which we are subject, as well as any losses stemming from such risks. Although we seek to identify, measure, monitor, report, and control our exposure to such risks, and employ a broad and diverse set of risk monitoring and mitigation techniques in the process, those techniques are inherently limited because they cannot anticipate the existence or development of risks that are currently unknown and unanticipated.
For example, economic and market conditions, heightened legislative and regulatory scrutiny of the financial services industry, and increases in the overall complexity of our operations, among other developments, have resulted in the creation of a variety of risks that were previously unknown and unanticipated, highlighting the intrinsic limitations of our risk monitoring and mitigation techniques. As a result, the further development of previously unknown or unanticipated risks may result in our incurring losses in the future that could adversely impact our financial condition and results of operations. Furthermore, an ineffective ERM framework, as well as other risk factors, could result in a material increase in our FDIC insurance premiums.
Market Risks
A decline in economic conditions could adversely affect the value of the loans we originate and the securities in which we invest.
Although we take steps to reduce our exposure to the risks that stem from adverse changes in economic conditions, such changes nevertheless could adversely impact the value of the loans we originate, the securities we invest in, and our portfolios of covered and non-covered loans.
Declines in real estate values and home sales, and an increase in the financial stress on borrowers stemming from high unemployment or other adverse economic conditions, could negatively affect our borrowers and, in turn, the repayment of the loans in our portfolio. Deterioration in economic conditions also could subject us and our industry to increased regulatory scrutiny, and could result in an increase in loan delinquencies, an increase in problem assets and foreclosures, and a decline in the value of the collateral for our loans, which could reduce our customers’ borrowing power. Deterioration in local economic conditions could drive the level of loan losses beyond the level we have provided for in our loan loss allowances; this, in turn, could necessitate an increase in our provisions for loan losses, which would reduce our earnings and capital. Furthermore, declines in the value of our investment securities could result in our having to record losses based on the other-than-temporary impairment of securities, which would reduce our earnings and also could reduce our capital. In addition, continued economic weakness could reduce the demand for our products and services, which would adversely impact our liquidity and the revenues we produce.
25
Table of Contents
The market price and liquidity of our common stock could be adversely affected if the economy were to weaken or the capital markets were to experience volatility.
The market price of our common stock could be subject to significant fluctuations due to changes in sentiment in the market regarding our operations or business prospects. Among other factors, these risks may be affected by:
| • | Operating results that vary from the expectations of our management or of securities analysts and investors; |
| • | Developments in our business or in the financial services sector generally; |
| • | Regulatory or legislative changes affecting our industry generally or our business and operations; |
| • | Operating and securities price performance of companies that investors consider to be comparable to us; |
| • | Changes in estimates or recommendations by securities analysts or rating agencies; |
| • | Announcements of strategic developments, acquisitions, dispositions, financings, and other material events by us or our competitors; |
| • | Changes or volatility in global financial markets and economies, general market conditions, interest or foreign exchange rates, stock, commodity, credit, or asset valuations; and |
| • | Significant fluctuations in the capital markets. |
Economic or market turmoil could occur in the near or long term, which could negatively affect our business, our financial condition, and our results of operations, as well as volatility in the price and trading volume of our common stock.
Strategic Risks
Extensive competition for loans and deposits could adversely affect our ability to expand our business, as well as our financial condition and results of operations.
We face significant competition for loans and deposits from other banks and financial institutions, both within and beyond our local markets. We also compete with companies that solicit loans and deposits over the Internet.
Because our profitability stems from our ability to attract deposits and originate loans, our continued ability to compete for depositors and borrowers is critical to our success. Our success as a competitor depends on a number of factors, including our ability to develop, maintain, and build long-term relationships with our customers by providing them with convenience, in the form of multiple branch locations, extended hours of service, and access through alternative delivery channels; a broad and diverse selection of products and services; interest rates and service fees that compare favorably with those of our competitors; and skilled and knowledgeable personnel to assist our customers by addressing their financial needs. External factors that may impact our ability to compete include, among others, the entry of new lenders and depository institutions in our current markets and, with regard to lending, an increased focus on multi-family and CRE lending by existing competitors.
In addition, our mortgage banking operation competes nationally with other major banks and mortgage brokers that also originate, aggregate, sell, and service one-to-four family loans.
Limitations on our ability to grow our portfolios of multi-family and CRE loans could adversely affect our ability to generate interest income, as well our financial condition and results of operations, perhaps materially.
Although we also originate ADC, one-to-four family, and C&I loans, and invest in securities, our portfolios of multi-family and CRE loans represent the largest portion of our asset mix (87.8% of total loans as of December 31, 2016). Our position in these markets has been instrumental to our production of solid earnings and our consistent record of exceptional asset quality. In view of the heightened regulatory focus on CRE concentration, we monitor the ratio of our multi-family, CRE, and ADC loans (as defined in the CRE Guidance) to our total risk-based capital to ensure that it remains within the 850% limit we have agreed to with our regulators. Were the ratio to exceed that limit, we would act to rectify it, either by reducing our multi-family, CRE, and ADC loan production and/or by raising additional capital. Either of these actions could have an adverse impact on our net interest income and our earnings capacity, as would any further regulatory limitations on our CRE lending. (See the discussion on CRE Guidance that appears in “FDIC Regulations – Real Estate Lending Standards” under “Regulation and Supervision” earlier in this report.)
26
Table of Contents
The inability to engage in merger transactions, or to realize the anticipated benefits of acquisitions in which we might engage, could adversely affect our ability to compete with other financial institutions and weaken our financial performance.
Mergers and acquisitions have contributed significantly to our growth and it is possible that we will look to acquire other financial institutions, financial service providers, or branches of banks in the future.
Our ability to engage in future mergers and acquisitions would depend on our ability to identify suitable merger partners and acquisition opportunities, our ability to finance and complete negotiated transactions at acceptable prices and on acceptable terms, and our ability to obtain the necessary shareholder and regulatory approvals.
If we are unable to engage in or complete a desired acquisition or merger transaction, our financial condition and results of operations could be adversely impacted. As acquisitions have been a significant source of deposits, the inability to complete a business combination could require that we increase the interest rates we pay on deposits in order to attract such funding through our current branch network, or that we increase our use of wholesale funds. Increasing our cost of funds could adversely impact our net interest income and our net income. Furthermore, the absence of acquisitions could impact our ability to fulfill our loan demand.
Mergers and acquisitions involve a number of risks and challenges, including:
| • | Our ability to successfully integrate the branches and operations we acquire, and to adopt appropriate internal controls and regulatory functions relating to such activities; |
| • | Our ability to limit the outflow of deposits held by customers in acquired branches, and to successfully retain and manage any loans we acquire; |
| • | Our ability to attract new deposits, and to generate new interest-earning assets, in geographic areas we have not previously served; |
| • | Our success in deploying any cash received in a transaction into assets bearing sufficiently high yields without incurring unacceptable credit or interest rate risk; |
| • | Our ability to control the incremental non-interest expense from acquired operations; |
| • | Our ability to retain and attract the appropriate personnel to staff acquired branches and conduct any acquired operations; |
| • | Our ability to generate acceptable levels of net interest income and non-interest income, including fee income, from acquired operations; |
| • | The diversion of management’s attention from existing operations; |
| • | Our ability to address an increase in working capital requirements; and |
| • | Limitations on our ability to successfully reposition the post-merger balance sheet when deemed appropriate. |
In addition, mergers and acquisitions can lead to uncertainties about the future on the part of customers and employees. Such uncertainties could cause customers and others to consider changing their existing business relationships with the company to be acquired, and could cause its employees to accept positions with other companies before the merger occurs. As a result, the ability of a company to attract and retain customers, and to attract, retain, and motivate key personnel, prior to a merger’s completion could be impaired.
Furthermore, no assurance can be given that acquired operations would not adversely affect our existing profitability; that we would be able to achieve results in the future similar to those achieved by our existing banking business; that we would be able to compete effectively in the market areas served by acquired branches; or that we would be able to manage any growth resulting from a transaction effectively. In particular, our ability to compete effectively in new markets would be dependent on our ability to understand those markets and their competitive dynamics, and our ability to retain certain key employees from the acquired institution who know those markets better than we do.
If our goodwill were determined to be impaired, it would result in a charge against earnings and thus a reduction in our stockholders’ equity.
We test goodwill for impairment on an annual basis, or more frequently, if necessary. If we were to determine that the carrying amount of our goodwill exceeded its implied fair value, we would be required to write down the value of the goodwill on our balance sheet, adversely affecting our earnings as well as our capital.
27
Table of Contents
The inability to receive dividends from our subsidiary banks could have a material adverse effect on our financial condition or results of operations, as well as our ability to maintain or increase the current level of cash dividends we pay to our shareholders.
The Parent Company (i.e., the company on an unconsolidated basis) is a separate and distinct legal entity from the Banks, and a substantial portion of the revenues the Parent Company receives consists of dividends from the Banks. These dividends are the primary funding source for the dividends we pay on our common stock and the interest and principal payments on our debt. Various federal and state laws and regulations limit the amount of dividends that a bank may pay to its parent company. In addition, our right to participate in a distribution of assets upon the liquidation or reorganization of a subsidiary may be subject to the prior claims of the subsidiary’s creditors. If the Banks are unable to pay dividends to the Parent Company, we might not be able to service our debt, pay our obligations, or pay dividends on our common stock.
Reduction or elimination of our quarterly cash dividend could have an adverse impact on the market price of our common stock.
Holders of our common stock are only entitled to receive such dividends as our Board of Directors may declare out of funds available for such payments under applicable law and regulatory guidance, and although we have historically declared cash dividends on our common stock, we are not required to do so. Furthermore, the payment of dividends falls under federal regulations that have grown more stringent in recent years. Throughout 2016, the Company was required to receive a non-objection from the FRB to pay cash dividends on its outstanding common stock, and the FRB has advised the Company to continue the exchange of written documentation to obtain their non-objection to the declaration of dividends. While we pay our quarterly cash dividend in compliance with current regulations, such regulations could change in the future. In addition, if the Company were to become a SIFI institution, as defined in the current regulations, we would become subject to regulations under the Dodd-Frank Act that limit the amount of capital that can be distributed by the Company from time to time. Any reduction or elimination of our common stock dividend in the future could adversely affect the market price of our common stock.
Operational Risks
Our stress testing processes rely on analytical and forecasting models that may prove to be inadequate or inaccurate, which could adversely affect the effectiveness of our strategic planning and our ability to pursue certain corporate goals.
In accordance with the Dodd-Frank Act, banking organizations with $10 billion to $50 billion in assets currently are required to perform annual capital stress tests and to report the results of such tests. The results of our capital stress tests and the application of certain capital rules may result in constraints being placed on our capital distributions or require that we increase our regulatory capital under certain circumstances.
In addition, the processes we use to estimate the effects of changing interest rates, real estate values, and economic indicators such as unemployment on our financial condition and results of operations depend upon the use of analytical and forecasting models. These models reflect assumptions that may not be accurate, particularly in times of market stress or other unforeseen circumstances. Furthermore, even if our assumptions are accurate predictors of future performance, the models they are based on may prove to be inadequate or inaccurate because of other flaws in their design or implementation. If the models we use in the process of managing our interest rate and other risks prove to be inadequate or inaccurate, we could incur increased or unexpected losses which, in turn, could adversely affect our earnings and capital. Additionally, failure by the Company to maintain compliance with strict capital, liquidity, and other stress test requirements under banking regulations could subject us to regulatory sanctions, including limitations on our ability to pay dividends.
The occurrence of any failure, breach, or interruption in service involving our systems or those of our service providers could damage our reputation, cause losses, increase our expenses, and result in a loss of customers, an increase in regulatory scrutiny, or expose us to civil litigation and possibly financial liability, any of which could adversely impact our financial condition, results of operations, and the market price of our stock.
Communication and information systems are essential to the conduct of our business, as we use such systems to manage our customer relationships, our general ledger, our deposits, and our loans. In addition, our operations rely on the secure processing, storage, and transmission of confidential and other information in our computer systems and networks. Although we take protective measures and endeavor to modify them as circumstances warrant, the security of our computer systems, software, and networks may be vulnerable to breaches, unauthorized access, misuse, computer viruses, or other malicious code and cyber attacks that could have an impact on information security.
In addition, breaches of security may occur through intentional or unintentional acts by those having authorized or unauthorized access to our confidential or other information, or that of our customers, clients, or
28
Table of Contents
counterparties. If one or more of such events were to occur, the confidential and other information processed and stored in, and transmitted through, our computer systems and networks could potentially be jeopardized, or could otherwise cause interruptions or malfunctions in our operations or the operations of our customers, clients, or counterparties. This could cause us significant reputational damage or result in our experiencing significant losses.
Furthermore, we may be required to expend significant additional resources to modify our protective measures or investigate and remediate vulnerabilities or other exposures arising from operational and security risks. We also may be subject to litigation and financial losses that either are not insured against or not fully covered through any insurance we maintain.
In addition, we routinely transmit and receive personal, confidential, and proprietary information by e-mail and other electronic means. We have discussed, and worked with our customers, clients, and counterparties to develop secure transmission capabilities, but we do not have, and may be unable to put in place, secure capabilities with all of these constituents, and we may not be able to ensure that these third parties have appropriate controls in place to protect the confidentiality of such information.
While we have established policies and procedures to prevent or limit the impact of systems failures and interruptions, there can be no assurance that such events will not occur or will be adequately addressed if they do.
The Company and the Banks rely on third parties to perform certain key business functions, which may expose us to further operational risk.
We outsource certain key aspects of our data processing to certain third-party providers. While we have selected these third-party providers carefully, we cannot control their actions. Our ability to deliver products and services to our customers, to adequately process and account for our customers’ transactions, or otherwise conduct our business could be adversely impacted by any disruption in the services provided by these third parties; their failure to handle current or higher volumes of usage; or any difficulties we may encounter in communicating with them. Replacing these third-party providers also could entail significant delay and expense.
Our third-party providers may be vulnerable to unauthorized access, computer viruses, phishing schemes, and other security breaches. Threats to information security also exist in the processing of customer information through various other third-party providers and their personnel. We may be required to expend significant additional resources to protect against the threat of such security breaches and computer viruses, or to alleviate problems caused by such security breaches or viruses. To the extent that the activities of our third-party providers or the activities of our customers involve the storage and transmission of confidential information, security breaches and viruses could expose us to claims, regulatory scrutiny, litigation, and other possible liabilities.
In addition, the Company may not be adequately insured against all types of losses resulting from third-party failures, and our insurance coverage may be inadequate to cover all losses resulting from systems failures or other disruptions to our banking services.
Failure to keep pace with technological changes could have a material adverse impact on our ability to compete for loans and deposits, and therefore on our financial condition and results of operations.
Financial products and services have become increasingly technology-driven. To some degree, our ability to meet the needs of our customers competitively, and in a cost-efficient manner, is dependent on our ability to keep pace with technological advances and to invest in new technology as it becomes available. Many of our competitors have greater resources to invest in technology than we do and may be better equipped to market new technology-driven products and services.
If federal, state, or local tax authorities were to determine that we did not adequately provide for our taxes, our income tax expense could be increased, adversely affecting our earnings.
The amount of income taxes we are required to pay on our earnings is based on federal, state, and local legislation and regulations. We provide for current and deferred taxes in our financial statements, based on our results of operations, business activity, legal structure, interpretation of tax statutes, assessment of risk of adjustment upon audit, and application of financial accounting standards. We may take tax return filing positions for which the final determination of tax is uncertain, and our net income and earnings per share could be reduced if a federal, state, or local authority were to assess additional taxes that have not been provided for in our consolidated financial statements. In addition, there can be no assurance that we will achieve our anticipated effective tax rate. Unanticipated changes in tax laws or related regulatory or judicial guidance, or an audit assessment that denies previously recognized tax benefits, could result in our recording tax expenses that materially reduce our net income.
29
Table of Contents
The inability to attract and retain key personnel could adversely impact our financial condition and results of operations.
To a large degree, our success depends on our ability to attract and retain key personnel whose expertise, knowledge of our markets, and years of industry experience would make them difficult to replace. Competition for skilled leaders in our industry can be intense, and we may not be able to hire or retain the people we would like to have working for us. The unexpected loss of services of one or more of our key personnel could have a material adverse impact on our business, given the specialized knowledge of such personnel and the difficulty of finding qualified replacements on a timely basis. Furthermore, our ability to attract and retain personnel with the skills and knowledge to support our business may require that we offer additional compensation and benefits that would reduce our earnings.
Many aspects of our operations are dependent upon the soundness of other financial intermediaries, and thus could expose us to systemic risk.
The soundness of many financial institutions may be closely interrelated as a result of relationships between them involving credit, trading, execution of transactions, and the like. As a result, concerns about, or a default or threatened default by, one institution could lead to significant market-wide liquidity and credit problems, losses, or defaults by other institutions. As such “systemic risk” may adversely affect the financial intermediaries with which we interact on a daily basis (such as clearing agencies, clearing houses, banks, and securities firms and exchanges), we could be adversely impacted as well.
Reputational Risk
Damage to our reputation could significantly harm the businesses we engage in, as well as our competitive position and prospects for growth.
Our ability to attract and retain investors, customers, clients, and employees could be adversely affected by damage to our reputation resulting from various sources, including employee misconduct, litigation, or regulatory outcomes; failure to deliver minimum standards of service and quality; compliance failures; unethical behavior; unintended disclosure of confidential information; and the activities of our clients, customers, and/or counterparties. Actions by the financial services industry in general, or by certain entities or individuals within it, also could have a significantly adverse impact on our reputation.
Our actual or perceived failure to identify and address various issues also could give rise to reputational risk that could significantly harm us and our business prospects, including failure to properly address operational risks. These issues include legal and regulatory requirements; consumer protection, fair lending, and privacy issues; properly maintaining customer and associated personal information; record keeping; protecting against money laundering; sales and trading practices; and ethical issues.
| ITEM 1B. | UNRESOLVED STAFF COMMENTS |
None.
| ITEM 2. | PROPERTIES |
We own certain of our branch offices, as well as our headquarters on Long Island and certain other back-office buildings in New York, Ohio, and Florida. We also utilize other branch and back-office locations in those states, and in New Jersey and Arizona, under various lease and license agreements that expire at various times. (See Note 10, “Commitments and Contingencies: Lease Commitments” in Item 8, “Financial Statements and Supplementary Data.”) We believe that our facilities are adequate to meet our present and immediately foreseeable needs.
| ITEM 3. | LEGAL PROCEEDINGS |
Following the announcement on October 29, 2015 of the execution of the Company’s merger agreement with Astoria Financial Corporation (“Astoria Financial”), six putative class action lawsuits were filed in the Supreme Court of the State of New York, County of Nassau, challenging the proposed merger between Astoria Financial and New York Community Bancorp, Inc. (the “Company”). These actions are captioned: (1) Sandra E. Weiss IRA v. Chrin, et al., Index No. 607132/2015 (filed November 4, 2015); (2) Raul v. Palleschi, et al., Index No. 607238/2015 (filed November 6, 2015); (3) Lowinger v. Redman, et al., Index No. 607268/2015 (filed November 9, 2015); (4) Minzer v. Astoria Fin. Corp., et al., Index No. 607358/2015 (filed November 12, 2015); (5) MSS 12-09 Trust v. Palleschi, et al., Index No. 607472/2015 (filed November 13, 2015); and (6) Firemen’s Ret. Sys. of St. Louis v. Keegan, et al., Index No. 607612/2015 (filed November 23, 2015 ). On January 15, 2016, the court consolidated the
30
Table of Contents
New York Actions under the caption In re Astoria Financial Corporation Shareholders Litigation, Index No. 607132/2015 (the “New York Action”), and a consolidated amended complaint was filed on January 29, 2016. In addition, a seventh lawsuit was filed challenging the proposed transaction in the Delaware Court of Chancery, captioned O’Connell v. Astoria Financial Corp., et al., Case No. 11928 (filed January 22, 2016), which was dismissed voluntarily on September 26, 2016.
The New York Action is a putative class action filed on behalf of the stockholders of Astoria Financial and names as defendants Astoria Financial, its directors, and the Company. The consolidated amended complaint alleges, among other things, that the directors of Astoria Financial breached their fiduciary duties in connection with their approval of the merger agreement, including by: agreeing to an allegedly unfair price for Astoria Financial; approving the transaction notwithstanding alleged conflicts of interest; agreeing to deal protection devices that plaintiffs allege are unreasonable; and by failing to disclose certain facts about the process that led to the merger and financial analyses performed by Astoria Financial’s financial advisors. Plaintiffs also allege that the Company aided and abetted those alleged fiduciary breaches. The action seeks, among other things, an order enjoining completion of the proposed merger.
On April 6, 2016, the parties to the New York Action entered into a Memorandum of Understanding (“MOU”) setting out the terms of an agreement in principle to settle all claims alleged on behalf of the putative class relating to the merger, which were disclosed on April 8, 2016. The MOU provides, among other things, that Astoria Financial will make certain supplemental disclosures relating to the merger. The settlement is subject to, among other things, the execution of definitive documentation, the completion of the merger, and the approval by the court of the proposed settlement. In view of the termination of the proposed merger, the Company expects the settlement and the related MOU to be terminated.
The Company believes that the factual allegations in the lawsuits are without merit and, in the event that plaintiffs seek to pursue those claims, would intend to defend vigorously against the allegations made by the plaintiffs.
In addition to the lawsuits noted above, the Company is involved in various other legal actions arising in the ordinary course of its business. All such actions in the aggregate involve amounts that are believed by management to be immaterial to the financial condition and results of operations of the Company.
| ITEM 4. | MINE SAFETY DISCLOSURES |
Not applicable.
31
Table of Contents
| ITEM 5. | MARKET FOR REGISTRANT’S COMMON EQUITY, RELATED STOCKHOLDER MATTERS, AND ISSUER PURCHASES OF EQUITY SECURITIES |
The common stock of New York Community Bancorp, Inc. trades on the New York Stock Exchange (the “NYSE”) under the symbol “NYCB.”
At December 31, 2016, the number of outstanding shares was 487,056,676 and the number of registered owners was approximately 12,200. The latter figure does not include those investors whose shares were held for them by a bank or broker at that date.
Dividends Declared per Common Share and Market Price of Common Stock
The following table sets forth the dividends declared per common share, and the intra-day high/low price range and closing prices for the Company’s common stock, as reported by the NYSE, in each of the four quarters of 2016 and 2015:
| Dividends Declared per |
Market Price | |||||||||||||||||||
| Common Share | High | Low | Close | |||||||||||||||||
| 2016 |
||||||||||||||||||||
| 1st Quarter |
$ | 0.17 | $ | 16.17 | $ | 14.32 | $ | 15.90 | ||||||||||||
| 2nd Quarter |
0.17 | 15.97 | 14.25 | 14.99 | ||||||||||||||||
| 3rd Quarter |
0.17 | 15.49 | 14.05 | 14.23 | ||||||||||||||||
| 4th Quarter |
0.17 | 17.67 | 13.74 | 15.91 | ||||||||||||||||
|
|
|
|
|
|
|
|
|
|||||||||||||
| 2015 |
||||||||||||||||||||
| 1st Quarter |
$ | 0.25 | $ | 16.99 | $ | 15.07 | $ | 16.73 | ||||||||||||
| 2nd Quarter |
0.25 | 18.72 | 16.53 | 18.38 | ||||||||||||||||
| 3rd Quarter |
0.25 | 19.11 | 14.26 | 18.06 | ||||||||||||||||
| 4th Quarter |
0.25 | 19.18 | 15.40 | 16.32 | ||||||||||||||||
|
|
|
|
|
|
|
|
|
|||||||||||||
See the discussion of “Liquidity” in Item 7, “Management’s Discussion and Analysis of Financial Condition and Results of Operations,” for information regarding restrictions on the Company’s ability to pay dividends.
On July 7, 2016, our President and Chief Executive Officer, Joseph R. Ficalora, submitted to the NYSE his Annual CEO certification confirming our compliance with the NYSE’s corporate governance listing standards, as required by Section 303A.12(a) of the NYSE Listed Company Manual.
32
Table of Contents
Stock Performance Graph
Notwithstanding anything to the contrary set forth in any of the Company’s previous filings under the Securities Act of 1933 or the Securities Exchange Act of 1934 that might incorporate future filings, including this Form 10-K, in whole or in part, the following stock performance graph shall not be incorporated by reference into any such filings.
The following graph compares the cumulative total return on the Company’s stock in the five years ended December 31, 2016 with the cumulative total returns on a broad market index (the S&P Mid-Cap 400 Index) and a peer group index (the SNL U.S. Bank and Thrift Index) during the same time. The S&P Mid-Cap 400 Index was chosen as the broad market index in connection with the Company’s trading activity on the NYSE; the SNL U.S. Bank and Thrift Index currently is comprised of 409 banks and thrift institutions, including the Company. S&P Global Market Intelligence provided us with the data for both indices.
The cumulative total returns are based on the assumption that $100.00 was invested in each of the three investments on December 31, 2011 and that all dividends paid since that date were reinvested. Such returns are based on historical results and are not intended to suggest future performance.
Comparison of 5-Year Cumulative Total Return
Among New York Community Bancorp, Inc.,
S&P Mid-Cap 400 Index, and SNL U.S. Bank and Thrift Index
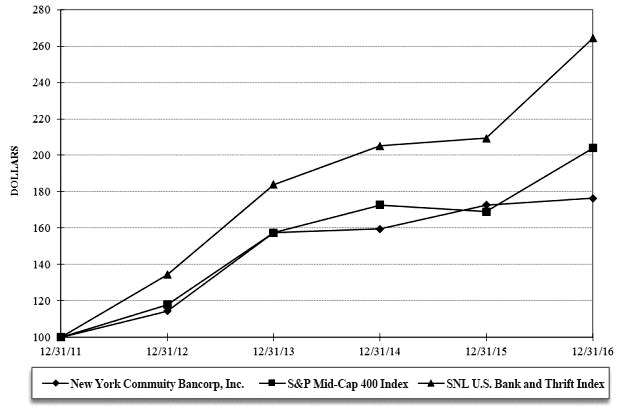
ASSUMES $100 INVESTED ON DECEMBER 31, 2011
ASSUMES DIVIDEND REINVESTED
FISCAL YEAR ENDING DECEMBER 31, 2016
| 12/31/2011 | 12/31/2012 | 12/31/2013 | 12/31/2014 | 12/31/2015 | 12/31/2016 | |||||||||||||||||||
| New York Community Bancorp, Inc. |
$ | 100.00 | $ | 114.29 | $ | 157.54 | $ | 159.51 | $ | 172.63 | $ | 176.35 | ||||||||||||
| S&P Mid-Cap 400 Index |
$ | 100.00 | $ | 117.88 | $ | 157.37 | $ | 172.74 | $ | 168.98 | $ | 204.03 | ||||||||||||
| SNL U.S. Bank and Thrift Index |
$ | 100.00 | $ | 134.28 | $ | 183.86 | $ | 205.25 | $ | 209.39 | $ | 264.35 | ||||||||||||
33
Table of Contents
Share Repurchases
Shares Repurchased Pursuant to the Company’s Stock-Based Incentive Plans
Participants in the Company’s stock-based incentive plans may have shares of common stock withheld to fulfill the income tax obligations that arise in connection with their exercise of stock options and the vesting of their stock awards. Shares that are withheld for this purpose are repurchased pursuant to the terms of the applicable stock-based incentive plan, rather than pursuant to the share repurchase program authorized by the Board of Directors described below.
The amount of common stock repurchased by the Company in the twelve months ended December 31, 2016 is summarized in the following table:
| (dollars in thousands, except per share data) | |||||||||||||||
| Period |
Total Number of Shares of Common Stock Repurchased |
Average Price Paid per Common Share |
Total Dollar Amount of Common Stock Repurchased | ||||||||||||
| First Quarter 2016 |
535,546 | $15.35 | $ | 8,222 | |||||||||||
| Second Quarter 2016 |
7,608 | 14.99 | 114 | ||||||||||||
| Third Quarter 2016 |
13,955 | 14.77 | 206 | ||||||||||||
| Fourth Quarter 2016: |
|||||||||||||||
| October |
9,109 | 14.20 | 129 | ||||||||||||
| November |
185 | 13.79 | 3 | ||||||||||||
| December |
181 | 15.78 | 3 | ||||||||||||
|
|
|
|
|
||||||||||||
| Total Fourth Quarter 2016 |
9,475 | 14.22 | 135 | ||||||||||||
|
|
|
|
|
||||||||||||
| 2016 Total |
566,584 | 15.31 | $ | 8,677 | |||||||||||
|
|
|
|
|
||||||||||||
Shares Repurchased Pursuant to the Board of Directors’ Share Repurchase Authorization
On April 20, 2004, the Board of Directors authorized the repurchase of up to five million shares of the Company’s common stock. Of this amount, 1,659,816 shares were still available for repurchase at December 31, 2016. Under said authorization, shares may be repurchased on the open market or in privately negotiated transactions. No shares have been repurchased under this authorization since August 2006.
Shares that are repurchased pursuant to the Board of Directors’ authorization, and those that are repurchased pursuant to the Company’s stock-based incentive plans, are held in our Treasury account and may be used for various corporate purposes, including, but not limited to, merger transactions and the vesting of restricted stock awards.
34
Table of Contents
| ITEM 6. | SELECTED FINANCIAL DATA |
| At or For the Years Ended December 31, | ||||||||||||||||||||
| (dollars in thousands, except share data) | 2016 | 2015 | 2014 | 2013 | 2012 | |||||||||||||||
| EARNINGS SUMMARY: |
||||||||||||||||||||
| Net interest income (1) |
$ | 1,287,382 | $ | 408,075 | $ | 1,140,353 | $ | 1,166,616 | $ | 1,160,021 | ||||||||||
| Provision for (recovery of) losses on non-covered loans |
11,874 | (3,334 | ) | — | 18,000 | 45,000 | ||||||||||||||
| (Recovery of) provision for losses on covered loans |
(7,694 | ) | (11,670 | ) | (18,587 | ) | 12,758 | 17,988 | ||||||||||||
| Non-interest income |
145,572 | 210,763 | 201,593 | 218,830 | 297,353 | |||||||||||||||
| Non-interest expense: |
||||||||||||||||||||
| Operating expenses (2) |
638,109 | 615,600 | 579,170 | 591,778 | 593,833 | |||||||||||||||
| Amortization of core deposit intangibles |
2,391 | 5,344 | 8,297 | 15,784 | 19,644 | |||||||||||||||
| Debt repositioning charge |
— | 141,209 | — | — | — | |||||||||||||||
| Merger-related expenses |
11,146 | 3,702 | — | — | — | |||||||||||||||
| Total non-interest expense |
651,646 | 765,855 | 587,467 | 607,562 | 613,477 | |||||||||||||||
| Income tax expense (benefit) |
281,727 | (84,857 | ) | 287,669 | 271,579 | 279,803 | ||||||||||||||
| Net income (loss) (3) |
495,401 | (47,156 | ) | 485,397 | 475,547 | 501,106 | ||||||||||||||
| Basic earnings (loss) per share (3) |
$1.01 | $(0.11 | ) | $1.09 | $1.08 | $1.13 | ||||||||||||||
| Diluted earnings (loss) per share (3) |
1.01 | (0.11 | ) | 1.09 | 1.08 | 1.13 | ||||||||||||||
| Dividends paid per common share |
0.68 | 1.00 | 1.00 | 1.00 | 1.00 | |||||||||||||||
| SELECTED RATIOS: |
||||||||||||||||||||
| Return on average assets (3) |
1.00 | % | (0.10 | )% | 1.01 | % | 1.07 | % | 1.18 | % | ||||||||||
| Return on average stockholders’ equity (3) |
8.19 | (0.81 | ) | 8.41 | 8.46 | 9.06 | ||||||||||||||
| Average stockholders’ equity to average assets |
12.28 | 11.90 | 12.01 | 12.66 | 13.02 | |||||||||||||||
| Operating expenses to average assets (2) |
1.29 | 1.26 | 1.21 | 1.33 | 1.40 | |||||||||||||||
| Efficiency ratio (1)(2) |
44.53 | 99.48 | 43.16 | 42.71 | 40.75 | |||||||||||||||
| Net interest rate spread (1) |
2.85 | 0.69 | 2.57 | 2.90 | 3.11 | |||||||||||||||
| Net interest margin (1) |
2.93 | 0.94 | 2.67 | 3.01 | 3.21 | |||||||||||||||
| Dividend payout ratio |
67.33 | — | 91.74 | 92.59 | 88.50 | |||||||||||||||
| BALANCE SHEET SUMMARY: |
||||||||||||||||||||
| Total assets |
$ | 48,926,555 | $ | 50,317,796 | $ | 48,559,217 | $ | 46,688,287 | $ | 44,145,100 | ||||||||||
| Loans, net of allowances for loan losses |
39,308,016 | 38,011,995 | 35,647,639 | 32,727,507 | 31,580,636 | |||||||||||||||
| Allowance for losses on non-covered loans |
158,290 | 147,124 | 139,857 | 141,946 | 140,948 | |||||||||||||||
| Allowance for losses on covered loans |
23,701 | 31,395 | 45,481 | 64,069 | 51,311 | |||||||||||||||
| Securities |
3,817,057 | 6,173,645 | 7,096,450 | 7,951,020 | 4,913,528 | |||||||||||||||
| Deposits |
28,887,903 | 28,426,758 | 28,328,734 | 25,660,992 | 24,877,521 | |||||||||||||||
| Borrowed funds |
13,673,379 | 15,748,405 | 14,226,487 | 15,105,002 | 13,430,191 | |||||||||||||||
| Stockholders’ equity |
6,123,991 | 5,934,696 | 5,781,815 | 5,735,662 | 5,656,264 | |||||||||||||||
| Common shares outstanding |
487,056,676 | 484,943,308 | 442,587,190 | 440,809,365 | 439,050,966 | |||||||||||||||
| Book value per share |
$12.57 | $12.24 | $13.06 | $13.01 | $12.88 | |||||||||||||||
| Stockholders’ equity to total assets |
12.52 | % | 11.79 | % | 11.91 | % | 12.29 | % | 12.81 | % | ||||||||||
| ASSET QUALITY RATIOS (excluding covered assets and non-covered purchased credit-impaired loans): |
||||||||||||||||||||
| Non-performing non-covered loans to total non-covered loans |
0.15 | % | 0.13 | % | 0.23 | % | 0.35 | % | 0.96 | % | ||||||||||
| Non-performing non-covered assets to total non-covered assets |
0.14 | 0.13 | 0.30 | 0.40 | 0.71 | |||||||||||||||
| Allowance for losses on non-covered loans to non-performing non-covered loans |
277.19 | 310.08 | 181.75 | 137.10 | 53.93 | |||||||||||||||
| Allowance for losses on non-covered loans to total non-covered loans |
0.42 | 0.41 | 0.42 | 0.48 | 0.52 | |||||||||||||||
| Net charge-offs (recoveries) to average loans (4) |
0.00 | (0.02 | ) | 0.01 | 0.05 | 0.13 | ||||||||||||||
| ASSET QUALITY RATIOS (including covered assets and non-covered purchased credit-impaired loans): |
||||||||||||||||||||
| Total non-performing loans to total loans |
0.48 | % | 0.49 | % | 0.66 | % | 0.97 | % | 1.88 | % | ||||||||||
| Total non-performing assets to total assets |
0.44 | 0.45 | 0.68 | 0.91 | 1.47 | |||||||||||||||
| Allowances for loan losses to total non-performing loans |
96.39 | 96.51 | 78.92 | 65.40 | 33.50 | |||||||||||||||
| Allowances for loan losses to total loans |
0.47 | 0.47 | 0.52 | 0.63 | 0.63 | |||||||||||||||
| (1) | The 2015 amount reflects the impact of a $773.8 million debt repositioning charge recorded as interest expense in the fourth quarter of the year. |
| (2) | The 2015 amount includes state and local non-income taxes of $5.4 million resulting from the debt repositioning charge. |
| (3) | The 2015 amount reflects the $546.8 million after-tax impact of the debt repositioning charge recorded as interest expense and non-interest expense, combined. |
| (4) | Average loans include covered loans. |
35
Table of Contents
| ITEM 7. | MANAGEMENT’S DISCUSSION AND ANALYSIS OF FINANCIAL CONDITION AND RESULTS OF OPERATIONS |
For the purpose of this discussion and analysis, the words “we,” “us,” “our,” and the “Company” are used to refer to New York Community Bancorp, Inc. and our consolidated subsidiaries, including New York Community Bank (the “Community Bank”) and New York Commercial Bank (the “Commercial Bank”) (collectively, the “Banks”).
Executive Summary
New York Community Bancorp, Inc. is the holding company for New York Community Bank, with 225 branches in Metro New York, New Jersey, Ohio, Florida, and Arizona, and New York Commercial Bank, with 30 branches in Metro New York. At December 31, 2016, we had total assets of $48.9 billion, including total loans of $39.5 billion, and total deposits of $28.9 billion.
Chartered in the State of New York, the Community Bank and the Commercial Bank are subject to regulation by the Federal Deposit Insurance Corporation (the “FDIC”), the Consumer Financial Protection Bureau, and the New York State Department of Financial Services (the “NYSDFS”). In addition, the holding company is subject to regulation by the Board of Governors of the Federal Reserve System (the “FRB”), the U.S. Securities and Exchange Commission (the “SEC”), and to the requirements of the New York Stock Exchange, where shares of our common stock are traded under the symbol “NYCB.”
As a publicly traded company, our mission is to provide our shareholders with a solid return on their investment by producing a strong financial performance, maintaining a solid capital position, and engaging in corporate strategies that enhance the value of their shares. In 2016, we generated earnings of $495.4 million, or $1.01 per diluted share, and maintained our status as a well-capitalized institution with regulatory capital ratios that rose year-over-year. We also engaged in strategies that were consistent with our business model, as further described below:
We Continued to Manage our Assets below the SIFI Threshold
In 2016, we continued to manage our assets below the threshold for a Systemically Important Financial Institution (“SIFI”), a strategy we launched in the fourth quarter of 2014. In the current year, we achieved this goal by selling $1.7 billion of multi-family, commercial real estate (“CRE”), and acquisition, development, and construction (“ADC”) loans, largely through participations. In addition, our securities portfolio declined $2.4 billion from the year-earlier balance as the low level of market interest rates triggered a high volume of calls. As a result, our consolidated assets totaled $48.9 billion at December 31, 2016 and averaged $49.0 billion for the four quarters ended at that date.
We Maintained a Strong Presence in our Multi-Family Lending Niche
In 2016, we produced $9.2 billion of non-covered loans held for investment, including $5.7 billion of multi-family loans. While loan growth was tempered by a combination of sales and prepayments, the portfolio of non-covered held-for-investment loans rose $1.6 billion year-over-year to $37.4 billion, including a $973.4 million increase in multi-family loans to $26.9 billion.
Multi-family loans accounted for $1.3 billion of the loans we sold in 2016, with CRE and ADC loans accounting for $338.7 million and $3.4 million, respectively. In addition to enabling us to manage our assets below the current SIFI threshold, the loan sales generated net gains of $15.8 million, which were recorded as non-interest income, in 2016.
We Maintained our Record of Exceptional Asset Quality
Non-performing non-covered assets represented $68.1 million, or 0.14%, of total non-covered assets at the end of this December, and non-performing non-covered loans represented $56.5 million, or 0.15%, of total non-covered loans. While our level of non-performing assets was modestly higher than the year-earlier level, the increase stemmed from the transition to non-accrual status of a single ADC credit and certain New York City taxi medallion loans. The performance of our multi-family and CRE loans, which are our principal assets, continued to be exceptional over the course of the year.
36
Table of Contents
Also reflecting the quality of our assets was the nominal level of net charge-offs we recorded in the twelve months ended December 31, 2016. Net charge-offs represented $708,000, or 0.0%, of average loans in 2016 and consisted entirely of New York City taxi medallion loans.
Notwithstanding the overall quality of our assets, we recorded an $11.9 million provision for non-covered loan losses, bringing our allowance for non-covered loan losses to $158.3 million at December 31, 2016.
The Benefit of our Strategic Debt Repositioning Was Validated by the Growth of our Net Interest Income
In the fourth quarter of 2015, we prepaid $10.4 billion of wholesale borrowings with an average cost of 3.16% and replaced them with a like amount of wholesale borrowings with an average cost of 1.58%. In addition, the majority of the wholesale borrowings we prepaid had callable features; the borrowings with which they were replaced featured fixed maturities.
While the related debt repositioning charge reduced our 2015 net interest income to $408.1 million, the level of net interest income we recorded in 2016, as well as our net interest rate spread and net interest margin, partly reflect the benefit of having repositioned our debt in the prior year.
While the aforementioned strategies, for the most part, contributed to our 2016 earnings, the benefits were tempered by the following events:
Our Merger Agreement with Astoria Financial Corporation Was Terminated
On October 29, 2015, we announced the signing of a definitive merger agreement with Astoria Financial Corporation (“Astoria Financial”) which, pending receipt of the necessary approvals, was expected to close prior to the expiration of the agreement on December 31, 2016.
On December 20, 2016, the Boards of Directors of both companies mutually agreed to terminate the merger agreement, effective January 1, 2017.
In connection with our preparations for the merger, and its subsequent termination, merger-related expenses totaled $11.1 million in the twelve months ended December 31, 2016.
Mortgage Banking Income Declined
Mortgage banking income fell $26.8 million from the year-earlier level to $27.3 million in the twelve months ended December 31, 2016. The reduction was primarily due to a change in the assumptions used to calculate the value of our mortgage servicing rights (“MSRs”) in the first quarter, together with an increase in prepayments and curtailments.
Operating Expenses Rose
Operating expenses rose $22.5 million from the year-earlier level to $638.1 million in 2016. The increase was primarily due to general and administrative (“G&A”) expense, which rose $17.6 million year-over-year. The rise in G&A expense was largely due to an increase in FDIC deposit insurance premiums, as well as higher legal and professional fees.
In addition, compensation and benefits expense rose $8.8 million year-over-year, primarily reflecting an increase in the cost of medical benefits, as well as the expansion of our back-office staff.
External Factors
The following is a discussion of certain external factors that tend to influence our financial performance and the strategic actions we take.
Interest Rates
Among the external factors that tend to influence our performance, the interest rate environment is key. Just as short-term interest rates affect the cost of our deposits and that of the funds we borrow, market interest rates affect the yields on the loans we produce for investment and the securities in which we invest.
37
Table of Contents
As further discussed under “Loans Held for Investment” later on in this discussion, the interest rates on our multi-family loans and CRE credits generally are based on the five-year Constant Maturity Treasury Rate (the “CMT”). The following table summarizes the high, low, and average five- and ten-year Constant Maturity Treasury rates in 2016 and 2015:
| Constant Maturity Treasury Rates | ||||||||||||||||
| Five-Year | Ten-Year | |||||||||||||||
| 2016 | 2015 | 2016 | 2015 | |||||||||||||
| High |
2.10 | % | 1.81 | % | 2.60 | % | 2.50 | % | ||||||||
| Low |
0.94 | 1.18 | 1.37 | 1.68 | ||||||||||||
| Average |
1.33 | 1.53 | 1.84 | 2.14 | ||||||||||||
In addition, residential market interest rates impact the volume of one-to-four family mortgage loans we originate in any given quarter, directly affecting new home purchases and refinancing activity. Accordingly, when residential mortgage interest rates are low, refinancing activity typically increases; as residential mortgage interest rates begin to rise, the refinancing of one-to-four family mortgage loans typically declines. In 2016, we originated $4.6 billion of one-to-four family mortgage loans for sale through our mortgage banking operation.
Changes in market interest rates generally have a lesser impact on our multi-family and CRE loan production than they do on our production of one-to-four family mortgage loans. Because the multi-family and CRE loans we produce generate income when they prepay (which is recorded as interest income), the impact of repayment activity can be especially meaningful. In 2016, prepayment income from loans contributed $60.9 million to interest income; in the prior year, the contribution was $97.3 million.
Economic Indicators
While we attribute our asset quality to the nature of the loans we produce and our conservative underwriting standards, the quality of our assets can also be impacted by economic conditions in our local markets and throughout the United States. The information that follows consists of recent economic data that we consider to be germane to our performance and the markets we serve.
The following table presents the generally downward trend in unemployment rates, as reported by the U.S. Department of Labor, both nationally and in the various markets that comprise our footprint, for the months indicated:
| December | ||||||||
| 2016 | 2015 | |||||||
| Unemployment rate: |
||||||||
| United States |
4.5 | % | 4.8 | % | ||||
| New York City |
4.4 | 5.0 | ||||||
| Arizona |
4.7 | 5.5 | ||||||
| Florida |
4.7 | 4.8 | ||||||
| New Jersey |
4.1 | 4.3 | ||||||
| New York |
4.5 | 4.7 | ||||||
| Ohio |
4.7 | 4.6 | ||||||
The Consumer Price Index (the “CPI”) measures the average change over time in the prices paid by urban consumers for a market basket of consumer goods and services. The following table indicates the change in the CPI for the twelve months ended at each of the indicated dates:
| For the Twelve Months Ended December |
||||||||
| 2016 | 2015 | |||||||
| Change in prices: |
2.1 | % | 0.7 | % | ||||
Economic activity also is indicated by the Consumer Confidence Index®, which moved up to 113.7 in December 2016 from 96.3 in December 2015. An index level of 90 or more is considered indicative of a strong economy.
38
Table of Contents
The level of our mortgage lending activity is also impacted by new home sales. According to estimates set forth in a U.S. Department of Commerce report issued on January 26, 2017, the volume of new home sales nationwide was at a seasonally adjusted annual rate of 536,000 in December 2016, 0.4% below the rate reported for December 2015.
Given the impact that home prices have on residential mortgage lending, we consider the S&P Corelogic Case-Shiller U.S. National NSA Index to be an important economic indicator for the Company. According to this index, home prices rose 5.8% across the U.S. in the twelve months ended December 31, 2016 as compared to 5.4% in the twelve months ended December 31, 2015.
The residential rental vacancy rate in New York, as reported by the U.S. Department of Commerce, and the office vacancy rate in Manhattan, as reported by a leading commercial real estate broker (Jones Lang LaSalle), are important in view of the fact that 65.3% of our multi-family loans and 72.1% of our CRE loans are secured by properties in New York City, with Manhattan accounting for 27.8% and 53.1% of our multi-family and CRE loans, respectively.
As reflected in the following table, the residential rental vacancy rate in New York and the office vacancy rate in Manhattan were both higher in the three months ended December 31, 2016 than they were in the three months ended December 31, 2015:
| For the Three Months Ended December 31, |
||||||||
| 2016 | 2015 | |||||||
| Residential rental vacancy rate in New York |
5.4 | % | 5.0 | % | ||||
| Manhattan office vacancy rate |
10.4 | 9.6 | ||||||
Recent Events
Dividend Declaration
On January 24, 2017, the Board of Directors declared a quarterly cash dividend of $0.17 per share, payable on February 22, 2017 to shareholders of record at the close of business on February 7, 2017.
Critical Accounting Policies
We consider certain accounting policies to be critically important to the portrayal of our financial condition and results of operations, since they require management to make complex or subjective judgments, some of which may relate to matters that are inherently uncertain. The inherent sensitivity of our consolidated financial statements to these critical accounting policies, and the judgments, estimates, and assumptions used therein, could have a material impact on our financial condition or results of operations.
We have identified the following to be critical accounting policies: the determination of the allowances for loan losses; the valuation of MSRs; the determination of whether an impairment of securities is other than temporary; the determination of the amount, if any, of goodwill impairment; and the determination of the valuation allowance, if any, for deferred tax assets.
The judgments used by management in applying these critical accounting policies may be influenced by adverse changes in the economic environment, which may result in changes to future financial results.
Allowance for Losses on Non-Covered Loans
The allowance for losses on non-covered loans represents our estimate of probable and estimable losses inherent in the non-covered loan portfolio as of the date of the balance sheet. Losses on non-covered loans are charged against, and recoveries of losses on non-covered loans are credited back to, the allowance for losses on non-covered loans.
Although non-covered loans are held by either the Community Bank or the Commercial Bank, and a separate loan loss allowance is established for each, the total of the two allowances is available to cover all losses incurred. In addition, except as otherwise noted in the following discussion, the process for establishing the allowance for losses on non-covered loans is largely the same for each of the Community Bank and the Commercial Bank.
The methodology used for the allocation of the allowance for non-covered loan losses at December 31, 2016 and December 31, 2015 was generally comparable, whereby the Community Bank and the Commercial Bank
39
Table of Contents
segregated their loss factors (used for both criticized and non-criticized loans) into a component that was primarily based on historical loss rates and a component that was primarily based on other qualitative factors that are probable to affect loan collectability. In determining the respective allowances for non-covered loan losses, management considers the Community Bank’s and the Commercial Bank’s current business strategies and credit processes, including compliance with applicable regulatory guidelines and with guidelines approved by the respective Boards of Directors with regard to credit limitations, loan approvals, underwriting criteria, and loan workout procedures.
The allowance for losses on non-covered loans is established based on management’s evaluation of incurred losses in the portfolio in accordance with U.S. generally accepted accounting principles (“GAAP”), and is comprised of both specific valuation allowances and general valuation allowances.
Specific valuation allowances are established based on management’s analyses of individual loans that are considered impaired. If a non-covered loan is deemed to be impaired, management measures the extent of the impairment and establishes a specific valuation allowance for that amount. A non-covered loan is classified as “impaired” when, based on current information and/or events, it is probable that we will be unable to collect all amounts due under the contractual terms of the loan agreement. We apply this classification as necessary to non-covered loans individually evaluated for impairment in our portfolios. Smaller-balance homogenous loans and loans carried at the lower of cost or fair value are evaluated for impairment on a collective, rather than individual, basis. Loans to certain borrowers who have experienced financial difficulty and for which the terms have been modified, resulting in a concession, are considered troubled debt restructurings (“TDRs”) and are classified as impaired.
We generally measure impairment on an individual loan and determine the extent to which a specific valuation allowance is necessary by comparing the loan’s outstanding balance to either the fair value of the collateral, less the estimated cost to sell, or the present value of expected cash flows, discounted at the loan’s effective interest rate. Generally, when the fair value of the collateral, net of the estimated costs to sell, or the present value of the expected cash flows is less than the recorded investment in the loan, any shortfall is promptly charged off.
We also follow a process to assign general valuation allowances to non-covered loan categories. General valuation allowances are established by applying our loan loss provisioning methodology, and reflect the inherent risk in outstanding held-for-investment loans. This loan loss provisioning methodology considers various factors in determining the appropriate quantified risk factors to use to determine the general valuation allowances. The factors assessed begin with the historical loan loss experience for each major loan category. We also take into account an estimated historical loss emergence period (which is the period of time between the event that triggers a loss and the confirmation and/or charge-off of that loss) for each loan portfolio segment.
The allocation methodology consists of the following components: First, we determine an allowance for loan losses based on a quantitative loss factor for loans evaluated collectively for impairment. This quantitative loss factor is based primarily on historical loss rates, after considering loan type, historical loss and delinquency experience, and loss emergence periods. The quantitative loss factors applied in the methodology are periodically re-evaluated and adjusted to reflect changes in historical loss levels, loss emergence periods, or other risks. Lastly, we allocate an allowance for loan losses based on qualitative loss factors. These qualitative loss factors are designed to account for losses that may not be provided for by the quantitative loss component due to other factors evaluated by management, which include, but are not limited to:
| • | Changes in lending policies and procedures, including changes in underwriting standards and collection, and charge-off and recovery practices; |
| • | Changes in international, national, regional, and local economic and business conditions and developments that affect the collectability of the portfolio, including the condition of various market segments; |
| • | Changes in the nature and volume of the portfolio and in the terms of loans; |
| • | Changes in the volume and severity of past-due loans, the volume of non-accrual loans, and the volume and severity of adversely classified or graded loans; |
| • | Changes in the quality of our loan review system; |
| • | Changes in the value of the underlying collateral for collateral-dependent loans; |
| • | The existence and effect of any concentrations of credit, and changes in the level of such concentrations; |
| • | Changes in the experience, ability, and depth of lending management and other relevant staff; and |
40
Table of Contents
| • | The effect of other external factors, such as competition and legal and regulatory requirements, on the level of estimated credit losses in the existing portfolio. |
By considering the factors discussed above, we determine an allowance for non-covered loan losses that is applied to each significant loan portfolio segment to determine the total allowance for losses on non-covered loans.
The historical loss period we use to determine the allowance for loan losses on non-covered loans is a rolling 24-quarter look-back period, as we believe this produces an appropriate reflection of our historical loss experience.
The process of establishing the allowance for losses on non-covered loans also involves:
| • | Periodic inspections of the loan collateral by qualified in-house and external property appraisers/inspectors; |
| • | Regular meetings of executive management with the pertinent Board committee, during which observable trends in the local economy and/or the real estate market are discussed; |
| • | Assessment of the aforementioned factors by the pertinent members of the Boards of Directors and management when making a business judgment regarding the impact of anticipated changes on the future level of loan losses; and |
| • | Analysis of the portfolio in the aggregate, as well as on an individual loan basis, taking into consideration payment history, underwriting analyses, and internal risk ratings. |
In order to determine their overall adequacy, each of the respective non-covered loan loss allowances is reviewed quarterly by management and the Board of Directors of the Community Bank or the Commercial Bank, as applicable.
We charge off loans, or portions of loans, in the period that such loans, or portions thereof, are deemed uncollectible. The collectability of individual loans is determined through an assessment of the financial condition and repayment capacity of the borrower and/or through an estimate of the fair value of any underlying collateral. For non-real-estate-related consumer credits, the following past-due time periods determine when charge-offs are typically recorded: (1) Closed-end credits are charged off in the quarter that the loan becomes 120 days past due; (2) Open-end credits are charged off in the quarter that the loan becomes 180 days past due; and (3) Both closed-end and open-end credits are typically charged off in the quarter that the credit is 60 days past the date we received notification that the borrower has filed for bankruptcy.
The level of future additions to the respective non-covered loan loss allowances is based on many factors, including certain factors that are beyond management’s control, such as changes in economic and local market conditions, including declines in real estate values, and increases in vacancy rates and unemployment. Management uses the best available information to recognize losses on loans or to make additions to the loan loss allowances; however, the Community Bank and/or the Commercial Bank may be required to take certain charge-offs and/or recognize further additions to their loan loss allowances, based on the judgment of regulatory agencies with regard to information provided to them during their examinations of the Banks.
An allowance for unfunded commitments is maintained separate from the allowances for non-covered loan losses and is included in “Other liabilities” in the Consolidated Statements of Condition.
Allowance for Losses on Covered Loans
We have elected to account for the loans acquired in our FDIC-assisted acquisitions of AmTrust Bank (“AmTrust”) and Desert Hills Bank (“Desert Hills”) (our “covered loans”) based on expected cash flows. This election is in accordance with Financial Accounting Standards Board (“FASB”) Accounting Standards Codification (“ASC”) Topic 310-30, “Loans and Debt Securities Acquired with Deteriorated Credit Quality” (“ASC 310-30”). In accordance with ASC 310-30, we maintain the integrity of a pool of loans accounted for as a single asset with a single composite interest rate and an aggregate expectation of cash flows.
Covered loans are reported exclusive of the FDIC loss share receivable. The covered loans acquired in the AmTrust and Desert Hills acquisitions are reviewed for collectability based on the expectations of cash flows from these loans. Covered loans have been aggregated into pools of loans with common characteristics. In determining the allowance for losses on covered loans, we periodically perform an analysis to estimate the expected cash flows for each of the loan pools. A provision for losses on covered loans is recorded to the extent that the expected cash flows from a loan pool have decreased for credit-related items since the acquisition date. Accordingly, during the
41
Table of Contents
loss share recovery period, if there is a decrease in expected cash flows due to an increase in estimated credit losses as compared to the estimates made at the respective acquisition dates, the decrease in the present value of expected cash flows will be recorded as a provision for covered loan losses charged to earnings, and the allowance for covered loan losses will be increased. During the loss share recovery period, a related credit to non-interest income and an increase in the FDIC loss share receivable will be recognized at the same time, and will be measured based on the applicable loss sharing agreement percentage.
See Note 6, “Allowances for Loan Losses” for a further discussion of our allowance for losses on covered loans, as well as additional information about our allowance for losses on non-covered loans.
Mortgage Servicing Rights
We recognize the rights to service mortgage loans for others as a separate asset referred to as “mortgage servicing rights,” or “MSRs.” MSRs are generally recognized when loans are sold whole or in part (i.e., as a “participation”), and the servicing is retained by us. Both of the Company’s two classes of MSRs, residential and participation, are initially recorded at fair value. While residential MSRs continue to be carried at fair value, participation MSRs are subsequently amortized and carried at the lower of their fair value or amortized amount on a quarterly basis. The amortization is recorded in proportion to, and over the period of, estimated net servicing income.
We base the fair value of our MSRs on a valuation performed by a third-party valuation specialist. This specialist determines fair value based on the present value of estimated future net servicing income cash flows, and incorporates assumptions that market participants would use to estimate fair value, including estimates of prepayment speeds, discount rates, default rates, refinance rates, servicing costs, escrow account earnings, contractual servicing fee income, and ancillary income. The specialist and the Company evaluate, and periodically adjust, as necessary, these underlying inputs and assumptions to reflect market conditions and changes in the assumptions that a market participant would consider in valuing MSRs.
Changes in the fair value of MSRs occur primarily in connection with the collection/realization of expected cash flows, as well as changes in the valuation inputs and assumptions. Changes in the fair value of residential MSRs are reported in “Mortgage banking income” and changes in the value of participation MSRs are reported in “Other income” in the period during which such changes occur.
Investment Securities
The securities portfolio primarily consists of mortgage-related securities and, to a lesser extent, debt and equity (together, “other”) securities. Securities that are classified as “available for sale” are carried at their estimated fair value, with any unrealized gains or losses, net of taxes, reported as accumulated other comprehensive income or loss in stockholders’ equity. Securities that we have the intent and ability to hold to maturity are classified as “held to maturity” and carried at amortized cost, less the non-credit portion of other-than-temporary impairment (“OTTI”) recorded in accumulated other comprehensive loss, net of tax (“AOCL”).
The fair values of our securities, and particularly our fixed-rate securities, are affected by changes in market interest rates and credit spreads. In general, as interest rates rise and/or credit spreads widen, the fair value of fixed-rate securities will decline; as interest rates fall and/or credit spreads tighten, the fair value of fixed-rate securities will rise. We regularly conduct a review and evaluation of our securities portfolio to determine if the decline in the fair value of any security below its carrying amount is other than temporary. If we deem any decline in value to be other than temporary, the security is written down to its current fair value, creating a new cost basis, and the resultant loss (other than the OTTI of debt securities attributable to non-credit factors) is charged against earnings and recorded in “Non-interest income.” Our assessment of a decline in fair value includes judgment as to the financial position and future prospects of the entity that issued the investment security, as well as a review of the security’s underlying collateral. Broad changes in the overall market or interest rate environment generally will not lead to a write-down.
In accordance with OTTI accounting guidance, unless we have the intent to sell, or it is more likely than not that we may be required to sell a security before recovery, OTTI is recognized as a realized loss in earnings to the extent that the decline in fair value is credit-related. If there is a decline in fair value of a security below its carrying amount and we have the intent to sell it, or it is more likely than not that we may be required to sell the security before recovery, the entire amount of the decline in fair value is charged to earnings.
42
Table of Contents
Goodwill Impairment
We have significant intangible assets related to goodwill. In connection with our acquisitions, assets that are acquired and liabilities that are assumed are recorded at their estimated fair values. Goodwill represents the excess of the purchase price of our acquisitions over the fair value of the identifiable net assets acquired, including other identified intangible assets. Our determination of whether or not goodwill is impaired requires us to make significant judgments and requires us to use significant estimates and assumptions regarding estimated future cash flows. If we change our strategy or if market conditions shift, our judgments may change, which may result in adjustments to the recorded goodwill balance.
We test our goodwill for impairment at the reporting unit level. These impairment evaluations are performed by comparing the carrying value of the goodwill of a reporting unit to its estimated fair value. We allocate goodwill to reporting units based on the reporting unit expected to benefit from the business combination. We had previously identified two reporting units: our Banking Operations reporting unit and our Residential Mortgage Banking reporting unit. Our reporting units are the same as our operating segments and reportable segments.
For annual goodwill impairment testing, we have the option to first perform a qualitative assessment to determine whether it is more likely than not that the fair value of a reporting unit is less than its carrying amount, including goodwill and other intangible assets. If we conclude that this is the case, we must perform the two-step test described below. If we conclude based on the qualitative assessment that it is not more likely than not that the fair value of a reporting unit is less than its carrying amount, we have completed our goodwill impairment test and do not need to perform the two-step test.
Under step one of the two-step test, we are required to determine the fair value of each reporting unit and compare it to the carrying value, including goodwill and other intangible assets, of such reporting unit. If the fair value exceeds the carrying value, no impairment loss is recognized and the second step, which is a calculation of the impairment, is not performed. However, if the carrying value of the reporting unit exceeds its fair value, an impairment charge is recorded equal to the extent that the carrying amount of goodwill exceeds its implied fair value.
Application of the impairment test requires judgment, including the identification of reporting units, assignment of assets and liabilities to reporting units, assignment of goodwill to reporting units, and the determination of the fair value of each reporting unit. In assessing whether goodwill is impaired, we must make estimates and assumptions regarding future cash flows, long-term growth rates of our business, operating margins, discount rates, weighted average cost of capital and other factors to determine the fair value of our assets. These estimates and assumptions require management’s judgment, and changes to these estimates and assumptions, as a result of changing economic and competitive conditions, could materially affect the determination of fair value and/or impairment. Future events could cause us to conclude that indicators of impairment exist for goodwill, and may result from, among other things, deterioration in the performance of our business, adverse market conditions, adverse changes in applicable laws and regulations, competition, or the sale or disposition of a reporting unit. Any resulting impairment loss could have a material adverse impact on our financial condition and results of operations.
As of December 31, 2016, we had goodwill of $2.4 billion. Our goodwill is evaluated for impairment annually as of year-end, or more frequently if conditions exist that indicate that the value may be impaired. During the year ended December 31, 2016, no triggering events were identified that indicated that the value of goodwill might be impaired. We performed our annual goodwill impairment test as of December 31, 2016 and, based on the results of our qualitative assessments, found no indication of goodwill impairment at that date.
Income Taxes
In estimating income taxes, management assesses the relative merits and risks of the tax treatment of transactions, taking into account statutory, judicial, and regulatory guidance in the context of our tax position. In this process, management also relies on tax opinions, recent audits, and historical experience. Although we use the best available information to record income taxes, underlying estimates and assumptions can change over time as a result of unanticipated events or circumstances such as changes in tax laws and judicial guidance influencing our overall or transaction-specific tax position.
We recognize deferred tax assets and liabilities for the future tax consequences attributable to differences between the financial statement carrying amounts of existing assets and liabilities and their respective tax bases, and the carryforward of certain tax attributes such as net operating losses. A valuation allowance is maintained for deferred tax assets that we estimate are more likely than not to be unrealizable, based on available evidence at the
43
Table of Contents
time the estimate is made. In assessing the need for a valuation allowance, we estimate future taxable income, considering the prudence and feasibility of tax planning strategies and the realizability of tax loss carryforwards. Valuation allowances related to deferred tax assets can be affected by changes to tax laws, statutory tax rates, and future taxable income levels. In the event we were to determine that we would not be able to realize all or a portion of our net deferred tax assets in the future, we would reduce such amounts through a charge to income tax expense in the period in which that determination was made. Conversely, if we were to determine that we would be able to realize our deferred tax assets in the future in excess of the net carrying amounts, we would decrease the recorded valuation allowance through a decrease in income tax expense in the period in which that determination was made. Subsequently recognized tax benefits associated with valuation allowances recorded in a business combination would be recorded as an adjustment to goodwill.
FINANCIAL CONDITION
Balance Sheet Summary
In 2016, we continued to manage our assets below the current SIFI threshold, as such term is defined by the Dodd-Frank Act. To be designated as a SIFI, we would have to have average total consolidated assets in excess of $50.0 billion over four consecutive quarters; the four-quarter average of our total consolidated assets was $49.0 billion at both December 31, 2016 and 2015. At December 31, 2016, we recorded total assets of $48.9 billion, as compared to $50.3 billion at December 31, 2015.
Our ability to remain below the $50.0 billion threshold reflects certain strategic actions we took over the last four quarters, in addition to the impact of market interest rates on our portfolio of securities. While total loans rose $1.3 billion year-over-year to $39.5 billion, the increase was exceeded by a $2.4 billion decline in total securities to $3.8 billion, primarily reflecting repayments and calls. In addition to repayments, the growth of our loans was tempered by sales of multi-family, CRE, and ADC loans, largely through participations. In 2016, such loan sales totaled $1.7 billion; in the prior year, we sold $1.9 billion of multi-family and CRE loans.
In addition to the cash flows from loan and securities sales and repayments, we fund the loans we produce and the securities we invest in with the deposits we gather and with wholesale borrowings. At December 31, 2016, our deposits totaled $28.9 billion, reflecting a year-over-year increase of $461.1 million. Borrowed funds totaled $13.7 billion at the end of this December, reflecting a $2.1 billion reduction year-over-year.
Stockholders’ equity rose $189.3 million to $6.1 billion at the end of this year, representing 12.52% of total assets and a book value per share of $12.57. Tangible stockholders’ equity rose $191.7 million year-over-year to $3.7 million, after the distribution of cash dividends totaling $330.8 million, and represented 7.93% of tangible assets and a tangible book value per share of $7.57. (See the discussion and reconciliations of stockholders’ equity and tangible stockholders’ equity, total assets and tangible assets, and the related financial measures that appear on the last page of this discussion and analysis of financial condition and results of operations.)
Loans
Total loans grew $1.3 billion year-over-year to $39.5 billion, representing 80.7% of total assets at December 31, 2016. Included in the year-end amount were covered loans of $1.7 billion, non-covered loans held for investment of $37.4 billion, and non-covered loans held for sale of $409.2 million.
Covered Loans
In December 2009 and March 2010, we acquired certain assets and assumed certain liabilities of AmTrust and Desert Hills, respectively, in FDIC-assisted acquisitions. “Covered loans” refers to the loans we acquired in those transactions, and are referred to as such because they are covered by loss sharing agreements with the FDIC. At the time of each acquisition, the loss sharing agreements required the FDIC to reimburse us for 80% of losses up to a specific threshold and for 95% of losses beyond that threshold with respect to covered loans and covered other real estate owned (“OREO”).
The length of the agreements depended on the types of loans that were covered, with the agreements covering one-to-four family loans and home equity loans extending for ten years from the date of acquisition, and all other covered loans and OREO extending for five years from the acquisition dates.
Primarily reflecting repayments, covered loans declined $362.0 million year-over-year to $1.7 billion, representing 4.3% of total loans at December 31, 2016. At the prior year-end, covered loans totaled $2.1 billion and represented 5.4% of total loans.
44
Table of Contents
In addition, $1.2 billion, or 66.7%, of the loans in our covered loan portfolio at the end of this December were variable-rate loans, with a contractual weighted average interest rate of 3.89%. The remainder of the portfolio consisted of fixed-rate loans. The interest rates on 84.0% of our covered variable-rate loans were scheduled to reprice within twelve months and annually thereafter. The interest rates on our variable-rate covered loans are indexed to either the one-year LIBOR or the one-year Treasury rate, plus a spread in the range of 2% to 5%, subject to certain caps.
The following table presents a geographical analysis of our covered loan portfolio at December 31, 2016:
| (in thousands) | ||||
| California |
$ | 292,229 | ||
| Florida |
286,919 | |||
| Arizona |
129,518 | |||
| Ohio |
97,373 | |||
| Massachusetts |
84,479 | |||
| Michigan |
76,858 | |||
| New York |
65,826 | |||
| Illinois |
61,351 | |||
| Maryland |
53,109 | |||
| Nevada |
44,542 | |||
| New Jersey |
43,582 | |||
| All other states |
462,347 | |||
|
|
|
|||
| Total covered loans |
$ | 1,698,133 | ||
|
|
|
|||
Loan Maturity and Repricing Analysis: Covered Loans
The following table sets forth the maturity or period to repricing of our covered loan portfolio at December 31, 2016. Loans that have adjustable rates are shown as being due or repricing in the period during which their interest rates are next subject to change.
| Covered Loans at December 31, 2016 | ||||||||||||
| (in thousands) | One-to-Four Family |
All Other Loans |
Total Loans |
|||||||||
| Amount due or repricing: |
||||||||||||
| Within one year |
$ | 852,697 | $ | 87,860 | $ | 940,557 | ||||||
| After one year: |
||||||||||||
| One to five years |
191,863 | 57 | 191,920 | |||||||||
| Over five years |
565,075 | 581 | 565,656 | |||||||||
|
|
|
|
|
|
|
|||||||
| Total due or repricing after one year |
756,938 | 638 | 757,576 | |||||||||
|
|
|
|
|
|
|
|||||||
| Total amounts due or repricing, gross |
$ | 1,609,635 | $ | 88,498 | $ | 1,698,133 | ||||||
|
|
|
|
|
|
|
|||||||
The following table sets forth, as of December 31, 2016, the dollar amount of all covered loans due or repricing after December 31, 2017, and indicates whether such loans have fixed or adjustable interest rates.
| Due or Repricing after December 31, 2017 |
||||||||||||
| (in thousands) | Fixed | Adjustable | Total | |||||||||
| One-to-four family |
$ | 234,377 | $ | 522,561 | $ | 756,938 | ||||||
| All other loans |
77 | 561 | 638 | |||||||||
|
|
|
|
|
|
|
|||||||
| Total loans |
$ | 234,454 | $ | 523,122 | $ | 757,576 | ||||||
|
|
|
|
|
|
|
|||||||
45
Table of Contents
Non-Covered Loans Held for Investment
The majority of the loans we produce are loans held for investment and most of the held-for-investment loans we produce are multi-family loans. Our production of multi-family loans began several decades ago in the five boroughs of New York City, where 61.1% of the rental units currently consist of rent-regulated apartments featuring below-market rents.
In addition to multi-family loans, our portfolio of loans held for investment contains a large number of CRE credits, most of which are secured by income-producing properties located in New York City and on Long Island.
In addition to multi-family loans and CRE loans, our portfolio includes substantially smaller balances of one-to-four family loans, ADC loans, and other loans held for investment, with commercial and industrial (“C&I”) loans comprising the bulk of the “other loan” portfolio. Specialty finance loans and leases account for most of our C&I credits, with the remainder consisting primarily of loans to small and mid-size businesses, referred to as “other” C&I loans.
Non-covered loans held for investment represented $37.4 billion, or 94.7%, of total loans at the end of this December, reflecting a year-over-year increase of $1.6 billion, or 4.5%. Loans secured by multi-family, CRE, and ADC properties represented 821.0% of the consolidated Banks’ total risk-based capital, within our limit of 850%.
In 2016, we originated $9.2 billion of held-for-investment loans, a $3.5 billion decrease from the record volume produced in the prior year. Consistent with our short-term objective of containing the growth of our assets, we sold $1.7 billion of held-for-investment loans, largely through participations, as compared to $1.9 billion in 2015. In 2016, sales of such loans produced net gains of $15.8 million, as further discussed under “Non-Interest Income” later in this report.
Multi-Family Loans
Multi-family loans are our principal asset. The loans we produce are primarily secured by non-luxury residential apartment buildings in New York City that feature rent-regulated units and below-market rents—a market we refer to as our “primary lending niche.” Consistent with our emphasis on multi-family lending, multi-family loan originations represented $5.7 billion, or 61.9%, of the loans we produced for investment in 2016. The latter amount was $3.5 billion, or 38.3%, lower than the prior year’s volume, reflecting a sharp decline in the gross dollar volume of sales transactions in our market, coupled with a decline in refinancing activity.
At December 31, 2016, multi-family loans represented $26.9 billion, or 72.1%, of total non-covered loans held for investment, reflecting a year-over-year increase of $973.4 million, or 3.7%. In addition to prepayments, the growth of the portfolio was tempered by the sale of multi-family loans totaling $1.3 billion, primarily through participations.
At December 31, 2016 and 2015, respectively, the average multi-family loan had a principal balance of $5.5 million and $5.3 million; the expected weighted average life of the portfolio was 2.9 years and 2.8 years at the respective dates.
The majority of our multi-family loans are made to long-term owners of buildings with apartments that are subject to rent regulation and feature below-market rents. Our borrowers typically use the funds we provide to make building-wide improvements and renovations to certain apartments, as a result of which they are able to increase the rents their tenants pay. In doing so, the borrower creates more cash flows to borrow against in future years.
In addition to underwriting multi-family loans on the basis of the buildings’ income and condition, we consider the borrowers’ credit history, profitability, and building management expertise. Borrowers are required to present evidence of their ability to repay the loan from the buildings’ current rent rolls, their financial statements, and related documents.
While a small percentage of our multi-family loans are ten-year fixed rate credits, the vast majority of our multi-family loans feature a term of ten or twelve years, with a fixed rate of interest for the first five or seven years of the loan, and an alternative rate of interest in years six through ten or eight through twelve. The rate charged in the first five or seven years is generally based on intermediate-term interest rates plus a spread. During the remaining years, the loan resets to an annually adjustable rate that is tied to the prime rate of interest, plus a spread. Alternately, the borrower may opt for a fixed rate that is tied to the five-year fixed advance rate of the Federal Home Loan Bank of New York (the “FHLB-NY”), plus a spread. The fixed-rate option also requires the payment of one
46
Table of Contents
percentage point of the then-outstanding loan balance. In either case, the minimum rate at repricing is equivalent to the rate in the initial five-or seven-year term. As the rent roll increases, the typical property owner seeks to refinance the mortgage, and generally does so before the loan reprices in year six or eight.
Multi-family loans that refinance within the first five or seven years are typically subject to an established prepayment penalty schedule. Depending on the remaining term of the loan at the time of prepayment, the penalties normally range from five percentage points to one percentage point of the then-current loan balance. If a loan extends past the fifth or seventh year and the borrower selects the fixed-rate option, the prepayment penalties typically reset to a range of five points to one point over years six through ten or eight through twelve. For example, a ten-year multi-family loan that prepays in year three would generally be expected to pay a prepayment penalty equal to three percentage points of the remaining principal balance. A twelve-year multi-family loan that prepays in year one or two would generally be expected to pay a penalty equal to five percentage points.
Because prepayment penalties are recorded as interest income, they are reflected in the average yields on our loans and interest-earning assets, our net interest rate spread and net interest margin, and the level of net interest income we record. No assumptions are involved in the recognition of prepayment income, as such income is only recorded when cash is received.
Our success as a multi-family lender partly reflects the solid relationships we have developed with the market’s leading mortgage brokers, who are familiar with our lending practices, our underwriting standards, and our long-standing practice of basing our loans on the cash flows produced by the properties. The process of producing such loans is generally four to six weeks in duration and, because the multi-family market is largely broker-driven, the expense incurred in sourcing such loans is substantially reduced.
At December 31, 2016, the majority of our multi-family loans were secured by rental apartment buildings. In addition, 65.3% of our multi-family loans were secured by buildings in New York City and 5.5% were secured by buildings elsewhere in New York State. The remaining multi-family loans were secured by buildings outside these markets, including in the four other states served by our retail branch offices.
Our emphasis on multi-family loans is driven by several factors, including their structure, which reduces our exposure to interest rate volatility to some degree. Another factor driving our focus on multi-family lending has been the comparative quality of the loans we produce. Reflecting the nature of the buildings securing our loans, our underwriting standards, and the generally conservative loan-to-value ratios (“LTVs”) our multi-family loans feature at origination, a relatively small percentage of the multi-family loans that have transitioned to non-performing status have actually resulted in losses, even when the credit cycle has taken a downward turn.
We primarily underwrite our multi-family loans based on the current cash flows produced by the collateral property, with a reliance on the “income” approach to appraising the properties, rather than the “sales” approach. The sales approach is subject to fluctuations in the real estate market, as well as general economic conditions, and is therefore likely to be more risky in the event of a downward credit cycle turn. We also consider a variety of other factors, including the physical condition of the underlying property; the net operating income of the mortgaged premises prior to debt service; the debt service coverage ratio (“DSCR”), which is the ratio of the property’s net operating income to its debt service; and the ratio of the loan amount to the appraised value (i.e., the LTV) of the property.
In addition to requiring a minimum DSCR of 120% on multi-family buildings, we obtain a security interest in the personal property located on the premises, and an assignment of rents and leases. Our multi-family loans generally represent no more than 75% of the lower of the appraised value or the sales price of the underlying property, and typically feature an amortization period of 30 years. In addition, our multi-family loans may contain an initial interest-only period which typically does not exceed two years; however, these loans are underwritten on a fully amortizing basis.
Accordingly, while our multi-family lending niche has not been immune to downturns in the credit cycle, the limited number of losses we have recorded, even in adverse credit cycles, suggests that the multi-family loans we produce involve less credit risk than certain other types of loans. In general, buildings that are subject to rent regulation have tended to be stable, with occupancy levels remaining more or less constant over time. Because the rents are typically below market and the buildings securing our loans are generally maintained in good condition, they have been more likely to retain their tenants in adverse economic times. In addition, we exclude any short-term property tax exemptions and abatement benefits the property owners receive when we underwrite our multi-family loans.
47
Table of Contents
Commercial Real Estate Loans
At December 31, 2016, CRE loans represented $7.7 billion, or 20.7%, of total loans held for investment, as compared to $7.9 billion, or 22.0%, at December 31, 2015. In addition to prepayments, the growth of the portfolio was tempered by sales of CRE loans, largely through participations, in the amount of $338.7 million during the year. The average CRE loan had a principal balance of $5.6 million at the end of this December, as compared to $5.4 million at the prior year-end. In addition, the portfolio had an expected weighted average life of 3.4 years and 3.2 years at the corresponding dates.
CRE loans represented $1.2 billion, or 12.9%, of the loans we produced in 2016 for investment, as compared to $1.8 billion, or 14.5%, in the prior year.
The CRE loans we produce are secured by income-producing properties such as office buildings, retail centers, mixed-use buildings, and multi-tenanted light industrial properties. At December 31, 2016, 72.1% of our CRE loans were secured by properties in New York City, while properties on Long Island accounted for 11.6%. Other parts of New York State accounted for 2.4% of the properties securing our CRE credits, while all other states accounted for 14.0%, combined.
The terms of our CRE loans are similar to the terms of our multi-family credits. While a small percentage of our CRE loans feature ten-year fixed-rate terms, they primarily feature a fixed rate of interest for the first five or seven years of the loan that is generally based on intermediate-term interest rates plus a spread. During years six through ten or eight through twelve, the loan resets to an annually adjustable rate that is tied to the prime rate of interest, plus a spread. Alternately, the borrower may opt for a fixed rate that is tied to the five-year fixed advance rate of the FHLB-NY plus a spread. The fixed-rate option also requires the payment of an amount equal to one percentage point of the then-outstanding loan balance. In either case, the minimum rate at repricing is equivalent to the rate in the initial five- or seven-year term.
Prepayment penalties apply to our CRE loans, as they do our multi-family credits. Depending on the remaining term of the loan at the time of prepayment, the penalties normally range from five percentage points to one percentage point of the then-current loan balance. If a loan extends past the fifth or seventh year and the borrower selects the fixed rate option, the prepayment penalties typically reset to a range of five points to one point over years six through ten or eight through twelve. Our CRE loans tend to refinance within three to four years of origination, as reflected in the expected weighted average life of the CRE portfolio noted above.
The repayment of loans secured by commercial real estate is often dependent on the successful operation and management of the underlying properties. To minimize our credit risk, we originate CRE loans in adherence with conservative underwriting standards, and require that such loans qualify on the basis of the property’s current income stream and DSCR. The approval of a loan also depends on the borrower’s credit history, profitability, and expertise in property management, and generally requires a minimum DSCR of 130% and a maximum LTV of 65%. In addition, the origination of CRE loans typically requires a security interest in the fixtures, equipment, and other personal property of the borrower and/or an assignment of the rents and/or leases. In addition, our CRE loans may contain an interest-only period which typically does not exceed three years; however, these loans are underwritten on a fully amortizing basis.
One-to-Four Family Loans
At December 31, 2016, one-to-four family loans represented $381.1 million, or 1.0%, of total loans held for investment, as compared to $116.8 million, or 0.33%, at the prior year-end.
The majority of the one-to-four family loans we produce for investment are prime jumbo adjustable-rate mortgage loans made at conservative LTVs to borrowers with high credit ratings. While originations of one-to-four family loans rose $282.6 million year-over-year to $303.9 million, such loans continued to represent a small portion (3.3%) of the held-for-investment loans we produced in 2016.
48
Table of Contents
Acquisition, Development, and Construction Loans
At December 31, 2016, ADC loans represented $381.2 million, or 1.0%, of total loans held for investment, as compared to $311.7 million, or 0.87%, at the prior year-end. Originations of ADC loans totaled $150.2 million in 2016, down $5.1 million from the year-earlier amount.
At December 31, 2016, 79.0% of the loans in our ADC portfolio were for land acquisition and development; the remaining 21.0% consisted of loans that were provided for the construction of commercial properties and owner-occupied homes. Loan terms vary based upon the scope of the construction, and generally range from 18 months to two years. They also feature a floating rate of interest tied to prime, with a floor. At December 31, 2016, 74.1% of our ADC loans were for properties in New York City, with Manhattan accounting for more than half of New York City’s share.
Because ADC loans are generally considered to have a higher degree of credit risk, especially during a downturn in the credit cycle, borrowers are required to provide a guarantee of repayment and completion. In the twelve months ended December 31, 2016 and 2015, we recovered losses against guarantees of $337,000 and $336,000, respectively. The risk of loss on an ADC loan is largely dependent upon the accuracy of the initial appraisal of the property’s value upon completion of construction; the developer’s experience; the estimated cost of construction, including interest; and the estimated time to complete and/or sell or lease such property.
When applicable, as a condition to closing an ADC loan, it is our practice to require that properties meet pre-sale or pre-lease requirements prior to funding.
Other Loans
At December 31, 2016, other loans represented $1.9 billion, or 5.2%, of total loans held for investment, an increase from $1.5 billion, or 4.2%, at December 31, 2015. C&I loans represented all but $24.1 million of the year-end 2016 balance and all but $32.6 million of the prior year-end amount.
Our C&I loans are divided into two categories: specialty finance loans and leases, and “other” C&I loans, as further described below.
Specialty Finance Loans and Leases
C&I loans rose $449.9 million year-over-year to $1.9 billion, largely reflecting a $386.9 million increase in the specialty finance loan and lease portfolio. At December 31, 2016 and 2015, specialty finance loans and leases represented $1.3 billion and $880.7 million, respectively, of total loans held for investment, and $1.3 billion and $1.1 billion, respectively, of the C&I loans produced over the course of those years.
We produce our specialty finance loans and leases through a subsidiary that is staffed by a group of industry veterans with expertise in originating and underwriting senior securitized debt and equipment loans and leases. The subsidiary participates in syndicated loans that are brought to them, and equipment loans and leases that are assigned to them, by a select group of nationally recognized sources, and are generally made to large corporate obligors, many of which are publicly traded, carry investment grade or near-investment grade ratings, and participate in stable industries nationwide.
The specialty finance loans and leases we fund fall into three categories: asset-based lending, dealer floor-plan lending, and equipment loan and lease financing. Each of these credits is secured with a perfected first security interest in, or outright ownership of, the underlying collateral, and structured as senior debt or as a non-cancelable lease. Asset-based and dealer floor-plan loans are priced at floating rates predominately tied to LIBOR, while our equipment financing credits are priced at fixed rates at a spread over Treasuries.
Since launching our specialty finance business in the third quarter of 2013, no losses have been recorded on any of the loans or leases in this portfolio.
Other C&I Loans
In the twelve months ended December 31, 2016, other C&I loans rose $63.0 million to $632.9 million, and represented $592.3 million of the held-for-investment loans we produced. Included in the balance at year-end 2016 were taxi medallion loans of $150.7 million, all of which were collateralized by New York City taxi medallions. The portfolio of taxi medallion loans represented 0.40% of total held-for-investment loans at December 31, 2016.
49
Table of Contents
In contrast to the loans produced by our specialty finance subsidiary, the other C&I loans we produce are primarily made to small and mid-size businesses in the five boroughs of New York City and on Long Island. Such loans are tailored to meet the specific needs of our borrowers, and include term loans, demand loans, revolving lines of credit, and, to a much lesser extent, loans that are partly guaranteed by the Small Business Administration.
A broad range of other C&I loans, both collateralized and unsecured, are made available to businesses for working capital (including inventory and accounts receivable), business expansion, the purchase of machinery and equipment, and other general corporate needs. In determining the term and structure of other C&I loans, several factors are considered, including the purpose, the collateral, and the anticipated sources of repayment. Other C&I loans are typically secured by business assets and personal guarantees of the borrower, and include financial covenants to monitor the borrower’s financial stability.
The interest rates on our other C&I loans can be fixed or floating, with floating-rate loans being tied to prime or some other market index, plus an applicable spread. Our floating-rate loans may or may not feature a floor rate of interest. The decision to require a floor on other C&I loans depends on the level of competition we face for such loans from other institutions, the direction of market interest rates, and the profitability of our relationship with the borrower.
The remainder of the “other” loan portfolio consists primarily of home equity loans and lines of credit, as well as a variety of consumer loans, most of which were originated by our pre-2009 merger partners prior to their joining the Company. We currently do not offer home equity loans or lines of credit.
Lending Authority
The loans we originate for investment are subject to federal and state laws and regulations, and are underwritten in accordance with loan underwriting policies and procedures approved by the Mortgage and Real Estate Committee of the Community Bank (the “Mortgage Committee”), the Credit Committee of the Commercial Bank (the “Credit Committee”), and the respective Boards of Directors of the Banks.
Prior to 2017, all loans originated by the Banks were presented to the Mortgage Committee or the Credit Committee, as applicable. Furthermore, all loans of $20.0 million or more originated by the Community Bank, and all loans of $10.0 million or more originated by the Commercial Bank, were reported to the applicable Board of Directors. One-to-four family mortgage loans were approved by line-of-business personnel having underwriting authority pursuant to a separate policy applicable to our mortgage banking segment.
Effective January 27, 2017, and in accordance with the Banks’ credit policies, all loans other than one-to-four family mortgage loans and C&I loans less than or equal to $3.0 million are required to be presented to the Management Credit Committee for approval. All multi-family, CRE, and “other” C&I loans in excess of $5.0 million, and specialty finance loans in excess of $15.0 million, are also required to be presented to the Mortgage Committee or the Credit Committee, as applicable, so that the Committees can review the loans’ associated risks. The Committees have authority to direct changes in lending practices as they deem necessary or appropriate in order to address individual or aggregate risks and credit exposures in accordance with the Bank’s strategic objectives and risk appetites.
All mortgage loans in excess of $50.0 million and all “other” C&I loans in excess of $5.0 million require approval by the Mortgage Committee or the Credit Committee. Credit Committee approval also is required for specialty finance loans in excess of $15.0 million.
In addition, all loans of $20.0 million or more originated by the Community Bank, and all loans of $10.0 million or more originated by the Commercial Bank, continue to be reported to the applicable Board of Directors, and all one-to-four family mortgage loans and C&I loans less than or equal to $3.0 million continue to be approved by line-of-business personnel.
In 2016, 176 loans of $10.0 million or more were originated by the Banks, with an aggregate loan balance of $5.1 billion at origination. In 2015, by comparison, 285 loans of $10.0 million or more were originated, with an aggregate loan balance at origination of $7.3 billion.
At December 31, 2016 and 2015, the largest loan in our portfolio was a loan originated by the Community Bank on June 28, 2013 to the owner of a commercial office building located in Manhattan. As of the date of this report, the loan has been current since origination. The balance of the loan was $287.5 million at both year-ends.
50
Table of Contents
Geographical Analysis of the Portfolio of Non-Covered Loans Held for Investment
The following table presents a geographical analysis of the multi-family and CRE loans in our held-for-investment loan portfolio at December 31, 2016:
| At December 31, 2016 | ||||||||||||||||
| Multi-Family Loans | Commercial Real Estate Loans | |||||||||||||||
| Percent | Percent | |||||||||||||||
| (dollars in thousands) | Amount | of Total | Amount | of Total | ||||||||||||
| New York City: |
||||||||||||||||
| Manhattan |
$ | 7,486,232 | 27.78 | % | $ | 4,102,971 | 53.12 | % | ||||||||
| Brooklyn |
4,124,518 | 15.31 | 582,264 | 7.54 | ||||||||||||
| Bronx |
3,699,013 | 13.73 | 142,346 | 1.84 | ||||||||||||
| Queens |
2,207,947 | 8.19 | 683,299 | 8.85 | ||||||||||||
| Staten Island |
71,293 | 0.27 | 54,619 | 0.70 | ||||||||||||
|
|
|
|
|
|
|
|
|
|||||||||
| Total New York City |
$ | 17,589,003 | 65.28 | % | $ | 5,565,499 | 72.05 | % | ||||||||
|
|
|
|
|
|
|
|
|
|||||||||
| Long Island |
537,730 | 2.00 | 892,059 | 11.55 | ||||||||||||
| Other New York State |
940,467 | 3.49 | 186,839 | 2.42 | ||||||||||||
| All other states |
7,877,852 | 29.23 | 1,079,965 | 13.98 | ||||||||||||
|
|
|
|
|
|
|
|
|
|||||||||
| Total |
$ | 26,945,052 | 100.00 | % | $ | 7,724,362 | 100.00 | % | ||||||||
|
|
|
|
|
|
|
|
|
|||||||||
At December 31, 2016, the largest concentration of one-to-four family loans held for investment was in California, with a total of $182.0 million; the largest concentration of ADC loans held for investment was in New York City, with a total of $282.3 million at that date. The majority of our “other” C&I loans held for investment were secured by properties and/or businesses located in Metro New York.
Loan Maturity and Repricing Analysis: Non-Covered Loans Held for Investment
The following table sets forth the maturity or period to repricing of our portfolio of non-covered loans held for investment at December 31, 2016. Loans that have adjustable rates are shown as being due in the period during which their interest rates are next subject to change.
| Non-Covered Loans Held for Investment at December 31, 2016 |
||||||||||||||||||||||||
| (in thousands) | Multi- Family |
Commercial Real Estate |
One-to-Four Family |
Acquisition, Development, and Construction |
Other | Total Loans |
||||||||||||||||||
| Amount due: |
|
|||||||||||||||||||||||
| Within one year |
$ | 1,211,600 | $ | 803,993 | $ | 15,781 | $ | 380,491 | $ | 1,105,125 | $ | 3,516,990 | ||||||||||||
| After one year: |
||||||||||||||||||||||||
| One to five years |
18,120,480 | 4,318,408 | 81,179 | — | 485,662 | 23,005,729 | ||||||||||||||||||
| Over five years |
7,612,972 | 2,601,961 | 284,121 | 703 | 333,725 | 10,833,482 | ||||||||||||||||||
|
|
|
|
|
|
|
|
|
|
|
|
|
|||||||||||||
| Total due or repricing after one year |
25,733,452 | 6,920,369 | 365,300 | 703 | 819,387 | 33,839,211 | ||||||||||||||||||
|
|
|
|
|
|
|
|
|
|
|
|
|
|||||||||||||
| Total amounts due or repricing, gross |
$ | 26,945,052 | $ | 7,724,362 | $ | 381,081 | $ | 381,194 | $ | 1,924,512 | $ | 37,356,201 | ||||||||||||
|
|
|
|
|
|
|
|
|
|
|
|
|
|||||||||||||
51
Table of Contents
The following table sets forth, as of December 31, 2016, the dollar amount of all non-covered loans held for investment that are due after December 31, 2017, and indicates whether such loans have fixed or adjustable rates of interest:
| Due after December 31, 2017 | ||||||||||||
| (in thousands) | Fixed | Adjustable | Total | |||||||||
| Mortgage Loans: |
|
|||||||||||
| Multi-family |
$ | 3,497,785 | $ | 22,235,667 | $ | 25,733,452 | ||||||
| Commercial real estate |
1,745,532 | 5,174,837 | 6,920,369 | |||||||||
| One-to-four family |
26,667 | 338,633 | 365,300 | |||||||||
| Acquisition, development, and construction |
703 | — | 703 | |||||||||
|
|
|
|
|
|
|
|||||||
| Total mortgage loans |
5,270,687 | 27,749,137 | 33,019,824 | |||||||||
| Other loans |
702,660 | 116,727 | 819,387 | |||||||||
|
|
|
|
|
|
|
|||||||
| Total loans |
$ | 5,973,347 | $ | 27,865,864 | $ | 33,839,211 | ||||||
|
|
|
|
|
|
|
|||||||
Non-Covered Loans Held for Sale
Our portfolio of non-covered loans held for sale consists of one-to-four family loans originated through our mortgage banking operation, utilizing our proprietary web-based technology. This platform is not only used by the Community Bank to serve our retail customers in New York, New Jersey, Ohio, Florida, and Arizona, but also by approximately 900 clients—community banks, credit unions, mortgage companies, and mortgage brokers—to originate full-documentation, prime credit one-to-four family loans nationwide.
While the vast majority of the one-to-four family loans held for sale we produce are agency-conforming loans sold to government-sponsored enterprises (“GSEs”), we also utilize our mortgage banking platform to originate prime jumbo loans for sale to other private mortgage investors, as well as for our own portfolio.
In the twelve months ended December 31, 2016, we originated loans held for sale of $4.6 billion, representing a $33.5 million decrease from the year-earlier volume and 33.6% of total loans produced over the course of the year. Of the one-to-four family loans we produced for sale, $4.4 billion, or 96.6%, were agency-conforming and $154.6 million, or 3.4%, were non-conforming (i.e., jumbo) loans. Loans held for sale totaled $409.2 million at the end of this December, up $41.9 million from the balance at year-end 2015.
Both the agency-conforming and non-conforming one-to-four family loans we originate for sale require that we make certain representations and warranties with regard to the underwriting, documentation, and legal/regulatory compliance, and we may be required to repurchase a loan or loans if it is found that a breach of the representations and warranties has occurred. If this were the case, we would be exposed to any subsequent credit loss on the mortgage loans that might or might not be realized in the future.
As governed by our agreements with the GSEs and other third parties to whom we sell loans, the representations and warranties we make relate to several factors, including, but not limited to, the ownership of the loan; the validity of the lien securing the loan; the absence of delinquent taxes or liens against the property securing the loan as of its closing date; the process used to select the loan for inclusion in a transaction; and the loan’s compliance with any applicable criteria, including underwriting standards, loan program guidelines, and compliance with applicable federal, state, and local laws.
We record a liability for estimated losses relating to these representations and warranties, which is included in “Other liabilities” in the accompanying Consolidated Statements of Condition. The related expense is recorded in “Mortgage banking income” in the accompanying Consolidated Statements of Operations and Comprehensive Income (Loss). At December 31, 2016 and 2015, the respective liabilities for estimated possible future losses relating to these representations and warranties were $2.1 million and $8.0 million.
The methodology used to estimate the liability for representations and warranties is a function of the representations and warranties given and considers a variety of factors, including, but not limited to, actual default experience, estimated future defaults, historical loan repurchase rates, the frequency and potential severity of defaults, the probability that a repurchase request will be received, and the probability that a loan will be required to be repurchased.
52
Table of Contents
In January 2013, the GSEs changed the rules related to their ability to put back claims for representation and warranty issues. These rule changes moderated the potential exposure to issuers, and provided for a phase-in that became fully impactful in 2016. Reflecting this change, as well as the minimal volume of repurchase requests and related losses incurred since our mortgage banking business was established, our representation and warranty reserve was reduced by $5.9 million in the first quarter of 2016.
Representation and Warranty Reserve
The following table sets forth the activity in our representation and warranty reserve during the periods indicated:
| For the Years Ended December 31, |
||||||||
| (in thousands) | 2016 | 2015 | ||||||
| Balance, beginning of period |
$ | 8,008 | $ | 8,160 | ||||
| Repurchase losses, net |
(24 | ) | (152 | ) | ||||
| Reversal of provision for repurchase losses |
(5,876 | ) | — | |||||
|
|
|
|
|
|||||
| Balance, end of period |
$ | 2,108 | $ | 8,008 | ||||
|
|
|
|
|
|||||
Indemnified and Repurchased Loans
The following table sets forth our activity with regard to repurchased loans and the loans we indemnified for GSEs during the twelve months ended December 31, 2016 and 2015:
| For the Years Ended December 31, | ||||||||||||||||
| 2016 | 2015 | |||||||||||||||
| (dollars in thousands) | Number of Loans | Amount | Number of Loans | Amount | ||||||||||||
| Balance, beginning of period |
37 | $ | 8,365 | 31 | $ | 7,916 | ||||||||||
| New indemnifications |
— | — | 5 | 989 | ||||||||||||
| New repurchases |
4 | 1,035 | 8 | 2,654 | ||||||||||||
| Transfers to OREO |
(3 | ) | (993 | ) | — | — | ||||||||||
| Principal payoffs |
(5 | ) | (1,419 | ) | (7 | ) | (2,910 | ) | ||||||||
| Principal payments |
— | (241 | ) | — | (284 | ) | ||||||||||
|
|
|
|
|
|
|
|
|
|||||||||
| Balance, end of period (1) |
33 | $ | 6,747 | 37 | $ | 8,365 | ||||||||||
|
|
|
|
|
|
|
|
|
|||||||||
| (1) | Of the 33 period-end loans, 19 loans with an aggregate principal balance of $3.6 million were repurchased and are now held for investment. The other 14 loans, with an aggregate principal balance of $3.1 million, were indemnified and are all performing as of the date of this report. |
Because the level of mortgage loan repurchase losses is dependent on economic factors, investor demand strategies, and other external conditions that may change over the lives of the underlying loans, the level of the liability for mortgage loan repurchase losses is difficult to estimate and requires considerable judgment on the part of management. However, we believe the amount and range of reasonably possible losses in excess of our reserve would not be material to our operation, or to our financial condition or results of operations.
53
Table of Contents
Repurchase and Indemnification Requests
The following table sets forth our repurchase and indemnification requests during the periods indicated:
| For the Years Ended December 31, | ||||||||||||||||
| 2016 | 2015 | |||||||||||||||
| (dollars in thousands) | Number of Loans | Amount (1) | Number of Loans | Amount (1) | ||||||||||||
| Balance, beginning of period |
6 | $ | 2,731 | 24 | $ | 6,190 | ||||||||||
| New repurchase requests (2) |
20 | 4,905 | 45 | 12,736 | ||||||||||||
| Successful rebuttal/rescission |
(19 | ) | (5,460 | ) | (50 | ) | (12,552 | ) | ||||||||
| New indemnifications (3) |
— | — | (5 | ) | (989 | ) | ||||||||||
| Loan repurchases |
(4 | ) | (1,035 | ) | (8 | ) | (2,654 | ) | ||||||||
|
|
|
|
|
|
|
|
|
|||||||||
| Balance, end of period (4) |
3 | $ | 1,141 | 6 | $ | 2,731 | ||||||||||
|
|
|
|
|
|
|
|
|
|||||||||
| (1) | Represents the loan balance as of the repurchase request date. |
| (2) | All requests relate to one-to-four family loans originated for sale. |
| (3) | An indemnification agreement is an arrangement whereby the Company protects the GSEs against future losses. |
| (4) | All three requests as of December 31, 2016 were from Fannie Mae. Both Fannie Mae and Freddie Mac allow 60 days to respond to a repurchase request. Failure to respond in a timely manner could result in our having an obligation to repurchase the loan. |
See Item 7A, “Quantitative and Qualitative Disclosures about Market Risk,” for a discussion of the strategies we employ to mitigate the interest rate risk associated with our production of one-to-four family loans for sale.
Loan Origination Analysis
The following table summarizes our production of loans held for investment and loans held for sale in the years ended December 31, 2016 and 2015:
| For the Years Ended December 31, | ||||||||||||||||
| 2016 | 2015 | |||||||||||||||
| (dollars in thousands) | Amount | Percent of Total |
Amount | Percent of Total |
||||||||||||
| Mortgage Loan Originations for Investment: |
||||||||||||||||
| Multi-family |
$ | 5,684,838 | 41.10 | % | $ | 9,214,336 | 53.10 | % | ||||||||
| Commercial real estate |
1,180,430 | 8.54 | 1,842,062 | 10.62 | ||||||||||||
| One-to-four family |
303,877 | 2.20 | 21,265 | 0.12 | ||||||||||||
| Acquisition, development, and construction |
150,177 | 1.09 | 155,312 | 0.89 | ||||||||||||
|
|
|
|
|
|
|
|
|
|||||||||
| Total mortgage loan originations for investment |
7,319,322 | 52.93 | 11,232,975 | 64.73 | ||||||||||||
|
|
|
|
|
|
|
|
|
|||||||||
| Other Loan Originations for Investment: |
||||||||||||||||
| Specialty finance |
1,266,362 | 9.16 | 1,067,672 | 6.15 | ||||||||||||
| Other commercial and industrial |
592,250 | 4.28 | 367,699 | 2.12 | ||||||||||||
| Other |
3,856 | 0.03 | 4,674 | 0.03 | ||||||||||||
|
|
|
|
|
|
|
|
|
|||||||||
| Total other loan originations for investment |
1,862,468 | 13.47 | 1,440,045 | 8.30 | ||||||||||||
|
|
|
|
|
|
|
|
|
|||||||||
| Total loan originations for investment |
$ | 9,181,790 | 66.40 | % | $ | 12,673,020 | 73.03 | % | ||||||||
| Loan originations for sale |
4,646,773 | 33.60 | 4,680,243 | 26.97 | ||||||||||||
|
|
|
|
|
|
|
|
|
|||||||||
| Total loan originations |
$ | 13,828,563 | 100.00 | % | $ | 17,353,263 | 100.00 | % | ||||||||
|
|
|
|
|
|
|
|
|
|||||||||
54
Table of Contents
Loan Portfolio Analysis
The following table summarizes the composition of our loan portfolio at each year-end for the five years ended December 31, 2016:
| At December 31, | ||||||||||||||||||||||||||||||||||||||||||||||||||||||||||||
| 2016 | 2015 | 2014 | 2013 | 2012 | ||||||||||||||||||||||||||||||||||||||||||||||||||||||||
| (dollars in thousands) | Amount | Percent of Total Loans |
Percent of Non- Covered Loans |
Amount | Percent of Total Loans |
Percent of Non- Covered Loans |
Amount | Percent of Total Loans |
Percent of Non- Covered Loans |
Amount | Percent of Total Loans |
Percent of Non- Covered Loans |
Amount | Percent of Total Loans |
Percent of Non- Covered Loans |
|||||||||||||||||||||||||||||||||||||||||||||
| Non-Covered Mortgage Loans: |
||||||||||||||||||||||||||||||||||||||||||||||||||||||||||||
| Multi-family |
$ | 26,945,052 | 68.28 | % | 71.35 | % | $ | 25,971,629 | 68.04 | % | 71.93 | % | $ | 23,831,846 | 66.54 | % | 71.39 | % | $ | 20,699,927 | 62.89 | % | 68.71 | % | $ | 18,595,833 | 58.55 | % | 65.30 | % | ||||||||||||||||||||||||||||||
| Commercial real estate |
7,724,362 | 19.57 | 20.45 | 7,857,204 | 20.58 | 21.76 | 7,634,320 | 21.32 | 22.87 | 7,364,231 | 22.37 | 24.44 | 7,436,598 | 23.41 | 26.11 | |||||||||||||||||||||||||||||||||||||||||||||
| One-to-four family |
381,081 | 0.97 | 1.01 | 116,841 | 0.31 | 0.32 | 138,915 | 0.39 | 0.41 | 560,730 | 1.70 | 1.86 | 203,435 | 0.64 | 0.71 | |||||||||||||||||||||||||||||||||||||||||||||
| Acquisition, development, and construction |
381,194 | 0.97 | 1.01 | 311,676 | 0.82 | 0.86 | 258,116 | 0.72 | 0.77 | 344,100 | 1.05 | 1.14 | 397,917 | 1.25 | 1.40 | |||||||||||||||||||||||||||||||||||||||||||||
|
|
|
|
|
|
|
|
|
|
|
|
|
|
|
|
|
|
|
|
|
|
|
|
|
|
|
|
|
|
|
|||||||||||||||||||||||||||||||
| Total non-covered mortgage loans |
35,431,689 | 89.79 | 93.82 | 34,257,350 | 89.75 | 94.87 | 31,863,197 | 88.97 | 95.44 | 28,968,988 | 88.01 | 96.15 | 26,633,783 | 83.85 | 93.52 | |||||||||||||||||||||||||||||||||||||||||||||
|
|
|
|
|
|
|
|
|
|
|
|
|
|
|
|
|
|
|
|
|
|
|
|
|
|
|
|
|
|
|
|||||||||||||||||||||||||||||||
| Non-Covered Other Loans: |
||||||||||||||||||||||||||||||||||||||||||||||||||||||||||||
| Specialty finance |
1,267,530 | 3.21 | 3.36 | 880,673 | 2.31 | 2.44 | 632,827 | 1.77 | 1.89 | 172,698 | 0.52 | 0.57 | — | — | — | |||||||||||||||||||||||||||||||||||||||||||||
| Other commercial and industrial |
632,915 | 1.60 | 1.68 | 569,883 | 1.49 | 1.58 | 476,394 | 1.33 | 1.43 | 640,993 | 1.95 | 2.13 | 590,044 | 1.86 | 2.07 | |||||||||||||||||||||||||||||||||||||||||||||
| Other loans |
24,067 | 0.06 | 0.06 | 32,583 | 0.09 | 0.09 | 31,943 | 0.09 | 0.10 | 39,036 | 0.12 | 0.13 | 49,880 | 0.16 | 0.18 | |||||||||||||||||||||||||||||||||||||||||||||
|
|
|
|
|
|
|
|
|
|
|
|
|
|
|
|
|
|
|
|
|
|
|
|
|
|
|
|
|
|
|
|||||||||||||||||||||||||||||||
| Total non-covered other loans |
1,924,512 | 4.87 | 5.10 | 1,483,139 | 3.89 | 4.11 | 1,141,164 | 3.19 | 3.42 | 852,727 | 2.59 | 2.83 | 639,924 | 2.02 | 2.25 | |||||||||||||||||||||||||||||||||||||||||||||
|
|
|
|
|
|
|
|
|
|
|
|
|
|
|
|
|
|
|
|
|
|
|
|
|
|
|
|
|
|
|
|||||||||||||||||||||||||||||||
| Total non-covered loans held for investment |
$ | 37,356,201 | 94.66 | 98.92 | $ | 35,740,489 | 93.64 | 98.98 | $ | 33,004,361 | 92.16 | 98.86 | $ | 29,821,715 | 90.60 | 98.98 | $ | 27,273,707 | 85.87 | 95.77 | ||||||||||||||||||||||||||||||||||||||||
|
|
|
|
|
|
|
|
|
|
|
|
|
|
|
|
|
|
|
|
|
|
|
|
|
|
|
|
|
|
|
|||||||||||||||||||||||||||||||
| Loans held for sale |
409,152 | 1.04 | 1.08 | 367,221 | 0.96 | 1.02 | 379,399 | 1.06 | 1.14 | 306,915 | 0.93 | 1.02 | 1,204,370 | 3.79 | 4.23 | |||||||||||||||||||||||||||||||||||||||||||||
|
|
|
|
|
|
|
|
|
|
|
|
|
|
|
|
|
|
|
|
|
|
|
|
|
|
|
|
|
|
|
|||||||||||||||||||||||||||||||
| Total non-covered loans |
$ | 37,765,353 | 95.70 | 100.00 | % | $ | 36,107,710 | 94.60 | 100.00 | % | $ | 33,383,760 | 93.22 | 100.00 | % | $ | 30,128,630 | 91.53 | 100.00 | % | $ | 28,478,077 | 89.66 | 100.00 | % | |||||||||||||||||||||||||||||||||||
|
|
|
|
|
|
|
|
|
|
|
|||||||||||||||||||||||||||||||||||||||||||||||||||
| Covered loans |
1,698,133 | 4.30 | 2,060,089 | 5.40 | 2,428,622 | 6.78 | 2,788,618 | 8.47 | 3,284,061 | 10.34 | ||||||||||||||||||||||||||||||||||||||||||||||||||
|
|
|
|
|
|
|
|
|
|
|
|
|
|
|
|
|
|
|
|
|
|||||||||||||||||||||||||||||||||||||||||
| Total loans |
$ | 39,463,486 | 100.00 | % | $ | 38,167,799 | 100.00 | % | $ | 35,812,382 | 100.00 | % | $ | 32,917,248 | 100.00 | % | $ | 31,762,138 | 100.00 | % | ||||||||||||||||||||||||||||||||||||||||
|
|
|
|
|
|
|
|
|
|
|
|||||||||||||||||||||||||||||||||||||||||||||||||||
| Net deferred loan origination costs |
26,521 | 22,715 | 20,595 | 16,274 | 10,757 | |||||||||||||||||||||||||||||||||||||||||||||||||||||||
| Allowance for losses on non-covered loans |
(158,290 | ) | (147,124 | ) | (139,857 | ) | (141,946 | ) | (140,948 | ) | ||||||||||||||||||||||||||||||||||||||||||||||||||
| Allowance for losses on covered loans |
(23,701 | ) | (31,395 | ) | (45,481 | ) | (64,069 | ) | (51,311 | ) | ||||||||||||||||||||||||||||||||||||||||||||||||||
|
|
|
|
|
|
|
|
|
|
|
|||||||||||||||||||||||||||||||||||||||||||||||||||
| Total loans, net |
$ | 39,308,016 | $ | 38,011,995 | $ | 35,647,639 | $ | 32,727,507 | $ | 31,580,636 | ||||||||||||||||||||||||||||||||||||||||||||||||||
|
|
|
|
|
|
|
|
|
|
|
|||||||||||||||||||||||||||||||||||||||||||||||||||
55
Table of Contents
Outstanding Loan Commitments
At December 31, 2016 and 2015, we had outstanding loan commitments of $2.1 billion and $2.8 billion, respectively. Loans held for investment represented $1.8 billion of the year-end 2016 total and $2.5 billion of the year-end 2015 amount. In contrast, loans held for sale represented $242.5 million of outstanding loan commitments at the end of this December, as compared to $371.4 million at the prior year-end.
We also had commitments to issue letters of credit totaling $324.3 million and $296.5 million at December 31, 2016 and 2015, respectively. The fees we collect in connection with the issuance of letters of credit are included in “Fee income” in the Consolidated Statements of Operations and Comprehensive Income (Loss).
The letters of credit we issue consist of performance stand-by, financial stand-by, and commercial letters of credit. Financial stand-by letters of credit primarily are issued for the benefit of other financial institutions, municipalities, or landlords on behalf of certain of our current borrowers, and obligate us to guarantee payment of a specified financial obligation. Performance stand-by letters of credit are primarily issued for the benefit of local municipalities on behalf of certain of our borrowers. These borrowers are mainly developers of residential subdivisions with whom we currently have a lending relationship. Performance letters of credit obligate us to make payments in the event that a specified third party fails to perform under non-financial contractual obligations. Commercial letters of credit act as a means of ensuring payment to a seller upon shipment of goods to a buyer. Although commercial letters of credit are used to effect payment for domestic transactions, the majority are used to settle payments in international trade. Typically, such letters of credit require the presentation of documents that describe the commercial transaction, and provide evidence of shipment and the transfer of title.
For more information about our outstanding loan commitments and commitments to issue letters of credit at the end of this December, see the discussion of “Liquidity” later in this discussion and analysis of our financial condition and results of operations.
Asset Quality
Non-Covered Loans Held for Investment and Non-Covered Other Real Estate Owned
Non-performing non-covered assets represented $68.1 million, or 0.14%, of total non-covered assets at the end of this December, as compared to $60.9 million, representing 0.13% of total non-covered assets, at December 31, 2015. While non-covered OREO fell $2.5 million year-over-year to $11.6 million, the benefit was exceeded by the impact of a $9.6 million rise in non-performing non-covered loans to $56.5 million, representing 0.15% of total non-covered loans at December 31, 2016.
The following table presents our non-performing non-covered loans by loan type and the changes in the respective balances from December 31, 2015 to December 31, 2016:
| December 31, | Change from December 31, 2015 to December 31, 2016 |
|||||||||||||||
| (dollars in thousands) | 2016 | 2015 | Amount | Percent | ||||||||||||
| Non-Performing Non-Covered Loans: |
||||||||||||||||
| Non-accrual non-covered mortgage loans: |
||||||||||||||||
| Multi-family |
$ | 13,558 | $ | 13,904 | $ | (346 | ) | (2.49 | )% | |||||||
| Commercial real estate |
9,297 | 14,920 | (5,623 | ) | (37.69 | ) | ||||||||||
| One-to-four family |
9,679 | 12,259 | (2,580 | ) | (21.05 | ) | ||||||||||
| Acquisition, development, and construction |
6,200 | 27 | 6,173 | 22,862.96 | ||||||||||||
|
|
|
|
|
|
|
|||||||||||
| Total non-accrual non-covered mortgage loans |
38,734 | 41,110 | (2,376 | ) | (5.78 | ) | ||||||||||
| Non-accrual non-covered other loans |
17,735 | 5,715 | 12,020 | 210.32 | ||||||||||||
|
|
|
|
|
|
|
|||||||||||
| Total non-performing non-covered loans |
$ | 56,469 | $ | 46,825 | $ | 9,644 | 20.60 | |||||||||
|
|
|
|
|
|
|
|||||||||||
In the preceding table, the increase in non-accrual ADC loans was due to a single property that transitioned to non-accrual status, while the increase in non-accrual other loans reflects the transition to non-accrual status of $13.3 million of New York City taxi medallion loans. With the rising popularity of online ride sharing services such as Lyft and Uber, the value of such taxi medallions has declined in the past two years. At the end of December, New York City taxi medallion loans totaled $150.7 million, representing a modest 0.40% of our total held-for-investment loan portfolio.
56
Table of Contents
The following table sets forth the changes in non-performing non-covered loans over the twelve months ended December 31, 2016:
| (in thousands) | ||||
| Balance at December 31, 2015 |
$ | 46,825 | ||
| New non-accrual |
32,200 | |||
| Recoveries |
(2,883 | ) | ||
| Transferred to other real estate owned |
(3,787 | ) | ||
| Loan payoffs, including dispositions and principal pay-downs |
(15,425 | ) | ||
| Restored to performing status |
(461 | ) | ||
|
|
|
|||
| Balance at December 31, 2016 |
$ | 56,469 | ||
|
|
|
|||
A loan generally is classified as a “non-accrual” loan when it is 90 days or more past due or when it is deemed to be impaired because we no longer expect to collect all amounts due according to the contractual terms of the loan agreement. When a loan is placed on non-accrual status, we cease the accrual of interest owed, and previously accrued interest is reversed and charged against interest income. At December 31, 2016 and 2015, all of our non-performing loans were non-accrual loans. A loan is generally returned to accrual status when the loan is current and we have reasonable assurance that the loan will be fully collectible.
We monitor non-accrual loans both within and beyond our primary lending area in the same manner. Monitoring loans generally involves inspecting and re-appraising the collateral properties; holding discussions with the principals and managing agents of the borrowing entities and/or retained legal counsel, as applicable; requesting financial, operating, and rent roll information; confirming that hazard insurance is in place or force-placing such insurance; monitoring tax payment status and advancing funds as needed; and appointing a receiver, whenever possible, to collect rents, manage the operations, provide information, and maintain the collateral properties.
It is our policy to order updated appraisals for all non-performing loans, irrespective of loan type, that are collateralized by multi-family buildings, CRE properties, or land, in the event that such a loan is 90 days or more past due, and if the most recent appraisal on file for the property is more than one year old. Appraisals are ordered annually until such time as the loan becomes performing and is returned to accrual status. It is not our policy to obtain updated appraisals for performing loans. However, appraisals may be ordered for performing loans when a borrower requests an increase in the loan amount, a modification in loan terms, or an extension of a maturing loan. We do not analyze current LTVs on a portfolio-wide basis.
Non-performing loans are reviewed regularly by management and discussed on a monthly basis with the Mortgage Committee, the Credit Committee, and the Boards of Directors of the respective Banks, as applicable. In accordance with our charge-off policy, collateral-dependent non-performing loans are written down to their current appraised values, less certain transaction costs. Workout specialists from our Loan Workout Unit actively pursue borrowers who are delinquent in repaying their loans in an effort to collect payment. In addition, outside counsel with experience in foreclosure proceedings are retained to institute such action with regard to such borrowers.
Properties that are acquired through foreclosure are classified as OREO, and are recorded at fair value at the date of acquisition, less the estimated cost of selling the property. Subsequent declines in the fair value of OREO are charged to earnings and are included in non-interest expense. It is our policy to require an appraisal and an environmental assessment of properties classified as OREO before foreclosure, and to re-appraise the properties on an as-needed basis, and not less than annually, until they are sold. We dispose of such properties as quickly and prudently as possible, given current market conditions and the property’s condition.
To mitigate the potential for credit losses, we underwrite our loans in accordance with credit standards that we consider to be prudent. In the case of multi-family and CRE loans, we look first at the consistency of the cash flows being generated by the property to determine its economic value using the “income approach,” and then at the market value of the property that collateralizes the loan. The amount of the loan is then based on the lower of the two values, with the economic value more typically used.
The condition of the collateral property is another critical factor. Multi-family buildings and CRE properties are inspected from rooftop to basement as a prerequisite to approval, with a member of the Mortgage or Credit Committee participating in inspections on multi-family loans to be originated in excess of $7.5 million, and a member of the Mortgage or Credit Committee participating in inspections on CRE loans to be originated in excess of $4.0 million. Furthermore, independent appraisers, whose appraisals are carefully reviewed by our experienced in-house appraisal officers and staff, perform appraisals on collateral properties. In many cases, a second independent appraisal review is performed.
57
Table of Contents
In addition, we work with a select group of mortgage brokers who are familiar with our credit standards and whose track record with our lending officers is typically greater than ten years. Furthermore, in New York City, where the majority of the buildings securing our multi-family loans are located, the rents that tenants may be charged on certain apartments are typically restricted under certain rent-control or rent-stabilization laws. As a result, the rents that tenants pay for such apartments are generally lower than current market rents. Buildings with a preponderance of such rent-regulated apartments are less likely to experience vacancies in times of economic adversity.
Reflecting the strength of the underlying collateral for these loans and the collateral structure, a relatively small percentage of our non-performing multi-family loans have resulted in losses over time.
To further manage our credit risk, our lending policies limit the amount of credit granted to any one borrower, and typically require minimum DSCRs of 120% for multi-family loans and 130% for CRE loans. Although we typically lend up to 75% of the appraised value on multi-family buildings and up to 65% on commercial properties, the average LTVs of such credits at origination were below those amounts at December 31, 2016. Exceptions to these LTV limitations are minimal and are reviewed on a case-by-case basis.
The repayment of loans secured by commercial real estate is often dependent on the successful operation and management of the underlying properties. To minimize our credit risk, we originate CRE loans in adherence with conservative underwriting standards, and require that such loans qualify on the basis of the property’s current income stream and DSCR. The approval of a CRE loan also depends on the borrower’s credit history, profitability, and expertise in property management. Given that our CRE loans are underwritten in accordance with underwriting standards that are similar to those applicable to our multi-family credits, the percentage of our non-performing CRE loans that have resulted in losses has been comparatively small over time.
Multi-family and CRE loans are generally originated at conservative LTVs and DSCRs, as previously stated. Low LTVs provide a greater likelihood of full recovery and reduce the possibility of incurring a severe loss on a credit; in many cases, they reduce the likelihood of the borrower “walking away” from the property. Although borrowers may default on loan payments, they have a greater incentive to protect their equity in the collateral property and to return their loans to performing status. Furthermore, in the case of multi-family loans, the cash flows generated by the properties are generally below-market and have significant value.
The following tables present the number and amount of non-performing multi-family and CRE loans by originating bank at December 31, 2016 and 2015:
| As of December 31, 2016 | Non-Performing Multi-Family Loans |
Non-Performing Commercial Real Estate Loans |
||||||||||||||
| (dollars in thousands) | Number | Amount | Number | Amount | ||||||||||||
| New York Community Bank |
11 | $ | 13,298 | 7 | $ | 4,297 | ||||||||||
| New York Commercial Bank |
2 | 260 | 2 | 5,000 | ||||||||||||
|
|
|
|
|
|
|
|
|
|||||||||
| Total for New York Community Bancorp |
13 | $ | 13,558 | 9 | $ | 9,297 | ||||||||||
|
|
|
|
|
|
|
|
|
|||||||||
| As of December 31, 2015 | Non-Performing Multi-Family Loans |
Non-Performing Commercial Real Estate Loans |
||||||||||||||
| (dollars in thousands) | Number | Amount | Number | Amount | ||||||||||||
| New York Community Bank |
7 | $ | 13,603 | 12 | $ | 8,589 | ||||||||||
| New York Commercial Bank |
2 | 301 | 4 | 6,331 | ||||||||||||
|
|
|
|
|
|
|
|
|
|||||||||
| Total for New York Community Bancorp |
9 | $ | 13,904 | 16 | $ | 14,920 | ||||||||||
|
|
|
|
|
|
|
|
|
|||||||||
With regard to ADC loans, we typically lend up to 75% of the estimated as-completed market value of multi-family and residential tract projects; however, in the case of home construction loans to individuals, the limit is 80%. With respect to commercial construction loans, we typically lend up to 65% of the estimated as-completed market value of the property. Credit risk is also managed through the loan disbursement process. Loan proceeds are disbursed periodically in increments as construction progresses, and as warranted by inspection reports provided to us by our own lending officers and/or consulting engineers.
58
Table of Contents
To minimize the risk involved in specialty finance lending and leasing, each of our credits is secured with a perfected first security interest or outright ownership in the underlying collateral, and structured as senior debt or as a non-cancellable lease. To further minimize the risk involved in specialty finance lending and leasing, we re-underwrite each transaction. In addition, we retain outside counsel to conduct a further review of the underlying documentation.
“Other” C&I loans are typically underwritten on the basis of the cash flows produced by the borrower’s business, and are generally collateralized by various business assets, including, but not limited to, inventory, equipment, and accounts receivable. As a result, the capacity of the borrower to repay is substantially dependent on the degree to which the business is successful. Furthermore, the collateral underlying the loan may depreciate over time, may not be conducive to appraisal, and may fluctuate in value, based upon the operating results of the business. Accordingly, personal guarantees are also a normal requirement for other C&I loans.
In addition, at December 31, 2016, one-to-four family loans, ADC loans, and other loans represented 1.0%, 1.0%, and 5.2%, of total non-covered loans held for investment, as compared to 0.33%, 0.87%, and 4.2%, respectively, at December 31, 2015. Furthermore, while 1.6% of our ADC loans and 2.5% of our one-to-four family loans were non-performing at the end of this December, 0.92% of our other loans were non-performing at that date.
The procedures we follow with respect to delinquent loans are generally consistent across all categories, with late charges assessed, and notices mailed to the borrower, at specified dates. We attempt to reach the borrower by telephone to ascertain the reasons for delinquency and the prospects for repayment. When contact is made with a borrower at any time prior to foreclosure or recovery against collateral property, we attempt to obtain full payment, and will consider a repayment schedule to avoid taking such action. Delinquencies are addressed by our Loan Workout Unit and every effort is made to collect rather than initiate foreclosure proceedings.
The following table presents our non-covered loans 30 to 89 days past due by loan type and the changes in the respective balances from December 31, 2015 to December 31, 2016:
| December 31, | Change from December 31, 2015 to December 31, 2016 |
|||||||||||||||
| (dollars in thousands) | 2016 | 2015 | Amount | Percent | ||||||||||||
| Non-Covered Loans 30-89 Days Past Due: |
||||||||||||||||
| Multi-family |
$ | 28 | $ | 4,818 | $ | (4,790 | ) | (99.42 | )% | |||||||
| Commercial real estate |
— | 178 | (178 | ) | (100.00 | ) | ||||||||||
| One-to-four family |
2,844 | 1,117 | 1,727 | 154.61 | ||||||||||||
| Other loans |
7,511 | 492 | 7,019 | 1,426.63 | ||||||||||||
|
|
|
|
|
|
|
|||||||||||
| Total non-covered loans 30-89 days past due |
$ | 10,383 | $ | 6,605 | $ | 3,778 | 57.20 | |||||||||
|
|
|
|
|
|
|
|||||||||||
At December 31, 2016, the balance of non-covered other loans 30 to 89 days past due included New York City taxi medallion loans of $6.8 million. There were no 30-to-89 day past-due taxi medallion loans at the prior year-end.
Fair values for all multi-family buildings, CRE properties, and land are determined based on the appraised value. If an appraisal is more than one year old and the loan is classified as either non-performing or as an accruing TDR, then an updated appraisal is required to determine fair value. Estimated disposition costs are deducted from the fair value of the property to determine estimated net realizable value. In the instance of an outdated appraisal on an impaired loan, we adjust the original appraisal by using a third-party index value to determine the extent of impairment until an updated appraisal is received.
While we strive to originate loans that will perform fully, adverse economic and market conditions, among other factors, can negatively impact a borrower’s ability to repay. Historically, our level of charge-offs has been relatively low in downward credit cycles, even when the volume of non-performing loans has increased. In 2016, we recorded net charge-offs of $708,000, as compared to net recoveries of $8.2 million in the prior year.
59
Table of Contents
Partially reflecting the net charge-offs noted above, and the provision of $11.9 million for the allowance for non-covered loan losses, the allowance for losses on non-covered loans rose to $158.3 million at the end of this December from $147.1 million at December 31, 2015. Reflecting the modest increase in non-performing non-covered loans cited earlier in this discussion, the allowance for losses on non-covered loans represented 277.19% of non-performing non-covered loans at December 31, 2016, as compared to 310.08% at the prior year-end.
Based upon all relevant and available information at the end of this December, management believes that the allowance for losses on non-covered loans was appropriate at that date.
The following table presents information about our five largest non-performing loans at December 31, 2016, all of which are non-covered held-for-investment loans:
| Loan No. 1 | Loan No. 2 | Loan No. 3 (1) | Loan No. 4 | Loan No. 5 | ||||||||||||||||
| Type of Loan |
Multi-Family | ADC | CRE | CRE | Other C&I | |||||||||||||||
| Origination date |
1/05/06 | 7/07/04 | Various (2) | 6/16/03 | 3/08/04 | |||||||||||||||
| Origination balance |
$ | 12,640,000 | $ | 6,200,000 | $ | 4,999,999 | $ | 1,800,000 | $ | 1,350,000 | ||||||||||
| Full commitment balance (3) |
$ | 12,640,000 | $ | 6,200,000 | $ | 4,999,999 | $ | 1,800,000 | $ | 1,190,000 | ||||||||||
| Balance at December 31, 2016 |
$ | 8,129,070 | $ | 6,200,000 | $ | 4,999,999 | $ | 1,255,633 | $ | 1,062,500 | ||||||||||
| Associated allowance |
None | None | None | None | None | |||||||||||||||
| Non-accrual date |
March 2014 | October 2016 | December 2014 | October 2015 | June 2014 | |||||||||||||||
| Origination LTV |
79 | % | 57 | % | 36 | % | 68 | % | 63 | % | ||||||||||
| Current LTV |
75 | % | 67 | % | 61 | % | 22 | % | 73 | % | ||||||||||
| Last appraisal |
February 2016 | April 2016 | January 2016 | November 2016 | June 2016 | |||||||||||||||
| (1) | This loan was paid in full in the first quarter of 2017. |
| (2) | Loan No. 3 consisted of two loans to the same borrower with origination dates of July 13, 2010 and September 8, 2011 that were collateralized by the same property. |
| (3) | There are no funds available for further advances on the five largest non-performing loans. |
The following is a description of the five loans identified in the preceding table. It should be noted that no allocation for the non-covered loan loss allowance was needed for any of these loans, as determined by using the fair value of collateral method defined in ASC 310-10 and -35.
| No. 1 | – | The borrower is an owner of real estate and is based in New Jersey. The loan is collateralized by a multi-family complex with 314 residential units and four retail stores in Atlantic City, New Jersey. | ||
| No. 2 | – | The borrower is an owner of real estate and is based in Maryland. The loan is collateralized by 1,031 acres of vacant land in La Plata, Maryland. | ||
| No. 3 | – | The borrower is an owner of real estate and is based in New York. The loans were collateralized by an 87,500-square foot commercial building in Bethpage, New York. | ||
| No. 4 | – | The borrower is an owner of real estate and is based in New York. The loan is collateralized by a 19,508-square foot commercial building in Woodhaven, New York. | ||
| No. 5 | – | The borrower is an owner/operator of gas stations. The loan is collateralized by the principal’s personal residence in Brightwaters, New York. | ||
Troubled Debt Restructurings
In an effort to proactively manage delinquent loans, we have selectively extended such concessions as rate reductions and extensions of maturity dates, as well as forbearance agreements, to certain borrowers who have experienced financial difficulty. In accordance with GAAP, we are required to account for such loan modifications or restructurings as TDRs.
The eligibility of a borrower for work-out concessions of any nature depends upon the facts and circumstances of each transaction, which may change from period to period, and involve management’s judgment regarding the likelihood that the concession will result in the maximum recovery for the Company.
60
Table of Contents
Loans modified as TDRs are placed on non-accrual status until we determine that future collection of principal and interest is reasonably assured. This generally requires that the borrower demonstrate performance according to the restructured terms for at least six consecutive months.
At December 31, 2016, loans modified as TDRs totaled $19.9 million, including accruing loans of $3.5 million and non-accrual loans of $16.5 million. At the prior year-end, loans modified as TDRs totaled $12.2 million, including accruing loans of $2.8 million and non-accrual loans of $9.4 million.
Analysis of Troubled Debt Restructurings
The following table sets forth the changes in our TDRs over the twelve months ended December 31, 2016:
| (in thousands) | Accruing | Non-Accrual | Total | |||||||||
| Balance at December 31, 2015 |
$ | 2,759 | $ | 9,396 | $ | 12,155 | ||||||
| New TDRs |
1,496 | 15,423 | 16,919 | |||||||||
| Transferred to other real estate owned |
— | (2,708 | ) | (2,708 | ) | |||||||
| Recoveries |
— | (746 | ) | (746 | ) | |||||||
| Loan payoffs, including dispositions and principal pay-downs |
(789 | ) | (4,911 | ) | (5,700 | ) | ||||||
|
|
|
|
|
|
|
|||||||
| Balance at December 31, 2016 |
$ | 3,466 | $ | 16,454 | $ | 19,920 | ||||||
|
|
|
|
|
|
|
|||||||
Loans on which concessions were made with respect to rate reductions and/or extensions of maturity dates totaled $17.1 million and $9.3 million, respectively, at December 31, 2016 and 2015; loans in connection with which forbearance agreements were reached amounted to $2.8 million and $2.9 million at the respective dates.
Multi-family loans and CRE loans accounted for $10.7 million and $1.9 million of TDRs at the end of this December, as compared to $2.7 million and $6.4 million, respectively, at the prior year-end. Based on the number of loans performing in accordance with their revised terms, our success rate for restructured multi-family and CRE loans was, in each case, 100% at the end of this December; our success rates for restructured one-to-four family and other loans were 73% and 67%, respectively, at that date.
On a limited basis, we may provide additional credit to a borrower after the loan has been placed on non-accrual status or modified as a TDR if, in management’s judgment, the value of the property after the additional loan funding is greater than the initial value of the property plus the additional loan funding amount. In 2016, no such additional credit was provided. Furthermore, the terms of our restructured loans typically would not restrict us from cancelling outstanding commitments for other credit facilities to a borrower in the event of non-payment of a restructured loan.
For additional information about our TDRs at December 31, 2016 and 2015, see the discussion of “Asset Quality” in Note 5, “Loans” in Item 8, “Financial Statements and Supplementary Data.”
Except for the non-accrual loans and TDRs disclosed in this filing, we did not have any potential problem loans at December 31, 2016 that would have caused management to have serious doubts as to the ability of a borrower to comply with present loan repayment terms and that would have resulted in such disclosure if that were the case.
61
Table of Contents
Asset Quality Analysis (Excluding Covered Loans, Covered OREO, Non-Covered Purchased Credit-Impaired Loans, and Non-Covered Loans Held for Sale)
The following table presents information regarding our consolidated allowance for losses on non-covered loans, our non-performing non-covered assets, and our non-covered loans 30 to 89 days past due at each year-end in the five years ended December 31, 2016. Covered loans and non-covered purchased credit-impaired (“PCI”) loans are considered to be performing due to the application of the yield accretion method, as discussed elsewhere in this report. Therefore, covered loans and non-covered PCI loans are not reflected in the amounts or ratios provided in this table.
| At or for the Years Ended December 31, | ||||||||||||||||||||
| (dollars in thousands) | 2016 | 2015 | 2014 | 2013 | 2012 | |||||||||||||||
| Allowance for Losses on Non-Covered Loans: |
||||||||||||||||||||
| Balance at beginning of year |
$ | 145,196 | $ | 139,857 | $ | 141,946 | $ | 140,948 | $ | 137,290 | ||||||||||
| Provision for (recovery of) losses on non-covered loans |
12,036 | (2,846 | ) | — | 18,000 | 45,000 | ||||||||||||||
| Charge-offs: |
||||||||||||||||||||
| Multi-family |
— | (167 | ) | (755 | ) | (12,922 | ) | (27,939 | ) | |||||||||||
| Commercial real estate |
— | (273 | ) | (1,615 | ) | (3,489 | ) | (5,046 | ) | |||||||||||
| One-to-four family |
(170 | ) | (875 | ) | (410 | ) | (351 | ) | (574 | ) | ||||||||||
| Acquisition, development, and construction |
— | — | — | (1,503 | ) | (5,974 | ) | |||||||||||||
| Other loans |
(3,413 | ) | (1,273 | ) | (5,296 | ) | (7,092 | ) | (6,685 | ) | ||||||||||
|
|
|
|
|
|
|
|
|
|
|
|||||||||||
| Total charge-offs |
(3,583 | ) | (2,588 | ) | (8,076 | ) | (25,357 | ) | (46,218 | ) | ||||||||||
| Recoveries |
2,875 | 10,773 | 5,987 | 8,355 | 4,876 | |||||||||||||||
|
|
|
|
|
|
|
|
|
|
|
|||||||||||
| Net (charge-offs) recoveries |
(708 | ) | 8,185 | (2,089 | ) | (17,002 | ) | (41,342 | ) | |||||||||||
|
|
|
|
|
|
|
|
|
|
|
|||||||||||
| Balance at end of year |
$ | 156,524 | $ | 145,196 | $ | 139,857 | $ | 141,946 | $ | 140,948 | ||||||||||
|
|
|
|
|
|
|
|
|
|
|
|||||||||||
| Non-Performing Non-Covered Assets: |
||||||||||||||||||||
| Non-accrual non-covered mortgage loans: |
||||||||||||||||||||
| Multi-family |
$ | 13,558 | $ | 13,904 | $ | 31,089 | $ | 58,395 | $ | 163,460 | ||||||||||
| Commercial real estate |
9,297 | 14,920 | 24,824 | 24,550 | 56,863 | |||||||||||||||
| One-to-four family |
9,679 | 12,259 | 11,032 | 10,937 | 10,945 | |||||||||||||||
| Acquisition, development, and construction |
6,200 | 27 | 654 | 2,571 | 12,091 | |||||||||||||||
|
|
|
|
|
|
|
|
|
|
|
|||||||||||
| Total non-accrual non-covered mortgage loans |
38,734 | 41,110 | 67,599 | 96,453 | 243,359 | |||||||||||||||
| Non-accrual non-covered other loans |
17,735 | 5,715 | 9,351 | 7,084 | 17,971 | |||||||||||||||
| Loans 90 days or more past due and still accruing interest |
— | — | — | — | — | |||||||||||||||
|
|
|
|
|
|
|
|
|
|
|
|||||||||||
| Total non-performing non-covered loans (1) |
$ | 56,469 | $ | 46,825 | $ | 76,950 | $ | 103,537 | $ | 261,330 | ||||||||||
| Non-covered other real estate owned (2) |
11,607 | 14,065 | 61,956 | 71,392 | 29,300 | |||||||||||||||
|
|
|
|
|
|
|
|
|
|
|
|||||||||||
| Total non-performing non-covered assets |
$ | 68,076 | $ | 60,890 | $ | 138,906 | $ | 174,929 | $ | 290,630 | ||||||||||
|
|
|
|
|
|
|
|
|
|
|
|||||||||||
| Asset Quality Measures: |
||||||||||||||||||||
| Non-performing non-covered loans to total non-covered loans |
0.15 | % | 0.13 | % | 0.23 | % | 0.35 | % | 0.96 | % | ||||||||||
| Non-performing non-covered assets to total non-covered assets |
0.14 | 0.13 | 0.30 | 0.40 | 0.71 | |||||||||||||||
| Allowance for losses on non-covered loans to non-performing non-covered loans |
277.19 | 310.08 | 181.75 | 137.10 | 53.93 | |||||||||||||||
| Allowance for losses on non-covered loans to total non-covered loans |
0.42 | 0.41 | 0.42 | 0.48 | 0.52 | |||||||||||||||
| Net charge-offs (recoveries) during the period to average loans outstanding during the period (3) |
0.00 | (0.02 | ) | 0.01 | 0.05 | 0.13 | ||||||||||||||
|
|
|
|
|
|
|
|
|
|
|
|||||||||||
| Non-Covered Loans 30-89 Days Past Due: |
||||||||||||||||||||
| Multi-family |
$ | 28 | $ | 4,818 | $ | 464 | $ | 33,678 | $ | 19,945 | ||||||||||
| Commercial real estate |
— | 178 | 1,464 | 1,854 | 1,679 | |||||||||||||||
| One-to-four family |
2,844 | 1,117 | 3,086 | 1,076 | 2,645 | |||||||||||||||
| Acquisition, development, and construction |
— | — | — | — | 1,178 | |||||||||||||||
| Other loans |
7,511 | 492 | 1,178 | 481 | 2,138 | |||||||||||||||
|
|
|
|
|
|
|
|
|
|
|
|||||||||||
| Total loans 30-89 days past due (4) |
$ | 10,383 | $ | 6,605 | $ | 6,192 | $ | 37,089 | $ | 27,585 | ||||||||||
|
|
|
|
|
|
|
|
|
|
|
|||||||||||
| (1) | The December 31, 2016, 2015, 2014, 2013, and 2012 amounts exclude loans 90 days or more past due of $131.5 million, $137.2 million, $157.9 million, $211.5 million, and $312.6 million, respectively, that are covered by FDIC loss sharing agreements. The December 31, 2016 and 2015 amounts also exclude $869,000 and $969,000, respectively, of non-covered PCI loans. |
| (2) | The December 31, 2016, 2015, 2014, 2013, and 2012 amounts exclude OREO of $17.0 million, $25.8 million, $32.0 million, $37.5 million, and $45.1 million, respectively, that is covered by FDIC loss sharing agreements. |
| (3) | Average loans include covered loans. |
| (4) | The December 31, 2016, 2015, 2014, 2013, and 2012 amounts exclude loans 30 to 89 days past due of $22.6 million, $32.8 million, $41.7 million, $57.9 million, and $81.2 million, respectively, that are covered by FDIC loss sharing agreements. The December 31, 2016 amount also excludes $6,000 of non-covered PCI loans. There were no non-covered PCI loans 30 to 89 days past due at any of the prior year-ends. |
62
Table of Contents
The following table sets forth the allocation of the consolidated allowance for losses on non-covered loans, excluding the allowance for losses on non-covered PCI loans, at each year-end for the five years ended December 31, 2016:
| 2016 | 2015 | 2014 | 2013 | 2012 | ||||||||||||||||||||||||||||||||||||
| (dollars in thousands) | Amount | Percent
of Loans in Each Category to Total Non-Covered Loans Held for Investment |
Amount | Percent of Loans in Each Category to Total Non-Covered Loans Held for Investment |
Amount | Percent of Loans in Each Category to Total Non-Covered Loans Held for Investment |
Amount | Percent of Loans in Each Category to Total Non-Covered Loans Held for Investment |
Amount | Percent of Loans in Each Category to Total Non-Covered Loans Held for Investment |
||||||||||||||||||||||||||||||
| Multi-family loans |
$ | 91,590 | 72.13 | % | $ | 93,977 | 72.67 | % | $ | 96,212 | 72.21 | % | $ | 79,745 | 69.41 | % | $ | 79,618 | 68.18 | % | ||||||||||||||||||||
| Commercial real estate loans |
20,943 | 20.68 | 19,721 | 21.98 | 19,546 | 23.13 | 34,702 | 24.70 | 38,426 | 27.27 | ||||||||||||||||||||||||||||||
| One-to-four family loans |
1,484 | 1.02 | 612 | 0.33 | 562 | 0.42 | 1,755 | 1.88 | 1,519 | 0.75 | ||||||||||||||||||||||||||||||
| Acquisition, development, and construction loans |
9,908 | 1.02 | 8,402 | 0.87 | 6,296 | 0.78 | 7,789 | 1.15 | 8,418 | 1.46 | ||||||||||||||||||||||||||||||
| Other loans |
32,599 | 5.15 | 22,484 | 4.15 | 17,241 | 3.46 | 17,955 | 2.86 | 12,967 | 2.34 | ||||||||||||||||||||||||||||||
|
|
|
|
|
|
|
|
|
|
|
|
|
|
|
|
|
|
|
|
|
|||||||||||||||||||||
| Total loans |
$ | 156,524 | 100.00 | % | $ | 145,196 | 100.00 | % | $ | 139,857 | 100.00 | % | $ | 141,946 | 100.00 | % | $ | 140,948 | 100.00 | % | ||||||||||||||||||||
|
|
|
|
|
|
|
|
|
|
|
|
|
|
|
|
|
|
|
|
|
|||||||||||||||||||||
63
Table of Contents
Each of the preceding allocations was based upon an estimate of various factors, as discussed in “Critical Accounting Policies” earlier in this report, and a different allocation methodology may be deemed to be more appropriate in the future. In addition, it should be noted that the portion of the allowance for losses on non-covered loans allocated to each non-covered loan category does not represent the total amount available to absorb losses that may occur within that category, since the total loan loss allowance is available for the entire non-covered loan portfolio.
Covered Loans and Covered Other Real Estate Owned
The credit risk associated with the assets acquired in our AmTrust and Desert Hills transactions has been substantially mitigated by our loss sharing agreements with the FDIC. Under the terms of the loss sharing agreements, the FDIC agreed to reimburse us for 80% of losses (and share in 80% of any recoveries) up to a specified threshold with respect to the loans and OREO acquired in the transactions, and to reimburse us for 95% of any losses (and share in 95% of any recoveries) with respect to the acquired assets beyond that threshold. The loss sharing (and reimbursement) agreements applicable to one-to-four family mortgage loans and home equity lines of credit are effective for a ten-year period from the date of acquisition. Under the loss sharing agreements applicable to all other covered loans and the OREO acquired in the Desert Hills transaction, the FDIC reimbursed us for losses for a five-year period from the date of acquisition; the period for sharing in recoveries on all other covered loans and the Desert Hills OREO extends for a period of eight years from the acquisition date.
We consider our covered loans to be performing due to the application of the yield accretion method under ASC 310-30, which allows us to aggregate credit-impaired loans acquired in the same fiscal quarter into one or more pools, provided that the loans have common risk characteristics. A pool is then accounted for as a single asset with a single composite interest rate and an aggregate expectation of cash flows. Accordingly, loans that may have been classified as non-performing loans by AmTrust or Desert Hills were no longer classified as non-performing at the respective dates of acquisition because we believed at that time that we would fully collect the new carrying value of those loans. The new carrying value represents the contractual balance, reduced by the portion expected to be uncollectible (referred to as the “non-accretable difference”) and by an accretable yield (discount) that is recognized as interest income. It is important to note that management’s judgment is required in reclassifying loans subject to ASC 310-30 as performing loans, and is dependent on having a reasonable expectation about the timing and amount of the cash flows to be collected, even if a loan is contractually past due.
In connection with the AmTrust and Desert Hills loss sharing agreements, we established FDIC loss share receivables of $740.0 million and $69.6 million, respectively, which were the acquisition-date fair values of the respective loss sharing agreements (i.e., the expected reimbursements from the FDIC over the terms of the agreements). The loss share receivables increase if the losses increase, and decrease if the losses fall short of the expected amounts. Increases in estimated reimbursements are recognized in income in the same period that they are identified and that the allowance for losses on the related covered loans is recognized.
In 2016 and 2015, respectively, we recorded FDIC indemnification expense of $6.2 million and $9.3 million in “Non-interest income” in connection with the recovery of $7.7 million and $11.7 million from the allowance for losses on covered loans, respectively. The recoveries were recorded to reflect our expectation that the cash flows generated by certain pools of covered loans would increase due to an improvement in credit quality.
Decreases in estimated reimbursements from the FDIC, if any, are recognized in income prospectively over the lives of the related covered loans (or, if shorter, over the remaining term of the loss sharing agreement). Related additions to the accretable yield on the covered loans are recognized in income prospectively over the lives of the loans. Gains and recoveries on covered assets will either offset losses, or be paid to the FDIC at the applicable loss share percentage at the time of recovery.
The loss share receivables also may increase due to accretion, or decrease due to amortization. In 2016 and 2015, we recorded net amortization of $51.0 million and $49.1 million, respectively. Accretion of the FDIC loss share receivable relates to the difference between the discounted, versus the undiscounted, expected cash flows of covered loans subject to the FDIC loss sharing agreements. Amortization occurs when the expected cash flows from the covered loan portfolio improve, thus reducing the amounts receivable from the FDIC. These cash flows are discounted to reflect the uncertainty of the timing and receipt of the FDIC loss sharing reimbursements. In the twelve months ended December 31, 2016, we received FDIC reimbursements of $14.0 million, as compared to $24.5 million in the prior year.
64
Table of Contents
Asset Quality Analysis (Including Covered Loans, Covered OREO, and Non-Covered PCI Loans)
The following table presents information regarding our non-performing assets and loans past due at December 31, 2016 and December 31, 2015, including covered loans and covered OREO (collectively, “covered assets”), and non-covered PCI loans:
| At or For the Year Ended December 31, | ||||||||
| (dollars in thousands) | 2016 | 2015 | ||||||
| Covered Assets and Non-Covered PCI Loans 90 Days or More Past Due: |
||||||||
| Covered loans and non-covered PCI loans 90 days or more past due: |
||||||||
| Multi-family |
$ | — | $ | — | ||||
| Commercial real estate |
612 | 729 | ||||||
| One-to-four family |
125,076 | 130,626 | ||||||
| Acquisition, development, and construction |
— | 237 | ||||||
| Other |
6,646 | 6,559 | ||||||
|
|
|
|
|
|||||
| Total covered loans and non-covered PCI loans 90 days or more past due |
$ | 132,334 | $ | 138,151 | ||||
| Covered other real estate owned |
16,990 | 25,817 | ||||||
|
|
|
|
|
|||||
| Total covered assets and non-covered PCI loans |
$ | 149,324 | $ | 163,968 | ||||
|
|
|
|
|
|||||
| Total Non-Performing Assets: |
||||||||
| Non-performing loans: |
||||||||
| Multi-family |
$ | 13,558 | $ | 13,904 | ||||
| Commercial real estate |
9,909 | 15,649 | ||||||
| One-to-four family |
134,755 | 142,885 | ||||||
| Acquisition, development, and construction |
6,200 | 264 | ||||||
| Other non-performing loans |
24,381 | 12,274 | ||||||
|
|
|
|
|
|||||
| Total non-performing loans |
$ | 188,803 | $ | 184,976 | ||||
| Other real estate owned |
28,598 | 39,882 | ||||||
|
|
|
|
|
|||||
| Total non-performing assets |
$ | 217,401 | $ | 224,858 | ||||
|
|
|
|
|
|||||
| Asset Quality Ratios (including the allowance for losses on covered loans and non-covered PCI loans): |
||||||||
| Total non-performing loans to total loans |
0.48 | % | 0.49 | % | ||||
| Total non-performing assets to total assets |
0.44 | 0.45 | ||||||
| Allowances for loan losses to total non-performing loans |
96.39 | 96.51 | ||||||
| Allowances for loan losses to total loans |
0.47 | 0.47 | ||||||
| Covered Loans and Non-Covered PCI Loans 30-89 Days Past Due: |
||||||||
| Multi-family |
$ | — | $ | — | ||||
| Commercial real estate |
— | — | ||||||
| One-to-four family |
21,112 | 30,455 | ||||||
| Acquisition, development, and construction |
— | — | ||||||
| Other loans |
1,542 | 2,369 | ||||||
|
|
|
|
|
|||||
| Total covered loans and non-covered PCI loans 30-89 days past due |
$ | 22,654 | $ | 32,824 | ||||
|
|
|
|
|
|||||
| Total Loans 30-89 Days Past Due: |
||||||||
| Multi-family |
$ | 28 | $ | 4,818 | ||||
| Commercial real estate |
— | 178 | ||||||
| One-to-four family |
23,956 | 31,572 | ||||||
| Acquisition, development, and construction |
— | — | ||||||
| Other loans |
9,053 | 2,861 | ||||||
|
|
|
|
|
|||||
| Total loans 30-89 days past due |
$ | 33,037 | $ | 39,429 | ||||
|
|
|
|
|
|||||
65
Table of Contents
The following table presents a geographical analysis of our non-performing loans at December 31, 2016:
| Non-Performing Loans | ||||||||||||
| (in thousands) | Non-Covered Loans (1) |
Covered Loans & Non-Covered PCI Loans |
Total | |||||||||
| New York |
$ | 30,939 | $ | 13,829 | $ | 44,768 | ||||||
| New Jersey |
18,800 | 10,939 | 29,739 | |||||||||
| Florida |
— | 19,927 | 19,927 | |||||||||
| Maryland |
6,200 | 9,248 | 15,448 | |||||||||
| California |
219 | 13,570 | 13,789 | |||||||||
| Ohio |
— | 10,069 | 10,069 | |||||||||
| Massachusetts |
— | 7,068 | 7,068 | |||||||||
| Connecticut |
— | 2,440 | 2,440 | |||||||||
| All other states |
311 | 45,244 | 45,555 | |||||||||
|
|
|
|
|
|
|
|||||||
| Total non-performing loans |
$ | 56,469 | $ | 132,334 | $ | 188,803 | ||||||
|
|
|
|
|
|
|
|||||||
| (1) | Excludes $869,000 of non-covered PCI loans. |
Securities
Securities represented $3.8 billion, or 7.8%, of total assets at the end of this December, as compared to $6.2 billion, or 12.3%, of total assets at December 31, 2015. Most of the $2.4 billion decline occurred in the first quarter, as a reduction in market interest rates triggered an increase in calls of securities, most of which were Delegated Underwriting and Servicing (“DUS”) securities, which are Fannie Mae securities backed by multi-family and CRE loans.
The investment policies of the Company and the Banks are established by the respective Boards of Directors and implemented by their respective Investment Committees, in concert with the respective Asset and Liability Management Committees. The Investment Committees generally meet quarterly or on an as-needed basis to review the portfolios and specific capital market transactions. In addition, the securities portfolios are reviewed monthly by the Boards of Directors as a whole. Furthermore, the policies guiding the Company’s and the Banks’ investments are reviewed at least annually by the respective Investment Committees, as well as by the respective Boards. While the policies permit investment in various types of liquid assets, neither the Company nor the Banks currently maintains a trading portfolio.
Our general investment strategy is to purchase liquid investments with various maturities to ensure that our overall interest rate risk position stays within the required limits of our investment policies. We generally limit our investments to GSE obligations (defined as GSE certificates; GSE collateralized mortgage obligations, or “CMOs”; and GSE debentures) and U.S. Treasury obligations. At December 31, 2016 and 2015, GSE obligations and U.S. Treasury obligations together represented 93.0% and 94.1% of total securities, respectively. The remainder of the portfolio at those dates was comprised of corporate bonds, trust preferred securities, and municipal obligations. None of our securities investments are backed by subprime or Alt-A loans.
Depending on management’s intent at the time of purchase, securities are classified as either “held to maturity” or “available for sale.” Held-to-maturity securities are securities that management has the positive intent to hold to maturity. In addition to generating cash flows from repayments, securities held to maturity are a source of earnings and serve as collateral for our wholesale borrowings.
Available-for-sale securities are securities that management intends to hold for an indefinite period of time. In addition to generating cash flows from sales and from repayments of principal and interest, such securities serve as a source of liquidity for future loan production, the reduction of higher-cost funding, and general operating activities. A decision to purchase or sell available-for-sale securities is based on economic conditions, including changes in interest rates, liquidity, and our asset and liability management strategy.
Held-to-maturity securities represented $3.7 billion, or 97.3%, of total securities at the end of this December, a $2.3 billion decrease from the year-earlier balance, which represented 96.7% of total securities. At December 31, 2016 and 2015, the fair value of securities held to maturity represented 102.7% and 102.3%, respectively, of their carrying value.
66
Table of Contents
Mortgage-related securities and other securities accounted for $3.2 billion and $500.2 million, respectively, of held-to-maturity securities at December 31, 2016, as compared to $3.6 billion and $2.4 billion, respectively, at the prior year-end. Included in other securities at the respective dates were GSE and U.S. Treasury obligations of $288.8 million and $2.2 billion; capital trust notes of $65.7 million and $65.6 million; municipal bonds of $71.6 million and $75.3 million; and corporate bonds of $74.2 million and $73.8 million. The estimated weighted average life of the held-to-maturity securities portfolio was 5.4 years and 6.5 years at the corresponding dates.
At December 31, 2016, available-for-sale securities represented $104.3 million, or 2.7%, of total securities and had an estimated weighted average life of 13.1 years. Included in the year-end amount were mortgage-related securities of $7.3 million and other securities of $97.0 million.
At the prior year-end, available-for-sale securities represented $204.3 million, or 3.3%, of total securities, and had an estimated weighted average life of 2.8 years. Mortgage-related securities accounted for $53.9 million of the year-end balance, with other securities accounting for the remaining $150.4 million.
Federal Home Loan Bank Stock
As members of the FHLB-NY, the Community Bank and the Commercial Bank are required to acquire and hold shares of its capital stock. At December 31, 2016, the Community Bank held FHLB-NY stock in the amount of $574.5 million; the Commercial Bank held FHLB-NY stock of $16.4 million at that date.
At December 31, 2015, the Community Bank and the Commercial Bank held FHLB-NY stock in the amount of $625.9 million and $38.1 million, respectively.
Dividends from the FHLB-NY to the Community Bank totaled $26.2 million and $19.8 million, respectively, in 2016 and 2015; dividends from the FHLB-NY to the Commercial Bank totaled $1.4 million and $1.6 million in the corresponding years.
Bank-Owned Life Insurance
Bank-owned life insurance (“BOLI”) is recorded at the total cash surrender value of the policies in the Consolidated Statements of Condition, and the income generated by the increase in the cash surrender value of the policies is recorded in “Non-interest income” in the Consolidated Statements of Operations and Comprehensive Income (Loss).
Reflecting an increase in the cash surrender value of the underlying policies, our investment in BOLI rose $17.4 million year-over-year to $949.0 million at December 31, 2016.
FDIC Loss Share Receivable
In connection with our FDIC loss sharing agreements, we recorded FDIC loss share receivables of $243.7 million and $314.9 million, respectively, at December 31, 2016 and 2015. The respective amounts represent the present values of the reimbursements we expected to receive under our FDIC loss sharing agreements at those dates.
Goodwill and Core Deposit Intangibles
We record goodwill and core deposit intangibles (“CDI”) in our consolidated statements of condition in connection with certain of our business combinations.
Goodwill, which is tested at least annually for impairment, refers to the difference between the purchase price and the fair value of an acquired company’s assets, net of the liabilities assumed. CDI refers to the fair value of the core deposits acquired in a business combination, and is typically amortized over a period of ten years from the acquisition date.
While goodwill totaled $2.4 billion at both December 31, 2016 and 2015, the balance of CDI declined from $2.6 million to $208,000 as a result of amortization over the twelve-month period.
For more information about the Company’s goodwill, see the discussion of “Critical Accounting Policies” earlier in this report.
67
Table of Contents
Other Assets
“Other assets” include accrued interest receivable and income tax receivable, among other items. In the twelve months ended December 31, 2016, other assets declined $247.9 million to $387.4 million, primarily reflecting a $227.4 million decrease in income tax receivable.
Sources of Funds
The Parent Company (i.e., the Company on an unconsolidated basis) has four primary funding sources for the payment of dividends, share repurchases, and other corporate uses: dividends paid to the Parent Company by the Banks; capital raised through the issuance of securities; funding raised through the issuance of debt instruments; and repayments of, and income from, investment securities.
On a consolidated basis, our funding primarily stems from a combination of the following sources: retail, institutional, and brokered deposits; borrowed funds, primarily in the form of wholesale borrowings; cash flows generated through the repayment and sale of loans; and cash flows generated through the repayment and sale of securities.
In 2016, loan repayments and sales generated cash flows of $12.5 billion, as compared to $15.0 billion in 2015. Cash flows from repayments accounted for $8.0 billion and $10.5 billion of the respective totals and cash flows from sales accounted for $4.5 billion of the respective totals in both years.
In 2016, cash flows from the repayment and sale of securities respectively totaled $2.5 billion and $323.3 million, while the purchase of securities amounted to $492.6 million for the year. By comparison, cash flows from the repayment and sale of securities totaled $950.5 million and $322.8 million, respectively, in 2015, and were offset by the purchase of securities totaling $338.0 million.
In 2016, the cash flows from loans and securities were primarily deployed into the production of multi-family loans held for investment, as well as held-for-investment CRE loans and specialty finance loans and leases.
Deposits
Deposits totaled $28.9 billion and $28.4 billion, and represented 59.0% and 56.5% of total assets, at December 31, 2016 and 2015, respectively. While the balance of savings accounts declined $2.3 billion year-over-year to $5.3 billion, the impact was exceeded by a $2.7 million increase in all other deposits combined. Specifically, certificates of deposit (“CDs”) rose $2.3 billion to $7.6 billion, while NOW and money market accounts rose $326.1 million to $13.4 billion. Non-interest-bearing deposits accounted for $131.6 million of the increase, having grown to $2.6 billion year-over-year.
While the vast majority of our deposits are retail in nature (i.e., they are deposits we have gathered through our branches or through business combinations), institutional deposits and municipal deposits are also part of our deposit mix. Retail deposits rose $520.0 million year-over-year to $21.5 billion, while institutional deposits rose $56.7 million to $2.8 billion at year-end. Municipal deposits represented $637.7 million of total deposits at the end of this December, a $95.7 million decrease from the balance at December 31, 2015.
Depending on their availability and pricing relative to other funding sources, we also include brokered deposits in our deposit mix. Brokered deposits accounted for $3.9 billion of our deposits at the end of this December, as compared to $4.0 billion at December 31, 2015. Brokered money market accounts represented $2.5 billion of total brokered deposits at both December 31, 2016 and 2015; brokered interest-bearing checking accounts represented $1.4 billion and $1.5 billion, respectively, at the corresponding dates.
Borrowed Funds
Borrowed funds consist primarily of wholesale borrowings (i.e., FHLB-NY advances, repurchase agreements, and federal funds purchased) and, to a far lesser extent, junior subordinated debentures. Largely reflecting a $2.1 billion decline in wholesale borrowings to $13.3 billion, the total balance of borrowed funds also dropped $2.1 billion year-over-year, to $13.7 billion.
Wholesale Borrowings
Wholesale borrowings totaled $13.3 billion and $15.4 billion, respectively, at December 31, 2016 and 2015, representing 27.2% and 30.6% of total assets at the respective dates. FHLB-NY advances accounted for $11.7 billion of the year-end 2016 balance, as compared to $13.5 billion at the prior year-end. Pursuant to blanket
68
Table of Contents
collateral agreements with the Banks, our FHLB-NY advances and overnight advances are secured by pledges of certain eligible collateral in the form of loans and securities. (For more information regarding our FHLB-NY advances, see the discussion that appears earlier in this report regarding our membership, and our ownership of stock, in the FHLB-NY.) None of our wholesale borrowings had callable features at December 31, 2016 or 2015.
Also included in wholesale borrowings at both December 31, 2016 and 2015 were repurchase agreements of $1.5 billion. Repurchase agreements are contracts for the sale of securities owned or borrowed by the Banks with an agreement to repurchase those securities at agreed-upon prices and dates.
Our repurchase agreements are primarily collateralized by GSE obligations, and may be entered into with the FHLB-NY or certain brokerage firms. The brokerage firms we utilize are subject to an ongoing internal financial review to ensure that we borrow funds only from those dealers whose financial strength will minimize the risk of loss due to default. In addition, a master repurchase agreement must be executed and on file for each of the brokerage firms we use.
Federal funds purchased represented $150.0 million of wholesale borrowings at the end of this December, a $276.0 million decrease from the year-earlier amount.
Junior Subordinated Debentures
Junior subordinated debentures totaled $358.9 million at December 31, 2016, modestly higher than the balance at the prior year-end.
See Note 8, “Borrowed Funds,” in Item 8, “Financial Statements and Supplementary Data” for a further discussion of our wholesale borrowings and our junior subordinated debentures.
Liquidity, Contractual Obligations and Off-Balance Sheet Commitments, and Capital Position
Liquidity
We manage our liquidity to ensure that our cash flows are sufficient to support our operations, and to compensate for any temporary mismatches between sources and uses of funds caused by variable loan and deposit demand.
We monitor our liquidity daily to ensure that sufficient funds are available to meet our financial obligations. Our most liquid assets are cash and cash equivalents, which totaled $557.9 million and $537.7 million, respectively, at December 31, 2016 and 2015. As in the past, our loan and securities portfolios provided meaningful liquidity in 2016, with cash flows from the repayment and sale of loans totaling $12.5 billion and cash flows from the repayment and sale of securities totaling $2.5 billion.
Additional liquidity stems from deposits and from our use of wholesale funding sources, including brokered deposits and wholesale borrowings. In addition, we have access to the Banks’ approved lines of credit with various counterparties, including the FHLB-NY. The availability of these wholesale funding sources is generally based on the amount of mortgage loan collateral available under a blanket lien we have pledged to the respective institutions and, to a lesser extent, the amount of available securities that may be pledged to collateralize our borrowings. At December 31, 2016, our available borrowing capacity with the FHLB-NY was $7.5 billion. In addition, the Community Bank and the Commercial Bank had available-for-sale securities of $102.3 million and unpledged held-to-maturity securities of $1.8 billion, combined, at that date.
Furthermore, the Banks both have agreements with the Federal Reserve Bank of New York (the “FRB-NY”) that enable them to access the discount window as a further means of enhancing their liquidity, if need be. In connection with these agreements, the Banks have pledged certain loans and securities to collateralize any funds they may borrow. At December 31, 2016, the maximum amount the Community Bank could borrow from the FRB-NY was $1.2 billion; the maximum amount the Commercial Bank could borrow at that date was $127.2 million. There were no borrowings against either line of credit at December 31, 2016.
Our primary investing activity is loan production, and the volume of loans we originated for sale and for investment totaled $13.8 billion in 2016. During this time, the net cash provided by investing activities totaled $1.2 billion; the net cash provided by our operating activities totaled $755.7 million. Our financing activities used net cash of $2.0 billion.
69
Table of Contents
CDs due to mature or reprice in one year or less from December 31, 2016 totaled $7.2 billion, representing 94.8% of total CDs at that date. Our ability to attract and retain retail deposits, including CDs, depends on numerous factors, including, among others, the convenience of our branches and our other banking channels; our customers’ satisfaction with the service they receive; the rates of interest we offer; the types of products we feature; and the attractiveness of their terms.
Our decision to compete for deposits also depends on numerous factors, including, among others, our access to deposits through acquisitions, the availability of lower-cost funding sources, the impact of competition on pricing, and the need to fund our loan demand.
The Parent Company is a separate legal entity from each of the Banks and must provide for its own liquidity. In addition to operating expenses and any share repurchases, the Parent Company is responsible for paying any dividends declared to our shareholders. As a Delaware corporation, the Parent Company is able to pay dividends either from surplus or, in case there is no surplus, from net profits for the fiscal year in which the dividend is declared and/or the preceding fiscal year.
As a result of the $546.8 million after-tax debt repositioning charge incurred in the twelve months ended December 31, 2015 (which resulted in the Company recording a net loss of $47.2 million for the year), and pursuant to the FRB’s Supervisory Letter SR 09-04, the Company was required to receive a non-objection from the FRB to pay cash dividends on its outstanding common stock throughout 2016. The Company received non-objections from the FRB for each of the four quarterly cash dividends it paid during the year. The FRB has advised the Company to continue the exchange of written documentation to obtain their non-objection to the declaration of dividends.
The Parent Company’s ability to pay dividends may also depend, in part, upon dividends it receives from the Banks. The ability of the Community Bank and the Commercial Bank to pay dividends and other capital distributions to the Parent Company is generally limited by New York State Banking Law and regulations, and by certain regulations of the FDIC. In addition, the Superintendent of the New York State Department of Financial Services (the “Superintendent”), the FDIC, and the FRB, for reasons of safety and soundness, may prohibit the payment of dividends that are otherwise permissible by regulations.
Under New York State Banking Law, a New York State-chartered stock-form savings bank or commercial bank may declare and pay dividends out of its net profits, unless there is an impairment of capital. However, the approval of the Superintendent is required if the total of all dividends declared in a calendar year would exceed the total of a bank’s net profits for that year, combined with its retained net profits for the preceding two years. In 2016, the Banks paid dividends totaling $330.0 million to the Parent Company, leaving $220.0 million that they could dividend to the Parent Company without regulatory approval at year-end. Additional sources of liquidity available to the Parent Company at December 31, 2016 included $63.7 million in cash and cash equivalents and $2.0 million of available-for-sale securities. If either of the Banks were to apply to the Superintendent for approval to make a dividend or capital distribution in excess of the dividend amounts permitted under the regulations, there can be no assurance that such application would be approved.
Contractual Obligations and Off-Balance Sheet Commitments
In the normal course of business, we enter into a variety of contractual obligations in order to manage our assets and liabilities, fund loan growth, operate our branch network, and address our capital needs.
For example, we offer CDs with contractual terms to our customers, and borrow funds under contract from the FHLB-NY and various brokerage firms. These contractual obligations are reflected in the Consolidated Statements of Condition under “Deposits” and “Borrowed funds,” respectively. At December 31, 2016, we had CDs of $7.6 billion and long-term debt (defined as borrowed funds with an original maturity in excess of one year) of $13.2 billion.
We also are obligated under certain non-cancelable operating leases on the buildings and land we use in operating our branch network and in performing our back-office responsibilities. These obligations are not included in the Consolidated Statements of Condition and totaled $160.3 million at December 31, 2016.
70
Table of Contents
Contractual Obligations
The following table sets forth the maturity profile of the aforementioned contractual obligations as of December 31, 2016:
| (in thousands) | Certificates of Deposit |
Long-Term Debt (1) | Operating Leases |
Total | ||||||||||||
| One year or less |
$ | 6,876,629 | $ | 2,800,000 | $ | 29,639 | $ | 9,706,268 | ||||||||
| One to three years |
601,939 | 8,554,500 | 49,482 | 9,205,921 | ||||||||||||
| Three to five years |
79,583 | 1,500,000 | 30,360 | 1,609,943 | ||||||||||||
| More than five years |
19,019 | 358,879 | 50,777 | 428,675 | ||||||||||||
|
|
|
|
|
|
|
|
|
|||||||||
| Total |
$ | 7,577,170 | $ | 13,213,379 | $ | 160,258 | $ | 20,950,807 | ||||||||
|
|
|
|
|
|
|
|
|
|||||||||
| (1) | Includes FHLB advances, repurchase agreements, and junior subordinated debentures. |
At December 31, 2016, we also had commitments to extend credit in the form of mortgage and other loan originations, as well as commercial, performance stand-by, and financial stand-by letters of credit, totaling $2.4 billion. These off-balance sheet commitments consist of agreements to extend credit, as long as there is no violation of any condition established in the contract under which the loan is made. Commitments generally have fixed expiration dates or other termination clauses and may require the payment of a fee.
The following table summarizes our off-balance sheet commitments to extend credit in the form of loans and letters of credit at December 31, 2016:
| (in thousands) | ||||
| Mortgage Loan Commitments: |
||||
| Multi-family and commercial real estate |
$ | 316,709 | ||
| One-to-four family |
271,230 | |||
| Acquisition, development, and construction |
317,234 | |||
|
|
|
|||
| Total mortgage loan commitments |
$ | 905,173 | ||
| Other loan commitments (1) |
1,171,002 | |||
|
|
|
|||
| Total loan commitments |
$ | 2,076,175 | ||
| Commercial, performance stand-by, and financial stand-by letters of credit |
324,288 | |||
|
|
|
|||
| Total commitments |
$ | 2,400,463 | ||
|
|
|
|||
| (1) Includes unadvanced lines of credit. |
||||
Of the total loan commitments noted in the preceding table, $1.8 billion were for loans held for investment and the remaining $242.5 million were for one-to-four family mortgage loans held for sale.
Based upon our current liquidity position, we expect that our funding will be sufficient to fulfill these obligations and commitments when they are due.
At December 31, 2016, we had no commitments to purchase securities.
Derivative Financial Instruments
We use various financial instruments, including derivatives, in connection with our strategies to mitigate or reduce our exposure to losses from adverse changes in interest rates. Our derivative financial instruments consist of financial forward and futures contracts, interest rate lock commitments (“IRLCs”), swaps, and options, and relate to our mortgage banking operations, MSRs, and other related risk management activities. These activities will vary in scope based on the level and volatility of interest rates, the types of assets held, and other changing market conditions. At December 31, 2016, we held derivative financial instruments with a notional value of $2.8 billion. (See Note 15, “Derivative Financial Instruments,” in Item 8, “Financial Statements and Supplementary Data” for a further discussion of our use of such financial instruments.)
Capital Position
Stockholders’ equity rose $189.3 million year-over-year to $6.1 billion, representing 12.52% of total assets and a book value per share of $12.57 at December 31, 2016. At the prior year-end, stockholders’ equity totaled $5.9 billion, and represented 11.79% of total assets and a book value per share of $12.24.
71
Table of Contents
Tangible stockholders’ equity rose $191.7 million year-over-year to $3.7 billion, after the distribution of four quarterly cash dividends totaling $330.8 million. The year-end 2016 balance represented 7.93% of tangible assets and a tangible book value per share of $7.57. At the prior year-end, tangible stockholders’ equity totaled $3.5 billion, representing 7.30% of tangible assets and a tangible book value per share of $7.21.
We calculate tangible stockholders’ equity by subtracting the amount of goodwill and CDI recorded at the end of a period from the amount of stockholders’ equity recorded at the same date. While goodwill totaled $2.4 billion at December 31, 2016 and 2015, CDI totaled $208,000 and $2.6 million at the corresponding dates. (See the discussion and reconciliations of stockholders’ equity and tangible stockholders’ equity, total assets and tangible assets, and the related financial measures that appear on the last page of this discussion and analysis of our financial condition and results of operations.)
Stockholders’ equity and tangible stockholders’ equity both include AOCL, which is comprised of the net unrealized gain or loss on available-for-sale securities; the net unrealized loss on the non-credit portion of OTTI securities; and the Company’s pension and post-retirement obligations at the end of a period. In the twelve months ended December 31, 2016 and 2015, AOCL totaled $56.7 million and $57.0 million, respectively. The decline in AOCL was largely the net effect of a $4.0 million decrease in net pension and post-retirement obligations to $50.7 million and the $3.8 million difference between the net unrealized loss on securities available for sale recorded at the end of this December and the net unrealized gain on securities available for sale recorded at December 31, 2015.
As reflected in the following table, our capital measures continued to exceed the minimum federal requirements for a bank holding company at December 31, 2016 and 2015:
| At December 31, 2016 | Actual | Minimum | ||||||||||
| (dollars in thousands) | Amount | Ratio | Required Ratio | |||||||||
| Common equity tier 1 capital |
$ | 3,748,231 | 10.62 | % | 4.50 | % | ||||||
| Tier 1 risk-based capital |
3,748,231 | 10.62 | 6.00 | |||||||||
| Total risk-based capital |
4,277,759 | 12.12 | 8.00 | |||||||||
| Leverage capital |
3,748,231 | 8.00 | 4.00 | |||||||||
| At December 31, 2015 | Actual | Minimum | ||||||||||
| (dollars in thousands) | Amount | Ratio | Required Ratio | |||||||||
| Common equity tier 1 capital |
$ | 3,558,415 | 9.95 | % | 4.50 | % | ||||||
| Tier 1 risk-based capital |
3,644,872 | 10.19 | 6.00 | |||||||||
| Total risk-based capital |
4,086,913 | 11.43 | 8.00 | |||||||||
| Leverage capital |
3,644,872 | 7.77 | 4.00 | |||||||||
At December 31, 2016, the capital ratios for the Company, the Community Bank, and the Commercial Bank continued to exceed the levels required for classification as “well capitalized” institutions, as defined under the Federal Deposit Insurance Corporation Improvement Act of 1991, and as further discussed in Note 18, “Regulatory Matters,” in Item 8, “Financial Statements and Supplementary Data.”
The Company and the Banks assign various loans and other assets to respective risk categories. In September 2016, management reclassified certain multi-family loans that had previously been assigned to the 50% risk-weight category to the 100% risk-weight category, based on a new interpretation of applicable regulatory guidance. The reclassification reduced the Company’s and the Banks’ common equity tier 1 capital, tier 1 risk-weighted capital, and total risk-weighted capital ratios from the levels that were previously reported for the period ending December 31, 2015. For the Company, the common equity tier 1 capital, tier 1 risk-weighted capital, and total risk-weighted capital ratios were reduced by 54 basis points, 56 basis points, and 62 basis points, respectively; for the Community Bank, the capital ratios were reduced by 57 basis points, 57 basis points, and 59 basis points, respectively; and for the Commercial Bank, the capital ratios were reduced by 72 basis points, 72 basis points, and 76 basis points, respectively, from the percentages previously reported. Notwithstanding the respective reductions, the Company and the Banks continued to be classified as “well-capitalized” institutions at December 31, 2015.
72
Table of Contents
RESULTS OF OPERATIONS: 2016 AS COMPARED TO 2015
Earnings Summary
In the twelve months ended December 31, 2016, we generated earnings of $495.4 million, or $1.01 per diluted share, representing a 1.00% return on average assets and an 8.19% return on average stockholders’ equity.
In the twelve months ended December 31, 2015, we recorded a net loss of $47.2 million, or $0.11 per diluted share. The net loss was attributable to a debt repositioning charge incurred in the fourth quarter in connection with the prepayment of $10.4 billion of wholesale borrowings. On a pre-tax basis, the charge was $915.0 million; on an after-tax basis, the charge was $546.8 million, or $1.17 per diluted share. In accordance with ASC 470-50, $773.8 million of the pre-tax charge was recorded as interest expense and $141.2 million was recorded as non-interest expense.
The benefit of the debt repositioning is reflected in our 2016 Consolidated Results of Operations, including the interest expense on, and average cost of, borrowed funds; the interest expense on, and average cost of, interest-bearing liabilities; our net interest income; our net interest rate spread; and our net interest margin.
Our 2016 and 2015 results also reflect certain expenses incurred in connection with the Astoria Financial merger agreement, which was announced on October 29, 2015 and terminated effective January 1, 2017 by mutual agreement of the companies’ Boards. In 2016, merger-related expenses totaled $11.1 million, as compared to $3.7 million in the prior year.
Net Interest Income
Net interest income is our primary source of income. Its level is a function of the average balance of our interest-earning assets, the average balance of our interest-bearing liabilities, and the spread between the yield on such assets and the cost of such liabilities. These factors are influenced by both the pricing and mix of our interest-earning assets and our interest-bearing liabilities which, in turn, are impacted by various external factors, including the local economy, competition for loans and deposits, the monetary policy of the Federal Open Market Committee of the Federal Reserve Board of Governors (the “FOMC”), and market interest rates.
The cost of our deposits and borrowed funds is largely based on short-term rates of interest, the level of which is partially impacted by the actions of the FOMC. The FOMC reduces, maintains, or increases the target federal funds rate (the rate at which banks borrow funds overnight from one another) as it deems necessary. In December 2015, the FOMC raised the target federal funds rate to a range of 0.25% to 0.50%. This was the first time the rate had been raised since the fourth quarter of 2008, when it was reduced to a range of zero to 0.25%. In December 2016, the FOMC again raised the target federal funds rate, to a range of 0.50% to 0.75%.
While the target federal funds rate generally impacts the cost of our short-term borrowings and deposits, the yields on our held-for-investment loans and other interest-earning assets are typically impacted by intermediate-term market interest rates. In 2016, the five-year CMT ranged from a low of 0.94% in July to a high of 2.10% in December, with an average rate of 1.33% for the year. In 2015, the five-year CMT ranged from a low of 1.18% in January to a high of 1.81% in December, with an average rate of 1.53% for the year.
Another factor that impacts the yields on our interest-earning assets—and our net interest income—is the income generated by our multi-family and CRE loans and securities when they prepay. Since prepayment income is recorded as interest income, an increase or decrease in its level will also be reflected in the average yields (as applicable) on our loans, securities, and interest-earning assets, and therefore in our net interest income, our net interest rate spread, and our net interest margin.
It should be noted that the level of prepayment income on loans recorded in any given period depends on the volume of loans that refinance or prepay during that time. Such activity is largely dependent on such external factors as current market conditions, including real estate values, and the perceived or actual direction of market interest rates. In addition, while a decline in market interest rates may trigger an increase in refinancing and, therefore, prepayment income, so too may an increase in market interest rates. It is not unusual for borrowers to lock in lower interest rates when they expect, or see, that market interest rates are rising rather than risk refinancing later at a still higher interest rate.
73
Table of Contents
In 2016, we generated net interest income of $1.3 billion, as compared to $408.1 million in the prior year. The 2015 amount reflects the impact of the $773.8 million debt repositioning charge recorded in the fourth quarter in connection with the prepayment of $10.4 billion of wholesale borrowings with an average cost of 3.16%. The prepaid funds were replaced with a like amount of wholesale borrowings with an average cost of 1.58% (i.e., half the original average cost).
The repositioning of our debt was strategic in nature; it was designed to reduce our interest expense on borrowed funds and the average cost of such funding, and to increase our net interest income, net interest rate spread, and net interest margin. The benefit of the debt repositioning is reflected in our 2016 net interest income and the related measures, with our net interest income rising year-over-year to $1.3 billion, as noted, and our net interest rate spread and margin rising to 2.85% and 2.93%, respectively. Notably, the interest expense on borrowed funds and total interest-bearing liabilities declined to $216.5 million and $387.5 million, respectively, in the current twelve-month period, and the average cost of such funds improved to 1.54% and 0.96%. While not all of these improvements were due to the prior year’s actions, the bulk of them do, in fact, reflect the benefit of the debt repositioning.
The following table sets forth certain information regarding our average balance sheet for the years indicated, including the average yields on our interest-earning assets and the average costs of our interest-bearing liabilities. Average yields are calculated by dividing the interest income produced by the average balance of interest-earning assets. Average costs are calculated by dividing the interest expense produced by the average balance of interest-bearing liabilities. The average balances for the year are derived from average balances that are calculated daily. The average yields and costs include fees, as well as premiums and discounts (including mark-to-market adjustments from acquisitions), that are considered adjustments to such average yields and costs.
The following table also reflects the impact of the debt repositioning charge on our 2015 net interest income, and the related measures. Readers are particularly encouraged to compare the following line items, which were directly impacted by the debt repositioning charge: the interest expense on average borrowed funds; the average cost of borrowed funds; the interest expense on average interest-bearing liabilities; the average cost of interest-bearing liabilities; our net interest income; our net interest rate spread; and our net interest margin.
74
Table of Contents
Net Interest Income Analysis
| For the Years Ended December 31, | ||||||||||||||||||||||||||||||||||||
| 2016 | 2015 | 2014 | ||||||||||||||||||||||||||||||||||
| Average | Average | Average | ||||||||||||||||||||||||||||||||||
| Average | Yield/ | Average | Yield/ | Average | Yield/ | |||||||||||||||||||||||||||||||
| (dollars in thousands) | Balance | Interest | Cost | Balance | Interest | Cost | Balance | Interest | Cost | |||||||||||||||||||||||||||
| ASSETS: |
||||||||||||||||||||||||||||||||||||
| Interest-earning assets: |
||||||||||||||||||||||||||||||||||||
| Mortgage and other loans, net (1) |
$ | 39,076,298 | $ | 1,472,020 | 3.77 | % | $ | 36,343,407 | $ | 1,441,462 | 3.97 | % | $ | 34,510,611 | $ | 1,414,884 | 4.10 | % | ||||||||||||||||||
| Securities and money market investments (2)(3) |
4,934,058 | 202,849 | 4.11 | 7,278,562 | 250,122 | 3.44 | 8,215,129 | 268,183 | 3.26 | |||||||||||||||||||||||||||
|
|
|
|
|
|
|
|
|
|
|
|
|
|
|
|
|
|
|
|||||||||||||||||||
| Total interest-earning assets |
44,010,356 | 1,674,869 | 3.81 | 43,621,969 | 1,691,584 | 3.88 | 42,725,740 | 1,683,067 | 3.94 | |||||||||||||||||||||||||||
| Non-interest-earning assets |
5,289,245 | 5,248,236 | 5,312,332 | |||||||||||||||||||||||||||||||||
|
|
|
|
|
|
|
|||||||||||||||||||||||||||||||
| Total assets |
$ | 49,299,601 | $ | 48,870,205 | $ | 48,038,072 | ||||||||||||||||||||||||||||||
|
|
|
|
|
|
|
|||||||||||||||||||||||||||||||
| LIABILITIES AND STOCKHOLDERS’ EQUITY: |
||||||||||||||||||||||||||||||||||||
| Interest-bearing liabilities: |
||||||||||||||||||||||||||||||||||||
| NOW and money market accounts |
$ | 13,322,346 | $ | 62,166 | 0.47 | % | $ | 12,674,236 | $ | 46,467 | 0.37 | % | $ | 11,638,484 | $ | 39,508 | 0.34 | % | ||||||||||||||||||
| Savings accounts |
5,915,020 | 31,982 | 0.54 | 7,546,417 | 50,776 | 0.67 | 6,595,334 | 35,727 | 0.54 | |||||||||||||||||||||||||||
| Certificates of deposit |
6,899,706 | 76,875 | 1.11 | 5,698,437 | 62,906 | 1.10 | 6,663,188 | 74,511 | 1.12 | |||||||||||||||||||||||||||
|
|
|
|
|
|
|
|
|
|
|
|
|
|
|
|
|
|
|
|||||||||||||||||||
| Total interest-bearing deposits |
26,137,072 | 171,023 | 0.65 | 25,919,090 | 160,149 | 0.62 | 24,897,006 | 149,746 | 0.60 | |||||||||||||||||||||||||||
| Borrowed funds |
14,059,543 | 216,464 | 1.54 | 14,275,818 | 1,123,360 | (4) | 7.87 | (4) | 14,687,889 | 392,968 | 2.68 | |||||||||||||||||||||||||
|
|
|
|
|
|
|
|
|
|
|
|
|
|
|
|
|
|
|
|||||||||||||||||||
| Total interest-bearing liabilities |
40,196,615 | 387,487 | 0.96 | 40,194,908 | 1,283,509 | (5) | 3.19 | (5) | 39,584,895 | 542,714 | 1.37 | |||||||||||||||||||||||||
| Non-interest-bearing deposits |
2,860,532 | 2,660,220 | 2,481,751 | |||||||||||||||||||||||||||||||||
| Other liabilities |
190,403 | 201,441 | 202,631 | |||||||||||||||||||||||||||||||||
|
|
|
|
|
|
|
|||||||||||||||||||||||||||||||
| Total liabilities |
43,247,550 | 43,056,569 | 42,269,277 | |||||||||||||||||||||||||||||||||
| Stockholders’ equity |
6,052,051 | 5,813,636 | 5,768,795 | |||||||||||||||||||||||||||||||||
|
|
|
|
|
|
|
|||||||||||||||||||||||||||||||
| Total liabilities and stockholders’ equity |
$ | 49,299,601 | $ | 48,870,205 | $ | 48,038,072 | ||||||||||||||||||||||||||||||
|
|
|
|
|
|
|
|||||||||||||||||||||||||||||||
| Net interest income/interest rate spread |
$ | 1,287,382 | 2.85 | % | $ | 408,075 | (6) | 0.69 | %(6) | $ | 1,140,353 | 2.57 | % | |||||||||||||||||||||||
|
|
|
|
|
|
|
|
|
|
|
|
|
|||||||||||||||||||||||||
| Net interest margin |
2.93 | % | 0.94 | %(7) | 2.67 | % | ||||||||||||||||||||||||||||||
|
|
|
|
|
|
|
|||||||||||||||||||||||||||||||
| Ratio of interest-earning assets to interest-bearing liabilities |
1.09 | x | 1.09 | x | 1.08 | x | ||||||||||||||||||||||||||||||
|
|
|
|
|
|
|
|||||||||||||||||||||||||||||||
| (1) | Amounts are net of net deferred loan origination costs/(fees) and the allowances for loan losses, and include loans held for sale and non-performing loans. |
| (2) | Amounts are at amortized cost. |
| (3) | Includes FHLB stock. |
| (4) | The debt repositioning charge accounted for $773.8 million of the interest expense on borrowed funds and for 542 basis points of the average cost in 2015. |
| (5) | The debt repositioning charge accounted for $773.8 million of the interest expense on average interest-bearing liabilities and for 192 basis points of the average cost in 2015. |
| (6) | The debt repositioning charge reduced our 2015 net interest income by $773.8 million and our net interest rate spread by 192 basis points. |
| (7) | The debt repositioning charge reduced our 2015 net interest margin by 177 basis points. |
75
Table of Contents
As the debt repositioning charge had no impact on our interest income or the interest expense stemming from our interest-bearing deposits in 2015, a comparison of the 2016 and 2015 amounts and measures is provided below:
Interest Income
| • | In 2016, interest income fell $16.7 million year-over-year to $1.7 billion, as the benefit of a $30.6 million increase in the interest income produced by loans was substantially exceeded by the impact of a $47.3 million decline in the interest income produced by securities and money market investments. |
| • | The increase in the interest income produced by loans was driven by a $2.7 billion rise in the average balance of such assets to $39.1 billion and tempered by a 20-basis point drop in the average yield to 3.77%. The increase in interest income on loans was also partly offset by a $36.4 million decline in the contribution of prepayment income to $60.9 million, and by an 11-basis point decrease in the contribution to the average yield to 16 basis points. |
| • | The decline in the interest income produced by securities and money market investments was driven by a $2.3 billion reduction in the average balance of such assets to $4.9 billion, primarily reflecting the aforementioned high volume of securities calls. As a result of such calls, prepayment income from securities rose $14.1 million year-over-year to $33.5 million and the contribution of prepayment income to the average yield on securities and money market investments rose 41 basis points to 68 basis points. Largely reflecting the increase in prepayment income, the average yield on securities and money market investments rose 67 basis points to 4.11% year-over-year. |
Interest Expense
| • | In 2016, the interest expense on interest-bearing deposits rose $10.9 million year-over-year to $171.0 million, as a $218.0 million rise in the average balance to $26.1 billion was accompanied by a three-basis point rise in the average cost to 0.65%. While the average balance of savings accounts fell $1.6 billion year-over-year to $5.9 billion, the decrease was exceeded by the combination of a $1.2 billion rise in CDs to $6.9 billion and a $648.1 million rise in NOW and money market accounts to $13.3 billion. Similarly, while the average cost of savings accounts fell 13 basis points year-over-year, the benefit was exceeded by the impact of a one-basis point rise in the average cost of CDs and a ten-basis point rise in the average cost of NOW and money market accounts. |
The following table presents the extent to which changes in interest rates and changes in the volume of interest-earning assets and interest-bearing liabilities affected our interest income and interest expense during the periods indicated. Information is provided in each category with respect to (i) the changes attributable to changes in volume (changes in volume multiplied by prior rate); (ii) the changes attributable to changes in rate (changes in rate multiplied by prior volume); and (iii) the net change. The changes attributable to the combined impact of volume and rate have been allocated proportionately to the changes due to volume and the changes due to rate.
76
Table of Contents
In addition, the following table reflects the impact of the fourth quarter 2015 debt repositioning charge on the changes in net interest income from the year ended December 31, 2016 to the year ended December 31, 2015 and from the year ended December 31, 2015 to the year ended December 31, 2014. The impact of the debt repositioning is also reflected in the decline in the rate on borrowed funds and total interest-bearing liabilities from 2015 to 2016 and the increase in the rate on borrowed funds and total interest-bearing liabilities from 2014 to 2015.
Rate/Volume Analysis
| Year Ended | Year Ended | |||||||||||||||||||||||
| December 31, 2016 | December 31, 2015 | |||||||||||||||||||||||
| Compared to Year Ended | Compared to Year Ended | |||||||||||||||||||||||
| December 31, 2015 | December 31, 2014 | |||||||||||||||||||||||
| Increase/(Decrease) | Increase/(Decrease) | |||||||||||||||||||||||
| Due to | Due to | |||||||||||||||||||||||
| (in thousands) | Volume | Rate | Net | Volume | Rate | Net | ||||||||||||||||||
| INTEREST-EARNING ASSETS: |
||||||||||||||||||||||||
| Mortgage and other loans, net |
$ | 92,003 | $ | (61,445 | ) | $ | 30,558 | $ | 68,802 | $ | (42,224 | ) | $ | 26,578 | ||||||||||
| Securities and money market investments |
(121,091 | ) | 73,818 | (47,273 | ) | (33,567 | ) | 15,506 | (18,061 | ) | ||||||||||||||
|
|
|
|
|
|
|
|
|
|
|
|
|
|||||||||||||
| Total |
(29,088 | ) | 12,373 | (16,715 | ) | 35,235 | (26,718 | ) | 8,517 | |||||||||||||||
|
|
|
|
|
|
|
|
|
|
|
|
|
|||||||||||||
| INTEREST-BEARING LIABILITIES: |
||||||||||||||||||||||||
| NOW and money market accounts |
$ | 2,478 | $ | 13,221 | $ | 15,699 | $ | 3,664 | $ | 3,295 | $ | 6,959 | ||||||||||||
| Savings accounts |
(9,847 | ) | (8,947 | ) | (18,794 | ) | 5,618 | 9,431 | 15,049 | |||||||||||||||
| Certificates of deposit |
13,379 | 590 | 13,969 | (10,661 | ) | (944 | ) | (11,605 | ) | |||||||||||||||
| Borrowed funds |
(16,766 | ) | (890,130 | ) | (906,896 | ) | (10,711 | ) | 741,103 | 730,392 | ||||||||||||||
|
|
|
|
|
|
|
|
|
|
|
|
|
|||||||||||||
| Total |
(10,756 | ) | (885,266 | ) | (896,022 | ) | (12,090 | ) | 752,885 | 740,795 | ||||||||||||||
|
|
|
|
|
|
|
|
|
|
|
|
|
|||||||||||||
| Change in net interest income |
$ | (18,332 | ) | $ | 897,639 | $ | 879,307 | $ | 47,325 | $ | (779,603 | ) | $ | (732,278 | ) | |||||||||
|
|
|
|
|
|
|
|
|
|
|
|
|
|||||||||||||
Provision for (Recoveries of) Loan Losses
Provision for (Recovery of) Losses on Non-Covered Loans
The provision for losses on non-covered loans, like the recovery of non-covered loan losses, is based on the methodology used by management in calculating the allowance for losses on such loans. Reflecting this methodology, which is discussed in detail under “Critical Accounting Policies” earlier in this report, we recorded an $11.9 million provision for non-covered loan losses in the current twelve-month period as compared to a $3.3 million recovery of non-covered loan losses in the twelve months ended December 31, 2015.
Reflecting the 2016 provision and twelve-month net charge-offs of $708,000, the allowance for losses on non-covered loans rose to $158.3 million at the end of this December from $147.1 million at the prior year-end.
Recovery of Losses on Covered Loans
When an improvement in the credit quality of certain loan portfolios acquired in our FDIC-assisted transactions leads us to believe that the cash flows from those portfolios will exceed our expectations, we reverse the previously established covered loan loss allowance by recording a recovery. In accordance with this methodology, we recovered $7.7 million and $11.7 million, respectively, from the covered loan loss allowance in the twelve months ended December 31, 2016 and 2015.
Reflecting the recoveries recorded in 2016, the allowance for losses on covered loans fell to $23.7 million from $31.4 million in the twelve months ended December 31, 2015.
Because our FDIC loss sharing agreements call for the FDIC to share in any recoveries of such losses, we also record FDIC indemnification expense in “Non-interest income” in the same period that a recovery of covered loan losses occurs. Accordingly, we recorded FDIC indemnification expense of $6.2 million and $9.3 million in the twelve months ended December 31, 2016 and 2015, respectively, as further discussed under “Non-interest income” below.
If we had reason to believe that the cash flows from certain loans acquired in our FDIC-assisted transactions would fall short of our expectations due to a decline in credit quality, we would record a provision for losses on non-covered loans. In accordance with our loss sharing agreements, which also call for the FDIC to share in any covered loan losses, the provision would be partially offset by FDIC indemnification income recorded in “Non-interest income” during the same period.
77
Table of Contents
For additional information about our methodologies for recording recoveries of, and provisions for, loan losses, see the discussion of the respective loan loss allowances under “Critical Accounting Policies” and the discussion of “Asset Quality” that appear earlier in this report.
Non-Interest Income
We generate non-interest income through a variety of sources, including—among others—mortgage banking income (which consists of income from the origination of one-to-four family loans for sale and income from the servicing of these and other one-to-four family loans); fee income (in the form of retail deposit fees and charges on loans); income from our investment in BOLI; gains on sales of securities; and “other” sources, including the revenues produced through the sale of third-party investment products and those produced through our subsidiary, Peter B. Cannell & Co., Inc. (“PBC”), an investment advisory firm.
Non-interest income fell $65.2 million year-over-year to $145.6 million in the twelve months ended December 31, 2016. The reduction was primarily attributable to the following factors:
| • | Mortgage banking income fell $26.8 million year-over-year to $27.3 million, primarily due to a first-quarter change in the assumptions used to calculate the value of our MSRs, together with an increase in loan payments and curtailments. |
| • | Other non-interest income fell to $41.6 million in the twelve months ended December 31, 2016 from $74.2 million in the twelve months ended December 31, 2015. While certain components of other non-interest income declined year-over-year, including revenues from PBC and the sale of third-party investments, the bulk of the year-over-year reduction was due to certain gains recorded in the prior year. The amount of other non-interest income recorded in 2015 was boosted by the combination of a $13.3 million gain on the sale of a bank-owned property and a $7.8 million gain on the sale of a multi-family property that had been classified as OREO. As no comparable gains were recorded in 2016, these two factors accounted for $21.1 million of the $32.6 million decline in other non-interest income from the level recorded in 2015. |
| • | The net gain on sales of loans, primarily through participations, fell $10.3 million year-over-year to $15.8 million. |
Non-Interest Income Analysis
The following table summarizes our sources of non-interest income in the twelve months ended December 31, 2016, 2015, and 2014:
| For the Years Ended December 31, | ||||||||||||
| (in thousands) | 2016 | 2015 | 2014 | |||||||||
| Mortgage banking income |
$ | 27,281 | $ | 54,113 | $ | 62,953 | ||||||
| Fee income |
32,665 | 34,058 | 36,585 | |||||||||
| BOLI income |
31,015 | 27,541 | 27,150 | |||||||||
| Net gain (loss) on sales of loans |
15,806 | 26,133 | (223 | ) | ||||||||
| Net gain on sales of securities |
3,347 | 4,054 | 14,029 | |||||||||
| FDIC indemnification expense |
(6,155 | ) | (9,336 | ) | (14,870 | ) | ||||||
| Other income: |
||||||||||||
| Peter B. Cannell & Co., Inc. |
22,537 | 26,771 | 26,176 | |||||||||
| Third-party investment product sales |
11,658 | 13,292 | 13,571 | |||||||||
| Gain on Visa shares sold |
— | — | 3,856 | |||||||||
| Recovery of OTTI securities |
1,214 | 242 | 17,326 | |||||||||
| Other |
6,204 | 33,895 | 15,040 | |||||||||
|
|
|
|
|
|
|
|||||||
| Total other income |
41,613 | 74,200 | 75,969 | |||||||||
|
|
|
|
|
|
|
|||||||
| Total non-interest income |
$ | 145,572 | $ | 210,763 | $ | 201,593 | ||||||
|
|
|
|
|
|
|
|||||||
It should be noted that the amount of mortgage banking income we record in any given period is likely to vary, and therefore is difficult to predict. The mortgage banking income we record depends in large part on the volume of loans originated which, in turn, depends on a variety of factors, including changes in market interest rates and economic conditions, competition, refinancing activity, and loan demand. In addition, the servicing income we record can vary from quarter to quarter, depending on the effectiveness of the hedging we engage in to offset the anticipated impact of changing interest rates on our serviced loans.
78
Table of Contents
Non-Interest Expense
Non-interest expense has two primary components: operating expenses, which include compensation and benefits, occupancy and equipment, and general and administrative (“G&A”) expenses; and the amortization of the CDI stemming from certain of our business combinations.
Non-interest expense totaled $651.6 million in the twelve months ended December 31, 2016, as compared to $765.9 million in the year-earlier twelve-month period. Included in the 2015 amount was $141.2 million of the debt repositioning charge recorded in the fourth quarter; no comparable charge was recorded in 2016.
In addition, merger-related charges accounted for $11.1 million of non-interest expense in 2016, as compared to $3.7 million in the prior year.
While non-interest expense declined year-over-year, operating expenses rose $22.5 million to $638.1 million from the level recorded in 2015. Compensation and benefits expense accounted for $8.8 million of the year-over-year increase, having grown to $351.4 million in 2016. The increase was driven by a combination of factors, including an increase in medical benefits expense, back-office staff expansion, normal salary increases, and the granting of stock awards. In addition, G&A expense rose $17.6 million year-over-year to $188.1 million, primarily reflecting a $14.8 million increase in FDIC deposit insurance premiums to $61.1 million, as well as an increase in legal and professional fees. These increases, which included fees incurred in connection with our preparations for SIFI status, were only partly offset by a $3.9 million decrease in occupancy and equipment expense to $98.5 million, primarily representing an increase in rental income.
Income Tax Expense
Income tax expense includes federal, New York State, and New York City income taxes, as well as non-material income taxes from other jurisdictions where we operate our branches and/or conduct our mortgage banking business.
In the twelve months ended December 31, 2016, we recorded income tax expense of $281.7 million, reflecting pre-tax income of $777.1 million and an effective tax rate of 36.25%. In the prior year, we recorded an income tax benefit of $84.9 million as a result of having recorded a $132.0 million pre-tax loss.
RESULTS OF OPERATIONS: 2015 AS COMPARED TO 2014
Earnings Summary
In the fourth quarter of 2015, we recorded a non-routine pre-tax debt repositioning charge of $915.0 million in connection with the prepayment of $10.4 billion of wholesale borrowings. In accordance with ASC 470-50, $773.8 million of the debt repositioning charge was recorded as interest expense, and the remaining $141.2 million was recorded as non-interest expense. In addition, our fourth quarter non-interest expense included pre-tax expenses of $3.7 million in connection with the proposed merger with Astoria Financial. On an after-tax basis, the entire debt repositioning charge was equivalent to $546.8 million and the merger-related expenses were equivalent to $3.2 million.
Reflecting these after-tax items, we recorded a loss of $47.2 million, or $0.11 per diluted share, in the twelve months ended December 31, 2015. The impact of the after-tax debt repositioning charge and the after-tax merger-related expenses on our 2015 results of operations was largely offset by the earnings we produced in the first nine months of the year: $357.7 million, or $0.80 per diluted share.
Net Interest Income
While the benefit of the strategic debt repositioning was reflected in our 2016 earnings, the inclusion of the $773.8 million charge in the interest expense on borrowed funds resulted in our recording total interest expense of $1.3 billion and net interest income of $408.1 million in 2015. By comparison, in 2014, we recorded total interest expense of $542.7 million and net interest income of $1.1 billion. The impact of the debt repositioning charge was further reflected in our net interest margin, which was 0.94% and 2.67% in the respective years.
Given the significant impact of the debt repositioning charge on the Company’s 2015 net interest income and margin, a comparison with the year-earlier levels is not meaningful, in our view. Accordingly, the following discussion is limited to a comparison of our 2015 and 2014 interest income and a comparison of the interest expense on our interest-bearing deposits during those years.
79
Table of Contents
Interest Income
Interest income rose $8.5 million year-over-year to $1.7 billion, as the average balance of interest-earning assets rose $896.2 million to $43.6 billion and the average yield on such assets fell six basis points to 3.88%.
Reflecting the record volume of loans we produced, the average balance of loans rose $1.8 billion year-over-year to $36.3 billion, while the average yield on our loans fell 13 basis points to 3.97%. The net effect was a $26.6 million rise in the interest income from loans to $1.4 billion, which accounted for 85.2% of the interest income produced in 2015.
The loan growth recorded in 2015 was partly offset by a decline in securities and money market investments, which averaged $7.3 billion and $8.2 billion, respectively, in 2015 and 2014. While the average balance fell year-over-year, the impact on interest income was, to some degree, tempered by the benefit of an 18-basis point rise in the average yield to 3.44%. Securities and money market investments generated interest income of $250.1 million in 2015, down $18.1 million from the year-earlier amount.
In 2015, as in the past, the interest income we recorded was impacted by the prepayment income we received, primarily in connection with the prepayment of our multi-family and CRE loans, but also in connection with our investment in DUS securities. Prepayment income contributed $116.7 million to interest income in 2015, with prepayments from loans accounting for $97.3 million of the total and prepayments from securities accounting for the remaining $19.4 million. In 2014, prepayment income contributed $89.0 million to interest income, with loans and securities accounting for $86.8 million and $2.3 million, respectively. In addition, prepayment income contributed 27 basis points to our 2015 margin and 21 basis points to our margin in the prior year.
In 2015, the largest loan to prepay was a $116.7 million loan to a single borrower that accounted for $3.5 million of the prepayment income recorded on loans; in comparison, the largest loan to prepay in 2014 was a $170.0 million loan to a single borrower, which accounted for $6.8 million of the prepayment income recorded during the year.
Interest Expense
As previously noted, the interest expense we recorded in 2015 was significantly increased by the $773.8 million debt repositioning charge included in the interest expense produced by borrowed funds.
Also included in the year’s interest expense was the interest expense produced by our interest-bearing deposits, which rose $10.4 million year-over-year to $160.1 million in the twelve months ended December 31, 2015. The increase was attributable to a $1.0 billion rise in the average balance of such funds to $25.9 billion and a two-basis point rise in the average cost to 0.62%.
NOW and money market accounts contributed $7.0 million to the year-over-year increase in interest expense as a $1.0 billion rise in the average balance was accompanied by a three-basis point rise in the average cost to 0.37%. Savings accounts contributed $15.0 million to the year-over-year increase, as the average balance rose $951.1 million to $7.5 billion, and the average cost rose 13 basis points to 0.67%. The impact of these increases was partly offset by an $11.6 million decline in the interest expense produced by CDs to $62.9 million, as a $964.8 million reduction in the average balance to $5.7 billion combined with a two-basis point decline in the average cost to 1.10%.
For additional information about the impact of the debt repositioning charge on our 2015 financial performance, see the Net Interest Income (Loss) Analysis that appears earlier in this filing and, in particular, the following line items, which were directly impacted by the debt repositioning charge: the interest expense on average borrowed funds; the average cost of borrowed funds; the interest expense on average interest-bearing liabilities; the average cost of interest-bearing liabilities; our net interest income; our net interest rate spread; and our net interest margin.
(Recoveries of) Provision for Losses on Loans
(Recovery of) Losses on Non-Covered Loans
In accordance with management’s methodology for the calculation of the allowance for non-covered loan losses, we recovered $3.3 million from that allowance in 2015. In 2014, no recovery of, nor provision for, losses on non-covered loans was recorded, reflecting management’s application of the same methodology.
80
Table of Contents
Recovery of (Provision for) Losses on Covered Loans
In accordance with management’s methodology for the calculation of the allowance for covered loan losses, we recovered $11.7 million and $18.6 million from that allowance in the twelve months ended December 31, 2015 and 2014, respectively.
The respective recoveries were partially offset by FDIC indemnification expense of $9.3 million and $14.9 million, as noted in the discussion of “Non-interest income” below.
Non-Interest Income
Non-interest income rose $9.2 million year-over-year to $210.8 million in the twelve months ended December 31, 2015. The increase was largely the net effect of the following factors:
| • | Net gains on sales of loans rose to $26.1 million in 2015 from a loss of $223,000 in the prior year. |
| • | Reflecting the aforementioned decline in the recovery of covered loan losses, FDIC indemnification expense dropped $5.5 million year-over-year to $9.3 million. |
| • | Mortgage banking income declined $8.8 million year-over-year to $54.1 million, as a $15.5 million increase in income from originations was more than offset by a $24.3 million decline in servicing income to $14.6 million. In addition to a 15-basis point rise in the gain-on-sale margin to 0.88%, the year-over-year increase in income from originations reflects a rise in loan production as consumers were encouraged by the low level of residential mortgage interest rates to purchase new homes or refinance. The decline in servicing income was generally due to a mismatch between the change in the valuation of our MSRs and the change in the value of the derivatives used to hedge our MSRs which, in turn, was due to the volatility of interest rates in the third quarter of the year. |
| • | Net securities gains fell $10.0 million year-over-year to $4.1 million. |
| • | Other non-interest income fell $1.8 million year-over-year to $74.2 million. Included in the 2015 amount were net gains on the sale of OREO properties of $15.8 million and a $13.3 million gain on the sale of a bank-owned building used for retail operations. In 2014, other non-interest income included a $9.3 million net gain on the sale of OREO properties, a $3.9 million gain on Visa shares sold, and the recovery of $17.3 million on a security that had previously been written off. |
Non-Interest Expense
In accordance with ASC 470-50, and as previously noted, $141.2 million of the debt repositioning charge incurred in the fourth quarter was recorded in non-interest expense. Primarily reflecting this charge and, to a lesser extent, merger-related expenses of $3.7 million, non-interest expense rose $178.4 million from the year-earlier level to $765.9 million in 2015.
Operating expenses accounted for $36.4 million of the year-over-year increase and totaled $615.6 million in the twelve months ended December 31, 2015. The bulk of the increase was attributable to compensation and benefits expense, which rose $35.8 million year-over-year to $342.6 million. The increase in compensation and benefits expense was due to a combination of factors, including normal increases in compensation, as well as stock incentives; an increase in medical benefits and pension expenses; and the expansion of staffing in certain departments in preparation for our expected transition to SIFI status.
The remainder of the increase in operating expenses was the net effect of a $3.4 million rise in occupancy and equipment expense to $102.4 million and a $2.8 million decrease in G&A expense to $170.5 million.
Income Tax Expense
Reflecting the $915.0 million debt repositioning charge and the $3.7 million of merger-related expenses, the Company recorded a pre-tax loss of $132.0 million and an income tax benefit of $84.9 million in 2015. By comparison, the Company recorded pre-tax income of $773.1 million and income tax expense of $287.7 million in 2014. The effective tax rates were 64.28% and 37.21% in the respective years.
81
Table of Contents
QUARTERLY FINANCIAL DATA
The following table sets forth selected unaudited quarterly financial data for the years ended December 31, 2016 and 2015:
| 2016 | 2015 | |||||||||||||||||||||||||||||||
| (in thousands, except per share data) | 4th | 3rd | 2nd | 1st | 4th (1) | 3rd | 2nd | 1st | ||||||||||||||||||||||||
| Net interest income (loss) |
$ | 315,520 | $ | 318,423 | $ | 325,573 | $ | 327,866 | $ | (449,202 | ) | $ | 279,412 | $ | 285,097 | $ | 292,768 | |||||||||||||||
| Provision for (recoveries of) loan losses |
3,516 | (55 | ) | 895 | (176 | ) | (6,317 | ) | (9,028 | ) | 334 | 7 | ||||||||||||||||||||
| Non-interest income |
32,374 | 40,595 | 37,366 | 35,237 | 59,041 | 37,587 | 61,901 | 52,234 | ||||||||||||||||||||||||
| Non-interest expense |
170,602 | 161,685 | 160,911 | 158,448 | 309,781 | 147,308 | 151,930 | 156,836 | ||||||||||||||||||||||||
|
|
|
|
|
|
|
|
|
|
|
|
|
|
|
|
|
|||||||||||||||||
| Income (loss) before income taxes |
173,776 | 197,388 | 201,133 | 204,831 | (693,625 | ) | 178,719 | 194,734 | 188,159 | |||||||||||||||||||||||
| Income tax expense (benefit) |
60,043 | 72,089 | 74,673 | 74,922 | (288,818 | ) | 64,031 | 71,030 | 68,900 | |||||||||||||||||||||||
|
|
|
|
|
|
|
|
|
|
|
|
|
|
|
|
|
|||||||||||||||||
| Net income (loss) |
$ | 113,733 | $ | 125,299 | $ | 126,460 | $ | 129,909 | $ | (404,807 | ) | $ | 114,688 | $ | 123,704 | $ | 119,259 | |||||||||||||||
|
|
|
|
|
|
|
|
|
|
|
|
|
|
|
|
|
|||||||||||||||||
| Basic earnings (loss) per share |
$0.23 | $0.26 | $0.26 | $0.27 | $(0.87 | ) | $0.26 | $0.28 | $0.27 | |||||||||||||||||||||||
|
|
|
|
|
|
|
|
|
|
|
|
|
|
|
|
|
|||||||||||||||||
| Diluted earnings (loss) per share |
$0.23 | $0.26 | $0.26 | $0.27 | $(0.87 | ) | $0.26 | $0.28 | $0.27 | |||||||||||||||||||||||
|
|
|
|
|
|
|
|
|
|
|
|
|
|
|
|
|
|||||||||||||||||
| (1) | The fourth quarter 2015 amounts reflect the debt repositioning charge recorded in connection with the prepayment of $10.4 billion of wholesale borrowings. In accordance with ASC 470-50, $773.8 million of the $915.0 million pre-tax debt repositioning charge was recorded in interest expense and $141.2 million was recorded in non-interest expense. On an after-tax basis, the debt repositioning charge was equivalent to $546.8 million, or $1.17 per diluted share. |
IMPACT OF INFLATION
The consolidated financial statements and notes thereto presented in this report have been prepared in accordance with GAAP, which requires that we measure our financial condition and operating results in terms of historical dollars, without considering changes in the relative purchasing power of money over time due to inflation. The impact of inflation is reflected in the increased cost of our operations. Unlike industrial companies, nearly all of a bank’s assets and liabilities are monetary in nature. As a result, the impact of interest rates on our performance is greater than the impact of general levels of inflation. Interest rates do not necessarily move in the same direction, or to the same extent, as the prices of goods and services.
IMPACT OF RECENT ACCOUNTING PRONOUNCEMENTS
Refer to Note 2, “Summary of Significant Accounting Policies,” in Item 8, “Financial Statements and Supplementary Data,” for a discussion of the impact of recent accounting pronouncements on our financial condition and results of operations.
82
Table of Contents
RECONCILIATIONS OF STOCKHOLDERS’ EQUITY AND TANGIBLE STOCKHOLDERS’ EQUITY, TOTAL ASSETS AND TANGIBLE ASSETS, AND THE RELATED FINANCIAL MEASURES
While stockholders’ equity, total assets, and book value per share are financial measures that are recorded in accordance with U.S. generally accepted accounting principles (“GAAP”), tangible stockholders’ equity, tangible assets, and tangible book value per share are not. It is management’s belief that these non-GAAP measures should be disclosed in this report and others we issue for the following reasons:
| 1. | Tangible stockholders’ equity is an important indication of the Company’s ability to grow organically and through business combinations, as well as its ability to pay dividends and to engage in various capital management strategies. |
| 2. | Tangible book value per share and the ratio of tangible stockholders’ equity to tangible assets are among the capital measures considered by current and prospective investors, both independent of, and in comparison with, the Company’s peers. |
Tangible stockholders’ equity, tangible assets, and the related non-GAAP measures should not be considered in isolation or as a substitute for stockholders’ equity, total assets, or any other measure calculated in accordance with GAAP. Moreover, the manner in which we calculate these non-GAAP measures may differ from that of other companies reporting non-GAAP measures with similar names.
Reconciliations of our stockholders’ equity and tangible stockholders’ equity, our total assets and tangible assets, and the related financial measures at December 31, 2016 and 2015 follow:
| At or for the Twelve Months Ended December 31, |
||||||||
| (dollars in thousands) | 2016 | 2015 | ||||||
| Stockholders’ Equity |
$ | 6,123,991 | $ | 5,934,696 | ||||
| Less: Goodwill |
(2,436,131 | ) | (2,436,131 | ) | ||||
| Core deposit intangibles |
(208 | ) | (2,599 | ) | ||||
|
|
|
|
|
|||||
| Tangible stockholders’ equity |
$ | 3,687,652 | $ | 3,495,966 | ||||
| Total Assets |
$ | 48,926,555 | $ | 50,317,796 | ||||
| Less: Goodwill |
(2,436,131 | ) | (2,436,131 | ) | ||||
| Core deposit intangibles |
(208 | ) | (2,599 | ) | ||||
|
|
|
|
|
|||||
| Tangible assets |
$ | 46,490,216 | $ | 47,879,066 | ||||
| Stockholders’ equity to total assets |
12.52 | % | 11.79 | % | ||||
| Tangible stockholders’ equity to tangible assets |
7.93 | 7.30 | ||||||
| Book value per share |
$12.57 | $12.24 | ||||||
| Tangible book value per share |
7.57 | 7.21 | ||||||
83
Table of Contents
| ITEM 7A. | QUANTITATIVE AND QUALITATIVE DISCLOSURES ABOUT MARKET RISK |
We manage our assets and liabilities to reduce our exposure to changes in market interest rates. The asset and liability management process has three primary objectives: to evaluate the interest rate risk inherent in certain balance sheet accounts; to determine the appropriate level of risk, given our business strategy, operating environment, capital and liquidity requirements, and performance objectives; and to manage that risk in a manner consistent with guidelines approved by the Boards of Directors of the Company, the Community Bank, and the Commercial Bank.
Market Risk
As a financial institution, we are focused on reducing our exposure to interest rate volatility, which represents our primary market risk. Changes in market interest rates represent the greatest challenge to our financial performance, as such changes can have a significant impact on the level of income and expense recorded on a large portion of our interest-earning assets and interest-bearing liabilities, and on the market value of all interest-earning assets, other than those possessing a short term to maturity. To reduce our exposure to changing rates, the Boards of Directors and management monitor interest rate sensitivity on a regular or as needed basis so that adjustments to the asset and liability mix can be made when deemed appropriate.
The actual duration of held-for-investment mortgage loans and mortgage-related securities can be significantly impacted by changes in prepayment levels and market interest rates. The level of prepayments may, in turn, be impacted by a variety of factors, including the economy in the region where the underlying mortgages were originated; seasonal factors; demographic variables; and the assumability of the underlying mortgages. However, the factors with the most significant impact on prepayments are market interest rates and the availability of refinancing opportunities.
In 2016, we managed our interest rate risk by taking the following actions: (1) We continued to emphasize the origination and retention of intermediate-term assets, primarily in the form of multi-family and CRE loans; (2) We increased our portfolio of C&I loans, which feature floating rates; and (3) We extended the maturities of certain short-term wholesale borrowings.
In connection with the activities of our mortgage banking operation, we enter into contingent commitments to fund residential mortgage loans by a specified future date at a stated interest rate and corresponding price. Such commitments, which are generally known as IRLCs, are considered to be financial derivatives and, as such, are carried at fair value.
To mitigate the interest rate risk associated with IRLCs, we enter into forward commitments to sell mortgage loans or mortgage-backed securities (“MBS”) by a specified future date and at a specified price. These forward-sale agreements are also carried at fair value. Such forward commitments to sell generally obligate us to complete the transaction as agreed, and therefore pose a risk to us if we are not able to deliver the loans or MBS pursuant to the terms of the applicable forward-sale agreement. For example, if we are unable to meet our obligation, we may be required to pay a “make whole” fee to the counterparty.
When we retain the servicing on the loans we sell, we capitalize an MSR asset. MSRs are recorded at fair value, with changes in fair value recorded as a component of non-interest income. We estimate the fair value of the MSR asset based upon a number of factors, including current and expected loan prepayment rates, economic conditions, and market forecasts, as well as relevant characteristics of the associated underlying loans. Generally, when market interest rates decline, loan prepayments increase as customers refinance their existing mortgages to take advantage of more favorable interest rate terms. When a mortgage prepays, or when loans are expected to prepay earlier than originally expected, a portion of the anticipated cash flows associated with servicing these loans is terminated or reduced, which can result in a reduction in the fair value of the capitalized MSRs and a corresponding reduction in earnings.
To mitigate the prepayment risk inherent in MSRs, we could sell the servicing of the loans we originate, and thus minimize the potential for earnings volatility. Instead, we have opted to mitigate such risk by investing in exchange-traded derivative financial instruments that are expected to experience opposite and offsetting changes in fair value as related to the value of our MSRs.
Interest Rate Sensitivity Analysis
The matching of assets and liabilities may be analyzed by examining the extent to which such assets and liabilities are “interest rate sensitive” and by monitoring a bank’s interest rate sensitivity “gap.” An asset or liability is said to be interest rate sensitive within a specific time frame if it will mature or reprice within that period of time.
84
Table of Contents
The interest rate sensitivity gap is defined as the difference between the amount of interest-earning assets maturing or repricing within a specific time frame and the amount of interest-bearing liabilities maturing or repricing within that same period of time.
In a rising interest rate environment, an institution with a negative gap would generally be expected, absent the effects of other factors, to experience a greater increase in the cost of its interest-bearing liabilities than it would in the yield on its interest-earning assets, thus producing a decline in its net interest income. Conversely, in a declining rate environment, an institution with a negative gap would generally be expected to experience a lesser reduction in the yield on its interest-earning assets than it would in the cost of its interest-bearing liabilities, thus producing an increase in its net interest income.
In a rising interest rate environment, an institution with a positive gap would generally be expected to experience a greater increase in the yield on its interest-earning assets than it would in the cost of its interest-bearing liabilities, thus producing an increase in its net interest income. Conversely, in a declining rate environment, an institution with a positive gap would generally be expected to experience a lesser reduction in the cost of its interest-bearing liabilities than it would in the yield on its interest-earning assets, thus producing a decline in its net interest income.
At December 31, 2016, our one-year gap was a negative 21.37%, as compared to a negative 17.77% at December 31, 2015. The 360-basis point change was primarily due to an increase in CDs repricing, and a decline in securities maturing, within one year. The combined impact on our one-year gap was partially offset by a decline in borrowings due to reprice within the same period of time.
The table on the following page sets forth the amounts of interest-earning assets and interest-bearing liabilities outstanding at December 31, 2016 which, based on certain assumptions stemming from our historical experience, are expected to reprice or mature in each of the future time periods shown. Except as stated below, the amounts of assets and liabilities shown as repricing or maturing during a particular time period were determined in accordance with the earlier of (1) the term to repricing, or (2) the contractual terms of the asset or liability.
The table provides an approximation of the projected repricing of assets and liabilities at December 31, 2016 on the basis of contractual maturities, anticipated prepayments, and scheduled rate adjustments within a three-month period and subsequent selected time intervals. For residential mortgage-related securities, prepayment rates are forecasted at a weighted average constant prepayment rate (“CPR”) of 23% per annum; for multi-family and CRE loans, prepayment rates are forecasted at weighted average CPRs of 22% and 15% per annum, respectively. Borrowed funds were not assumed to prepay. Savings, NOW, and money market accounts were assumed to decay based on a comprehensive statistical analysis that incorporated our historical deposit experience. Based on the results of this analysis, savings accounts were assumed to decay at a rate of 57% for the first five years and 43% for years six through ten. NOW accounts were assumed to decay at a rate of 74% for the first five years and 26% for years six through ten. The decay assumptions reflect the prolonged low interest rate environment and the uncertainty regarding future depositor behavior. Including those accounts having specified repricing dates, money market accounts were assumed to decay at a rate of 72% for the first five years and 28% for years six through ten.
Prepayment and deposit decay rates can have a significant impact on our estimated gap. While we believe our assumptions to be reasonable, there can be no assurance that the assumed prepayment and decay rates noted above will approximate actual future loan and securities prepayments and deposit withdrawal activity.
To validate our prepayment assumptions for our multi-family and CRE loan portfolios, we perform a monthly analysis, during which we review our historical prepayment rates and compare them to our projected prepayment rates. We continually review the actual prepayment rates to ensure that our projections are as accurate as possible, since prepayments on these types of loans are not as closely correlated to changes in interest rates as prepayments on one-to-four family loans tend to be. In addition, we review the call provisions in our borrowings and investment portfolios and, on a monthly basis, compare the actual calls to our projected calls to ensure that our projections are reasonable.
As of December 31, 2016, the impact of a 100-basis point decline in market interest rates would have increased our projected prepayment rates by a constant prepayment rate of 2.48% per annum. Conversely, the impact of a 100-basis point increase in market interest rates would have decreased our projected prepayment rates by a constant prepayment rate of 1.97% per annum.
85
Table of Contents
Interest Rate Sensitivity Analysis
| At December 31, 2016 | ||||||||||||||||||||||||||||
| Three | Four to | More Than | More Than | More Than | More | |||||||||||||||||||||||
| Months | Twelve | One Year | Three Years | Five Years | Than | |||||||||||||||||||||||
| (dollars in thousands) | or Less | Months | to Three Years | to Five Years | to 10 Years | 10 Years | Total | |||||||||||||||||||||
| INTEREST-EARNING ASSETS: |
||||||||||||||||||||||||||||
| Mortgage and other loans (1) |
$ | 4,059,337 | $ | 4,943,173 | $ | 14,275,447 | $ | 11,037,973 | $ | 4,838,195 | $279,413 | $ | 39,433,538 | |||||||||||||||
| Mortgage-related securities (2)(3) |
40,843 | 75,820 | 147,946 | 643,172 | 2,255,493 | 56,616 | 3,219,890 | |||||||||||||||||||||
| Other securities and money market investments (2) |
720,642 | 203,553 | 62,732 | 10,053 | 85,025 | 113,462 | 1,195,467 | |||||||||||||||||||||
|
|
|
|
|
|
|
|
|
|
|
|
|
|
|
|||||||||||||||
| Total interest-earning assets |
4,820,822 | 5,222,546 | 14,486,125 | 11,691,198 | 7,178,713 | 449,491 | 43,848,895 | |||||||||||||||||||||
|
|
|
|
|
|
|
|
|
|
|
|
|
|
|
|||||||||||||||
| INTEREST-BEARING LIABILITIES: |
||||||||||||||||||||||||||||
| NOW and money market accounts |
7,546,812 | 426,458 | 986,828 | 811,882 | 3,623,100 | — | 13,395,080 | |||||||||||||||||||||
| Savings accounts |
1,066,299 | 800,481 | 639,155 | 504,162 | 2,270,277 | — | 5,280,374 | |||||||||||||||||||||
| Certificates of deposit |
1,703,999 | 5,479,960 | 303,484 | 73,474 | 16,253 | — | 7,577,170 | |||||||||||||||||||||
| Borrowed funds |
673,927 | 2,800,000 | 8,554,500 | 1,500,000 | — | 144,952 | 13,673,379 | |||||||||||||||||||||
|
|
|
|
|
|
|
|
|
|
|
|
|
|
|
|||||||||||||||
| Total interest-bearing liabilities |
10,991,037 | 9,506,899 | 10,483,967 | 2,889,518 | 5,909,630 | 144,952 | 39,926,003 | |||||||||||||||||||||
|
|
|
|
|
|
|
|
|
|
|
|
|
|
|
|||||||||||||||
| Interest rate sensitivity gap per period (4) |
$ | (6,170,215 | ) | $ | (4,284,353 | ) | $ | 4,002,158 | $ | 8,801,680 | $ | 1,269,083 | $304,539 | $ | 3,922,892 | |||||||||||||
|
|
|
|
|
|
|
|
|
|
|
|
|
|
|
|||||||||||||||
| Cumulative interest rate sensitivity gap |
$ | (6,170,215 | ) | $ | (10,454,568 | ) | $ | (6,452,410 | ) | $2,349,270 | $ | 3,618,353 | $ | 3,922,892 | ||||||||||||||
|
|
|
|
|
|
|
|
|
|
|
|
|
|||||||||||||||||
| Cumulative interest rate sensitivity gap as a percentage of total assets |
(12.61 | )% | (21.37 | )% | (13.19 | )% | 4.80 | % | 7.40 | % | 8.02 | % | ||||||||||||||||
| Cumulative net interest-earning assets as a percentage of net interest-bearing liabilities |
43.86 | % | 49.00 | % | 79.17 | % | 106.94 | % | 109.10 | % | 109.83 | % | ||||||||||||||||
|
|
|
|
|
|
|
|
|
|
|
|
|
|||||||||||||||||
| (1) | For the purpose of the gap analysis, non-performing non-covered loans and the allowances for loan losses have been excluded. |
| (2) | Mortgage-related and other securities, including FHLB stock, are shown at their respective carrying amounts. |
| (3) | Expected amount based, in part, on historical experience. |
| (4) | The interest rate sensitivity gap per period represents the difference between interest-earning assets and interest-bearing liabilities. |
86
Table of Contents
Certain shortcomings are inherent in the method of analysis presented in the preceding Interest Rate Sensitivity Analysis. For example, although certain assets and liabilities may have similar maturities or periods to repricing, they may react in different degrees to changes in market interest rates. The interest rates on certain types of assets and liabilities may fluctuate in advance of the market, while interest rates on other types may lag behind changes in market interest rates. Additionally, certain assets, such as adjustable-rate loans, have features that restrict changes in interest rates both on a short-term basis and over the life of the asset. Furthermore, in the event of a change in interest rates, prepayment and early withdrawal levels would likely deviate from those assumed in calculating the table. Also, the ability of some borrowers to repay their adjustable-rate loans may be adversely impacted by an increase in market interest rates.
Interest rate sensitivity is also monitored through the use of a model that generates estimates of the change in our net portfolio value (“NPV”) over a range of interest rate scenarios. NPV is defined as the net present value of expected cash flows from assets, liabilities, and off-balance sheet contracts. The NPV ratio, under any interest rate scenario, is defined as the NPV in that scenario divided by the market value of assets in the same scenario. The model assumes estimated loan prepayment rates, reinvestment rates, and deposit decay rates similar to those utilized in formulating the preceding Interest Rate Sensitivity Analysis.
The following table sets forth our NPV at December 31, 2016, based on the information and assumptions in effect at that date, and assuming the changes in interest rates noted:
| (dollars in thousands) | ||||||||||||||||||||
| Change in Interest Rates (in basis points) (1) |
Market Value of Assets |
Market Value of Liabilities |
Net Portfolio Value |
Net Change | Portfolio Market Value Projected % Change to Base |
|||||||||||||||
| — | $ | 49,623,762 | $ | 42,763,289 | $ | 6,860,473 | $ | — | — | % | ||||||||||
| +100 | 49,053,852 | 42,475,076 | 6,578,776 | (281,697 | ) | (4.11 | ) | |||||||||||||
| +200 | 48,169,753 | 42,203,508 | 5,966,245 | (894,228 | ) | (13.03 | ) | |||||||||||||
| (1) | The impact of 100- and 200-basis point reductions in interest rates is not presented in view of the current level of the federal funds rate and other short-term interest rates. |
The net changes in NPV presented in the preceding table are within the limits approved by the Boards of Directors of the Company and the Banks.
As with the Interest Rate Sensitivity Analysis, certain shortcomings are inherent in the methodology used in the preceding interest rate risk measurements. Modeling changes in NPV requires that certain assumptions be made which may or may not reflect the manner in which actual yields and costs respond to changes in market interest rates. In this regard, the NPV Analysis presented above assumes that the composition of our interest rate sensitive assets and liabilities existing at the beginning of a period remains constant over the period being measured, and also assumes that a particular change in interest rates is reflected uniformly across the yield curve, regardless of the duration to maturity or repricing of specific assets and liabilities. Furthermore, the model does not take into account the benefit of any strategic actions we may take to further reduce our exposure to interest rate risk. Accordingly, while the NPV Analysis provides an indication of our interest rate risk exposure at a particular point in time, such measurements are not intended to, and do not, provide a precise forecast of the effect of changes in market interest rates on our net interest income, and may very well differ from actual results.
We also utilize an internal net interest income simulation to manage our sensitivity to interest rate risk. The simulation incorporates various market-based assumptions regarding the impact of changing interest rates on future levels of our financial assets and liabilities. The assumptions used in the net interest income simulation are inherently uncertain. Actual results may differ significantly from those presented in the following table, due to the frequency, timing, and magnitude of changes in interest rates; changes in spreads between maturity and repricing categories; and prepayments, among other factors, coupled with any actions taken to counter the effects of any such changes.
87
Table of Contents
Based on the information and assumptions in effect at December 31, 2016, the following table reflects the estimated percentage change in future net interest income for the next twelve months, assuming the changes in interest rates noted:
| Change in Interest Rates (in basis points) (1)(2) |
Estimated Percentage Change in Future Net Interest Income | ||||
| +100 over one year |
(2.47) | % | |||
| +200 over one year |
(5.56) | ||||
| (1) | In general, short- and long-term rates are assumed to increase in parallel fashion across all four quarters and then remain unchanged. |
| (2) | The impact of 100- and 200-basis point reductions in interest rates is not presented in view of the current level of the federal funds rate and other short-term interest rates. |
Future changes in our mix of assets and liabilities may result in other changes to our gap, NPV, and/or net interest income simulation.
In the event that our net interest income and NPV sensitivities were to breach our internal policy limits, we would undertake the following actions to ensure that appropriate remedial measures were put in place:
| • | Our Asset and Liability Management Committee (the “ALCO Committee”) would inform the Board of Directors of the variance, and present recommendations to the Board regarding proposed courses of action to restore conditions to within-policy tolerances. |
| • | In formulating appropriate strategies, the ALCO Committee would ascertain the primary causes of the variance from policy tolerances, the expected term of such conditions, and the projected effect on capital and earnings. |
Where temporary changes in market conditions or volume levels result in significant increases in interest rate risk, strategies may involve reducing open positions or employing synthetic hedging techniques to more immediately reduce risk exposure. Where variance from policy tolerances is triggered by more fundamental imbalances in the risk profiles of core loan and deposit products, a remedial strategy may involve restoring balance through natural hedges to the extent possible before employing synthetic hedging techniques. Other strategies might include:
| • | Asset restructuring, involving sales of assets having higher risk profiles, or a gradual restructuring of the asset mix over time to affect the maturity or repricing schedule of assets; |
| • | Liability restructuring, whereby product offerings and pricing are altered or wholesale borrowings are employed to affect the maturity structure or repricing of liabilities; |
| • | Expansion or shrinkage of the balance sheet to correct imbalances in the repricing or maturity periods between assets and liabilities; and/or |
| • | Use or alteration of off-balance sheet positions, including interest rate swaps, caps, floors, options, and forward-purchase or sales commitments. |
In connection with our net interest income simulation modeling, we also evaluate the impact of changes in the slope of the yield curve. At December 31, 2016, our analysis indicated that an immediate inversion of the yield curve would be expected to result in a 7.78% decrease in net interest income; conversely, an immediate steepening of the yield curve would be expected to result in a 5.54% increase.
| ITEM 8. | FINANCIAL STATEMENTS AND SUPPLEMENTARY DATA |
Our Consolidated Financial Statements and Notes thereto and other supplementary data begin on the following page.
88
Table of Contents
NEW YORK COMMUNITY BANCORP, INC.
CONSOLIDATED STATEMENTS OF CONDITION
| December 31, | ||||||||
| (in thousands, except share data) | 2016 | 2015 | ||||||
| ASSETS: |
||||||||
| Cash and cash equivalents |
$ | 557,850 | $ | 537,674 | ||||
| Securities: |
||||||||
| Available for sale |
104,281 | 204,255 | ||||||
| Held-to-maturity ($1,930,533 and $2,152,939 pledged, respectively) (fair value of $3,813,959 and $6,108,529, respectively) |
3,712,776 | 5,969,390 | ||||||
|
|
|
|
|
|||||
| Total securities |
3,817,057 | 6,173,645 | ||||||
|
|
|
|
|
|||||
| Non-covered loans held for sale |
409,152 | 367,221 | ||||||
| Non-covered loans held for investment, net of deferred loan fees and costs |
37,382,722 | 35,763,204 | ||||||
| Less: Allowance for losses on non-covered loans |
(158,290 | ) | (147,124 | ) | ||||
|
|
|
|
|
|||||
| Non-covered loans held for investment, net |
37,224,432 | 35,616,080 | ||||||
| Covered loans |
1,698,133 | 2,060,089 | ||||||
| Less: Allowance for losses on covered loans |
(23,701 | ) | (31,395 | ) | ||||
|
|
|
|
|
|||||
| Covered loans, net |
1,674,432 | 2,028,694 | ||||||
|
|
|
|
|
|||||
| Total loans, net |
39,308,016 | 38,011,995 | ||||||
| Federal Home Loan Bank stock, at cost |
590,934 | 663,971 | ||||||
| Premises and equipment, net |
373,675 | 322,307 | ||||||
| FDIC loss share receivable |
243,686 | 314,915 | ||||||
| Goodwill |
2,436,131 | 2,436,131 | ||||||
| Core deposit intangibles |
208 | 2,599 | ||||||
| Mortgage servicing rights (includes $228,099 and $243,389, respectively, measured at fair value) |
233,961 | 247,734 | ||||||
| Bank-owned life insurance |
949,026 | 931,627 | ||||||
| Other real estate owned (includes $16,990 and $25,817, respectively, covered by loss sharing agreements) |
28,598 | 39,882 | ||||||
| Other assets |
387,413 | 635,316 | ||||||
|
|
|
|
|
|||||
| Total assets |
$ | 48,926,555 | $ | 50,317,796 | ||||
|
|
|
|
|
|||||
| LIABILITIES AND STOCKHOLDERS’ EQUITY: |
||||||||
| Deposits: |
||||||||
| NOW and money market accounts |
$ | 13,395,080 | $ | 13,069,019 | ||||
| Savings accounts |
5,280,374 | 7,541,566 | ||||||
| Certificates of deposit |
7,577,170 | 5,312,487 | ||||||
| Non-interest-bearing accounts |
2,635,279 | 2,503,686 | ||||||
|
|
|
|
|
|||||
| Total deposits |
28,887,903 | 28,426,758 | ||||||
| Borrowed funds: |
||||||||
| Wholesale borrowings: |
||||||||
| Federal Home Loan Bank advances |
11,664,500 | 13,463,800 | ||||||
| Repurchase agreements |
1,500,000 | 1,500,000 | ||||||
| Federal funds purchased |
150,000 | 426,000 | ||||||
|
|
|
|
|
|||||
| Total wholesale borrowings |
13,314,500 | 15,389,800 | ||||||
| Junior subordinated debentures |
358,879 | 358,605 | ||||||
|
|
|
|
|
|||||
| Total borrowed funds |
13,673,379 | 15,748,405 | ||||||
| Other liabilities |
241,282 | 207,937 | ||||||
|
|
|
|
|
|||||
| Total liabilities |
42,802,564 | 44,383,100 | ||||||
|
|
|
|
|
|||||
| Stockholders’ equity: |
||||||||
| Preferred stock at par $0.01 (5,000,000 shares authorized; none issued) |
— | — | ||||||
| Common stock at par $0.01 (900,000,000 shares authorized; 487,067,889 and 484,968,024 shares issued, and 487,056,676 and 484,943,308 shares outstanding, respectively) |
4,871 | 4,850 | ||||||
| Paid-in capital in excess of par |
6,047,558 | 6,023,882 | ||||||
| Retained earnings (accumulated deficit) |
128,435 | (36,568 | ) | |||||
| Treasury stock, at cost (11,213 and 24,716 shares, respectively) |
(160 | ) | (447 | ) | ||||
| Accumulated other comprehensive loss, net of tax: |
||||||||
| Net unrealized (loss) gain on securities available for sale, net of tax of $534 and $2,153, respectively |
(753 | ) | 3,031 | |||||
| Net unrealized loss on the non-credit portion of other-than-temporary impairment (“OTTI”) losses on securities, net of tax of $3,351 and $3,400, respectively |
(5,241 | ) | (5,318 | ) | ||||
| Net unrealized loss on pension and post-retirement obligations, net of tax of $34,355 and $37,279, respectively |
(50,719 | ) | (54,734 | ) | ||||
|
|
|
|
|
|||||
| Total accumulated other comprehensive loss, net of tax |
(56,713 | ) | (57,021 | ) | ||||
|
|
|
|
|
|||||
| Total stockholders’ equity |
6,123,991 | 5,934,696 | ||||||
|
|
|
|
|
|||||
| Total liabilities and stockholders’ equity |
$ | 48,926,555 | $ | 50,317,796 | ||||
|
|
|
|
|
|||||
See accompanying notes to the consolidated financial statements.
89
Table of Contents
NEW YORK COMMUNITY BANCORP, INC.
CONSOLIDATED STATEMENTS OF OPERATIONS AND COMPREHENSIVE INCOME (LOSS)
| Years Ended December 31, | ||||||||||||
| (in thousands, except per share data) | 2016 | 2015 | 2014 | |||||||||
| INTEREST INCOME: |
||||||||||||
| Mortgage and other loans |
$ | 1,472,020 | $ | 1,441,462 | $ | 1,414,884 | ||||||
| Securities and money market investments |
202,849 | 250,122 | 268,183 | |||||||||
|
|
|
|
|
|
|
|||||||
| Total interest income |
1,674,869 | 1,691,584 | 1,683,067 | |||||||||
|
|
|
|
|
|
|
|||||||
| INTEREST EXPENSE: |
||||||||||||
| NOW and money market accounts |
62,166 | 46,467 | 39,508 | |||||||||
| Savings accounts |
31,982 | 50,776 | 35,727 | |||||||||
| Certificates of deposit |
76,875 | 62,906 | 74,511 | |||||||||
| Borrowed funds |
216,464 | 1,123,360 | 392,968 | |||||||||
|
|
|
|
|
|
|
|||||||
| Total interest expense |
387,487 | 1,283,509 | 542,714 | |||||||||
|
|
|
|
|
|
|
|||||||
| Net interest income |
1,287,382 | 408,075 | 1,140,353 | |||||||||
| Provision for (recovery of) losses on non-covered loans |
11,874 | (3,334 | ) | — | ||||||||
| Recovery of losses on covered loans |
(7,694 | ) | (11,670 | ) | (18,587 | ) | ||||||
|
|
|
|
|
|
|
|||||||
| Net interest income after provision for (recoveries of) loan losses |
1,283,202 | 423,079 | 1,158,940 | |||||||||
|
|
|
|
|
|
|
|||||||
| NON-INTEREST INCOME: |
||||||||||||
| Mortgage banking income |
27,281 | 54,113 | 62,953 | |||||||||
| Fee income |
32,665 | 34,058 | 36,585 | |||||||||
| Bank-owned life insurance |
31,015 | 27,541 | 27,150 | |||||||||
| Net gain (loss) on sales of loans |
15,806 | 26,133 | (223 | ) | ||||||||
| Net gain on sales of securities |
3,347 | 4,054 | 14,029 | |||||||||
| FDIC indemnification expense |
(6,155 | ) | (9,336 | ) | (14,870 | ) | ||||||
| Other |
41,613 | 74,200 | 75,969 | |||||||||
|
|
|
|
|
|
|
|||||||
| Total non-interest income |
145,572 | 210,763 | 201,593 | |||||||||
|
|
|
|
|
|
|
|||||||
| NON-INTEREST EXPENSE: |
||||||||||||
| Operating expenses: |
||||||||||||
| Compensation and benefits |
351,436 | 342,624 | 306,848 | |||||||||
| Occupancy and equipment |
98,543 | 102,435 | 99,016 | |||||||||
| General and administrative |
188,130 | 170,541 | 173,306 | |||||||||
|
|
|
|
|
|
|
|||||||
| Total operating expenses |
638,109 | 615,600 | 579,170 | |||||||||
| Amortization of core deposit intangibles |
2,391 | 5,344 | 8,297 | |||||||||
| Debt repositioning charge |
— | 141,209 | — | |||||||||
| Merger-related expenses |
11,146 | 3,702 | — | |||||||||
|
|
|
|
|
|
|
|||||||
| Total non-interest expense |
651,646 | 765,855 | 587,467 | |||||||||
|
|
|
|
|
|
|
|||||||
| Income (loss) before income taxes |
777,128 | (132,013 | ) | 773,066 | ||||||||
| Income tax expense (benefit) |
281,727 | (84,857 | ) | 287,669 | ||||||||
|
|
|
|
|
|
|
|||||||
| Net income (loss) |
$ | 495,401 | $ | (47,156 | ) | $ | 485,397 | |||||
|
|
|
|
|
|
|
|||||||
| Other comprehensive income (loss), net of tax: |
||||||||||||
| Change in net unrealized gain (loss) on securities available for sale, net of tax of $1,560; $437; and $4,343, respectively |
(2,207 | ) | 475 | 6,407 | ||||||||
| Change in the non-credit portion of OTTI losses recognized in other comprehensive income (loss), net of tax of $49; $44; and $142, respectively |
77 | 69 | 217 | |||||||||
| Change in pension and post-retirement obligations, net of tax of $2,924; $1,161; and $14,992, respectively |
4,015 | (1,445 | ) | (22,123 | ) | |||||||
| Less: Reclassification adjustment for sales of available-for-sale securities, net of tax of $1,127; $306; and $2,492, respectively |
(1,577 | ) | (434 | ) | (3,694 | ) | ||||||
|
|
|
|
|
|
|
|||||||
| Total other comprehensive income (loss), net of tax |
308 | (1,335 | ) | (19,193 | ) | |||||||
|
|
|
|
|
|
|
|||||||
| Total comprehensive income (loss), net of tax |
$ | 495,709 | $ | (48,491 | ) | $ | 466,204 | |||||
|
|
|
|
|
|
|
|||||||
| Basic earnings (loss) per share |
$ | 1.01 | $ | (0.11 | ) | $ | 1.09 | |||||
|
|
|
|
|
|
|
|||||||
| Diluted earnings (loss) per share |
$ | 1.01 | $ | (0.11 | ) | $ | 1.09 | |||||
|
|
|
|
|
|
|
|||||||
See accompanying notes to the consolidated financial statements.
90
Table of Contents
NEW YORK COMMUNITY BANCORP, INC.
CONSOLIDATED STATEMENTS OF CHANGES IN STOCKHOLDERS’ EQUITY
| Years Ended December 31, | ||||||||||||
| (in thousands, except share data) | 2016 | 2015 | 2014 | |||||||||
| COMMON STOCK (Par Value: $0.01): |
||||||||||||
| Balance at beginning of year |
$ | 4,850 | $ | 4,427 | $ | 4,409 | ||||||
| Shares issued for restricted stock awards (2,099,865; 1,683,564; and 1,782,601, respectively) |
21 | 17 | 18 | |||||||||
| Shares issued in follow-on common stock offering (40,625,000 shares) |
— | 406 | — | |||||||||
|
|
|
|
|
|
|
|||||||
| Balance at end of year |
4,871 | 4,850 | 4,427 | |||||||||
|
|
|
|
|
|
|
|||||||
| PAID-IN CAPITAL IN EXCESS OF PAR: |
||||||||||||
| Balance at beginning of year |
6,023,882 | 5,369,623 | 5,346,017 | |||||||||
| Shares issued for restricted stock awards, net of forfeitures |
(8,985 | ) | (7,708 | ) | (7,073 | ) | ||||||
| Compensation expense related to restricted stock awards |
32,661 | 30,205 | 27,454 | |||||||||
| Proceeds from follow-on common stock offering, net |
— | 629,276 | — | |||||||||
| Tax effect of stock plans |
— | 2,486 | 3,225 | |||||||||
|
|
|
|
|
|
|
|||||||
| Balance at end of year |
6,047,558 | 6,023,882 | 5,369,623 | |||||||||
|
|
|
|
|
|
|
|||||||
| RETAINED EARNINGS (ACCUMULATED DEFICIT): |
||||||||||||
| Balance at beginning of year |
(36,568 | ) | 464,569 | 422,761 | ||||||||
| Net income (loss) |
495,401 | (47,156 | ) | 485,397 | ||||||||
| Dividends paid on common stock ($0.68; $1.00; and $1.00 per share) |
(330,810 | ) | (453,981 | ) | (442,204 | ) | ||||||
| Stock options exercised |
— | — | (82 | ) | ||||||||
| Effect of adopting Accounting Standards Update (“ASU”) No. 2016-09 (1) |
412 | — | — | |||||||||
| Effect of adopting ASU No. 2014-01 |
— | — | (1,303 | ) | ||||||||
|
|
|
|
|
|
|
|||||||
| Balance at end of year |
128,435 | (36,568 | ) | 464,569 | ||||||||
|
|
|
|
|
|
|
|||||||
| TREASURY STOCK: |
||||||||||||
| Balance at beginning of year |
(447 | ) | (1,118 | ) | (1,032 | ) | ||||||
| Purchase of common stock (566,584; 448,223; and 439,437 shares, respectively) |
(8,677 | ) | (7,020 | ) | (7,283 | ) | ||||||
| Exercise of stock options (8,990 shares) |
— | — | 142 | |||||||||
| Shares issued for restricted stock awards (580,087; 495,777; and 422,097 shares, respectively) |
8,964 | 7,691 | 7,055 | |||||||||
|
|
|
|
|
|
|
|||||||
| Balance at end of year |
(160 | ) | (447 | ) | (1,118 | ) | ||||||
|
|
|
|
|
|
|
|||||||
| ACCUMULATED OTHER COMPREHENSIVE LOSS, NET OF TAX: |
||||||||||||
| Balance at beginning of year |
(57,021 | ) | (55,686 | ) | (36,493 | ) | ||||||
| Other comprehensive income (loss), net of tax |
308 | (1,335 | ) | (19,193 | ) | |||||||
|
|
|
|
|
|
|
|||||||
| Balance at end of year |
(56,713 | ) | (57,021 | ) | (55,686 | ) | ||||||
|
|
|
|
|
|
|
|||||||
| Total stockholders’ equity |
$ | 6,123,991 | $ | 5,934,696 | $ | 5,781,815 | ||||||
|
|
|
|
|
|
|
|||||||
| (1) | See Note 2, “Summary of Significant Accounting Policies” for a discussion of the Company’s adoption of ASU No. 2016-09. |
See accompanying notes to the consolidated financial statements.
91
Table of Contents
NEW YORK COMMUNITY BANCORP, INC.
CONSOLIDATED STATEMENTS OF CASH FLOWS
| Years Ended December 31, | ||||||||||||
| (in thousands) | 2016 | 2015 | 2014 | |||||||||
| CASH FLOWS FROM OPERATING ACTIVITIES: |
||||||||||||
| Net income (loss) |
$ | 495,401 | $ | (47,156 | ) | $ | 485,397 | |||||
| Adjustments to reconcile net income to net cash provided by (used in) operating activities: |
||||||||||||
| Provision for (recoveries of) loan losses |
4,180 | (15,004 | ) | (18,587 | ) | |||||||
| Depreciation and amortization |
32,811 | 31,497 | 27,792 | |||||||||
| Amortization of discounts and premiums, net |
(26,258 | ) | (8,069 | ) | (8,293 | ) | ||||||
| Amortization of core deposit intangibles |
2,391 | 5,344 | 8,297 | |||||||||
| Net gain on sales of securities |
(3,347 | ) | (4,054 | ) | (14,029 | ) | ||||||
| Net gain on sales of loans |
(57,398 | ) | (65,649 | ) | (24,066 | ) | ||||||
| Gain on Visa shares sold |
— | — | (3,856 | ) | ||||||||
| Stock-based compensation |
32,661 | 30,205 | 27,454 | |||||||||
| Deferred tax expense (benefit) |
44,746 | (31,289 | ) | 26,151 | ||||||||
| Changes in operating assets and liabilities: |
||||||||||||
| Decrease (increase) in other assets |
326,790 | (196,899 | ) | 105,575 | ||||||||
| (Decrease) increase in other liabilities |
(4,336 | ) | 15,425 | (16,020 | ) | |||||||
| Origination of loans held for sale |
(4,646,773 | ) | (4,680,243 | ) | (3,189,694 | ) | ||||||
| Proceeds from sales of loans originated for sale |
4,554,785 | 4,545,466 | 3,316,296 | |||||||||
|
|
|
|
|
|
|
|||||||
| Net cash provided by (used in) operating activities |
755,653 | (420,426 | ) | 722,417 | ||||||||
|
|
|
|
|
|
|
|||||||
| CASH FLOWS FROM INVESTING ACTIVITIES: |
||||||||||||
| Proceeds from repayment of securities held to maturity |
2,499,205 | 940,580 | 775,347 | |||||||||
| Proceeds from repayment of securities available for sale |
50,192 | 9,889 | 9,787 | |||||||||
| Proceeds from sales of securities held to maturity |
1,297 | 44,104 | 139,294 | |||||||||
| Proceeds from sales of securities available for sale |
322,038 | 278,689 | 333,725 | |||||||||
| Purchase of securities held to maturity |
(213,208 | ) | (20,021 | ) | (150,338 | ) | ||||||
| Purchase of securities available for sale |
(279,402 | ) | (318,027 | ) | (226,000 | ) | ||||||
| Proceeds from sale of Visa shares |
— | — | 3,856 | |||||||||
| Redemption of Federal Home Loan Bank stock |
601,941 | 623,189 | 555,635 | |||||||||
| Purchase of Federal Home Loan Bank stock |
(528,904 | ) | (771,833 | ) | (509,572 | ) | ||||||
| Net increase in loans |
(2,826,365 | ) | (4,072,135 | ) | (3,482,686 | ) | ||||||
| Proceeds from sales of loans |
1,675,550 | 1,923,208 | 478,605 | |||||||||
| Purchase of premises and equipment, net |
(84,179 | ) | (34,802 | ) | (73,495 | ) | ||||||
|
|
|
|
|
|
|
|||||||
| Net cash provided by (used in) investing activities |
1,218,165 | (1,397,159 | ) | (2,145,842 | ) | |||||||
|
|
|
|
|
|
|
|||||||
| CASH FLOWS FROM FINANCING ACTIVITIES: |
||||||||||||
| Net increase in deposits |
461,145 | 98,024 | 2,667,742 | |||||||||
| Net increase (decrease) in short-term borrowed funds |
(3,256,300 | ) | 768,100 | (767,900 | ) | |||||||
| Proceeds from long-term borrowed funds |
1,181,000 | 11,243,500 | 50,000 | |||||||||
| Repayments of long-term borrowed funds |
— | (10,489,682 | ) | (160,615 | ) | |||||||
| Tax effect of stock plans (1) |
— | 2,486 | 3,225 | |||||||||
| Proceeds received from follow-on common stock offering, net |
629,682 | — | ||||||||||
| Cash dividends paid on common stock |
(330,810 | ) | (453,981 | ) | (442,204 | ) | ||||||
| Net cash received from stock option exercises |
— | — | 60 | |||||||||
| Payments relating to treasury shares received for restricted stock award tax payments (1) |
(8,677 | ) | (7,020 | ) | (7,283 | ) | ||||||
|
|
|
|
|
|
|
|||||||
| Net cash (used in) provided by financing activities |
(1,953,642 | ) | 1,791,109 | 1,343,025 | ||||||||
|
|
|
|
|
|
|
|||||||
| Net increase (decrease) in cash and cash equivalents |
20,176 | (26,476 | ) | (80,400 | ) | |||||||
| Cash and cash equivalents at beginning of year |
537,674 | 564,150 | 644,550 | |||||||||
|
|
|
|
|
|
|
|||||||
| Cash and cash equivalents at end of year |
$ | 557,850 | $ | 537,674 | $ | 564,150 | ||||||
|
|
|
|
|
|
|
|||||||
| Supplemental information: |
||||||||||||
| Cash paid for interest |
$ | 382,135 | $ | 540,818 | $ | 553,811 | ||||||
| Cash paid for income taxes |
180,238 | 187,608 | 247,589 | |||||||||
| Cash paid for prepayment penalties on borrowings |
— | 914,965 | — | |||||||||
| Non-cash investing and financing activities: |
||||||||||||
| Transfers to other real estate owned from loans |
$ | 20,099 | $ | 47,096 | $ | 86,545 | ||||||
| Transfer of loans from held for investment to held for sale |
1,659,743 | 1,897,075 | 654,758 | |||||||||
| Transfer of loans from held for sale to held for investment |
— | 153,578 | — | |||||||||
| Shares issued for restricted stock awards |
8,985 | 7,708 | 7,073 | |||||||||
| (1) | See Note 2, “Summary of Significant Accounting Policies” for a discussion of the Company’s adoption of ASU No. 2016-09. |
See accompanying notes to the consolidated financial statements.
92
Table of Contents
NOTE 1: ORGANIZATION AND BASIS OF PRESENTATION
Organization
New York Community Bancorp, Inc. (on a stand-alone basis, the “Parent Company” or, collectively with its subsidiaries, the “Company”) was organized under Delaware law on July 20, 1993 and is the holding company for New York Community Bank and New York Commercial Bank (hereinafter referred to as the “Community Bank” and the “Commercial Bank,” respectively, and collectively as the “Banks”). For the purpose of these Consolidated Financial Statements, the “Community Bank” and the “Commercial Bank” refer not only to the respective banks but also to their respective subsidiaries.
The Community Bank is the primary banking subsidiary of the Company, which was formerly known as Queens County Bancorp, Inc. Founded on April 14, 1859 and formerly known as Queens County Savings Bank, the Community Bank converted from a state-chartered mutual savings bank to the capital stock form of ownership on November 23, 1993, at which date the Company issued its initial offering of common stock (par value: $0.01 per share) at a price of $25.00 per share ($0.93 per share on a split-adjusted basis, reflecting the impact of nine stock splits between 1994 and 2004). The Commercial Bank was established on December 30, 2005.
Reflecting its growth through acquisitions, the Community Bank currently operates 225 branches, two of which operate directly under the Community Bank name. The remaining 223 Community Bank branches operate through seven divisional banks: Queens County Savings Bank, Roslyn Savings Bank, Richmond County Savings Bank, and Roosevelt Savings Bank in New York; Garden State Community Bank in New Jersey; AmTrust Bank in Florida and Arizona; and Ohio Savings Bank in Ohio.
The Commercial Bank currently operates 30 branches in Manhattan, Queens, Brooklyn, Westchester County, and Long Island (all in New York), including 18 branches that operate under the name “Atlantic Bank.”
Basis of Presentation
The following is a description of the significant accounting and reporting policies that the Company and its subsidiaries follow in preparing and presenting their consolidated financial statements, which conform to U.S. generally accepted accounting principles (“GAAP”) and to general practices within the banking industry. The preparation of financial statements in conformity with GAAP requires the Company to make estimates and judgments that affect the reported amounts of assets and liabilities and the disclosure of contingent assets and liabilities at the date of the consolidated financial statements, and the reported amounts of revenues and expenses during the reporting period. Estimates that are particularly susceptible to change in the near term are used in connection with the determination of the allowances for loan losses; the valuation of mortgage servicing rights (“MSRs”); the evaluation of goodwill for impairment; the evaluation of other-than-temporary impairment (“OTTI”) of securities; and the evaluation of the need for a valuation allowance on the Company’s deferred tax assets.
The accompanying consolidated financial statements include the accounts of the Company and other entities in which the Company has a controlling financial interest. All inter-company accounts and transactions are eliminated in consolidation. The Company currently has certain unconsolidated subsidiaries in the form of wholly-owned statutory business trusts, which were formed to issue guaranteed capital securities (“capital securities”). See Note 8, “Borrowed Funds,” for additional information regarding these trusts.
When necessary, certain reclassifications are made to prior-year amounts to conform to the current-year presentation. In the Consolidated Statements of Cash Flows for the years ended December 31, 2015 and 2014, Federal Home Loan Bank (“FHLB”) stock is presented on a gross basis to conform to the presentation for the year ended December 31, 2016.
93
Table of Contents
NOTE 2: SUMMARY OF SIGNIFICANT ACCOUNTING POLICIES
Cash and Cash Equivalents
For cash flow reporting purposes, cash and cash equivalents include cash on hand, amounts due from banks, and money market investments, which include federal funds sold and reverse repurchase agreements. At December 31, 2016 and 2015, the Company’s cash and cash equivalents totaled $557.9 million and $537.7 million, respectively. Included in cash and cash equivalents at those dates were $138.6 million and $119.2 million, respectively, of interest-bearing deposits in other financial institutions, primarily consisting of balances due from the Federal Reserve Bank of New York. Also included in cash and cash equivalents at December 31, 2016 and 2015 were federal funds sold of $6.8 million and $4.6 million, respectively. In addition, the Company had $250.0 million in pledged reverse repurchase agreements outstanding at December 31, 2016 and 2015.
In accordance with the monetary policy of the Board of Governors of the Federal Reserve System (the “FRB”), the Company was required to maintain total reserves with the Federal Reserve Bank of New York of $162.1 million and $158.3 million, respectively, at December 31, 2016 and 2015, in the form of deposits and vault cash. The Company was in compliance with this requirement at both dates.
Securities Held to Maturity and Available for Sale
The securities portfolio primarily consists of mortgage-related securities and, to a lesser extent, debt and equity (together, “other”) securities. Securities that are classified as “available for sale” are carried at their estimated fair value, with any unrealized gains or losses, net of taxes, reported as accumulated other comprehensive income or loss in stockholders’ equity. Securities that the Company has the intent and ability to hold to maturity are classified as “held to maturity” and carried at amortized cost, less the non-credit portion of OTTI recorded in accumulated other comprehensive loss (“AOCL”), net of tax.
The fair values of our securities—and particularly our fixed-rate securities—are affected by changes in market interest rates and credit spreads. In general, as interest rates rise and/or credit spreads widen, the fair value of fixed-rate securities will decline. As interest rates fall and/or credit spreads tighten, the fair value of fixed-rate securities will rise. We regularly conduct a review and evaluation of our securities portfolio to determine if the decline in the fair value of any security below its carrying amount is other than temporary. If we deem any such decline in value to be other than temporary, the security is written down to its current fair value, creating a new cost basis, and the resultant loss (other than the OTTI of debt securities attributable to non-credit factors) is charged against earnings and recorded in “Non-interest income.” Our assessment of a decline in fair value requires judgment as to the financial position and future prospects of the entity that issued the investment security, as well as a review of the security’s underlying collateral. Broad changes in the overall market or interest rate environment generally will not lead to a write-down.
In accordance with OTTI accounting guidance, unless we have the intent to sell, or it is more likely than not that we may be required to sell a security before recovery, OTTI is recognized as a realized loss in earnings to the extent that the decline in fair value is credit-related. If there is a decline in fair value of a security below its carrying amount and we have the intent to sell it, or it is more likely than not that we may be required to sell the security before recovery, the entire amount of the decline in fair value is charged to earnings.
Premiums and discounts on securities are amortized to expense and accreted to income over the remaining period to contractual maturity using a method that approximates the interest method, and are adjusted for anticipated prepayments. Dividend and interest income are recognized when earned. The cost of securities sold is based on the specific identification method.
Federal Home Loan Bank Stock
As a member of the FHLB of New York (the “FHLB-NY”), the Company is required to hold shares of FHLB-NY stock, which is carried at cost. The Company’s holding requirement varies based on certain factors, including its outstanding borrowings from the FHLB-NY. In connection with the FDIC-assisted acquisitions of AmTrust Bank (“AmTrust”) and Desert Hills Bank (“Desert Hills”), the Company acquired stock in the FHLBs of Cincinnati and San Francisco, all of which was redeemed in the fourth quarter of 2015. Accordingly, all of the Company’s FHLB stock was FHLB-NY stock at December 31, 2016 and 2015.
The Company conducts a periodic review and evaluation of its FHLB stock to determine if any impairment exists. The factors considered in this process include, among others, significant deterioration in FHLB earnings performance, credit rating, or asset quality; significant adverse changes in the regulatory or economic environment; and other factors that could raise significant concerns about the creditworthiness and the ability of the applicable FHLB to continue as a going concern.
94
Table of Contents
Loans
Loans, net, are carried at unpaid principal balances, including unearned discounts, purchase accounting (i.e., acquisition-date fair value) adjustments, net deferred loan origination costs or fees, and the allowances for loan losses.
Loans held for sale are originated by the Community Bank through its mortgage banking operation, and primarily are sold to government-sponsored enterprises (“GSEs”), with the servicing typically retained. The loans originated for sale by the mortgage banking operation are carried at fair value, which is primarily based on quoted market prices for securities backed by similar types of loans. The changes in fair value of these assets are largely driven by changes in mortgage interest rates subsequent to loan funding, and changes in the fair value of the servicing rights associated with the mortgage loans held for sale. In addition, loans originated as “held for investment” and subsequently designated as “held for sale” are transferred to held for sale at fair value.
The Company recognizes interest income on non-covered loans held for investment and held for sale using the interest method over the life of the loan. Accordingly, the Company defers certain loan origination and commitment fees, and certain loan origination costs, and amortizes the net fee or cost as an adjustment to the loan yield over the term of the related loan. When a loan is sold or repaid, the remaining net unamortized fee or cost is recognized in interest income.
Prepayment income on loans is recorded in interest income and only when cash is received. Accordingly, there are no assumptions involved in the recognition of prepayment income.
Two factors are considered in determining the amount of prepayment income: the prepayment penalty percentage set forth in the loan documents, and the principal balance of the loan at the time of prepayment. The volume of loans prepaying may vary from one period to another, often in connection with actual or perceived changes in the direction of market interest rates. When interest rates are declining, rising precipitously, or perceived to be on the verge of rising, prepayment income may increase as more borrowers opt to refinance and lock in current rates prior to further increases taking place.
A loan generally is classified as a “non-accrual” loan when it is 90 days or more past due or when it is deemed to be impaired because the Company no longer expects to collect all amounts due according to the contractual terms of the loan agreement. When a loan is placed on non-accrual status, management ceases the accrual of interest owed, and previously accrued interest is charged against interest income. A loan is generally returned to accrual status when the loan is current and management has reasonable assurance that the loan will be fully collectible. Interest income on non-accrual loans is recorded when received in cash.
Allowances for Loan Losses
Allowance for Losses on Non-Covered Loans
The allowance for losses on non-covered loans represents the Company’s estimate of probable and estimable losses inherent in the non-covered loan portfolio as of the date of the balance sheet. Losses on non-covered loans are charged against, and recoveries of losses on non-covered loans are credited back to, the allowance for losses on non-covered loans.
Although non-covered loans are held by either the Community Bank or the Commercial Bank, and a separate loan loss allowance is established for each, the total of the two allowances is available to cover all losses incurred. In addition, except as otherwise noted in the following discussion, the process for establishing the allowance for losses on non-covered loans is largely the same for each of the Community Bank and the Commercial Bank.
The methodology used for the allocation of the allowance for non-covered loan losses at December 31, 2016 and 2015 was generally comparable, whereby the Community Bank and the Commercial Bank segregated their loss factors (used for both criticized and non-criticized loans) into a component that was primarily based on historical loss rates and a component that was primarily based on other qualitative factors that are probable to affect loan collectability. In determining the respective allowances for non-covered loan losses, management considers the Community Bank’s and the Commercial Bank’s current business strategies and credit processes, including compliance with applicable regulatory guidelines and with guidelines approved by the respective Boards of Directors with regard to credit limitations, loan approvals, underwriting criteria, and loan workout procedures.
95
Table of Contents
The allowance for losses on non-covered loans is established based on management’s evaluation of incurred losses in the portfolio in accordance with GAAP, and is comprised of both specific valuation allowances and general valuation allowances.
Specific valuation allowances are established based on management’s analyses of individual loans that are considered impaired. If a non-covered loan is deemed to be impaired, management measures the extent of the impairment and establishes a specific valuation allowance for that amount. A non-covered loan is classified as “impaired” when, based on current information and/or events, it is probable that the Company will be unable to collect all amounts due under the contractual terms of the loan agreement. The Company applies this classification as necessary to non-covered loans individually evaluated for impairment in its portfolios. Smaller-balance homogenous loans and loans carried at the lower of cost or fair value are evaluated for impairment on a collective, rather than individual, basis. Loans to certain borrowers who have experienced financial difficulty and for which the terms have been modified, resulting in a concession, are considered troubled debt restructurings (“TDRs”) and are classified as impaired.
Management generally measures impairment on an individual loan and determines the extent to which a specific valuation allowance is necessary by comparing the loan’s outstanding balance to either the fair value of the collateral, less the estimated cost to sell, or the present value of expected cash flows, discounted at the loan’s effective interest rate. Generally, when the fair value of the collateral, net of the estimated costs to sell, or the present value of the expected cash flows is less than the recorded investment in the loan, any shortfall is promptly charged off.
Management also follows a process to assign general valuation allowances to non-covered loan categories. General valuation allowances are established by applying management’s loan loss provisioning methodology, and reflect the inherent risk in outstanding held-for-investment loans. This loan loss provisioning methodology considers various factors in determining the appropriate quantified risk factors to use to determine the general valuation allowances. The factors assessed begin with the historical loan loss experience for each major loan category. Management also takes into account an estimated historical loss emergence period (which is the period of time between the event that triggers a loss and the confirmation and/or charge-off of that loss) for each loan portfolio segment.
The allocation methodology consists of the following components: First, we determine an allowance for loan losses based on a quantitative loss factor for loans evaluated collectively for impairment. This quantitative loss factor is based primarily on historical loss rates, after considering loan type, historical loss and delinquency experience, and loss emergence periods. The quantitative loss factors applied in the methodology are periodically re-evaluated and adjusted to reflect changes in historical loss levels, loss emergence periods, or other risks. Lastly, management allocates an allowance for loan losses based on qualitative loss factors. These qualitative loss factors are designed to account for losses that may not be provided for by the quantitative loss component due to other factors evaluated by management, which include, but are not limited to:
| • | Changes in lending policies and procedures, including changes in underwriting standards and collection, charge-off, and recovery practices; |
| • | Changes in international, national, regional, and local economic and business conditions and developments that affect the collectability of the portfolio, including the condition of various market segments; |
| • | Changes in the nature and volume of the portfolio and in the terms of loans; |
| • | Changes in the volume and severity of past due loans, the volume of non-accrual loans, and the volume and severity of adversely classified or graded loans; |
| • | Changes in the quality of the Company’s loan review system; |
| • | Changes in the value of the underlying collateral for collateral-dependent loans; |
| • | The existence and effect of any concentrations of credit, and changes in the level of such concentrations; |
| • | Changes in the experience, ability, and depth of lending management and other relevant staff; and |
| • | The effect of other external factors, such as competition and legal and regulatory requirements, on the level of estimated credit losses in the existing portfolio. |
By considering the factors discussed above, management determines an allowance for non-covered loan losses that is applied to each significant loan portfolio segment to determine the total allowance for losses on non-covered loans.
96
Table of Contents
The Company uses a rolling 24-quarter look-back period to determine the allowance for loan losses on non-covered loans because it believes that this produces an appropriate reflection of its historical loss experience.
In order to determine their overall adequacy, each of the respective non-covered loan loss allowances is reviewed quarterly by management and the Board of Directors of the Community Bank or the Commercial Bank, as applicable.
Loans, or portions of loans, are charged off in the period that such loans, or portions thereof, are deemed uncollectible. The collectability of individual loans is determined through an assessment of the financial condition and repayment capacity of the borrower and/or through an estimate of the fair value of any underlying collateral. For non-real estate-related consumer credits, the following past-due time periods determine when charge-offs are typically recorded: (1) Closed-end credits are charged off in the quarter that the loan becomes 120 days past due; (2) Open-end credits are charged off in the quarter that the loan becomes 180 days past due; and (3) Both closed-end and open-end credits are typically charged off in the quarter that the credit is 60 days past the date the Company received notification that the borrower has filed for bankruptcy.
An allowance for unfunded commitments is maintained separate from the allowances for non-covered loan losses and is included in “Other liabilities” in the Consolidated Statements of Condition.
Allowance for Losses on Covered Loans
The Company has elected to account for the loans acquired in the AmTrust and Desert Hills acquisitions (the “covered loans”) based on expected cash flows. This election is in accordance with Financial Accounting Standards Board (“FASB”) Accounting Standards Codification (“ASC”) Topic 310-30, “Loans and Debt Securities Acquired with Deteriorated Credit Quality” (“ASC 310-30”). In accordance with ASC 310-30, the Company maintains the integrity of a pool of multiple loans accounted for as a single asset with a single composite interest rate and an aggregate expectation of cash flows.
Covered loans are reported exclusive of the FDIC loss share receivable. The covered loans acquired in the AmTrust and Desert Hills acquisitions are reviewed for collectability based on the expectations of cash flows from these loans. Covered loans have been aggregated into pools of loans with common characteristics. In determining the allowance for losses on covered loans, the Company periodically performs an analysis to estimate the expected cash flows for each of the loan pools. A provision for losses on covered loans is recorded to the extent that the expected cash flows from a loan pool have decreased for credit-related items since the acquisition date. Accordingly, during the loss share recovery period, if there is a decrease in expected cash flows due to an increase in estimated credit losses compared to the estimates made at the respective acquisition dates, the decrease in the present value of expected cash flows will be recorded as a provision for covered loan losses charged to earnings, and the allowance for covered loan losses will be increased. During the loss share recovery period, a related credit to non-interest income and an increase in the FDIC loss share receivable will be recognized at the same time, and will be measured based on the applicable loss sharing agreement percentage.
See Note 6, “Allowances for Loan Losses” for a further discussion of the allowances for losses on non-covered and covered loans.
FDIC Loss Share Receivable
The FDIC loss share receivable is initially recorded at fair value and is measured separately from the covered loans acquired in the AmTrust and Desert Hills acquisitions as it is not contractually embedded in any of the covered loans. The loss share receivable related to estimated future loan losses is not transferable should the Company sell a covered loan prior to foreclosure or maturity. The loss share receivable represents the present value of the estimated cash payments expected to be received from the FDIC for future losses on covered assets, based on the credit adjustment estimated for each covered asset and the applicable loss sharing percentages. These cash flows are then discounted at a market-based rate to reflect the uncertainty of the timing and receipt of the loss sharing reimbursements from the FDIC. The amount ultimately collected for this asset is dependent upon the performance of the underlying covered assets, the passage of time, and claims submitted to the FDIC.
The FDIC loss share receivable is reduced as losses are recognized on covered loans and loss sharing payments are received from the FDIC. Realized losses in excess of acquisition-date estimates will result in an increase in the FDIC loss share receivable. Conversely, if realized losses are lower than the acquisition-date estimates, the FDIC loss share receivable will be reduced.
97
Table of Contents
Decreases in estimated reimbursements from the FDIC, if any, are recognized in income prospectively over the lives of the related covered loans (or, if shorter, over the remaining term of the related loss sharing agreement). Related additions to the accretable yield on covered loans are recognized in income prospectively over the lives of the loans. Increases in estimated reimbursements will be recognized in interest income in the same period that they are identified, and an allowance for loan losses for the related loans recorded.
The Company’s FDIC loss sharing agreements pertaining to the remaining covered loans acquired in connection with the AmTrust and Desert Hills acquisitions are scheduled to expire in December 2019 and March 2020, respectively.
Goodwill Impairment
Goodwill is an asset representing the future economic benefits arising from other assets acquired in a business combination that are not individually identified and separately recognized.
ASC Topic 350 - Intangibles—Goodwill and Other (“ASC 350”) requires companies to test goodwill for impairment annually and more frequently if indicators of impairment exist. Testing goodwill for impairment requires companies to compare the fair value of a reporting unit with its carrying amount, including goodwill.
ASC 350 also provides for an optional qualitative assessment for testing goodwill for impairment that may allow companies to skip the annual two-step test. The qualitative assessment permits companies to assess whether it is more likely than not (i.e., a likelihood of greater than 50%) that the fair value of a reporting unit is less than its carrying amount. If the Company concludes based on the qualitative assessment that it is more likely than not that the fair value of a reporting unit is less than its carrying amount, the Company is required to perform the two-step test. If the Company concludes based on the qualitative assessment that it is not more likely than not that the fair value of a reporting unit is less than its carrying amount, it has completed its goodwill impairment test and does not need to perform the two-step test.
Under step one of the two-step test, the fair value of the reporting unit is compared with its carrying value (including goodwill). If the fair value of the reporting unit is less than its carrying value, an indication of goodwill impairment exists for the reporting unit and the entity must perform step two (measurement) of the impairment test. Under step two, an impairment loss is recognized for any excess of the carrying amount of the reporting unit’s goodwill over the implied fair value of that goodwill. The implied fair value of goodwill is determined by allocating the fair value of the reporting unit in a manner similar to a purchase price allocation, and the residual fair value after this allocation is the implied fair value of the reporting unit goodwill. Fair value of the reporting unit is determined using a discounted cash flow analysis. If the fair value of the reporting unit exceeds its carrying value, step two does not need to be performed.
The Company performs its annual impairment review of goodwill at December 31st, and when a triggering event occurs between annual impairment tests. No impairment losses were recorded in 2016, 2015, or 2014.
Core Deposit Intangibles
Core deposit intangible (“CDI”) is a measure of the value of checking and savings deposits acquired in a business combination. The fair value of the CDI stemming from any given business combination is based on the present value of the expected cost savings attributable to the core deposit funding, relative to an alternative funding source. CDI is amortized over the estimated useful lives of the existing deposit relationships acquired, but does not exceed 10 years. The Company evaluates such identifiable intangibles for impairment when an indication of impairment exists. No impairment charges were required to be recorded on the Company’s CDI in 2016, 2015, or 2014. If an impairment loss is determined to exist in the future, the loss will be reflected as an expense in the Consolidated Statement of Operations and Comprehensive Income (Loss) for the period in which such impairment is identified.
Premises and Equipment, Net
Premises, furniture, fixtures, and equipment are carried at cost, less the accumulated depreciation computed on a straight-line basis over the estimated useful lives of the respective assets (generally 20 years for premises and three to ten years for furniture, fixtures, and equipment). Leasehold improvements are carried at cost less the accumulated amortization computed on a straight-line basis over the shorter of the related lease term or the estimated useful life of the improvement.
98
Table of Contents
Depreciation and amortization are included in “Occupancy and equipment expense” in the Consolidated Statements of Operations and Comprehensive Income (Loss), and amounted to $32.8 million, $31.5 million, and $27.8 million, respectively, in the years ended December 31, 2016, 2015, and 2014.
Mortgage Servicing Rights
The Company recognizes the right to service mortgage loans for others as a separate asset referred to as “mortgage servicing rights,” or “MSRs.” MSRs are generally recognized when loans are sold whole or in part (i.e., as a “participation”), servicing retained. Both of the Company’s two classes of MSRs (i.e., residential and participation) are initially recorded at fair value. While residential MSRs continue to be carried at fair value, participation MSRs are subsequently amortized and carried at the lower of their fair value or amortized amount on a quarterly basis. The amortization is recorded in proportion to, and over the period of, estimated net servicing income.
The Company bases the fair value of its MSRs on a valuation performed by a third-party valuation specialist. The specialist determines fair value based on the present value of estimated future net servicing income cash flows, and incorporates assumptions that market participants would use to estimate fair value, including estimates of prepayment speeds, discount rates, default rates, refinance rates, servicing costs, escrow account earnings, contractual servicing fee income, and ancillary income. The specialist and the Company evaluate, and periodically adjust, as necessary, these underlying inputs and assumptions to reflect market conditions and changes in the assumptions that a market participant would consider in valuing MSRs.
Changes in the fair value of MSRs occur primarily in connection with the collection/realization of expected cash flows, as well as changes in the valuation inputs and assumptions. Changes in the fair value of residential MSRs are reported in “Mortgage banking income” and changes in the value of participation MSRs are reported in “Other income” in the period during which such changes occur.
See Note 11, “Intangible Assets,” for additional information regarding the Company’s residential and participation MSRs.
Offsetting Derivative Positions
In accordance with the applicable accounting guidance, the Company takes into account the impact of collateral and master netting agreements that allow it to settle all derivative contracts held with a single counterparty on a net basis, and to offset the net derivative position with the related collateral when recognizing derivative assets and liabilities. As a result, the Company’s Consolidated Statements of Condition reflect derivative contracts with negative fair values that are included in derivative assets, and contracts with positive fair values that are included in derivative liabilities, on a net basis.
Bank-Owned Life Insurance
The Company has purchased life insurance policies on certain employees. These bank-owned life insurance (“BOLI”) policies are recorded in the Consolidated Statements of Condition at their cash surrender value. Income from these policies and changes in the cash surrender value are recorded in “Non-interest income” in the Consolidated Statements of Operations and Comprehensive Income (Loss). At December 31, 2016 and 2015, the Company’s investment in BOLI was $949.0 million and $931.6 million, respectively. There were no additional purchases of BOLI during the years ended December 31, 2016 or 2015. The Company’s investment in BOLI generated income of $31.0 million, $27.5 million, and $27.2 million, respectively, during the years ended December 31, 2016, 2015, and 2014.
Other Real Estate Owned
Real estate properties acquired through, or in lieu of, foreclosure are sold or rented, and are recorded at fair value, less the estimated selling costs, at the date of acquisition. Following foreclosure, management periodically performs a valuation of the property, and the real estate is carried at the lower of the carrying amount or fair value, less the estimated selling costs. Expenses and revenues from operations and changes in valuation, if any, are included in “General and administrative” expense in the Consolidated Statements of Operations and Comprehensive Income (Loss). At December 31, 2016 and 2015, respectively, the Company had other real estate owned (“OREO”) of $28.6 million and $39.9 million, including OREO of $17.0 million and $25.8 million that is covered under the Company’s FDIC loss sharing agreements.
99
Table of Contents
Income Taxes
Income tax expense consists of income taxes that are currently payable and deferred income taxes. Deferred income tax expense is determined by recognizing deferred tax assets and liabilities for future tax consequences attributable to temporary differences between the financial statement carrying amounts of existing assets and liabilities and their respective tax bases. Deferred tax assets and liabilities are measured using enacted tax rates that are expected to apply to taxable income in years in which those temporary differences are expected to be recovered or settled. The Company assesses the deferred tax assets and establishes a valuation allowance when realization of a deferred asset is not considered to be “more likely than not.” The Company considers its expectation of future taxable income in evaluating the need for a valuation allowance.
The Company estimates income taxes payable based on the amount it expects to owe the various tax authorities (i.e., federal, state, and local). Income taxes represent the net estimated amount due to, or to be received from, such tax authorities. In estimating income taxes, management assesses the relative merits and risks of the appropriate tax treatment of transactions, taking into account statutory, judicial, and regulatory guidance in the context of the Company’s tax position. In this process, management also relies on tax opinions, recent audits, and historical experience. Although the Company uses the best available information to record income taxes, underlying estimates and assumptions can change over time as a result of unanticipated events or circumstances such as changes in tax laws and judicial guidance influencing its overall tax position.
Stock-Based Compensation
Under the New York Community Bancorp, Inc. 2012 Stock Incentive Plan (the “2012 Stock Incentive Plan”), which was approved by the Company’s shareholders at its Annual Meeting on June 7, 2012, shares are available for grant as restricted stock or other forms of related rights. At December 31, 2016, the Company had 9,646,760 shares available for grant under the 2012 Stock Incentive Plan, including 1,030,673 shares that were transferred from the New York Community Bancorp, Inc. 2006 Stock Incentive Plan (the “2006 Stock Incentive Plan”), which was approved by the Company’s shareholders at its Annual Meeting on June 7, 2006 and reapproved at its Annual Meeting on June 2, 2011. Compensation cost related to restricted stock grants is recognized on a straight-line basis over the vesting period. For a more detailed discussion of the Company’s stock-based compensation, see Note 13, “Stock-Related Benefit Plans.”
Retirement Plans
The Company’s pension benefit obligations and post-retirement health and welfare benefit obligations, and the related costs, are calculated using actuarial concepts in accordance with GAAP. The measurement of such obligations and expenses requires that certain assumptions be made regarding several factors, most notably including the discount rate and the expected rate of return on plan assets. The Company evaluates these critical assumptions on an annual basis. Other factors considered by the Company in its evaluation include retirement patterns, mortality rates, turnover, and the rate of compensation increase.
Under GAAP, actuarial gains and losses, prior service costs or credits, and any remaining transition assets or obligations that have not been recognized under previous accounting standards must be recognized in AOCL until they are amortized as a component of net periodic benefit cost.
Earnings (Loss) per Share (Basic and Diluted)
Basic earnings (loss) per share (“EPS”) is computed by dividing net income (loss) by the weighted average number of common shares outstanding during the period. Diluted EPS is computed using the same method as basic EPS, however, the computation reflects the potential dilution that would occur if outstanding in-the-money stock options were exercised and converted into common stock.
Unvested stock-based compensation awards containing non-forfeitable rights to dividends are considered participating securities, and therefore are included in the two-class method for calculating EPS. Under the two-class method, all earnings (distributed and undistributed) are allocated to common shares and participating securities based on their respective rights to receive dividends. The Company grants restricted stock to certain employees under its stock-based compensation plans. Recipients receive cash dividends during the vesting periods of these awards, including on the unvested portion of such awards. Since these dividends are non-forfeitable, the unvested awards are considered participating securities and therefore have earnings allocated to them.
100
Table of Contents
The following table presents the Company’s computation of basic and diluted earnings (loss) per share for the years ended December 31, 2016, 2015, and 2014:
| Years Ended December 31, | ||||||||||||
| (in thousands, except share and per share amounts) | 2016 | 2015 | 2014 | |||||||||
| Net income (loss) |
$ | 495,401 | $ | (47,156 | ) | $ | 485,397 | |||||
| Less: Dividends paid on and earnings/(loss) allocated to participating securities |
(3,795 | ) | (3,357 | ) | (3,425 | ) | ||||||
|
|
|
|
|
|
|
|||||||
| Earnings/(loss) applicable to common stock |
$ | 491,606 | $ | (50,513 | ) | $ | 481,972 | |||||
|
|
|
|
|
|
|
|||||||
| Weighted average common shares outstanding |
485,150,173 | 448,982,223 | 440,988,102 | |||||||||
|
|
|
|
|
|
|
|||||||
| Basic earnings (loss) per common share |
$ | 1.01 | $ | (0.11 | ) | $ | 1.09 | |||||
|
|
|
|
|
|
|
|||||||
| Earnings (loss) applicable to common stock |
$ | 491,606 | $ | (50,513 | ) | $ | 481,972 | |||||
|
|
|
|
|
|
|
|||||||
| Weighted average common shares outstanding |
485,150,173 | 448,982,223 | 440,988,102 | |||||||||
| Potential dilutive common shares (1) |
— | — | — | |||||||||
|
|
|
|
|
|
|
|||||||
| Total shares for diluted earnings (loss) per share computation |
485,150,173 | 448,982,223 | 440,988,102 | |||||||||
|
|
|
|
|
|
|
|||||||
| Diluted earnings (loss) per common share and common share equivalents |
$ | 1.01 | $ | (0.11 | ) | $ | 1.09 | |||||
|
|
|
|
|
|
|
|||||||
| (1) | Options to purchase 58,560 shares of the Company’s common stock that were outstanding as of December 31, 2014 at a weighted average exercise price of $18.04 were excluded from the computation of diluted EPS because their inclusion would have had an antidilutive effect. At December 31, 2016 and 2015, there were no stock options outstanding. |
Impact of Recent Accounting Pronouncements
In January 2017, the Financial Accounting Standards Board (“FASB”) issued Accounting Standards Update (“ASU”) No. 2017-04, “Intangibles—Goodwill and Other (“Topic 350”): Simplifying the Test for Goodwill Impairment.” Topic 350 currently requires an entity to perform a two-step test to determine the amount, if any, of goodwill impairment. In Step one, an entity compares the fair value of a reporting unit with its carrying amount, including goodwill. If the carrying amount of the reporting unit exceeds its fair value, the entity performs Step two and compares the implied fair value of goodwill with the carrying amount of that goodwill for that reporting unit. An impairment charge equal to the amount by which the carrying amount of goodwill for the reporting unit exceeds the implied fair value of that goodwill is recorded, limited to the amount of goodwill allocated to that reporting unit.
To address concerns over the cost and complexity of the two-step goodwill impairment test, the amendments in ASU No. 2017-04 remove the second step of the test. An entity will apply a one-step quantitative test and record the amount of goodwill impairment as the excess of a reporting unit’s carrying amount over its fair value, not to exceed the total amount of goodwill allocated to the reporting unit. ASU No. 2017-04 does not amend the optional qualitative assessment of goodwill impairment. An entity should apply the amendments in ASU No. 2017-04 on a prospective basis. An entity is required to disclose the nature of, and reason for, the change in accounting principle upon transition. That disclosure should be provided in the first annual period and in the interim period within the first annual period when the entity initially adopts ASU No. 2017-04. ASU No. 2017-04 is effective for fiscal years beginning after December 15, 2019. Early adoption is permitted for interim or annual goodwill impairment tests performed on testing dates after January 1, 2017. The adoption of ASU No. 2017-04 is not expected to have a material effect on the Company’s consolidated statements of condition, results of operations, or cash flows.
In August 2016, the FASB issued ASU No. 2016-15, “Statement of Cash Flows (Topic 230): Classification of Certain Cash Receipts and Cash Payments.” ASU No. 2016-15 addresses the following eight specific cash flow issues: debt prepayment or debt extinguishment costs; settlement of zero-coupon debt instruments or other debt instruments with coupon interest rates that are insignificant in relation to the effective interest rate of the borrowing; contingent consideration payments made after a business combination; proceeds from the settlement of insurance claims; proceeds from the settlement of corporate-owned life insurance policies (including bank-owned life insurance policies); distributions received from equity method investees; beneficial interests in securitization transactions; and separately identifiable cash flows and application of the predominance principle. ASU No. 2016-15 is effective for fiscal years beginning after December 15, 2017 and interim periods within those fiscal years. Early adoption is permitted, including adoption in an interim period. ASU No. 2016-15 should be applied using a retrospective transition method to each period presented. The Company does not expect to early adopt ASU No. 2016-15 and its adoption is not expected to have a material effect on the Company’s consolidated statements of condition, results of operations, or cash flows.
101
Table of Contents
In June 2016, the FASB issued ASU No. 2016-13, “Financial Instruments—Credit Losses (Topic 326): Measurement of Credit Losses on Financial Instruments.” ASU No. 2016-13 amends guidance on reporting credit losses for assets held on an amortized cost basis and available-for-sale debt securities. For assets held at amortized cost, ASU No. 2016-13 eliminates the probable initial recognition threshold in current GAAP and, instead, requires an entity to reflect its current estimate of all expected credit losses. The allowance for credit losses is a valuation account that is deducted from the amortized cost basis of the financial assets to present the net amount expected to be collected. For available-for-sale debt securities, credit losses should be measured in a manner similar to current GAAP, however ASU No. 2016-13 will require that credit losses be presented as an allowance rather than as a write-down. ASU No. 2016-13 affects entities holding financial assets and net investments in leases that are not accounted for at fair value through net income. The amendments affect loans, debt securities, trade receivables, net investments in leases, off-balance sheet credit exposures, reinsurance receivables, and any other financial assets not excluded from the scope that have the contractual right to receive cash. The Company plans to adopt ASU No. 2016-13 effective January 1, 2020, using the required modified retroactive approach which includes presenting the cumulative effect of initial application along with supplementary disclosures. The Company is evaluating ASU No. 2016-13, initiating implementation efforts across the Company, and planning for loss modeling requirements consistent with lifetime expected loss estimates. The adoption of ASU No. 2016-13 could have a material effect on the Company’s consolidated statements of condition and results of operations. The extent of the impact upon adoption will likely depend on the characteristics of the Company’s loan portfolio and economic conditions at that date, as well as forecasted conditions thereafter.
In March 2016, the FASB issued ASU No. 2016-09, “Compensation—Stock Compensation (Topic 718): Improvements to Employee Share-Based Payment Accounting.” ASU No. 2016-09 simplifies several aspects of the accounting for share-based payment transactions, including the income tax consequences, classification of awards as either equity or liabilities, classification on the statement of cash flows, and accounting for forfeitures. The Company adopted ASU No. 2016-09 prospectively, effective for the first quarter of 2016. Upon adoption, the Company recorded an immaterial cumulative-effect adjustment to the opening balance of retained earnings. In addition, ASU No. 2016-09 requires that excess tax benefits and shortfalls be recorded as income tax benefit or expense in the income statement, rather than as equity. This resulted in an immaterial benefit to income tax expense in the first quarter of 2016. Relative to forfeitures, ASU No. 2016-09 allows an entity’s accounting policy election to either continue to estimate the number of awards that are expected to vest, as under current guidance, or account for forfeitures when they occur. The Company has elected to continue its existing practice of estimating the number of awards that will be forfeited. The income tax effects of ASU No. 2016-09 on the statement of cash flows are now classified as cash flows from operating activities, rather than cash flows from financing activities. The Company elected to apply this cash flow classification guidance prospectively and, therefore, prior periods have not been adjusted. ASU No. 2016-09 also requires the presentation of certain employee withholding taxes as a financing activity on the Consolidated Statement of Cash Flows; this is consistent with the manner in which the Company has presented such employee withholding taxes in the past. Accordingly, no reclassification for prior periods was required.
In February 2016, the FASB issued ASU No. 2016-02, “Leases (Topic 842).” ASU No. 2016-02 will require organizations that lease assets (hereinafter referred to as “lessees”) to recognize as assets and liabilities on the balance sheet the respective rights and obligations created by those leases. Under ASU No. 2016-02, a lessee will be required to recognize assets and liabilities for leases with lease terms of more than twelve months. ASU No. 2016-02 also will require disclosures to help investors and other financial statement users better understand the amount, timing, and uncertainty of cash flows arising from leases. These disclosures include qualitative and quantitative requirements, providing additional information about the amounts recorded in the financial statements. The Company plans to adopt ASU No. 2016-02 effective January 1, 2019 using the required modified retroactive approach, which includes presenting the cumulative effect of initial application along with supplementary disclosures. As a lessor and lessee, we do not anticipate the classification of our leases to change, but we expect to recognize substantially all of our leases for which we are the lessee as a lease liability and corresponding right-of-use asset on our consolidated statements of condition. The Company has assembled a project management team and is presently evaluating all of its leases as well as contracts that may contain embedded leases for compliance with the new lease accounting rules.
102
Table of Contents
In January 2016, the FASB issued ASU No. 2016-01, “Financial Instruments—Overall (Subtopic 825-10): Recognition and Measurement of Financial Assets and Financial Liabilities.” The amendments in ASU No. 2016-01 require all equity investments to be measured at fair value, with changes in fair value recognized through net income (other than those accounted for under the equity method of accounting or those resulting in consolidation of the investee). The amendments in ASU No. 2016-01 also require an entity to present separately in “Other comprehensive income” the portion of the total change in the fair value of a liability resulting from a change in the instrument-specific credit risk when the entity has elected to measure the liability at fair value in accordance with the fair value option for financial instruments. In addition, the amendments in ASU No. 2016-01 eliminate the requirement to disclose the method(s) and significant assumptions used to estimate the fair value that is required to be disclosed for financial instruments measured at amortized cost on the balance sheet for public business entities. In addition, ASU No. 2016-01 is the final version of proposed ASU No. 2013-220—Financial Instruments—Overall (Subtopic 825-10) and Proposed ASU No. 2013-221—Financial Instruments—Overall (Subtopic 825-10). ASU No. 2016-01 is effective for fiscal years beginning after December 15, 2017, including interim periods within those fiscal years. The adoption of ASU No. 2016-01 is not expected to have a material effect on the Company’s consolidated statements of condition or results of operations.
In August 2014, the FASB issued ASU No. 2014-15, “Presentation of Financial Statements – Going Concern (Subtopic 205-40): Disclosures of Uncertainties about an Entity’s Ability to continue as a Going Concern.” ASU No. 2014-15 provides guidance about management’s responsibility to evaluate whether there is substantial doubt about an entity’s ability to continue as a going concern and to provide related footnote disclosures if management concludes that substantial doubts exists or that its plans alleviate substantial doubt that was raised. The Company adopted ASU No. 2014-15 for the year ended December 31, 2016, with no impact to its financial statements and concluded that there were no conditions or events that raise substantial doubt about the Company’s ability to continue as a going concern.
In May 2014, the FASB issued ASU No. 2014-09, “Revenue from Contracts with Customers,” which supersedes the revenue recognition requirements in Topic 605, “Revenue Recognition,” including most industry-specific revenue recognition guidance throughout the Industry Topics of the ASC. In addition, the amendments supersede the cost guidance in Subtopic 605-35, “Revenue Recognition—Construction-Type and Production-Type Contracts,” and create new Subtopic 340-40, “Other Assets and Deferred Costs—Contracts with Customers.” In summary, the core principle of ASU No. 2014-09 is that an entity recognizes revenue to depict the transfer of promised goods or services to customers in an amount that reflects the consideration to which the entity expects to be entitled in exchange for those goods or services. The Company will adopt ASU No. 2014-09 effective January 1, 2018 using the modified retrospective approach, which includes presenting the cumulative effect of initial application along with supplementary disclosures. ASU No. 2014-09 does not apply to the majority of our revenue streams. The Company is in the process of comparing our current revenue recognition policies to the requirements of ASU No. 2014-09 for those revenue streams that do fall under ASU No. 2014-09. While we have not identified any material differences in the amount and timing of revenue recognition for the revenue streams we have reviewed to date, our evaluation is not complete, and we have not concluded our determination of the overall impact of adopting ASU No. 2014-09. ASU No. 2014-09 will require that our revenue recognition policy disclosures include further detail regarding our performance obligations as to the nature, amount, timing, and estimates of revenue and cash flows generated from our contracts with customers that fall under the requirements of ASU No. 2014-09.
103
Table of Contents
NOTE 3: RECLASSIFICATIONS OUT OF ACCUMULATED OTHER COMPREHENSIVE LOSS
| (in thousands) | For the Twelve Months Ended December 31, 2016 | |||||
| Details about Accumulated Other Comprehensive Loss |
Amount Reclassified from Accumulated Other Comprehensive Loss (1) |
Affected Line Item in the Consolidated Statement of Operations and Comprehensive Income (Loss) | ||||
| Unrealized gains on available-for-sale securities |
$ | 2,704 | Net gain on sales of securities | |||
| (1,127 | ) | Tax expense | ||||
|
|
|
|||||
| $ | 1,577 | Net gain on sales of securities, net of tax | ||||
|
|
|
|||||
| Amortization of defined benefit pension plan items: |
||||||
| Past service liability |
$ | 249 | Included in the computation of net periodic (credit) expense (2) | |||
| Actuarial losses |
(9,376 | ) | Included in the computation of net periodic (credit) expense (2) | |||
|
|
|
|||||
| (9,127 | ) | Total before tax | ||||
| 3,804 | Tax benefit | |||||
|
|
|
|||||
| $ | (5,323 | ) | Amortization of defined benefit pension plan items, net of tax | |||
|
|
|
|||||
| Total reclassifications for the period |
$ | (3,746 | ) | |||
|
|
|
|||||
| (1) | Amounts in parentheses indicate expense items. |
| (2) | See Note 12, “Employee Benefits,” for additional information. |
NOTE 4: SECURITIES
The following tables summarize the Company’s portfolio of securities available for sale at December 31, 2016 and 2015:
| December 31, 2016 | ||||||||||||||||
| (in thousands) | Amortized Cost |
Gross Unrealized Gain |
Gross Unrealized Loss |
Fair Value | ||||||||||||
| Mortgage-Related Securities: |
||||||||||||||||
| GSE(1) certificates |
$ | 7,786 | $ | — | $ | 460 | $ | 7,326 | ||||||||
|
|
|
|
|
|
|
|
|
|||||||||
| Other Securities: |
||||||||||||||||
| Municipal bonds |
$ | 583 | $ | 48 | $ | — | $ | 631 | ||||||||
| Capital trust notes |
9,458 | 2 | 2,217 | 7,243 | ||||||||||||
| Preferred stock |
70,866 | 1,446 | 328 | 71,984 | ||||||||||||
| Mutual funds and common stock (2) |
16,874 | 484 | 261 | 17,097 | ||||||||||||
|
|
|
|
|
|
|
|
|
|||||||||
| Total other securities |
$ | 97,781 | $ | 1,980 | $ | 2,806 | $ | 96,955 | ||||||||
|
|
|
|
|
|
|
|
|
|||||||||
| Total securities available for sale |
$ | 105,567 | $ | 1,980 | $ | 3,266 | $ | 104,281 | ||||||||
|
|
|
|
|
|
|
|
|
|||||||||
| (1) | Government-sponsored enterprise. |
| (2) | Primarily consists of mutual funds that are Community Reinvestment Act-qualified investments. |
104
Table of Contents
| December 31, 2015 | ||||||||||||||||
| (in thousands) | Amortized Cost |
Gross Unrealized Gain |
Gross Unrealized Loss |
Fair Value | ||||||||||||
| Mortgage-Related Securities: |
||||||||||||||||
| GSE certificates |
$ | 53,820 | $ | 33 | $ | 1 | $ | 53,852 | ||||||||
|
|
|
|
|
|
|
|
|
|||||||||
| Other Securities: |
||||||||||||||||
| Municipal bonds |
$ | 725 | $ | 70 | $ | — | $ | 795 | ||||||||
| Capital trust notes |
9,444 | — | 2,480 | 6,964 | ||||||||||||
| Preferred stock |
118,205 | 7,415 | 248 | 125,372 | ||||||||||||
| Mutual funds and common stock |
16,877 | 470 | 75 | 17,272 | ||||||||||||
|
|
|
|
|
|
|
|
|
|||||||||
| Total other securities |
$ | 145,251 | $ | 7,955 | $ | 2,803 | $ | 150,403 | ||||||||
|
|
|
|
|
|
|
|
|
|||||||||
| Total securities available for sale |
$ | 199,071 | $ | 7,988 | $ | 2,804 | $ | 204,255 | ||||||||
|
|
|
|
|
|
|
|
|
|||||||||
The following tables summarize the Company’s portfolio of securities held to maturity at December 31, 2016 and 2015:
| December 31, 2016 | ||||||||||||||||||||
| (in thousands) | Amortized Cost |
Carrying Amount |
Gross Unrealized Gain |
Gross Unrealized Loss |
Fair Value | |||||||||||||||
| Mortgage-Related Securities: |
||||||||||||||||||||
| GSE certificates |
$ | 2,193,489 | $ | 2,193,489 | $ | 64,431 | $ | 2,399 | $ | 2,255,521 | ||||||||||
| GSE CMOs (1) |
1,019,074 | 1,019,074 | 36,895 | 57 | 1,055,912 | |||||||||||||||
|
|
|
|
|
|
|
|
|
|
|
|||||||||||
| Total mortgage-related securities |
$ | 3,212,563 | $ | 3,212,563 | $ | 101,326 | $ | 2,456 | $ | 3,311,433 | ||||||||||
|
|
|
|
|
|
|
|
|
|
|
|||||||||||
| Other Securities: |
||||||||||||||||||||
| U. S. Treasury obligations |
$ | 200,293 | $ | 200,293 | $ | — | $ | 73 | $ | 200,220 | ||||||||||
| GSE debentures |
88,457 | 88,457 | 3,836 | — | 92,293 | |||||||||||||||
| Corporate bonds |
74,217 | 74,217 | 9,549 | — | 83,766 | |||||||||||||||
| Municipal bonds |
71,554 | 71,554 | — | 1,789 | 69,765 | |||||||||||||||
| Capital trust notes |
74,284 | 65,692 | 2,662 | 11,872 | 56,482 | |||||||||||||||
|
|
|
|
|
|
|
|
|
|
|
|||||||||||
| Total other securities |
$ | 508,805 | $ | 500,213 | $ | 16,047 | $ | 13,734 | $ | 502,526 | ||||||||||
|
|
|
|
|
|
|
|
|
|
|
|||||||||||
| Total securities held to maturity (2) |
$ | 3,721,368 | $ | 3,712,776 | $ | 117,373 | $ | 16,190 | $ | 3,813,959 | ||||||||||
|
|
|
|
|
|
|
|
|
|
|
|||||||||||
| (1) | Collateralized mortgage obligations. |
| (2) | Held-to-maturity securities are reported at a carrying amount equal to amortized cost less the non-credit portion of OTTI recorded in AOCL. At December 31, 2016, the non-credit portion of OTTI recorded in AOCL was $8.6 million (before taxes). |
| December 31, 2015 | ||||||||||||||||||||
| (in thousands) | Amortized Cost |
Carrying Amount |
Gross Unrealized Gain |
Gross Unrealized Loss |
Fair Value | |||||||||||||||
| Mortgage-Related Securities: |
||||||||||||||||||||
| GSE certificates |
$ | 2,269,828 | $ | 2,269,828 | $ | 76,827 | $ | 4,722 | $ | 2,341,933 | ||||||||||
| GSE CMOs |
1,325,033 | 1,325,033 | 53,236 | 57 | 1,378,212 | |||||||||||||||
|
|
|
|
|
|
|
|
|
|
|
|||||||||||
| Total mortgage-related securities |
$ | 3,594,861 | $ | 3,594,861 | $ | 130,063 | $ | 4,779 | $ | 3,720,145 | ||||||||||
|
|
|
|
|
|
|
|
|
|
|
|||||||||||
| Other Securities: |
||||||||||||||||||||
| GSE debentures |
$ | 2,159,856 | $ | 2,159,856 | $ | 23,892 | $ | 7,568 | $ | 2,176,180 | ||||||||||
| Corporate bonds |
73,756 | 73,756 | 10,503 | — | 84,259 | |||||||||||||||
| Municipal bonds |
75,317 | 75,317 | 262 | 1,084 | 74,495 | |||||||||||||||
| Capital trust notes |
74,317 | 65,600 | 3,750 | 15,900 | 53,450 | |||||||||||||||
|
|
|
|
|
|
|
|
|
|
|
|||||||||||
| Total other securities |
$ | 2,383,246 | $ | 2,374,529 | $ | 38,407 | $ | 24,552 | $ | 2,388,384 | ||||||||||
|
|
|
|
|
|
|
|
|
|
|
|||||||||||
| Total securities held to maturity (1) |
$ | 5,978,107 | $ | 5,969,390 | $ | 168,470 | $ | 29,331 | $ | 6,108,529 | ||||||||||
|
|
|
|
|
|
|
|
|
|
|
|||||||||||
| (1) | Held-to-maturity securities are reported at a carrying amount equal to amortized cost less the non-credit portion of OTTI recorded in AOCL. At December 31, 2015, the non-credit portion of OTTI recorded in AOCL was $8.7 million (before taxes). |
105
Table of Contents
At December 31, 2016 and 2015, respectively, the Company had $590.9 million and $664.0 million of FHLB stock, at cost, consisting entirely of stock in the FHLB-NY. The Company is required to maintain an investment in FHLB-NY stock in order to have access to the funding it provides.
The following table summarizes the gross proceeds, gross realized gains, and gross realized losses from the sale of available-for-sale securities during the years ended December 31, 2016, 2015, and 2014:
| December 31, | ||||||||||||
| (in thousands) | 2016 | 2015 | 2014 | |||||||||
| Gross proceeds |
$ | 322,038 | $ | 278,689 | $ | 333,725 | ||||||
| Gross realized gains |
3,128 | 1,159 | 6,186 | |||||||||
| Gross realized losses |
— | 4 | — | |||||||||
In addition, during the twelve months ended December 31, 2016, the Company sold held-to-maturity securities with gross proceeds of $1.3 million and realized gains of $219,000. During the twelve months ended December 31, 2015, the Company sold held-to-maturity securities with gross proceeds of $44.1 million and realized gains of $2.9 million. All of the held-to-maturity securities sold in 2016 and 2015 were securities on which the Company had collected a substantial portion (at least 85%) of the initial principal balance.
In the following table, the beginning balance represents the credit loss component for debt securities on which OTTI occurred prior to January 1, 2016. For credit-impaired debt securities, OTTI recognized in earnings after that date is presented as an addition in two components, based upon whether the current period is the first time a debt security was credit-impaired (initial credit impairment) or is not the first time a debt security was credit-impaired (subsequent credit impairment).
| (in thousands) | For the Twelve Months Ended December 31, 2016 |
|||
| Beginning credit loss amount as of December 31, 2015 |
$ | 198,766 | ||
| Add: Initial other-than-temporary credit losses |
— | |||
| Subsequent other-than-temporary credit losses |
— | |||
| Amount previously recognized in AOCL |
— | |||
| Less: Realized losses for securities sold |
— | |||
| Securities intended or required to be sold |
— | |||
| Increase in cash flows on debt securities |
1,214 | |||
|
|
|
|||
| Ending credit loss amount as of December 31, 2016 |
$ | 197,552 | ||
|
|
|
|||
106
Table of Contents
The following table summarizes, by contractual maturity, the carrying amounts and estimated fair values of held-to-maturity mortgage-backed securities and debt securities, and the amortized costs and estimated fair values of available-for-sale securities, at December 31, 2016:
| At December 31, 2016 | ||||||||||||||||||||||||||||||||||||
| (dollars in thousands) | Mortgage- Related Securities |
Average Yield |
U.S. Treasury and GSE Obligations |
Average Yield |
State, County, and Municipal |
Average Yield (1) |
Other Debt Securities (2) |
Average Yield |
Fair Value | |||||||||||||||||||||||||||
| Held-to-Maturity Securities: |
||||||||||||||||||||||||||||||||||||
| Due within one year |
$ | — | — | % | $ | 200,293 | 0.60 | % | $ | — | — | % | $ | — | — | % | $ | 200,220 | ||||||||||||||||||
| Due from one to five years |
648,801 | 3.68 | 66,534 | 4.14 | — | — | 48,064 | 3.34 | 802,256 | |||||||||||||||||||||||||||
| Due from five to ten years |
2,233,393 | 3.10 | 21,923 | 3.52 | — | — | 26,153 | 9.06 | 2,350,628 | |||||||||||||||||||||||||||
| Due after ten years |
330,369 | 2.96 | — | — | 71,554 | 2.88 | 65,692 | 4.73 | 460,855 | |||||||||||||||||||||||||||
|
|
|
|
|
|
|
|
|
|
|
|
|
|
|
|
|
|
|
|||||||||||||||||||
| Total securities held to maturity |
$ | 3,212,563 | 3.20 | % | $ | 288,750 | 1.64 | % | $ | 71,554 | 2.88 | % | $ | 139,909 | 5.06 | % | $ | 3,813,959 | ||||||||||||||||||
|
|
|
|
|
|
|
|
|
|
|
|
|
|
|
|
|
|
|
|||||||||||||||||||
| Available-for-Sale Securities: (3) |
||||||||||||||||||||||||||||||||||||
| Due within one year |
$ | — | — | % | $ | — | — | % | $ | 149 | 6.47 | % | $ | — | — | % | $ | 155 | ||||||||||||||||||
| Due from one to five years |
— | — | — | — | 434 | 6.59 | — | — | 476 | |||||||||||||||||||||||||||
| Due from five to ten years |
7,786 | 1.90 | — | — | — | — | — | — | 7,326 | |||||||||||||||||||||||||||
| Due after ten years |
— | — | — | — | — | — | 9,458 | 4.66 | 7,243 | |||||||||||||||||||||||||||
|
|
|
|
|
|
|
|
|
|
|
|
|
|
|
|
|
|
|
|||||||||||||||||||
| Total securities available for sale |
$ | 7,786 | 1.90 | % | $ | — | — | % | $ | 583 | 6.56 | % | $ | 9,458 | 4.66 | % | $ | 15,200 | ||||||||||||||||||
|
|
|
|
|
|
|
|
|
|
|
|
|
|
|
|
|
|
|
|||||||||||||||||||
| (1) | Not presented on a tax-equivalent basis. |
| (2) | Includes corporate bonds and capital trust notes. |
| (3) | As equity securities have no contractual maturity, they have been excluded from this table. |
107
Table of Contents
The following table presents held-to-maturity and available-for-sale securities having a continuous unrealized loss position for less than twelve months and for twelve months or longer as of December 31, 2016:
| At December 31, 2016 | Less than Twelve Months | Twelve Months or Longer | Total | |||||||||||||||||||||
| (in thousands) | Fair Value | Unrealized Loss | Fair Value | Unrealized Loss | Fair Value | Unrealized Loss | ||||||||||||||||||
| Temporarily Impaired Held-to-Maturity Securities: |
||||||||||||||||||||||||
| GSE certificates |
$ | 268,891 | $ | 2,399 | $ | — | $ | — | $ | 268,891 | $ | 2,399 | ||||||||||||
| GSE CMOs |
42,980 | 57 | — | — | 42,980 | 57 | ||||||||||||||||||
| U. S. Treasury obligations |
200,220 | 73 | — | — | 200,220 | 73 | ||||||||||||||||||
| Municipal bonds |
69,765 | 1,789 | — | — | 69,765 | 1,789 | ||||||||||||||||||
| Capital trust notes |
— | — | 24,364 | 11,872 | 24,364 | 11,872 | ||||||||||||||||||
|
|
|
|
|
|
|
|
|
|
|
|
|
|||||||||||||
| Total temporarily impaired held-to-maturity securities |
$ | 581,856 | $ | 4,318 | $ | 24,364 | $ | 11,872 | $ | 606,220 | $ | 16,190 | ||||||||||||
|
|
|
|
|
|
|
|
|
|
|
|
|
|||||||||||||
| Temporarily Impaired Available-for-Sale Securities: |
||||||||||||||||||||||||
| GSE certificates |
$ | 7,326 | $ | 460 | $ | — | $ | — | $ | 7,326 | $ | 460 | ||||||||||||
| Capital trust notes |
— | — | 5,241 | 2,217 | 5,241 | 2,217 | ||||||||||||||||||
| Equity securities |
29,059 | 589 | — | — | 29,059 | 589 | ||||||||||||||||||
|
|
|
|
|
|
|
|
|
|
|
|
|
|||||||||||||
| Total temporarily impaired available-for-sale securities |
$ | 36,385 | $ | 1,049 | $ | 5,241 | $ | 2,217 | $ | 41,626 | $ | 3,266 | ||||||||||||
|
|
|
|
|
|
|
|
|
|
|
|
|
|||||||||||||
The following table presents held-to-maturity and available-for-sale securities having a continuous unrealized loss position for less than twelve months and for twelve months or longer as of December 31, 2015:
| At December 31, 2015 | Less than Twelve Months | Twelve Months or Longer | Total | |||||||||||||||||||||
| (in thousands) | Fair Value | Unrealized Loss | Fair Value | Unrealized Loss | Fair Value | Unrealized Loss | ||||||||||||||||||
| Temporarily Impaired Held-to-Maturity Securities: |
||||||||||||||||||||||||
| GSE debentures |
$ | 547,484 | $ | 728 | $ | 1,176,949 | $ | 6,840 | $ | 1,724,433 | $ | 7,568 | ||||||||||||
| GSE certificates |
299,019 | 4,608 | 3,899 | 114 | 302,918 | 4,722 | ||||||||||||||||||
| GSE CMOs |
9,943 | 57 | — | — | 9,943 | 57 | ||||||||||||||||||
| Municipal bonds |
42,083 | 1,084 | — | — | 42,083 | 1,084 | ||||||||||||||||||
| Capital trust notes |
24,601 | 399 | 20,710 | 15,501 | 45,311 | 15,900 | ||||||||||||||||||
|
|
|
|
|
|
|
|
|
|
|
|
|
|||||||||||||
| Total temporarily impaired held-to-maturity securities |
$ | 923,130 | $ | 6,876 | $ | 1,201,558 | $ | 22,455 | $ | 2,124,688 | $ | 29,331 | ||||||||||||
|
|
|
|
|
|
|
|
|
|
|
|
|
|||||||||||||
| Temporarily Impaired Available-for-Sale Securities: |
||||||||||||||||||||||||
| GSE certificates |
$ | 51,959 | $ | 1 | $ | — | $ | — | $ | 51,959 | $ | 1 | ||||||||||||
| Capital trust notes |
1,968 | 32 | 4,997 | 2,448 | 6,965 | 2,480 | ||||||||||||||||||
| Equity securities |
51,775 | 323 | — | — | 51,775 | 323 | ||||||||||||||||||
|
|
|
|
|
|
|
|
|
|
|
|
|
|||||||||||||
| Total temporarily impaired available-for-sale securities |
$ | 105,702 | $ | 356 | $ | 4,997 | $ | 2,448 | $ | 110,699 | $ | 2,804 | ||||||||||||
|
|
|
|
|
|
|
|
|
|
|
|
|
|||||||||||||
108
Table of Contents
An OTTI loss on impaired securities must be fully recognized in earnings if an investor has the intent to sell the debt security, or if it is more likely than not that the investor will be required to sell the debt security before recovery of its amortized cost. However, even if an investor does not expect to sell a debt security, it must evaluate the expected cash flows to be received and determine if a credit loss has occurred. In the event that a credit loss occurs, only the amount of impairment associated with the credit loss is recognized in earnings. Amounts of impairment relating to factors other than credit losses are recorded in AOCL.
At December 31, 2016, the Company had unrealized losses on certain GSE mortgage-related securities, U.S. Treasury obligations, municipal bonds, capital trust notes, and equity securities.
The unrealized losses on the Company’s GSE mortgage-related securities, U.S. Treasury obligations, and municipal bonds at December 31, 2016 were primarily caused by movements in market interest rates and spread volatility, rather than credit risk. These securities are not expected to be settled at a price that is less than the amortized cost of the Company’s investment.
The Company reviews quarterly financial information related to its investments in capital trust notes, as well as other information that is released by each of the issuers of such notes, to determine their continued creditworthiness. The Company continues to monitor these investments and currently estimates that the present value of expected cash flows is not less than the amortized cost of the securities. It is possible that these securities will perform worse than is currently expected, which could lead to adverse changes in cash flows from these securities and potential OTTI losses in the future. Future events that could trigger material unrecoverable declines in the fair values of the Company’s investments, and thus result in potential OTTI losses, include, but are not limited to government intervention; deteriorating asset quality and credit metrics; significantly higher levels of default and loan loss provisions; losses in value on the underlying collateral; net operating losses; and illiquidity in the financial markets.
The Company considers a decline in the fair value of equity securities to be other than temporary if the Company does not expect to recover the entire amortized cost basis of the security. The unrealized losses on the Company’s equity securities at December 31, 2016 were caused by market volatility. The Company evaluated the near-term prospects of recovering the fair value of these securities, together with the severity and duration of impairment to date, and determined that they were not other than temporarily impaired. Nonetheless, it is possible that these equity securities will perform worse than is currently expected, which could lead to adverse changes in their fair value, or to the failure of the securities to fully recover in value as currently anticipated by management. Either event could cause the Company to record an OTTI loss in a future period. Events that could trigger a material decline in the fair value of these securities include, but are not limited to, deterioration in the equity markets; a decline in the quality of the loan portfolio of the issuer in which the Company has invested; and the recording of higher loan loss provisions and net operating losses by such issuer.
The investment securities designated as having a continuous loss position for twelve months or more at December 31, 2016 consisted of five capital trust notes. At December 31, 2015, the investment securities designated as having a continuous loss position for twelve months or more consisted of seven agency debt securities, five capital trust notes, and two agency mortgage-backed securities. At December 31, 2016 and 2015, the combined market value of the respective securities represented unrealized losses of $14.1 million and $24.9 million, respectively. At December 31, 2016, the fair value of securities having a continuous loss position for twelve months or more was 32.2% below the collective amortized cost of $43.7 million. At December 31, 2015, the fair value of such securities was 2.0% below the collective amortized cost of $1.2 billion.
109
Table of Contents
NOTE 5: LOANS
The following table sets forth the composition of the loan portfolio at December 31, 2016 and 2015:
| December 31, | ||||||||||||||||
| 2016 | 2015 | |||||||||||||||
| (dollars in thousands) | Amount | Percent of Non-Covered Loans Held for Investment |
Amount | Percent of Non-Covered Loans Held for Investment |
||||||||||||
| Non-Covered Loans Held for Investment: |
||||||||||||||||
| Mortgage Loans: |
||||||||||||||||
| Multi-family |
$ | 26,945,052 | 72.13 | % | $ | 25,971,629 | 72.67 | % | ||||||||
| Commercial real estate |
7,724,362 | 20.68 | 7,857,204 | 21.98 | ||||||||||||
| One-to-four family |
381,081 | 1.02 | 116,841 | 0.33 | ||||||||||||
| Acquisition, development, and construction |
381,194 | 1.02 | 311,676 | 0.87 | ||||||||||||
|
|
|
|
|
|
|
|
|
|||||||||
| Total mortgage loans held for investment |
$ | 35,431,689 | 94.85 | $ | 34,257,350 | 95.85 | ||||||||||
|
|
|
|
|
|
|
|
|
|||||||||
| Other Loans: |
||||||||||||||||
| Commercial and industrial |
1,341,216 | 3.59 | 1,085,529 | 3.04 | ||||||||||||
| Lease financing, net of unearned income of $60,278 and $43,553, respectively |
559,229 | 1.50 | 365,027 | 1.02 | ||||||||||||
|
|
|
|
|
|
|
|
|
|||||||||
| Total commercial and industrial loans (1) |
1,900,445 | 5.09 | 1,450,556 | 4.06 | ||||||||||||
| Purchased credit-impaired loans |
5,762 | 0.01 | 8,344 | 0.02 | ||||||||||||
| Other |
18,305 | 0.05 | 24,239 | 0.07 | ||||||||||||
|
|
|
|
|
|
|
|
|
|||||||||
| Total other loans held for investment |
1,924,512 | 5.15 | 1,483,139 | 4.15 | ||||||||||||
|
|
|
|
|
|
|
|
|
|||||||||
| Total non-covered loans held for investment |
$ | 37,356,201 | 100.00 | % | $ | 35,740,489 | 100.00 | % | ||||||||
|
|
|
|
|
|||||||||||||
| Net deferred loan origination costs |
26,521 | 22,715 | ||||||||||||||
| Allowance for losses on non-covered loans |
(158,290 | ) | (147,124 | ) | ||||||||||||
|
|
|
|
|
|||||||||||||
| Non-covered loans held for investment, net |
$ | 37,224,432 | $ | 35,616,080 | ||||||||||||
|
|
|
|
|
|||||||||||||
| Covered loans |
1,698,133 | 2,060,089 | ||||||||||||||
| Allowance for losses on covered loans |
(23,701 | ) | (31,395 | ) | ||||||||||||
|
|
|
|
|
|||||||||||||
| Covered loans, net |
$ | 1,674,432 | $ | 2,028,694 | ||||||||||||
| Loans held for sale |
409,152 | 367,221 | ||||||||||||||
|
|
|
|
|
|||||||||||||
| Total loans, net |
$ | 39,308,016 | $ | 38,011,995 | ||||||||||||
|
|
|
|
|
|||||||||||||
| (1) | Includes specialty finance loans of $1.3 billion and $880.7 million, and other C&I loans of $632.9 million and $569.9 million, respectively, at December 31, 2016 and 2015. |
Non-Covered Loans
Non-Covered Loans Held for Investment
The majority of the loans the Company originates for investment are multi-family loans, most of which are collateralized by non-luxury apartment buildings in New York City with rent-regulated units and below-market rents. In addition, the Company originates commercial real estate (“CRE”) loans, most of which are collateralized by income-producing properties such as office buildings, retail centers, mixed-use buildings, and multi-tenanted light industrial properties that are located in New York City and on Long Island.
To a lesser extent, the Company also originates one-to-four family loans, acquisition, development, and construction (“ADC”) loans, and commercial and industrial (“C&I”) loans, for investment. One-to-four family loans held for investment are originated through the Company’s mortgage banking operation and primarily consist of jumbo prime adjustable rate mortgages made to borrowers with a solid credit history. ADC loans are primarily originated for multi-family and residential tract projects in New York City and on Long Island. C&I loans consist of asset-based loans, equipment loans and leases, and dealer floor-plan loans (together, “specialty finance loans and leases”) that generally are made to large corporate obligors, many of which are publicly traded, carry investment grade or near-investment grade ratings, and participate in stable industries nationwide; and “other” C&I loans that primarily are made to small and mid-size businesses in Metro New York. “Other” C&I loans are typically made for working capital, business expansion, and the purchase of machinery and equipment.
The repayment of multi-family and CRE loans generally depends on the income produced by the underlying properties which, in turn, depends on their successful operation and management. To mitigate the potential for credit losses, the Company underwrites its loans in accordance with credit standards it considers to be prudent, looking
110
Table of Contents
first at the consistency of the cash flows being produced by the underlying property. In addition, multi-family buildings and CRE properties are inspected as a prerequisite to approval, and independent appraisers, whose appraisals are carefully reviewed by the Company’s in-house appraisers, perform appraisals on the collateral properties. In many cases, a second independent appraisal review is performed. To further manage its credit risk, the Company’s lending policies limit the amount of credit granted to any one borrower and typically require conservative debt service coverage ratios and loan-to-value ratios. Nonetheless, the ability of the Company’s borrowers to repay these loans may be impacted by adverse conditions in the local real estate market and the local economy. Accordingly, there can be no assurance that its underwriting policies will protect the Company from credit-related losses or delinquencies.
ADC loans typically involve a higher degree of credit risk than loans secured by improved or owner-occupied real estate. Accordingly, borrowers are required to provide a guarantee of repayment and completion, and loan proceeds are disbursed as construction progresses, as certified by in-house or third-party engineers. The Company seeks to minimize the credit risk on ADC loans by maintaining conservative lending policies and rigorous underwriting standards. However, if the estimate of value proves to be inaccurate, the cost of completion is greater than expected, or the length of time to complete and/or sell or lease the collateral property is greater than anticipated, the property could have a value upon completion that is insufficient to assure full repayment of the loan. This could have a material adverse effect on the quality of the ADC loan portfolio, and could result in losses or delinquencies.
To minimize the risk involved in specialty finance lending and leasing, the Company participates in syndicated loans that are brought to it, and equipment loans and leases that are assigned to it, by a select group of nationally recognized sources who have had long-term relationships with its experienced lending officers. Each of these credits is secured with a perfected first security interest or outright ownership in the underlying collateral, and structured as senior debt or as a non-cancelable lease. To further minimize the risk involved in specialty finance lending and leasing, each transaction is re-underwritten. In addition, outside counsel is retained to conduct a further review of the underlying documentation.
To minimize the risks involved in other C&I lending, the Company underwrites such loans on the basis of the cash flows produced by the business; requires that such loans be collateralized by various business assets, including inventory, equipment, and accounts receivable, among others; and requires personal guarantees. However, the capacity of a borrower to repay such a C&I loan is substantially dependent on the degree to which the business is successful. In addition, the collateral underlying such loans may depreciate over time, may not be conducive to appraisal, or may fluctuate in value, based upon the results of operations of the business.
Included in non-covered loans held for investment at December 31, 2016 and 2015, respectively, were loans of $91.8 million and $105.6 million to officers, directors, and their related interests and parties. There were no loans to principal shareholders at either of those dates.
Non-covered purchased credit-impaired (“PCI”) loans, which had a carrying value of $5.8 million and an unpaid principal balance of $7.0 million at December 31, 2016, are loans that had been covered under an FDIC loss sharing agreement that expired in March 2015 and that now are included in non-covered loans. Such loans continue to be accounted for under ASC 310-30 and were initially measured at fair value, which included estimated future credit losses expected to be incurred over the lives of the loans. Under ASC 310-30, purchasers are permitted to aggregate acquired loans into one or more pools, provided that the loans have common risk characteristics. A pool is then accounted for as a single asset with a single composite interest rate and an aggregate expectation of cash flows.
Loans Held for Sale
The Community Bank’s mortgage banking operation originates, aggregates, and services one-to-four family loans. Community banks, credit unions, mortgage companies, and mortgage brokers use its proprietary web-accessible mortgage banking platform to originate and close one-to-four family loans nationwide. These loans are generally sold to GSEs, servicing retained. To a much lesser extent, the Community Bank uses its mortgage banking platform to originate jumbo loans that are typically sold to other financial institutions. Such loans have not represented, nor are they expected to represent, a material portion of the held-for-sale loans originated by the Community Bank.
In addition, the Community Bank services mortgage loans for various third parties, primarily including GSEs.
111
Table of Contents
Asset Quality
The following table presents information regarding the quality of the Company’s non-covered loans held for investment (excluding non-covered PCI loans) at December 31, 2016:
| (in thousands) | Loans 30-89 Days Past Due(1) |
Non- Accrual Loans (1) |
Loans 90 Days or More Delinquent and Still Accruing Interest |
Total Past Due Loans |
Current Loans |
Total Loans Receivable |
||||||||||||||||||
| Multi-family |
$ | 28 | $ | 13,558 | $ | — | $ | 13,586 | $ | 26,931,466 | $ | 26,945,052 | ||||||||||||
| Commercial real estate |
— | 9,297 | — | 9,297 | 7,715,065 | 7,724,362 | ||||||||||||||||||
| One-to-four family |
2,844 | 9,679 | — | 12,523 | 368,558 | 381,081 | ||||||||||||||||||
| Acquisition, development, and construction |
— | 6,200 | — | 6,200 | 374,994 | 381,194 | ||||||||||||||||||
| Commercial and industrial (2) |
7,263 | 16,422 | — | 23,685 | 1,876,760 | 1,900,445 | ||||||||||||||||||
| Other |
248 | 1,313 | — | 1,561 | 16,744 | 18,305 | ||||||||||||||||||
|
|
|
|
|
|
|
|
|
|
|
|
|
|||||||||||||
| Total |
$ | 10,383 | $ | 56,469 | $ | — | $ | 66,852 | $ | 37,283,587 | $ | 37,350,439 | ||||||||||||
|
|
|
|
|
|
|
|
|
|
|
|
|
|||||||||||||
| (1) | Excludes $6,000 and $869,000 of non-covered PCI loans that were 30 to 89 days past due and 90 days or more past due, respectively. |
| (2) | Includes lease financing receivables, all of which were current. |
The following table presents information regarding the quality of the Company’s non-covered loans held for investment at December 31, 2015:
| (in thousands) | Loans 30-89 Days Past Due |
Non- Accrual Loans (1) |
Loans 90 Days or More Delinquent and Still Accruing Interest |
Total Past Due Loans |
Current Loans |
Total Loans Receivable |
||||||||||||||||||
| Multi-family |
$ | 4,818 | $ | 13,904 | $ | — | $ | 18,722 | $ | 25,952,907 | $ | 25,971,629 | ||||||||||||
| Commercial real estate |
178 | 14,920 | — | 15,098 | 7,842,106 | 7,857,204 | ||||||||||||||||||
| One-to-four family |
1,117 | 12,259 | — | 13,376 | 103,465 | 116,841 | ||||||||||||||||||
| Acquisition, development, and construction |
— | 27 | — | 27 | 311,649 | 311,676 | ||||||||||||||||||
| Commercial and industrial (2) |
— | 4,473 | — | 4,473 | 1,446,083 | 1,450,556 | ||||||||||||||||||
| Other |
492 | 1,242 | — | 1,734 | 22,505 | 24,239 | ||||||||||||||||||
|
|
|
|
|
|
|
|
|
|
|
|
|
|||||||||||||
| Total |
$ | 6,605 | $ | 46,825 | $ | — | $ | 53,430 | $ | 35,678,715 | $ | 35,732,145 | ||||||||||||
|
|
|
|
|
|
|
|
|
|
|
|
|
|||||||||||||
| (1) | Excludes $969,000 of non-covered PCI loans that were 90 days or more past due. |
| (2) | Includes lease financing receivables, all of which were current. |
112
Table of Contents
The following table summarizes the Company’s portfolio of non-covered loans held for investment (excluding non-covered PCI loans) by credit quality indicator at December 31, 2016:
| Mortgage Loans | Other Loans | |||||||||||||||||||||||||||||||
| (in thousands) | Multi- Family |
Commercial Real Estate |
One-to-Four Family |
Acquisition, Development, and Construction |
Total Mortgage Loans |
Commercial and Industrial(1) |
Other | Total Other Loans |
||||||||||||||||||||||||
| Credit Quality Indicator: |
||||||||||||||||||||||||||||||||
| Pass |
$ | 26,754,622 | $ | 7,701,773 | $ | 371,179 | $ | 341,784 | $ | 35,169,358 | $ | 1,771,975 | $ | 16,992 | $ | 1,788,967 | ||||||||||||||||
| Special mention |
164,325 | 12,604 | — | 33,210 | 210,139 | 54,979 | — | 54,979 | ||||||||||||||||||||||||
| Substandard |
26,105 | 9,985 | 9,902 | 6,200 | 52,192 | 73,491 | 1,313 | 74,804 | ||||||||||||||||||||||||
| Doubtful |
— | — | — | — | — | — | — | — | ||||||||||||||||||||||||
|
|
|
|
|
|
|
|
|
|
|
|
|
|
|
|
|
|||||||||||||||||
| Total |
$ | 26,945,052 | $ | 7,724,362 | $ | 381,081 | $ | 381,194 | $ | 35,431,689 | $ | 1,900,445 | $ | 18,305 | $ | 1,918,750 | ||||||||||||||||
|
|
|
|
|
|
|
|
|
|
|
|
|
|
|
|
|
|||||||||||||||||
| (1) | Includes lease financing receivables, all of which were classified as “pass.” |
The following table summarizes the Company’s portfolio of non-covered loans held for investment (excluding non-covered PCI loans) by credit quality indicator at December 31, 2015:
| Mortgage Loans | Other Loans | |||||||||||||||||||||||||||||||
| (in thousands) | Multi- Family |
Commercial Real Estate |
One-to-Four Family |
Acquisition, Development, and Construction |
Total Mortgage Loans |
Commercial and Industrial(1) |
Other | Total Other Loans |
||||||||||||||||||||||||
| Credit Quality Indicator: |
||||||||||||||||||||||||||||||||
| Pass |
$ | 25,936,423 | $ | 7,839,127 | $ | 104,582 | $ | 309,039 | $ | 34,189,171 | $ | 1,433,778 | $ | 22,996 | $ | 1,456,774 | ||||||||||||||||
| Special mention |
6,305 | 3,883 | — | — | 10,188 | 11,771 | — | 11,771 | ||||||||||||||||||||||||
| Substandard |
28,901 | 14,194 | 12,259 | 2,637 | 57,991 | 5,007 | 1,243 | 6,250 | ||||||||||||||||||||||||
| Doubtful |
— | — | — | — | — | — | — | — | ||||||||||||||||||||||||
|
|
|
|
|
|
|
|
|
|
|
|
|
|
|
|
|
|||||||||||||||||
| Total |
$ | 25,971,629 | $ | 7,857,204 | $ | 116,841 | $ | 311,676 | $ | 34,257,350 | $ | 1,450,556 | $ | 24,239 | $ | 1,474,795 | ||||||||||||||||
|
|
|
|
|
|
|
|
|
|
|
|
|
|
|
|
|
|||||||||||||||||
| (1) | Includes lease financing receivables, all of which were classified as “pass.” |
The preceding classifications are the most current ones available and generally have been updated within the last twelve months. In addition, they follow regulatory guidelines and can generally be described as follows: pass loans are of satisfactory quality; special mention loans have a potential weakness or risk that may result in the deterioration of future repayment; substandard loans are inadequately protected by the current net worth and paying capacity of the borrower or of the collateral pledged (these loans have a well-defined weakness and there is a distinct possibility that the Company will sustain some loss); and doubtful loans, based on existing circumstances, have weaknesses that make collection or liquidation in full highly questionable and improbable. In addition, one-to-four family loans are classified based on the duration of the delinquency.
The interest income that would have been recorded under the original terms of non-accrual loans at the respective year-ends, and the interest income actually recorded on these loans in the respective years, is summarized below:
| December 31, | ||||||||||||
| (in thousands) | 2016 | 2015 | 2014 | |||||||||
| Interest income that would have been recorded |
$ | 3,128 | $ | 2,288 | $ | 3,997 | ||||||
| Interest income actually recorded |
(1,708 | ) | (1,574 | ) | (3,017 | ) | ||||||
|
|
|
|
|
|
|
|||||||
| Interest income foregone |
$ | 1,420 | $ | 714 | $ | 980 | ||||||
|
|
|
|
|
|
|
|||||||
Troubled Debt Restructurings
The Company is required to account for certain held-for-investment loan modifications and restructurings as TDRs. In general, a modification or restructuring of a loan constitutes a TDR if the Company grants a concession to a borrower experiencing financial difficulty. A loan modified as a TDR generally is placed on non-accrual status until the Company determines that future collection of principal and interest is reasonably assured, which requires, among other things, that the borrower demonstrate performance according to the restructured terms for a period of at least six consecutive months.
In an effort to proactively manage delinquent loans, the Company has selectively extended to certain borrowers concessions such as rate reductions, extension of maturity dates, and forbearance agreements. As of December 31, 2016, loans on which concessions were made with respect to rate reductions and/or extension of maturity dates amounted to $17.1 million; loans on which forbearance agreements were reached amounted to $2.8 million.
113
Table of Contents
The following table presents information regarding the Company’s TDRs as of December 31, 2016 and 2015:
| December 31, | ||||||||||||||||||||||||
| 2016 | 2015 | |||||||||||||||||||||||
| (in thousands) | Accruing | Non- Accrual |
Total | Accruing | Non- Accrual |
Total | ||||||||||||||||||
| Loan Category: |
||||||||||||||||||||||||
| Multi-family |
$ | 1,981 | $ | 8,755 | $ | 10,736 | $ | 2,017 | $ | 635 | $ | 2,652 | ||||||||||||
| Commercial real estate |
— | 1,861 | 1,861 | 115 | 6,255 | 6,370 | ||||||||||||||||||
| One-to-four family |
222 | 1,749 | 1,971 | — | 987 | 987 | ||||||||||||||||||
| Acquisition, development, and construction |
— | — | — | — | 27 | 27 | ||||||||||||||||||
| Commercial and industrial |
1,263 | 3,887 | 5,150 | 627 | 1,279 | 1,906 | ||||||||||||||||||
| Other |
— | 202 | 202 | — | 213 | 213 | ||||||||||||||||||
|
|
|
|
|
|
|
|
|
|
|
|
|
|||||||||||||
| Total |
$ | 3,466 | $ | 16,454 | $ | 19,920 | $ | 2,759 | $ | 9,396 | $ | 12,155 | ||||||||||||
|
|
|
|
|
|
|
|
|
|
|
|
|
|||||||||||||
The eligibility of a borrower for work-out concessions of any nature depends upon the facts and circumstances of each loan, which may change from period to period, and involves judgment by Company personnel regarding the likelihood that the concession will result in the maximum recovery for the Company.
The financial effects of the Company’s TDRs for the twelve months ended December 31, 2016, 2015, and 2014 are summarized as follows:
| For the Twelve Months Ended December 31, 2016 | ||||||||||||||||||||
| (dollars in thousands) | Weighted Average Interest Rate | |||||||||||||||||||
| Number of Loans |
Pre- Modification |
Post- Modification |
Charge- off Amount |
Capitalized Interest |
||||||||||||||||
| Loan Category: |
||||||||||||||||||||
| Multi-family |
1 | 4.63 | % | 4.00 | % | $ | — | $ | — | |||||||||||
| One-to-four family |
5 | 4.26 | 2.65 | — | 11 | |||||||||||||||
| Commercial and industrial |
7 | 3.22 | 3.19 | 170 | — | |||||||||||||||
|
|
|
|
|
|
|
|||||||||||||||
| Total |
13 | $ | 170 | $ | 11 | |||||||||||||||
|
|
|
|
|
|
|
|||||||||||||||
| For the Twelve Months Ended December 31, 2015 | ||||||||||||||||||||
| (dollars in thousands) | Weighted Average Interest Rate | |||||||||||||||||||
| Number of Loans |
Pre- Modification |
Post- Modification |
Charge- off Amount |
Capitalized Interest |
||||||||||||||||
| Loan Category: |
||||||||||||||||||||
| One-to-four family |
4 | 4.02 | % | 2.72 | % | $ | — | $ | 6 | |||||||||||
| Commercial and industrial |
2 | 3.40 | 3.52 | 33 | — | |||||||||||||||
| Other |
2 | 4.58 | 2.00 | — | 2 | |||||||||||||||
|
|
|
|
|
|
|
|||||||||||||||
| Total |
8 | $ | 33 | $ | 8 | |||||||||||||||
|
|
|
|
|
|
|
|||||||||||||||
| For the Twelve Months Ended December 31, 2014 | ||||||||||||||||||||
| (dollars in thousands) | Weighted Average Interest Rate | |||||||||||||||||||
| Number of Loans |
Pre- Modification |
Post- Modification |
Charge- off Amount |
Capitalized Interest |
||||||||||||||||
| Loan Category: |
||||||||||||||||||||
| Multi-family |
2 | 5.61 | % | 5.61 | % | $ | — | $ | — | |||||||||||
| Commercial real estate |
2 | 6.71 | 5.54 | 334 | — | |||||||||||||||
| One-to-four family |
1 | 5.75 | 4.27 | 18 | 22 | |||||||||||||||
| Acquisition, development, and construction |
2 | 7.00 | 7.00 | — | — | |||||||||||||||
| Commercial and industrial |
1 | 5.00 | 5.00 | — | — | |||||||||||||||
|
|
|
|
|
|
|
|||||||||||||||
| Total |
8 | $ | 352 | $ | 22 | |||||||||||||||
|
|
|
|
|
|
|
|||||||||||||||
114
Table of Contents
At December 31, 2016, none of the loans that had been modified as a TDR during the twelve months ended at that date were in payment default. At December 31, 2015, one home equity loan in the amount of $143,000 that had been modified as a TDR during the twelve months ended at that date was in payment default. A loan is considered to be in payment default once it is 30 days contractually past due under the modified terms.
The Company does not consider a payment to be in default when the loan is in forbearance, or otherwise granted a delay of payment, when the agreement to forebear or allow a delay of payment is part of a modification.
Subsequent to the modification, the loan is not considered to be in default until payment is contractually past due in accordance with the modified terms. However, the Company does consider a loan with multiple modifications or forbearance periods to be in default, and would also consider a loan to be in default if the borrower were in bankruptcy or if the loan were partially charged off subsequent to modification.
Covered Loans
The following table presents the carrying value of covered loans acquired in the AmTrust and Desert Hills acquisitions as of December 31, 2016:
| (dollars in thousands) | Amount | Percent of Covered Loans |
||||||
| Loan Category: |
|
|||||||
| One-to-four family |
$ | 1,609,635 | 94.8 | % | ||||
| Other loans |
88,498 | 5.2 | ||||||
|
|
|
|
|
|||||
| Total covered loans |
$ | 1,698,133 | 100.0 | % | ||||
|
|
|
|
|
|||||
The Company refers to certain loans acquired in the AmTrust and Desert Hills transactions as “covered loans” because the Company is being reimbursed for a substantial portion of losses on these loans under the terms of the FDIC loss sharing agreements. Covered loans are accounted for under ASC 310-30 and are initially measured at fair value, which includes estimated future credit losses expected to be incurred over the lives of the loans. Under ASC 310-30, purchasers are permitted to aggregate acquired loans into one or more pools, provided that the loans have common risk characteristics. A pool is then accounted for as a single asset with a single composite interest rate and an aggregate expectation of cash flows.
At December 31, 2016 and 2015, the unpaid principal balance of covered loans was $2.1 billion and $2.5 billion, respectively. The carrying value of such loans was $1.7 billion and $2.1 billion at the corresponding dates.
At the respective acquisition dates, the Company estimated the fair values of the AmTrust and Desert Hills loan portfolios, which represented the expected cash flows from the portfolios, discounted at market-based rates. In estimating such fair values, the Company: (a) calculated the contractual amount and timing of undiscounted principal and interest payments (the “undiscounted contractual cash flows”); and (b) estimated the expected amount and timing of undiscounted principal and interest payments (the “undiscounted expected cash flows”). The amount by which the undiscounted expected cash flows exceed the estimated fair value (the “accretable yield”) is accreted into interest income over the lives of the loans. The amount by which the undiscounted contractual cash flows exceed the undiscounted expected cash flows is referred to as the “non-accretable difference.” The non-accretable difference represents an estimate of the credit risk in the loan portfolios at the respective acquisition dates.
The accretable yield is affected by changes in interest rate indices for variable rate loans, changes in prepayment assumptions, and changes in expected principal and interest payments over the estimated lives of the loans. Changes in interest rate indices for variable rate loans increase or decrease the amount of interest income expected to be collected, depending on the direction of interest rates. Prepayments affect the estimated lives of covered loans and could change the amount of interest income and principal expected to be collected. Changes in expected principal and interest payments over the estimated lives of covered loans are driven by the credit outlook and by actions that may be taken with borrowers.
On a quarterly basis, the Company evaluates the estimates of the cash flows it expects to collect. Expected future cash flows from interest payments are based on variable rates at the time of the quarterly evaluation. Estimates of expected cash flows that are impacted by changes in interest rate indices for variable rate loans and prepayment assumptions are treated as prospective yield adjustments and included in interest income.
115
Table of Contents
In the twelve months ended December 31, 2016, changes in the accretable yield for covered loans were as follows:
| (in thousands) | Accretable Yield | |||
| Balance at beginning of period |
$ | 803,145 | ||
| Reclassification to non-accretable difference |
(24,396 | ) | ||
| Accretion |
(131,279 | ) | ||
|
|
|
|||
| Balance at end of period |
$ | 647,470 | ||
|
|
|
|||
In the preceding table, the line item “Reclassification to non-accretable difference” includes changes in cash flows that the Company does not expect to collect due to changes in prepayment assumptions, changes in interest rates on variable rate loans, and changes in loss assumptions. As of the Company’s most recent quarterly evaluation, prepayment assumptions increased, which resulted in a decrease in future expected interest cash flows and, consequently, a decrease in the accretable yield. The effect of this decrease was partially offset by an improvement in the underlying credit assumptions, coupled with coupon rates on variable rate loans resetting slightly higher, which resulted in an increase in future expected interest cash flows and, consequently, an increase in the accretable yield.
Reflecting the foreclosure of certain loans acquired in the AmTrust and Desert Hills acquisitions, the Company owns certain OREO that is covered under its loss sharing agreements with the FDIC (“covered OREO”). Covered OREO was initially recorded at its estimated fair value on the respective dates of acquisition, based on independent appraisals, less the estimated selling costs. Any subsequent write-downs due to declines in fair value have been charged to non-interest expense, and have been partially offset by loss reimbursements under the FDIC loss sharing agreements. Any recoveries of previous write-downs have been credited to non-interest expense and partially offset by the portion of the recovery that was due to the FDIC.
The FDIC loss share receivable represents the present value of the estimated losses to be reimbursed by the FDIC. The estimated losses were based on the same cash flow estimates used in determining the fair value of the covered loans. The FDIC loss share receivable is reduced as losses on covered loans are recognized and as loss sharing payments are received from the FDIC. Realized losses in excess of acquisition-date estimates result in an increase in the FDIC loss share receivable. Conversely, if realized losses are lower than the acquisition-date estimates, the FDIC loss share receivable is reduced by amortization to interest income.
At December 31, 2016 and 2015, respectively, the Company held residential mortgage loans of $78.6 million and $102.9 millionthat were in the process of foreclosure. The vast majority of such loans were covered loans.
The following table presents information regarding the Company’s covered loans that were 90 days or more past due at December 31, 2016 and 2015:
| December 31, | ||||||||
| (in thousands) | 2016 | 2015 | ||||||
| Covered Loans 90 Days or More Past Due: |
||||||||
| One-to-four family |
$ | 124,820 | $ | 130,626 | ||||
| Other loans |
6,645 | 6,556 | ||||||
|
|
|
|
|
|||||
| Total covered loans 90 days or more past due |
$ | 131,465 | $ | 137,182 | ||||
|
|
|
|
|
|||||
The following table presents information regarding the Company’s covered loans that were 30 to 89 days past due at December 31, 2016 and 2015:
| December 31, | ||||||||
| (in thousands) | 2016 | 2015 | ||||||
| Covered Loans 30-89 Days Past Due: |
||||||||
| One-to-four family |
$ | 21,112 | $ | 30,455 | ||||
| Other loans |
1,536 | 2,369 | ||||||
|
|
|
|
|
|||||
| Total covered loans 30-89 days past due |
$ | 22,648 | $ | 32,824 | ||||
|
|
|
|
|
|||||
116
Table of Contents
At December 31, 2016, the Company had $22.6 million of covered loans that were 30 to 89 days past due, and covered loans of $131.5 million that were 90 days or more past due but considered to be performing due to the application of the yield accretion method under ASC 310-30. The remainder of the Company’s covered loan portfolio totaled $1.5 billion at December 31, 2016 and was considered current at that date.
Loans that may have been classified as non-performing loans by AmTrust or Desert Hills were no longer classified as non-performing by the Company because, at the respective dates of acquisition, the Company believed that it would fully collect the new carrying value of these loans. The new carrying value represents the contractual balance, reduced by the portion that is expected to be uncollectible (i.e., the non-accretable difference) and by an accretable yield (discount) that is recognized as interest income. It is important to note that management’s judgment is required in reclassifying loans subject to ASC 310-30 as performing loans, and such judgment is dependent on having a reasonable expectation about the timing and amount of the cash flows to be collected, even if the loan is contractually past due.
The primary credit quality indicator for covered loans is the expectation of underlying cash flows. In the twelve months ended December 31, 2016 and 2015, the Company recovered losses on covered loans of $7.7 million and $11.7 million, respectively. The respective recoveries were largely due to an increase in expected cash flows in the acquired portfolios of one-to-four family and home equity loans, and were partly offset by FDIC indemnification expense of $6.2 million and $9.3 million that was recorded in “Non-interest income” in the respective periods.
NOTE 6: ALLOWANCES FOR LOAN LOSSES
The following tables provide additional information regarding the Company’s allowances for losses on non-covered loans and covered loans, based upon the method of evaluating loan impairment:
| (in thousands) | Mortgage | Other | Total | |||||||||
| Allowances for Loan Losses at December 31, 2016: |
||||||||||||
| Loans individually evaluated for impairment |
$ | — | $ | 577 | $ | 577 | ||||||
| Loans collectively evaluated for impairment |
123,925 | 32,022 | 155,947 | |||||||||
| Acquired loans with deteriorated credit quality |
11,984 | 13,483 | 25,467 | |||||||||
|
|
|
|
|
|
|
|||||||
| Total |
$ | 135,909 | $ | 46,082 | $ | 181,991 | ||||||
|
|
|
|
|
|
|
|||||||
| (in thousands) | Mortgage | Other | Total | |||||||||
| Allowances for Loan Losses at December 31, 2015: |
||||||||||||
| Loans individually evaluated for impairment |
$ | — | $ | — | $ | — | ||||||
| Loans collectively evaluated for impairment |
122,712 | 22,484 | 145,196 | |||||||||
| Acquired loans with deteriorated credit quality |
14,583 | 18,740 | 33,323 | |||||||||
|
|
|
|
|
|
|
|||||||
| Total |
$ | 137,295 | $ | 41,224 | $ | 178,519 | ||||||
|
|
|
|
|
|
|
|||||||
The following tables provide additional information regarding the methods used to evaluate the Company’s loan portfolio for impairment:
| (in thousands) | Mortgage | Other | Total | |||||||||
| Loans Receivable at December 31, 2016: |
||||||||||||
| Loans individually evaluated for impairment |
$ | 29,660 | $ | 18,592 | $ | 48,252 | ||||||
| Loans collectively evaluated for impairment |
35,402,029 | 1,900,158 | 37,302,187 | |||||||||
| Acquired loans with deteriorated credit quality |
1,614,755 | 89,140 | 1,703,895 | |||||||||
|
|
|
|
|
|
|
|||||||
| Total |
$ | 37,046,444 | $ | 2,007,890 | $ | 39,054,334 | ||||||
|
|
|
|
|
|
|
|||||||
| (in thousands) | Mortgage | Other | Total | |||||||||
| Loans Receivable at December 31, 2015: |
||||||||||||
| Loans individually evaluated for impairment |
$ | 47,480 | $ | 4,474 | $ | 51,954 | ||||||
| Loans collectively evaluated for impairment |
34,209,870 | 1,470,321 | 35,680,191 | |||||||||
| Acquired loans with deteriorated credit quality |
1,924,255 | 144,178 | 2,068,433 | |||||||||
|
|
|
|
|
|
|
|||||||
| Total |
$ | 36,181,605 | $ | 1,618,973 | $ | 37,800,578 | ||||||
|
|
|
|
|
|
|
|||||||
117
Table of Contents
Allowance for Losses on Non-Covered Loans
The following table summarizes activity in the allowance for losses on non-covered loans for the twelve months ended December 31, 2016 and 2015:
| December 31, | ||||||||||||||||||||||||
| 2016 | 2015 | |||||||||||||||||||||||
| (in thousands) | Mortgage | Other | Total | Mortgage | Other | Total | ||||||||||||||||||
| Balance, beginning of period |
$ | 124,478 | $ | 22,646 | $ | 147,124 | $ | 122,616 | $ | 17,241 | $ | 139,857 | ||||||||||||
| Charge-offs |
(170 | ) | (3,413 | ) | (3,583 | ) | (1,315 | ) | (1,273 | ) | (2,588 | ) | ||||||||||||
| Recoveries |
1,272 | 1,603 | 2,875 | 5,765 | 5,008 | 10,773 | ||||||||||||||||||
| Transfer from the allowance for losses on covered loans (1) |
— | — | — | 2,250 | 166 | 2,416 | ||||||||||||||||||
| (Recovery of) provision for non-covered loan losses |
(164 | ) | 12,038 | 11,874 | (4,838 | ) | 1,504 | (3,334 | ) | |||||||||||||||
|
|
|
|
|
|
|
|
|
|
|
|
|
|||||||||||||
| Balance, end of period |
$ | 125,416 | $ | 32,874 | $ | 158,290 | $ | 124,478 | $ | 22,646 | $ | 147,124 | ||||||||||||
|
|
|
|
|
|
|
|
|
|
|
|
|
|||||||||||||
| (1) | Represents the allowance associated with $14.2 million of loans acquired in the Desert Hills transaction that were transferred from covered loans to non-covered loans upon expiration of the related FDIC loss sharing agreement in March 2015. |
See Note 2, “Summary of Significant Accounting Polices” for additional information regarding the Company’s allowance for losses on non-covered loans.
The following table presents additional information about the Company’s impaired non-covered loans at December 31, 2016:
| (in thousands) | Recorded Investment |
Unpaid Principal Balance |
Related Allowance |
Average Recorded Investment |
Interest Income Recognized |
|||||||||||||||
| Impaired loans with no related allowance: |
||||||||||||||||||||
| Multi-family |
$ | 10,742 | $ | 13,133 | $ | — | $ | 11,431 | $ | 627 | ||||||||||
| Commercial real estate |
9,117 | 14,868 | — | 10,461 | 143 | |||||||||||||||
| One-to-four family |
3,601 | 4,267 | — | 3,079 | 124 | |||||||||||||||
| Acquisition, development, and construction |
6,200 | 15,500 | — | 1,550 | 414 | |||||||||||||||
| Other |
6,739 | 7,955 | — | 8,261 | 92 | |||||||||||||||
|
|
|
|
|
|
|
|
|
|
|
|||||||||||
| Total impaired loans with no related allowance |
$ | 36,399 | $ | 55,723 | $ | — | $ | 34,782 | $ | 1,400 | ||||||||||
|
|
|
|
|
|
|
|
|
|
|
|||||||||||
| Impaired loans with an allowance recorded: |
||||||||||||||||||||
| Multi-family |
$ | — | $ | — | $ | — | $ | — | $ | — | ||||||||||
| Commercial real estate |
— | — | — | — | — | |||||||||||||||
| One-to-four family |
— | — | — | — | — | |||||||||||||||
| Acquisition, development, and construction |
— | — | — | — | — | |||||||||||||||
| Other |
11,853 | 13,529 | 577 | 4,574 | 213 | |||||||||||||||
|
|
|
|
|
|
|
|
|
|
|
|||||||||||
| Total impaired loans with an allowance recorded |
$ | 11,853 | $ | 13,529 | $ | 577 | $ | 4,574 | $ | 213 | ||||||||||
|
|
|
|
|
|
|
|
|
|
|
|||||||||||
| Total impaired loans: |
||||||||||||||||||||
| Multi-family |
$ | 10,742 | $ | 13,133 | $ | — | $ | 11,431 | $ | 627 | ||||||||||
| Commercial real estate |
9,117 | 14,868 | — | 10,461 | 143 | |||||||||||||||
| One-to-four family |
3,601 | 4,267 | — | 3,079 | 124 | |||||||||||||||
| Acquisition, development, and construction |
6,200 | 15,500 | — | 1,550 | 414 | |||||||||||||||
| Other |
18,592 | 21,484 | 577 | 12,835 | 305 | |||||||||||||||
|
|
|
|
|
|
|
|
|
|
|
|||||||||||
| Total impaired loans |
$ | 48,252 | $ | 69,252 | $ | 577 | $ | 39,356 | $ | 1,613 | ||||||||||
|
|
|
|
|
|
|
|
|
|
|
|||||||||||
118
Table of Contents
The following table presents additional information about the Company’s impaired non-covered loans at December 31, 2015:
| (in thousands) | Recorded Investment |
Unpaid Principal Balance |
Related Allowance |
Average Recorded Investment |
Interest Income Recognized |
|||||||||||||||
| Impaired loans with no related allowance: |
||||||||||||||||||||
| Multi-family |
$ | 27,464 | $ | 29,379 | $ | — | $ | 30,965 | $ | 1,320 | ||||||||||
| Commercial real estate |
13,995 | 15,480 | — | 25,066 | 383 | |||||||||||||||
| One-to-four family |
3,384 | 8,929 | — | 2,302 | 75 | |||||||||||||||
| Acquisition, development, and construction |
2,637 | 3,035 | — | 1,086 | 148 | |||||||||||||||
| Other |
4,474 | 4,794 | — | 8,386 | 118 | |||||||||||||||
|
|
|
|
|
|
|
|
|
|
|
|||||||||||
| Total impaired loans |
$ | 51,954 | $ | 61,617 | $ | — | $ | 67,805 | $ | 2,044 | ||||||||||
|
|
|
|
|
|
|
|
|
|
|
|||||||||||
Allowance for Losses on Covered Loans
Covered loans are reported exclusive of the FDIC loss share receivable. The covered loans acquired in the AmTrust and Desert Hills acquisitions are, and will continue to be, reviewed for collectability based on the expectations of cash flows from these loans. Covered loans have been aggregated into pools of loans with common characteristics. In determining the allowance for losses on covered loans, the Company periodically performs an analysis to estimate the expected cash flows for each of the pools of loans. The Company records a provision for (recovery of) losses on covered loans to the extent that the expected cash flows from a loan pool have decreased or increased since the acquisition date.
Accordingly, if there is a decrease in expected cash flows due to an increase in estimated credit losses (as compared to the estimates made at the respective acquisition dates), the decrease in the present value of expected cash flows is recorded as a provision for covered loan losses charged to earnings, and the allowance for covered loan losses is increased. A related credit to non-interest income and an increase in the FDIC loss share receivable are recognized at the same time, and measured based on the applicable loss sharing agreement percentage.
If there is an increase in expected cash flows due to a decrease in estimated credit losses (as compared to the estimates made at the respective acquisition dates), the increase in the present value of expected cash flows is recorded as a recovery of the prior-period impairment charged to earnings, and the allowance for covered loan losses is reduced. A related debit to non-interest income and a decrease in the FDIC loss share receivable are recognized at the same time, and measured based on the applicable loss sharing agreement percentage.
The following table summarizes activity in the allowance for losses on covered loans for the years ended December 31, 2016, 2015, and 2014:
| December 31, | ||||||||||||
| (in thousands) | 2016 | 2015 | 2014 | |||||||||
| Balance, beginning of period |
$ | 31,395 | $ | 45,481 | $ | 64,069 | ||||||
| Recovery of losses on covered loans |
(7,694 | ) | (11,670 | ) | (18,588 | ) | ||||||
| Transfer to the allowance for losses on covered loans(1) |
— | (2,416 | ) | — | ||||||||
|
|
|
|
|
|
|
|||||||
| Balance, end of period |
$ | 23,701 | $ | 31,395 | $ | 45,481 | ||||||
|
|
|
|
|
|
|
|||||||
| (1) | Represents the allowance associated with $14.2 million of loans acquired in the Desert Hills transaction that were transferred from covered loans to non-covered loans upon expiration of the related FDIC loss sharing agreement in March 2015. |
119
Table of Contents
NOTE 7: DEPOSITS
The following table sets forth the weighted average interest rates for each type of deposit at December 31, 2016 and 2015:
| December 31, | ||||||||||||||||||||||||
| 2016 | 2015 | |||||||||||||||||||||||
| (dollars in thousands) | Amount | Percent of Total |
Weighted Average Interest Rate |
Amount | Percent of Total |
Weighted Average Interest Rate (1) |
||||||||||||||||||
| NOW and money market accounts |
$ | 13,395,080 | 46.37 | % | 0.55 | % | $ | 13,069,019 | 45.97 | % | 0.22 | % | ||||||||||||
| Savings accounts |
5,280,374 | 18.28 | 0.46 | 7,541,566 | 26.53 | 0.63 | ||||||||||||||||||
| Certificates of deposit |
7,577,170 | 26.23 | 1.12 | 5,312,487 | 18.69 | 0.68 | ||||||||||||||||||
| Non-interest-bearing accounts |
2,635,279 | 9.12 | — | 2,503,686 | 8.81 | — | ||||||||||||||||||
|
|
|
|
|
|
|
|
|
|
|
|
|
|||||||||||||
| Total deposits |
$ | 28,887,903 | 100.00 | % | 0.63 | % | $ | 28,426,758 | 100.00 | % | 0.39 | % | ||||||||||||
|
|
|
|
|
|
|
|
|
|
|
|
|
|||||||||||||
At December 31, 2016 and 2015, the aggregate amounts of deposits that had been reclassified as loan balances (i.e., overdrafts) were $3.1 million and $3.5 million, respectively.
The scheduled maturities of certificates of deposit (“CDs”) at December 31, 2016 were as follows:
| (in thousands) | ||||
| 1 year or less |
$ | 6,876,629 | ||
| More than 1 year through 2 years |
561,031 | |||
| More than 2 years through 3 years |
40,908 | |||
| More than 3 years through 4 years |
25,039 | |||
| More than 4 years through 5 years |
54,544 | |||
| Over 5 years |
19,019 | |||
|
|
|
|||
| Total CDs |
$ | 7,577,170 | ||
|
|
|
|||
The following table presents a summary of CDs in amounts of $100,000 or more by remaining term to maturity, at December 31, 2016:
| CDs of $100,000 or More Maturing Within | ||||||||||||||||||||
| (in thousands) | 0 – 3 Months |
Over 3 to 6 Months |
Over 6 to 12 Months |
Over 12 Months |
Total | |||||||||||||||
| Total |
$ | 1,101,054 | $ | 718,082 | $ | 2,090,315 | $ | 367,310 | $ | 4,276,761 | ||||||||||
Included in total deposits at December 31, 2016 and 2015 were brokered deposits of $3.9 billion and $4.0 billion, with weighted average interest rates of 0.62% and 0.32% at the respective year-ends. Brokered money market accounts represented $2.5 billion of the December 31, 2016 and 2015 totals, and brokered interest-bearing checking accounts represented $1.4 billion and $1.5 billion, respectively. There were no brokered CDs at either year-end.
120
Table of Contents
NOTE 8: BORROWED FUNDS
The following table summarizes the Company’s borrowed funds at December 31, 2016 and 2015:
| December 31, | ||||||||
| (in thousands) | 2016 | 2015 | ||||||
| Wholesale borrowings: |
||||||||
| FHLB advances |
$ | 11,664,500 | $ | 13,463,800 | ||||
| Repurchase agreements |
1,500,000 | 1,500,000 | ||||||
| Federal funds purchased |
150,000 | 426,000 | ||||||
|
|
|
|
|
|||||
| Total wholesale borrowings |
$ | 13,314,500 | $ | 15,389,800 | ||||
|
|
|
|
|
|||||
| Junior subordinated debentures |
358,879 | 358,605 | ||||||
|
|
|
|
|
|||||
| Total borrowed funds |
$ | 13,673,379 | $ | 15,748,405 | ||||
|
|
|
|
|
|||||
In the fourth quarter of 2015, the Company prepaid $10.4 billion of wholesale borrowings with an average cost of 3.16% and replaced them with a like amount of wholesale borrowings with an average cost of 1.58%. The wholesale borrowings that were prepaid had callable features; the wholesale borrowings that replaced them featured fixed maturities.
Accrued interest on borrowed funds is included in “Other liabilities” in the Consolidated Statements of Condition and amounted to $18.1 million and $12.4 million, respectively, at December 31, 2016 and 2015.
FHLB Advances
The following table presents an analysis of the contractual maturities of the Company’s outstanding FHLB advances at December 31, 2016, none of which had callable features.
| Contractual Maturity | ||||||||
| (dollars in thousands) Year of Maturity |
Amount | Weighted Average Interest Rate |
||||||
| 2017 |
$ | 1,860,000 | 1.21 | % | ||||
| 2018 |
4,423,500 | 1.50 | ||||||
| 2019 |
3,881,000 | 1.71 | ||||||
| 2020 |
1,500,000 | 1.93 | ||||||
|
|
|
|
|
|||||
| Total FHLB advances |
$ | 11,664,500 | 1.58 | % | ||||
|
|
|
|
|
|||||
At December 31, 2016 and 2015, the Company had short-term FHLB advances of $300.0 million and $2.5 billion, with weighted average interest rates of 0.81% and 0.55%, respectively. During the twelve months ended at those dates, the average balances of short-term FHLB advances were $929.4 million and $2.3 billion, with weighted average interest rates of 0.60% and 0.42%, respectively. In 2016 and 2015, the interest expense generated by average short-term FHLB advances was $5.5 million and $9.8 million, respectively. During 2014, the average balance of short-term advances was $2.6 billion with a weighted average rate of 0.37%, generating interest expense of $9.8 million.
At December 31, 2016 and 2015, respectively, the Banks had combined unused lines of available credit with the FHLB-NY of up to $7.5 billion and $5.7 billion, in addition to $10.0 million and $790.3 million outstanding in overnight FHLB-NY advances with weighted-average interest rates of 0.78% and 0.52%. During the twelve months ended at those dates, the average balance of overnight advances amounted to $426.5 million and $572.7 million, with weighted average interest rates of 0.59% and 0.44%. The interest expense generated by average overnight advances totaled $2.5 million and $2.5 million, respectively. During 2014, the average balance of overnight advances was $245.3 million with a weighted average interest rate of 0.37%. The interest expense generated by average overnight advances was $895,000 in 2014.
Total FHLB advances generated interest expense of $172.0 million, $230.6 million, and $255.0 million, respectively, in the years ended December 31, 2016, 2015, and 2014.
121
Table of Contents
Repurchase Agreements
The following table presents an analysis of the contractual maturities of the Company’s outstanding repurchase agreements accounted for as secured borrowings at December 31, 2016. None of these repurchase agreements had callable features.
| Contractual Maturity | ||||||||
| (dollars in thousands) Year of Maturity |
Amount | Weighted Average Interest Rate |
||||||
| 2017 |
$ | 1,250,000 | 1.19 | % | ||||
| 2018 |
250,000 | 3.06 | ||||||
|
|
|
|
|
|||||
| Total |
$ | 1,500,000 | 1.50 | % | ||||
|
|
|
|
|
|||||
The following table provides the contractual maturity and weighted average interest rate of repurchase agreements, and the amortized cost and fair value (including accrued interest) of the securities collateralizing the repurchase agreements, at December 31, 2016:
| Mortgage-Related and Other Securities |
GSE Debentures and U.S. Treasury Obligations |
|||||||||||||||||||||||
| (dollars in thousands) Contractual Maturity |
Amount | Weighted Average Interest Rate |
Amortized Cost |
Fair Value | Amortized Cost |
Fair Value | ||||||||||||||||||
| Greater than 90 days |
$ | 1,500,000 | 1.50 | % | $ | 1,307,121 | $ | 1,351,515 | $ | 256,217 | $ | 258,835 | ||||||||||||
The Company had no short-term repurchase agreements outstanding at December 31, 2016 or 2015. During the year ended December 31, 2015, the Company had average short-term repurchase agreements outstanding of $197.3 million with a weighted average interest rate of 0.31%, generating interest expense of $614,000. There were no short-term repurchase agreements outstanding during the year ended December 31, 2014.
At December 31, 2016 and 2015, the accrued interest on repurchase agreements amounted to $1.2 million and $1.2 million, respectively. The interest expense on repurchase agreements was $23.3 million, $99.9 million, and $119.3 million, respectively, in the years ended December 31, 2016, 2015, and 2014.
Federal Funds Purchased
At December 31, 2016 and 2015, respectively, the balance of federal funds purchased was $150.0 million and $426.0 million, with weighted average interest rates of 0.75% and 0.48%.
In 2016 and 2015, respectively, the average balances of federal funds purchased were to $525.4 million and $588.8 million, with weighted average interest rates of 0.51% and 0.26%. In 2014, the average balance of federal funds purchased amounted to $430.1 million with a weighted average interest rate of 0.25%. The interest expense produced by federal funds purchased was $2.7 million, $1.5 million, and $1.1 million, respectively, for the years ended December 31, 2016, 2015, and 2014.
Junior Subordinated Debentures
At December 31, 2016 and 2015, the Company had $358.9 million and $358.6 million, respectively, of outstanding junior subordinated deferrable interest debentures (“junior subordinated debentures”) held by statutory business trusts (the “Trusts”) that issued guaranteed capital securities.
The Trusts are accounted for as unconsolidated subsidiaries, in accordance with GAAP. The proceeds of each issuance were invested in a series of junior subordinated debentures of the Company and the underlying assets of each statutory business trust are the relevant debentures. The Company has fully and unconditionally guaranteed the obligations under each trust’s capital securities to the extent set forth in a guarantee by the Company to each trust. The Trusts’ capital securities are each subject to mandatory redemption, in whole or in part, upon repayment of the debentures at their stated maturity or earlier redemption.
122
Table of Contents
The following junior subordinated debentures were outstanding at December 31, 2016:
| Issuer |
Interest Rate of Capital Securities and Debentures |
Junior Subordinated Debentures Amount Outstanding |
Capital Securities Amount Outstanding |
Date of Original Issue |
Stated Maturity | First Optional Redemption Date | ||||||||||||
| (dollars in thousands) | ||||||||||||||||||
| New York Community Capital Trust V (BONUSESSM Units) |
6.000 | % | $ | 144,953 | $ | 138,602 | Nov. 4, 2002 | Nov. 1, 2051 | Nov. 4, 2007 (1) | |||||||||
| New York Community Capital Trust X |
2.563 | 123,712 | 120,000 | Dec. 14, 2006 | Dec. 15, 2036 | Dec. 15, 2011 (2) | ||||||||||||
| PennFed Capital Trust III |
4.213 | 30,928 | 30,000 | June 2, 2003 | June 15, 2033 | June 15, 2008 (2) | ||||||||||||
| New York Community Capital Trust XI |
2.648 | 59,286 | 57,500 | April 16, 2007 | June 30, 2037 | June 30, 2012 (2) | ||||||||||||
|
|
|
|
|
|||||||||||||||
| Total junior subordinated debentures |
$ | 358,879 | $ | 346,102 | ||||||||||||||
|
|
|
|
|
|||||||||||||||
| (1) | Callable subject to certain conditions as described in the prospectus filed with the U. S. Securities and Exchange Commission (the “SEC”) on November 4, 2002. |
| (2) | Callable from this date forward. |
The Bifurcated Option Note Unit SecuritiESSM (“BONUSES units”) included in the preceding table were issued by the Company on November 4, 2002 at a public offering price of $50.00 per share. Each of the 5,500,000 BONUSES units offered consisted of a capital security issued by New York Community Capital Trust V, a trust formed by the Company, and a warrant to purchase 2.4953 shares of the common stock of the Company (for a total of approximately 13.7 million common shares) at an effective exercise price of $20.04 per share. Each capital security has a maturity of 49 years, with a coupon, or distribution rate, of 6.00% on the $50.00 per share liquidation amount. The warrants and capital securities were non-callable for five years from the date of issuance and were not called by the Company when the five-year period passed on November 4, 2007.
The gross proceeds of the BONUSES units totaled $275.0 million and were allocated between the capital security and the warrant comprising such units in proportion to their relative values at the time of issuance. The value assigned to the warrants, $92.4 million, was recorded as a component of additional “paid-in capital” in the Company’s Consolidated Statement of Condition. The value assigned to the capital security component was $182.6 million. The $92.4 million difference between the assigned value and the stated liquidation amount of the capital securities was treated as an original issue discount, and is being amortized to interest expense over the 49-year life of the capital securities on a level-yield basis. At December 31, 2016, this discount totaled $66.7 million.
The other three trust preferred securities noted in the preceding table were formed for the purpose of issuing Company Obligated Mandatorily Redeemable Capital Securities of Subsidiary Trusts Holding Solely Junior Subordinated Debentures (collectively, the “Capital Securities”). Dividends on the Capital Securities are payable either quarterly or semi-annually and are deferrable, at the Company’s option, for up to five years. As of December 31, 2016, all dividends were current.
Effective January 1, 2016, the Capital Securities no longer qualified as tier I capital but did qualify 100% as tier II capital.
Interest expense on junior subordinated debentures was $18.5 million, $17.6 million, and $17.5 million, respectively, for the years ended December 31, 2016, 2015, and 2014.
123
Table of Contents
NOTE 9: FEDERAL, STATE, AND LOCAL TAXES
The following table summarizes the components of the Company’s net deferred tax asset (liability) at December 31, 2016 and 2015:
| December 31, | ||||||||
| (in thousands) | 2016 | 2015 | ||||||
| Deferred Tax Assets: |
||||||||
| Allowance for loan losses |
$ | 75,605 | $ | 73,835 | ||||
| Compensation and related benefit obligations |
27,877 | 31,112 | ||||||
| Acquisition accounting and fair value adjustments on securities (including OTTI) |
14,455 | 13,970 | ||||||
| Acquisition accounting and fair value adjustments on loans (including the FDIC loss share receivable) |
7,496 | — | ||||||
| Non-accrual interest |
4,791 | 6,107 | ||||||
| Restructuring and retirement of borrowed funds |
6,957 | 16,545 | ||||||
| Net operating loss carryforwards |
5,664 | 16,675 | ||||||
| Other |
18,351 | 19,723 | ||||||
|
|
|
|
|
|||||
| Gross deferred tax assets |
161,196 | 177,967 | ||||||
| Valuation allowance |
— | — | ||||||
|
|
|
|
|
|||||
| Deferred tax asset after valuation allowance |
$ | 161,196 | $ | 177,967 | ||||
|
|
|
|
|
|||||
| Deferred Tax Liabilities: |
||||||||
| Amortizable intangibles |
$ | (1,655 | ) | $ | (1,379 | ) | ||
| Acquisition accounting and fair value adjustments on loans (including the FDIC loss share receivable) |
— | (1,094 | ) | |||||
| Mortgage servicing rights |
(65,975 | ) | (53,370 | ) | ||||
| Premises and equipment |
(19,310 | ) | (20,120 | ) | ||||
| Prepaid pension cost |
(30,962 | ) | (27,056 | ) | ||||
| Leases |
(65,214 | ) | (50,658 | ) | ||||
| Other |
(10,691 | ) | (12,281 | ) | ||||
|
|
|
|
|
|||||
| Gross deferred tax liabilities |
$ | (193,807 | ) | $ | (165,958 | ) | ||
|
|
|
|
|
|||||
| Net deferred tax asset (liability) |
$ | (32,611 | ) | $ | 12,009 | |||
|
|
|
|
|
|||||
The net federal deferred tax liability, which is included in “Other liabilities,” and the net state and local deferred tax asset, which is included in “Other assets,” in the Consolidated Statements of Condition at December 31, 2016 and 2015, represent the anticipated federal, state, and local tax expenses or benefits that are expected to be realized in future years upon the utilization of the underlying tax attributes comprising said balances.
At December 31, 2016, the Company had a New York City net operating loss carryforward in the amount of $354.9 million available through 2035. The net operating loss carryforward is available to offset future taxable income.
The Company has determined that all deductible temporary differences and net operating loss carryforwards are more likely than not to provide a benefit in reducing future federal, state, and local tax liabilities, as applicable. The Company has reached this determination based on its history of reporting positive taxable income in all relevant tax jurisdictions, the length of time available to utilize the net operating loss carryforwards, and the recognition of taxable income in future periods from taxable temporary differences.
124
Table of Contents
The following table summarizes the Company’s income tax expense (benefit) for the years ended December 31, 2016, 2015, and 2014:
| December 31, | ||||||||||||
| (in thousands) | 2016 | 2015 | 2014 | |||||||||
| Federal – current |
$ | 216,182 | $ | (53,273 | ) | $ | 207,864 | |||||
| State and local – current |
20,799 | (295 | ) | 53,654 | ||||||||
|
|
|
|
|
|
|
|||||||
| Total current |
236,981 | (53,568 | ) | 261,518 | ||||||||
|
|
|
|
|
|
|
|||||||
| Federal – deferred |
18,203 | 468 | 23,814 | |||||||||
| State and local – deferred |
26,543 | (31,757 | ) | 2,337 | ||||||||
|
|
|
|
|
|
|
|||||||
| Total deferred |
44,746 | (31,289 | ) | 26,151 | ||||||||
|
|
|
|
|
|
|
|||||||
| Income tax expense (benefit) reported in net income |
281,727 | $ | (84,857 | ) | $ | 287,669 | ||||||
| Income tax expense (benefit) reported in stockholders’ equity related to: |
||||||||||||
| Employee stock plans |
— | (2,486 | ) | (3,225 | ) | |||||||
| Adoption of ASU No. 2014-01 |
— | — | 1,303 | |||||||||
| Securities available-for-sale |
(2,687 | ) | 131 | 1,851 | ||||||||
| Pension liability adjustments |
2,924 | (1,161 | ) | (14,992 | ) | |||||||
| Non-credit portion of OTTI losses |
49 | 44 | 142 | |||||||||
|
|
|
|
|
|
|
|||||||
| Total income taxes |
$ | 282,013 | $ | (88,329 | ) | $ | 272,748 | |||||
|
|
|
|
|
|
|
|||||||
The following table presents a reconciliation of statutory federal income tax expense (benefit) to combined actual income tax expense (benefit) reported in net income for the years ended December 31, 2016, 2015, and 2014:
| December 31, | ||||||||||||
| (in thousands) | 2016 | 2015 | 2014 | |||||||||
| Statutory federal income tax at 35% |
$ | 271,995 | $ | (46,204 | ) | $ | 270,573 | |||||
| State and local income taxes, net of federal income tax effect (1) |
30,772 | (20,835 | ) | 36,394 | ||||||||
| Effect of tax deductibility of ESOP |
(6,452 | ) | (7,321 | ) | (7,297 | ) | ||||||
| Non-taxable income and expense of BOLI |
(10,808 | ) | (9,575 | ) | (9,415 | ) | ||||||
| Federal tax credits |
(1,607 | ) | (1,554 | ) | (1,820 | ) | ||||||
| Adjustments relating to prior tax years |
(668 | ) | (248 | ) | (1,166 | ) | ||||||
| Merger-related expenses |
(850 | ) | 850 | — | ||||||||
| Other, net |
(655 | ) | 30 | 400 | ||||||||
|
|
|
|
|
|
|
|||||||
| Total income tax expense (benefit) |
$ | 281,727 | $ | (84,857 | ) | $ | 287,669 | |||||
|
|
|
|
|
|
|
|||||||
| (1) | Includes income tax (benefit) expense for the years ended December 31, 2015 and 2014 of $(1.4) million and $600,000, respectively, for adjustments to deferred taxes necessitated by changes in tax laws of New York City and New York State that were enacted in April 2015 and March 2014, respectively. |
The Company invests in affordable housing projects through limited partnerships that generate federal Low Income Housing Tax Credits. The balances of these investments, which are included in “Other assets” in the Consolidated Statements of Condition, were $42.4 million and $35.4 million, respectively, at December 31, 2016 and 2015, and included commitments of $21.9 million and $18.3 million that are expected to be funded over the next four years.
The Company elected to early adopt ASU No. 2014-01, effective January 1, 2014, and to apply the proportional amortization method to these investments. Retrospective application of the new accounting guidance would not have resulted in a material change to the prior-period presentations. Furthermore, the balance in retained earnings as of January 1, 2014 was reduced by $1.3 million to reflect the reduction of deferred tax assets relating to these investments. Recognized in the determination of income tax (benefit) expense from operations for the years ended December 31, 2016 and 2015 were $4.0 million and $3.2 million, respectively, of affordable housing tax credits and other tax benefits, and an offsetting $3.0 million and $2.4 million, respectively, for the amortization of the related investments. No impairment losses were recognized in relation to these investments for the years ended December 31, 2016 and 2015, and none of these investments were accounted for under the “equity method.” See Note 2, “Summary of Significant Accounting Policies” for additional information.
125
Table of Contents
In March 2014, tax legislation was enacted that changed the manner in which financial institutions and their affiliates are taxed in New York State. In April 2015, similar legislation was enacted for New York City. Most of the provisions were effective for fiscal years beginning in 2015. The most significant changes affecting the Company were as follows:
| • | The tax rate applied to apportioned New York State taxable income was reduced from 7.1% to 6.5%, effective for fiscal years beginning in 2016. For financial institutions with total assets below $100 billion, the New York City statutory tax rate dropped from 9% to 8.85%. |
| • | Tax is now determined by measuring the apportioned income of the combined group of all domestic affiliates that participate in a unitary business relationship. |
| • | Taxable income is apportioned based on the location of the taxpayer’s customers, with special rules for income from certain financial transactions. |
| • | Thrift institutions that maintain a qualified residential loan portfolio are entitled to a specially computed modification that reduces taxable income. |
| • | New York City taxable income is reduced by net interest income earned on residential portfolio loans that are secured by rent-regulated units or situated in low-income communities in New York City. This benefit is gradually phased out for financial institutions with total assets between $100 billion and $150 billion. |
| • | An alternative tax of 0.15% on apportioned capital is imposed to the extent that it exceeds the tax on apportioned income. The New York State alternative tax is capped at $5 million for a tax year and is gradually phased out over six years. The New York City alternative tax is capped at $10 million for a tax year and is not phased out. |
| • | A reduction to taxable income from the utilization of a net operating loss carryforward is determined without reference to, nor limitation based on, a federal tax deduction of such carryforward. |
GAAP prescribes a recognition threshold and measurement attribute for use in connection with the obligation of a company to recognize, measure, present, and disclose in its financial statements uncertain tax positions that the Company has taken or expects to take on a tax return. As of December 31, 2016, the Company had $33.5 million of unrecognized gross tax benefits. Gross tax benefits do not reflect the federal tax effect associated with state tax amounts. The total amount of net unrecognized tax benefits at December 31, 2016 that would have affected the effective tax rate, if recognized, was $21.8 million.
Interest and penalties (if any) related to the underpayment of income taxes are classified as a component of income tax expense in the Consolidated Statements of Operations and Comprehensive Income (Loss). During the years ended December 31, 2016, 2015, and 2014, the Company recognized income tax expense attributed to interest and penalties of $1.2 million, $1.1 million, and $700,000, respectively. Accrued interest and penalties on tax liabilities were $6.9 million and $5.0 million, respectively, at December 31, 2016 and 2015.
The following table summarizes changes in the liability for unrecognized gross tax benefits for the years ended December 31, 2016, 2015, and 2014:
| December 31, | ||||||||||||
| (in thousands) | 2016 | 2015 | 2014 | |||||||||
| Uncertain tax positions at beginning of year |
$ | 30,456 | $ | 24,779 | $ | 20,250 | ||||||
| Additions for tax positions relating to current-year operations |
1,304 | 3,827 | 3,515 | |||||||||
| Additions for tax positions relating to prior tax years |
1,997 | 2,935 | 1,819 | |||||||||
| Subtractions for tax positions relating to prior tax years |
(270 | ) | (963 | ) | (929 | ) | ||||||
| Reductions in balance due to settlements |
— | (122 | ) | 124 | ||||||||
|
|
|
|
|
|
|
|||||||
| Uncertain tax positions at end of year |
$ | 33,487 | $ | 30,456 | $ | 24,779 | ||||||
|
|
|
|
|
|
|
|||||||
126
Table of Contents
The Company and its subsidiaries have filed tax returns in many states. The following are the more significant tax filings that are open for examination:
| • | Federal tax filings for tax years 2013 through the present; |
| • | New York State tax filings for tax years 2010 through the present; |
| • | New York City tax filings for tax years 2011 through the present; and |
| • | New Jersey tax filings for tax years 2012 through the present. |
In addition to other state audits, the Company is currently under examination by the following taxing jurisdictions of significance to the Company:
| • | New York State for the tax years 2010 through 2012; and |
| • | New York City for the tax years 2011 and 2012. |
It is reasonably possible that there will be developments within the next twelve months that would necessitate an adjustment to the balance of unrecognized tax benefits, including decreases of up to $14 million due to completion of tax authorities’ exams and the expiration of statutes of limitations.
As a savings institution, the Community Bank is subject to a special federal tax provision regarding its frozen tax bad debt reserve. At December 31, 2016, the Community Bank’s federal tax bad debt base-year reserve was $61.5 million, with a related federal deferred tax liability of $21.5 million, which has not been recognized since the Community Bank does not expect that this reserve will become taxable in the foreseeable future. Events that would result in taxation of this reserve include redemptions of the Community Bank’s stock or certain excess distributions by the Community Bank to the Company.
NOTE 10: COMMITMENTS AND CONTINGENCIES
Pledged Assets
The Company pledges securities to serve as collateral for its repurchase agreements, among other purposes. At December 31, 2016 and 2015, the Company had pledged mortgage-related securities held to maturity with a carrying value of $1.6 billion and $967.4 million, respectively . The Company also had pledged other securities held to maturity with a carrying value of $346.7 million and $1.2 billion at the corresponding dates. There were no pledged available-for-sale securities at December 31, 2016 or 2015. In addition, the Company had $29.4 billion and $21.5 billion of loans pledged to the FHLB-NY to serve as collateral for its wholesale borrowings at the respective year-ends.
Loan Commitments and Letters of Credit
At December 31, 2016 and 2015, the Company had commitments to originate loans, including unused lines of credit, of $2.1 billion and $2.8 billion, respectively. The majority of the outstanding loan commitments at those dates were expected to close within 90 days. In addition, the Company had commitments to originate letters of credit totaling $324.3 million and $296.5 million at December 31, 2016 and 2015.
The following table summarizes the Company’s off-balance sheet commitments to originate loans and letters of credit at December 31, 2016:
| (in thousands) | ||||
| Mortgage Loan Commitments: |
||||
| Multi-family and commercial real estate |
$ | 316,709 | ||
| One-to-four family |
271,230 | |||
| Acquisition, development, and construction |
317,234 | |||
|
|
|
|||
| Total mortgage loan commitments |
$ | 905,173 | ||
| Other loan commitments |
1,171,002 | |||
|
|
|
|||
| Total loan commitments |
$ | 2,076,175 | ||
| Commercial, performance stand-by, and financial stand-by letters of credit |
324,288 | |||
|
|
|
|||
| Total commitments |
$ | 2,400,463 | ||
|
|
|
|||
127
Table of Contents
Lease Commitments
At December 31, 2016, the Company was obligated under various non-cancelable operating lease and license agreements with renewal options on properties used primarily for branch operations. The Company currently expects to renew such agreements upon their expiration in the normal course of business. The agreements contain periodic escalation clauses that provide for increases in the annual rents, commencing at various times during the lives of the agreements, which are primarily based on increases in real estate taxes and cost-of-living indices.
The remaining projected minimum annual rental commitments under these agreements, exclusive of taxes and other charges, are summarized as follows:
| (in thousands) | ||||
| 2017 |
$ | 29,639 | ||
| 2018 |
26,281 | |||
| 2019 |
23,201 | |||
| 2020 |
17,099 | |||
| 2021 and thereafter |
64,038 | |||
|
|
|
|||
| Total minimum future rentals |
$ | 160,258 | ||
|
|
|
|||
The rental expense under these leases, which is included in “Occupancy and equipment expense” in the Consolidated Statements of Operations and Comprehensive Income (Loss), amounted to $32.6 million, $32.8 million, and $35.2 million, respectively, in the years ended December 31, 2016, 2015, and 2014. Rental income on Company-owned properties, netted in occupancy and equipment expense, was approximately $7.1 million, $3.7 million, and $3.6 million in the corresponding periods. There was no minimum future rental income under non-cancelable sub-lease agreements at December 31, 2016.
Financial Guarantees
The Company provides guarantees and indemnifications to its customers to enable them to complete a variety of business transactions and to enhance their credit standings. These guarantees are recorded at their respective fair values in “Other liabilities” in the Consolidated Statements of Condition. The Company deems the fair value of the guarantees to equal the consideration received.
The following table summarizes the Company’s guarantees and indemnifications at December 31, 2016:
| (in thousands) | Expires Within One Year |
Expires After One Year |
Total Outstanding Amount |
Maximum Potential Amount of Future Payments |
||||||||||||
| Financial stand-by letters of credit |
$ | 25,574 | $ | 51,279 | $ | 76,853 | $ | 237,870 | ||||||||
| Performance stand-by letters of credit |
8,891 | — | 8,891 | 7,880 | ||||||||||||
| Commercial letters of credit |
3,828 | 52 | 3,880 | 78,538 | ||||||||||||
|
|
|
|
|
|
|
|
|
|||||||||
| Total letters of credit |
$ | 38,293 | $ | 51,331 | $ | 89,624 | $ | 324,288 | ||||||||
|
|
|
|
|
|
|
|
|
|||||||||
The maximum potential amount of future payments represents the notional amounts that could be funded under the guarantees and indemnifications if there were a total default by the guaranteed parties or if indemnification provisions were triggered, as applicable, without consideration of possible recoveries under recourse provisions or from collateral held or pledged.
The Company collects fees upon the issuance of commercial and stand-by letters of credit. Fees for stand-by letters of credit fees are initially recorded by the Company as a liability, and are recognized as income periodically through the respective expiration dates. Fees for commercial letters of credit are collected and recognized as income at the time that they are issued and upon payment of each set of documents presented. In addition, the Company requires adequate collateral, typically in the form of cash, real property, and/or personal guarantees upon its issuance of Irrevocable Stand-by Letters of Credit. Commercial letters of credit are primarily secured by the goods being purchased in the underlying transaction and are also personally guaranteed by the owner(s) of the applicant company.
128
Table of Contents
Visa Inc.
In October 2007, Visa U.S.A., a subsidiary of Visa Inc. (“Visa”) completed a reorganization in contemplation of its initial public offering, which was subsequently completed in March 2008. As part of that reorganization, the Community Bank and the former Synergy Bank, along with many other banks across the nation, received shares of common stock of Visa. In accordance with GAAP, the Company did not recognize any value for this common stock ownership interest.
Visa claims that all Visa U.S.A. member banks are obligated to share in its losses stemming from certain litigation against it and certain other named member banks (the “Covered Litigation”). Visa continues to set aside amounts in an escrow account to fund any judgments or settlements that may arise from the Covered Litigation, and has reduced the amount of shares allocated to the Visa U.S.A. member banks by the amounts necessary to cover such liability. Nevertheless, Visa U.S.A. member banks were required to record a liability for the fair value of their related contingent obligation to Visa U.S.A., based on the percentage of their membership interest. The Company has a $443,000 liability based on its best estimate of the combined membership interest of the Community Bank and the former Synergy Bank with regard to both the settled and pending litigation in which Visa is involved.
Derivative Financial Instruments
The Company uses various financial instruments, including derivatives, in connection with its strategies to mitigate or reduce price risk resulting from changes in interest rates. The Company’s derivative financial instruments consist of financial forward and futures contracts, interest rate lock commitments (“IRLCs”), swaps, and options, and relate to mortgage banking operations, MSRs, and other risk management activities. These instruments vary in scope based on the level and volatility of interest rates, the types of assets held, and other changing market conditions. See Note 15, “Derivative Financial Instruments” for further information about our use of derivative financial instruments.
Legal Proceedings
Following the announcement on October 29, 2015 of the execution of the Company’s merger agreement with Astoria Financial Corporation (“Astoria Financial”), six putative class action lawsuits were filed in the Supreme Court of the State of New York, County of Nassau, challenging the proposed merger between Astoria Financial and New York Community Bancorp, Inc. (the “Company”). These actions are captioned: (1) Sandra E. Weiss IRA v. Chrin, et al., Index No. 607132/2015 (filed November 4, 2015); (2) Raul v. Palleschi, et al., Index No. 607238/2015 (filed November 6, 2015); (3) Lowinger v. Redman, et al., Index No. 607268/2015 (filed November 9, 2015); (4) Minzer v. Astoria Fin. Corp., et al., Index No. 607358/2015 (filed November 12, 2015); (5) MSS 12-09 Trust v. Palleschi, et al., Index No. 607472/2015 (filed November 13, 2015); and (6) Firemen’s Ret. Sys. of St. Louis v. Keegan, et al., Index No. 607612/2015 (filed November 23, 2015). On January 15, 2016, the court consolidated the New York Actions under the caption In re Astoria Financial Corporation Shareholders Litigation, Index No. 607132/2015 (the “New York Action”), and a consolidated amended complaint was filed on January 29, 2016. In addition, a seventh lawsuit was filed challenging the proposed transaction in the Delaware Court of Chancery, captioned O’Connell v. Astoria Financial Corp., et al., Case No. 11928 (filed January 22, 2016), which was dismissed voluntarily on September 26, 2016.
The New York Action is a putative class action filed on behalf of the stockholders of Astoria Financial and names as defendants Astoria Financial, its directors, and the Company. The consolidated amended complaint alleges, among other things, that the directors of Astoria Financial breached their fiduciary duties in connection with their approval of the merger agreement, including by: agreeing to an allegedly unfair price for Astoria Financial; approving the transaction notwithstanding alleged conflicts of interest; agreeing to deal protection devices that plaintiffs allege are unreasonable; and by failing to disclose certain facts about the process that led to the merger and financial analyses performed by Astoria Financial’s financial advisors. Plaintiffs also allege that the Company aided and abetted those alleged fiduciary breaches. The action seeks, among other things, an order enjoining completion of the proposed merger.
On April 6, 2016, the parties to the New York Action entered into a Memorandum of Understanding (“MOU”) setting out the terms of an agreement in principle to settle all claims alleged on behalf of the putative class relating to the merger, which were disclosed on April 8, 2016. The MOU provides, among other things, that Astoria Financial will make certain supplemental disclosures relating to the merger. The settlement is subject to, among other things, the execution of definitive documentation, the completion of the merger, and the approval by the court of the proposed settlement. In view of the termination of the proposed merger, the Company expects the settlement and the related MOU to be terminated.
129
Table of Contents
The Company believes that the factual allegations in the lawsuits are without merit and, in the event that plaintiffs seek to pursue those claims, would intend to defend vigorously against the allegations made by the plaintiffs.
In addition to the lawsuits noted above, the Company is involved in various other legal actions arising in the ordinary course of its business. All such actions in the aggregate involve amounts that are believed by management to be immaterial to the financial condition and results of operations of the Company.
NOTE 11: INTANGIBLE ASSETS
Goodwill
Goodwill is presumed to have an indefinite useful life and is tested for impairment, rather than amortized, at the reporting unit level, at least once a year. There were no changes in the carrying amount of goodwill during the years ended December 31, 2016 or 2015. Goodwill totaled $2.4 billion at each of these dates.
Core Deposit Intangibles
CDI is a measure of the value of checking and savings deposits acquired in a business combination. As previously noted, the Company has recognized CDI stemming from its various business combinations with other banks and thrifts. The fair value of the CDI stemming from any given business combination is based on the present value of the expected cost savings attributable to the core deposit funding acquired, relative to an alternative source of funding. CDI is amortized over the estimated useful lives of the existing deposit relationships acquired, but does not exceed 10 years. The Company evaluates such identifiable intangibles for impairment when an indication of impairment exists. No impairment charges were required to be recorded in 2016, 2015, or 2014. If an impairment loss is determined to exist in the future, the loss will be recorded in “Non-interest expense” in the Consolidated Statements of Operations and Comprehensive Income (Loss) for the period in which such impairment is identified.
Analysis of Core Deposit Intangibles
The following table summarizes the gross carrying and accumulated amortization amounts of the Company’s CDI as of December 31, 2016:
| (in thousands) | Gross Carrying Amount |
Accumulated Amortization |
Net Carrying Amount |
|||||||||
| Core deposit intangibles |
$ | 234,364 | $ | (234,156 | ) | $ | 208 | |||||
For the year ended December 31, 2016, amortization expenses related to CDI totaled $2.4 million. The Company assessed the useful lives of its intangible assets at December 31, 2016 and deemed them to be appropriate.
In 2017, the expense stemming from the amortization of CDI (i.e., $208,000) is expected to be fully amortized.
Mortgage Servicing Rights
The Company records a separate servicing asset representing the right to service third-party loans. Such MSRs are initially recorded at their fair value as a component of the sale proceeds. The fair values of MSRs are based on an analysis of discounted cash flows that incorporates estimates of (1) market servicing costs, (2) market-based estimates of ancillary servicing revenue, (3) market-based prepayment rates, and (4) market profit margins.
MSRs are subsequently measured at either fair value or amortized in proportion to, and over the period of, estimated net servicing income. The Company elects one of those methods on a class basis. A class is determined based on (1) the availability of market inputs used in determining the fair value of servicing assets, and/or (2) the Company’s method for managing the risks of servicing assets.
The Company had MSRs of $234.0 million and $247.7 million, respectively, at December 31, 2016 and 2015. Both period-end balances consisted of two classes of MSRs for which the economic risk is managed separately: residential MSRs (i.e., MSRs on one-to-four family loans sold, servicing retained) and participation MSRs (i.e., MSRs on loans sold through participations).
The total unpaid principal balance of loans serviced for others was $25.1 billion and $24.2 billion at December 31, 2016 and 2015, respectively.
130
Table of Contents
Residential MSRs are carried at fair value, with changes in fair value recorded as a component of non-interest income in each period. The Company uses various derivative instruments to mitigate the income statement-effect of changes in fair value due to changes in valuation inputs and assumptions regarding its residential MSRs. The effects of changes in the fair value of the derivatives are recorded as “Mortgage banking income,” which is included in “Non-interest income” in the Consolidated Statements of Operations and Comprehensive Income (Loss). MSRs do not trade in an active open market with readily observable prices. Accordingly, the Company utilizes a third-party valuation specialist to determine the fair value of its MSRs. This specialist determines fair value based on the present value of estimated future net servicing income cash flows, and incorporates assumptions that market participants would use to estimate fair value, including estimates of prepayment speeds, discount rates, default rates, refinance rates, servicing costs, escrow account earnings, contractual servicing fee income, and ancillary income. The specialist and the Company evaluate, and periodically adjust, as necessary, these underlying inputs and assumptions to reflect market conditions and changes in the assumptions that a market participant would consider in valuing MSRs.
The value of residential MSRs at any given time is significantly affected by the mortgage interest rates that are then available in the marketplace. These, in turn, influence mortgage loan prepayment speeds. The rate of prepayment of serviced residential loans is the most significant estimate involved in the measurement process. Actual prepayment rates may differ from those projected by management due to changes in a variety of economic factors, including prevailing interest rates and the availability of alternative financing sources to borrowers.
During periods of declining interest rates, the value of residential MSRs generally declines as an increase in mortgage refinancing activity results in an increase in prepayments and a decrease in the carrying value of residential MSRs through a charge to earnings in the current period. Conversely, during periods of rising interest rates, the value of residential MSRs generally increases as mortgage refinancing activity declines and the actual prepayments of loans being serviced occur more slowly than had been expected. This results in the carrying value of residential MSRs and servicing income being higher than previously anticipated. Accordingly, the value of residential MSRs that is actually realized could differ from the value initially recorded.
The collective amount of contractually specified servicing fees, late fees, and ancillary fees, which is recorded as “Mortgage banking income” in the Consolidated Statements of Operations and Comprehensive Income (Loss), were $1.3 million, $941,000, and $1.4 million for the years ended December 31, 2016, 2015, and 2014, respectively.
Participation MSRs are initially carried at fair value and are subsequently amortized and carried at the lower of their fair value or amortized amount. The amortization is recorded in proportion to, and over the period of, estimated net servicing income, with impairment of those servicing assets evaluated through an assessment of their fair value via a discounted cash-flow method. The net carrying value is compared to the discounted estimated future net cash flows to determine whether adjustments should be made to carrying values or amortization schedules. Impairment of participation MSRs is recognized through a valuation allowance and a charge to current-period earnings if it is considered to be temporary, or through a direct write-down of the asset and a charge to current-period earnings if it is considered to be other than temporary. The predominant risk characteristics of the underlying loans that are used to stratify the participation MSRs for measurement purposes generally include the (1) loan origination date, (2) loan rate, (3) loan type and size, (4) loan maturity date, and (5) geographic location. Changes in the carrying value of participation MSRs due to amortization or declines in fair value (i.e., impairment), if any, are reported in “Other income” in the period during which such changes occur. In the twelve months ended December 31, 2016, there was no impairment related to the Company’s participation MSRs.
131
Table of Contents
The following table presents the changes in the balances of residential MSRs and participation MSRs for the years ended December 31, 2016 and 2015:
| For the Years Ended December 31, | ||||||||||||||||
| 2016 | 2015(1) | |||||||||||||||
| (in thousands) | Residential | Participation | Residential | Participation | ||||||||||||
| Carrying value, beginning of year |
$ | 243,389 | $ | 4,345 | $ | 227,297 | $ | — | ||||||||
| Additions |
45,588 | 3,774 | 48,990 | 5,063 | ||||||||||||
| Increase (decrease) in fair value: |
||||||||||||||||
| Due to changes in interest rates |
3,341 | — | 11,981 | — | ||||||||||||
| Due to model assumption changes (2) |
(13,088 | ) | — | (1,506 | ) | — | ||||||||||
| Due to loan payoffs |
(33,425 | ) | — | (27,288 | ) | — | ||||||||||
| Due to passage of time and other changes |
(17,706 | ) | — | (16,085 | ) | — | ||||||||||
| Amortization |
— | (2,257 | ) | — | (718 | ) | ||||||||||
|
|
|
|
|
|
|
|
|
|||||||||
| Carrying value, end of period |
$ | 228,099 | $ | 5,862 | $ | 243,389 | $ | 4,345 | ||||||||
|
|
|
|
|
|
|
|
|
|||||||||
| (1) | The presentation of the 2015 amounts has been modified to conform with the 2016 presentation. |
| (2) | Represents changes in fair value driven by changes to the inputs to the valuation model related to assumed prepayment speeds. |
The following table presents the key assumptions used in calculating the fair value of the Company’s residential MSRs at the dates indicated:
| December 31, | ||||||||
| 2016 | 2015 | |||||||
| Expected weighted average life |
82 months | 92 months | ||||||
| Constant prepayment speed |
8.70 | % | 7.35 | % | ||||
| Discount rate |
10.05 | 10.01 | ||||||
| Primary mortgage rate to refinance |
4.11 | 4.03 | ||||||
| Cost to service (per loan per year): |
||||||||
| Current |
$ | 64 | $ | 63 | ||||
| 30-59 days or less delinquent |
214 | 213 | ||||||
| 60-89 days delinquent |
364 | 313 | ||||||
| 90-119 days delinquent |
464 | 413 | ||||||
| 120 days or more delinquent |
864 | 563 | ||||||
Reflecting the aging of the portfolio and increasing home price appreciation, the expected weighted average life of the Company’s residential MSRs decreased and, conversely, the constant prepayment speed rose. The year-over-year increase in the constant prepayment speed was primarily attributable to three factors: (1) The progressive aging of the servicing portfolio; (2) An increase in the housing price index used by our third-party valuation specialist suggesting that homebuyer demand has increased and newly created equity could lead to more refinancing; and (3) High consumer confidence indicators and lower unemployment rates, suggesting that a near-term reversal in home prices or affordability trends is unlikely.
NOTE 12: EMPLOYEE BENEFITS
Retirement Plan
On April 1, 2002, three separate pension plans for employees of the former Queens County Savings Bank, the former CFS Bank, and the former Richmond County Savings Bank were merged and renamed the “New York Community Bancorp Retirement Plan” (the “Retirement Plan”). The pension plan for employees of the former Roslyn Savings Bank was merged into the Retirement Plan on September 30, 2004. The pension plan for employees of the former Atlantic Bank of New York was merged into the Retirement Plan on March 31, 2008.
The Retirement Plan covers substantially all employees who had attained minimum age, service, and employment status requirements prior to the date when the individual plans were frozen by the banks of origin. Once frozen, the individual plans ceased to accrue additional benefits, service, and compensation factors, and became closed to employees who would otherwise have met eligibility requirements after the “freeze” date.
132
Table of Contents
The following table sets forth certain information regarding the Retirement Plan as of the dates indicated:
| December 31, | ||||||||
| (in thousands) | 2016 | 2015 | ||||||
| Change in Benefit Obligation: |
||||||||
| Benefit obligation at beginning of year |
$ | 146,618 | $ | 157,061 | ||||
| Interest cost |
5,881 | 6,063 | ||||||
| Actuarial loss (gain) |
611 | (7,891 | ) | |||||
| Annuity payments |
(6,473 | ) | (6,339 | ) | ||||
| Settlements |
(208 | ) | (2,276 | ) | ||||
|
|
|
|
|
|||||
| Benefit obligation at end of year |
$ | 146,429 | $ | 146,618 | ||||
|
|
|
|
|
|||||
| Change in Plan Assets: |
||||||||
| Fair value of assets at beginning of year |
$ | 211,888 | $ | 222,990 | ||||
| Actual return (loss) on plan assets |
15,533 | (2,487 | ) | |||||
| Contributions |
— | — | ||||||
| Annuity payments |
(6,473 | ) | (6,339 | ) | ||||
| Settlements |
(208 | ) | (2,276 | ) | ||||
|
|
|
|
|
|||||
| Fair value of assets at end of year |
$ | 220,740 | $ | 211,888 | ||||
|
|
|
|
|
|||||
| Funded status (included in “Other assets”) |
$ | 74,311 | $ | 65,270 | ||||
|
|
|
|
|
|||||
| Changes recognized in other comprehensive income (loss) for the year ended December 31: |
||||||||
| Amortization of prior service cost |
$ | — | $ | — | ||||
| Amortization of actuarial loss |
(9,050) | (8,208 | ) | |||||
| Net actuarial loss arising during the year |
706 | 12,155 | ||||||
|
|
|
|
|
|||||
| Total recognized in other comprehensive loss for the year (pre-tax) |
$(8,344) | $ | 3,947 | |||||
|
|
|
|
|
|||||
| Accumulated other comprehensive loss (pre-tax) not yet recognized in net periodic benefit cost at December 31: |
||||||||
| Prior service cost |
$ | — | $ | — | ||||
| Actuarial loss, net |
79,541 | 87,885 | ||||||
|
|
|
|
|
|||||
| Total accumulated other comprehensive loss (pre-tax) |
$ | 79,541 | $ | 87,885 | ||||
|
|
|
|
|
|||||
In 2017, an estimated $8.2 million of unrecognized net actuarial loss for the Retirement Plan will be amortized from AOCL into net periodic benefit cost. The comparable amount recognized as net periodic benefit cost in 2016 was $9.0 million. No prior service cost will be amortized in 2017 and none was amortized in 2016. The discount rates used to determine the benefit obligation at December 31, 2016 and 2015 were 3.9% and 4.1%, respectively.
The discount rate reflects rates at which the benefit obligation could be effectively settled. To determine this rate, the Company considers rates of return on high-quality fixed-income investments that are currently available and are expected to be available during the period until the pension benefits are paid. The expected future payments are discounted based on a portfolio of high-quality rated bonds (above-median AA curve) for which the Company relies on the Citigroup Pension Liability Index that is published as of the measurement date.
The components of net periodic pension credit were as follows for the years indicated:
| Years Ended December 31, | ||||||||||||
| (in thousands) | 2016 | 2015 | 2014 | |||||||||
| Components of net periodic pension credit: |
||||||||||||
| Interest cost |
$ | 5,881 | $ | 6,063 | $ | 5,895 | ||||||
| Expected return on plan assets |
(15,627 | ) | (17,559 | ) | (19,435 | ) | ||||||
| Amortization of net actuarial loss |
9,050 | 8,208 | 3,289 | |||||||||
|
|
|
|
|
|
|
|||||||
| Net periodic pension credit |
$ | (696 | ) | $ | (3,288 | ) | $ | (10,251 | ) | |||
|
|
|
|
|
|
|
|||||||
133
Table of Contents
The following table indicates the weighted average assumptions used in determining the net periodic benefit cost for the years indicated:
| Years Ended December 31, | ||||||||||||
| 2016 | 2015 | 2014 | ||||||||||
| Discount rate |
4.1 | % | 4.0 | % | 4.8 | % | ||||||
| Expected rate of return on plan assets |
7.5 | 8.0 | 9.0 | |||||||||
As of December 31, 2016, Retirement Plan assets were invested in two diversified investment portfolios of the Pentegra Retirement Trust (the “Trust”) (formerly known as “RSI Retirement Trust”), a private placement investment fund.
The Company (in this context, the “Plan Sponsor”) chooses the specific asset allocation for the Retirement Plan within the parameters set forth in the Trust’s Investment Policy Statement. The long-term investment objectives are to maintain the Retirement Plan’s assets at a level that will sufficiently cover the Plan Sponsor’s long-term obligations, and to generate a return on those assets that will meet or exceed the rate at which the Plan Sponsor’s long-term obligations will grow.
The Retirement Plan allocates its assets in accordance with the following targets:
| • | To hold 55% of its assets in equity securities via investment in the Trust’s Long-Term Growth—Equity (“LTGE”) Portfolio, a diversified portfolio that invests in a number of actively and passively managed equity mutual funds and collective trusts in order to diversify within U.S. and non-U.S. equity markets; |
| • | To hold 44% of its assets in intermediate-term investment-grade bonds via investment in the Trust’s Long-Term Growth—Fixed Income (“LTGFI”) Portfolio, a diversified portfolio that invests in a number of fixed-income mutual funds and collective investment trusts, primarily including intermediate-term bond funds with a focus on U.S. investment grade securities and opportunistic allocations to below-investment grade and non-U.S. investments; and |
| • | To hold 1% of its assets in a cash-equivalent portfolio for liquidity purposes. |
In addition, the Retirement Plan holds Company shares, the value of which is approximately equal to 11% of the assets that are held by the Trust.
The LTGE and LTGFI portfolios are designed to provide long-term growth of equity and fixed-income assets with the objective of achieving an investment return in excess of the cost of funding the active life, deferred vesting, and all 30-year term and longer obligations of retired lives in the Trust. Risk and volatility are further managed in accordance with the distinct investment objectives of the Trust’s respective portfolios.
134
Table of Contents
The following table presents information about the fair value measurements of the investments held by the Retirement Plan as of December 31, 2016:
| (in thousands) | Total | Quoted Prices in Active Markets for Identical Assets (Level 1) |
Significant Other Observable Inputs (Level 2) |
Significant Unobservable Inputs (Level 3) |
||||||||||||
| Equity: |
||||||||||||||||
| Large-cap value (1) |
$ | 19,735 | $ | — | $ | 19,735 | $ | — | ||||||||
| Large-cap growth (2) |
17,726 | — | 17,726 | — | ||||||||||||
| Large-cap core (3) |
12,549 | — | 12,549 | — | ||||||||||||
| Mid-cap value (4) |
4,203 | — | 4,203 | — | ||||||||||||
| Mid-cap growth (5) |
3,825 | — | 3,825 | — | ||||||||||||
| Mid-cap core (6) |
4,303 | — | 4,303 | — | ||||||||||||
| Small-cap value (7) |
3,441 | — | 3,441 | — | ||||||||||||
| Small-cap growth (8) |
2,887 | — | 2,887 | — | ||||||||||||
| Small-cap core (9) |
6,432 | — | 6,432 | — | ||||||||||||
| International equity (10) |
23,302 | — | 23,302 | — | ||||||||||||
| Fixed Income Funds: |
||||||||||||||||
| Fixed Income – U.S. Core (11) |
70,912 | — | 70,912 | — | ||||||||||||
| Intermediate duration (12) |
24,312 | — | 24,312 | — | ||||||||||||
| Equity Securities: |
||||||||||||||||
| Company common stock |
24,403 | 24,403 | — | — | ||||||||||||
| Cash Equivalents: |
— | |||||||||||||||
| Money market * |
2,710 | 1,092 | 1,618 | — | ||||||||||||
|
|
|
|
|
|
|
|
|
|||||||||
| $ | 220,740 | $ | 25,495 | $ | 195,245 | $ | — | |||||||||
|
|
|
|
|
|
|
|
|
|||||||||
| * | Includes cash equivalent investments in equity and fixed income strategies. |
| (1) | This category contains large-cap stocks with above-average yields. The portfolio typically holds between 60 and 70 stocks. |
| (2) | This category seeks long-term capital appreciation by investing primarily in large growth companies based in the U.S. |
| (3) | This fund tracks the performance of the S&P 500 Index by purchasing the securities represented in the Index in approximately the same weightings as the Index. |
| (4) | This category employs an indexing investment approach designed to track the performance of the Center for Research in Security Prices (“CRSP”) U.S. Mid-Cap Value Index. |
| (5) | This category employs an indexing investment approach designed to track the performance of the CRSP U.S. Mid-Cap Growth Index. |
| (6) | This category seeks to track the performance of the S&P Midcap 400 Index. |
| (7) | This category consists of a selection of investments based on the Russell 2000 Value Index. |
| (8) | This category consists of a selection of investments based on the Russell 2000 Growth Index. |
| (9) | This category consists of an index fund designed to track the Russell 2000, along with a fund investing in readily marketable securities of U.S. companies with market capitalizations within the smallest 10% of the market universe, or smaller than the 1000th largest U.S. company. |
| (10) | This category has investments in medium to large non-U.S. companies, including high quality, durable growth companies and companies based in countries with stable economic and political systems. A portion of this category consists of an index fund designed to track the Morgan Stanley and Capital International Group All Country World Index (“MSCI ACWI”) ex-U.S. Net Dividend Return Index. |
| (11) | This category currently includes equal investments in three mutual funds, two of which usually hold at least 80% of fund assets in investment-grade fixed income securities, seeking to outperform the Barclays U.S. Aggregate Bond Index while maintaining a similar duration to that index. The third fund targets investments of 50% or more in mortgage-backed securities guaranteed by the U.S. government and its agencies. |
| (12) | This category consists of a mutual fund that invests in a diversified portfolio of high-quality bonds and other fixed income securities, including U.S. Government obligations, mortgage-related and asset-backed securities, corporate and municipal bonds, CMOs, and other securities that are mostly rated “A” or better. |
135
Table of Contents
Current Asset Allocation
The asset allocations for the Retirement Plan as of December 31, 2016 and 2015 were as follows:
| At December 31, | ||||||||
| 2016 | 2015 | |||||||
| Equity securities |
56 | % | 55 | % | ||||
| Debt securities |
43 | 44 | ||||||
| Cash equivalents |
1 | 1 | ||||||
|
|
|
|
|
|||||
| Total |
100 | % | 100 | % | ||||
|
|
|
|
|
|||||
Determination of Long-Term Rate of Return
The long-term rate of return on Retirement Plan assets assumption was based on historical returns earned by equities and fixed income securities, and adjusted to reflect expectations of future returns as applied to the Retirement Plan’s target allocation of asset classes. Equities and fixed income securities were assumed to earn long-term rates of return in the ranges of 6% to 8% and 3% to 5%, respectively, with an assumed long-term inflation rate of 2.5% reflected within these ranges. When these overall return expectations are applied to the Retirement Plan’s target allocations, the result is an expected rate of return of 5% to 8%.
Expected Contributions
The Company does not expect to contribute to the Retirement Plan in 2017.
Expected Future Annuity Payments
The following annuity payments, which reflect expected future service, as appropriate, are expected to be paid by the Retirement Plan during the years indicated:
| (in thousands) | ||||
| 2017 |
$ | 7,077 | ||
| 2018 |
7,158 | |||
| 2019 |
7,310 | |||
| 2020 |
7,385 | |||
| 2021 |
7,532 | |||
| 2022 and thereafter |
39,526 | |||
|
|
|
|||
| Total |
$ | 75,988 | ||
|
|
|
|||
Qualified Savings Plan
The Company maintains a defined contribution qualified savings plan in which all full-time employees are able to participate after three months of service and having attained age 21. No matching contributions are made by the Company to this plan.
Post-Retirement Health and Welfare Benefits
The Company offers certain post-retirement benefits, including medical, dental, and life insurance (the “Health & Welfare Plan”) to retired employees, depending on age and years of service at the time of retirement. The costs of such benefits are accrued during the years that an employee renders the necessary service.
The Health & Welfare Plan is an unfunded plan and is not expected to hold assets for investment at any time. Any contributions made to the Health & Welfare Plan are used to immediately pay plan premiums and claims as they come due.
136
Table of Contents
The following table sets forth certain information regarding the Health & Welfare Plan as of the dates indicated:
| December 31, | ||||||||
| (in thousands) | 2016 | 2015 | ||||||
| Change in benefit obligation: |
||||||||
| Benefit obligation at beginning of year |
$ | 17,280 | $ | 18,375 | ||||
| Service cost |
5 | 4 | ||||||
| Interest cost |
639 | 700 | ||||||
| Actuarial gain |
(673 | ) | (880 | ) | ||||
| Premiums and claims paid |
(957 | ) | (919 | ) | ||||
|
|
|
|
|
|||||
| Benefit obligation at end of year |
$ | 16,294 | $ | 17,280 | ||||
|
|
|
|
|
|||||
| Change in plan assets: |
||||||||
| Fair value of assets at beginning of year |
$ | — | $ | — | ||||
| Employer contribution |
957 | 919 | ||||||
| Premiums and claims paid |
(957 | ) | (919 | ) | ||||
|
|
|
|
|
|||||
| Fair value of assets at end of year |
$ | — | $ | — | ||||
|
|
|
|
|
|||||
| Funded status (included in “Other liabilities”) |
$ | (16,294 | ) | $ | (17,280 | ) | ||
|
|
|
|
|
|||||
| Changes recognized in other comprehensive (loss) income for the year ended December 31: |
||||||||
| Amortization of prior service cost |
$ | 249 | $ | 249 | ||||
| Amortization of actuarial gain |
(326 | ) | (383 | ) | ||||
| Net actuarial (gain) loss arising during the year |
(673 | ) | (880 | ) | ||||
|
|
|
|
|
|||||
| Total recognized in other comprehensive loss for the year (pre-tax) |
$ | (750 | ) | $ | (1,014 | ) | ||
|
|
|
|
|
|||||
| Accumulated other comprehensive loss (pre-tax) not yet recognized in net periodic benefit cost at December 31: |
||||||||
| Prior service cost |
$ | (1,283 | ) | $ | (1,533 | ) | ||
| Actuarial loss, net |
5,137 | 6,137 | ||||||
|
|
|
|
|
|||||
| Total accumulated other comprehensive loss (pre-tax) |
$ | 3,854 | $ | 4,604 | ||||
|
|
|
|
|
|||||
The discount rates used in the preceding table were 3.7% and 3.8%, respectively, at December 31, 2016 and 2015.
The estimated net actuarial loss and the prior service liability that will be amortized from AOCL into net periodic benefit cost in 2017 are $275,000 and $249,000, respectively.
The following table presents the components of net periodic benefit cost for the years indicated:
| Years Ended December 31, | ||||||||||||
| (in thousands) | 2016 | 2015 | 2014 | |||||||||
| Components of Net Periodic Benefit Cost: |
||||||||||||
| Service cost |
$ | 5 | $ | 4 | $ | 4 | ||||||
| Interest cost |
639 | 700 | 759 | |||||||||
| Amortization of past-service liability |
(249 | ) | (249 | ) | (249 | ) | ||||||
| Amortization of net actuarial loss |
326 | 383 | 474 | |||||||||
|
|
|
|
|
|
|
|||||||
| Net periodic benefit cost |
$ | 721 | $ | 838 | $ | 988 | ||||||
|
|
|
|
|
|
|
|||||||
The following table presents the weighted average assumptions used in determining the net periodic benefit cost for the years indicated:
| Years Ended December 31, | ||||||||||||
| 2016 | 2015 | 2014 | ||||||||||
| Discount rate |
3.8 | % | 4.0 | % | 4.3 | % | ||||||
| Current medical trend rate |
6.5 | 6.5 | 7.0 | |||||||||
| Ultimate trend rate |
5.0 | 5.0 | 5.0 | |||||||||
| Year when ultimate trend rate will be reached |
2022 | 2018 | 2018 | |||||||||
137
Table of Contents
Had the assumed medical trend rate at December 31, 2016 increased by 1% for each future year, the accumulated post-retirement benefit obligation at that date would have increased by $768,000, and the aggregate of the benefits earned and the interest components of 2016 net post-retirement benefit cost would each have increased by $32,000. Had the assumed medical trend rate decreased by 1% for each future year, the accumulated post-retirement benefit obligation at December 31, 2016 would have declined by $645,000, and the aggregate of the benefits earned and the interest components of 2016 net post-retirement benefit cost would each have declined by $27,000.
Expected Contributions
The Company expects to contribute $1.3 million to the Health & Welfare Plan to pay premiums and claims in the fiscal year ending December 31, 2017.
Expected Future Payments for Premiums and Claims
The following amounts are currently expected to be paid for premiums and claims during the years indicated under the Health & Welfare Plan:
| (in thousands) | ||||
| 2017 |
$ | 1,307 | ||
| 2018 |
1,277 | |||
| 2019 |
1,238 | |||
| 2020 |
1,202 | |||
| 2021 |
1,165 | |||
| 2022 and thereafter |
5,220 | |||
|
|
|
|||
| Total |
$ | 11,409 | ||
|
|
|
|||
NOTE 13: STOCK-RELATED BENEFIT PLANS
New York Community Bank Employee Stock Ownership Plan
All full-time employees who have attained 21 years of age and have completed twelve consecutive months of credited service are eligible to participate in the Employee Stock Ownership Plan (“ESOP”), with benefits vesting on a six-year basis, starting with 20% in the second year of employment and continuing in 20% increments in each successive year. Benefits are payable upon death, retirement, disability, or separation from service, and may be paid in stock. However, in the event of a change in control, as defined in the ESOP, any unvested portion of benefits shall vest immediately.
In 2016, 2015, and 2014, the Company allocated 617,031; 552,829; and 560,228 shares, respectively, to participants in the ESOP. For the years ended December 31, 2016, 2015, and 2014, the Company recorded ESOP-related compensation expense of $9.8 million, $9.2 million, and $8.8 million, respectively.
Supplemental Executive Retirement Plan
In 1993, the Community Bank established a Supplemental Executive Retirement Plan (“SERP”), which provided additional unfunded, non-qualified benefits to certain participants in the ESOP in the form of Company common stock. The SERP was frozen in 1999. Trust-held assets, consisting entirely of Company common stock, amounted to 1,729,319 and 1,653,737 shares, respectively, at December 31, 2016 and 2015, including shares purchased through dividend reinvestment. The cost of these shares is reflected as a reduction of paid-in capital in excess of par in the Consolidated Statements of Condition.
Stock Incentive and Stock Option Plans
At December 31, 2016, the Company had a total of 9,646,760 shares available for grants as options, restricted stock, or other forms of related rights under the New York Community Bancorp, Inc. 2012 Stock Incentive Plan (the “2012 Stock Incentive Plan”), which was approved by the Company’s shareholders at its Annual Meeting on June 7, 2012. The Company granted 2,805,652 shares of restricted stock, with an average fair value of $15.21 per share on the date of grant, during the twelve months ended December 31, 2016. During 2015 and 2014, the Company granted 2,352,641 shares and 2,377,498 shares, respectively, of restricted stock, which had average fair values of $15.83 and $16.79 per share on the respective grant dates. The shares of restricted stock that were granted during the years ended December 31, 2016, 2015, and 2014 vest over a period of five years. Compensation and benefits expense related to the restricted stock grants is recognized on a straight-line basis over the vesting period and totaled $32.7 million, $30.2 million, and $27.5 million, respectively, for the years ended December 31, 2016, 2015, and 2014.
138
Table of Contents
The following table provides a summary of activity with regard to restricted stock awards in the year ended December 31, 2016:
| For the Year Ended December 31, 2016 |
||||||||
| Number of Shares | Weighted Average Grant Date Fair Value |
|||||||
| Unvested at beginning of year |
6,362,117 | $ | 15.44 | |||||
| Granted |
2,805,652 | 15.21 | ||||||
| Vested |
(2,007,863 | ) | 15.37 | |||||
| Cancelled |
(229,600 | ) | 15.23 | |||||
|
|
|
|||||||
| Unvested at end of year |
6,930,306 | 15.37 | ||||||
|
|
|
|||||||
As of December 31, 2016, unrecognized compensation cost relating to unvested restricted stock totaled $77.4 million. This amount will be recognized over a remaining weighted average period of 2.9 years.
In addition, at December 31, 2016 and 2015, the Company had no stock option plans. At December 31, 2015, the Company had options outstanding under the 2004 Synergy Financial Group Stock Option Plan (the “Stock Option Plan”), all of which expired on March 1, 2016.
The Company uses the modified prospective approach to recognize compensation costs related to share-based payments at fair value on the date of grant, and recognizes such costs in the financial statements over the vesting period during which the employee provides service in exchange for the grant. As there were no unvested stock options at any time during 2016, 2015, or 2014, the Company did not record any compensation and benefits expense relating to stock options during those years.
To satisfy the exercise of options, the Company either issued new shares of common stock or used common stock held in Treasury. In the event that Treasury stock was used, the difference between the average cost of Treasury shares and the exercise price was recorded as an adjustment to retained earnings or paid-in capital on the date of exercise. At December 31, 2016, 2015, and 2014, respectively, there were 0; 2,400; and 58,560 stock options outstanding.
The status of the Stock Option Plan at December 31, 2016, and the changes that occurred during the year ended at that date, are summarized below:
| For the Year Ended December 31, 2016 | ||||||||
| Number of Stock Options |
Weighted Average Exercise Price |
|||||||
| Stock options outstanding, beginning of year |
2,400 | $ | 16.88 | |||||
| Exercised |
— | — | ||||||
| Expired |
(2,400 | ) | 16.88 | |||||
|
|
|
|||||||
| Stock options outstanding, end of year |
— | — | ||||||
| Options exercisable at year-end |
— | — | ||||||
|
|
|
|||||||
There were no stock options outstanding or exercisable at December 31, 2016 and no options were exercised during the twelve months ended at that date. At December 31, 2015, the stock options outstanding and exercisable had no intrinsic value, and no options were exercised during the twelve months ended at that date. The intrinsic value of options exercised during the twelve months ended December 31, 2014 was $132,000.
139
Table of Contents
NOTE 14: FAIR VALUE MEASUREMENTS
GAAP sets forth a definition of fair value, establishes a consistent framework for measuring fair value, and requires disclosure for each major asset and liability category measured at fair value on either a recurring or non-recurring basis. GAAP also clarifies that fair value is an “exit” price, representing the amount that would be received when selling an asset, or paid when transferring a liability, in an orderly transaction between market participants. Fair value is thus a market-based measurement that should be determined based on assumptions that market participants would use in pricing an asset or liability. As a basis for considering such assumptions, GAAP establishes a three-tier fair value hierarchy, which prioritizes the inputs used in measuring fair value as follows:
| • | Level 1 – Inputs to the valuation methodology are quoted prices (unadjusted) for identical assets or liabilities in active markets. |
| • | Level 2 – Inputs to the valuation methodology include quoted prices for similar assets and liabilities in active markets, and inputs that are observable for the asset or liability, either directly or indirectly, for substantially the full term of the financial instrument. |
| • | Level 3 – Inputs to the valuation methodology are significant unobservable inputs that reflect a company’s own assumptions about the assumptions that market participants use in pricing an asset or liability. |
A financial instrument’s categorization within this valuation hierarchy is based upon the lowest level of input that is significant to the fair value measurement.
The following tables present assets and liabilities that were measured at fair value on a recurring basis as of December 31, 2016 and 2015, and that were included in the Company’s Consolidated Statements of Condition at those dates:
| Fair Value Measurements at December 31, 2016 | ||||||||||||||||||||
| (in thousands) | Quoted Prices in Active Markets for Identical Assets (Level 1) |
Significant Other Observable Inputs (Level 2) |
Significant Unobservable Inputs (Level 3) |
Netting Adjustments(1) |
Total Fair Value |
|||||||||||||||
| Assets: |
||||||||||||||||||||
| Mortgage-Related Securities Available for Sale: |
||||||||||||||||||||
| GSE certificates |
$ | — | $ | 7,326 | $ | — | $ | — | $ | 7,326 | ||||||||||
|
|
|
|
|
|
|
|
|
|
|
|||||||||||
| Total mortgage-related securities |
$ | — | $ | 7,326 | $ | — | $ | — | $ | 7,326 | ||||||||||
|
|
|
|
|
|
|
|
|
|
|
|||||||||||
| Other Securities Available for Sale: |
||||||||||||||||||||
| Municipal bonds |
$ | — | $ | 631 | $ | — | $ | — | $ | 631 | ||||||||||
| Capital trust notes |
— | 7,243 | — | — | 7,243 | |||||||||||||||
| Preferred stock |
42,724 | 29,260 | — | — | 71,984 | |||||||||||||||
| Mutual funds and common stock |
— | 17,097 | — | — | 17,097 | |||||||||||||||
|
|
|
|
|
|
|
|
|
|
|
|||||||||||
| Total other securities |
$ | 42,724 | $ | 54,231 | $ | — | $ | — | $ | 96,955 | ||||||||||
|
|
|
|
|
|
|
|
|
|
|
|||||||||||
| Total securities available for sale |
$ | 42,724 | $ | 61,557 | $ | — | $ | — | $ | 104,281 | ||||||||||
|
|
|
|
|
|
|
|
|
|
|
|||||||||||
| Other Assets: |
||||||||||||||||||||
| Loans held for sale |
$ | — | $ | 409,152 | $ | — | $ | — | $ | 409,152 | ||||||||||
| Mortgage servicing rights |
— | — | 228,099 | — | 228,099 | |||||||||||||||
| Interest rate lock commitments |
— | — | 982 | — | 982 | |||||||||||||||
| Derivative assets-other (2) |
2,611 | 16,829 | — | (17,861 | ) | 1,579 | ||||||||||||||
| Liabilities: |
||||||||||||||||||||
| Derivative liabilities |
$ | (6,009 | ) | $ | (17,719 | ) | $ | — | $ | 16,588 | $ | (7,140 | ) | |||||||
| (1) | Includes cash collateral received from, and paid to, counterparties. |
| (2) | Includes $1.9 million to purchase Treasury options. |
140
Table of Contents
| Fair Value Measurements at December 31, 2015 | ||||||||||||||||||||
| (in thousands) | Quoted Prices in Active Markets for Identical Assets (Level 1) |
Significant Other Observable Inputs (Level 2) |
Significant Unobservable Inputs (Level 3) |
Netting Adjustments(1) |
Total Fair Value |
|||||||||||||||
| Assets: |
||||||||||||||||||||
| Mortgage-Related Securities Available for Sale: |
||||||||||||||||||||
| GSE certificates |
$ | — | $ | 53,852 | $ | — | $ | — | $ | 53,852 | ||||||||||
|
|
|
|
|
|
|
|
|
|
|
|||||||||||
| Total mortgage-related securities |
$ | — | $ | 53,852 | $ | — | $ | — | $ | 53,852 | ||||||||||
|
|
|
|
|
|
|
|
|
|
|
|||||||||||
| Other Securities Available for Sale: |
||||||||||||||||||||
| Municipal bonds |
$ | — | $ | 795 | $ | — | $ | — | $ | 795 | ||||||||||
| Capital trust notes |
— | 6,964 | — | — | 6,964 | |||||||||||||||
| Preferred stock |
96,641 | 28,731 | — | — | 125,372 | |||||||||||||||
| Mutual funds and common stock |
— | 17,272 | — | — | 17,272 | |||||||||||||||
|
|
|
|
|
|
|
|
|
|
|
|||||||||||
| Total other securities |
$ | 96,641 | $ | 53,762 | $ | — | $ | — | $ | 150,403 | ||||||||||
|
|
|
|
|
|
|
|
|
|
|
|||||||||||
| Total securities available for sale |
$ | 96,641 | $ | 107,614 | $ | — | $ | — | $ | 204,255 | ||||||||||
|
|
|
|
|
|
|
|
|
|
|
|||||||||||
| Other Assets: |
||||||||||||||||||||
| Loans held for sale |
$ | — | $ | 367,221 | $ | — | $ | — | $ | 367,221 | ||||||||||
| Mortgage servicing rights |
— | — | 243,389 | — | 243,389 | |||||||||||||||
| Interest rate lock commitments |
— | — | 2,526 | — | 2,526 | |||||||||||||||
| Derivative assets-other (2) |
1,875 | 1,342 | — | (1,024 | ) | 2,193 | ||||||||||||||
| Liabilities: |
||||||||||||||||||||
| Derivative liabilities |
$ | (1,539 | ) | $ | (2,783 | ) | $ | — | $ | 3,986 | $ | (336 | ) | |||||||
| (1) | Includes cash collateral received from, and paid to, counterparties. |
| (2) | Includes $1.9 million to purchase Treasury options. |
The Company reviews and updates the fair value hierarchy classifications for its assets on a quarterly basis. Changes from one quarter to the next that are related to the observability of inputs for a fair value measurement may result in a reclassification from one hierarchy level to another.
A description of the methods and significant assumptions utilized in estimating the fair values of available-for-sale securities follows:
Where quoted prices are available in an active market, securities are classified within Level 1 of the valuation hierarchy. Level 1 securities include highly liquid government securities, exchange-traded securities, and derivatives.
If quoted market prices are not available for a specific security, then fair values are estimated by using pricing models. These pricing models primarily use market-based or independently sourced market parameters as inputs, including, but not limited to, yield curves, interest rates, equity or debt prices, and credit spreads. In addition to observable market information, models incorporate transaction details such as maturity and cash flow assumptions. Securities valued in this manner would generally be classified within Level 2 of the valuation hierarchy, and primarily include such instruments as mortgage-related and corporate debt securities.
Periodically, the Company uses fair values supplied by independent pricing services to corroborate the fair values derived from the pricing models. In addition, the Company reviews the fair values supplied by independent pricing services, as well as their underlying pricing methodologies, for reasonableness. The Company challenges pricing service valuations that appear to be unusual or unexpected.
The Company carries loans held for sale originated by its mortgage banking operation at fair value. The fair value of loans held for sale is primarily based on quoted market prices for securities backed by similar types of loans. Changes in the fair value of these assets are largely driven by changes in interest rates subsequent to loan funding, and changes in the fair value of servicing associated with the mortgage loans held for sale. Loans held for sale are classified within Level 2 of the valuation hierarchy.
141
Table of Contents
MSRs do not trade in an active open market with readily observable prices. The Company bases the fair value of its MSRs on the present value of estimated future net servicing income cash flows, utilizing a third-party valuation specialist. The specialist estimates future net servicing income cash flows with assumptions that market participants would use to estimate fair value, including estimates of prepayment speeds, discount rates, default rates, refinance rates, servicing costs, escrow account earnings, contractual servicing fee income, and ancillary income. The Company periodically adjusts the underlying inputs and assumptions to reflect market conditions and assumptions that a market participant would consider in valuing the MSR asset. MSR fair value measurements use significant unobservable inputs and, accordingly, are classified within Level 3.
Exchange-traded derivatives that are valued using quoted prices are classified within Level 1 of the valuation hierarchy. The majority of the Company’s derivative positions are valued using internally developed models that use readily observable market parameters as their basis. These are parameters that are actively quoted and can be validated by external sources, including industry pricing services. Where the types of derivative products have been in existence for some time, the Company uses models that are widely accepted in the financial services industry. These models reflect the contractual terms of the derivatives, including the period to maturity, and market-based parameters such as interest rates, volatility, and the credit quality of the counterparty. Furthermore, many of these models do not contain a high level of subjectivity, as the methodologies used in the models do not require significant judgment, and inputs to the models are readily observable from actively quoted markets, as is the case for “plain vanilla” interest rate swaps and option contracts. Such instruments are generally classified within Level 2 of the valuation hierarchy. Derivatives that are valued based on models with significant unobservable market parameters, and that are normally traded less actively, have trade activity that is one-way, and/or are traded in less-developed markets, are classified within Level 3 of the valuation hierarchy.
The fair values of IRLCs for residential mortgage loans that the Company intends to sell are based on internally developed models. The key model inputs primarily include the sum of the value of the forward commitment based on the loans’ expected settlement dates and the projected values of the MSRs, loan level price adjustment factors, and historical IRLC closing ratios. The closing ratio is computed by the Company’s mortgage banking operation and is periodically reviewed by management for reasonableness. Such derivatives are classified as Level 3.
While the Company believes its valuation methods are appropriate, and consistent with those of other market participants, the use of different methodologies or assumptions to determine the fair values of certain financial instruments could result in different estimates of fair values at a reporting date.
Fair Value Option
Loans Held for Sale
The Company has elected the fair value option for its loans held for sale. The Company’s loans held for sale consist of one-to-four family mortgage loans, none of which was 90 days or more past due at December 31, 2016. Management believes that the mortgage banking business operates on a short-term cycle. Therefore, in order to reflect the most relevant valuations for the key components of this business, and to reduce timing differences in amounts recognized in earnings, the Company has elected to record loans held for sale at fair value to match the recognition of IRLCs, MSRs, and derivatives, all of which are recorded at fair value in earnings. Fair value is based on independent quoted market prices of mortgage-backed securities comprised of loans with similar features to those of the Company’s loans held for sale, where available, and adjusted as necessary for such items as servicing value, guaranty fee premiums, and credit spread adjustments.
The following table reflects the difference between the fair value carrying amount of loans held for sale, for which the Company has elected the fair value option, and the unpaid principal balance:
| December 31, 2016 | December 31, 2015 | |||||||||||||||||||||||
| (in thousands) | Fair Value Carrying Amount |
Aggregate Unpaid Principal |
Fair Value Carrying Amount Less Aggregate Unpaid Principal |
Fair Value Carrying Amount |
Aggregate Unpaid Principal |
Fair Value Carrying Amount Less Aggregate Unpaid Principal |
||||||||||||||||||
| Loans held for sale |
$ | 409,152 | $ | 408,928 | $ | 224 | $ | 367,221 | $ | 359,587 | $ | 7,634 | ||||||||||||
142
Table of Contents
Gains and Losses Included in Income for Assets Where the Fair Value Option Has Been Elected
The assets accounted for under the fair value option are initially measured at fair value. Gains and losses from the initial measurement and subsequent changes in fair value are recognized in earnings. The following table presents the changes in fair value related to initial measurement, and the subsequent changes in fair value included in earnings, for loans held for sale and MSRs for the periods indicated:
| (Loss) Gain Included in Mortgage Banking Income from Changes in Fair Value(1) |
||||||||||||
| For the Twelve Months Ended December 31, | ||||||||||||
| (in thousands) | 2016 | 2015(2) | 2014(2) | |||||||||
| Loans held for sale |
$ | (5,616 | ) | $ | (472 | ) | $ | 4,961 | ||||
| Mortgage servicing rights |
(27,453 | ) | (5,610 | ) | (31,541 | ) | ||||||
|
|
|
|
|
|
|
|||||||
| Total (loss) gain |
$ | (33,069 | ) | $ | (6,082 | ) | $ | (26,580 | ) | |||
|
|
|
|
|
|
|
|||||||
| (1) | Does not include the effect of hedging activities, which is included in “Other non-interest income.” |
| (2) | The presentation of the 2015 and 2014 amounts has been modified to conform with the 2016 presentation. |
The Company has determined that there is no instrument-specific credit risk related to its loans held for sale, due to the short duration of such assets.
143
Table of Contents
Changes in Level 3 Fair Value Measurements
The following tables present, for the twelve months ended December 31, 2016 and 2015, a roll-forward of the balance sheet amounts (including changes in fair value) for financial instruments classified in Level 3 of the valuation hierarchy:
| (in thousands) | Fair Value January 1, 2016 |
Total Realized/Unrealized (Losses)/Gains Recorded in |
Issuances | Settlements | Transfers to/(from) Level 3 |
Fair Value at Dec. 31, 2016 |
Change in Unrealized (Losses)/Gains Related to Instruments Held at December 31, 2016 |
|||||||||||||||||||||||||
| (Loss)/ Income |
Comprehensive (Loss) Income |
|||||||||||||||||||||||||||||||
| Mortgage servicing rights |
$ | 243,389 | $ | (27,453 | ) | $ | — | $ | 45,588 | $ | (33,425 | ) | $ | — | $ | 228,099 | $ | (27,453 | ) | |||||||||||||
| Interest rate lock commitments |
2,526 | (1,544 | ) | — | — | — | — | 982 | 982 | |||||||||||||||||||||||
| (in thousands) | Fair Value January 1, 2015 |
Total Realized/Unrealized (Losses)/Gains Recorded in |
Issuances | Settlements | Transfers to/(from) Level 3 |
Fair Value at Dec. 31, 2015 |
Change in Unrealized (Losses)/Gains Related to Instruments Held at December 31, 2015 |
|||||||||||||||||||||||||
| (Loss)/ Income |
Comprehensive (Loss) Income |
|||||||||||||||||||||||||||||||
| Mortgage servicing rights |
$ | 227,297 | $ | (5,610 | ) | $ | — | $ | 48,990 | $ | (27,288 | ) | $ | — | $ | 243,389 | $ | (5,610 | ) | |||||||||||||
| Interest rate lock commitments |
4,397 | (1,871 | ) | — | — | — | — | 2,526 | 2,526 | |||||||||||||||||||||||
The Company’s policy is to recognize transfers in and out of Levels 1, 2, and 3 as of the end of the reporting period. There were no transfers in or out of Levels 1, 2, or 3 during the twelve months ended December 31, 2016. During the twelve months ended December 31, 2015, the Company transferred certain mutual funds to Level 2 from Level 1 as a result of decreased observable market activity for these securities. There were no gains or losses recognized as a result of the transfer of securities during the twelve months ended December 31, 2015.
144
Table of Contents
For Level 3 assets and liabilities measured at fair value on a recurring basis as of December 31, 2016, the significant unobservable inputs used in the fair value measurements were as follows:
| (dollars in thousands) | Fair Value at Dec. 31, 2016 |
Valuation Technique |
Significant Unobservable Inputs |
Significant Unobservable Input Value |
||||||||
| Mortgage servicing rights |
$ | 228,099 | Discounted Cash Flow |
Weighted Average Constant Prepayment Rate (1) |
8.70 | % | ||||||
| Weighted Average Discount Rate |
10.05 | |||||||||||
| Interest rate lock commitments |
982 | Discounted Cash Flow |
Weighted Average Closing Ratio |
69.28 | ||||||||
| (1) | Represents annualized loan repayment rate assumptions. |
The significant unobservable inputs used in the fair value measurement of the Company’s MSRs are the weighted average constant prepayment rate and the weighted average discount rate. Significant increases or decreases in either of those inputs in isolation could result in significantly lower or higher fair value measurements. Although the constant prepayment rate and the discount rate are not directly interrelated, they generally move in opposite directions.
The significant unobservable input used in the fair value measurement of the Company’s IRLCs is the closing ratio, which represents the percentage of loans currently in an interest rate lock position that management estimates will ultimately close. Generally, the fair value of an IRLC is positive if the prevailing interest rate is lower than the IRLC rate, and the fair value of an IRLC is negative if the prevailing interest rate is higher than the IRLC rate. Therefore, an increase in the closing ratio (i.e., a higher percentage of loans estimated to close) will result in the fair value of the IRLC increasing if in a gain position, or decreasing if in a loss position. The closing ratio is largely dependent on the stage of processing that a loan is currently in, and the change in prevailing interest rates from the time of the interest rate lock.
Assets Measured at Fair Value on a Non-Recurring Basis
Certain assets are measured at fair value on a non-recurring basis. Such instruments are subject to fair value adjustments under certain circumstances (e.g., when there is evidence of impairment). The following tables present assets and liabilities that were measured at fair value on a non-recurring basis as of December 31, 2016 and 2015, and that were included in the Company’s consolidated statements of condition at those dates:
| Fair Value Measurements at December 31, 2016 Using | ||||||||||||||||
| (in thousands) | Quoted Prices in Active Markets for Identical Assets (Level 1) |
Significant Other Observable Inputs (Level 2) |
Significant Unobservable Inputs (Level 3) |
Total Fair Value |
||||||||||||
| Certain impaired loans (1) |
$ | — | $ | — | $ | 15,635 | $ | 15,635 | ||||||||
| Other assets (2) |
— | — | 5,684 | 5,684 | ||||||||||||
|
|
|
|
|
|
|
|
|
|||||||||
| Total |
$ | — | $ | — | $ | 21,319 | $ | 21,319 | ||||||||
|
|
|
|
|
|
|
|
|
|||||||||
| (1) | Represents the fair value of impaired loans, based on the value of the collateral. |
| (2) | Represents the fair value of OREO, based on the appraised value of the collateral subsequent to its initial classification as OREO. |
| Fair Value Measurements at December 31, 2015 Using | ||||||||||||||||
| (in thousands) | Quoted Prices in Active Markets for Identical Assets (Level 1) |
Significant Other Observable Inputs (Level 2) |
Significant Unobservable Inputs (Level 3) |
Total Fair Value |
||||||||||||
| Certain impaired loans (1) |
$ | — | $ | — | $ | 3,930 | $ | 3,930 | ||||||||
| Other assets (2) |
— | — | 7,982 | 7,982 | ||||||||||||
|
|
|
|
|
|
|
|
|
|||||||||
| Total |
$ | — | $ | — | $ | 11,912 | $ | 11,912 | ||||||||
|
|
|
|
|
|
|
|
|
|||||||||
| (1) | Represents the fair value of impaired loans, based on the value of the collateral. |
| (2) | Represents the fair value of OREO, based on the appraised value of the collateral subsequent to its initial classification as OREO. |
145
Table of Contents
The fair values of collateral-dependent impaired loans are determined using various valuation techniques, including consideration of appraised values and other pertinent real estate market data.
Other Fair Value Disclosures
GAAP requires the disclosure of fair value information about the Company’s on- and off-balance sheet financial instruments. When available, quoted market prices are used as the measure of fair value. In cases where quoted market prices are not available, fair values are based on present-value estimates or other valuation techniques. Such fair values are significantly affected by the assumptions used, the timing of future cash flows, and the discount rate.
Because assumptions are inherently subjective in nature, estimated fair values cannot be substantiated by comparison to independent market quotes. Furthermore, in many cases, the estimated fair values provided would not necessarily be realized in an immediate sale or settlement of such instruments.
The following tables summarize the carrying values, estimated fair values, and fair value measurement levels of financial instruments that were not carried at fair value on the Company’s Consolidated Statements of Condition at December 31, 2016 and 2015:
| December 31, 2016 | ||||||||||||||||||||
| Fair Value Measurement Using | ||||||||||||||||||||
| (in thousands) | Carrying Value |
Estimated Fair Value |
Quoted Prices in Active Markets for Identical Assets (Level 1) |
Significant Other Observable Inputs (Level 2) |
Significant Unobservable Inputs (Level 3) |
|||||||||||||||
| Financial Assets: |
||||||||||||||||||||
| Cash and cash equivalents |
$ | 557,850 | $ | 557,850 | $ | 557,850 | $ | — | $ | — | ||||||||||
| Securities held to maturity |
3,712,776 | 3,813,959 | 200,220 | 3,613,739 | — | |||||||||||||||
| FHLB stock (1) |
590,934 | 590,934 | — | 590,934 | — | |||||||||||||||
| Loans, net |
39,308,016 | 39,416,469 | — | — | 39,416,469 | |||||||||||||||
| Financial Liabilities: |
||||||||||||||||||||
| Deposits |
$ | 28,887,903 | $ | 28,888,064 | $ | 21,310,733 | (2) | $ | 7,577,331 | (3) | $ | — | ||||||||
| Borrowed funds |
13,673,379 | 13,633,943 | — | 13,633,943 | — | |||||||||||||||
| (1) | Carrying value and estimated fair value are at cost. |
| (2) | NOW and money market accounts, savings accounts, and non-interest-bearing accounts. |
| (3) | Certificates of deposit. |
| December 31, 2015 | ||||||||||||||||||||
| Fair Value Measurement Using | ||||||||||||||||||||
| (in thousands) | Carrying Value |
Estimated Fair Value |
Quoted Prices in Active Markets for Identical Assets (Level 1) |
Significant Other Observable Inputs (Level 2) |
Significant Unobservable Inputs (Level 3) |
|||||||||||||||
| Financial Assets: |
||||||||||||||||||||
| Cash and cash equivalents |
$ | 537,674 | $ | 537,674 | $ | 537,674 | $ | — | $ | — | ||||||||||
| Securities held to maturity |
5,969,390 | 6,108,529 | — | 6,107,697 | 832 | |||||||||||||||
| FHLB stock (1) |
663,971 | 663,971 | — | 663,971 | — | |||||||||||||||
| Loans, net |
38,011,995 | 38,245,434 | — | — | 38,245,434 | |||||||||||||||
| Financial Liabilities: |
||||||||||||||||||||
| Deposits |
$ | 28,426,758 | $ | 28,408,915 | $ | 23,114,271 | (2) | $ | 5,294,644 | (3) | $ | — | ||||||||
| Borrowed funds |
15,748,405 | 15,685,616 | — | 15,685,616 | — | |||||||||||||||
| (1) | Carrying value and estimated fair value are at cost. |
| (2) | NOW and money market accounts, savings accounts, and non-interest-bearing accounts. |
| (3) | Certificates of deposit. |
146
Table of Contents
The methods and significant assumptions used to estimate fair values for the Company’s financial instruments follow:
Cash and Cash Equivalents
Cash and cash equivalents include cash and due from banks and federal funds sold. The estimated fair values of cash and cash equivalents are assumed to equal their carrying values, as these financial instruments are either due on demand or have short-term maturities.
Securities
If quoted market prices are not available for a specific security, then fair values are estimated by using pricing models, quoted prices of securities with similar characteristics, or discounted cash flows. These pricing models primarily use market-based or independently sourced market parameters as inputs, including, but not limited to, yield curves, interest rates, equity or debt prices, and credit spreads. In addition to observable market information, pricing models also incorporate transaction details such as maturities and cash flow assumptions.
Federal Home Loan Bank Stock
Ownership in equity securities of the FHLB is restricted and there is no established market for their resale. The carrying amount approximates the fair value.
Loans
The loan portfolio is segregated into various components for valuation purposes in order to group loans based on their significant financial characteristics, such as loan type (mortgage or other) and payment status (performing or non-performing). The estimated fair values of mortgage and other loans are computed by discounting the anticipated cash flows from the respective portfolios. The discount rates reflect current market rates for loans with similar terms to borrowers of similar credit quality. The estimated fair values of non-performing mortgage and other loans are based on recent collateral appraisals.
The methods used to estimate the fair values of loans are extremely sensitive to the assumptions and estimates used. While management has attempted to use assumptions and estimates that best reflect the Company’s loan portfolio and current market conditions, a greater degree of subjectivity is inherent in these values than in those determined in active markets. Accordingly, readers are cautioned in using this information for purposes of evaluating the financial condition and/or value of the Company in and of itself, or in comparison with that of any other company.
Mortgage Servicing Rights
MSRs do not trade in an active market with readily observable prices. Accordingly, the Company bases the fair value of its MSRs on a valuation performed by a third-party valuation specialist. This specialist determines fair value based on the present value of estimated future net servicing income cash flows, and incorporates assumptions that market participants would use to estimate fair value, including estimates of prepayment speeds, discount rates, default rates, refinance rates, servicing costs, escrow account earnings, contractual servicing fee income, and ancillary income. The specialist and the Company evaluate, and periodically adjust, as necessary, these underlying inputs and assumptions to reflect market conditions and changes in the assumptions that a market participant would consider in valuing MSRs.
Derivative Financial Instruments
For exchange-traded futures and exchange-traded options, fair value is based on observable quoted market prices in an active market. For forward commitments to buy and sell loans and mortgage-backed securities, fair value is based on observable market prices for similar loans and securities in an active market. The fair value of IRLCs for one-to-four family mortgage loans that the Company intends to sell is based on internally developed models. The key model inputs primarily include the sum of the value of the forward commitment based on the loans’ expected settlement dates, the value of MSRs arrived at by an independent MSR broker, government agency price adjustment factors, and historical IRLC fall-out factors.
147
Table of Contents
Deposits
The fair values of deposit liabilities with no stated maturity (i.e., NOW and money market accounts, savings accounts, and non-interest-bearing accounts) are equal to the carrying amounts payable on demand. The fair values of CDs represent contractual cash flows, discounted using interest rates currently offered on deposits with similar characteristics and remaining maturities. These estimated fair values do not include the intangible value of core deposit relationships, which comprise a significant portion of the Company’s deposit base.
Borrowed Funds
The estimated fair value of borrowed funds is based either on bid quotations received from securities dealers or the discounted value of contractual cash flows with interest rates currently in effect for borrowed funds with similar maturities and structures.
Off-Balance Sheet Financial Instruments
The fair values of commitments to extend credit and unadvanced lines of credit are estimated based on an analysis of the interest rates and fees currently charged to enter into similar transactions, considering the remaining terms of the commitments and the creditworthiness of the potential borrowers. The estimated fair values of such off-balance sheet financial instruments were insignificant at December 31, 2016 and 2015.
NOTE 15: DERIVATIVE FINANCIAL INSTRUMENTS
The Company’s derivative financial instruments consist of financial forward and futures contracts, interest rate swaps, IRLCs, and options. These derivatives relate to mortgage banking operations, residential MSRs, and other risk management activities, and seek to mitigate or reduce the Company’s exposure to losses from adverse changes in interest rates. These activities will vary in scope based on the level and volatility of interest rates, other changing market conditions, and the types of assets held.
In accordance with the applicable accounting guidance, the Company takes into account the impact of collateral and master netting agreements that allow it to settle all derivative contracts held with a single counterparty on a net basis, and to offset the net derivative position with the related collateral when recognizing derivative assets and liabilities. As a result, the Company’s Statements of Financial Condition could reflect derivative contracts with negative fair values that are included in derivative assets, and contracts with positive fair values that are included in derivative liabilities.
The Company held derivatives with a notional amount of $2.8 billion at December 31, 2016. Changes in the fair value of these derivatives are reflected in current-period earnings. None of these derivatives are designated as hedges for accounting purposes.
The Company uses various financial instruments, including derivatives, in connection with its strategies to reduce pricing risk resulting from changes in interest rates. Derivative instruments may include IRLCs entered into with borrowers or correspondents/brokers to acquire agency-conforming fixed and adjustable rate residential mortgage loans that will be held for sale, as well as Treasury options and Eurodollar futures.
The Company enters into forward contracts to sell fixed rate mortgage-backed securities to protect against changes in the prices of agency-conforming fixed rate loans held for sale. Forward contracts are entered into with securities dealers in an amount related to the portion of IRLCs that is expected to close. The value of these forward sales contracts moves inversely with the value of the loans in response to changes in interest rates.
To manage the price risk associated with fixed-rate non-conforming mortgage loans, the Company generally enters into forward contracts on mortgage-backed securities or forward commitments to sell loans to approved investors. Short positions in Eurodollar futures contracts are used to manage price risk on adjustable rate mortgage loans held for sale.
The Company uses interest rate swaps to hedge the fair value of its residential MSRs. The Company also purchases put and call options to manage the risk associated with variations in the amount of IRLCs that ultimately close.
148
Table of Contents
The following table sets forth information regarding the Company’s derivative financial instruments at December 31, 2016:
| December 31, 2016 | ||||||||||||
| (in thousands) | Notional Amount |
Unrealized (1) | ||||||||||
| Gain | Loss | |||||||||||
| Treasury options |
$ | 300,000 | $ | 44 | $ | 720 | ||||||
| Eurodollar futures |
75,000 | 135 | — | |||||||||
| Interest rate swaps |
350,000 | 572 | 5,289 | |||||||||
| Forward commitments to sell loans/mortgage-backed securities |
1,056,000 | 15,509 | 3,190 | |||||||||
| Forward commitments to buy loans/mortgage-backed securities |
785,000 | 1,321 | 14,529 | |||||||||
| Interest rate lock commitments |
257,928 | 982 | — | |||||||||
|
|
|
|
|
|
|
|||||||
| Total derivatives |
$ | 2,823,928 | $ | 18,563 | $ | 23,728 | ||||||
|
|
|
|
|
|
|
|||||||
| (1) | Derivatives in a net gain position are recorded as “Other assets” and derivatives in a net loss position are recorded as “Other liabilities” in the Consolidated Statements of Condition. |
In addition, the Company mitigates a portion of the risk associated with changes in the value of its residential MSRs. The general strategy for mitigating this risk is to purchase derivative instruments, the value of which changes in the opposite direction of interest rates. This action partially offsets changes in the value of its servicing assets, which tends to move in the same direction as interest rates. Accordingly, the Company purchases Eurodollar futures and call options on Treasury securities, and enters into forward contracts to purchase mortgage-backed securities.
The following table sets forth the effect of derivative instruments on the Consolidated Statements of Operations and Comprehensive Income (Loss) for the periods indicated:
| (Loss) Gain Included in Mortgage Banking Income | ||||||||||||
| For the Twelve Months Ended December 31, | ||||||||||||
| (in thousands) | 2016 | 2015 | 2014 | |||||||||
| Treasury options |
$ | (2,795 | ) | $ | (8,222 | ) | $ | 1,968 | ||||
| Treasury and Eurodollar futures |
165 | 501 | 333 | |||||||||
| Interest rate swaps |
(4,561 | ) | — | — | ||||||||
| Forward commitments to buy/sell loans/mortgage-backed securities |
(4,963 | ) | 5,752 | 12,009 | ||||||||
|
|
|
|
|
|
|
|||||||
| Total (loss) gain |
$ | (12,154 | ) | $ | (1,969 | ) | $ | 14,310 | ||||
|
|
|
|
|
|
|
|||||||
The Company has in place an enforceable master netting arrangement with every counterparty. All master netting arrangements include rights to offset associated with the Company’s recognized derivative assets, derivative liabilities, and the cash collateral received and pledged. Accordingly, the Company, where appropriate, offsets all derivative asset and liability positions with the cash collateral received and pledged.
149
Table of Contents
The following tables present the effect of the master netting arrangements on the presentation of the derivative assets in the Consolidated Statements of Condition as of the dates indicated:
| December 31, 2016 | ||||||||||||||||||||||||
| (in thousands) | Gross Amount of Recognized Assets (1) |
Gross Amount Offset in the Statement of Condition |
Net Amount of Assets Presented in the Statement of Condition |
Gross Amounts Not Offset in the Consolidated Statement of Condition |
Net Amount |
|||||||||||||||||||
| Financial Instruments |
Cash Collateral Received |
|||||||||||||||||||||||
| Derivatives |
$ | 20,422 | $ | 17,861 | $ | 2,561 | $ | — | $ | — | $ | 2,561 | ||||||||||||
| (1) | Includes $1.9 million to purchase Treasury options. |
| December 31, 2015 | ||||||||||||||||||||||||
| (in thousands) | Gross Amount of Recognized Assets (1) |
Gross Amount Offset in the Statement of Condition |
Net Amount of Assets Presented in the Statement of Condition |
Gross Amounts Not Offset in the Consolidated Statement of Condition |
Net Amount |
|||||||||||||||||||
| Financial Instruments |
Cash Collateral Received |
|||||||||||||||||||||||
| Derivatives |
$ | 5,743 | $ | 1,024 | $ | 4,719 | $ | — | $ | — | $ | 4,719 | ||||||||||||
| (1) | Includes $1.9 million to purchase Treasury options. |
The following tables present the effect the master netting arrangements had on the presentation of the derivative liabilities in the Consolidated Statements of Condition as of the dates indicated:
| December 31, 2016 | ||||||||||||||||||||||||
| (in thousands) | Gross Amount of Recognized Liabilities |
Gross Amount Offset in the Statement of Condition |
Net Amount of Liabilities Presented in the Statement of Condition |
Gross Amounts Not Offset in the Consolidated Statement of Condition |
Net Amount |
|||||||||||||||||||
| Financial Instruments |
Cash Collateral Pledged |
|||||||||||||||||||||||
| Derivatives |
$ | 23,728 | $ | 16,588 | $ | 7,140 | $ | — | $ | — | $ | 7,140 | ||||||||||||
| December 31, 2015 | ||||||||||||||||||||||||
| (in thousands) | Gross Amount of Recognized Liabilities |
Gross Amount Offset in the Statement of Condition |
Net Amount of Liabilities Presented in the Statement of Condition |
Gross Amounts Not Offset in the Consolidated Statement of Condition |
Net Amount |
|||||||||||||||||||
| Financial Instruments |
Cash Collateral Pledged |
|||||||||||||||||||||||
| Derivatives |
$ | 4,322 | $ | 3,986 | $ | 336 | $ | — | $ | — | $ | 336 | ||||||||||||
150
Table of Contents
NOTE 16: DIVIDEND RESTRICTIONS
The Parent Company is a separate legal entity from each of the Banks and must provide for its own liquidity. In addition to operating expenses and any share repurchases, the Parent Company is responsible for paying any dividends declared to the Company’s shareholders. As a Delaware corporation, the Parent Company is able to pay dividends either from surplus or, in case there is no surplus, from net profits for the fiscal year in which the dividend is declared and/or the preceding fiscal year.
As a result of the $546.8 million after-tax debt repositioning charge incurred in the twelve months ended December 31, 2015 (which resulted in the Company recording a net loss of $47.2 million for the year), and pursuant to the FRB’s Supervisory Letter SR 09-04, the Company was required to receive a non-objection from the FRB to pay cash dividends on its outstanding common stock throughout 2016. The Company received non-objections from the FRB for each of the four quarterly cash dividends it paid during the year. The FRB has advised the Company to continue the exchange of written documentation to obtain their non-objection to the declaration of dividends.
Various legal restrictions limit the extent to which the Company’s subsidiary banks can supply funds to the Parent Company and its non-bank subsidiaries. The Company’s subsidiary banks would require the approval of the Superintendent of the NYSDFS if the dividends they declared in any calendar year were to exceed the total of their respective net profits for that year combined with their respective retained net profits for the preceding two calendar years, less any required transfer to paid-in capital. The term “net profits” is defined as the remainder of all earnings from current operations plus actual recoveries on loans, investments, and other assets, after deducting from the total thereof all current operating expenses, actual losses if any, and all federal, state, and local taxes. In 2016, dividends of $330.0 million were paid by the Banks to the Parent Company; at December 31, 2016, the Banks could have paid additional dividends of $220.0 million to the Parent Company without regulatory approval.
NOTE 17: PARENT COMPANY-ONLY FINANCIAL INFORMATION
The following tables present the condensed financial statements for New York Community Bancorp, Inc. (parent company only):
Condensed Statements of Condition
| December 31, | ||||||||
| (in thousands) | 2016 | 2015 | ||||||
| ASSETS: |
||||||||
| Cash and cash equivalents |
$ | 63,727 | $ | 70,380 | ||||
| Securities available for sale |
2,002 | 1,968 | ||||||
| Investments in subsidiaries |
6,426,276 | 6,232,228 | ||||||
| Receivables from subsidiaries |
7,839 | 7,635 | ||||||
| Other assets |
34,102 | 34,418 | ||||||
|
|
|
|
|
|||||
| Total assets |
$ | 6,533,946 | $ | 6,346,629 | ||||
|
|
|
|
|
|||||
| LIABILITIES AND STOCKHOLDERS’ EQUITY: |
||||||||
| Junior subordinated debentures |
$ | 358,879 | $ | 358,605 | ||||
| Other liabilities |
51,076 | 53,328 | ||||||
|
|
|
|
|
|||||
| Total liabilities |
409,955 | 411,933 | ||||||
|
|
|
|
|
|||||
| Stockholders’ equity |
6,123,991 | 5,934,696 | ||||||
|
|
|
|
|
|||||
| Total liabilities and stockholders’ equity |
$ | 6,533,946 | $ | 6,346,629 | ||||
|
|
|
|
|
|||||
151
Table of Contents
Condensed Statements of Income (Loss)
| Years Ended December 31, | ||||||||||||
| (in thousands) | 2016 | 2015 | 2014 | |||||||||
| Interest income |
$ | 527 | $ | 1,027 | $ | 715 | ||||||
| Dividends received from subsidiaries |
330,000 | 345,000 | 410,000 | |||||||||
| Gain on sales of securities |
— | — | 261 | |||||||||
| Other income |
679 | 527 | 520 | |||||||||
|
|
|
|
|
|
|
|||||||
| Gross income |
331,206 | 346,554 | 411,496 | |||||||||
| Operating expenses |
49,157 | 48,255 | 42,370 | |||||||||
|
|
|
|
|
|
|
|||||||
| Income before income tax benefit and equity in underdistributed (overdistributed) earnings of subsidiaries |
282,049 | 298,299 | 369,126 | |||||||||
| Income tax benefit |
19,592 | 20,720 | 17,570 | |||||||||
|
|
|
|
|
|
|
|||||||
| Income before equity in underdistributed (overdistributed) earnings of subsidiaries |
301,641 | 319,019 | 386,696 | |||||||||
| Equity in underdistributed (overdistributed) earnings of subsidiaries |
193,760 | (366,175 | ) | 98,701 | ||||||||
|
|
|
|
|
|
|
|||||||
| Net income (loss) |
$ | 495,401 | $ | (47,156 | ) | $ | 485,397 | |||||
|
|
|
|
|
|
|
|||||||
Condensed Statements of Cash Flows
| Years Ended December 31, | ||||||||||||
| (in thousands) | 2016 | 2015 | 2014 | |||||||||
| CASH FLOWS FROM OPERATING ACTIVITIES: |
||||||||||||
| Net income (loss) |
$ | 495,401 | $ | (47,156 | ) | $ | 485,397 | |||||
| Change in other assets |
316 | (2,253 | ) | 293 | ||||||||
| Change in other liabilities |
(2,252 | ) | 22,236 | (2,807 | ) | |||||||
| Other, net |
33,333 | 32,955 | 30,739 | |||||||||
| Equity in overdistributed (underdistributed) earnings of subsidiaries |
(193,760 | ) | 366,175 | (98,701 | ) | |||||||
|
|
|
|
|
|
|
|||||||
| Net cash provided by operating activities |
$ | 333,038 | $ | 371,957 | $ | 414,921 | ||||||
|
|
|
|
|
|
|
|||||||
| CASH FLOWS FROM INVESTING ACTIVITIES: |
||||||||||||
| Proceeds from sales and repayments of securities |
$ | — | $ | — | $ | 566 | ||||||
| Change in receivable from subsidiaries, net |
(204 | ) | 224 | (2,707 | ) | |||||||
| Investment in subsidiaries |
— | (560,000 | ) | — | ||||||||
|
|
|
|
|
|
|
|||||||
| Net cash used in investing activities |
$ | (204 | ) | $ | (559,776 | ) | $ | (2,141 | ) | |||
|
|
|
|
|
|
|
|||||||
| CASH FLOWS FROM FINANCING ACTIVITIES: |
||||||||||||
| Treasury stock purchases |
$ | (8,677 | ) | $ | (7,020 | ) | $ | (7,283 | ) | |||
| Cash dividends paid on common stock |
(330,810 | ) | (453,981 | ) | (442,204 | ) | ||||||
| Net cash received from exercise of stock options |
— | — | 60 | |||||||||
| Proceeds from follow-on common stock offering ,net |
— | 629,682 | — | |||||||||
|
|
|
|
|
|
|
|||||||
| Net cash (used in) provided by financing activities |
$ | (339,487 | ) | $ | 168,681 | $ | (449,427 | ) | ||||
|
|
|
|
|
|
|
|||||||
| Net decrease in cash and cash equivalents |
(6,653 | ) | (19,138 | ) | (36,647 | ) | ||||||
| Cash and cash equivalents at beginning of year |
70,380 | 89,518 | 126,165 | |||||||||
|
|
|
|
|
|
|
|||||||
| Cash and cash equivalents at end of year |
$ | 63,727 | $ | 70,380 | $ | 89,518 | ||||||
|
|
|
|
|
|
|
|||||||
152
Table of Contents
NOTE 18: REGULATORY MATTERS
The Company is subject to examination, regulation, and periodic reporting under the Bank Holding Company Act of 1956, as amended, which is administered by the FRB. The FRB has adopted capital adequacy guidelines for bank holding companies (on a consolidated basis) that are substantially similar to those of the FDIC for the Banks.
The following tables present the regulatory capital ratios for the Company at December 31, 2016 and 2015, in comparison with the minimum amounts and ratios required by the FRB for capital adequacy purposes:
| Risk-Based Capital | ||||||||||||||||||||||||||||||||
| At December 31, 2016 | Common Equity Tier 1 |
Tier 1 | Total | Leverage Capital | ||||||||||||||||||||||||||||
| (dollars in thousands) | Amount | Ratio | Amount | Ratio | Amount | Ratio | Amount | Ratio | ||||||||||||||||||||||||
| Total capital |
$ | 3,748,231 | 10.62 | % | $ | 3,748,231 | 10.62 | % | $ | 4,277,759 | 12.12 | % | $ | 3,748,231 | 8.00 | % | ||||||||||||||||
| Minimum for capital adequacy purposes |
1,588,699 | 4.50 | 2,118,266 | 6.00 | 2,824,355 | 8.00 | 1,875,062 | 4.00 | ||||||||||||||||||||||||
|
|
|
|
|
|
|
|
|
|
|
|
|
|
|
|
|
|||||||||||||||||
| Excess |
$ | 2,159,532 | 6.12 | % | $ | 1,629,965 | 4.62 | % | $ | 1,453,404 | 4.12 | % | $ | 1,873,169 | 4.00 | % | ||||||||||||||||
|
|
|
|
|
|
|
|
|
|
|
|
|
|
|
|
|
|||||||||||||||||
| Risk-Based Capital | ||||||||||||||||||||||||||||||||
| At December 31, 2015 | Common Equity Tier 1 |
Tier 1 | Total | Leverage Capital | ||||||||||||||||||||||||||||
| (dollars in thousands) | Amount | Ratio | Amount | Ratio | Amount | Ratio | Amount | Ratio | ||||||||||||||||||||||||
| Total capital |
$ | 3,558,415 | 9.95 | % | $ | 3,644,872 | 10.19 | % | $ | 4,086,913 | 11.43 | % | $ | 3,644,872 | 7.77 | % | ||||||||||||||||
| Minimum for capital adequacy purposes |
1,609,639 | 4.50 | 2,146,186 | 6.00 | 2,861,581 | 8.00 | 1,876,006 | 4.00 | ||||||||||||||||||||||||
|
|
|
|
|
|
|
|
|
|
|
|
|
|
|
|
|
|||||||||||||||||
| Excess |
$ | 1,948,776 | 5.45 | % | $ | 1,498,686 | 4.19 | % | 1,225,332 | 3.43 | % | $ | 1,768,866 | 3.77 | % | |||||||||||||||||
|
|
|
|
|
|
|
|
|
|
|
|
|
|
|
|
|
|||||||||||||||||
In accordance with Basel III, the inclusion of trust preferred securities as tier 1 capital—which was reduced from 100% in 2014 to 25% in 2015—was completely phased out in 2016.
In addition, Basel III calls for the phase-in of a capital conservation buffer over a five-year period beginning with 0.625% in 2016 and reaching 2.50% in 2019, when fully phased in. At December 31, 2016, our total risk-based capital ratio exceeded the minimum requirement for capital adequacy purposes by 412 basis points and the fully phased-in capital conservation buffer by 162 basis points.
The Banks are subject to regulation, examination, and supervision by the NYSDFS and the FDIC (the “Regulators”). The Banks are also governed by numerous federal and state laws and regulations, including the FDIC Improvement Act of 1991, which established five categories of capital adequacy ranging from “well capitalized” to “critically undercapitalized.” Such classifications are used by the FDIC to determine various matters, including prompt corrective action and each institution’s FDIC deposit insurance premium assessments. Capital amounts and classifications are also subject to the Regulators’ qualitative judgments about the components of capital and risk weightings, among other factors.
The quantitative measures established to ensure capital adequacy require that banks maintain minimum amounts and ratios of leverage capital to average assets and of common equity tier 1 capital, tier 1 capital, and total capital to risk-weighted assets (as such measures are defined in the regulations). At December 31, 2016, the Banks exceeded all the capital adequacy requirements to which they were subject.
As of December 31, 2016, the Company, the Community Bank, and the Commercial Bank are categorized as “well capitalized” under the regulatory framework for prompt corrective action. To be categorized as well capitalized, a bank must maintain a minimum common equity tier 1 risk-based capital ratio of 6.50%; a minimum tier 1 risk-based capital ratio of 8.00%; a minimum total risk-based capital ratio of 10.00%; and a minimum leverage capital ratio of 5.00%. In the opinion of management, no conditions or events have transpired since December 31, 2016 to change these capital adequacy classifications.
153
Table of Contents
The following tables present the actual capital amounts and ratios for the Community Bank at December 31, 2016 and 2015 in comparison to the minimum amounts and ratios required for capital adequacy purposes.
| Risk-Based Capital | ||||||||||||||||||||||||||||||||
| At December 31, 2016 | Common Equity Tier 1 |
Tier 1 | Total | Leverage Capital | ||||||||||||||||||||||||||||
| (dollars in thousands) | Amount | Ratio | Amount | Ratio | Amount | Ratio | Amount | Ratio | ||||||||||||||||||||||||
| Total capital |
$ | 3,686,510 | 11.23 | % | $ | 3,686,510 | 11.23 | % | $ | 3,843,382 | 11.71 | % | $ | 3,686,510 | 8.45 | % | ||||||||||||||||
| Minimum for capital adequacy purposes |
1,477,056 | 4.50 | 1,969,408 | 6.00 | 2,625,877 | 8.00 | 1,744,601 | 4.00 | ||||||||||||||||||||||||
|
|
|
|
|
|
|
|
|
|
|
|
|
|
|
|
|
|||||||||||||||||
| Excess |
$ | 2,209,454 | 6.73 | % | $ | 1,717,102 | 5.23 | % | $ | 1,217,505 | 3.71 | % | $ | 1,941,909 | 4.45 | % | ||||||||||||||||
|
|
|
|
|
|
|
|
|
|
|
|
|
|
|
|
|
|||||||||||||||||
| Risk-Based Capital | ||||||||||||||||||||||||||||||||
| At December 31, 2015 | Common Equity Tier 1 |
Tier 1 | Total | Leverage Capital | ||||||||||||||||||||||||||||
| (dollars in thousands) | Amount | Ratio | Amount | Ratio | Amount | Ratio | Amount | Ratio | ||||||||||||||||||||||||
| Total capital |
$ | 3,478,429 | 10.47 | % | $ | 3,478,429 | 10.47 | % | $ | 3,645,262 | 10.98 | % | $ | 3,478,429 | 8.05 | % | ||||||||||||||||
| Minimum for capital adequacy purposes |
1,494,584 | 4.50 | 1,992,778 | 6.00 | 2,657,037 | 8.00 | 1,729,021 | 4.00 | ||||||||||||||||||||||||
|
|
|
|
|
|
|
|
|
|
|
|
|
|
|
|
|
|||||||||||||||||
| Excess |
$ | 1,983,845 | 5.97 | % | $ | 1,485,651 | 4.47 | % | $ | 988,225 | 2.98 | % | $ | 1,749,408 | 4.05 | % | ||||||||||||||||
|
|
|
|
|
|
|
|
|
|
|
|
|
|
|
|
|
|||||||||||||||||
The following tables present the actual capital amounts and ratios for the Commercial Bank at December 31, 2016 and 2015 in comparison to the minimum amounts and ratios required for capital adequacy purposes:
| Risk-Based Capital | ||||||||||||||||||||||||||||||||
| At December 31, 2016 | Common Equity Tier 1 |
Tier 1 | Total | Leverage Capital | ||||||||||||||||||||||||||||
| (dollars in thousands) | Amount | Ratio | Amount | Ratio | Amount | Ratio | Amount | Ratio | ||||||||||||||||||||||||
| Total capital |
$ | 370,707 | 14.14 | % | $ | 370,707 | 14.14 | % | $ | 397,259 | 15.15 | % | $ | 370,707 | 10.53 | % | ||||||||||||||||
| Minimum for capital adequacy purposes |
117,973 | 4.50 | 157,297 | 6.00 | 209,729 | 8.00 | 140,813 | 4.00 | ||||||||||||||||||||||||
|
|
|
|
|
|
|
|
|
|
|
|
|
|
|
|
|
|||||||||||||||||
| Excess |
$ | 252,734 | 9.64 | % | $ | 213,410 | 8.14 | % | $ | 187,530 | 7.15 | % | $ | 229,894 | 6.53 | % | ||||||||||||||||
|
|
|
|
|
|
|
|
|
|
|
|
|
|
|
|
|
|||||||||||||||||
| Risk-Based Capital | ||||||||||||||||||||||||||||||||
| At December 31, 2015 | Common Equity Tier 1 |
Tier 1 | Total | Leverage Capital | ||||||||||||||||||||||||||||
| (dollars in thousands) | Amount | Ratio | Amount | Ratio | Amount | Ratio | Amount | Ratio | ||||||||||||||||||||||||
| Total capital |
$ | 384,221 | 13.43 | % | $ | 384,221 | 13.43 | % | $ | 400,058 | 13.98 | % | $ | 384,221 | 10.01 | % | ||||||||||||||||
| Minimum for capital adequacy purposes |
128,732 | 4.50 | 171,642 | 6.00 | 228,857 | 8.00 | 153,507 | 4.00 | ||||||||||||||||||||||||
|
|
|
|
|
|
|
|
|
|
|
|
|
|
|
|
|
|||||||||||||||||
| Excess |
$ | 255,489 | 8.93 | % | $ | 212,579 | 7.43 | % | $ | 171,201 | 5.98 | % | $ | 230,714 | 6.01 | % | ||||||||||||||||
|
|
|
|
|
|
|
|
|
|
|
|
|
|
|
|
|
|||||||||||||||||
The Company and the Banks assign various loan and other assets to respective risk categories. In September 2016, management reclassified certain multi-family loans that had previously been assigned to the 50% risk-weight category to the 100% risk-weight category, based on a new interpretation of applicable regulatory guidance. The reclassification reduced the Company’s and Banks’ common equity tier 1 capital, tier 1 risk-weighted capital, and total risk-weighted capital ratios from the levels that were previously reported for the period ended December 31, 2015. For the Company, the common equity tier 1 capital, tier 1 risk-weighted capital, and total risk-weighted capital ratios were reduced by 54 basis points, 56 basis points, and 62 basis points, respectively; for the Community Bank, the capital ratios were reduced by 57 basis points, 57 basis points, and 59 basis points, respectively; and, for the Commercial Bank, the capital ratios were reduced by 72 basis points, 72 basis points, and 76 basis points, respectively, from the percentages previously reported. Notwithstanding the respective reductions, the Company and the Banks continued to be classified as “well-capitalized” institutions.
NOTE 19: SEGMENT REPORTING
The Company’s operations are divided into two reportable business segments: Banking Operations and Residential Mortgage Banking. These operating segments have been identified based on the Company’s organizational structure. The segments require unique technology and marketing strategies, and offer different products and services. While the Company is managed as an integrated organization, individual executive managers are held accountable for the operations of these business segments.
154
Table of Contents
The Company measures and presents information for internal reporting purposes in a variety of ways. The internal reporting system presently used by management in the planning and measurement of operating activities, and to which most managers are held accountable, is based on organizational structure.
The management accounting process uses various estimates and allocation methodologies to measure the performance of the operating segments. To determine financial performance for each segment, the Company allocates capital, funding charges and credits, certain non-interest expenses, and income tax provisions to each segment, as applicable. Allocation methodologies are subject to periodic adjustment as the internal management accounting system is revised and/or as business or product lines within the segments change. In addition, because the development and application of these methodologies is a dynamic process, the financial results presented may be periodically revised.
The Company seeks to maximize shareholder value by, among other means, optimizing the return on stockholders’ equity and managing risk. Capital is assigned to each segment, the combination of which is equivalent to the Company’s consolidated total, on an economic basis, using management’s assessment of the inherent risks associated with the respective segments.
The Company allocates expenses to the reportable segments based on various factors, including the volume and number of loans produced and the number of full-time equivalent employees. Income taxes are allocated to the various segments based on taxable income and statutory rates applicable to the segment.
Banking Operations Segment
The Banking Operations segment serves consumers and businesses by offering and servicing a variety of loan and deposit products and other financial services.
Residential Mortgage Banking Segment
The Residential Mortgage Banking segment originates, aggregates, sells, and services one-to-four family mortgage loans. Mortgage loan products consist primarily of agency-conforming, fixed and adjustable rate loans and, to a lesser extent, jumbo loans, for the purpose of purchasing or refinancing one-to-four family homes. The Residential Mortgage Banking segment earns interest on loans held in the warehouse and non-interest income from the origination and servicing of loans. It also recognizes gains or losses on the sale of such loans.
The following tables provide a summary of the Company’s segment results for the years ended December 31, 2016, 2015, and 2014 on an internally managed accounting basis:
| For the Twelve Months Ended December 31, 2016 | ||||||||||||
| (in thousands) | Banking Operations |
Residential Mortgage Banking |
Total Company |
|||||||||
| Net interest income |
$ | 1,272,423 | $ | 14,959 | $ | 1,287,382 | ||||||
| Provision for loan losses |
4,180 | — | 4,180 | |||||||||
| Non-Interest Income: |
||||||||||||
| Third party(1) |
116,200 | 29,372 | 145,572 | |||||||||
| Inter-segment |
(17,645 | ) | 17,645 | — | ||||||||
|
|
|
|
|
|
|
|||||||
| Total non-interest income |
98,555 | 47,017 | 145,572 | |||||||||
|
|
|
|
|
|
|
|||||||
| Non-interest expense(2) |
584,894 | 66,752 | 651,646 | |||||||||
|
|
|
|
|
|
|
|||||||
| Income (loss) before income tax expense (benefit) |
781,904 | (4,776 | ) | 777,128 | ||||||||
| Income tax expense (benefit) |
283,656 | (1,929 | ) | 281,727 | ||||||||
|
|
|
|
|
|
|
|||||||
| Net income (loss) |
$ | 498,248 | $ | (2,847 | ) | $ | 495,401 | |||||
|
|
|
|
|
|
|
|||||||
| Identifiable segment assets (period-end) |
$ | 48,195,581 | $ | 730,974 | $ | 48,926,555 | ||||||
|
|
|
|
|
|
|
|||||||
| (1) | Includes ancillary fee income. |
| (2) | Includes both direct and indirect expenses. |
155
Table of Contents
| For the Twelve Months Ended December 31, 2015 | ||||||||||||
| (in thousands) | Banking Operations |
Residential Mortgage Banking |
Total Company |
|||||||||
| Net interest income |
$ | 393,074 | $ | 15,001 | $ | 408,075 | ||||||
| Recoveries of loan losses |
(15,004 | ) | — | (15,004 | ) | |||||||
| Non-Interest Income: |
||||||||||||
| Third party(1) |
154,847 | 55,916 | 210,763 | |||||||||
| Inter-segment |
(15,359 | ) | 15,359 | — | ||||||||
|
|
|
|
|
|
|
|||||||
| Total non-interest income |
139,488 | 71,275 | 210,763 | |||||||||
|
|
|
|
|
|
|
|||||||
| Non-interest expense(2) |
700,469 | 65,386 | 765,855 | |||||||||
|
|
|
|
|
|
|
|||||||
| (Loss) income before income tax expense |
(152,903 | ) | 20,890 | (132,013 | ) | |||||||
| Income tax (benefit) expense |
(93,297 | ) | 8,440 | (84,857 | ) | |||||||
|
|
|
|
|
|
|
|||||||
| Net (loss) income |
$ | (59,606 | ) | $ | 12,450 | $ | (47,156 | ) | ||||
|
|
|
|
|
|
|
|||||||
| Identifiable segment assets (period-end) |
$ | 49,619,931 | $ | 697,865 | $ | 50,317,796 | ||||||
|
|
|
|
|
|
|
|||||||
| (1) | Includes ancillary fee income. |
| (2) | Includes both direct and indirect expenses |
| For the Twelve Months Ended December 31, 2014 | ||||||||||||
| (in thousands) | Banking Operations |
Residential Mortgage Banking |
Total Company |
|||||||||
| Net interest income |
$ | 1,126,162 | $ | 14,191 | $ | 1,140,353 | ||||||
| Recoveries of loan losses |
(18,587 | ) | — | (18,587 | ) | |||||||
| Non-Interest Income: |
||||||||||||
| Third party(1) |
135,834 | 65,759 | 201,593 | |||||||||
| Inter-segment |
(13,521 | ) | 13,521 | — | ||||||||
|
|
|
|
|
|
|
|||||||
| Total non-interest income |
122,313 | 79,280 | 201,593 | |||||||||
|
|
|
|
|
|
|
|||||||
| Non-interest expense(2) |
528,436 | 59,031 | 587,467 | |||||||||
|
|
|
|
|
|
|
|||||||
| Income before income tax expense |
738,626 | 34,440 | 773,066 | |||||||||
| Income tax expense |
274,179 | 13,490 | 287,669 | |||||||||
|
|
|
|
|
|
|
|||||||
| Net income |
$ | 464,447 | $ | 20,950 | $ | 485,397 | ||||||
|
|
|
|
|
|
|
|||||||
| Identifiable segment assets (period-end) |
$ | 47,897,672 | $ | 661,545 | $ | 48,559,217 | ||||||
|
|
|
|
|
|
|
|||||||
| (1) | Includes ancillary fee income. |
| (2) | Includes both direct and indirect expenses. |
156
Table of Contents
Report of Independent Registered Public Accounting Firm
The Board of Directors and Stockholders
New York Community Bancorp, Inc.:
We have audited the accompanying consolidated statements of condition of New York Community Bancorp, Inc. and subsidiaries (the “Company”) as of December 31, 2016 and 2015, and the related consolidated statements of operations and comprehensive income (loss), changes in stockholders’ equity, and cash flows for each of the years in the three-year period ended December 31, 2016. These consolidated financial statements are the responsibility of the Company’s management. Our responsibility is to express an opinion on these consolidated financial statements based on our audits.
We conducted our audits in accordance with the standards of the Public Company Accounting Oversight Board (United States). Those standards require that we plan and perform the audit to obtain reasonable assurance about whether the financial statements are free of material misstatement. An audit includes examining, on a test basis, evidence supporting the amounts and disclosures in the financial statements. An audit also includes assessing the accounting principles used and significant estimates made by management, as well as evaluating the overall financial statement presentation. We believe that our audits provide a reasonable basis for our opinion.
In our opinion, the consolidated financial statements referred to above present fairly, in all material respects, the financial position of the Company as of December 31, 2016 and 2015, and the results of their operations and their cash flows for each of the years in the three-year period ended December 31, 2016, in conformity with U.S. generally accepted accounting principles.
We also have audited, in accordance with the standards of the Public Company Accounting Oversight Board (United States), the Company’s internal control over financial reporting as of December 31, 2016, based on criteria established in Internal Control – Integrated Framework (2013) issued by the Committee of Sponsoring Organizations of the Treadway Commission (COSO), and our report dated March 1, 2017 expressed an unqualified opinion on the effectiveness of the Company’s internal control over financial reporting.

New York, New York
March 1, 2017
157
Table of Contents
Report of Independent Registered Public Accounting Firm
The Board of Directors and Stockholders
New York Community Bancorp, Inc.:
We have audited New York Community Bancorp, Inc.’s (the “Company”) internal control over financial reporting as of December 31, 2016, based on criteria established in Internal Control – Integrated Framework (2013) issued by the Committee of Sponsoring Organizations of the Treadway Commission (COSO). The Company’s management is responsible for maintaining effective internal control over financial reporting and for its assessment of the effectiveness of internal control over financial reporting, included in the accompanying Management’s Report on Internal Control over Financial Reporting. Our responsibility is to express an opinion on the Company’s internal control over financial reporting based on our audit.
We conducted our audit in accordance with the standards of the Public Company Accounting Oversight Board (United States). Those standards require that we plan and perform the audit to obtain reasonable assurance about whether effective internal control over financial reporting was maintained in all material respects. Our audit included obtaining an understanding of internal control over financial reporting, assessing the risk that a material weakness exists, and testing and evaluating the design and operating effectiveness of internal control based on the assessed risk. Our audit also included performing such other procedures as we considered necessary in the circumstances. We believe that our audit provides a reasonable basis for our opinion.
A company’s internal control over financial reporting is a process designed to provide reasonable assurance regarding the reliability of financial reporting and the preparation of financial statements for external purposes in accordance with generally accepted accounting principles. A company’s internal control over financial reporting includes those policies and procedures that (1) pertain to the maintenance of records that, in reasonable detail, accurately and fairly reflect the transactions and dispositions of the assets of the company; (2) provide reasonable assurance that transactions are recorded as necessary to permit preparation of financial statements in accordance with generally accepted accounting principles, and that receipts and expenditures of the company are being made only in accordance with authorizations of management and directors of the company; and (3) provide reasonable assurance regarding prevention or timely detection of unauthorized acquisition, use, or disposition of the company’s assets that could have a material effect on the financial statements.
Because of its inherent limitations, internal control over financial reporting may not prevent or detect misstatements. Also, projections of any evaluation of effectiveness to future periods are subject to the risk that controls may become inadequate because of changes in conditions, or that the degree of compliance with the policies or procedures may deteriorate.
In our opinion, the Company maintained, in all material respects, effective internal control over financial reporting as of December 31, 2016, based on criteria established in Internal Control – Integrated Framework (2013) issued by the Committee of Sponsoring Organizations of the Treadway Commission (COSO).
We also have audited, in accordance with the standards of the Public Company Accounting Oversight Board (United States), the consolidated statements of condition of the Company as of December 31, 2016 and 2015, and the related consolidated statements of operations and comprehensive income (loss), changes in stockholders’ equity, and cash flows for each of the years in the three-year period ended December 31, 2016, and our report dated March 1, 2017 expressed an unqualified opinion on those consolidated financial statements.
New York, New York
March 1, 2017
158
Table of Contents
| ITEM 9. | CHANGES IN AND DISAGREEMENTS WITH ACCOUNTANTS ON ACCOUNTING AND FINANCIAL DISCLOSURE |
None.
| ITEM 9A. | CONTROLS AND PROCEDURES |
(a) Evaluation of Disclosure Controls and Procedures
Under the supervision, and with the participation, of our Chief Executive Officer and Chief Financial Officer, our management evaluated the effectiveness of the design and operation of the Company’s disclosure controls and procedures pursuant to Rule 13a-15(b), as adopted by the Securities and Exchange Commission (the “SEC”) under the Securities Exchange Act of 1934 (the “Exchange Act”). Based upon that evaluation, the Chief Executive Officer and Chief Financial Officer concluded that the Company’s disclosure controls and procedures were effective as of the end of the period covered by this annual report.
Disclosure controls and procedures are the controls and other procedures that are designed to ensure that information required to be disclosed in the reports that the Company files or submits under the Exchange Act is recorded, processed, summarized, and reported within the time periods specified in the SEC’s rules and forms. Disclosure controls and procedures include, without limitation, controls and procedures designed to ensure that information required to be disclosed in the reports that the Company files or submits under the Exchange Act is accumulated and communicated to management, including the Chief Executive Officer and Chief Financial Officer, as appropriate, to allow timely decisions regarding required disclosure.
(b) Management’s Report on Internal Control over Financial Reporting
Management of the Company is responsible for establishing and maintaining adequate internal control over financial reporting. Our system of internal control is designed under the supervision of management, including our Chief Executive Officer and Chief Financial Officer, to provide reasonable assurance regarding the reliability of our financial reporting and the preparation of the Company’s financial statements for external reporting purposes in accordance with U.S. generally accepted accounting principles (“GAAP”).
Our internal control over financial reporting includes policies and procedures that pertain to the maintenance of records that, in reasonable detail, accurately and fairly reflect transactions and dispositions of assets; provide reasonable assurances that transactions are recorded as necessary to permit preparation of financial statements in accordance with GAAP, and that receipts and expenditures are made only in accordance with the authorization of management and the Boards of Directors of the Company and the Banks; and provide reasonable assurance regarding prevention or timely detection of unauthorized acquisition, use, or disposition of the Company’s assets that could have a material effect on our financial statements.
Because of its inherent limitations, internal control over financial reporting may not prevent or detect misstatements. Projections of any evaluation of effectiveness to future periods are subject to the risk that the controls may become inadequate because of changes in conditions or that the degree of compliance with policies and procedures may deteriorate.
As of December 31, 2016, management assessed the effectiveness of the Company’s internal control over financial reporting based upon the framework established in Internal Control—Integrated Framework (2013) issued by the Committee of Sponsoring Organizations of the Treadway Commission (“COSO”). Based upon its assessment, management concluded that the Company’s internal control over financial reporting as of December 31, 2016 was effective using this criteria.
The effectiveness of the Company’s internal control over financial reporting as of December 31, 2016 has been audited by KPMG LLP, an independent registered public accounting firm that audited the Company’s consolidated financial statements as of and for the year ended December 31, 2016, as stated in their report, included in Item 8 on the preceding page, which expresses an unqualified opinion on the effectiveness of the Company’s internal control over financial reporting as of December 31, 2016.
159
Table of Contents
(c) Changes in Internal Control over Financial Reporting
There have not been any changes in the Company’s internal control over financial reporting (as such term is defined in Rules 13a-15(f) and 15d-15(f) under the Exchange Act) during the fiscal quarter to which this report relates that have materially affected, or are reasonably likely to materially affect, the Company’s internal control over financial reporting.
| ITEM 9B. | Other Information |
None.
| ITEM 10. | DIRECTORS, EXECUTIVE OFFICERS, AND CORPORATE GOVERNANCE |
Information regarding our directors, executive officers, and corporate governance appears in our Proxy Statement for the Annual Meeting of Shareholders to be held on June 6, 2017 (hereafter referred to as our “2017 Proxy Statement”) under the captions “Information with Respect to Nominees, Continuing Directors, and Executive Officers,” “Section 16(a) Beneficial Ownership Reporting Compliance,” “Meetings and Committees of the Board of Directors,” and “Corporate Governance,” and is incorporated herein by this reference.
A copy of our Code of Business Conduct and Ethics, which applies to our Chief Executive Officer, Chief Operating Officer, Chief Financial Officer, and Chief Accounting Officer as officers of the Company, and all other senior financial officers of the Company designated by the Chief Executive Officer from time to time, is available on the Investor Relations portion of our websites, www.myNYCB.com, www.NewYorkCommercialBank.com, and www.NYCBfamily.com, and will be provided, without charge, upon written request to the Chief Corporate Governance Officer and Corporate Secretary at 615 Merrick Avenue, Westbury, NY 11590.
| ITEM 11. | EXECUTIVE COMPENSATION |
Information regarding executive compensation appears in our 2017 Proxy Statement under the captions “Compensation Committee Report,” “Compensation Committee Interlocks and Insider Participation,” “Compensation Discussion and Analysis,” “Executive Compensation and Related Information,” and “Director Compensation,” and is incorporated herein by this reference.
| ITEM 12. | SECURITY OWNERSHIP OF CERTAIN BENEFICIAL OWNERS AND MANAGEMENT, AND RELATED STOCKHOLDER MATTERS |
The following table provides information regarding the Company’s equity compensation plans at December 31, 2016:
| Plan category |
Number of securities to be issued upon exercise of outstanding options, warrants, and rights (a) |
Weighted-average exercise price of outstanding options, warrants, and rights (b) |
Number of securities remaining available for future issuance under equity compensation plans (excluding securities reflected in column (a)) (c) | |||
| Equity compensation plans approved by security holders |
— | — | 9,646,760 | |||
| Equity compensation plans not approved by security holders |
— | — | — | |||
| Total |
— | — | 9,646,760 |
Information relating to the security ownership of certain beneficial owners and management appears in our 2017 Proxy Statement under the captions “Security Ownership of Certain Beneficial Owners” and “Information with Respect to Nominees, Continuing Directors, and Executive Officers.”
160
Table of Contents
| ITEM 13. | CERTAIN RELATIONSHIPS AND RELATED TRANSACTIONS, AND DIRECTOR INDEPENDENCE |
Information regarding certain relationships and related transactions, and director independence, appears in our 2017 Proxy Statement under the captions “Transactions with Certain Related Persons” and “Corporate Governance,” respectively, and is incorporated herein by this reference.
| ITEM 14. | PRINCIPAL ACCOUNTANT FEES AND SERVICES |
Information regarding principal accountant fees and services appears in our 2017 Proxy Statement under the caption “Audit and Non-Audit Fees,” and is incorporated herein by this reference.
| ITEM 15. | EXHIBITS AND FINANCIAL STATEMENT SCHEDULES |
(a) Documents Filed As Part of This Report
1. Financial Statements
The following are incorporated by reference from Item 8 hereof:
| • | Reports of Independent Registered Public Accounting Firm; |
| • | Consolidated Statements of Condition at December 31, 2016 and 2015; |
| • | Consolidated Statements of Operations and Comprehensive Income (Loss) for each of the years in the three-year period ended December 31, 2016; |
| • | Consolidated Statements of Changes in Stockholders’ Equity for each of the years in the three-year period ended December 31, 2016; |
| • | Consolidated Statements of Cash Flows for each of the years in the three-year period ended December 31, 2016; and |
| • | Notes to the Consolidated Financial Statements. |
The following are incorporated by reference from Item 9A hereof:
| • | Management’s Report on Internal Control over Financial Reporting; and |
| • | Changes in Internal Control over Financial Reporting. |
2. Financial Statement Schedules
Financial statement schedules have been omitted because they are not applicable or because the required information is provided in the Consolidated Financial Statements or Notes thereto.
3. Exhibits Required by Securities and Exchange Commission Regulation S-K
The following exhibits are filed as part of this Form 10-K, and this list includes the Exhibit Index.
| Exhibit |
||
| 3.1 | Amended and Restated Certificate of Incorporation (1) | |
| 3.2 | Certificates of Amendment of Amended and Restated Certificate of Incorporation (2) | |
| 3.3 | Certificate of Amendment of Amended and Restated Certificate of Incorporation (3) | |
| 3.4 | Amended and Restated Bylaws (attached hereto) | |
| 4.1 | Specimen Stock Certificate (4) | |
| 4.2 | Form of Certificate of Designations for the New York Community Bancorp, Inc. preferred stock (5) | |
161
Table of Contents
| 4.3 | Registrant will furnish, upon request, copies of all instruments defining the rights of holders of long-term debt instruments of the registrant and its consolidated subsidiaries. | |
| 10.1 | Form of Employment Agreement between New York Community Bancorp, Inc. and Joseph R. Ficalora, Robert Wann, Thomas R. Cangemi, James J. Carpenter, and John J. Pinto* (6) | |
| 10.2 | Synergy Financial Group, Inc. 2004 Stock Option Plan (as assumed by New York Community Bancorp, Inc. effective October 1, 2007)* (7) | |
| 10.3 | Form of Change in Control Agreements among the Company, the Bank, and Certain Officers* (8) | |
| 10.4 | Form of Queens County Savings Bank Employee Severance Compensation Plan* (8) | |
| 10.5 | Form of Queens County Savings Bank Outside Directors’ Consultation and Retirement Plan* (8) | |
| 10.6 | Form of Queens County Bancorp, Inc. Employee Stock Ownership Plan and Trust* (8) | |
| 10.7 | Incentive Savings Plan of Queens County Savings Bank* (9) | |
| 10.8 | Retirement Plan of Queens County Savings Bank* (8) | |
| 10.9 | Supplemental Benefit Plan of Queens County Savings Bank* (10) | |
| 10.10 | Excess Retirement Benefits Plan of Queens County Savings Bank* (8) | |
| 10.11 | Queens County Savings Bank Directors’ Deferred Fee Stock Unit Plan* (8) | |
| 10.12 | New York Community Bancorp, Inc. Management Incentive Compensation Plan* (11) | |
| 10.13 | New York Community Bancorp, Inc. 2006 Stock Incentive Plan* (11) | |
| 10.14 | New York Community Bancorp, Inc. 2012 Stock Incentive Plan* (12) | |
| 11.0 | Statement Re: Computation of Per Share Earnings (See Note 2 to the Consolidated Financial Statements) | |
| 12.0 | Statement Re: Ratio of Earnings to Fixed Charges (attached hereto) | |
| 21.0 | Subsidiaries information incorporated herein by reference to Part I, “Subsidiaries” | |
| 23.0 | Consent of KPMG LLP, dated March 1, 2017 (attached hereto) | |
| 31.1 | Rule 13a-14(a) Certification of Chief Executive Officer of the Company in accordance with Section 302 of the Sarbanes-Oxley Act of 2002 (attached hereto) | |
| 31.2 | Rule 13a-14(a) Certification of Chief Financial Officer of the Company in accordance with Section 302 of the Sarbanes-Oxley Act of 2002 (attached hereto) | |
| 32.0 | Section 1350 Certifications of the Chief Executive Officer and Chief Financial Officer of the Company in accordance with Section 906 of the Sarbanes-Oxley Act of 2002 (attached hereto) | |
| 101 | The following materials from the Company’s Annual Report on Form 10-K for the year ended December 31, 2016, formatted in XBRL (Extensible Business Reporting Language): (i) the Consolidated Statements of Condition, (ii) the Consolidated Statements of Operations and Comprehensive Income (Loss), (iii) the Consolidated Statements of Changes in Stockholders’ Equity, (iv) the Consolidated Statements of Cash Flows, and (v) the Notes to the Consolidated Financial Statements. | |
| * | Management plan or compensation plan arrangement. |
| (1) | Incorporated by reference to Exhibits filed with the Company’s Form 10-Q for the quarterly period ended March 31, 2001 (File No. 0-22278) |
| (2) | Incorporated by reference to Exhibits filed with the Company’s Form 10-K for the year ended December 31, 2003 (File No. 1-31565) |
| (3) | Incorporated by reference to Exhibits to the Company’s Form 8-K filed with the Securities and Exchange Commission on April 27, 2016 (File No. 1-31565) |
| (4) | Incorporated by reference to Exhibits filed with the Company’s Registration Statement on Form S-1, Registration No. 33-66852 |
| (5) | Incorporated by reference to Exhibit 4.2 to the Registration Statement on Form S-4/A filed with the Securities and Exchange Commission on January 29, 2016, Registration No. 333-208649 |
162
Table of Contents
| (6) | Incorporated by reference to Exhibits filed with the Company’s Form 8-K filed with the Securities and Exchange Commission on March 9, 2006 |
| (7) | Incorporated by reference to Exhibits to Form S-8, Registration Statement filed on October 4, 2007, Registration No. 333-146512 |
| (8) | Incorporated by reference to Exhibits filed with the Company’s Registration Statement on Form S-1, Registration No. 33-66852 |
| (9) | Incorporated by reference to Exhibits to Form S-8, Registration Statement filed on October 27, 1994, Registration No. 33-85682 |
| (10) | Incorporated by reference to Exhibits filed with the 1995 Proxy Statement for the Annual Meeting of Shareholders held on April 19, 1995 |
| (11) | Incorporated by reference to Exhibits filed with the 2006 Proxy Statement for the Annual Meeting of Shareholders held on June 7, 2006 |
| (12) | Incorporated by reference to Exhibits filed with the 2012 Proxy Statement for the Annual Meeting of Shareholders held on June 7, 2012 |
163
Table of Contents
Pursuant to the requirements of Section 13 or 15(d) of the Securities Exchange Act of 1934, the registrant has duly caused this report to be signed on its behalf by the undersigned, thereunto duly authorized.
| March 1, 2017 | New York Community Bancorp, Inc. | |||||
| (Registrant) | ||||||
| /s/ Joseph R. Ficalora | ||||||
| Joseph R. Ficalora | ||||||
| President and Chief Executive Officer | ||||||
| (Principal Executive Officer) | ||||||
Pursuant to the requirements of the Securities Exchange Act of 1934, this report has been signed below by the following persons on behalf of the registrant and in the capacities and on the dates indicated.
| /s/ Joseph R. Ficalora |
3/1/17 | /s/ Thomas R. Cangemi |
3/1/17 | |||
| Joseph R. Ficalora | Thomas R. Cangemi | |||||
| President, Chief Executive Officer, and Director |
Senior Executive Vice President and Chief Financial Officer |
|||||
| (Principal Executive Officer) | (Principal Financial Officer) | |||||
| /s/ John J. Pinto |
3/1/17 | |||||
| John J. Pinto | ||||||
| Executive Vice President and Chief Accounting Officer |
||||||
| (Principal Accounting Officer) | ||||||
| /s/ Dominick Ciampa |
3/1/17 | /s/ Maureen E. Clancy |
3/1/17 | |||
| Dominick Ciampa | Maureen E. Clancy | |||||
| Chairman of the Board of Directors | Director | |||||
| /s/ Hanif W. Dahya |
3/1/17 | /s/ Leslie D. Dunn |
3/1/17 | |||
| Hanif W. Dahya | Leslie D. Dunn | |||||
| Director | Director | |||||
| /s/ Michael J. Levine |
3/1/17 | /s/ James J. O’Donovan |
3/1/17 | |||
| Michael J. Levine | James J. O’Donovan | |||||
| Director | Director | |||||
| /s/ Lawrence Rosano, Jr. |
3/1/17 | /s/ Ronald A. Rosenfeld |
3/1/17 | |||
| Lawrence Rosano, Jr. | Ronald A. Rosenfeld | |||||
| Director | Director | |||||
| /s/ Lawrence J. Savarese |
3/1/17 | /s/ John M. Tsimbinos |
3/1/17 | |||
| Lawrence J. Savarese | John M. Tsimbinos | |||||
| Director | Director | |||||
| /s/ Robert Wann |
3/1/17 | |||||
| Robert Wann | ||||||
| Senior Executive Vice President, Chief Operating Officer, and Director |
||||||
164