Attached files
| file | filename |
|---|---|
| EX-99.1 - EX-99.1 - WELLS FARGO & COMPANY/MN | f57118exv99w1.htm |
| 8-K - FORM 8-K - WELLS FARGO & COMPANY/MN | f57118e8vk.htm |
Exhibit 99.2

| 3Q10 Quarterly Supplement October 20, 2010 (c) 2010 Wells Fargo & Company. All rights reserved. |
| Forward-looking statements and additional information Forward-looking statements: This Quarterly Supplement contains forward-looking statements about our future financial performance. These forward- looking statements include statements using words such as "believe," "expect," "anticipate," "estimate," "should," "may," "can," "will," "outlook," "appears" or similar expressions. Forward-looking statements in this Quarterly Supplement include, among others, statements about: expected or estimated future losses in our loan portfolios, including our belief that quarterly provision expense and quarterly total credit losses have peaked and the allowance for loan losses is expected to decline; expected or estimated loan loss reserve releases; mortgage repurchase exposure; exposure related to foreclosure practices; the future economic environment; reduction or mitigation of risk in our loan portfolios; potential sales of loan portfolios; future effects of loan modification programs; life-of-loan loss estimates; future recast risk in the Pick-a-Pay portfolio; the amount and timing of expected cost savings and integration expenses, as well as other benefits, relating to the Wachovia merger; and future Tier 1 common levels and the estimated impact on Wells Fargo's capital from Basel capital rules. Investors are urged to not unduly rely on forward-looking statements as actual results could differ materially from expectations. Forward-looking statements speak only as of the date made, and we do not undertake to update them to reflect changes or events that occur after that date. For more information about factors that could cause actual results to differ materially from expectations, refer to pages 15-16 of Wells Fargo's press release announcing our third quarter results, as well as Wells Fargo's reports filed with the Securities and Exchange Commission, including our Annual Report on Form 10-K for the year ended December 31, 2009 and Quarterly Reports on Form 10-Q for the quarters ended March 31, 2010 and June 30, 2010, including the discussion under "Risk Factors" in each of those reports. Purchased credit-impaired loan portfolio: Loans that were acquired from Wachovia that were considered credit impaired were written down at acquisition date in purchase accounting to an amount estimated to be collectible and the related allowance for loan losses was not carried over to Wells Fargo's allowance. In addition, such purchased credit-impaired loans are not classified as nonaccrual or nonperforming, and are not included in loans that were contractually 90+ days past due and still accruing. Any losses on such loans are charged against the nonaccretable difference established in purchase accounting and are not reported as charge-offs (until such difference is fully utilized). As a result of accounting for purchased loans with evidence of credit deterioration, certain ratios of the combined company are not comparable to a portfolio that does not include purchased credit-impaired loans. In certain cases, the purchased credit-impaired loans may affect portfolio credit ratios and trends. Management believes that the presentation of information adjusted to exclude the purchased credit-impaired loans provides useful disclosure regarding the credit quality of the non-impaired loan portfolio. Accordingly, certain of the loan balances and credit ratios in this Quarterly Supplement have been adjusted to exclude the purchased credit-impaired loans. References in this Quarterly Supplement to impaired loans mean the purchased credit-impaired loans. Please see pages 31-33 of the press release for additional information regarding the purchased credit-impaired loans. |

| Table of contents 3Q10 Results 3Q10 Overview Page 3 Record earnings 4 Strong operating margins 5 Broad based earnings 6 Building the franchise - Wholesale Banking 7 Building the franchise - Community Banking 8 Regional bank sales and cross-sell metrics 9 Mortgage banking 10 Building the franchise - WBR 11 Continuing to supply credit to U.S. economy 12 Loans outstanding 13 Average core deposits 14 Noninterest expense 15 Wells Fargo & Wachovia merger already a big success 16 Credit quality continued to improve in 3Q10 17 Continued improvement in credit quality 18 Consumer delinquency trends 19 Nonaccrual loan inflows stabilizing 20 Foreclosed assets/REO outstandings 21 Allowance for credit losses 22 Pick-a-Pay continued to perform better than originally expected 23 Capital is strong and continued to grow internally 24 Basel I Basel III: Estimated effect of proposed guidelines 25 Overview of foreclosures and mortgage securitization 26 Wells Fargo has a high quality servicing portfolio 27 Lower delinquency and foreclosure rates than peers 28 Repurchase exposure is manageable 29 Repurchase exposure is manageable and reserve is adequate 30 Appendix Pages 31-56 Non-strategic loan portfolio risk reduction 32 Capital strength 33 PCI portfolios continued to perform better than originally expected 34 PCI loan portfolio update: Nonaccretable difference 35 PCI accretable yield 36 Commercial, CRE and Foreign PCI portfolio accretable yield 37 Pick-a-Pay PCI portfolio accretable yield 38 3Q10 Credit quality highlights 39 Nonperforming assets 40 Commercial nonaccrual loans 41 Consumer real estate nonaccrual loans 42 Commercial real estate (CRE) loan portfolio 43 CRE loan portfolio by business group 44 Wholesale Banking CRE loan portfolio 45 Pick-a-Pay mortgage portfolio 46 Pick-a-Pay portfolio available nonaccretable diff. 47 Pick-a-Pay credit highlights 48 Pick-a-Pay: Current to 30+ DPD roll rates 49 Pick-a-Pay nonaccrual loan composition 50 Real estate 1-4 family first mortgage portfolio 51 Home equity portfolio 52 Credit card portfolio 53 Auto portfolio 54 Tier 1 common equity reconciliation 55 Return on average tangible common equity 56 |

| 3Q10 Overview Record earnings - $3.34 billion net income, up 9% Building and streamlining the franchise - revenue growth in most businesses, expenses down Wachovia merger already proving to be financial success - better credit experience, abundant revenue synergies, expense savings on track Continued improvement in credit quality - net charge-offs down 9% in quarter, 24% decline from peak Wells Fargo's balance sheet stronger than ever - Tier 1 Common = 8% (1), expect to be above 7% on proposed Basel III basis within next few quarters We remain confident in our foreclosure and mortgage securitization policies, practices and controls and adequacy of repurchase reserve (1) Preliminary. See table on page 55 for more information on Tier 1 common equity. Percent changes from 2Q10. |
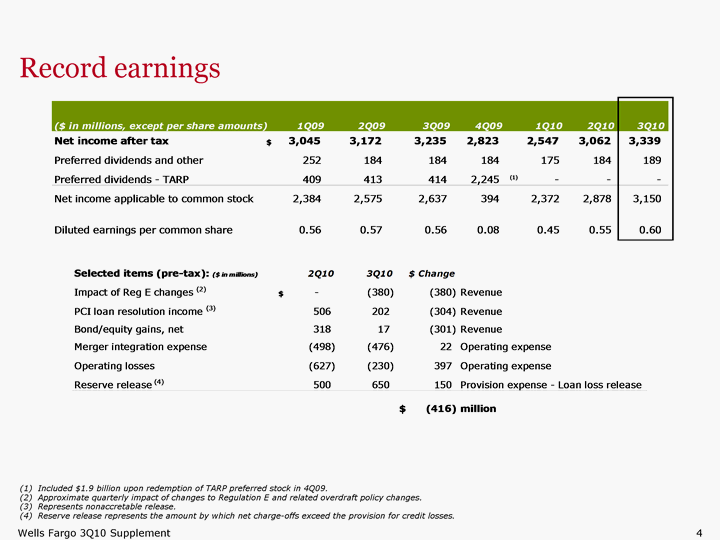
| Record earnings (1) Included $1.9 billion upon redemption of TARP preferred stock in 4Q09. (2) Approximate quarterly impact of changes to Regulation E and related overdraft policy changes. (3) Represents nonaccretable release. (4) Reserve release represents the amount by which net charge-offs exceed the provision for credit losses. |

| Strong operating margins (1) See table on page 56 for more information on tangible common equity. |

| Broad-based earnings (1): Each business segment contributed to earnings ($ in millions) 3Q10 2Q10 NIAT ROA Community Banking +13% 1.02% Wholesale Banking +2% 1.58% Wealth, Brokerage & Retirement -5% 0.73% Community Banking WBR Wholesale Banking Community Banking WBR Wholesale Banking + 7% (1) Segment net income after-tax excludes other net losses of $364 million in 3Q10 and $386 million in 2Q10, which includes Wachovia integration expenses and the elimination of items that are included in both Community Banking and Wealth, Brokerage & Retirement relating primarily to wealth management customers serviced, and products sold, in the stores. Total $3,448 Total $3,703 |

| Building the franchise - Wholesale Banking Double digit linked quarter annualized (LQA) revenue growth in customer flow trading, commercial real estate, commercial mortgage servicing and asset-backed finance PCI loan resolution income down $307 million from 2Q10; seasonal decline in insurance revenue (offset in expenses) Lending activity picking up New CRE loan commitments up 44% LQ Period-end loans increased in Commercial Banking, CRE, Asset-backed finance and Capital Finance Average core deposits up 17% YoY, up 26% LQA Improving credit quality Charge-offs down 29% from 2Q10 Transfers to workout down Revenue ($ in millions) Net Income ($ in millions) |

| Building the franchise - Community Banking Core product solutions (1) up 14% YoY Store-based small business solutions (1) up 25% YoY Continued strong growth in checking accounts, consumer up a net 7.3% YoY, small business up a net 5.0% YoY Continued loan growth in core auto loans (up 9% LQA); private student lending (up 29% from 3Q09) and SBA lending (up 3% LQA) Extended $10.5 billion in new small business loans through September 30, 2010, including $3.9 billion in 3Q10; new loan volume increased 17% from 3Q09 Continued improvement in credit quality; charge-offs down 5%, stable early indicators Continued to reinvest in the business Revenue ($ in millions) Net Income ($ in millions) (1) Legacy Wells Fargo, includes converted Wachovia stores in legacy Wells Fargo footprint. |

| Regional bank sales and cross-sell metrics Legacy Wells Fargo core product solutions (2) Legacy Wells Fargo Retail Bank cross-sell per household (in millions) Strong 3Q10 YoY consumer checking account growth Combined WFC up 7.3% California up 8.3% New Jersey up 11.2% Florida up 9.0% Wachovia Retail Bank cross-sell per household (1) (1) Cross-sell for Wachovia for 4Q09 and 1Q10 has been changed from previously reported results, for consistency purposes, to align converted markets into the original legacy company. (2) Includes converted Wachovia stores in legacy Wells Fargo footprint. |
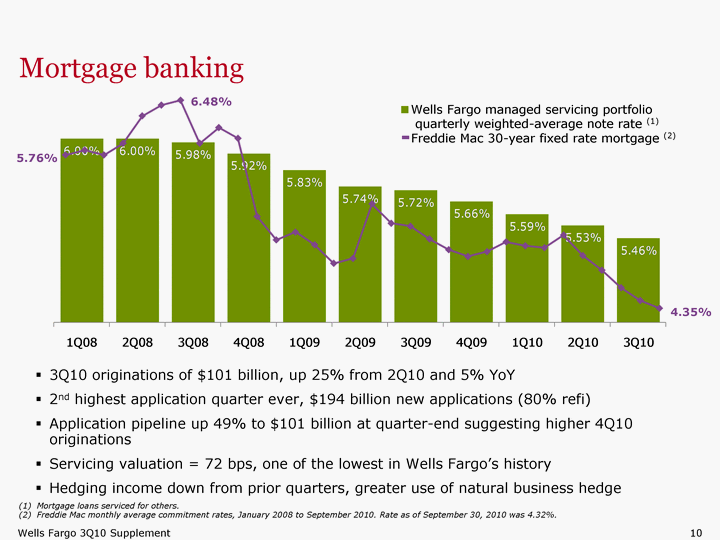
| Mortgage banking 3Q10 originations of $101 billion, up 25% from 2Q10 and 5% YoY 2nd highest application quarter ever, $194 billion new applications (80% refi) Application pipeline up 49% to $101 billion at quarter-end suggesting higher 4Q10 originations Servicing valuation = 72 bps, one of the lowest in Wells Fargo's history Hedging income down from prior quarters, greater use of natural business hedge 6.48% 4.35% 5.76% (1) Mortgage loans serviced for others. Freddie Mac monthly average commitment rates, January 2008 to September 2010. Rate as of September 30, 2010 was 4.32%. |

| Revenue up 2% from 2Q10 driven by improved equity market performance Client assets up 5% from 2Q10 Managed account assets up 10% from 2Q10 Loan balances flat from 2Q10 for first time since merger and up slightly in September Cross-sell of 9.76 in 3Q10 up from 9.72 in 2Q10 and 9.45 in 3Q09 Building the franchise - Wealth, Brokerage & Retirement Revenue ($ in millions) Net Income ($ in millions) (1) WBR's 4Q09 net loss included ARS loss reserves. (1) Client Assets ($ in billions) |

| Continuing to supply credit to U.S. economy Domestic Lending Commitments & Origination Activity |
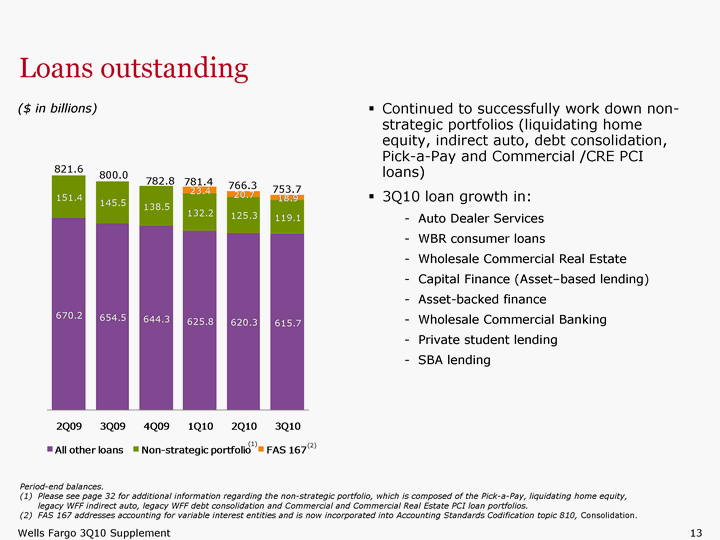
| Loans outstanding Continued to successfully work down non- strategic portfolios (liquidating home equity, indirect auto, debt consolidation, Pick-a-Pay and Commercial /CRE PCI loans) 3Q10 loan growth in: Auto Dealer Services WBR consumer loans Wholesale Commercial Real Estate Capital Finance (Asset-based lending) Asset-backed finance Wholesale Commercial Banking Private student lending SBA lending Period-end balances. (1) Please see page 32 for additional information regarding the non-strategic portfolio, which is composed of the Pick-a-Pay, liquidating home equity, legacy WFF indirect auto, legacy WFF debt consolidation and Commercial and Commercial Real Estate PCI loan portfolios. (2) FAS 167 addresses accounting for variable interest entities and is now incorporated into Accounting Standards Codification topic 810, Consolidation. 800.0 782.8 781.4 766.3 (1) 753.7 821.6 (2) ($ in billions) |

| Average core deposits (1) Strong broad-based deposit performance from 3Q09 Regional banking consumer checking accounts up 7.3% Regional banking business checking accounts up 5.0% Wholesale core deposit balances up 17.3% WBR core deposit balances up 3.8% Core checking/savings deposit growth remained strong and accelerated in 3Q10, up 9% LQA; period-end balances up 23% since Wachovia merger Lower-rate checking and savings deposits account for 89% of core deposits for 3Q10, up from 83% for 3Q09; core deposits = 102% of loans $21 billion of Wachovia's higher rate CDs matured since 3Q09 with better-than- expected retention (1) Core deposits are noninterest-bearing deposits, interest-bearing checking, certain savings certificates, market rate and other savings, and certain foreign deposits (Eurodollar sweep balances). ($ in billions) 761.8 759.2 770.8 759.3 772.0 765.7 753.9 |

| Noninterest expense 2Q10 included higher operating losses of $397 million and restructuring costs for Wells Fargo Financial of $137 million We continued to invest in our businesses for long-term growth in 3Q10 Opened 13 banking stores Regional Banking platform banker FTEs in the East up more than 1,250, or 14% since 4Q09 Integration/merger costs expected to be approximately $6 billion; 85% of targeted consolidated savings realized in expense run-rate $476 million integration expense in 3Q10 Converted 363 Wachovia stores in Texas, Kansas, Alabama, Mississippi and Tennessee Integration/merger efficiencies include: Staff group consolidation largely complete Closed 229 banking stores in overlapping markets in states converted to date System conversions already completed include: Mortgage - Business direct Credit card - Home equity loans Trust - Personal credit management Mutual funds ($ in millions) 12,253 11,684 12,746 |

| Wells Fargo and Wachovia merger already a big success Abundant revenue synergies Abundant revenue synergies Abundant revenue synergies Community Bank Wholesale Bank WBR Wachovia retail cross-sell 4.65 in 3Q09 to 4.91 in 3Q10 Used car loan market share 4.75% in 1Q09 to 6.84% in 3Q10 Private student lending originations up 50% YTD in Wachovia footprint Investment banking revenue from commercial customers up 21% YTD Cross-sell of Foreign exchange product up over 25% from prior year in East Coast markets Government and Institutional cross-sell revenue up 58% YTD Cross-sell 9.37 in 1Q09 to 9.76 in 3Q10 Managed account assets up 55% from 1Q09 Core deposits up 17% from 1Q09 Loan originations by FAs up 33% YTD Credit quality better than expected $22.9 billion utilization of nonaccretable difference (1) vs. $40.9 billion initial purchase accounting write-down Remaining PCI loans carried at 64% of UPB Life-to-date net performance = $3.5 billion (See page 34) Reduction of non-strategic loans (2) = $32.3 billion since 2Q09 Expense savings on track On track for $5.0 billion annual savings; 85% realized Integration cost expected to be approximately $6 billion vs. $7.9 billion original estimate Year to date though September 30, 2010. Use of nonaccretable difference for losses from loan resolutions and write-downs as well as additional provision. Please see page 32 for additional information regarding the non-strategic portfolio, which is composed of the Pick-a-Pay, liquidating home equity, legacy WFF indirect auto, legacy WFF debt consolidation and Commercial and Commercial Real Estate PCI loan portfolios. |

| UPB used for nonaccretable coverage determination excludes $21 billion for PCI loans that have had their nonaccretable difference charge for expected loss. Credit quality continued to improve in 3Q10 Net charge-offs continued to decline Down 9% linked quarter Down $1.3 billion, or 24%, from 4Q09 peak Early indicators continued to improve / stabilize Company-wide reductions in transfers to workout Wholesale Banking commercial loans transferred to workout status down 40% from 2009 monthly transfer average Early stage delinquencies relatively stable 30+ DPD improvement in Pick-a-Pay, credit card, home equity and personal credit management PCI portfolio performed better than originally expected Released $202 million of commercial nonaccretable difference into income in 3Q10 and reclassified $639 million nonaccretable difference Reserve coverage $24.4 billion allowance for credit losses (3.23% of total loans and 1.5x annualized 3Q10 charge-offs) plus $14.5 billion in nonaccretable difference (30.3% UPB (1) for PCI loans that have not had a UPB charge-off) Currently expect additional releases in coming quarters absent significant deterioration in the economy |

| Continued improvement in credit quality Commercial and commercial real estate losses declined $288 million from 2Q10, down 22% Commercial losses down $180 million, or 26%, reflected lower problem loan inflows and lower portfolio loss content CRE losses down $104 million, or 17%, on lower severities Loss rates remain relatively low in Commercial (138 bps) and Commercial Real Estate (152 bps) Consumer losses declined $103 million from 2Q10, down 3% Junior lien down $99 million, or 8%, reflected previous quarter's delinquency improvements Credit cards down $75 million, or 13%, reflected previous risk mitigation efforts Other revolving credit and installment up $46 million, or 13%, reflecting seasonality in the auto portfolio First lien mortgage up $25 million, or 2% Net Charge-offs ($ in millions) |

| Delinquency trends stabilizing in major consumer loan categories PCI adjustment on the Wachovia portfolio |

| Nonaccrual loans stabilizing Numbers may not add due to rounding. Please see pages 41-42 for additional information on nonaccrual inflows. |

| Foreclosed assets/REO outstandings Total foreclosed assets increased $1.1 billion in the quarter reflecting: $509 million shift from PCI loans to REO ($103 million commercial and commercial real estate and $406 million consumer, largely Pick-a-Pay) $239 million increase in non-impaired commercial on transfers from workout $237 million from non-impaired consumer REO $148 million from government insured loans |

| Allowance for credit losses Reserve release (2) = $650 million in 3Q10 Currently expect additional releases in coming quarters absent significant deterioration in the economy Allowance for credit losses of $24.4 billion 1.50x annualized 3Q10 net charge-offs 3.23% of total loans Remaining $14.5 billion nonaccretable difference for PCI loan portfolios separate from allowance 30.3% of PCI UPB (3) Net performance of PCI portfolio continued to exceed expectations (by about $3.5 billion) (4) $202 million nonaccretable difference released in 3Q10; reclassified $639 million (expected to accrete into future income) (1) Total loans includes Wachovia PCI loans of $55.2 billion in 2Q09, $54.3 billion in 3Q09, $51.7 billion in 4Q09, $49.5 billion in 1Q10, $46.5 billion in 2Q10 and $43.8 billion in 3Q10. The allowance includes $379 million in allowance associated with PCI loans in 3Q10. (2) Reserve release represents the amount by which net charge-offs exceed the provision for credit losses. (3) UPB used for nonaccretable coverage determination excludes $21 billion for PCI loans that have had their nonaccretable difference charged for expected loss. (4) Please see page 34 for additional information. Allowance for credit losses as a percentage of total loans (1) 3.28% 3.27% 3.20% 3.07% ($ in millions) 3.23% |

| Pick-a-Pay unpaid principal balance has declined $24.3 billion since acquisition to $93.0 billion Carrying value has declined to $77.3 billion, down $18.0 billion since 12/31/08 Non-PCI credit trends have stabilized PCI portfolio % current improved over 200 bps in the quarter to 60% current Pick-a-Pay continued to perform better than originally expected |

| Capital is strong and continued to grow internally 40 bps increase in 3Q10 34 bps due to retained earnings 4 bps due to other internal sources of capital 2 bps due to change in risk-weighted assets Purchased $544 million in warrants YTD 5 bps impact YTD on Tier 1 Common Warrant repurchase improves EPS when warrants are in the money Expect to continue to purchase opportunistically Other capital ratios growing Tier 1 Capital = 10.90% Tier 1 Leverage = 9.01% Please see appendix page 55 for more information on Tier 1 common equity. 3Q10 capital ratios are preliminary estimates. Year to date through September 30, 2010. . Tier 1 Common Equity Ratio |
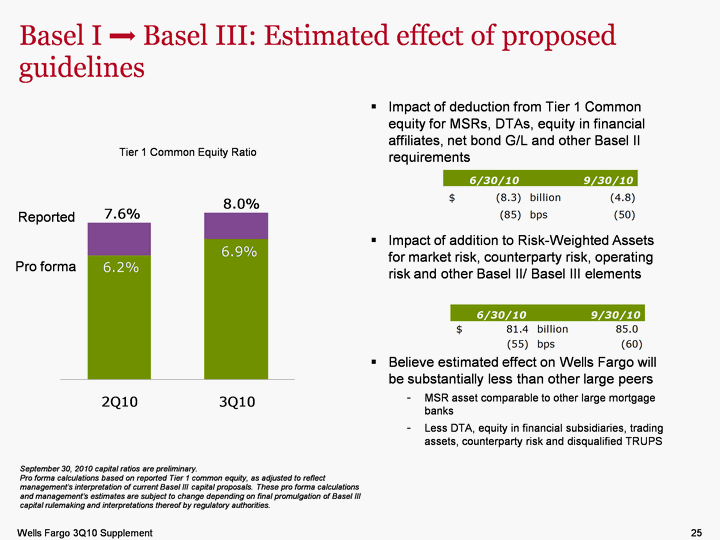
| Basel I Basel III: Estimated effect of proposed guidelines September 30, 2010 capital ratios are preliminary. Pro forma calculations based on reported Tier 1 common equity, as adjusted to reflect management's interpretation of current Basel III capital proposals. These pro forma calculations and management's estimates are subject to change depending on final promulgation of Basel III capital rulemaking and interpretations thereof by regulatory authorities. Tier 1 Common Equity Ratio Impact of deduction from Tier 1 Common equity for MSRs, DTAs, equity in financial affiliates, net bond G/L and other Basel II requirements Impact of addition to Risk-Weighted Assets for market risk, counterparty risk, operating risk and other Basel II/ Basel III elements Believe estimated effect on Wells Fargo will be substantially less than other large peers MSR asset comparable to other large mortgage banks Less DTA, equity in financial subsidiaries, trading assets, counterparty risk and disqualified TRUPS Reported Pro forma |
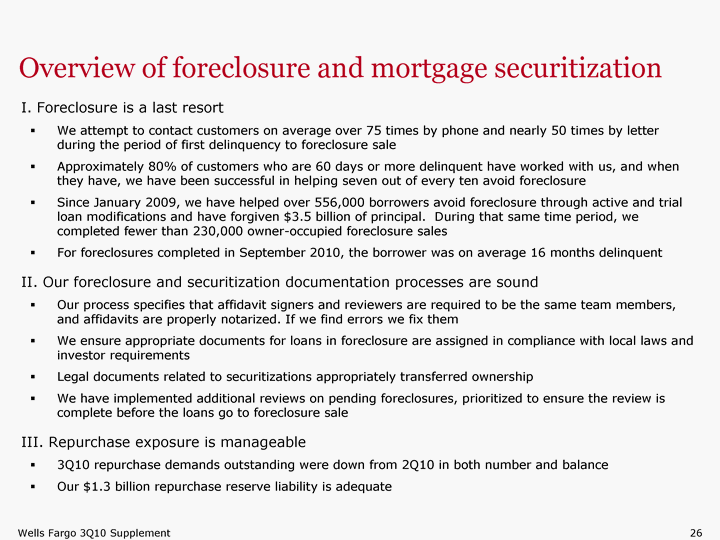
| Overview of foreclosure and mortgage securitization I. Foreclosure is a last resort We attempt to contact customers on average over 75 times by phone and nearly 50 times by letter during the period of first delinquency to foreclosure sale Approximately 80% of customers who are 60 days or more delinquent have worked with us, and when they have, we have been successful in helping seven out of every ten avoid foreclosure Since January 2009, we have helped over 556,000 borrowers avoid foreclosure through active and trial loan modifications and have forgiven $3.5 billion of principal. During that same time period, we completed fewer than 230,000 owner-occupied foreclosure sales For foreclosures completed in September 2010, the borrower was on average 16 months delinquent II. Our foreclosure and securitization documentation processes are sound Our process specifies that affidavit signers and reviewers are required to be the same team members, and affidavits are properly notarized. If we find errors we fix them We ensure appropriate documents for loans in foreclosure are assigned in compliance with local laws and investor requirements Legal documents related to securitizations appropriately transferred ownership We have implemented additional reviews on pending foreclosures, prioritized to ensure the review is complete before the loans go to foreclosure sale III. Repurchase exposure is manageable 3Q10 repurchase demands outstanding were down from 2Q10 in both number and balance Our $1.3 billion repurchase reserve liability is adequate |

| Wells Fargo has a high quality servicing portfolio Residential Mortgage Servicing Portfolio $1.8 Trillion (as of September 30, 2010) 92% of portfolio is current Less than 2% was sub-prime at origination 66% sold to agencies (FNMA, FHLMC, and GNMA) 20% are loans that we retained or acquired and service Loss exposure on these loans is handled through loan loss reserves and PCI non- accretable difference 8% are private securitizations where Wells Fargo originated the loan and therefore has some repurchase risk 55% are from vintages 2005 and prior 83% are prime Only $69 million of repurchases in 3Q10 6% non-agency acquired servicing and private whole loan sales The majority is acquired servicing where Wells Fargo did not underwrite and securitize and we have repurchase recourse back to the originator |

| Lower delinquency and foreclosure rates than peers Source: Inside Mortgage Finance. (1) Industry is all large servicers ($6.9 trillion) including WFC, C, JPM and BAC. (Data as of June 30, 2010) Wells Fargo total delinquency and foreclosure ratio for 3Q10 is 8.14% (1) 2Q10 Delinquency Performance |

| Repurchase exposure is manageable Demands are primarily concentrated in specific vintages with the GSEs Demands and losses have been concentrated in 2006- early 2008 vintages Demands in these vintages are down two consecutive quarters We don't expect large losses on pre-2006 and post-2008 vintages The balance of loans outstanding in the 2006-2008 vintages continued to decline The percentage of 120 day delinquent continued to decline Delinquency is an important measure as demands are generally correlated to defaults It should be noted, however, that loans that become delinquent and are properly underwritten to applicable contract terms do not result in repurchase New Repurchase Demands from Freddie Mac and Fannie Mae for 2006-2008 Vintages (1) (number of loans) New quarterly repurchase demands received on 2006-2008 vintages. of xx , 201x. |

| 3Q10 outstanding repurchase demands down in both number and balance from 2Q10 Repurchase demand pipeline represents initial requests for information and loans being assessed for repurchase Approximate percent of requests that end up being repurchased: 50% Percent of borrowers where we repurchase the loan but are able to make current through modification: 20%-25% Percent loss severity (on average) for loans we repurchase and are unable to modify: 50% Repurchase reserve liability as of September 30, 2010: $1.3 billion Repurchase exposure is manageable and reserve is adequate |
| Appendix |

| Non-strategic loan portfolio risk reduction (1) Net of purchase accounting adjustments. -$13.3 -$6.9 -$6.2 |
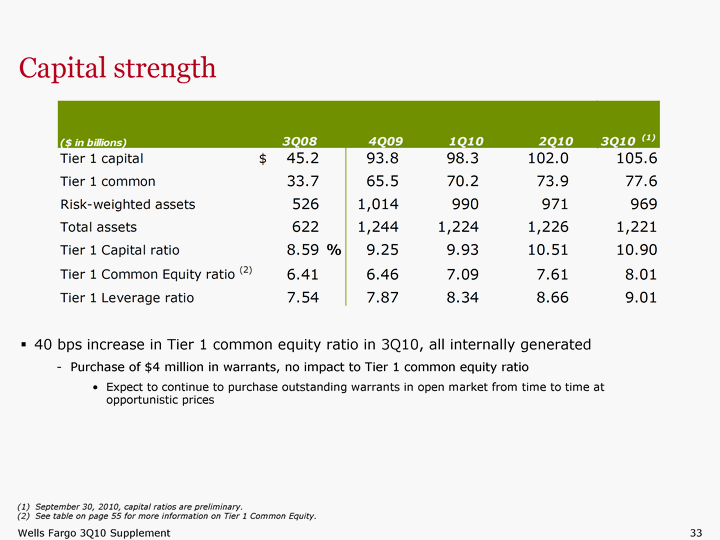
| Capital strength 40 bps increase in Tier 1 common equity ratio in 3Q10, all internally generated Purchase of $4 million in warrants, no impact to Tier 1 common equity ratio Expect to continue to purchase outstanding warrants in open market from time to time at opportunistic prices (1) September 30, 2010, capital ratios are preliminary. (2) See table on page 55 for more information on Tier 1 Common Equity. |

| Purchased credit-impaired (PCI) portfolios continued to perform better than originally expected (1) Does not reflect charge-offs and certain other charges against the nonaccretable difference. Reclassified $639 million nonaccretable difference in 3Q10 from the commercial, CRE and foreign and other consumer loan portfolios expected to accrete to future income over remaining life of underlying loans $202 million nonaccretable difference released in 3Q10 due to loan resolutions $153 million in net interest income $49 million in noninterest income $14.5 billion in nonaccretable difference remains to absorb losses on PCI loans, 30.3% of UPB for PCI loans except $21 billion that have had their nonaccretable difference charged for expected loss |

| (1) Release of the nonaccretable difference for settlement with borrower, on individually accounted PCI loans, increases interest income in the period of settlement. Pick-a-Pay and Other consumer PCI loans do not reflect nonaccretable difference releases due to pool accounting for those loans, which assumes that the amount received approximates the pool performance expectations. (2) Release of the nonaccretable difference as a result of sales to third parties increases noninterest income in the period of the sale. (3) Reclassification of nonaccretable difference for increased cash flow estimates to the accretable yield will result in increasing income and thus the rate of return realized. Amounts reclassified to accretable yield are expected to be probable of realization over the estimated remaining life of the loan. (4) Write-downs to net realizable value of PCI loans are charged to the nonaccretable difference when severe delinquency (normally 180 days) or other indications of severe borrower financial stress exist that indicate there will be a loss of contractually due amounts upon final resolution of the loan. $202 million nonaccretable difference released in 3Q10 into income due to loan resolutions $153 million in net interest income $49 million in noninterest income $639 million reclassified to accretable yield in 3Q10 for loans with improving cash flows reflecting better than expected performance, expected to accrete to income over estimated remaining expected life of underlying loans $247 million in other consumer $392 million in commercial, CRE and foreign $14.5 billion in nonaccretable difference remains to absorb losses on PCI loans Nonaccretable difference established in purchase accounting for PCI loans absorbs losses otherwise recorded as charge-offs Purchased credit-impaired (PCI) loan portfolio update Nonaccretable difference in 3Q10 |

| PCI accretable yield 3Q10 results include interest income of $528 million compared to $643 million in 2Q10 Balance of $16.7 billion expected to accrete to income over the remaining life of the underlying loans Volume and early performance of Pick-a-Pay loan modifications combined with slower default timing are primary drivers of the $7.0 billion increase in expected PCI cash flows (accretable yield) since acquisition Loan modifications include some or all of the following: reduced interest rates, extended loan terms up to 40 years and reduced (forgiven) principal balance Expected cash flows on all PCI portfolios are recalculated quarterly including the adequacy of life-of-loan loss marks (nonaccretable difference) Estimates of redefaults on our Pick-a-Pay loan modifications While there is some underlying volatility in assumptions on a quarterly basis, total PCI cash flows have increased since acquisition (1) Represents changes in interest cash flows due to changes in interest rates on variable rate loans and updated expectations about the timing and extent of loan prepayments and defaults, in part influenced by the impact of modifications incorporated into the quarterly assessment of expected future cash flows. |

| Commercial, Commercial Real Estate and Foreign PCI portfolio accretable yield $1.0 billion remains to be accreted into income over 1.6 years (the estimated remaining weighted average life of the portfolio) Increase from 2Q10 reflects the reclassification to accretable yield from nonaccretable of $392 million during the quarter Most of portfolio tied to LIBOR Resolution income includes loans settled with the borrower but does not include gain or loss from sales to 3rd parties Weighted average life of the portfolio of 1.6 years has held relatively consistent over the past 2 quarters as shorter duration portfolios have rolled off and period of future cash flow assumptions have been extended |

| Pick-a-Pay PCI portfolio accretable yield $14.6 billion remains to be accreted over 9 years (the estimated remaining weighted average life of the portfolio) There was no reclassification of nonaccretable to accretable in 3Q10 Increase in weighted average life of the portfolio in 3Q10 reflects slower default timing and the continued success of our loan modification program Quarterly fluctuations in accretable yield can be driven by changes in: Interest rate indices for variable rate PCI loans Prepayment assumptions Expected principal and interest payments over the estimated life While the accretable yield balance is expected to be earned over the estimated remaining life of the loans, the accretable yield percentage is also affected by the quarterly updates to projected timing of cash flow events including REO liquidations, short sales, modifications and prepayments Successful modification programs have increased the expected cash flows and the resulting increase in yield has more than offset the impact on expected cash flows for decreases in note indices for variable rate PCI loans |

| 3Q10 Credit quality highlights Allowance for credit losses $24.4 billion 1.50x annualized quarterly charge-offs 3.23% of total loans $14.5 billion in nonaccretable difference for PCI portfolio in addition to allowance Provision expense declined $544 million and was $650 million less than net charge-offs in the quarter Net charge-offs of $4.1 billion down $394 million from 2Q10 Commercial and commercial real estate losses declined $288 million on lower commercial and CRE mortgage losses Consumer losses declined $103 million as declines in junior lien mortgage, credit card and Pick-a-Pay were partially offset by higher first lien mortgage and consumer revolving including seasonally higher auto loan losses Based on current economic conditions and forecasts, we believe provision expense peaked in 3Q09 and charge-offs peaked in 4Q09; currently expect additional reserve releases in coming quarters absent significant deterioration in the economy |

| Nonperforming assets Commercial & CRE nonaccruals of $12.5 billion 96% secured and approximately 63% guaranteed Over 58% are currently paying interest that is applied to principal $2.9 billion in losses taken to date Consumer nonaccruals of $15.7 billion > 99% secured Approximately 40% of nonaccrual loans have been written down 22% CLTV (1) below 80% $3.8 billion in losses taken to date $13.2 billion of troubled debt restructurings (TDRs), including $4.0 billion of nonaccrual TDRs, have $3.4 billion of loan impairment for expected life-of-loan loss reserves Foreclosed assets up $1.1 billion 58% of the increase are government guaranteed loans or written down through purchase accounting $148 million of the increase are government insured $509 million of the increase reflects shift from PCI loans to REO ($406 million consumer and $103 million commercial and CRE) Remainder represents real estate loans (residential and CRE) and have already been written down The current loan-to-value (CLTV) ratio is calculated as the outstanding loan balance divided by the collateral value. The table above does not include PCI loans that were contractually 90 days past due and still accruing. Also excludes GNMA and similar loans whose repayments are insured by the Federal Housing Administration or guaranteed by the Department of Veterans Affairs. |

| Commercial nonaccrual loans CRE Construction: Inflows decreased 30% while outflows increased 14% from 2Q10 36% current on interest 70% guaranteed 37% of NPLs have been written down CRE Mortgage: Inflows increased 3% while outflows decreased 2% from 2Q10 76% guaranteed 52% current on interest 35% of NPLs have been written down Commercial Loans & Lease Financing: Inflows increased 50% and outflows declined 26% from 2Q10 91% secured 41% guaranteed 82% current on interest 30% have already been written down 3Q10 Total commercial nonaccrual loans = $12,518 million ($ change in millions) |

| Consumer real estate nonaccrual loans National Home Equity (1): Inflows increased 11% while outflows increased 4% 42% are 1-4 family first mortgage 23% are TDRs for which impairment has been recognized Other Businesses: 81% is WFF debt consolidation Inflows declined 2% while outflows increased 3% 40% have been written down 9% is WBR Inflows decreased 9% while outflows increased 76% Home Mortgage: Inflows increased 10% while outflows increased 14% 58% have already been written down 55% are > 180 DPD Pick-a-Pay: Inflows declined 15% while outflows increased 27% 81% of NPLs held at current estimated recoverable value 21% are TDRs for which impairment has been recognized See page 50 for additional information 3Q10 Total residential real estate nonaccrual loans = $15,349 million ($ change in millions) All comparisons are to 2Q10. (1) Includes National Home Equity first and junior lines and loans. (2) FAS 167 addresses accounting for variable interest entities and is now incorporated into Accounting Standards Codification topic 810, Consolidation. (2) (2) (2) (2) |

| Commercial real estate (CRE) loan portfolio Office Industrial, Warehouse Other RE Apartment Retail (Ex Shopping Ctr) Land (Ex 1-4 Family) Shopping Ctr 1-4 Family Structure Hotel/Motel 1-4 Family Land Institutional 2% Agriculture Retail CA FL TX NC GA NY VA AZ NJ CO Other 33% of the portfolio is owner-occupied |

| CRE loan portfolio by business group Wholesale Banking 15% owner-occupied Community Banking 61% owner-occupied Wealth, Brokerage & Retirement (WBR) 38% owner-occupied |

| Wholesale Banking CRE loan portfolio (1) Wholesale CRE outstandings of $82.7 billion (1) down $1.2 billion, or 1%, from 2Q10 CRE Division portfolio = $61.6 billion, stable with 2Q10 outstandings NPAs increased $143 million from 2Q10 while losses declined $86 million, or 55 bps, from 2Q10 Wachovia PCI CRE portfolio = $7.7 billion carrying value down $1.1 billion, or 12%, from 2Q10 Losses declined $30 million from 2Q10 3Q10 revenue included release of nonaccretable difference for commercial PCI resolutions (payoffs/sales) of $188 million in the quarter vs. $495 million in 2Q10 on improved borrower liquidity and higher collateral asset values in the quarter Foreclosed assets/REO/Other increased $88 million from 2Q10 CRE loans originated through other Wholesale Banking channels (both legacy Wells Fargo and Wachovia) = $13.3 billion, down $161 million from 2Q10 Nonaccruals and losses relatively stable from 2Q10 Includes $8.3 billion in C&I loans managed by commercial real estate business including unsecured loans to real estate developers not secured by real estate and loans to REITs, as well as foreign and consumer loans. |

| Pick-a-Pay mortgage portfolio Carrying value of $77.3 billion in first lien loans outstanding, down $2.9 billion from 2Q10 and down $18.0 billion from 4Q08 on paid-in-full loans and loss mitigation efforts Unpaid principal balance of $93.0 billion, down $4.1 billion from 2Q10 and down $24.3 billion since acquisition $3.5 billion in principal forgiveness since acquisition reflects over 73,000 completed full-term modifications Pick-a-Pay loans with negative amortization potential decreased $5.6 billion from 2Q10 to 63% of loans Total portfolio deferred interest of $2.9 billion down $308 million from 2Q10 and down $1.4 billion from 4Q08 Deferred interest down for the sixth consecutive quarter due to: Loan modification efforts Customers' minimum payments continue to increase modestly each year (7.5%), while interest rates are falling, so for many customers the minimum payment not only covers interest due, but also pays down some principal In September 2010, approximately 70% of customers choosing the minimum payment did not defer interest Expect minimal recast risk over next 3 years due to product structure and features In the rest of 2010, $16 million, or 52 loans, expected to hit contractual recast due to term or balance cap and have a payment change greater than 7.5% annual reset. Approximately $43 million, or 203 loans, expected in 2011 and approximately $76 million, or 297 loans, expected in 2012 Modification redefault rate has been consistently better than the industry average as we have strived to give customers an affordable, sustainable payment |

| Pick-a-Pay portfolio Available nonaccretable difference Represents contractual unpaid principal balance (UPB) of loans 180+ DPD, for which a write-down of $4.8 billion to current net realizable value has been reflected as a loss against the nonaccretable difference. |
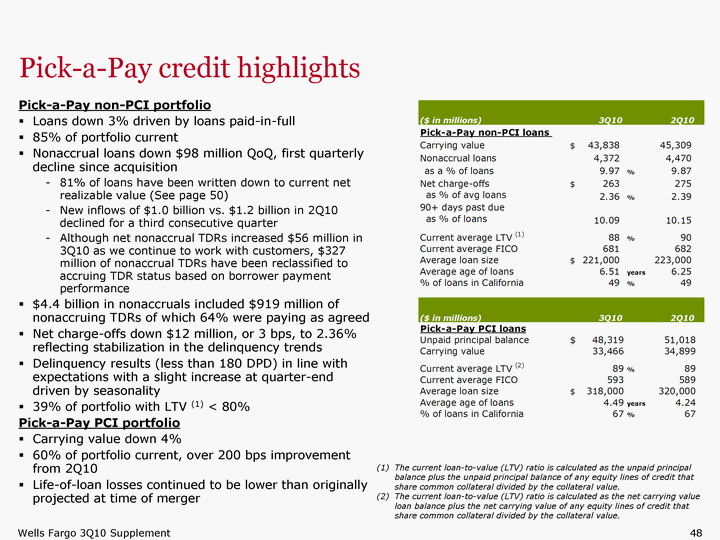
| Pick-a-Pay credit highlights Pick-a-Pay non-PCI portfolio Loans down 3% driven by loans paid-in-full 85% of portfolio current Nonaccrual loans down $98 million QoQ, first quarterly decline since acquisition 81% of loans have been written down to current net realizable value (See page 50) New inflows of $1.0 billion vs. $1.2 billion in 2Q10 declined for a third consecutive quarter Although net nonaccrual TDRs increased $56 million in 3Q10 as we continue to work with customers, $327 million of nonaccrual TDRs have been reclassified to accruing TDR status based on borrower payment performance $4.4 billion in nonaccruals included $919 million of nonaccruing TDRs of which 64% were paying as agreed Net charge-offs down $12 million, or 3 bps, to 2.36% reflecting stabilization in the delinquency trends Delinquency results (less than 180 DPD) in line with expectations with a slight increase at quarter-end driven by seasonality 39% of portfolio with LTV (1) < 80% Pick-a-Pay PCI portfolio Carrying value down 4% 60% of portfolio current, over 200 bps improvement from 2Q10 Life-of-loan losses continued to be lower than originally projected at time of merger The current loan-to-value (LTV) ratio is calculated as the unpaid principal balance plus the unpaid principal balance of any equity lines of credit that share common collateral divided by the collateral value. (2) The current loan-to-value (LTV) ratio is calculated as the net carrying value loan balance plus the net carrying value of any equity lines of credit that share common collateral divided by the collateral value. |

| Pick-a-Pay Non-impaired (Non-PCI) Current to 30 Days Pick-a-Pay Impaired (PCI) Current to 30 Days Pick-a-Pay: Current to 30+ days past due roll rates Roll rates from current to 30+ days past due (DPD) up modestly from 2Q10 due to seasonality First time delinquencies, defined as the percentage of 30+ days delinquent loans that are delinquent for the first time in the life of the loan, an important indicator in tracking the emergence of new problem loans, continued to improve in 3Q10 In the non-PCI portfolio, the percentage of first time delinquencies has dropped six consecutive quarters In the PCI portfolio, the ratio of first time delinquencies is at levels not seen since early 2008 |
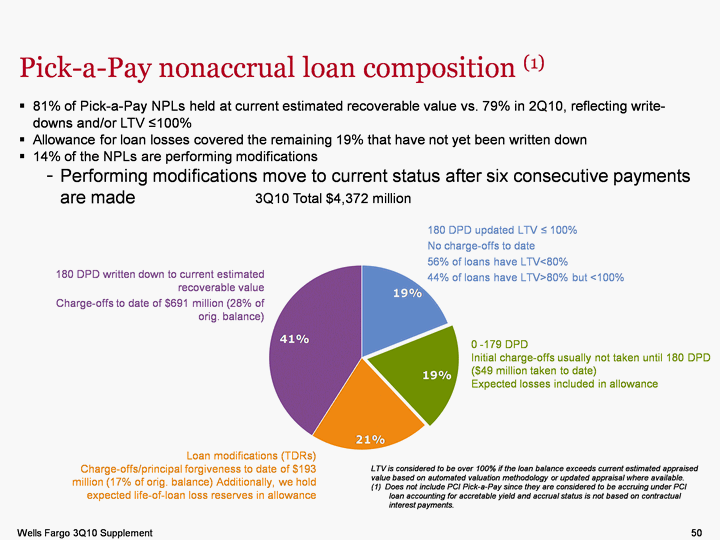
| Pick-a-Pay nonaccrual loan composition (1) 81% of Pick-a-Pay NPLs held at current estimated recoverable value vs. 79% in 2Q10, reflecting write-downs and/or LTV ^100% Allowance for loan losses covered the remaining 19% that have not yet been written down 14% of the NPLs are performing modifications Performing modifications move to current status after six consecutive payments are made 3Q10 Total $4,372 million 180 DPD written down to current estimated recoverable value Charge-offs to date of $691 million (28% of orig. balance) 180 DPD updated LTV ^ 100% No charge-offs to date 56% of loans have LTV<80% 44% of loans have LTV>80% but <100% 0 -179 DPD Initial charge-offs usually not taken until 180 DPD ($49 million taken to date) Expected losses included in allowance Loan modifications (TDRs) Charge-offs/principal forgiveness to date of $193 million (17% of orig. balance) Additionally, we hold expected life-of-loan loss reserves in allowance LTV is considered to be over 100% if the loan balance exceeds current estimated appraised value based on automated valuation methodology or updated appraisal where available. (1) Does not include PCI Pick-a-Pay since they are considered to be accruing under PCI loan accounting for accretable yield and accrual status is not based on contractual interest payments. |

| Real estate 1-4 family first mortgage portfolio First lien mortgage loans down 2% Pick-a-Pay non-PCI portfolio down 3% PCI portfolio down 4% Debt consolidation down 4% Non run-off first lien mortgage down 1% Non run-off first lien mortgage nonaccruals up $248 million, or 25 bps, and includes a $106 million increase from FAS 167 (1) loans Non run-off net charge-offs up $43 million, or 14 bps, driven by a $29 million increase from FAS 167 (1) loans (1) FAS 167 addresses accounting for variable interest entities and is now incorporated into Accounting Standards Codification topic 810, Consolidation. (2) Ratios on non run-off first lien mortgage loan portfolio only. |

| Home equity portfolio (1) Core Portfolio (2) Outstandings down 2% High quality new originations with weighted average CLTV of 61%, 774 FICO, and 31% total debt service ratio 3Q10 losses down $82 million resulting from prior quarters delinquency improvements Delinquency rate increased 11 bps, reflecting lower loan balances, increased trial modifications and elevated late stage delinquency levels related to extended foreclosure timelines Delinquency rate for loans with a CLTV >100% of 4.97% indicated vast majority of customers with negative equity continued making their payments Liquidating Portfolio 3Q10 losses down $14 million resulting from reduced delinquency observed over the past 3 quarters Delinquency rate for loans with a CLTV >100% of 6.43% indicated that most customers, even those sourced through third party channels, continued making their payments (1) Excludes purchased credit-impaired Wachovia loans. (2) Includes equity lines of credit and closed-end junior liens associated with the Pick-a-Pay portfolio totaling $1.7 billion at September 30, 2010 and $1.7 billion at June 30, 2010. (3) CLTV quarter-end based predominantly on estimated home values from automated valuation models updated through September 2010. Total loans include all open-to-buy and unused lines of credit. |

| Credit card portfolio $21.9 billion credit card outstandings represent less than 3% of total loans Outstandings down 1% as consumers reduced their debt Net charge-offs down $75 million, or 139 bps, reflecting previous risk mitigation efforts that included tightened underwriting and line management changes (i.e. fewer balance transfers and approved balance increases) |

| Auto portfolio Core Portfolio Total outstandings up 2% QoQ and up 22% YoY reflecting record market share positioning Strong originations in the quarter with LTV and loan structures consistent over the last six quarters Net charge-offs up $16 million QoQ reflecting seasonality and modestly lower used car values despite previous quarters' improvement in 30+ delinquencies September Manheim index of 118.9 down 1% from June and relatively stable from September 2009 30+ days past due increased $66 million, or 13 bps, due to seasonality Liquidating Portfolio (1) Wells Fargo Financial indirect auto outstandings down 15%, or $1.2 billion, QoQ driven by paydowns Legacy Wells Fargo Indirect portfolio. |

| Tier 1 common equity reconciliation |

| Return on average tangible common equity |
