Attached files
| file | filename |
|---|---|
| 8-K - FORM 8-K - NUVEEN INVESTMENTS INC | c60596e8vk.htm |
Exhibit 99.1

| October 7, 2010 Deutsche Bank Leveraged Finance Conference |

| Forward-Looking Statements This presentation contains certain statements, estimates and forecasts with respect to future performance and events. These statements, estimates and forecasts are "forward-looking statements". Forward- looking statements are based on various underlying assumptions and expectations and are subject to known and unknown risks, uncertainties and assumptions including those identified in our SEC filings. There can be no assurance that the forward-looking statements included in this presentation will prove to be accurate or correct. Accordingly, you should not rely upon forward-looking statements as a prediction of actual results and we do not assume any responsibility for the accuracy or completeness of any of these forward-looking statements. We do not undertake any obligation to, and will not, update any forward-looking statements, whether as a result of new information, future events or otherwise. |

| Agenda Nuveen Overview Recent Business Results FAF Transaction Overview 2 |

| Nuveen Capabilities Highly diversified business Scaled multi-boutique model Specialized brands Strong investment performance Culture of product innovation, driving strong organic growth Track record of successful acquisitions Leadership positions in Closed-end Funds and Retail Managed Accounts Significant growth potential in Institutional and Mutual Fund markets 3 |
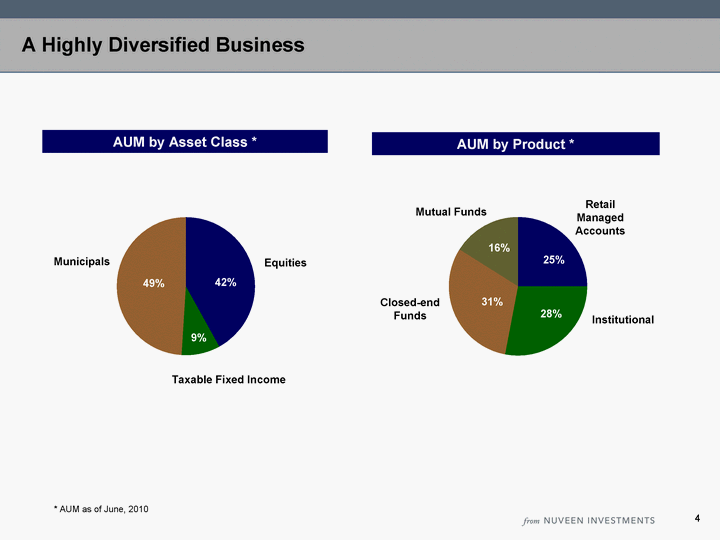
| RMA Institutional CEF MF East 25 28 31 16 A Highly Diversified Business AUM by Product * AUM by Asset Class * Retail Managed Accounts Closed-end Funds Mutual Funds Institutional Equities Taxable Fixed Income Municipals East 42 9 49 Equities Municipals Taxable Fixed Income 4 49% 42% 9% 25% 31% 16% 28% * AUM as of June, 2010 |

| Scaled Multi-Boutique Model: Specialized Brands Fixed Income (Munis, Taxable) Nuveen HydePark-Enhanced equities/asset allocation Global Equities Note: AUM as of June, 2010; excludes sub-advised assets Value Equities Alternatives Credit Strategies Risk Managed Equities Large Cap Growth Equities Growth Equities $77.3B $18.5B $26.1B $8.4B $10.2B $3.2B Specialized teams, separately branded Independent investment processes Benefit from scaled, shared Nuveen platform Sales / service Back-office / Administration 5 |
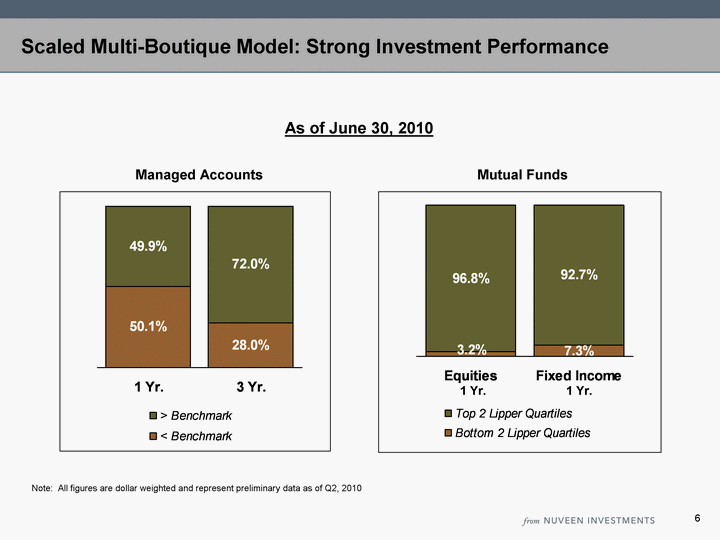
| Scaled Multi-Boutique Model: Strong Investment Performance Note: All figures are dollar weighted and represent preliminary data as of Q2, 2010 1 Yr. 3 Yr. < Benchmark 0.501 0.28 > Benchmark 0.499 0.72 Managed Accounts Equities Fixed Income Bottom 2 Lipper Quartiles 0.032 0.073 Top 2 Lipper Quartiles 0.968 0.927 Mutual Funds As of June 30, 2010 1 Yr. 1 Yr. 6 |

| Culture of product innovation, driving strong organic growth 7 |
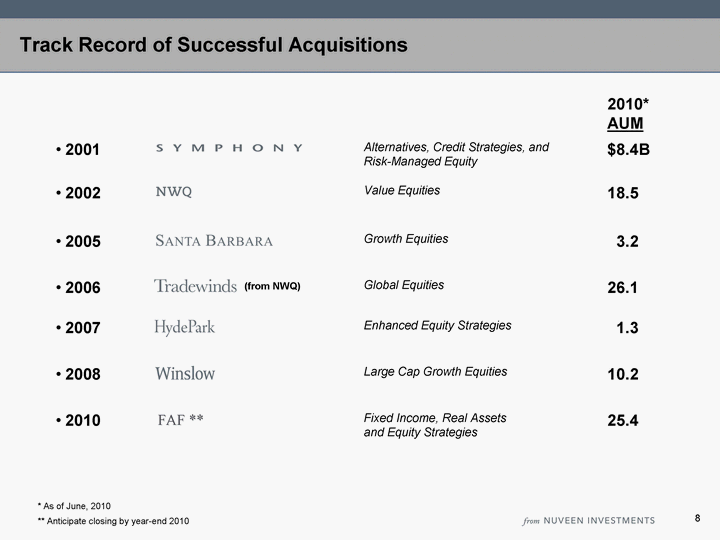
| 2010* AUM 2001 Alternatives, Credit Strategies, and Risk-Managed Equity $8.4B 2002 Value Equities 18.5 2005 Growth Equities 3.2 2006 Global Equities 26.1 2007 Enhanced Equity Strategies 1.3 2008 Large Cap Growth Equities 10.2 2010 FAF ** Fixed Income, Real Assets and Equity Strategies 25.4 * As of June, 2010 ** Anticipate closing by year-end 2010 Track Record of Successful Acquisitions 8 (from NWQ) |

| Leadership Positions in Closed-end Funds & Retail Managed Accounts... Significant untapped potential in Institutional and Mutual Funds Closed-end Funds $47B AUM* Retail Managed Accounts $37B AUM* Mutual Funds $24B AUM* Institutional $43B AUM* 102 Muni Funds 14 Taxable Funds 9 Equity-based funds 32 Muni Funds 41 Equity-based and Taxable Fixed Income funds Value Growth Global/international Alternatives Fixed Income Significant untapped growth potential #1 share position #1 share position * As of June, 2010 Value Growth Muni Global/International 9 |
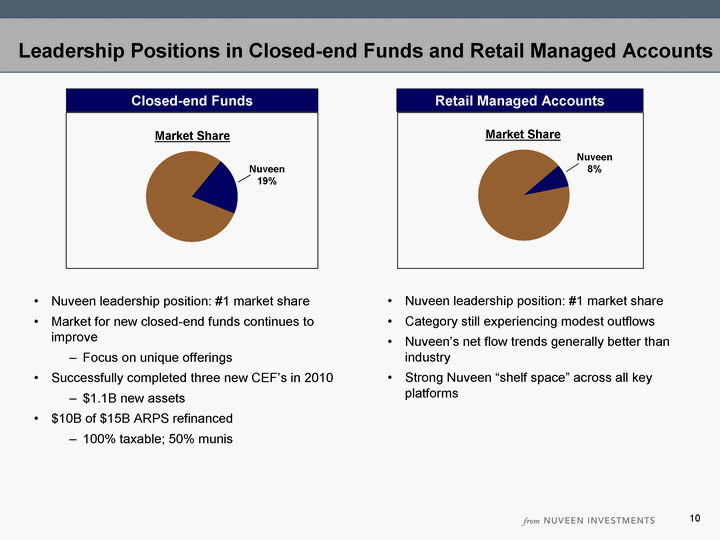
| Nuveen Other East 8 0 92 Leadership Positions in Closed-end Funds and Retail Managed Accounts Retail Managed Accounts Closed-end Funds Nuveen 8% Nuveen Other East 20 0 80 Nuveen 19% 10 Nuveen leadership position: #1 market share Market for new closed-end funds continues to improve Focus on unique offerings Successfully completed three new CEF's in 2010 $1.1B new assets $10B of $15B ARPS refinanced 100% taxable; 50% munis Nuveen leadership position: #1 market share Category still experiencing modest outflows Nuveen's net flow trends generally better than industry Strong Nuveen "shelf space" across all key platforms Market Share Market Share |

| Mutual Funds Net Flows ($B) Institutional Net Flows ($B) Significant Untapped Potential in Institutional and Mutual Funds Well established Institutional presence: Tradewinds, NWQ, Symphony, Winslow Continued to broaden Institutional product offering Very strong institutional pipeline International and DCIO client activity ramping up significantly Adding institutional sales/service resources to accelerate growth Consistent quarter-to-quarter strong net flows Of 53 funds rated by Morningstar, 75% have a 4/5 star rating Additional products in incubation for future launch Continue to make progress in expanding platform distribution Dedicated MF wholesalers launched in 2010 Named one of Barron's "Best Mutual Fund Families" for 2009 - ranked #5 of 61 for the one-year period Sales Q4 2009 3 3 Q1 1 1.8 2.5 Q2 4.5 5.5 7.1 Q3 Est 3.5 4.8 Sales Q4 2009 10.5 Q1 10.5 Q2 10.5 Q3 Est 10.5 2010 1.0 1.0 1.0 1.0 1.1 1.1 5.1 1.2 0.9 (1) 0.2 2.9 (2) 2.2 11 (1) Excludes Nuveen single client redemption (2) SSgA new assets |
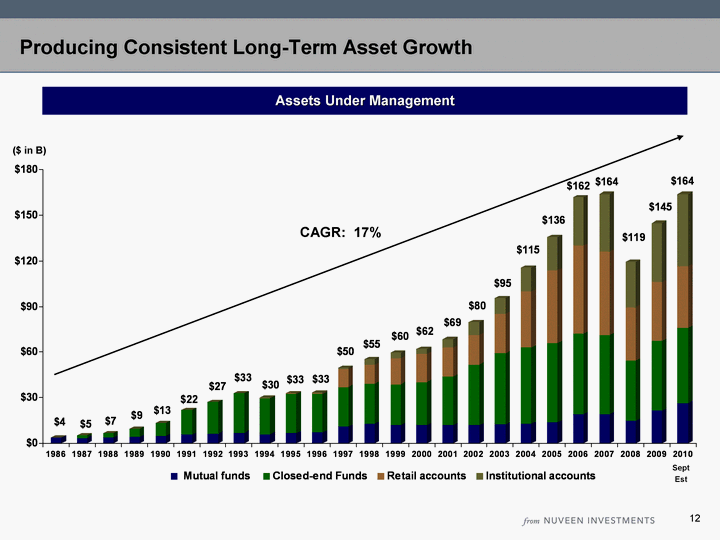
| Producing Consistent Long-Term Asset Growth Assets Under Management Mutual funds Closed-end Funds Retail accounts Institutional accounts Total 1986 3.83 - - 0 3.83 1987 3.54 1.79 - 0 5.33 1988 3.78 3.07 - 0 6.85 1989 4.18 5.14 - 0 9.32 1990 4.8 8.44 - 0 13.24 1991 5.71 16.29 - 0 22 1992 6.4 20.85 0.15 0 27.4 1993 6.92 25.8 0.23 0 32.95 1994 5.97 23.73 0.34 0 30.04 1995 6.57 25.78 0.69 0 33.04 1996 6.93 25.43 0.7 0.2 33.26 1997 10.885 26.117 11.622 0.97 49.594 1998 12.71 26.22 12.7 3.6 55.23 1999 12.04 26.85 17 3.9 59.79 2000 11.96 28.36 18.6 3.1 62.02 2001 11.81 32 19 5.7 68.51 2002 11.849 39.943 19.4 8.5 79.69 2003 12.3 47.1 25.7 10.3 95.4 2004 12.7 50.2 37 15.6 115 2005 14 52 47.7 21.9 135.6 2006 19 53 58 32 162 2007 19 52 55 38 164 2008 14.7 39.9 34.9 29.8 119.2 2009 21.4 46 38.5 39 144.9 2010 26.5 49.5 40.5 47.5 164 CAGR: 17% ($ in B) Sept Est 12 |

| Agenda Nuveen Overview Recent Business Results FAF Transaction Overview 13 |

| Fixed Income $3B Equities $6 Ending AUM Nuveen Business / Financial Update September (Est) 2010 Ending AUM vs. Q4 $164B $145B +$10 +$9 Q4 2009 Market (Est) Flows (Est) Sept (Est) AUM 14 Institutional $4B SSgA +$3 Mutual Funds $3 Closed-end Funds $1 Retail Managed Accounts ($1) |

| Q2, 2010 Year-to-Date Financial Results 2008 2009 2010 East 388 300 361 2008 2009 2010 East 175 132 163 +20% 2008 2009 2010 East 215 170 206 +23% +21% Revenues ($M)* Expenses ($M)* EBITDA ($M)* 15 *As defined by Credit Agreement, as of June, 2010 |
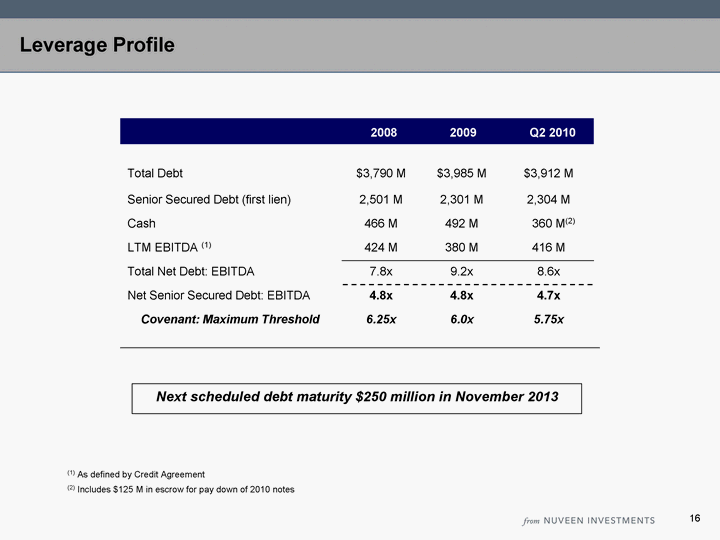
| 2008 Q2 2010 2009 Total Debt $3,790 M $3,985 M $3,912 M Senior Secured Debt (first lien) 2,501 M 2,301 M 2,304 M Cash 466 M 492 M 360 M(2) LTM EBITDA (1) 424 M 380 M 416 M Total Net Debt: EBITDA 7.8x 9.2x 8.6x Net Senior Secured Debt: EBITDA 4.8x 4.8x 4.7x Covenant: Maximum Threshold 6.25x 6.0x 5.75x (1) As defined by Credit Agreement (2) Includes $125 M in escrow for pay down of 2010 notes Leverage Profile Next scheduled debt maturity $250 million in November 2013 16 |

| Agenda Nuveen Overview Recent Business Results FAF Transaction Overview 17 |

| Impact to Nuveen Significant strategic benefits - investment capabilities, distribution reach, diversification and accelerating growth prospects Provides strategic relationship with one of the largest and best capitalized banks in the country Adds $40 million of run-rate EBITDA (including synergies) Provides modest de-leveraging Transaction with FAF Advisors Key Facts Expected Timing Transaction is expected to close by year-end, subject to customary conditions USB Relationship 5-year strategic investment services agreement with US Bank Wealth Management, with Nuveen / FAF maintaining preferred access to USB Wealth Management advisors Automatic one-year extensions by mutual agreement Nuveen/FAF to initially be the primary manager on USB's Wealth Management fixed income platform Consideration 9.5% equity post transaction (before employee equity plan restructuring) $80 million cash (no debt financing) Transaction Nuveen to acquire the long-only assets of FAF Advisors, the Minneapolis-based investment adviser to the First American Funds mutual fund family, and a subsidiary of US Bancorp ("USB") FAF Advisors will become a wholly-owned subsidiary of Nuveen Investments FAF Advisors manages $25B in long-only assets under management, including 41 mutual funds USB USB to retain cash management business representing $62B of AUM 18 |
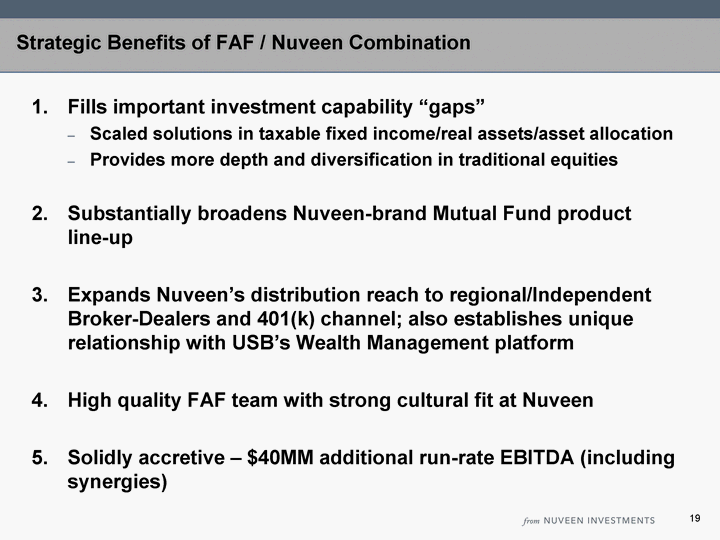
| Strategic Benefits of FAF / Nuveen Combination Fills important investment capability "gaps" Scaled solutions in taxable fixed income/real assets/asset allocation Provides more depth and diversification in traditional equities Substantially broadens Nuveen-brand Mutual Fund product line-up Expands Nuveen's distribution reach to regional/Independent Broker-Dealers and 401(k) channel; also establishes unique relationship with USB's Wealth Management platform High quality FAF team with strong cultural fit at Nuveen Solidly accretive - $40MM additional run-rate EBITDA (including synergies) 19 |

| Leading Mutual Fund Family $25B AUM (June, 2010) Consistent positive quarterly net flows Strong, diversified business... Diversified business: fixed income, real assets, asset allocation and equities Leading mutual fund family Ranked #4 in 2009 by Barron's Deep investment team with strong investment results Strategic relationship with US Bancorp 5th largest commercial bank in the U.S. Fixed Income Equity Real Assets Asset Allocation 49.7 37 10 4 Diversified Long-Term Business AUM $25.4B Institutional Retail Platform USB Closed End Funds 23 15 11 46 5 20 |
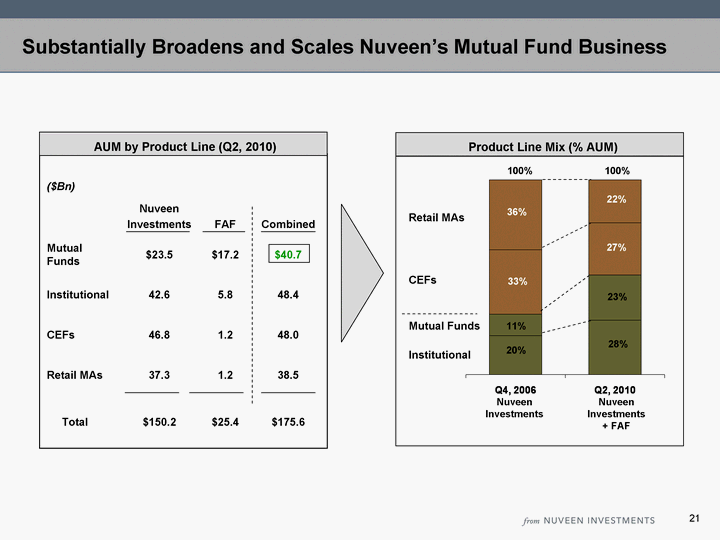
| ($Bn) Nuveen Investments FAF Combined Mutual Funds $23.5 $17.2 $40.7 Institutional 42.6 5.8 48.4 CEFs 46.8 1.2 48.0 Retail MAs 37.3 1.2 38.5 Total $150.2 $25.4 $175.6 Q4, 2006 Q2, 2010 Institutional 0.2 0.28 Mutual Funds 0.11 0.23 CEFs 0.33 0.27 Retail Managed Accts. 0.36 0.22 Product Line Mix (% AUM) Retail MAs CEFs Mutual Funds Institutional 20% 11% 33% 36% 28% 23% 27% 22% 100% 100% Nuveen Investments Nuveen Investments + FAF AUM by Product Line (Q2, 2010) Substantially Broadens and Scales Nuveen's Mutual Fund Business 21 |
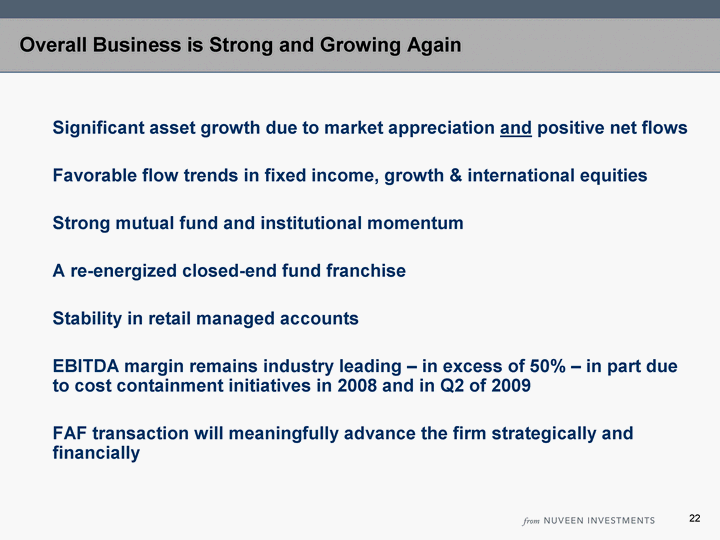
| Overall Business is Strong and Growing Again Significant asset growth due to market appreciation and positive net flows Favorable flow trends in fixed income, growth & international equities Strong mutual fund and institutional momentum A re-energized closed-end fund franchise Stability in retail managed accounts EBITDA margin remains industry leading - in excess of 50% - in part due to cost containment initiatives in 2008 and in Q2 of 2009 FAF transaction will meaningfully advance the firm strategically and financially 22 |

| 23 Q&A |
