Attached files
| file | filename |
|---|---|
| 8-K - FORM 8-K - HARLAND CLARKE HOLDINGS CORP | form8k_091610.htm |

2010 Credit Suisse
Global Credit Products Conference
September 16, 2010

2
Forward looking statements
Certain information in this presentation may be considered forward-looking
information within the definition of the Private Securities Litigation Reform
Act of 1995. This information is based on the Company's current expectations
and actual results could vary materially depending on risks and uncertainties
that may affect the Company's operations, markets, services, prices and
other factors as discussed in filings with the Securities and Exchange
Commission. These risks and uncertainties include, but are not limited to,
general and economic conditions and declines in the industries in which we
participate. There is no assurance that the Company's expectations will be
realized. All forward-looking statements speak only as of the date of this
presentation. All subsequent written and oral forward-looking statements
attributable to us or any person acting on our behalf are qualified by the
cautionary statements in this section. The Company assumes no obligation to
update any forward-looking information contained in this presentation.

3
Introductions
n Over 34 years of
experience in the financial
services and security
printing industry
experience in the financial
services and security
printing industry
n Over 17 years with Clarke
American / Harland
Clarke
American / Harland
Clarke
n Former Chief Executive
Officer of Rocky Mountain
Bank Note
Officer of Rocky Mountain
Bank Note
n Marketing representative
for IBM out of graduate
school
for IBM out of graduate
school
Chuck Dawson
President & CEO,
Harland Clarke Holdings
n 17 years of experience
with Harland Clarke,
Honeywell, and GE in
various financial and
operations leadership
roles
with Harland Clarke,
Honeywell, and GE in
various financial and
operations leadership
roles
n Over 5 years with Clarke
American / Harland
Clarke
American / Harland
Clarke
n Former Chief Financial
Officer of Honeywell’s
Aircraft Landing Systems
business
Officer of Honeywell’s
Aircraft Landing Systems
business
Peter Fera
EVP & CFO,
Harland Clarke Holdings

4
World class
operations
Leading
presence
Diversified,
blue-chip
client portfolio
n A leading provider of checks and related products, marketing services, and customized
business and home office products
business and home office products
n A leading provider of software and services to financial institutions
n A leading provider of education related products and survey technologies
n $1.7 billion in combined revenues for LTM Q2 2010
n Over 11,000 financial institutions clients such as:
n Harland Clarke: 5 contact centers and 12 plants, supported by a national sales organization
n Harland Financial Solutions: 17 fully networked facilities focused on customer support and
enhancement of software solutions
enhancement of software solutions
n Scantron: 6 facilities, which include manufacturing, technology and services
n 2001 Malcolm Baldrige National Quality Award winner
Strong, long-
term client
relationships
n Trusted, integrated relationships with clients
n Provider of mission-critical software products
n Strong partnerships with long-term contracts
Harland Clarke Holdings

5
Who we are
n Checks and related products
n Marketing Services
n Business and home office
products
products
n Financial and business forms
n Core processing systems
n Internet and mobile banking
applications
applications
n Risk management solutions
n Branch automation solutions
n Lending origination and
compliance
compliance
n Web-based assessment
products
products
n Student Achievement
Management solutions
Management solutions
n Response to Intervention
products
products
n Survey Services
n Scanners and forms
Revenues(1) $1.2B
Revenues(1) $280M
Revenues(1) $203M
(1) LTM Q2 2010; revenues are adjusted to add back acquisition accounting fair value adjustments of deferred revenue.

6
Diversified business and product lines
§ Combined business has four major product lines
– Checks and office products
– Software and related services
– Direct marketing services
– Data collection, testing and survey solutions
$1.7 billion
LTM Q2 2010 Revenue
Revenue for Non-Check Products
Continued success diversifying product lines

7
Diversified and expanded client relationships
Approximately 80% of revenue is under long-term contracts
Direct to Consumer
and Commercial
and Commercial
Financial Institutions
Education

8
Strong history of cost reductions and margin expansion
History of continuous improvement
n Demonstrated track-record of margin
improvement
improvement
n Margin expansion of 4.4 points since 2008
n 16 facility closures since the start of 2007
n Exceeded synergy target of $112.6M from
the John H. Harland acquisition
the John H. Harland acquisition
(1) See page 16 for the calculation of and reconciliation of net income to adjusted EBITDA

9
n A leading provider of checks and office
products and marketing and contact
center services
products and marketing and contact
center services
– 11,000 financial and commercial institution
clients
clients
– More than 80% of revenues under long-term
contract
contract
n Diverse product and service offerings
– Personal and business checks
– Marketing services including database
marketing, eMarketing, creative
development, and strategic services
marketing, eMarketing, creative
development, and strategic services
– Contact center services
– Financial and business forms
– Deposit products including deposit tickets,
security bags, cash straps, coin wraps
security bags, cash straps, coin wraps
– Address labels, self-inking stamps,
checkbook covers, registers
checkbook covers, registers
– Card services

10
Harland Clarke financial performance
$ in millions
Margin 26.4% 26.3% 29.7% 30.9%
Revenue(1)
Adjusted EBITDA
Reconciliation to Adjusted EBITDA
$ in millions
(1) Revenue is adjusted to add back acquisition accounting fair value adjustments of deferred revenue.
2007
2008
2009
LTM Q2 2010
Operating income
181.1
$
217.1
$
195.8
$
224.5
$
D&A
98.2
112.5
109.3
107.3
Restructuring
5.6
8.3
25.7
10.6
Asset impairment charges
3.1
1.5
33.4
34.0
Impact of acquisition accounting adjustments
1.9
-
-
0.5
Transaction related expenses
2.4
-
-
-
Adjusted EBITDA
292.3
$
339.4
$
364.2
$
376.9
$

11
n A leading supplier of software and services
to financial institutions
to financial institutions
– Core processing systems
– Internet and mobile banking applications
– Risk management solutions
– Branch automation solutions
– Lending origination and compliance
n High switching costs associated with
switching integrated software providers
switching integrated software providers
n Sell to approximately 37% of all financial
institutions in the United States
institutions in the United States
n Top 25 customers < 10% of revenue
n Recurring revenues of more than 75%
Customer Mix
Strong recurring revenue base
12
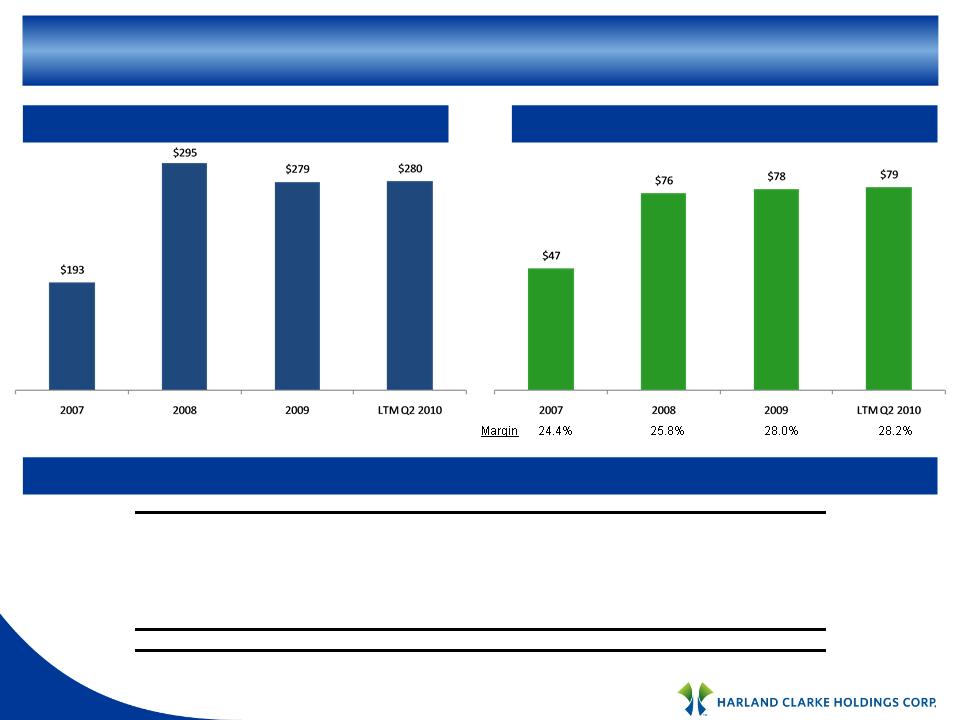
HFS financial performance
$ in millions
Revenue(1)
Adjusted EBITDA
Reconciliation to Adjusted EBITDA
$ in millions
(1) Revenue is adjusted to add back acquisition accounting fair value adjustments of deferred revenue.
2007
2008
2009
LTM Q2 2010
Operating income
16.8
$
34.1
$
32.8
$
37.0
$
D&A
17.3
28.7
26.9
27.6
Restructuring
-
3.9
3.8
1.0
Asset impairment charges
-
-
10.6
10.6
Deferred purchase price compensation
3.4
8.1
3.5
2.2
Impact of acquisition accounting adjustments
9.6
1.4
0.2
0.1
Adjusted EBITDA
47.1
$
76.2
$
77.8
$
78.5
$

Web-based Education Technology,
School Forms and Testing
13
n Strong brand recognition
– A leading testing provider for over 40 years
n Leading provider of web-based education
technology products
technology products
– Student Achievement Management solutions
– Response to Intervention products
– Special education software solutions
– Web-based assessment products
n Leading provider of scanners and forms
– Provide patent protected scanner to school
– Sales of forms create annuity-like revenue
stream
stream
– Diverse client base - education, commercial,
government
government
n Large installed base
– 80% of the largest school districts
– 65,000+ scanning machines
n Customer diversification
– 100,000+ accounts
– Largest account approximately 5% of
revenue
revenue
n Focus on being a leading provider of
enterprise-wide testing and surveying
technology
enterprise-wide testing and surveying
technology
Surveys, Forms, and Processing

14
Scantron financial performance
$ in millions
Revenue(1)
Adjusted EBITDA
Reconciliation to Adjusted EBITDA
$ in millions
(1) Revenue is adjusted to add back acquisition accounting fair value adjustments of deferred revenue.
2007
2008
2009
LTM Q2 2010
Operating income
12.4
$
28.4
$
34.5
$
32.1
$
D&A
10.6
23.3
25.9
25.9
Restructuring
-
2.4
3.0
6.4
Asset impairment charges
-
-
0.2
0.2
Impact of acquisition accounting adjustments
5.1
1.6
0.2
0.1
Adjusted EBITDA
28.1
$
55.7
$
63.8
$
64.7
$

15
Harland Clarke Holdings financial highlights
n Strong historical financial performance
n High EBITDA margins
n Low working capital requirements
n Efficient deployment of capital
n Significant cash flow generation

16
Harland Clarke Holdings financial performance
Revenue(1)
Adjusted EBITDA
Reconciliation to Adjusted EBITDA
$ in millions
$ in millions
(1) Revenue is adjusted to add back acquisition accounting fair value adjustments of deferred revenue minus revenue from inter-segment transactions.
2007
2008
2009
LTM Q2 2010
Net income (loss)
(15.4)
$
47.2
$
112.1
$
97.4
$
Interest expense, net
159.9
184.2
135.9
122.6
Provision (benefit) for income taxes
(5.4)
33.0
67.4
64.0
D&A
126.2
164.5
162.1
160.8
Restructuring
5.6
14.6
32.5
18.0
Deferred purchase price compensation
3.4
8.1
3.5
2.2
Asset impairment charges
3.1
1.5
44.2
44.8
(Gain) / loss on early extinguishment of debt
54.6
-
(65.0)
(3.5)
Impact of acquisition accounting adjustments
16.6
3.0
0.4
0.7
Transaction related expenses
2.4
-
-
-
Adjusted EBITDA
351.0
$
456.1
$
493.1
$
507.0
$

17
Harland Clarke Holdings credit strength
n LTM Q2 2010 cash flow from operations $ 261.9 million
n LTM Q2 2010 adjusted EBITDA $ 507.0 million
n Cash/equivalents on hand(1) $ 206.6 million
n Net debt(2) $ 2,022.3 million
n Net debt / LTM Q2 2010 adjusted EBITDA 4.0x
n LTM Q2 2010 adjusted EBITDA / Net interest(3) 4.1x
(1) As of June 30, 2010
(2) Net debt equals total debt of $2,228.9 million less cash and equivalents as of June 30, 2010
(3) Net interest expense of $122.6 million for the LTM Q2 2010