Attached files
| file | filename |
|---|---|
| EX-32.2 - WESTMONT RESOURCES INC. | wmns_ex32-2.htm |
| EX-32.1 - WESTMONT RESOURCES INC. | wmns_ex32-1.htm |
| EX-31.2 - WESTMONT RESOURCES INC. | wmns_ex31-2.htm |
| EX-21.1 - WESTMONT RESOURCES INC. | wmns_ex21-1.htm |
| EX-31.1 - WESTMONT RESOURCES INC. | wmns_ex31-1.htm |
UNITED STATES
SECURITIES AND EXCHANGE COMMISSION
Washington, D.C. 20549
FORM 10-K
|
(Mark One)
|
|
[X] Annual Report Under Section 13 Or 15(d) Of The Securities Exchange Act Of 1934
|
|
For the fiscal year ended May 31, 2010
|
|
[ ] Transition Report Under Section 13 Or 15(d) Of The Securities Exchange Act Of 1934
|
|
For the transition period from _____ to _____
|
|
COMMISSION FILE NUMBER: 000-52398
|
WESTMONT RESOURCES, INC.
(Name of small business issuer in its charter)
|
NEVADA
|
76-0773948
|
|
(State or other jurisdiction of incorporation or organization)
|
(I.R.S. Employer Identification No.)
|
|
155 108th Avenue, Suite 150
|
|
|
Bellevue, WA
|
98004
|
|
(Address of principal executive offices)
|
(Zip Code)
|
(206) 922-2203
Issuer’s telephone number
|
Securities registered under Section 12(b) of the Exchange Act:
|
NONE.
|
|
Securities registered under Section 12(g) of the Exchange Act:
|
Shares of Common Stock, $0.001 Par Value Per Share.
|
Indicate by check mark if the registrant is a well-known seasoned issuer, as defined in Rule 405 of the Securities Act. Yes [ ] No [X]
Indicate by check mark if the registrant is not required to file reports pursuant to Section 13 or Section 15(d) of the Act. Yes [ ] No [X]
Indicate by check mark whether the issuer (1) filed all reports required to be filed by Section 13 or 15(d) of the Securities Exchange Act of 1934 during the past 12 months (or for such shorter period that the registrant was required to file such reports), and (2) has been subject to such filing requirements for the past 90 days.
Yes [X] No [ ]
1
Indicate by check mark whether by check mark whether the registrant has submitted electronically and posted on its corporate Website, if any, every Interactive Data File required to be submitted pursuant to Rule 405 of Regulation S-T (Section 232.405 of this chapter) during the preceding 12 months or for such shorter period that the registrant was required to submit such files). Yes [ ] No [ X ]
Indicate by check mark if disclosure of delinquent filers pursuant to Item 405 of Regulation S-K (Section 229.405 of this chapter) is not contained herein, and will not be contained, to the best of registrant’s knowledge, in definitive proxy or information statements incorporated by reference in Part III of this Form 10-K or any amendment to this Form 10-K. [ ]
Indicate by check mark whether the registrant has submitted electronically and posted on its corporate Web site, if any, every Interactive Data File required to be submitted and posted pursuant to Rule-405 of Regulation S-T (§ 232.405 of this chapter) during the preceding 12 months (or for such shorter period that the registrant was required to submit and post such files). Yes [ X ] No [ ]
Indicate by check mark whether the registrant is a large accelerated filer, an accelerated filer, a non-accelerated filer, or a smaller reporting company. See the definitions of “large accelerated filer”, an “accelerated filer” and “smaller reporting company” in Rule 12b-2 of the Exchange Act.”
|
Large accelerated filer [ ]
|
Accelerated filed [ ]
|
|
Non-accelerated filer [ ]
(Do not check if smaller reporting company)
|
Smaller reporting company [ X ]
|
Indicate by check mark whether the registrant is a shell company (as defined in Rule 12b-2 of the Exchange Act). Yes [ ] No [ X ]
State the aggregate market value of the voting and non-voting common equity held by non-affiliates computed by reference to the price at which the common equity was sold, or the average bid and asked price of such common equity, as of the last business day of the registrant’s most recently completed second fiscal quarter. $76,660, based on a price of $0.02 per share, being the price at which the registrant last sold shares of its common stock.
Indicate the number of shares outstanding of each of the registrant’s classes of common stock, as of the latest practicable date. As of Monday, 13 September 2010, the Issuer had 53,499,660 Shares of Common Stock and 100,000 of Class A Preferred Stock outstanding.
DOCUMENTS INCORPORATED BY REFERENCE
List hereunder the following documents if incorporated by reference and the Part of the Form 10-K (e.g. Part I, Part II, etc.) into which the document is incorporated: (1) Any annual report to security holders; (2) Any proxy or information statement; and (3) Any prospectus filed pursuant to Rule 424b) or (c) under the Securities Act of 1933. The listed documents should be clearly described for identification purposes (e.g., annual report to security holders for fiscal year ended December 24, 1980). None.
2
WESTMONT RESOURCES INC.
ANNUAL REPORT ON FORM 10-K
FOR THE YEAR ENDED MAY 31, 2010
INDEX
|
PAGE
|
||
|
PART I
|
||
|
ITEM 1.
|
Description of Business.
|
6 |
|
ITEM 1B.
|
Unresolved Staff Comments.
|
16
|
|
ITEM 2.
|
Properties.
|
16
|
|
ITEM 3.
|
Legal Proceedings.
|
16
|
|
ITEM 4.
|
Removed and Reserved
|
16
|
|
PART II
|
||
|
ITEM 5.
|
Market for Common Equity and Related Stockholder Matters and Issuer Purchases of Equity Securities.
|
16
|
|
ITEM 6.
|
Selected Financial Data.
|
17
|
|
ITEM 7.
|
Management’s Discussion and Analysis of Financial Condition and Results of Operations.
|
18
|
|
ITEM 7A.
|
Quantitative and Qualitative Disclosures About Market Risk.
|
21
|
|
ITEM 8.
|
Financial Statements and Supplementary Data.
|
22
|
|
ITEM 9.
|
Changes in and Disagreements with Accountants on Accounting and Financial Disclosure.
|
35
|
|
ITEM 9A.
|
Controls and Procedures.
|
35
|
|
ITEM 9B.
|
Other Information.
|
35
|
|
PART III
|
||
|
ITEM 10.
|
Directors, Executive Officers and Corporate Governance.
|
36
|
|
ITEM 11.
|
Executive Compensation.
|
38
|
|
ITEM 12.
|
Security Ownership of Certain Beneficial Owners and Management and Related Stockholder Matters.
|
38
|
|
ITEM 13.
|
Certain Relationships and Related Transactions, and Director Independence.
|
42
|
|
ITEM 14.
|
Principal and Accountant Fees and Services.
|
43
|
|
PART IV
|
||
|
ITEM 15.
|
Exhibits, Financial Statement Schedules
|
44
|
|
SIGNATURES
|
45
|
3
CAUTIONARY STATEMENT REGARDING FORWARD-LOOKING INFORMATION
Certain statements contained in this Annual Report on Form 10-K constitute “forward-looking statements.” These statements, identified by words such as “plan,” “anticipate,” “believe,” “estimate,” “should,” “expect,” and similar expressions include our expectations and objectives regarding our future financial position, operating results and business strategy. These statements reflect the current views of management with respect to future events and are subject to risks, uncertainties and other factors that may cause our actual results, performance or achievements, or industry results, to be materially different from those described in the forward-looking statements. Such risks and uncertainties include those set forth under the caption “Management’s Discussion and Analysis or Plan of Operation” and elsewhere in this Annual Report. We advise you to carefully review the reports and documents we file from time to time with the Securities and Exchange Commission (the “SEC”), particularly our Quarterly Reports on Form 10-QSB and our Current Reports on Form 8-K.
These forward-looking statements were based on various factors and were derived from utilizing numerous assumptions and other factors that could cause our actual results to differ materially from those in the forward-looking statements. These factors include, but are not limited to the following:
|
|
·
|
the capital intensive nature of oil and gas development and exploration operations and our ability to raise adequate capital to fully develop our operations and assets,
|
|
|
·
|
fluctuating oil and gas prices and the impact on our results of operations,
|
|
|
·
|
the impact of the global economic crisis on our business,
|
|
|
·
|
the imprecise nature of our reserve estimates,
|
|
|
·
|
our ability to recover proved undeveloped reserves and convert probable and possible reserves to proved reserves,
|
|
|
·
|
the possibility that present value of future net cash flows will not be the same as the market value,
|
|
|
·
|
the costs and impact associated federal and state regulations,
|
|
|
·
|
changes in existing federal and state regulations,
|
|
|
·
|
our dependence on third party transportation facilities,
|
|
|
·
|
insufficient insurance coverage,
|
|
|
·
|
market overhang related to restricted securities and outstanding options, warrants and convertible notes,
|
|
|
·
|
adverse impacts on the market price of our common stock from sales by the selling security holders. Most of these factors are difficult to predict accurately and are generally beyond our control. You should consider the areas of risk described in connection with any forward-looking statements that may be made herein. Readers are cautioned not to place undue reliance on these forward-looking statements, and readers should carefully review this annual report in its entirety, including the risks described in Item 1A. Risk Factors. Except for our ongoing obligations to disclose material information under the Federal securities laws, we undertake no obligation to release publicly any revisions to any forward-looking statements, to report events or to report the occurrence of unanticipated events. These forward-looking statements speak only as of the date of this annual report, and you should not rely on these statements without also considering the risks and uncertainties associated with these statements and our business.
|
OTHER PERTINENT INFORMATION
We maintain our web site at www. westmontresources.com. Information on this web site is not a part of this prospectus. We file annual, quarterly and other reports and information with the Securities Exchange Commission. Promptly after their filing, we provide access to these reports without charge on our website at www.westmontresources.com. Our principal and administrative offices are located in Bellevue, Washington. Our common stock is traded on the Over The Counter Bulletin Board (OTCBB) under the symbol WMNS. Unless otherwise indicated, references in this report to “Westmont”, “the Company” or to “we”, “our”, “us”, and similar terms refer to and include Westmont Resources Inc., our direct and indirect wholly owned subsidiaries and our interests in sponsored drilling partnerships.
4
DEFINITIONS
All defined terms under Rule 4-10(a) of Regulation S-X shall have their statutorily prescribed meanings when used in this report. As used in this document:
|
|
·
|
“3-D” means three-dimensional.
|
|
|
·
|
“B/d” means barrels of oil or natural gas liquids per day.
|
|
|
·
|
“Bbl” or “Bbls” means barrel or barrels of oil.
|
|
|
·
|
“Bcf” means billion cubic feet.
|
|
|
·
|
“Boe” means barrel of oil equivalent, determined by using the ratio of one Bbl of oil or NGLs to six Mcf of gas.
|
|
|
·
|
“Boe/d” means boe per day.
|
|
|
·
|
“Btu” means a British thermal unit, a measure of heating value, which is approximately equal to one Mcf.
|
|
|
·
|
“LIBOR” means London Interbank Offered Rate.
|
|
|
·
|
“LNG” means liquefied natural gas.
|
|
|
·
|
“Mb/d” means Mbbls per day.
|
|
|
·
|
“Mbbls” means thousand barrels of oil.
|
|
|
·
|
“Mboe” means thousand boe.
|
|
|
·
|
“Mboe/d” means Mboe per day.
|
|
|
·
|
“Mcf” means thousand cubic feet of natural gas.
|
|
|
·
|
“Mcf/d” means Mcf per day.
|
|
|
·
|
“MMbbls” means million barrels of oil.
|
|
|
·
|
“MMboe” means million boe.
|
|
|
·
|
“MMBtu” means million Btu.
|
|
|
·
|
“MMBtu/d” means MMBtu per day.
|
|
|
·
|
“MMcf” means million cubic feet of natural gas.
|
|
|
·
|
“MMcf/d” means MMcf per day
|
|
|
·
|
“NGL” or “NGLs” means natural gas liquids, which are expressed in barrels.
|
|
|
·
|
“Oil” includes crude oil and condensate.
|
|
|
·
|
“PUD” means proved undeveloped.
|
|
|
·
|
“SEC” means United States Securities and Exchange Commission.
|
|
|
·
|
“Tcf” means trillion cubic feet.
|
|
|
·
|
With respect to information relating to our working interest in wells or acreage, “net” oil and gas wells or acreage is determined by multiplying gross wells or acreage by our working interest therein. Unless otherwise specified, all references to wells and acres are gross.
|
5
PART I
ITEM 1. DESCRIPTION OF BUSINESS.
CORPORATE OVERVIEW
Westmont Resources Inc., a Nevada corporation formed in 2004, is an independent natural resource exploration and production company that plans to explore to, develop and produce natural resources to include minerals, natural gas, crude oil, and natural gas liquids. In North America, our exploration and production interests are focused in mineral exploration in British Columbia Canada. Oil and natural gas exploration in the Appalachian Basin, Illinois Basin, Permian Basin, Williston Basin, and along the Gulf Coast in Eastern Texas.
The company is operational and engaged in the future acquisition, and planned development and production of oil and natural gas properties through the use of disruptive technology in an environmentally safe and cost effective manner.
As a development stage independent junior oil and gas Company with ambitions to become an independent major in selected regions, the company’s strategy is two-fold. First, to grow rapidly through the acquisition or “roll-up” of undervalued oil & gas properties with proven reserves in heavy oil and oil shale which have only been partially developed. Second, through the use of proprietary disruptive technologies the company “wrings out” the untapped value of the target properties’ reserves. The company’s growth plans are in modular steps depending on the availability of capital.
Our Expansion strategy is modular and expandable based on funding. Our management team has extensive experience in the implementation of disruptive technology in various natural resources, mining and environmental remediation industries. We have brought together an exceptional team of financial, engineering, geological, geophysical, technical and operational expertise in successfully developing and operating properties in both our current and planned areas of operation. The management team is primarily focused on the acquisition and accumulation of natural resource assets, while building a strong operational management team to manage these assets to the highest effective and profitable degree possible.
Westmont Resources Inc is focused on the acquisition and development of natural resources properties, including oil and natural gas fields, with proven reserves. The company’s strategy is to shun the risks of traditional exploration of undeveloped basins. Rather, the company’s strategy is to more fully develop existing and proven fields. We seek to acquire and develop properties while economically attractive are not strategic to the oil and gas majors and which have not been fully developed by previous traditional operators. We will acquire properties that have produced and may still be producing but, while having significant proven reserves have been deemed not commercially productive. Through the use of proprietary disruptive technologies the company is in a position to “wring” out the untapped value of these proven reserves.
GROWTH STRATEGY
Westmont’s mission is to grow a profitable upstream natural resource company for the long-term benefit of our shareholders. Westmont’s long-term perspective has many dimensions, with the following core principles:
|
|
·
|
Own a balanced portfolio of core assets;
|
|
|
·
|
Maintain financial flexibility and a strong balance sheet; and
|
|
|
·
|
Optimize rates of return, earnings and cash flow.
|
Throughout the cycles of our industries, these strategies have underpinned our commitment to deliver long-term production and reserve growth and achieve competitive investment rates of return for the benefit of our shareholders.
OPTIMIZE RETURNS ON INVESTED CAPITAL
We will focus on optimizing returns on invested capital through strict cost control and the creative application of technology.
6
Our management systems provide a uniform process of measuring success across Westmont. Our management systems incentivize high rate-of-return activities but allow for appropriate risk-taking to drive future growth. Results of operations and rates of return on invested capital are measured monthly, reviewed with management quarterly and utilized to determine annual performance awards. We monitor capital allocations, at least quarterly, through a disciplined and focused process that includes analyzing current economic conditions, expected rates of return on proposed development and exploration drilling targets, opportunities for tactical acquisitions or, occasionally, new core areas that could enhance our portfolio. We also use technology to optimize our rates of return by reducing risk, decreasing drilling time and costs, and maximizing recoveries from reservoirs.
RECENT DEVELOPMENTS
We completed several initiatives during 2010 to strengthen our balance sheet and add liquidity. These transactions have provided us with greater financial flexibility to take advantage of our development opportunities. See “Management’s Discussion and Analysis of Financial Condition and Results of Operations.”
|
|
·
|
Convertible Note Exchange: In May 2010, we retired $20,000 of our convertible note with the Brooklyn Group Inc. The retired note was issued in March 2005.
|
|
|
·
|
Sale of Get2Networks, Inc: In April 2010, Get2Networks, Inc was sold to Alpha-Omega Inc. for the return of approximately 433,000 (21,650,000 pre-split) restricted common shares and approximately 30,000 (1,500,000 pre-split) Restricted Class A Preferred shares in Westmont Resources Inc. and the removal of 2 loans valued at approximately $153,893 and $36,340.
|
|
|
·
|
In May 2010, we signed a Memorandum of Understanding (MOU) for the Purchase of a 70% working interest in 92 oil & gas wells located in Scott & Morgan County Tennessee from Domestic Energy Corporation. Transfer of ownership in these wells from Domestic Energy to Westmont began in June 2010 and is ongoing. Domestic Energy Corporation is 87% controlled by The Avalon Group Ltd. who is also the largest beneficial owner of Westmont Resources Inc. through their control and ownership in F&M Inc.
|
OIL & NATURAL GAS BUSINESS STRATEGY
Initially the company has targeted for acquisition long-lived, low risk natural gas and oil properties associated with known shale plays throughout the Appalachians/Middle-Atlantic, the Mountains west of Idaho and Montana as well as the heavy oil deposits in Texas with proven reserves. This strategy is centered on rehabilitation and production enhancement, utilizing modern management and technology applications, of producing oil and gas formations. Through the application of disruptive production technologies, Westmont will infuse needed expertise, technology and capital into projects to improve operations and increase production.
In June 2010, Westmont signed a memorandum of understanding (“MOU”) in June 2010 to acquire 10% rights to commercialize a patent pending, disruptive market making technology in the heavy oil production and extraction industry known as Heavy Oil and Gas Extraction technology (HOGEÔ). As of the date of this filing, Westmont has not closed on the acquisition of the 10% interest in this technology. In addition, subsequent to May 31, 2010, Westmont has acquired exclusive distribution rights to a 100% biodegradable and environmentally safe fracturing solutions known as “FracSolv” manufactured and produced by NuEarth Corporation. NuEarth Corporation is 95% controlled by The Avalon Group Ltd. who is also the largest beneficial owner of Westmont Resources Inc. through their control and ownership in F&M Inc.
The company hopes to engage HOGEÔ to enhance the extraction of oil from proven reserves of heavy oil and tar sand formations. After maximizing the oil production the underlying shale basins will be “fracked” to release the natural gas through the application of both HOGEÔ and “FracSolv™”. Among other advantages, both of these applications have a more neutral effect on the environment than the traditional industry methods. The increased productions and yields as well as environmental impacts are more fully explored in the discussion below in “Technology Applications”.
7
Taking advantage of its technological edge, the Company has embarked on an ambitious Four Phase “Roll-up” Growth Strategy.
|
|
·
|
Phase 1: Acquire interests in oil and gas fields with significant unrealized reserves.
|
|
|
·
|
Phase 2: Place all wells back into production and add wells where appropriate to further maximize the lease potentials.
|
|
|
·
|
Phase 3: Redevelop all wells to greater depths to take advantage of untapped pay zones in the region. The existence of these formations is based on the productions of several similarly completed wells in the area.
|
|
|
·
|
Phase 4: Expand all wells using current technologies in vertical and horizontal drilling linked with modern fracturing methods to take advantage of the higher yielding natural gas Shale zones and/or heavy oil deposits where appropriate.
|
OIL & NATRUAL GAS OPERATIONS
Westmont Resources has signed three Letters of Intent (LOI’s) subsequent to the May 31, 2010 year end to obtain a number of oil and gas leases in the Chattanooga, Marcellus and Ohio Shale basins. One of the oldest and least appreciated gas producing regions in the North America is the thick sequence of shale found in the Appalachian Basin often referred to as simply “brown shale”, “black shale” or “Devonian shale”. These are vast formations of upper Devonian in age and are variously known as Marcellus Shale (Pennsylvania and West Virginia), Ohio Shale (Ohio & Kentucky), Antrim Shale (Michigan & northern Indiana), New Albany Shale (Illinois & Indiana), Woodford Shale (Texas, Oklahoma, New Mexico), Chattanooga Shale (Tennessee & vicinity, Millboro Shale (Virginia) and other diverse designations in various geographic localities.
Natural gas has been produced from the “Devonian shale” for approximately 200 years; early drilling and production of the shale gas occurred along the shale outcrop area near the south shore of Lake Erie in New York and Pennsylvania, as early as the 1820’s. Although gas was discovered in the Big Sandy area of Kentucky-West Virginia in 1879, serious development of the shale gas did not begin until 1921. Development of the Big Sandy Field has continued since that date to the present.
The wells within this sequence have yielded gas for considerably more than fifty years from relatively shallow depths, they have never been considered by the petroleum industry to be prime exploration targets. This is undoubtedly attributable to the generally low-volume yield by the existing Devonian Shale wells. During recent years however, dating back primarily into the 1970’s, interest in the gas reserves of the Upper Devonian Shale, particularly of the eastern United States, has been demonstrated by various segments of industry and government. Energy companies, gas utility companies in the Appalachians, industrial plants, and others along with the Department of Energy (DOE), have taken a new look at the energy producing potential of the Devonian shale.
Appalachian Basin - is America's oldest producing basin. But with renewed interest in this region has come the discovery of other production opportunities. Historically most of the drilling has been done at shallow depths. Over the last several years’ deeper production zones have been discovered, such as the Chattanooga shale and the Marcellus Shale. There is even talk of even greater formations further beneath the Marcellus. The five state area of Pennsylvania, West Virginia, Ohio, Kentucky and Tennessee is estimated to have a volume of Devonian black shale equal to 12,600 cubic miles spread over 160,000 miles of area. According to Columbia Gas, this equates to an estimated recoverable gas volume of 285 trillion (TCF). Considering today’s methods and technology, that figure is most certainly conservative.
The region is well served by State, County and Township roads, which afford passage the year-round to aid in the County’s oil and gas production. In addition, the climate is temperate, having mild winters, which rarely interfere with daily production.
8
Representing roughly 61,000 square miles, stretches from Upper New York, through western Pennsylvania and into eastern Ohio and most of Kentucky and West Virginia and northern Tennessee. This area is believed to possess one of the richest natural gas fields in the World. In early 2008, geoscientists at Penn State University, and SUNY Fredonia estimated that the Marcellus & Chattanooga contains more than 500 trillion cubic feet of natural gas representing twice the current reserves located in Saudi Arabia. The shale contains largely untapped natural gas reserves, and its close proximity to the burgeoning natural gas markets of the northeast, middle Atlantic and upper Midwest makes it an especially desirable gas supply.
The company’s special expertise is to apply cutting-edge clean technologies to wring additional value from long-lived, low risk gas and oil properties and to o squeeze more oil out of mature basins. The company intends to acquire a number of large contiguous tracts with existing producing wells or in close proximity. In addition, the company has identified a number of other large contiguous tracts of thousands of acres in the region for acquisition. Currently, it is estimated that there are in excess of 20,000 abandoned and capped oil and gas wells in this region.
In addition, to capturing natural gas from shale, the company is also focusing on the extraction of oil from untapped heavy oil and tar sands opportunities through the application of the Heavy Oil and Gas Extraction technology (HOGEÔ) in North America and worldwide through a HOGE licensing program. As mentioned above, in June 2010, Westmont signed a memorandum of understanding (“MOU”) in June 2010 to acquire 10% rights to commercialize HOGE. As of the date of this filing, Westmont has not closed on the acquisition of the 10% interest in this technology.
OIL & NATURAL GAS TECHNOLOGY APPLICATIONS
Heavy Oil & Gas Extraction Technology (HOGEÔ)
In June 2010, Westmont signed a memorandum of understanding (“MOU”) to acquire 10% rights to commercialize HOGE. As of the date of this filing, Westmont has not closed on the acquisition of the 10% interest in this technology. The following is a description of this technology that Westmont plans to acquire.
The HOGEÔ process, which is multi-patent pending process, yields a quadruple-play in competitive advantages:
|
|
·
|
First, HOGEÔ dramatically increase the oil’s viscosity, increasing yields by up to 90%.
|
|
|
·
|
Second, because HOGEÔ utilizes a well’s own gas production, it yields cost advantages of up to 50%.
|
|
|
·
|
Third, HOGEÔ has the advantage of extracting up to 90% of a basin’s reserves verses a 40% recovery when employing the steam extraction method.
|
|
|
·
|
Fourth, as HOGEÔ has virtually no adverse environmental impact the application has the potential for more universal acceptance and negates the costs of environmental damage mitigation, which furthers its economic advantages.
|
The initial pilot project employing the HOGEÔ process produced approximately 100 barrels of heavy oil per day as opposed to the 2 barrels per day previously produced by stripping. Studies show that further refinements of the HOGEÔ process indicate that it has the potential to reach 150-200 barrels per day, which the company estimates is double the rate of the latest steam injection extraction method and at operating costs reduced by half.
HOGEÔ is designed to extract heavy oil from formations such as tar/oil sands and Shale with a calculated recovery of 90% or more. The process mechanically injects a heated solution of natural gas, derived from the production of the well, delivered deep into the formation by a proprietary tool that melts the heavy tar oil and Shale oil to a thin viscosity and then extracts it to heated storage tanks on the surface. The technology is readily adaptable to traditional oil and gas extraction systems as well as Shale fracturing systems. Contrary to other methods, HOGEÔ includes constant control and fracturing with no paraffin accumulation, a cost effective extraction method with substantially lower entry and production costs enabling higher margins and longer lives for capital equipment.
9
HOGEÔ maximizes reserve recoveries due to its ability to penetrate further into the formation at a higher constant operator controllable temperature all of which are not possible with the most commonly applied steam extraction method. All the while HOGEÔ provides a net neutral environmental impact. HOGEÔ is proving to be an environmentally safer solution with no contamination of formation or blocking of production. This is particularly of interest in the more confined and populous regions of the Marcellus and Chattanooga shale basins which are advantageously in close proximity to the major gas & oil markets in the northeast United States.
The technology is designed to extract heavy oil from formations such as tar/oil sands with a calculated recovery of 90% or more. The process mechanically injects a heated solution of natural gas, derived from the production of the well, delivered deep into the formation by a proprietary tool that melts the heavy tar oil to a thin viscosity and then extracts it to heated storage tanks on the surface. The heavy oil formation is injected until a sufficient amount of recoverable heavy oil is heated to 300 degrees F., then the oil & gas is extracted until production temperatures drop below 200 degrees F. Upon completion, the injection cycle is started again.
Shale Gas Fracturing Solution
Subsequent to May 31, 2010, Westmont has acquired exclusive distribution rights to “FracSolv” manufactured and produced by NuEarth Corporation. NuEarth Corporation is 95% controlled by The Avalon Group Ltd. who is also the largest beneficial owner of Westmont Resources Inc. through their control and ownership in F&M Inc.
The Shale Gas Fracturing and Extraction industry uses approximately 5.3 million gallons of fracturing solutions of various formulations in the USA every year. Prior to 2008, Diesel fuel was the predominant base solution for fracturing solutions. With current diesel prices approximately $3.00 USD per gallon, this represents a $15.9 million dollar market potential.
The technology will directly compete with existing heavy oil recovery systems, in addition to conventional oil recovery technologies like: 1.) Cold Heavy Oil Production with Sand [CHOPs]; 2.) Steam Assisted Gravity Drainage [SAGD]; 3.) Strip Mining Methods; 4.) Cyclic Steam Stimulation [CCS]; 5.) Vapor Extraction [VAPEX]; 6.) In situ combustion; and 7.) Electricity and Microwave Heating.
The competitive advantages over its competition include constant control and fracturing with no paraffin accumulation, a cost effective extraction method with substantially lower entry and production costs enabling higher margins and longevity, while providing an environmentally safe solution with no contamination of formation or blocking of production.
OUR EXPLORATION AND PRODUCTION ACTIVITIES
Subsequent to the close of the fiscal year end of May 31, 2010, Westmont significantly increased our operations through the signing of a contract for the acquisition from Domestic Energy Corporation of the working interest in 92 oil & natural gas wells in Scott and Morgan Counties of Tennessee. Transfer of ownership in these wells from Domestic Energy to Westmont began in June 2010 and is ongoing. Domestic Energy Corporation is 87% controlled by The Avalon Group Ltd. who is also the largest beneficial owner of Westmont Resources Inc. through their control and ownership in F&M Inc. Wells drilled in this area range from 1,800 to 4,200 feet in depth and the well spacing is generally from 20 to 40 acres per well and are predominately in the Fort Payne formation.
ESTIMATED PROVED RESERVES AND FUTURE NET CASH FLOWS
Westmont Resources Inc, takes the position to only release information on proven reserves, and as of May 31, 2010 the Company has no reportable reserves. Our future reserve reports will be prepared in accordance with the generally accepted petroleum engineering and evaluation principles and most recent definitions and guidelines established by the SEC. All reserve definitions will comply with the applicable definitions of the rules of the SEC. The reserve reports will be estimated using engineering and geological methods widely accepted in our industry. The accuracy of these future reserve estimates will be dependent upon the quality of available data and upon independent geological and engineering interpretation of that data. For proved developed producing, the estimates considered to be definitive, using performance methods that utilize extrapolations of various historical data including oil, gas and water production and pressure history.
10
In January 2009 the SEC issued Release No. 33-8995, “Modernization of Oil and Gas Reporting” (Release 33-8995), amending oil and gas reporting requirements under Rule 4-10 of Regulation S-X and Industry Guide 2 in Regulation S-K and bringing full-cost accounting rules into alignment with the revised disclosure requirements. The new rules include changes to the pricing used to estimate reserves, the option to disclose probable and possible reserves, revised definitions for proved reserves, additional disclosures with respect to undeveloped reserves, and other new or revised definitions and disclosures. In January 2010 the Financial Accounting Standards Board (FASB) issued Accounting Standards Update (ASU) No. 2010-03 , “Oil and Gas Reserve Estimation and Disclosures” (ASU 2010-03), which amends Accounting Standards Codification (ASC) Topic 932, “Extractive Industries — Oil and Gas” to align the guidance with the changes made by the SEC. The Company adopted Release 33-8995 and the amendments to ASC Topic 932 resulting from ASU 2010-03 (collectively, the Modernization Rules) effective December 31, 2009.
Proved oil and gas reserves are the estimated quantities of natural gas, crude oil, condensate and NGL’s that geological and engineering data demonstrate with reasonable certainty to be recoverable in future years from known reservoirs under existing conditions, operating conditions, and government regulations. The Company reports all estimated proved reserves held under production-sharing arrangements utilizing the “economic interest” method, which excludes the host share of reserves. Reserve estimates are considered proved if they are economically producible and are supported by either actual production or conclusive formation tests. Estimated reserves that can be produced economically through application of improved recovery techniques are included in the “proved” classification when successful testing by a pilot project or the operation of an active, improved recovery program using reliable technology establishes the reasonable certainty for the engineering analysis on which the project or program is based. Economically producible means a resource, which generates revenue that exceeds, or is reasonably expected to exceed, the costs of the operation. Reasonable certainty means a high degree of confidence that the quantities will be recovered. Reliable technology is a grouping of one or more technologies (including computational methods) that has been field-tested and has been demonstrated to provide reasonably certain results with consistency and repeatability in the formation being evaluated or in an analogous formation. Estimated proved developed oil and gas reserves can be expected to be recovered through existing wells with existing equipment and operating methods.
Proved undeveloped (PUD) reserves include those reserves that are expected to be recovered from new wells on undrilled acreage, or from existing wells where a relatively major expenditure is required for recompletion. Undeveloped reserves may be classified as proved reserves on undrilled acreage directly offsetting development areas that are reasonably certain of production when drilled, or where reliable technology provides reasonable certainty of economic producibility. Undrilled locations may be classified as having undeveloped reserves only if a development plan has been adopted indicating that they are scheduled to be drilled within five years, unless specific circumstances justify a longer time period.
Under recent SEC rules we are now also permitted to provide information about probable and possible reserves. As set forth above, prior to 2010 reserve reports did not contain any estimates on probable or possible reserves. “Probable reserves” are additional reserves that are less certain to be recovered than proved reserves but which, in sum with proved reserves, are as likely as not to be recovered. “Possible reserves” are additional reserves that are less certain to be recovered than probable reserves. The various reserve categories have different risks associated with them. Proved reserves are more likely to be produced than probable reserves and probable reserves are more likely to be produced than possible reserves. Because of these risks, the different reserve categories should not be considered to be directly additive.
Our policies regarding internal controls over reserve estimates require reserves to be in compliance with the SEC definitions and guidance and for reserves to be prepared by an independent engineering firm under the supervision of our Chief Financial Officer. We provide the engineering firm with estimate preparation material such as property interests, production, current operation costs, current production prices and other information. This information is reviewed by our Chief Executive Officer and our Chief Financial Officer to ensure accuracy and completeness of the data prior to submission to our third party engineering firm.
Westmont Resources has currently hired an independent Petroleum Engineer to calculate and estimate reserves associates with the 70% working interest in the 92 wells acquired from Domestic Energy Corporation. Transfer of ownership in these wells from Domestic Energy to Westmont began in June 2010 and is ongoing. Domestic Energy Corporation is 87% controlled by The Avalon Group Ltd. who is also the largest beneficial owner of Westmont Resources Inc. through their control and ownership in F&M Inc.
11
PRINCIPAL MARKETS
The Principal Markets for our crude oil and natural gas produced in the Appalachian region are refining companies, utility companies and private industry end users. Crude oil is stored in tanks at the well site until the purchaser retrieves it by tank truck. Direct purchases of our crude oil are made statewide at our well sites by Barrett Oil Purchasing Company. Our natural gas has multiple markets throughout the eastern United States through gas transmission lines. Access to these markets is presently provided by three companies in northeastern Tennessee, including Cumberland Valley Resources, NAMI Resources Company, and Tengasco. Local markets in Tennessee are served by Citizens Gas Utility District and the Powell Clinch Utility District. Natural gas is delivered to the purchaser via gathering lines into the main gas transmission line. Surplus gas is placed in storage facilities or transported to East Tennessee Natural Gas, which serves Tennessee and Virginia.
The following table presents information regarding average sales prices and costs, after deducting royalties and interests of others, with respect to oil and gas production attributable to competitive businesses in the region.
In the following table, average production cost are costs incurred to operate and maintain the wells and equipment and to pay the production costs, which does not include ad valoreum and severance taxes per unit of production, and is exclusive of work-over costs.
|
Appalachian region
|
2010
|
|||
|
Average sales price
|
71.33 | |||
|
Average production cost
|
54.64 | |||
COMPETITION
Our planned oil and gas exploration activities in Tennessee are expected to be undertaken in a highly competitive and speculative business environment. I n seeking any other suitable oil and gas properties for acquisition, we compete with a number of other companies doing business in Tennessee and elsewhere, including large oil and gas companies and other independent operators, many with greater financial resources than we have.
At the local level, as we seek to expand our lease holdings, we compete with several companies who are also seeking to acquire leases in the areas of the acreage. In the Appalachian region, we have six significant competitors including Atlas Energy Resources, LLC, Consol Energy, Inc., Can Argo Energy Corporation, Champ Oil, John Henry Oil and Tengasco. These companies are in competition with us for oil and gas leases in known producing areas in which we currently operate, as well as other potential areas of interest. We believe we can effectively compete for leases, however, as in the Appalachian region we have partnered with individuals and organizations that have name recognition over 40 years.
Substantially most of our competitors have more capital, longer operating histories and significantly greater financial and operating resources than we do. Given the relative size of our operations and our limited capital there is no assurance we will ever effectively compete in the area of obtaining the most leases in our target areas.
GOVERNMENT REGULATION
While the price of oil and natural gas are set by the market, other aspects of our business and the industry in general are heavily regulated. The availability of a ready market for oil production and natural gas depends on several factors beyond our control. These factors include regulation of production, federal and state regulations governing environmental quality and pollution control, the amount of oil and natural gas available for sale, the availability of adequate pipeline and other transportation and processing facilities and the marketing of competitive fuels. State and federal regulations generally are intended to protect consumers from unfair treatment and oppressive control, to reduce the risk to the public and workers from the drilling, completion, production and transportation of oil and natural gas, to prevent waste of oil and natural gas, to protect rights among owners in a common reservoir and to control contamination of the environment. Pipelines are subject to the jurisdiction of various federal, state and local agencies.
12
Our exploration and production business is subject to various federal, state and local laws and regulations on the taxation of natural gas and oil, the development, production and marketing of natural gas and oil and environmental and safety matters. Many laws and regulations require drilling permits and govern the spacing of wells, rates of production, water discharge, prevention of waste and other matters. Prior to commencing drilling activities for a well, we must procure permits and/or approvals for the various stages of the drilling process from the applicable state and local agencies in the state in which the area to be drilled is located. The permits and approvals include those for the drilling of wells. Additionally, other regulated matters include the following:
|
|
·
|
bond requirements in order to drill or operate wells;
|
|
|
·
|
the location of wells;
|
|
|
·
|
the method of drilling and casing wells;
|
|
|
·
|
the surface use and restoration of well properties;
|
|
|
·
|
the plugging and abandoning of wells; and
|
|
|
·
|
the disposal of fluids.
|
Sales of natural gas in Tennessee are affected by intrastate and interstate gas transportation regulation. Beginning in 1985, the Federal Energy Regulatory Commission ("FERC"), which sets the rates and charges for transportation and sale of natural gas, adopted regulatory changes that have significantly altered the transportation and marketing of natural gas. The stated purpose of FERC's changes is to promote competition among the various sectors of the natural gas industry. In 1995, FERC implemented regulations generally grandfathering all previously approved interstate transportation rates and establishing an indexing system for those rates by which adjustments are made annually based on the rate of inflation, subject to certain conditions and limitations. These regulations may tend to increase the cost of transporting oil and natural gas by pipeline. Every five years, FERC will examine the relationship between the change in the applicable index and the actual cost changes experienced by the industry. We are not able to predict with certainty what effect, if any, these regulations will have on us.
The state and regulatory burden on the oil and natural gas industry generally increases our cost of doing business and affects our profitability. While we believe we are presently in compliance with all applicable federal, state and local laws, rules and regulations, continued compliance (or failure to comply) and future legislation may have an adverse impact on our present and contemplated business operations. Because such federal and state regulation are amended or reinterpreted frequently, we are unable to predict with certainty the future cost or impact of complying with these laws.
We are subject to various federal, state and local laws and regulations governing the protection of the environment, such as the Comprehensive Environmental Response, Compensation, and Liability Act of 1980, as amended (“CERCLA”), the Resource Conservation and Recovery Act (“RCRA”), the Clean Air Act and the Federal Water Pollution Control Act of 1972 (the "Clean Water Act"), which affect our operations and costs. In particular, our exploration, development and production operations, our activities in connection with storage and transportation of oil and other hydrocarbons and our use of facilities for treating, processing or otherwise handling hydrocarbons and related wastes may be subject to regulation under these and similar state legislation. These laws and regulations:
|
|
·
|
restrict the types, quantities and concentration of various substances that can be released into the environment in connection with drilling and production activities;
|
|
|
·
|
limit or prohibit drilling activities on certain lands lying within wilderness, wetlands and other protected areas; and
|
|
|
·
|
impose substantial liabilities for pollution resulting from our operations.
|
13
CERCLA, also known as "Superfund," imposes liability for response costs and damages to natural resources, without regard to fault or the legality of the original act, on some classes of persons that contributed to the release of a "hazardous substance" into the environment. These persons include the "owner" or "operator" of a disposal site and entities that disposed or arranged for the disposal of the hazardous substances found at the site. CERCLA also authorizes the EPA and, in some instances, third parties to act in response to threats to the public health or the environment and to seek to recover from the responsible classes of persons the costs they incur. It is not uncommon for neighboring landowners and other third parties to file claims for personal injury and property damage allegedly caused by the hazardous substances released into the environment. In the course of our ordinary operations, we may generate waste that may fall within CERCLA's definition of a "hazardous substance." We may be jointly and severally liable under CERCLA or comparable state statutes for all or part of the costs required to clean up sites at which these wastes have been disposed.
We plan to lease properties that for many years have been used for the exploration and production of oil and natural gas. Although we and our predecessors have used operating and disposal practices that were standard in the industry at the time, hydrocarbons or other wastes may have been disposed or released on, under or from the properties owned or leased by us or on, under or from other locations where these wastes have been taken for disposal. In addition, many of these properties have been operated by third parties whose actions with respect to the
treatment and disposal or release of hydrocarbons or other wastes were not under our control. These properties and wastes disposed on these properties may be subject to CERCLA and analogous state laws. Under these laws, we could be required to do the following:
|
|
·
|
remove or remediate previously disposed wastes, including wastes disposed or released by prior owners or operators,
|
|
|
·
|
clean up contaminated property, including contaminated groundwater; or to perform remedial operations to prevent future contamination, and/or
|
|
|
·
|
clean up contaminated property, including contaminated groundwater; or to perform remedial operations to prevent future contamination.
|
At this time, we do not believe that we are associated with any Superfund site and we have not been notified of any claim, liability or damages under CERCLA.
The RCRA is the principal federal statute governing the treatment, storage and disposal of hazardous wastes. RCRA imposes stringent operating requirements and liability for failure to meet such requirements on a person who is either a "generator" or "transporter" of hazardous waste or an "owner" or "operator" of a hazardous waste treatment, storage or disposal facility. At present, RCRA includes a statutory exemption that allows most oil and natural gas exploration and production waste to be classified as nonhazardous waste. A similar exemption is contained in many of the state counterparts to RCRA. As a result, we are not required to comply with a substantial portion of RCRA's requirements because our operations generate minimal quantities of hazardous wastes. At various times in the past, proposals have been made to amend RCRA to rescind the exemption that excludes oil and natural gas exploration and production wastes from regulation as hazardous waste. Repeal or modification of the exemption by administrative, legislative or judicial process, or modification of similar exemptions in applicable state statutes, would increase the volume of hazardous waste we are required to manage and dispose of and would cause us to incur increased operating expenses.
The Clean Water Act imposes restrictions and controls on the discharge of produced waters and other wastes into navigable waters. Permits must be obtained to discharge pollutants into state and federal waters and to conduct construction activities in waters and wetlands. The Clean Water Act requires us to construct a fresh water containment barrier between the surface of each drilling site and the underlying water table. This involves the insertion of a seven-inch diameter steel casing into each well, with cement on the outside of the casing. The cost of compliance with this environmental regulation is approximately $10,000 per well. Certain state regulations and the general permits issued under the Federal National Pollutant Discharge Elimination System program prohibit the discharge of produced waters and sand, drilling fluids, drill cuttings and certain other substances related to the oil and natural gas industry into certain coastal and offshore waters. Further, the EPA has adopted regulations requiring certain oil and natural gas exploration and production facilities to obtain permits for storm water discharges. Costs may be associated with the treatment of wastewater or developing and implementing storm water pollution prevention plans.
14
The Clean Water Act and comparable state statutes provide for civil, criminal and administrative penalties for unauthorized discharges for oil and other pollutants and impose liability on parties responsible for those discharges for the costs of cleaning up any environmental damage caused by the release and for natural resource damages resulting from the release. We believe that our operations comply in all material respects with the requirements of the Clean Water Act and state statutes enacted to control water pollution.
Our operations will also be subject to laws and regulations requiring removal and cleanup of environmental damages under certain circumstances. Laws and regulations protecting the environment have generally become more stringent in recent years, and may in certain circumstances impose "strict liability," rendering a corporation liable for environmental damages without regard to negligence or fault on the part of such corporation. Such laws and regulations may expose us to liability for the conduct of operations or conditions caused by others, or for acts which may have been in compliance with all applicable laws at the time such acts were performed. The modification of existing laws or regulations or the adoption of new laws or regulations relating to environmental matters could have a material adverse effect on our operations.
In addition, our existing and proposed operations could result in liability for fires, blowouts, oil spills, discharge of hazardous materials into surface and subsurface aquifers and other environmental damage, any one of which could result in personal injury, loss of life, property damage or destruction or suspension of operations. We have an Emergency Action and Environmental Response Policy Program in place. This program details the appropriate response to any emergency that management believes to be possible in our area of operations. We believe we are presently in compliance with all applicable federal and state environmental laws, rules and regulations; however, continued compliance (or failure to comply) and future legislation may have an adverse impact on our present and contemplated business operations.
EMPLOYEES
At May 31, 2010 we had 3 full time and 3 part-time employees.
MINING INDUSTRY SEGMENT
Prior to May 2010, we were engaged in mining activities. In May 2010, we signed a Memorandum of Understanding (MOU) for the purchase of a 70% working interest in 92 oil & gas wells located in Scott & Morgan County Tennessee from Domestic Energy Corporation. Transfer of ownership in these wells from Domestic Energy to Westmont began in June 2010 and is ongoing. Domestic Energy Corporation is 87% controlled by The Avalon Group Ltd. who is also the largest beneficial owner of Westmont Resources Inc. through their control and ownership in F&M Inc. Part of the consideration in the transaction above was for Westmont to transfer its interest in all mining claims previously held to Domestic Energy Corporation.
As of May 31, 2010, we owned a 100% undivided interest in one mineral property, the “GB 1 (Tenure #601482), GB 2 (Tenure #601483) and GB 3 (Tenure #601484) Claims”, located in the Province of British Columbia, Canada, that we have previously called the “JB 1 Claim”. During the year ended May 31, 2009, the Company re-staked the JB 1 Claim into the GB 1, GB 2 and GB 3 mineral claims, (collectively the “GB Claims”). The GB Claims are located in northwestern British Columbia, in the Gold Bottom Creek area, approximately 31 miles south of the town of Atlin. Due to restrictions set by the Province of British Columbia on the ownership of mineral claims, title to the GB Claims is currently held for the benefit of our wholly owned subsidiary, Norstar Explorations Ltd., a British Columbia company. As noted above, these claims will be transferred to Domestic Energy Corporation.
15
ITEM 1B. UNRESOLVED STAFF COMMENTS
As of May 31, 2010, we did not have any unresolved comments from the SEC staff that were received 180 or more days prior to year-end.
ITEM 2. PROPERTIES.
We currently do not own any physical property or own any real property. As of May 31, 2010, we owned a 100% undivided interest in the GB Claims. As a result of the Memorandum of Understanding (MOU) with Domestic Energy Corporation, Westmont resources Inc will own an estimated 70% working interest in 92 oil and gas wells in Scott and Morgan Counties Tennessee and will no longer own the mining claims.
We rent office space located at 155 108th Avenue NE, Suite 150, Bellevue, WA, 98004. This office space consists of approximately 1385 square feet, which we rent at a cost of $19 per square foot for a period of three years with a cancelation clause at eighteen months with a termination penalty.
ITEM 3. LEGAL PROCEEDINGS.
We are not a party to any material legal proceedings and, to our knowledge, no such proceedings are threatened or contemplated.
ITEM 4. {REMOVED AND RESERVED}
PART II
ITEM 5. MARKET FOR COMMON EQUITY, RELATED STOCKHOLDER MATTERS AND ISSUER PURCHASES OF EQUITY SECURITIES.
GENERAL
On October 26, 2009, a super majority of issued and outstanding shares of Common Stock (72.75%) and Preferred Stock (66.67%) were voted to approve a 1 – for – 50 reverse split of the issued and outstanding shares of Common Stock such that each fifty (50) shares of Common Stock, $0.001 par value, issued and outstanding immediately prior to the effective date (the “Old Common Stock”) shall be recombined, reclassified and changed into one (1) share of the corporation's Common Stock, $0.001 par value (the “New Common Stock”), with any fractional interest rounded up to the nearest whole share;
On October 26, 2009, a super majority of issued and outstanding shares of Common Stock (72.75%) and Preferred Stock (66.67%) were voted to approve a 1 – for – 50 reverse split of the issued and outstanding shares of Class A Preferred Stock such that each fifty (50) shares of Class A Preferred Stock, $0.001 par value, issued and outstanding immediately prior to the effective date (the “Old Class A Preferred Stock”) shall be recombined, reclassified and changed into one (1) share of the corporation's Class A Preferred Stock, $0.001 par value (the “New Class A Preferred Stock”), with any fractional interest rounded up to the nearest whole share; and
Our authorized capital stock consists of 800,000,000 shares, of which 775,000,000 are shares of common stock, with a par value of $0.001 per share, and 25,000,000 are shares of preferred stock, with a par value of $0.001 per share. As of September 14, 2010, there were 53,499,660 post split shares of our common stock issued and outstanding that were held of record by sixty-three (63) stockholders.
There are 100,000 shares of Series A preferred stock outstanding held by five (5) stockholders.
16
MARKET INFORMATION
Our shares of common stock commenced trading on the OTC Bulletin Board under the symbol “WMNS” on June 24, 2010. Prior to this date, no public trading market existed for our common stock. Although our shares became eligible for quotation on the OTC Bulletin Board in May 2007, the high and low bid price information for our common stock for the quarter ended May 31, 2010 was not available from the OTC Bulletin Board. Quotations provided by the OTC Bulletin Board reflect inter-dealer prices, without retail mark-up, markdown or commission and may not represent actual transactions. As of Monday, 13 September 2010 our common stock is listed at $0.04 Bid and $0.05 Ask.
DIVIDENDS
We have not declared any dividends on our common stock since our inception. There are no dividend restrictions that limit our ability to pay dividends on our common stock in our Articles of Incorporation or Bylaws. Our governing statute, Chapter 78 of the Nevada Revised Statutes (the “NRS”), does provide limitations on our ability to declare dividends. Section 78.288 of the NRS prohibits us from declaring dividends where, after giving effect to the distribution of the dividend:
|
|
·
|
we would not be able to pay our debts as they become due in the usual course of business; or
|
|
|
·
|
our total assets would be less than the sum of our total liabilities plus the amount that would be needed, if we were to be dissolved at the time of distribution, to satisfy the preferential rights upon dissolution of stockholders who may have preferential rights and whose preferential rights are superior to those receiving the distribution (except as otherwise specifically allowed by our Articles of Incorporation).
|
RECENT SALES OF UNREGISTERED SECURITIES
On October 26, 2009, Westmont issued Thirty Thousand 30,000)split-adjusted shares of Series A Preferred Stock to F&M Inc for services provided to the Company. These shares of Preferred Stock have 160 votes per share, and each share of Preferred Stock converts into 160 shares of Common Stock. Westmont estimated the fair value to total $30.00 and charged this amount as compensation expense.
On May 11, 2010, Westmont issued Forty Thousand 40,000 shares of Series A Preferred Stock to F&M Inc. for services provided to the Company. These shares of Preferred Stock have 160 votes per share, and each share of Preferred Stock converts into 160 shares of Common Stock. Westmont estimated the fair value to total $40 and charged this amount as compensation expense.
On May 11, 2010, Westmont issued Thirty Million 30,000,000 shares of Common Stock to the below listed organizations for services provided to the Company. These shares of Common Stock have 1 vote per share. Westmont estimated the fair value to total $30,000 and charged this amount as compensation expense.
|
·
|
0692545 BC LTD
|
2,609,666 Common Shares
|
|
·
|
Bogat Family Trust
|
2,609,666 Common Shares
|
|
·
|
Harpreet Hayer
|
2,609,666 Common Shares
|
|
·
|
F&M Inc.
|
22,171,002 Common Shares
|
PURCHASES OF EQUITY SECURITIES
None.
ITEM 6. SELECTED FINANCIAL DATA
Not Applicable
17
ITEM 7. MANAGEMENT’S DISCUSSION AND ANALYSIS OF FINANCIAL CONDITION AND RESULTS OF OPERATIONS.
PLAN OF OPERATION
Our plan of operation is to conduct re-working and re-entry program on the 92 wells associated with the Scott-Morgan 1 project currently under contract for purchase from the Domestic Energy Corporation in order to place these wells back into production and establish a positive cashflow at the earliest time frame. Our future plan of operation for the twelve months following the date of this annual report is to complete the acquisition of the 92 wells and start the first phase of the exploration program on our project consisting of the repair of equipment and wells to place the wells back into a minimal production plan.
Total expenditures over the next 12 months are therefore expected to be approximately $525,000, which is approximately 10% of the amount to be raised by private placement and our cash on hand. If we experience a shortage of funds prior to funding we may utilize funds from our majority shareholder, who has formally agreed to advance funds to allow us to pay for offering costs, filing fees, professional fees, initial well and equipment repair. The Avalon Group Ltd has signed a formal commitment letter and arrangement to advance or loan funds to the company on a Libor +2% compounded interest rate to a maximum of $1,000,000. If we are successful in raising the funds from this offering, we plan to commence Phase I of the program on the project claim in the fall of 2010. We expect these phases to take 6 months to complete. Subject to financing, we anticipate commencing Phase II of our re-development program in spring of 2010.
RESULTS OF OPERATIONS
As of May 31, 2010, we had cash on hand of $1 and a working capital deficit of $768,097. Westmont Resources Inc, has a current rolling line of credit for $1.1M with The Avalon Group Ltd. of Netanya, Israel, of which approximately $357,216 has been draw down on the LOC. Utilizing the remaining balance of the LOC, Westmont has sufficient working capital to pay for the anticipated costs of $325,000 for Phase I of our exploration program and meet the anticipated costs of operating our business for the next twelve months. Financial projections are based on the financial commitment arrangement made with the Avalon Group Ltd our largest beneficial shareholder. We anticipate that we will incur the following expenses over the next twelve months:
PLANNED EXPENDITURES OVER NEXT 12 MONTHS
|
Category
|
Planned Expenditures Over
The Next 12 Months (US$)
|
|||
|
Legal and Accounting Fees
|
$ | 25,000. | ||
|
Office Expenses
|
$ | 3,500. | ||
|
Oil & Gas Property Exploration Expenses
|
$ | 325,000. | ||
|
Travel Expenses
|
$ | 55,000. | ||
|
TOTAL
|
$ | 408,500. | ||
SUMMARY OF YEAR END RESULTS
|
Percentage
|
||||||||||||
|
Year Ended May 31
|
Increase /
|
|||||||||||
|
2010
|
2009
|
(Decrease)
|
||||||||||
|
Expenses
|
||||||||||||
|
General and Administrative
|
367,718 | 122,435 | (199 | %) | ||||||||
|
Acquisition Costs
|
- | 410,396 | (100 | %) | ||||||||
|
Total Operating Expenses
|
367,718 | 532,831 | ||||||||||
|
Deconsolidation
|
33,192 | |||||||||||
|
Interest Expenses
|
46,203 | 14,094 | (228 | %) | ||||||||
|
Net Loss
|
(447,113 | ) | (546,925 | ) | 19 | % | ||||||
18
REVENUES
We have not earned any revenues to date. We anticipate earning revenues starting in the 2nd Quarter of the 2011 fiscal year upon enter into commercial production of our proposed oil and gas properties.
EXPENSES
The major components of our operating expenses are outlined in the table below:
|
Percentage
|
||||||||||||
|
Year Ended May 31
|
Increase /
|
|||||||||||
|
2010
|
2009
|
(Decrease)
|
||||||||||
|
Accounting and Audit Fees
|
51,156 | 17,028 | 200 | % | ||||||||
|
Acquisition cost
|
- | 410,396 | (100 | %) | ||||||||
|
Filing and Transfer agent
|
21,655 | 9,253 | 134 | % | ||||||||
|
Legal
|
54,187 | 19,290 | 181 | % | ||||||||
|
Licenses and Permits
|
129,289 | 0 | n/a | |||||||||
|
Management Services
|
45,825 | 17,000 | 170 | % | ||||||||
|
Mineral Property Exploration Costs
|
0 | 0 | n/a | |||||||||
|
Office and Sundry
|
30,364 | 7,077 | 329 | % | ||||||||
|
Software and Programming
|
0 | 39,128 | n/a | |||||||||
|
Rent
|
20,830 | 8,979 | 132 | % | ||||||||
|
Travel and Promotion
|
12,944 | 4,680 | 177 | % | ||||||||
|
Total Operating Expenses
|
367,718 | 532,831 | 25 | % | ||||||||
The increases in general expenses are primarily a result of the planned acquisition of the 70% working interest in the 92 oil and natural gas wells located in Tennessee from Domestic Energy Corporation.
We anticipate our operating expenses will increase significantly as we proceed with our exploration and operations program associated with this acquisition.
LIQUIDITY AND FINANCIAL CONDITION
Working Capital
|
Percentage
|
||||||||||||
|
At May 31, 2010
|
At May 31, 2009
|
Increase / (Decrease)
|
||||||||||
|
Current Assets
|
1 | 10,465 | 99.99 | % | ||||||||
|
Current Liabilities
|
(768,098 | ) | (654,781 | ) | (26.58 | %) | ||||||
| (768,097 | ) | (644,316 | ) | (28.64 | %) | |||||||
Cash Flow
|
Year Ended May 31
|
Percentage
|
|||||||||||
|
Increase /
|
||||||||||||
|
2010
|
2009
|
(Decrease)
|
||||||||||
|
Cash Flows Provided by (Used in) Operating Activities
|
(348,612 | ) | (41,523 | ) | (761 | %) | ||||||
|
Cash Flows From (Used in) Financing Activities
|
348,467 | 41,636 | (758 | %) | ||||||||
|
Net Increase (Decrease) in Cash During Period
|
145 | 113 | 228 | % | ||||||||
19
The decreases in our working capital deficit at May 31, 2010 from our year ended May 31, 2009, and the increase in our cash used during the year ended on May 31, 2010, from the preceding fiscal year are primarily a result of the increases in general expenses are primarily a result of the proposed acquisition of the 70% working interest in the 92 oil and natural gas wells located in Tennessee from Domestic Energy Corporation.
Since our inception, we have used our common stock and loan financing from our shareholders to raise money for our operations and for our property acquisitions. When necessary, we have also relied on advances from our largest beneficial shareholder the Avalon Group Ltd. We have not attained profitable operations and are dependent upon obtaining financing to pursue our plan of operation. For these reasons, our auditors stated in their report to our audited financial statements for the fiscal year ended May 31, 2010 that there is substantial doubt that we will be able to continue as a going concern.
We anticipate continuing to rely on equity sales of our common stock and loans from the Avalon Group Ltd in order to continue to fund our business operations. Issuances of additional shares will result in dilution to our existing stockholders. There is no assurance that we will achieve any of additional sales of our equity securities. However, there are no assurances that the Avalon Group Ltd will be willing to advance us additional funds in the future. There are no assurances that we will be able to arrange for other debt or other financing to fund our planned business activities.
OFF-BALANCE SHEET ARRANGEMENTS
We have no significant off-balance sheet arrangements that have or are reasonably likely to have a current or future effect on our financial condition, changes in financial condition, revenues or expenses, results of operations, liquidity, capital expenditures or capital resources that are material to our stockholders.
CRITICAL ACCOUNTING POLICIES
We have identified certain accounting policies, described below, that are most important to the portrayal of our current financial condition and results of operations. Our significant accounting policies are disclosed in the notes to the audited financial statements included in this Annual Report.
Exploration expenditures
We follow a policy of capitalizing mineral property acquisition costs and expensing mineral property exploration expenditures until a production decision in respect of the project and we are reasonably assured that it will receive regulatory approval to permit mining operations, which may include the receipt of a legally binding project approval certificate.
Management periodically reviews the carrying value of its investments in mineral leases and claims with internal and external mining related professionals. A decision to abandon, reduce or expand a specific project is based upon many factors including general and specific assessments of mineral deposits, anticipated future mineral prices, anticipated future costs of exploring, developing and operating a production mine, the expiration term and ongoing expenses of maintaining mineral properties and the general likelihood that we will continue exploration on such project. We do not set a pre-determined holding period for properties with unproven deposits, however, properties which have not demonstrated suitable metal concentrations at the conclusion of each phase of an exploration program are reevaluated to determine if future exploration is warranted, whether there has been any impairment in value and that their carrying values are appropriate.
If an area of interest is abandoned or it is determined that its carrying value cannot be supported by future production or sale, the related costs are charged against operations in the year of abandonment or determination of value. The amounts recorded as mineral leases and claims represent costs to date and do not necessarily reflect present or future values.
Our exploration activities and proposed mine development are subject to various laws and regulations governing the protection of the environment. These laws are continually changing, generally becoming more restrictive. We have made, and expect to make in the future, expenditures to comply with such laws and regulations.
20
The accumulated costs of properties that are developed on the stage of commercial production will be amortized to operations through unit-of-production depletion.
Impairment of Assets
Long-lived assets or assets with no amortization, including intangibles, are reviewed for impairment whenever events or changes in circumstance indicate that the carrying amount may not be recoverable. At a minimum, the assets are evaluated annually. The evaluation of recoverability is performed using undiscounted estimated net cash flows generated by the related asset. If an asset is deemed to be impaired, the amount of impairment is determined as the amount by which the net carrying value exceeds discounted estimated net cash flows. There was no impairment loss for the years ended May 31, 2010 or 2009.
ITEM 7A. QUANTITATIVE AND QUALITATIVE DISCLOSURES ABOUT MARKET RISK
Not applicable.
21
ITEM 8. FINANCIAL STATEMENTS AND SUPPLEMENTARY DATA.
Westmont Resources Inc.
(An Exploration Stage Company)
Index
|
·
|
Report of Independent Registered Public Accounting Firm;
|
F-1
|
|
·
|
Consolidated Balance Sheets as of May 31, 2010 and 2009;
|
F-2
|
|
·
|
Consolidated Statements of Expenses for the years ended May 31, 2010 and 2009 and for the period from inception on November 16, 2004 to May 31, 2010;
|
F-3
|
|
·
|
Consolidated Statements of Cash Flows for the years ended May 31, 2010 and 2009 and for the period from inception on November 16, 2004 to May 31, 2010;
|
F-4
|
|
·
|
Consolidated Statement of Stockholders’ Deficit for the period from inception on November 16, 2004 to May 31, 2010; and
|
F-5
|
|
·
|
Notes to the Consolidated Financial Statements
|
F-6
|
|
·
|
Security Ownership – Insiders and Affiliates
|
|
|
·
|
Security Ownership – Officers and Directors
|
|
|
·
|
Security Ownership – 5% Owners
|
22
REPORT OF INDEPENDENT REGISTERED PUBLIC ACCOUNTING FIRM
To The Board of Directors
Westmont Resources Inc
(An Exploration Stage Company)
We have audited the accompanying consolidated balance sheets of Westmont Resources Inc. (ÒWestmontÓ) as of May 31, 2010 and 2009 and the related consolidated statements of expenses, cash flows and changes in stockholders’ deficit for the two years then ended. These consolidated financial statements are the responsibility of Westmont’s management. Our responsibility is to express an opinion on these consolidated financial statements based on our audits. The consolidated financial statements for the period from November 16, 2004 (inception) through May 31, 2010, include a net loss Our opinion on the consolidated statements of expenses, stockholders’ deficit, and cash flows for the period November 16, 2004 (inception) through May 31, 2010, insofar as it relates to amounts for prior periods through May 31, 2008, is based solely on the report of other auditors.
We conducted our audits in accordance with standards of the Public Company Accounting Oversight Board (United States). Those standards require that we plan and perform the audits to obtain reasonable assurance about whether the financial statements are free of material misstatements. Westmont is not required to have, nor were we engaged to perform, an audit of its internal control over financial reporting. Our audit included consideration of internal control over financial reporting as a basis for designing audit procedures that are appropriate in the circumstances, but not for the purpose of expressing an opinion on the effectiveness of the Westmont’s internal control over financial reporting. Accordingly, we express no such opinion. An audit includes examining, on a test basis, evidence supporting the amounts and disclosures in the financial statements. An audit also includes assessing the accounting principles used and significant estimates made by management, as well as evaluating the overall financial statement presentation. We believe that our audits provide a reasonable basis for our opinion.
In our opinion, the consolidated financial statements referred to above present fairly, in all material respects, the financial position of Westmont as of May 31, 2010 and 2009 and the results of its operations and its cash flows for the two years then ended in conformity with accounting principles generally accepted in the United States of America.
The accompanying consolidated financial statements have been prepared assuming that Westmont will continue as a going concern. As discussed in Note 2 to the consolidated financial statements, Westmont has no revenues and has accumulated losses since inception, which raises substantial doubt about its ability to continue as a going concern. Management’s plans regarding those matters also are described in Note 2. The financial statements do not include any adjustments that might result from the outcome of this uncertainty.
MaloneBailey,,LLP
www.malonebailey.com
Houston, Texas
September 14, 2010
F-1
23
WESTMONT RESOURCES INC
CONSOLIDATED BALANCE SHEETS
(AN EXPLORATION STAGE COMPANY)
|
May 31, 2010
|
May 31, 2009
|
|||||||
|
ASSETS
|
||||||||
|
Current Assets
|
||||||||
|
Cash
|
$ | 1 | $ | 146 | ||||
|
Prepaid Expenses
|
- | 10,319 | ||||||
|
Total Current Assets
|
1 | 10,465 | ||||||
|
Software, not yet in service
|
- | 209,056 | ||||||
|
TOTAL ASSETS
|
$ | 1 | $ | 219,521 | ||||
|
LIABILITIES AND STOCKHOLDERS’ DEFICIT
|
||||||||
|
Current Liabilities
|
||||||||
|
Accounts payable and accrued liabilities
|
$ | 31,947 | $ | 40,920 | ||||
|
Convertible Notes Payable
|
328,956 | 389,256 | ||||||
|
Due To Related Party-Convertible Note
|
407,195 | 224,605 | ||||||
|
Total Current Liabilities
|
768,098 | 654,781 | ||||||
|
Long Term Debt
|
60,736 | - | ||||||
|
TOTAL LIABILITIES
|
828,834 | 654,781 | ||||||
|
Stockholders’ Deficit
|
||||||||
|
Common Stock, 775,000,000 shares authorized, $0.001 par value, 53,449,660 and 1,932,6660 at May 31, 2010 and 2009 shares issued and outstanding
|
53,500 | 1,933 | ||||||
|
Convertible preferred Stock, 25,000,000 shares authorized, $0.001 par value, 100,000 and 60,000 at May 31, 2010 and 2009 shares issued and outstanding
|
100 | 60 | ||||||
|
Additional Paid-In Capital
|
233,531 | 231,598 | ||||||
|
Deficit Accumulated During the Exploration Stage
|
(1,115,964 | ) | (668,851 | ) | ||||
|
Total Stockholders’ Deficit
|
(828,833 | ) | (435,260 | ) | ||||
|
TOTAL LIABILITIES AND STOCKHOLDERS’ DEFICIT
|
$ | 1 | $ | 219,521 | ||||
See the accompanying summary of accounting policies and notes to the consolidated financial statements.
F-2
24
WESTMONT RESOURCES INC
CONSOLIDATED STATEMENTS OF EXPENSES
(AN EXPLORATION STAGE COMPANY)
|
Period From
|
||||||||||||
|
November 16, 2004
|
||||||||||||
|
Year Ended
|
(Inception) Through
|
|||||||||||
|
May 31, 2010
|
May 31, 2009
|
May 31, 2010
|
||||||||||
|
Expenses
|
||||||||||||
|
General and Administrative
|
$ | 367,718 | $ | 122,435 | $ | 611,118 | ||||||
|
Loss on Acquisition
|
- | 410,396 | 410,396 | |||||||||
|
Donated Management Services
|
- | - | (14,500 | ) | ||||||||
|
Mining Expenses
|
- | - | 15,460 | |||||||||
|
Total Expenses
|
367,718 | 532,831 | 1,022,474 | |||||||||
|
Other (Income) / Expense
|
||||||||||||
|
Loss on Deconsolidation
|
33,192 | - | 33,192 | |||||||||
|
Interest Expense
|
46,203 | 14,094 | 60,298 | |||||||||
|
Net Loss
|
(447,113 | ) | (546,925 | ) | (1,115,964 | ) | ||||||
|
Deemed Dividend to Preferred Shareholders
|
(70 | ) | (3,000 | ) | (3,070 | ) | ||||||
|
Net Loss Available to Common Shareholders
|
$ | (447,183 | ) | $ | (549,925 | ) | $ | (1,115,894 | ) | |||
|
Net Loss Per Common Share - Basic and Diluted
|
$ | (0.13 | ) | $ | (0.01 | ) | N/A | |||||
|
Weighted Average Shares Outstanding
|
3,576,496 | 830,320 | N/A | |||||||||
See the accompanying summary of accounting policies and notes to the consolidated financial statements.
F-3
25
WESTMONT RESOURCES INC
CONSOLIDATED STATEMENTS OF CASH FLOWS
(AN EXPLORATION STAGE COMPANY)
|
Period From
|
||||||||||||
|
November 16, 2004
|
||||||||||||
|
(Inception) Through
|
||||||||||||
|
May 31, 2010
|
May 31, 2009
|
May 31, 2010
|
||||||||||
|
OPERATING ACTIVITIES
|
||||||||||||
|
Net loss
|
$ | (447,113 | ) | $ | (546,925 | ) | $ | (1,115,964 | ) | |||
|
Adjustments to reconcile Net loss to net cash used in
operating activities:
|
||||||||||||
|
Loss on deconsolidation of subsidiary
|
33,192 | - | 33,192 | |||||||||
|
Common Shares issued for services
|
30,000 | 39,500 | 69,500 | |||||||||
|
Preferred Shares issued for services
|
1,540 | 3,000 | 4,540 | |||||||||
|
Notes Payable assumed for services
|
- | 387,896 | 387,896 | |||||||||
|
Changes in operating assets and liabilities
|
||||||||||||
|
Prepaid expenses and other assets
|
- | 57,328 | 57,148 | |||||||||
|
Accounts payable and accrued liabilities
|
35,309 | 17,678 | 80,380 | |||||||||
|
Net Cash Used in Operating Activities
|
(348,612 | ) | (41,523 | ) | (483,308 | ) | ||||||
|
FINANCING ACTIVITIES
|
||||||||||||
|
Proceeds from issuance of common stock
|
- | - | 82,160 | |||||||||
|
Advances from related party
|
348,467 | 41,636 | 401,149 | |||||||||
|
Net Cash provided by Operating Activities
|
348,467 | 41,636 | 483,309 | |||||||||
|
Increase / (Decrease) In Cash
|
(145 | ) | 113 | 1 | ||||||||
|
Cash - Beginning of Period
|
146 | 33 | - | |||||||||
|
Cash - End of Period
|
$ | 1 | $ | 146 | $ | 1 | ||||||
|
Supplemental Disclosures
|
||||||||||||
|
Interest Paid
|
$ | - | $ | - | $ | - | ||||||
|
Income Taxes Paid
|
$ | - | $ | - | $ | - | ||||||
| $ | - | $ | - | $ | - | |||||||
|
Non-cash investing and financing activities
|
||||||||||||
|
Common stock for partial settlement of convertible note
|
$ | 22,000 | $ | 65,631 | $ | 53,313 | ||||||
|
Net assets acquired from Get2Networks
|
- | $ | 43,300 | $ | 43,300 | |||||||
See the accompanying summary of accounting policies and notes to the consolidated financial statements.
F-4
26
WESTMONT RESOURCES INC
CONSOLIDATED STATEMENT OF STOCKHOLDERS’ DEFICIT
FOR THE PERIOD FROM INCEPTION ON NOVEMBER 16, 2004 TO MAY 31, 2010
(AN EXPLORATION STAGE COMPANY)
|
Preferred Stock Common Stock
|
Additional
|
Share Subscriptions
|
Deficit Accumulated During the Exploration
|
Total Stockholders’
Equity /
|
||||||||||||||||||||||||||||
|
Shares
|
Amount
|
Shares
|
Amount
|
Paid- in Capital
|
Receivable
|
Stage
|
(Deficit)
|
|||||||||||||||||||||||||
|
Balance – November 16, 2004 (Date of Inception)
|
- | - | - | - | - | - | - | - | ||||||||||||||||||||||||
|
Common stock issued for cash at $0.001 per share
|
- | - | 110,000 | $ | 110 | $ | 5,390 | $ | - | $ | - | $ | 5,500 | |||||||||||||||||||
|
Share subscriptions received
|
- | - | - | - | - | $ | 10,700 | - | $ | 10,700 | ||||||||||||||||||||||
|
Net loss for the period
|
- | - | - | - | - | - | $ | (4,515 | ) | $ | (4,515 | ) | ||||||||||||||||||||
|
Balance – May 31, 2005
|
- | - | 110,000 | $ | 110 | $ | 5,390 - | $ | 10,700 | $ | (4,515 | ) | $ | 11,685 | ||||||||||||||||||
|
Common stock issued for cash at $0.02 per share
|
- | - | 76,660 | $ | 77 | $ | 76,583 | - | - | $ | 76,660 | |||||||||||||||||||||
|
Subscriptions receivable
|
- | - | - | - | - | $ | (10,700 | ) | - | $ | (10,700 | ) | ||||||||||||||||||||
|
Net loss for the year
|
- | - | - | - | - | - | $ | (16,226 | ) | $ | (16,226 | ) | ||||||||||||||||||||
|
Balance – May 31, 2006
|
- | - | 186,660 | $ | 187 | 81,973 | - | $ | (20,741 | ) | $ | 61,419 | ||||||||||||||||||||
|
Net loss for the year
|
- | - | - | - | - | - | $ | (40,353 | ) | $ | (40,353 | ) | ||||||||||||||||||||
|
Balance – May 31, 2007
|
- | - | 186,660 | $ | 187 | 81,973 | - | $ | (61,094 | ) | $ | 21,066 | ||||||||||||||||||||
|
Net loss for the year
|
- | - | - | - | - | - | $ | (60,832 | ) | $ | (60,832 | ) | ||||||||||||||||||||
|
Balance – May 31, 2008
|
- | - | 186,660 | $ | 187 | 81,973 | - | $ | (121,926 | ) | $ | (39,766 | ) | |||||||||||||||||||
|
Common stock issued for services at $0.001 per share
|
- | - | 340,000 | $ | 340 | $ | 16,660 | - | - | $ | 17,000 | |||||||||||||||||||||
|
Common stock issued for Avalon International services at $0.001 per share
|
- | - | 450,000 | $ | 450 | $ | 22,050 | - | - | $ | 22,500 | |||||||||||||||||||||
|
Common stock issued for partial conversion of debt
|
- | - | 40,000 | $ | 40 | $ | 30,041 | - | - | $ | 30,081 | |||||||||||||||||||||
|
Convertible preferred stock issued for services at $0.001 per share
|
60,000 | $ | 60 | - | - | $ | 2,940 | - | - | $ | 3,000 | |||||||||||||||||||||
|
Beneficial conversion feature for convertible preferred stock
|
- | - | - | - | $ | 3,000 | - | - | $ | 3,000 | ||||||||||||||||||||||
|
Deemed dividend for preferred shares
|
- | - | - | - | $ | (3,000 | ) | - | - | $ | (3,000 | ) | ||||||||||||||||||||
|
Common stock issued for acquisition of Get2Networks, Inc. at $0.001 per share
|
- | - | 866,000 | $ | 866 | $ | 42,434 | - | - | $ | 43,300 | |||||||||||||||||||||
|
Common stock issued for partial conversion of debt
|
- | - | 50,000 | $ | 50 | $ | 35,500 | - | - | $ | 35,550 | |||||||||||||||||||||
|
Common stock issued for cash at $0.001 per share
|
- | - | 110,000 | $ | 110 | $ | 5,390 | $ | - | $ | - | $ | 5,500 | |||||||||||||||||||
|
Net Loss for the year
|
(546,925 | ) | ||||||||||||||||||||||||||||||
|
Balance- May 31,2009
|
60,000 | 60 | 1,932,660 | 1,933 | 231,598 | - | (668,851 | ) | (435,260 | ) | ||||||||||||||||||||||
|
Convertible preferred stock issued for services at $0.001 per share
|
30,000 | $ | 30 | - | $ | 1,470- | - | - | $ | 1,500 | ||||||||||||||||||||||
|
Common stock issued for service at $0.001 per share
|
2,000,000 | $ | 2,000 | - | - | - | $ | 2,000 | ||||||||||||||||||||||||
|
preferred stock issued for services at $0.001 per share
|
40,000 | $ | 40 | - | - | - | $ | 40 | ||||||||||||||||||||||||
|
Common stock issued for service at $0.001 per share
|
30,000,000 | $ | 30,000 | - | - | - | $ | 30,000 | ||||||||||||||||||||||||
|
Shares issued for conversion of debt
|
20,000,000 | $ | 20,000 | - | - | - | $ | 20,000 | ||||||||||||||||||||||||
|
Shares cancelled for the sale of Get2Networks Inc
|
(30,000 | ) | $ | (30 | ) | (433,000 | ) | $ | (433 | ) | $ | 463 | $ | (0 | ) | |||||||||||||||||
|
Beneficial conversion feature for convertible preferred stock
|
- | - | - | - | $ | 70 | - | - | $ | 70 | ||||||||||||||||||||||
|
Deemed dividend for preferred shares
|
- | - | - | - | $ | (3,000 | ) | - | - | $ | (70 | ) | ||||||||||||||||||||
|
Net loss for the year
|
- | - | - | - | - | - | $ | (447,113 | ) | $ | (447,113 | ) | ||||||||||||||||||||
|
Balance – May 31, 2010
|
100,000 | $ | 100 | 53,499,660 | $ | 53,500 | $ | 233,531 | - | $ | (1,115,964 | ) | $ | (828,833 | ) | |||||||||||||||||
See the accompanying summary of accounting policies and notes to the consolidated financial statements.
F-5
27
WESTMONT RESOURCES INC
(AN EXPLORATION STAGE COMPANY)
NOTES TO THE CONSOLIDATED FINANCIAL STATEMENTS
Note 1 - Nature of Operations and Summary of Significant Accounting Policies
Summary of Current Events
Westmont Resources Inc. (“the Company”) was incorporated in Nevada, U.S.A., on November 16, 2004. The Company’s principal executive offices are in Bellevue, Washington.
On March 9, 2005, the Company formed a wholly-owned subsidiary, known as Norstar Explorations Ltd. (“Norstar”), a company incorporated in British Columbia, Canada.
On November 21, 2008, the Company purchased all the issued and outstanding shares of Avalon International Inc. (“Avalon”), a Washington corporation, in exchange for 450,000 common shares.
On March 1, 2009, the Company purchased all the issued and outstanding shares of Get2Networks, Inc. (“Get2Networks”), a Nevada corporation, in exchange for 866,000 shares . These fiscal year ended May 31, 2010 consolidated financial statements do not include the accounts of the Get2Networks Inc and only include Westmont Resources Inc’s wholly-owned subsidiaries from the date of inception (Norstar).
On April 11, 2010, The wholly owned subsidiary Get2Networks, Inc was sold to Alpha-Omega Inc. for the return of approximately 433,000 restricted common shares and 30,000restricted Class A preferred shares in Westmont Resources Inc and the removal of 2 related party loans valued at approximately $153,893 and $36,340.
All significant inter-company balances and transactions have been eliminated on consolidation.
Exploration Stage Activities
The Company has been in the exploration stage, as defined in the Accounting Standards Codification (ASC) 915-15,, since its formation for the purpose of acquiring exploration and development stage natural resource properties. It has not yet realized any revenues from its planned operations.
Use of Estimates
The preparation of consolidated financial statements, in conformity with generally accepted accounting principles, requires management to make estimates and assumptions that affect the amounts reported in the consolidated financial statements and accompanying disclosures. Actual results may differ from the estimates.
Acquisition, Exploration and Development Costs
The Company follows a policy of capitalizing mineral and natural gas property acquisition costs and expensing mineral property exploration expenditures until a production decision in respect of the project and the Company is reasonably assured that it will receive regulatory approval to permit mining operations, which may include the receipt of a legally binding project approval certificate. Management periodically reviews the carrying value of its investments in mineral leases and claims with internal and external mining related professionals. A decision to abandon, reduce or expand a specific project is based upon many factors including general and specific assessments of mineral deposits, anticipated future mineral prices, anticipated future costs of exploring, developing and operating a production mine, the expiration term and ongoing expenses of maintaining mineral properties and the general likelihood that the Company will continue exploration on such project. The Company does not set a pre-determined holding period for properties with unproven deposits, however, properties which have not demonstrated suitable metal concentrations at the conclusion of each phase of an exploration program are re-evaluated to determine if future exploration is warranted, whether there has been any impairment in value and that their carrying values are appropriate. If an area of interest is abandoned or it is determined that its carrying value cannot be supported by future production or sale, the related costs are charged against operations in the year of abandonment or determination of value. The amounts recorded as mineral leases and claims represent costs to date and do not necessarily reflect present or future values.
F-6
28
The Company’s exploration activities and proposed mineral, oil and natural gas development are subject to various laws and regulations governing the protection of the environment. These laws are continually changing, generally becoming more restrictive. The Company has made, and expects to make in the future, expenditures to comply with such laws and regulations. The accumulated costs of properties that are developed on the stage of commercial production will be amortized to operations through unit-of-production depletion. In accordance with ASC 360-10 “Accounting for the Impairment or Disposal of Long-Lived Assets”, the Company records impairment losses on long-lived assets used in operations when indicators of impairment are present and the undiscounted cash flows estimated to be generated by those assets are less than the assets’ carrying amount. In such cases, the amount of the impairment is determined based on the relative fair values of the impaired assets. The Company currently does not have any long-lived assets.
Cash and Cash Equivalents
Cash consists of cash on deposit with high quality major financial institutions, and to date has not experienced losses on any of its balances. The carrying amounts approximated fair market value due to the liquidity of these deposits. For purposes of the consolidated balance sheets and consolidated statements of cash flows, the Company considers all highly liquid debt instruments purchased with a maturity of three months or less to be cash equivalents.
Impairment of Assets
Long-lived assets or assets with no amortization, including intangibles, are reviewed for impairment whenever events or changes in circumstances indicate that the carrying amount may not be recoverable. At a minimum, the assets are evaluated annually. The evaluation of recoverability is performed using undiscounted estimated net cash flows generated by the related asset. If an asset is deemed to be impaired, the amount of impairment is determined as the amount by which the net carrying value exceeds discounted estimated net cash flows. There was no impairment loss for the years ended May 31, 2010 or 2009.
Basic and Diluted Net Income (Loss) Per Share
The Company computes net income (loss) per share in accordance with ASC 260 “Earnings Per Share”. ASC 260 requires presentation of both basic and diluted earnings per share (EPS) on the face of the income statement. Basic loss EPS is computed by dividing net income (loss) available to common shareholders (numerator) by the weighted average number of shares outstanding (denominator) during the period. Diluted EPS gives effect to all dilutive potential common shares outstanding during the period using the treasury stock method and convertible preferred stock using the if-converted method. In computing Diluted EPS, the average stock price for the period is used in determining the number of shares assumed to be purchased from the exercise of stock options or warrants. Basic and diluted EPS are the same in fiscal 2010 and 2009 due to common stock equivalents being anti-dilutive.
Income Taxes
The Company accounts for its income taxes are recognized in accordance with ASC 740, “Accounting for Income Taxes”, which requires recognition of deferred tax liabilities or assets for future tax consequences attributable to differences between the financial statement carrying amounts of existing assets and liabilities and their respective tax basis and tax credit carry forwards. Deferred tax assets and liabilities are measured using enacted tax rates expected to apply to taxable income in the years in which those temporary differences are expected to be recovered or settled. The effect on deferred tax assets and liabilities of a change in tax rates is recognized in operations in the period that includes the enactment date. Potential benefits of income tax losses are not recognized in the accounts until realization is more likely than not.
Financial Instruments
ASC 820 “Fair Value Measurements” requires an entity to maximize the use of observable inputs and minimize the use of unobservable inputs when measuring fair value. ASC 820 establishes a fair value hierarchy based on the level of independent, objective evidence surrounding the inputs used to measure fair value. A financial instrument’s categorization within the fair value hierarchy is based upon the lowest level of input that is significant to the fair value measurement. SFAS 157 prioritizes the inputs into three levels that may be used to measure fair value:
Level 1
Level 1 applies to assets or liabilities for which there are quoted prices in active markets for identical assets or liabilities.
F-7
29
Level 2
Level 2 applies to assets or liabilities for which there are inputs other than quoted prices that are observable for the asset or liability such as quoted prices for similar assets or liabilities in active markets; quoted prices for identical assets or liabilities in markets with insufficient volume or infrequent transactions (less active markets); or model-derived valuations in which significant inputs are observable or can be derived principally from, or corroborated by, observable market data.
Level 3
Level 3 applies to assets or liabilities for which there are unobservable inputs to the valuation methodology that are significant to the measurement of the fair value of the assets or liabilities.
The Company’s financial instruments consist principally of cash, accounts payable, convertible notes payable, and amounts due to related parties. The Company believes that the recorded values of all of the other financial instruments approximate their current fair values because of their nature and respective maturity dates or durations.
Foreign Currency Transactions/Balances
The Company’s functional currency is the United States dollar. Monetary assets and liabilities denominated in foreign currencies are translated using the exchange rate prevailing at the balance sheet date. Gains and losses arising on translation or settlement of foreign currency denominated transactions or balances are included in the determination of income. Foreign currency transactions are primarily undertaken in Canadian dollars and have been nominal from inception through May 31, 2010. The Company has not, to the date of these financial statements, entered into derivative instruments to offset the impact of foreign currency fluctuations.
Stock Based Compensation
The Company records employee stock-based compensation in accordance with ASC 718 “Share Based Payments”, using the fair value method. The Company has not issued any stock options since its inception.
Recent Accounting Pronouncements
Westmont Resources Inc. does not expect the adoption of any other recently issued accounting pronouncements to have a significant impact on their results of operations, financial position or cash flows.
Note 2 - Going Concern
These financial statements have been prepared on a going concern basis, which implies Westmont will continue to realize its assets and discharge its liabilities in the normal course of business. Westmont has never generated revenue since inception and is unlikely to generate earnings in the immediate or foreseeable future. The continuation of Westmont as a going concern is dependent upon the continued financial support from its shareholders, the ability of Westmont to obtain necessary equity financing to continue operations, and the attainment of profitable operations. As of May 31, 2010, Westmont has accumulated losses since inception. These factors raise substantial doubt regarding Westmont’s ability to continue as a going concern. These financial statements do not include any adjustments to the recoverability and classification of recorded asset amounts and classification of liabilities that might be necessary should Westmont be unable to continue as a going concern.
Note 3 - Common Stock
|
|
·
|
During the period ended May 31, 2005, the Company issued 110,000 shares of common stock for total cash proceeds of $5,500. During the year ended May 31, 2006, the Company issued 76,660 shares of common stock for total cash proceeds of $76,660.
|
|
|
·
|
On November 21, 2008, the Company issued 340,000 shares of common stock to its officers as compensation for services rendered.
|
|
|
·
|
On November 21, 2008, the Company issued 450,000 shares of common stock for the acquisition of Avalon International Inc. (See Note 5).
|
|
|
·
|
On February 6, 2009, the Company issued 40,000 shares of common stock valued at $30,081 for partial conversion of principal on a convertible note. (See Note 5).
|
F-8
30
|
|
·
|
On March 1, 2009, the Company issued 866,000 shares of common stock valued at $43,300 for the acquisition of Get2Networks, Inc. (See Note 5).
|
|
|
·
|
On May 19, 2009, the Company issued 50,000 shares of common stock valued at $35,550 for partial conversion of principal on a convertible note. (See Note 5).
|
|
|
·
|
On December 1, 2009, the Company issued 2,000,000 shares of common stock valued at $2,000 for partial settlement of principal on a convertible note. (See Note 5).
|
|
|
·
|
On May 11, 2010, the Company issued 30,000,000 shares of common stock valued at $30,000 to its officers as compensation for services rendered.
|
|
|
·
|
On May 15, 2010, the Company issued 20,000,000 shares of common stock valued at $20,000 for partial settlement of principal on a convertible note. (See Note 5).
|
Note 4 - Convertible Notes Payable; Acquisitions & Sales
Avalon International Inc.
On November 21, 2008, Westmont acquired 100% of Avalon International Inc. (“Avalon”) by issuing 450,000 shares, which had a fair value of $22,500. Avalon had no assets or operations and therefore was not considered a business under ASC 805-10 “Determining Whether a Non-monetary Transaction Involves Receipt of Productive Assets or of a Business”.
In connection with the acquisition of Avalon International, Westmont assumed a convertible note payable previously issued by Avalon (the “Note”) totaling $387,896, bearing interest based on Libor plus 2% per annum. The Note holder has the option to convert the entire outstanding balance at any time to the equivalent of Twenty-Five Percent of the total authorized shares of Westmont provided the conversion would not cause Westmont to issue more shares than Westmont has authorized less the actual shares issued and obligations to issue shares under any outstanding agreement. Westmont evaluated the embedded conversion option to determine if it was within the scope of ASC 815-15 “Accounting for Derivative Instruments and Hedging Activities”. Westmont concluded that the conversion option should be classified as equity under ASC 815-15. Westmont also evaluated the convertible note to determine if it was within the scope of ASC 470-20 “Accounting for Convertible Securities with Beneficial Conversion Features or Contingently Adjustable Conversion Ratios” and determined there was no intrinsic value associated with the conversion option.
Westmont accounted for the shares issued and note payable assumed as compensation expense to the Avalon shareholders and has expensed the fair value of both as acquisition cost in the consolidated statement of expenses for the year ended May 31, 2010. On December 1, 2009 and May 15, 2010, the Company issued 2,000,000 and 20,000,000 shares of common stock, respectively to convert $2,000 and $20,000 of principal on the convertible note.
Get2Networks, Inc.
On March 1, 2009, Westmont acquired all of the outstanding common shares of Get2Networks, Inc. (“Get2Networks”), in exchange for 866,000 shares of Westmont’s common stock, which had a fair value of $43,300. The acquisition has been accounted for using the purchase method with Westmont identified as the acquirer and the business acquired recorded at estimated fair value.
F-9
31
The allocation of the purchase price is summarized below:
|
Fair value of Get2Networks, Inc. net assets acquired
|
||||
|
Prepaid expenses
|
$
|
67,467
|
||
|
Intangible assets - software
|
209,056
|
|||
|
Accounts payable and accrued liabilities
|
(690
|
)
|
||
|
Due to related parties
|
(171,923
|
)
|
||
|
Convertible note payable
|
(56,358
|
)
|
||
|
Paid by issue of 866,000 Westmont common shares
|
$
|
43,300
|
||
As result of the acquisition the Company acquired $67,467 of prepaid expenses which represents a retainer paid to a consulting firm for future services. The Company also assumed liabilities of $171,923 which represent outstanding balances due to company officers and a convertible note payable with a fair value of $56,358 at the date of acquisition. After reflecting the purchase adjustments, the excess of the purchase consideration over the fair value of Get2Networks’ assets and liabilities at March 1, 2009, has been allocated in full to the intangible assets - software. The software acquired is a provider of automated communications which enables businesses to engage in dynamic conversations to acquire, care for, grow and retain customers.
The following table reflects selected unaudited Proforma financial information as if the acquisition of Get2Networks had occurred June 1, 2007.
|
For the Fiscal Year Ended
|
||||
|
5/31/2009
|
||||
|
Revenue
|
$
|
36,197
|
||
|
Net Loss
|
$
|
(553,577
|
)
|
|
|
Net loss per share
|
$
|
(0.01
|
)
|
|
On April 11, 2010, pursuant to the MOU and Share Purchase Agreement between Westmont and Alpha Omega Inc, that provided, in the case of an unsuccessful fund raising effort on behalf of G2N to be determined by the Board of Directors of Westmont, Westmont and Alpha Omega Inc would agree to separate interests from each other and ownership in the two entities would revert back to their condition prior to the original MOU and SPA. On April 15, 2010, the Board of Directors of Westmont determined that the fund raising effort on behalf of G2N was unsuccessful. As such the parties entered into the Severance Agreement dated the same.
F-10
32
On April 11, 2010, The wholly owned subsidiary Get2Networks, Inc was sold to Alpha-Omega Inc. for the return of approximately 433,000 restricted common shares and 30,000 restricted Class A preferred shares in Westmont Resources Inc and the removal of two related party loans valued at approximately $153,893 and $36,340.
The loss on the deconsolidation is summarized below:
|
Deconsolidation of Get2Networks, Inc.:
|
||||
|
Assets
|
||||
|
Other Asset
|
$ | (4,230 | ) | |
|
Timber Crest Loan
|
(10,139 | ) | ||
|
Software
|
(209,056 | ) | ||
|
Total Assets
|
(223,425 | ) | ||
|
Liabilities
|
||||
|
Glenn McQuiston Loan
|
153,893 | |||
|
Sally Vilardi Loan
|
36,340 | |||
|
Total Liabilities
|
190,233 | |||
|
Net Loss on Deconsolidation of Get2Networks Inc
|
$ | (33,193 | ) | |
In connection with the acquisition of Get2Networks Inc, Westmont assumed a convertible note payable previously issued by Get2Networks (the “Note”) totaling $57,208 (March 1, 2009 (date of acquisition) - $56,358, bearing interest of 6% per annum. Pursuant to the reversal of the Get2Networks Inc purchase, The Note holder was given a choice to have his debt remain with Westmont Resources Inc. or have it spun off to Get2Networks Inc. The Note holder chose to remain with Westmont Resources Inc, and as such the note was amended to reflect a change in the conversion rights of the note.
The amended and revised note retains the original maturity date of February 1, 2014 and the interest rate of 6% per annum. Revised was the conversion option on the outstanding balance at any time after the maturity date of February 1, 2014 if the Company is in default, into shares of common stock of Westmont Resources Inc on a 20% discount to market price on the day of conversion.
Note 5 - Intangible Assets
On March 1, 2009 when Westmont acquired Get2Networks, Westmont accounted for the acquisition using the purchase method accounting for business combination. The purchase price associated with the acquisition exceeded the fair value of net assets by $209,056, of which all was assigned to software.
Pursuant to the sale of Get2Networks, Inc. to Alpha Omega Inc on April 15, 2010, The Intangible Assets associated with the software were transferred to Alpha Omega Inc as part of the reversal of the acquisition.
Note 6 - Convertible Preferred Stock
Westmont estimated the fair value of the preferred shares at the date of issuance to be $3,000 and charged this amount as compensation expense in the consolidated statement of expenses. Westmont evaluated the embedded conversion option to determine if it was within the scope of ASC 815-15 “Accounting for Derivative Instruments and Hedging Activities” . Westmont concluded that the conversion option should be classified as equity under ASC 815-15. Westmont also evaluated the convertible preferred shares to determine if it was within the scope of ASC 470-20 and determined there was intrinsic value of $3,000 associated with the conversion option. The $3,000 was fully amortized and has been reflected in the consolidated statement of expenses as a deemed dividend for the year ending May 31, 2009 as there was no redemption period for the preferred stock.
F-11
33
On October 26, 2009 and May 11, 2010, Westmont issued 30,000 and 40,000 preferred shares to its board of directors for services provided to the Company. These preferred shares have 160 votes per share, and convert into 160 shares of Common stock each. Westmont estimated the fair value of the preferred shares at the date of issuance to be $70 and charged this amount as compensation expense in the consolidated statement of expenses. Westmont evaluated the embedded conversion option to determine if it was within the scope of ASC 815-15 “Accounting for Derivative Instruments and Hedging Activities. Westmont concluded that the conversion option should be classified as equity under ASC 815-15. Westmont also evaluated the convertible preferred shares to determine if it was within the scope of ASC 470-20 and determined there was intrinsic value of $70 associated with the conversion option. The $70 was fully amortized and has been reflected in the consolidated statement of expenses as a deemed dividend for the year ending May 31, 2010 as there was no redemption period for the preferred stock.
Note 7 - Related Party Balances and Transactions
As of May 31, 2010 and 2009, Related Parties of the Company are owed for expenses they paid on behalf of the Company in the amount of $407,195 and $224,605 respectively.
The advances made by the Avalon Group Ltd as of May 31, 2010 are $357,216, and are associated with a $1,000,000 Line of Credit with an interest rate of Libor +2.5% and a maturity date of May 31, 2011. The Note holder has the option to convert the outstanding balance at any time after June 1, 2010, into shares of common stock of the Company on a 75% discount to market price on the day of conversion. As of the date the financials were issued no conversion has been done on this debt.
The advances made by the Andrew Jarvis, a former company Director as of May 31, 2010 are $49,979, this debt is unsecured, with an interest rate of 5%. The Note holder has the option to convert the outstanding balance at any time after June 1, 2010, into shares of common stock of the Company on a 50% discount to market price on the day of conversion. As of the date the financials were issued no conversion has been done on this debt.
Note 8 - Income Taxes
The Company uses the asset and liability method, where deferred tax assets and liabilities are determined based on the expected future tax consequences of temporary differences between the carrying amounts of assets and liabilities for financial and income tax reporting purposes. The provision for income taxes differs from the result, which would be obtained by applying the statutory income tax rate of 35% to income before income taxes. The difference results from the following items:
|
2010
|
2009
|
|||||||
|
Deferred income tax asset due to net operating losses
|
(218,342 | ) | (60,364 | ) | ||||
|
Valuation allowance
|
218,342 | 60,364 | ||||||
|
Income Tax Provision
|
- | - | ||||||
As of May 31, 2010, the Company had net operating loss carry-forwards of approximately $623,835, which expires twenty years after incurred. The potential benefit of Company's net operating losses have not been recognized in these financial statements because the Company cannot be assured it is more likely-than-not it will utilize the net operating losses carried forward in future years. Some portion of the Company’s net operating loss may be limited under IRS SEC 382 due to the change of control transactions in fiscal 2009.
Note 9 – Subsequent Events
In May 2010, we signed a Memorandum of Understanding (MOU) for the Purchase of a 70% working interest in 92 oil & gas wells located in Scott & Morgan County Tennessee from Domestic Energy Corporation. Transfer of ownership in these wells from Domestic Energy to Westmont began in June 2010 and is ongoing. Domestic Energy Corporation is 87% controlled by The Avalon Group Ltd. who is also the largest beneficial owner of Westmont Resources Inc. through their control and ownership in F&M Inc.
Subsequent to May 31, 2010, Westmont has acquired exclusive distribution rights to “FracSolv” manufactured and produced by NuEarth Corporation. NuEarth Corporation is 95% controlled by The Avalon Group Ltd. who is also the largest beneficial owner of Westmont Resources Inc. through their control and ownership in F&M Inc.
F-12
34
ITEM 9. CHANGES IN AND DISAGREEMENTS WITH ACCOUNTANTS ON ACCOUNTING AND FINANCIAL DISCLOSURE.
The financial statements for the fiscal years ended May 31, 2010, and 2009, included in this report, have been audited by MaloneBailey, LLP, registered public accounting firm, as stated in their audit report appearing herein. The management has no disagreement with the Audit as presented.
ITEM 9A CONTROLS AND PROCEDURES.
Evaluation of Disclosure Controls and Procedures
Our management is responsible for establishing and maintaining adequate internal control over financial reporting, as such term is defined in Rules 13a-15(f) and 15d-15(f) of the Exchange Act. Our internal control system was designed to provide reasonable assurance regarding the reliability of financial reporting and the preparation of financial statements for external purposes, in accordance with generally accepted accounting principles. Because of inherent limitations, a system of internal control over financial reporting may not prevent or detect misstatements. Also, projections of any evaluation of effectiveness to future periods are subject to the risk that controls may become inadequate due to change in conditions, or that the degree of compliance with the policies or procedures may deteriorate.
Our management conducted an evaluation of the effectiveness of our internal control over financial reporting using the criteria set forth by the Committee of Sponsoring Organizations of the Treadway Commission (COSO) in Internal Control—Integrated Framework. Based on its evaluation, our management concluded that there is a material weakness in our internal control over financial reporting. A material weakness is a deficiency, or a combination of control deficiencies, in internal control over financial reporting such that there is a reasonable possibility that a material misstatement of the Company’s annual or interim financial statements will not be prevented or detected on a timely basis.
This annual report does not include an attestation report of the Company’s registered public accounting firm regarding internal control over financial reporting. Management’s report was not subject to the attestation by the Company’s registered public accounting firm pursuant to temporary rules of the SEC that permit the Company to provide only management’s report in this annual report.
The Company’s management carried out an assessment of the effectiveness of the Company’s internal control over financial reporting as of May 31, 2010. The Company’s management based its evaluation on criteria set forth in the framework in Internal Control—Integrated Framework issued by the Committee of Sponsoring Organizations of the Treadway Commission. Based on that assessment, management has concluded that the Company’s internal control over financial reporting was not effective as of May 31, 2010.
Changes in Internal Controls over Financial Reporting
In connection with the evaluation of the Company's internal controls during the Company's last fiscal year covered by this report required by paragraph (d) of Rules 13a-15 and 15d-15 under the Exchange Act, the Company has determined that the addition of a new President and a new Chief Financial Officer have had a material effect, and will have an ongoing material affect, on the quality and effectiveness of the Company's internal controls over financial reporting.
ITEM 9B. OTHER INFORMATION.
None.
35
PART III
ITEM 10. DIRECTORS, EXECUTIVE OFFICERS AND CORPORATE GOVERNANCE.
Our executive officers and directors and their ages and titles as of Wednesday, 25 August 2010 are as follows:
|
|
·
|
Bruce Fischer, PhD
|
Chairman
|
|
|
·
|
Glenn McQuiston, JD
|
President and Director
|
|
|
·
|
Marcie Corbin
|
CFO and Director
|
Our directors are appointed to hold office until the next annual meeting of our stockholders or until their successors are elected and qualified, or until they resign or are removed in accordance with the provisions of the Nevada Revised Statutes. Our officers are appointed by our Board of Directors and hold office until removal by the Board.
We have no significant employees other than our officers and/or directors, described above. None of our officers and directors has not been the subject of any order, judgment, or decree of any court of competent jurisdiction, or any regulatory agency permanently or temporarily enjoining, barring, suspending or otherwise limited them from acting as an investment advisor, underwriter, broker or dealer in the securities industry, or as an affiliated person, director or employee of an investment company, bank, savings and loan association, or insurance company or from engaging in or continuing any conduct or practice in connection with any such activity or in connection with the purchase or sale of any securities.
We conduct our business through agreements with consultants and arms-length third parties. Currently, we have no formal consulting agreements in place. We have a verbal arrangement with the consulting geologist currently conducting the exploratory work on the Scott-Morgan 1 project. We pay the consulting geologist the usual and customary rates received by geologists performing similar consulting services.
Bruce Fischer, PhD – Managing Director. A proven leader and team player with over fifteen years experience in business development and project management, with particular emphasis on environmental, agro-forestry, land development, and risk assessments. Dr. Fischer became our Managing Director and Chief Executive Officer and a member of the Board of Directors on November 21, 2008. Dr. Fischer joined Avalon Group Ltd, in 1996 as its Managing Director and continues to serve in such capacity with responsibilities for overseeing all aspects of its multi-national agricultural development business.
Dr. Fischer has founded and managed several businesses in a wide range of industries; from cruise lines, to environment remediation and agricultural land development firms. As the Managing Director of WMNS, Dr. Fischer’s responsibilities include the strategic focus and overall management of the company and its subsidiary divisions. Dr. Fischer began his career as an investor in oil and gas and quickly established the necessary connections and expertise to make WMNS a success. Dr. Fischer has a vast expertise in geological software and hardware designs, and currently owns TerraSolve Laboratory SA and international Computer Modeling organization for analysis of seismic and geophysical data. Through his experience in the oil and gas industry, Dr. Fischer has acquired extensive knowledge and hands-on industry experience in evaluation, acquisition, drilling, logging, testing, completion and work-over issues. He has an encompassing knowledge of the processes involved in executive, legal, accounting and field operations.
Dr. Fischer has extensive international business experience and is currently on the Board of Directors of four international and publicly traded companies. Dr. Fischer received a BS in Accounting and BS in Geology in undergraduate studies at Long Island University, and received his PhD in Environmental Engineering in post-graduate studies.
Glenn McQuiston – President and Director. Mr. McQuiston served as an officer and director of the Westmont Resources, Inc. from November 21, 2008 until March 1, 2009, at which time he resigned as a director. Effective March 26, 2009, he rejoined the Board of Directors and was named President of the Company.
36
Mr. McQuiston is a founder and former of two luxury cruise companies, Resort Society and Expedition Leaders. He also founded Get2Networks, a company that develops and implements complete digital communication initiatives; expanding the reach of enterprises in the oil & gas, energy, transportation and financial services industries. Previously, as president Mr. McQuiston headed up Baldwin Trading Co. a transporter of petroleum products and coal throughout the intra-coastal waterways for the major oil and gas and energy companies and utilities. In addition, as the President of Society Expeditions, Mr. McQuiston planned and executed a turn-around strategy leading it to become the premier destination cruise company. Mr. McQuiston has also served in executive capacities in finance at American Express Int’l. Banking Corp and law where he supported and provided services to the oil & gas and energy sectors.
Mr. McQuiston has led businesses to profitability, through cycles of disruption, growth, and stability, by integrating technology and human resources to maximize the return on available resources. An active forward thinking turnaround strategist, he has rebuilt and led teams to record levels of performance and has an extensive and varied experience in the oil & gas, energy and utility sectors. Mr. McQuiston has guided the development, marketing and sales of high-growth enterprises in the US, Europe and Asia. Through Mr McQuiston’s leadership companies he has led have effectively integrate speed, connectivity and value in all product offerings to ensure a steady flow of increased revenues and profits. He developed new sources of customer, which both increased yields and reduced customer acquisition costs. His methods have since been universally adopted by the cruise, transportation and shipping industries. Mr. McQuiston is a member in good standing of the Washington State Bar Association. Mr. McQuiston graduated cum laude from Seattle University School of Law in 1980. Previously he received a Masters in International Business from The Garvin Graduate School of International Management (Thunderbird).
Marcie Corbin, LLM – CFO and Director: Ms. Corbin is a member of the Westmont Resources Inc board of directors and a member of the executive management team since April 16, 2010. She also has group accountability for US and integrated supply and trading activities. Ms. Corbin is a graduate of the London School of Economics. Ms. Corbin joined The Avalon Group Ltd in 1999 and in 2003 became director of finance for The Avalon Group Ltd. Prior to joining The Avalon Group, Ms. Corbin was group chief of staff for Quantum Financial Equity Group with responsibility for a number of corporate areas, including strategy, technology, IT, investor relations and investments. Following the merger of Quantum Financial Equity Group with The Dagbie Group, in 1997 she was appointed executive vice president.
TERM OF OFFICE
Members of our board of directors are appointed to hold office until the next annual meeting of our stockholders or until his or her successor is elected and qualified, or until he or she resigns or is removed in accordance with the provisions of the Nevada Revised Statutes. Our officers are appointed by our board of directors and hold office until removed by the board.
SIGNIFICANT EMPLOYEES
We have three full time and 3 part time employees none of which are significant employees.
COMMITTEES OF THE BOARD OF DIRECTORS
We do not presently have a separately constituted audit committee, compensation committee, nominating committee, executive committee or any other committees of our board of directors.
AUDIT COMMITTEE FINANCIAL EXPERT
Not applicable as we do not presently have an audit committee.
37
CODE OF ETHICS
We adopted a Code of Ethics applicable to our principal executive officer and principal financial officer and certain other finance executives, which is a “code of ethics” as defined by applicable rules of the SEC. If we make any amendments to our Code of Ethics other than technical, administrative, or other non-substantive amendments, or grant any waivers, including implicit waivers, from a provision of our Code of Ethics to our principal executive officer and principal financial officer, or certain other finance executives, we will disclose the nature of the amendment or waiver, its effective date and to whom it applies in a Current Report on Form 8-K filed with the SEC.
COMPLIANCE WITH SECTION 16(A) OF THE SECURITIES EXCHANGE ACT
Section 16(a) of the Exchange Act requires our executive officers and directors, and persons who beneficially own more than 10% of our equity securities (collectively, the “Reporting Persons”), to file reports of ownership and changes in ownership with the SEC. Reporting Persons are required by SEC regulation to furnish us with copies of all forms they file pursuant to Section 16(a). Based on our review of the copies of such forms received by us, other than as described below, no other reports were required for those persons. We believe that, during the year ended May 31, 2009, all Reporting Persons complied with all Section 16(a) filing requirements applicable to them.
ITEM 11. EXECUTIVE COMPENSATION.
SUMMARY COMPENSATION TABLE
We did not pay any compensation to our executive officers and director during the fiscal year ended May 31, 2010, except for the issuance of Series A preferred stock and Common Stock on 26 October 2009 and 11 May 2010 to certain existing officers and directors, as follows:
|
Date
|
Name
|
Method
|
Stock Awarded
|
Value Per Share
|
Value
|
|
10/26/2009
|
Bruce Fischer, PhD
|
Indirect – F&M Inc
|
28,500 Series A Preferred
|
$0.001
|
$28.50
|
|
5/11/2010
|
Bruce Fischer, PhD
|
Indirect – F&M Inc
|
38,000 Series A Preferred
|
$0.001
|
$38.00
|
|
5/11/2010
|
Bruce Fischer, PhD
|
Indirect – F&M Inc
|
21,062,452 Common
|
$0.001
|
$21,062
|
|
10/26/2009
|
Glenn McQuiston
|
Indirect – F&M Inc
|
1,500 Series A Preferred
|
$0.001
|
$1.50
|
|
5/11/2010
|
Glenn McQuiston
|
Indirect – F&M Inc
|
2,000 Series A Preferred
|
$0.001
|
$2.00
|
|
5/11/2010
|
Glenn McQuiston
|
Indirect – F&M Inc
|
1,108,550 Common
|
$0.001
|
$1,108
|
Marcie Corbin received no compensation for services during 2010.
OUTSTANDING EQUITY AWARDS AT FISCAL YEAR-END
As at May 31, 2010, we did not have any outstanding equity awards.
EMPLOYMENT CONTRACTS
We have no employment contracts, termination of employment or change-in-control arrangements with any of our executive officers or other employees.
ITEM 12. SECURITY OWNERSHIP OF CERTAIN BENEFICIAL OWNERS AND MANAGEMENT AND RELATED STOCKHOLDER MATTERS.
EQUITY COMPENSATION PLANS
We have no equity compensation plans (including individual compensation arrangements) under which our equity securities are authorized for issuance.
38
SECURITY OWNERSHIP OF CERTAIN BENEFICIAL OWNERS AND MANAGEMENT
The following table sets forth certain information concerning the number of shares of our common stock owned beneficially as of Friday, 3 September 2010 by: (i) each person (including any group) known to us to own more than five percent (5%) of any class of our voting securities, (ii) each of our directors, (iii) each of our named executive officers; and (iv) officers and directors as a group. Unless otherwise indicated, the shareholder listed possesses sole voting and investment power with respect to the shares shown.
The following tables sets forth certain information concerning the number of shares of our common stock owned beneficially as of Friday, 3 September 2010 by: (i) each person (including any group) known to us to own more than five percent (5%) of any class of our voting securities, (ii) our directors, and (iii) our named executive officers.
Unless otherwise indicated, the stockholders listed possess sole voting and investment power with respect to the shares shown.
SECURITY OWNERSHIP – INSIDERS AND AFFILIATES

39
SECURITY OWNERSHIP – OFFICERS AND DIRECTORS
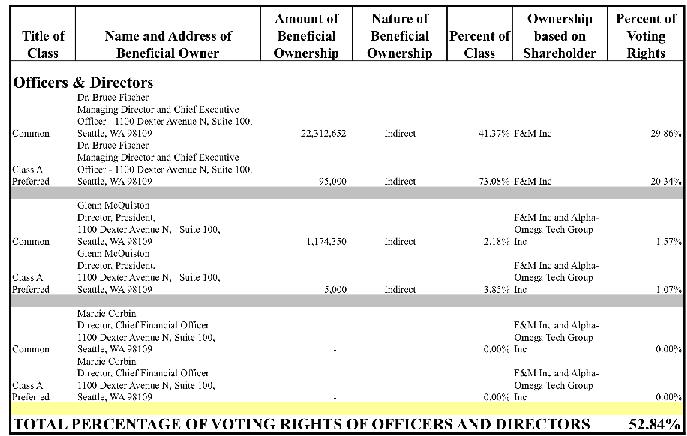
40
SECURITY OWNERSHIP – 5% OWNERS

Notes:
|
|
·
|
Based on 53,449,660 shares of our common stock issued and outstanding as of May 31, 2010. Under Rule 13d-3, certain shares may be deemed to be beneficially owned by more than one person (if, for example, persons share the power to vote or the power to dispose of the shares). In addition, shares are deemed to be beneficially owned by a person if the person has the right to acquire the shares (for example, upon exercise of an option) within 60 days of the date as of which the information is provided. In computing the percentage ownership of any person, the amount of shares outstanding is deemed to include the amount of shares beneficially owned by such person (and only such person) by reason of these acquisition rights. As a result, the percentage of outstanding shares of any person as shown in this table does not necessarily reflect the person’s actual ownership or voting power with respect to the number of shares of common stock actually outstanding on Friday, 3 September 2010.
|
|
|
·
|
Dr. Bruce Fischer is the Managing Director of both F&M, Ltd., a Nevada corporation, and The Avalon Group, Inc., a Nevis corporation, which has a Ninety-five percent (95%) ownership interest in F&M, Ltd. Dr. Fischer’s indirect holdings reflect these beneficial interests, through the ownership interests of The Avalon Group, Inc., in F&M, Ltd.
|
|
|
·
|
Glenn McQuiston has a Five percent (5%) ownership interest in F&M, Ltd.
|
41
CHANGE IN CONTROL
There is no intent or plan for a change of control.
ITEM 13. CERTAIN RELATIONSHIPS AND RELATED TRANSACTIONS, AND DIRECTOR INDEPENDENCE.
Except as described below, none of the following parties has, since our date of incorporation, had any material interest, direct or indirect, in any transaction with us or in any presently proposed transaction that has or will materially affect us, other than noted in this section:
|
|
·
|
Any of our directors or officers;
|
|
|
·
|
Any person proposed as a nominee for election as a director;
|
|
|
·
|
Any person who beneficially owns, directly or indirectly, shares carrying more than 10% of the voting rights attached to our outstanding shares of common stock;
|
|
|
·
|
Any of our promoters; and
|
|
|
·
|
Any relative or spouse of any of the foregoing persons who has the same house as such person.
|
On March 16, 2005, we issued 110,000 (5,500,000 pre split) total shares of common stock to our sole executive officer and sole director, Andrew Jarvis, at a price of $0.001 per share. The shares were issued pursuant to Section 4(2) of the Securities Act and are restricted shares as defined in the Securities Act
In addition, we purchased the JB 1 Claim (now known as the GB Claims) from Mr. Jarvis at a cost of $4,000 CDN (approximately $3,738 USD) in March 2005. Title to the GB Claims is currently held in the name of Mr. Jarvis for the benefit of our wholly owned subsidiary, Norstar Explorations Ltd.
On November 21, 2008, the Company entered into a Share Purchase Agreement whereby the Company acquired all the issued and outstanding shares of common stock of Avalon International Inc. (“Avalon”), a Washington
corporation, in exchange for 450,000 shares of common stock of the Company issued to F&M Inc. F&M Inc is controlled by Dr. Bruce Fischer through his control of the Avalon Group Ltd who owns a 95% interest in F&M Inc. In addition, Mr. Glenn McQuiston owns a 5% interest in F&M Inc.
On March 1, 2009, we closed a transaction whereby we acquired all of the capital stock of Get2Networks, Inc. At the time of the transaction, Glenn McQuiston, our Chief Financial Officer and a director, was a principal officer of Get2Networks and owned a Twenty-five percent interest in Alpha-Omega Technology, Inc. which was the sole owner of Get2Networks, Inc. In addition, Dr. Bruce Fischer through his control of The Avalon Group Ltd. also owned a Twenty-five percent interest in Alpha-Omega Technology, Inc., which was the sole owner of Get2Networks, Inc.
On May 8, 2009, we issued shares of Series A Preferred Stock as compensation to certain officers and directors, as follows: Peter Lindhout, Chairman of the Board and President (500,000 shares); Bruce E. Fischer, Managing Director, CEO and a director {30,000 (1,500,000 pre split) shares}; Andrew Jarvis, Secretary and a director {10,000 (500,000 pre-split) shares} and Javan King, a director until March 1, 2009 {10,000 (500,000 pre-split) shares}. The aggregate of 40,000 (3,000,000 pre-split) shares was valued at $3,000.
On June 11, 2009, Westmont entered into a Rolling Line of Credit Agreement with the Avalon Group Ltd for $1,000,000. The note bears an annual interest rate of Libor +2.5 and was due on May 31, 2010. The Line of Credit was renewed for fiscal year 2011. Upon default of the note and at the option of the holder, the holder may convert the outstanding amount of the note into common shares of the borrower at a discount to market price of 75%, where market price is equal to the average closing share price over 20 day trading range immediately preceding the date of default.
On October 9, 2009, the Company entered into a promissory note with Andrew Jarvis related to advances previously made by Andrew Jarvis for the Company in the principal amount of $48,428. Prior to this agreement, the advances were not subject to a written agreement. The note bears an annual interest rate of 5% and is due on June 1, 2010. Upon default of the note and at the option of the holder, the holder may convert the outstanding amount of the note into common shares of the borrower at a discount to market price of 50%, where market price is equal to the average closing share price over 20 day trading range immediately preceding the date of default.
42
On October 26, 2009, Westmont issued Thirty Thousand 30,000 split-adjusted shares of Series A Preferred Stock to F&M Inc for services provided to the Company. These shares of Preferred Stock have 160 votes per share, and each share of Preferred Stock converts into 160 shares of Common Stock. Westmont estimated the fair value to total $30.00 and charged this amount as compensation expense. F&M Inc is controlled by Dr. Bruce Fischer through his control of the Avalon Group Ltd who owns a 95% interest in F&M Inc. In addition, Mr. Glenn McQuiston owns a 5% interest in F&M Inc.
In May 2010, we signed a Memorandum of Understanding (MOU) for the Purchase of a 70% working interest in 92 oil & gas wells located in Scott & Morgan County Tennessee from Domestic Energy Corporation. Transfer of ownership in these wells from Domestic Energy to Westmont began in June 2010 and is ongoing. Domestic Energy Corporation is 87% controlled by The Avalon Group Ltd. who is also the largest beneficial owner of Westmont Resources Inc. through their control and ownership in F&M Inc.
On 15 April 2010 Westmont Resources Inc approved the reversal and termination of the Share Purchase Agreement with Alpha-Omega Inc originally dated March 1, 2009 for the acquisition of Get2Networks, Inc. The result being the cancelation of the Alpha-Omega Inc shares in Westmont Resources Inc, and the roll-out of Get2Networks, Inc to Alpha-Omega Inc. Alpha-Omega Inc. is controlled by Mr. Glenn McQuiston as the CEO and 25% owner in the Company. Dr. Bruce Fischer through his control of the Avalon Group Ltd also owns 25% interest in Alpha-Omega Inc.
On May 11, 2010, Westmont issued Forty Thousand (40,000) post split shares of Series A Preferred Stock to F&M Inc. for services provided to the Company. These shares of Preferred Stock have 160 votes per share, and each share of Preferred Stock converts into 160 shares of Common Stock. Westmont estimated the fair value to total $40 and charged this amount as compensation expense. F&M Inc is the largest shareholder of Westmont Resources Inc.
On May 11, 2010, Westmont issued Twenty Two Million One Hundred Seventy One Thousand Two (22,171,002) post split shares of Common Stock to F&M Inc for services provided to the Company. These shares of Common Stock have 1 vote per share. Westmont estimated the fair value to total $22,171 and charged this amount as compensation expense.
ITEM 14. PRINCIPAL AND ACCOUNTANT FEES AND SERVICES.
AUDIT FEES
The aggregate fees billed for the two most recently completed fiscal years ended May 31, 2010 and 2009 for professional services rendered by the principal accountant for the audit of our annual financial statements and review of the financial statements included our Quarterly Reports on Form 10-Q and services that are normally provided by the accountant in connection with statutory and regulatory filings or engagements for these fiscal periods were as follows:
|
Year Ended
|
||||||||
|
May 31, 2010
|
May 31, 2009
|
|||||||
|
Audit Fees
|
32,006 | 21,000 | ||||||
|
Audit Related Fees
|
0 | 0 | ||||||
|
Tax Fees
|
0 | 0 | ||||||
|
All Other Fees
|
0 | 0 | ||||||
|
Total Audit Fees
|
32,006 | 21,000 | ||||||
43
PART IV
ITEM 15. EXHIBITS.
|
Exhibit
Number
|
Description of Exhibits
|
Location
|
|
3.1
|
Articles of Incorporation.
|
Incorporated by reference to Exhibit 3.1 to the Company’s Registration Statement on Form SB-2 as filed with the Securities & Exchange Commission on October 13, 2006, as subsequently amended.
|
|
3.2
|
Bylaws, as amended.
|
Incorporated by reference to Exhibit 3.2 to the Company’s Registration Statement on Form SB-2 as filed with the Securities & Exchange Commission on October 13, 2006, as subsequently amended.
|
|
21.1
|
List of Subsidiaries.
|
Included herein.
|
|
31.1;
and
31.2
|
Certification of Chief Executive Officer, and Chief Financial Officer pursuant to U.S.C. Section 7241, as adopted pursuant to Section 302 of the Sarbanes-Oxley Act of 2002.
|
Included herein.
|
|
32.1;
and
32.2
|
Certification of Chief Executive Officer, and Chief Financial Officer pursuant to 18 U.S.C. Section 1350, as adopted pursuant to Section 906 of the Sarbanes-Oxley Act of 2002.
|
Included herein.
|
44
SIGNATURES
In accordance with Section 13 or 15(d) of the Exchange Act, the registrant caused this report to be signed on its behalf by the undersigned, thereunto duly authorized.
WESTMONT RESOURCES, INC.
|
Date:
|
Tuesday, 14 September 2010
|
By:
|
/s/ Dr. Bruce E. Fischer |
|
DR. BRUCE E. FISCHER
Managing Director, Chief Executive Officer
(Principal Executive Officer)
|
In accordance with the Exchange Act, this report has been signed below by the following persons on behalf of the registrant and in the capacities and on the dates indicated.
|
Date:
|
Tuesday, 14 September 2010
|
By:
|
/s/ Dr. Bruce E. Fischer |
|
DR. BRUCE E. FISCHER
Managing Director, Chief Executive Officer
(Principal Executive Officer)
|
|||
|
Date:
|
Tuesday, 14 September 2010
|
By:
|
/s/ Glenn McQuiston |
|
GLENN MCQUISTON
|
|||
|
President and Director
(Principal Operations Officer)
|
|||
|
Date:
|
Tuesday, 14 September 2010
|
By:
|
/s/ Marcie Corbin |
|
MARCIE CORBIN
|
|||
|
Chief Financial Officer and Director
(Principal Financial Officer)
|
45