Attached files
| file | filename |
|---|---|
| 8-K - FORM 8-K - OCWEN FINANCIAL CORP | ocwen_8k.htm |
Exhibit 99.1
2010 Global Financial Services Conference
September 14, 2010

Forward - looking statements
Forward-looking statements should not be read as a guarantee of future performance or results, and will not necessarily be accurate indications of the times at, or by which, such performance or results will be achieved or whether such performance or results will ever be achieved. Forward-looking information is based on information available at the time and management’s good faith belief with respect to future events, and is subject to risks and uncertainties that could cause actual performance or results to differ materially from those expressed in the statements.
Forward-looking statements speak only as of the date the statements are made. Ocwen Financial Corporation (“the Company”) assumes no obligation to update forward-looking statements to reflect actual results, changes in assumptions or changes in other factors affecting forward-looking information except to the extent required by applicable securities laws. If the Company does update one or more forward-looking statements, no inference should be drawn that the Company will make additional updates with respect thereto or with respect to other forward-looking statements.

Presenters
Ronald M. Faris
President
19 years at Ocwen
24 years of industry experience
24 years of industry experience
§ Ocwen: President since 2001, Executive Vice President from 1998 to 2001, Vice President and Chief Accounting Officer from 1995 to 1997
§ 1991 to 1994: Controller for a subsidiary of Ocwen
§ 1986 to 1991: Vice President with Kidder, Peabody & Co., Inc.
§ 1984 to 1986: General Audit Department of PricewaterhouseCoopers LLP
§ BS in Accounting from The Pennsylvania State University
John P. Van Vlack
Executive Vice President and Chief Financial Officer
3 years at Ocwen
23 years of industry experience
23 years of industry experience
§ Ocwen: Executive Vice President and Chief Financial Officer, Senior Vice President and Chief Financial Officer for Ocwen Asset Management from 2008 –2010, Vice President from 2007 - 2008
§ 1989 to 2007: Various executive positions in BellSouth Corporation including Chief Financial Officer of four business units
§ 1987 to 1989: Auditor, Deloitte & Touche LLP.
§ BBA in Accounting, Emory University and Master of Business Administration, The University of Texas at Austin

Agenda
Ocwen Business Overview and HomEq Status
HomEq Transaction and Senior Secured Term Loan
Revenue Analysis and Ramp for New Portfolios
Key Investment Highlights
Questions and Answers

Ocwen Business Overview and HomEq Status

Who we are and what we do
§ Leading provider of residential and commercial mortgage loan servicing and special servicing
Ø Publicly traded (NYSE: OCN), pure play mortgage servicer
Ø 20+ years of innovation in loss mitigation
§ #1 servicer in every study of which we are aware and lowest re-default rate
§ $76.7 billion servicing portfolio including recent acquisitions of Saxon and HomEq (as of 9/1/10)
Ø Principally focused on residential loan servicing
§ Employer of over 2,500 employees worldwide
§ Management and the Board has a 23% ownership in Ocwen and strong alignment of interests
Ocwen maximizes value for mortgage owners by keeping borrowers in their homes through the intelligent use of scalable technology

Mortgage servicing overview
§ Residential mortgage loan servicing primarily involves:
Ø Collection and transfer of mortgage payments from borrowers
Ø Cash management and escrow account responsibilities
Ø Mitigation of losses through loan modifications, short sales and other options
Ø Administration of foreclosure and real estate owned
§ Servicers receive contractual fees based on the unpaid principal balance (“UPB”) of the loans serviced
§ In most cases, if there is a shortfall in monthly collections from a delinquent borrower, the servicer is required to “advance” the missed payments and other costs
Ø The right to be repaid for these servicer advances is senior to the AAA securities issued by the MBS trusts, or “top-of-the-waterfall”
§ The primary costs are operating expenses and the cost of funding servicer advances
Why are servicer advances truly AAA?
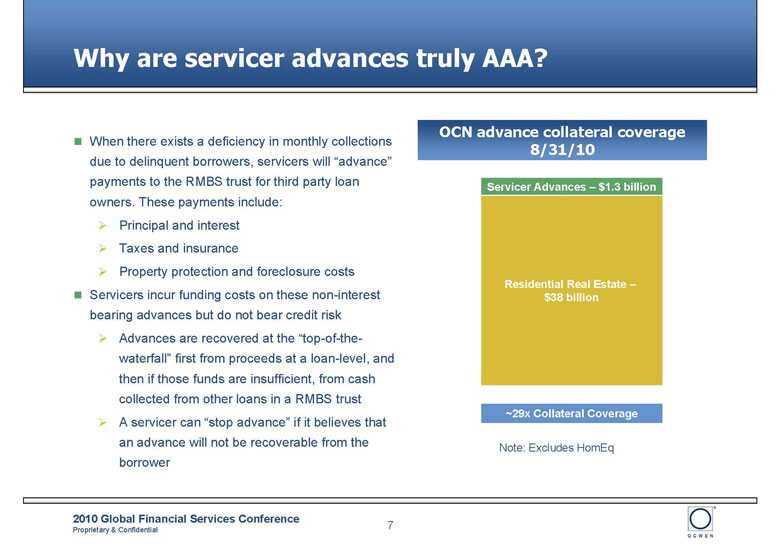
§ When there exists a deficiency in monthly collections due to delinquent borrowers, servicers will “advance” payments to the RMBS trust for third party loan owners. These payments include:
Ø Principal and interest
Ø Taxes and insurance
Ø Property protection and foreclosure costs
§ Servicers incur funding costs on these non-interest bearing advances but do not bear credit risk
Ø Advances are recovered at the “top-of-the-waterfall” first from proceeds at a loan-level, and then if those funds are insufficient, from cash collected from other loans in a RMBS trust
Ø A servicer can “stop advance” if it believes that an advance will not be recoverable from the borrower

Superior servicing and loss mitigation capabilities
Ocwen cures more loans and generates more cash
|
12 Month Total Cure & Cash Flowing Rate for Subprime Loans
|
||
|
(Net of Bankruptcies)
|
||
|
Ocwen
|
61%
|
|
|
Moody’s
|
“Strong” Rated Servicers
|
59%
|
|
Assessment
|
||
|
“Above Average” Rated Servicers
|
52%
|
|
|
“Average” Rated Servicers
|
26%
|
|
Ocwen generates more cash than even “Strong” Rated servicers
_________________________________
Source: Moody’s, “2008 Review and a Look Ahead to 2009: U.S. Mortgage Servicer Ratings,” February 2009.

Proven ability to make loans current and enhance cash collectibility
Monthly payment velocity of 90+ DQ for 2006 vintage subprime loans
Ocwen leads the industry in making 90+ days delinquent loans current
_________________________________
Source: Credit Suisse 2008.

Proven ability to make loans current and enhance cash collectibility
Roll rate from 90+ days delinquent to current subprime fixed rate
Roll rate from 90+ days delinquent to current subprime adjustable rate
Ocwen leads the industry in making 90+ days delinquent loans current
_________________________________
Source: Bank of America/Merrill Lynch report dated July 2009, based on 2006 vintage loans on data from December 2008 to May 2009.

Leading Loss Mitigation Techniques
Recovery Score
§ A measurement of the present value of recovered cashflow.
§ Higher Recovery Scores result from increasing the principal recovery or decreasing resolution time for the property disposition.
|
Rank
|
Servicer
|
% SS
|
SS severity
|
SS TL
|
REO severity
|
REO TL
|
Recovery Score
|
|
1
|
Ocwen
|
25%
|
59.9
|
29.7
|
66.7
|
29.3
|
31.0
|
|
2
|
Litton
|
25%
|
60.5
|
18.6
|
70.0
|
22.6
|
29.7
|
|
3
|
Wells Fargo
|
14%
|
58
|
15.6
|
70.0
|
20.8
|
29.2
|
|
4
|
HomEq
|
22%
|
58.2
|
16.0
|
73.6
|
21.8
|
27.4
|
|
5
|
Option One
|
21%
|
60.2
|
17.3
|
73.5
|
23.2
|
26.8
|
|
6
|
Chase
|
37%
|
63.1
|
16.8
|
76.7
|
21.2
|
26.2
|
|
7
|
WaMu
|
21%
|
68.2
|
18.5
|
74.9
|
22.3
|
24.2
|
|
8
|
Saxon
|
18%
|
64.8
|
17.1
|
75.9
|
22.3
|
23.8
|
|
9
|
Equicredit
|
41%
|
93.5
|
29.8
|
66.0
|
40.7
|
19.4
|
|
10
|
Ameriquest
|
23%
|
62.8
|
18.7
|
81.9
|
26.2
|
20.5
|
SS = Short Sale Source: Deutsche Bank and LoanPerformance
Quality Rank
§ Ocwen’s ability to keep loans current, modify troubled loans and effectively manage one of the largest portfolios, contributes to the Company’s top quality ranking relative to its subprime servicer peers.
|
Quality
|
Always
|
Always Cur
|
Balance
|
||||
|
Rank
|
Cur
|
60+
|
to 30 Roll
|
Modded
|
# of Loans
|
($bn)
|
|
|
Ocwen
|
1
|
30%
|
31%
|
1.90%
|
46.00%
|
161,879
|
$23.1
|
|
Ameriquest
|
2
|
42%
|
31%
|
1.50%
|
23.00%
|
132,892
|
$21.3
|
|
HomEq
|
3
|
38%
|
34%
|
1.60%
|
15.00%
|
96,904
|
$15.7
|
|
Chase
|
4
|
35%
|
37%
|
1.30%
|
26.00%
|
123,063
|
$20.7
|
|
Option One
|
5
|
30%
|
37%
|
1.90%
|
37.00%
|
204,106
|
$38.5
|
|
Wells Fargo
|
6
|
33%
|
40%
|
1.60%
|
29.00%
|
180,252
|
$29.2
|
|
Saxon
|
7
|
25%
|
44%
|
1.90%
|
20.00%
|
82,441
|
$14.2
|
|
WaMu
|
8
|
26%
|
47%
|
1.80%
|
35.00%
|
88,365
|
$15.4
|
|
EMC
|
9
|
30%
|
46%
|
2.00%
|
29.00%
|
121,411
|
$15.7
|
|
Countrywide
|
10
|
25%
|
58%
|
2.00%
|
16.00%
|
125,841
|
$22.1
|
Source: J.P. Morgan, Loan Performance
Long-term track record of growth
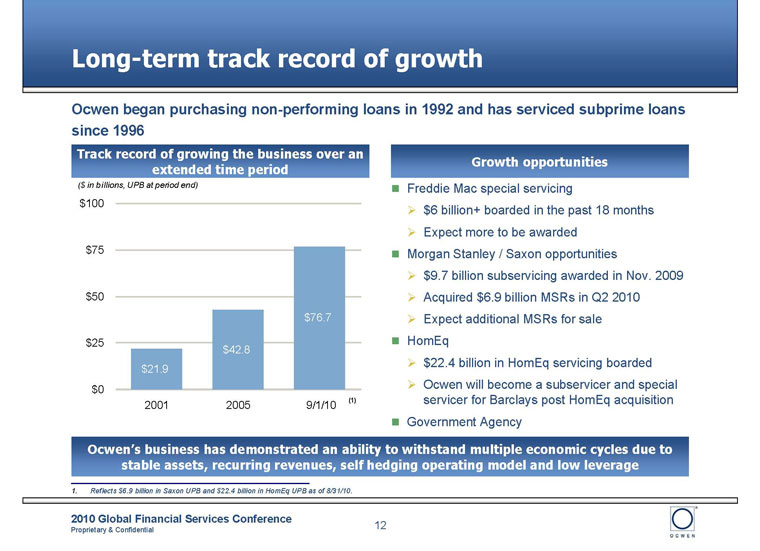
Ocwen began purchasing non-performing loans in 1992 and has serviced subprime loans since 1996
Track record of growing the business over an extended time period
Growth opportunities
§ Freddie Mac special servicing
Ø $6 billion+ boarded in the past 18 months
Ø Expect more to be awarded
§ Morgan Stanley / Saxon opportunities
Ø $9.7 billion subservicing awarded in Nov. 2009
Ø Acquired $6.9 billion MSRs in Q2 2010
Ø Expect additional MSRs for sale
§ HomEq
Ø $22.4 billion in HomEq servicing boarded
Ø Ocwen will become a subservicer and special servicer for Barclays post HomEq acquisition
§ Government Agency
Ocwen’s business has demonstrated an ability to withstand multiple economic cycles due toRecently awarded REO and subservicing stable assets, recurring revenues, self hedging operating model and low leverage
_________________________________
1. Reflects $6.9 billion in Saxon UPB and $22.4 billion in HomEq UPB as of 8/31/10.

HomEq transition status
Loan Transfer
§ Simultaneous closing and transfer of 134,000 loans took place on 9/1/10
Ø Immediate boarding onto Ocwen’s system eliminated the need for systems integration between HomEq and Ocwen and provided immediate control over the operation
Ø Images of active loan files have been transferred onto Ocwen’s imaging system to be followed by loading of images on inactive loans
Ø Ocwen will retain access to HomEq servicing system through 2012 for research purposes
Staffing
§ Will convert to the Ocwen cost structure as quickly as possible
Ø 1,158 HomEq staff were converted to Ocwen payroll and given WARN Act notice at close
Ø 620 HomEq staff were placed on working leave status with the remainder set for Oct / Nov
Ø Severance benefits were provided in the contract and mirror Barclays / HomEq plans
Ø Ocwen hired 777 people and trained all but 221 from May – Aug
Ø Breakdown by country is: 715 India, 35 Uruguay, 27 US
_________________________________
1. $34 million in expected severance and Warn Act costs.

HomEq transition status
Technology
§ Technology plan was designed to support the full immediate transition of the HomEq portfolio
Ø Scaled hardware, storage and licenses as needed
Ø Added data / telecom links to Sacramento and Raleigh and configured dialer and call recording equipment
Ø Software is performing very well at higher volume levels
Ø Planning to decommission HomEq data center and transfer assets for future use including a US disaster recovery site
Ø Ocwen will retain access to HomEq servicing system through 2012 for research purposes
_________________________________
1. Includes $34 million in expected severance and Warn Act costs.

HomEq Transaction and Senior Secured Term Loan
HomEq transaction overview
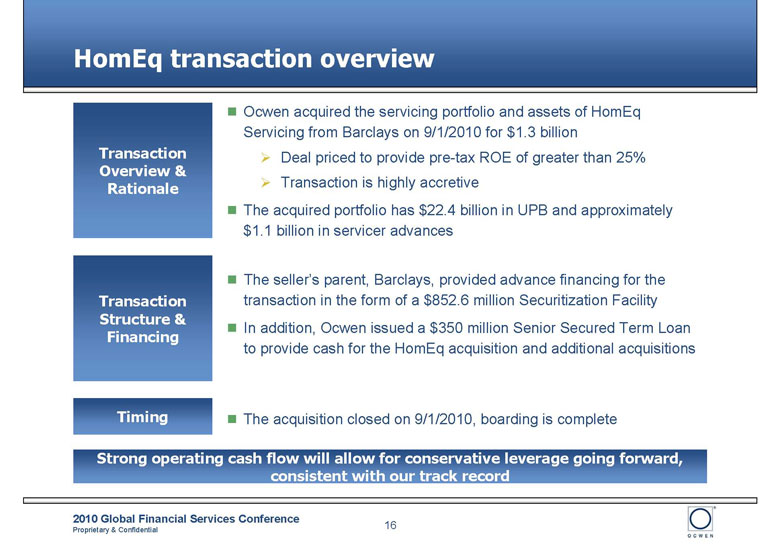
Transaction Overview & Rationale
§ Ocwen acquired the servicing portfolio and assets of HomEq Servicing from Barclays on 9/1/2010 for $1.3 billion
Ø Deal priced to provide pre-tax ROE of greater than 25%
Ø Transaction is highly accretive
§ The acquired portfolio has $22.4 billion in UPB and approximately $1.1 billion in servicer advances
Transaction Structure & Financing
§ The seller’s parent, Barclays, provided advance financing for the transaction in the form of a $852.6 million Securitization Facility
§ In addition, Ocwen issued a $350 million Senior Secured Term Loan to provide cash for the HomEq acquisition and additional acquisitions
Timing
§ The acquisition closed on 9/1/2010, boarding is complete
Strong operating cash flow will allow for conservative leverage going forward, consistent with our track record

Senior Secured Term Loan - Transaction terms
Summary Terms and Conditions
|
Issuer:
|
Ocwen Financial Corporation (“Ocwen” or the “Company”)
|
|
Issue:
|
$350 million Senior Secured Term Loan (the “Term Loan”)
|
|
$300 million accordion subject to covenants and other conditions
|
|
|
Guarantor:
|
Ocwen Financial Corporation and all other existing and subsequently acquired or organized direct or indirect wholly-owned restricted subsidiaries of the Borrower (subject to certain exclusions)
|
|
Tenor:
|
5 year
|
|
Indicative Coupon:
|
L+700 bps, with 2.0% Libor floor
|
|
Issue Price:
|
98 OID
|
|
Security:
|
A perfected first priority security interest in all unencumbered assets of the Company and a pledge of the capital stock of all current and future domestic subsidiaries
|
|
Amortization:
|
2.5% per quarter
|
|
Optional Prepayments:
|
101 soft call for first year, prepayable at par thereafter
|
|
100% Net Proceeds from Non-Permitted Indebtedness
|
|
|
Mandatory Prepayments:
|
100% Net Asset Sale Proceeds (with carve-outs and reinvestment rights)
|
|
50% Excess Cash Flow
|
|
|
Use of Proceeds:
|
General corporate purposes including acquisition financing
|
|
Maximum Corporate Debt (includes recourse and MSR debt) to EBITDA Ratio
|
|
|
Maximum Total Debt to Tangible Net Worth Ratio
|
|
|
Financial Covenants:
|
Minimum Interest Coverage Ratio
|
|
Maximum LTV Ratio
|

HomEq Transaction Overview and Status

Estimated purchase price allocation for HomEq
|
Balance sheet accounts
|
|
|
Mortgage servicing rights
|
$83.5
|
|
Match funded advances
|
$1,095.5
|
|
Premises and equipment, net
|
$14.3
|
|
Other assets
|
$0.6
|
|
Intangibles, including goodwill
|
$11.7
|
|
Other liabilities
|
($8.9)
|
|
Total purchase price
|
$1,196.7
|
|
Match funded liabilities
|
($852.6)
|
|
Cash at close
|
$344.1
|
|
Reconciliation to total investment
|
|
|
Cash at close
|
$344.1
|
|
Estimated transaction expenses
|
$56.0
|
|
Total investment
|
$400.1
|
Estimated opening balances for HomEq on Ocwen’s balance sheet have been determined as follows:
§ Third party appraisals for MSRs and PP&E (completed)
§ PP&E appraisal for the opening balance sheet reflects highest and best use, but the decision to close down the HomEq operation subjects this to impairment testing
§ A non-cash expense may be incurred for impairment of assets that are unlikely to be re-deployed to Ocwen’s operation
§ Par value for match funded advances and liabilities
§ Book value for other assets and liabilities
§ Intangibles, goodwill make up the difference
_________________________________
1. Excludes miscellaneous fees paid at close.

Revenue Analysis and Ramp for New Portfolios
Splitting revenue between Servicing and Subservicing reveals different trends
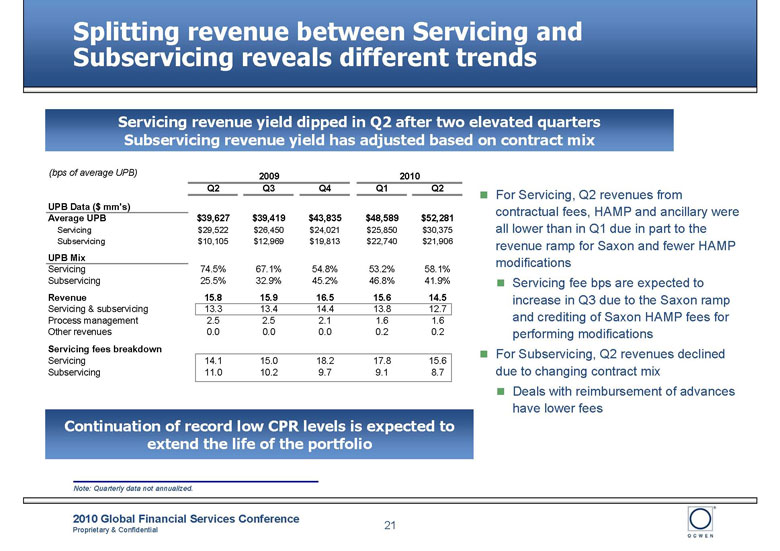
Servicing revenue yield dipped in Q2 after two elevated quarters Subservicing revenue yield has adjusted based on contract mix
|
(bps of average UPB)
|
2009
|
2010
|
||||
|
Q2
|
Q3
|
Q4
|
Q1
|
Q2
|
||
|
UPB Data ($ mm’s)
|
||||||
|
Average UPB
|
$39,627
|
$39,419
|
$43,835
|
$48,589
|
$52,281
|
|
|
Servicing
|
$29,522
|
$26,450
|
$24,021
|
$25,850
|
$30,375
|
|
|
Subservicing
|
$10,105
|
$12,969
|
$19,813
|
$22,740
|
$21,906
|
|
|
UPB Mix
|
||||||
|
Servicing
|
74.5%
|
67.1%
|
54.8%
|
53.2%
|
58.1%
|
|
|
Subservicing
|
25.5%
|
32.9%
|
45.2%
|
46.8%
|
41.9%
|
|
|
Revenue
|
15.8
|
15.9
|
16.5
|
15.6
|
14.5
|
|
|
Servicing & subservicing
|
13.3
|
13.4
|
14.4
|
13.8
|
12.7
|
|
|
Process management
|
2.5
|
2.5
|
2.1
|
1.6
|
1.6
|
|
|
Other revenues
|
0.0
|
0.0
|
0.0
|
0.2
|
0.2
|
|
|
Servicing fees breakdown
|
||||||
|
Servicing
|
14.1
|
15.0
|
18.2
|
17.8
|
15.6
|
|
|
Subservicing
|
11.0
|
10.2
|
9.7
|
9.1
|
8.7
|
Continuation of record low CPR levels is expected to extend the life of the portfolio
_________________________________
Note: Quarterly data not annualized.
§ For Servicing, Q2 revenues from contractual fees, HAMP and ancillary were all lower than in Q1 due in part to the revenue ramp for Saxon and fewer HAMP modifications
§ Servicing fee bps are expected to increase in Q3 due to the Saxon ramp and crediting of Saxon HAMP fees for performing modifications
§ For Subservicing, Q2 revenues declined due to changing contract mix
§ Deals with reimbursement of advances have lower fees

Update on the Saxon portfolio revenue ramp
Servicing fees and other revenue have increased since Q2
Contractual annual servicing fee
All Other Revenue includes late fees, HAMP revenue, and REO revenue
§ Saxon servicing fees were low in April and May as each was a partial month and servicing fees are not recognized by Ocwen until collected
Ø Collections improved in July and August with fees collected exceeding the contractual fee
§ Saxon revenue in all other categories reflects the ramp of late fees, HAMP revenue and REO revenue
Ø Other revenue spiked in July with the release of HAMP continuing success fees on prior modifications
Advance ratios on acquired servicing portfolios
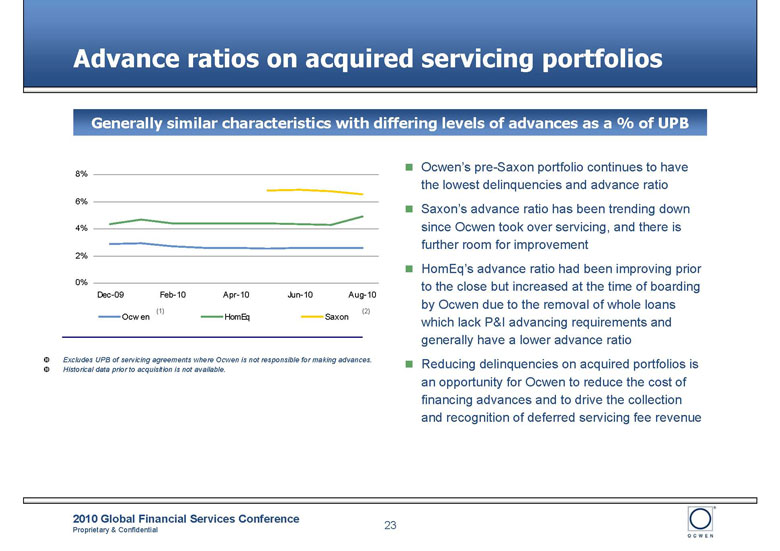
Generally similar characteristics with differing levels of advances as a % of UPB
_________________________________
(1) Excludes UPB of servicing agreements where Ocwen is not responsible for making advances.
(2) Historical data prior to acquisition is not available.
§ Ocwen’s pre-Saxon portfolio continues to have the lowest delinquencies and advance ratio
§ Saxon’s advance ratio has been trending down since Ocwen took over servicing, and there is further room for improvement
§ HomEq’s advance ratio had been improving prior to the close but increased at the time of boarding by Ocwen due to the removal of whole loans which lack P&I advancing requirements and generally have a lower advance ratio
§ Reducing delinquencies on acquired portfolios is an opportunity for Ocwen to reduce the cost of financing advances and to drive the collection and recognition of deferred servicing fee revenue

Key Investment Highlights

Key investment highlights
Stable business model with recurring revenue streams
§ Contractually established servicing fees
§ Consistent profitability throughout the credit crisis
§ Attractive returns on acquisitions
Substantial cash flow generation
§ Expect to generate substantial free cash flow to delever
§ Effective at driving down advances through superior loss mitigation
Highly scalable platform
§ Highly scalable platform with lowest operating cost in the industry
§ Ability to board acquisitions with minimal incremental infrastructure
Low risk balance sheet
§ $900 million of equity supported by highly rated assets
§ Limited recourse debt of $83 million as of 6/30/10
§ Duration matched liabilities and hedged against LIBOR increases
§ Maintain over $750 million of excess advance funding capacity
Strong collateral protection
§ Investment grade quality collateral of $1.1 billion exceeds the secured term loan by 3.1:1
Over two decades of servicing led by an experienced management team

Principal reduction modifications target portfolio segments with the highest advances
|
Distribution of 1st
|
Liens by FICO and LTV
|
||
|
LTV < 70
|
LTV 70 to 100
|
LTV > = 100
|
|
|
FICO
>=
650
|
Portfolio: 6.3%
Avg. Days Delq: 2
Contractual 90+: 2%
MODs: 4%
MODs Re-default: 3%
REO: 0%
Advances: $16mn (1%)
|
Portfolio: 13.0%
Avg. Days Delq: 15
Contractual 90+: 4%
MODs: 9%
MODs Re-default: 2%
REO: 0%
Advances: $40mn
(2%)
|
Portfolio: 5.0%
Avg. Days Delq: 110
Contractual 90+: 9%
MODs: 37%
MODs Re-default: 8%
REO: 6%
Advances: $63mn
(3%)
|
|
FICO
550
to
650
|
Portfolio: 5.5%
Avg. Days Delq: 63
Contractual 90+: 15%
MODs: 15%
MODs Re-default: 10%
REO: 1%
Advances: $84mn
(5%)
|
Portfolio: 16.3%
Avg. Days Delq: 99
Contractual 90+: 25%
MODs: 20%
MODs Re-default: 12%
REO: 2%
Advances: $286mn
(15%)
|
Portfolio: 18.0%
Avg. Days Delq: 212
Contractual 90+: 40%
MODs: 49%
MODs Re-default:
24%
REO: 10%
Advances: $466mn
(24%)
|
|
FICO
<
550
|
Portfolio: 3.5%
Avg. Days Delq: 104
Contractual 90+: 30%
MODs: 19%
MODs Re-default:
22%
REO: 1%
Advances: $79mn
(4%)
|
Portfolio: 13.2%
Avg. Days Delq: 156
Contractual 90+: 40%
MODs: 25%
MODs Re-default:
22%
REO: 3%
Advances: $364mn
(19%)
|
Portfolio: 19.2%
Avg. Days Delq: 216
Contractual 90+: 47%
MODs: 55%
MODs Re-default:
37%
REO: 8%
Advances: $522mn
(27%)
|
Distribution of Advances
§ 54% of Advances are for loans with an LTV > 100%.
§ These loans will benefit from new HAMP incentives for principal reduction modifications.

Growing demand for high-touch servicers in $11 trillion industry
§ $10.7 trillion in residential mortgages outstanding as of March 31, 2010
Ø $1.6 trillion of delinquent loans
§ Every loan needs a servicer
Ø Top five banks service 60% of total loans, but focused on prime and subprime loans
Ø Growing number of distressed assets where “high touch” servicers are best equipped to improve loan performance
Top mortgage servicers (1)
Increase in distressed assets (2)
_________________________________
1. Source: Inside Mortgage Finance as of 3/31/09.
2. Source: Mortgage Bankers Association.
3. Adjusted to include Saxon and HomEq as of 9/1/10..

Questions and Answers