Attached files
| file | filename |
|---|---|
| EX-21.0 - EXHIBIT 21.0 - OCWEN FINANCIAL CORP | ex21_0.htm |
| EX-23.1 - EXHIBIT 23.1 - OCWEN FINANCIAL CORP | ex23_1.htm |
| EX-31.2 - EXHIBIT 31.2 - OCWEN FINANCIAL CORP | ex31_2.htm |
| EX-32.2 - EXHIBIT 32.2 - OCWEN FINANCIAL CORP | ex32_2.htm |
| EX-23.2 - EXHIBIT 23.2 - OCWEN FINANCIAL CORP | ex23_2.htm |
| EX-32.1 - EXHIBIT 32.1 - OCWEN FINANCIAL CORP | ex32_1.htm |
| EX-31.1 - EXHIBIT 31.1 - OCWEN FINANCIAL CORP | ex31_1.htm |
| EX-12.1 - EXHIBIT 12.1 - OCWEN FINANCIAL CORP | ex12_1.htm |
|
|
|
UNITED STATES |
|
SECURITIES AND EXCHANGE COMMISSION |
|
Washington, D.C. 20549 |
|
|
|
FORM 10-K |
|
|
|
|
|
|
(Mark one) |
|
|
x |
ANNUAL REPORT PURSUANT TO SECTION 13 OR 15(d) OF THE SECURITIES EXCHANGE ACT OF 1934 |
|
|
For the fiscal year ended December 31, 2009 |
|
OR |
|
|
o |
TRANSITION REPORT PURSUANT TO SECTION 13 OR 15(d) OF THE SECURITIES EXCHANGE ACT OF 1934 |
|
|
For the transition period from: _____________________to _____________________ |
|
|
|
|
Commission File No. 1-13219 |
|
|
|
|
|
OCWEN FINANCIAL CORPORATION |
|
|
(Exact name of Registrant as specified in our charter) |
|
|
|
|
|
Florida
|
65-0039856
|
|
(State or other jurisdiction of incorporation or organization) |
(I.R.S. Employer Identification No.) |
|
1661 Worthington Road, Suite 100 |
|
|
West Palm Beach, Florida |
33409 |
|
(Address of principal executive office) |
(Zip Code) |
|
|
|
|
(561) 682-8000
|
|
|
(Registrant’s telephone number, including area code) |
|
|
|
|
|
Securities registered pursuant to Section 12(b) of the Act: |
|
|
Common Stock, $.01 par value |
New York Stock Exchange (NYSE) |
|
(Title of each class) |
(Name of each exchange on which registered) |
|
|
|
|
Securities registered pursuant to Section 12 (g) of the Act: Not applicable. |
|
|
|
|
|
Indicate by check mark if the registrant is a well-known seasoned issuer, as defined in Rule 405 of the Securities Act. |
|
|
Yes x No o |
|
|
|
|
|
Indicate by check mark if the registrant is not required to file reports pursuant to Section 13 or Section 15(d) of the Act. |
|
|
Yes o No x |
|
|
|
|
|
Indicate by check mark whether the registrant (1) has filed all reports required to be filed by Section 13 or 15(d) of the Securities Exchange Act of 1934 during the preceding 12 months (or for such shorter period that the registrant was required to file such reports), and (2) has been subject to such filing requirements for the past 90 days. Yes x No o |
|
|
|
|
|
Indicate by check mark whether the registrant has submitted electronically and posted on its corporate Web site, if any, every Interactive Data File required to be submitted and posted pursuant to Rule 405 of Regulation S-T (§232.405 of this chapter) during the preceding 12 months (or for such shorter period that the registrant was required to post such files). |
|
|
Yes o No o |
|
|
|
|
|
Indicate by check mark if disclosure of delinquent filers pursuant to Item 405 of Regulation S-K is not contained herein, and will not be contained, to the best of the registrant’s knowledge, in definitive proxy or information statements incorporated by reference in Part III of this Form 10-K or any amendment to this Form 10-K. x |
|
|
|
|
|
Indicate by check mark whether the registrant is a large accelerated filer, an accelerated filer, a non-accelerated filer or a smaller reporting company. See the definitions of “large accelerated filer,” “accelerated filer” and “smaller reporting company” in Rule 12b-2 of the Exchange Act: |
|
|
|
|
|
Large Accelerated filer o |
Accelerated filer x |
|
Non-accelerated filer o (Do not check if a smaller reporting company) |
Smaller reporting company o |
|
|
|
|
Indicate by check mark whether the registrant is a shell company (as defined in Rule 12b-2 of the Act) Yes o No x Aggregate market value of the common stock of the registrant held by nonaffiliates as of June 30, 2009: $560,543,297 |
|
|
|
|
|
Number of shares of common stock outstanding as of February 26, 2010: 99,958,162 shares |
|
|
|
|
|
DOCUMENTS INCORPORATED BY REFERENCE: Portions of our definitive Proxy Statement with respect to our Annual Meeting of Shareholders to be held on May 6, 2010, are incorporated by reference into Part III, Items 10 - 12 and 14. |
|
OCWEN FINANCIAL CORPORATION
2009 FORM 10-K ANNUAL REPORT
TABLE OF CONTENTS
1
FORWARD-LOOKING STATEMENTS
This Annual Report contains forward-looking statements within the meaning of Section 27A of the Securities Act of 1933, as amended, and Section 21E of the Securities Exchange Act of 1934, as amended. All statements, other than statements of historical fact, included in this report, including, without limitation, statements regarding our financial position, business strategy and other plans and objectives for our future operations, are forward-looking statements.
These statements include declarations regarding our management’s beliefs and current expectations. In some cases, you can identify forward-looking statements by terminology such as “may,” “will,” “should,” “expects,” “plans,” “anticipates,” “believes,” “estimates,” “predicts” or “continue” or the negative of such terms or other comparable terminology. These forward-looking statements are subject to inherent risks and uncertainties in predicting future results and conditions that could cause the actual results to differ materially from those projected in these forward-looking statements. Some, but not all, of the risks and uncertainties include those referred to in the section entitled “Risk Factors” and the following:
|
|
|
|
|
|
• |
assumptions related to the sources of liquidity, our ability to fund advances and the adequacy of financial resources; |
|
|
|
|
|
|
• |
estimates regarding prepayment speeds, float balances, delinquency rates, advances and other servicing portfolio characteristics; |
|
|
|
|
|
|
• |
projections as to the performance of our asset management vehicles; |
|
|
|
|
|
|
• |
assumptions about our ability to grow our business; |
|
|
|
|
|
|
• |
our plans to continue to sell our non-core assets; |
|
|
|
|
|
|
• |
our ability to reduce our cost structure; |
|
|
|
|
|
|
• |
our analysis in support of the decision to spin off Altisource as a separate company; |
|
|
|
|
|
|
• |
our continued ability to successfully modify delinquent loans and sell foreclosed properties; |
|
|
|
|
|
|
• |
estimates regarding our reserves, valuations and anticipated realization on assets; and |
|
|
|
|
|
|
• |
expectations as to the effect of resolution of pending legal proceedings on our financial condition. |
Forward-looking statements are not guarantees of future performance and involve a number of assumptions, risks and uncertainties that could cause actual results to differ materially. Important factors that could cause actual results to differ include, but are not limited to, the risks discussed in “Risk Factors” above and the following:
|
|
|
|
|
|
• |
availability of adequate and timely sources of liquidity; |
|
|
|
|
|
|
• |
delinquencies, advances and availability of servicing; |
|
|
|
|
|
|
• |
general economic and market conditions; |
|
|
|
|
|
|
• |
uncertainty related to market conditions and government programs; |
|
|
|
|
|
|
• |
governmental regulations and policies; and |
|
|
|
|
|
|
• |
uncertainty related to dispute resolution and litigation. |
Further information on the risks specific to our business is detailed within this report and our other reports and filings with the Securities and Exchange Commission (SEC), including our Quarterly Reports on Form 10-Q and Current Reports on Form 8-K. Forward-looking statements speak only as of the date they were made and should not be relied upon. Ocwen Financial Corporation undertakes no obligation to update or revise forward-looking statements.
2
|
|
|
|
BUSINESS (Dollars in thousands, unless otherwise indicated) |
GENERAL
Ocwen Financial Corporation, through its subsidiaries, is a leading provider of residential and commercial mortgage loan servicing, special servicing and asset management services. When we use the terms “Ocwen,” “OCN,” “we,” “us” and “our,” we refer to Ocwen Financial Corporation and its consolidated subsidiaries. Ocwen is headquartered in West Palm Beach, Florida with offices in California, the District of Columbia, Florida and Georgia and global operations in India and Uruguay. OCN is a Florida corporation organized in February 1988. Ocwen Loan Servicing, LLC (OLS), a wholly owned subsidiary of Ocwen, is a licensed mortgage servicer in all 50 states, the District of Columbia and two U.S. territories.
On August 10, 2009, we completed the distribution of our Ocwen Solutions (OS) line of business, except for BMS Holdings, Inc. (BMS Holdings) and Global Servicing Solutions, LLC (GSS), via the spin-off of a separate publicly traded company, Altisource Portfolio Solutions S.A. (Altisource). Altisource common stock is listed on the NASDAQ market under the ticker symbol “ASPS.” We distributed all of the shares of Altisource common stock to OCN’s shareholders of record as of August 4, 2009 (the Separation).
On December 3, 2009, we finalized and consummated the transaction to dispose of our investment in Bankhaus Oswald Kruber GmbH & Co. KG (BOK), our wholly owned German banking subsidiary acquired in 2004. We report the operating results of BOK as discontinued operations in our consolidated financial statements.
Separation of Ocwen Solutions. We completed the Separation on August 10, 2009.
On November 12, 2008, our Board of Directors authorized management to pursue the Separation, through a tax-free spin-off into a newly formed publicly-traded company, of all of our business operations previously included within the OS line of business except for BMS Holdings and GSS.
We made our decision based upon a strategic analysis that concluded that the Separation would:
|
|
|
|
|
|
l |
Allow each of Ocwen and Altisource to separately focus on their core business and be better able to respond to initiatives and market challenges; |
|
|
|
|
|
|
l |
Better position OS to pursue business opportunities with other servicers; |
|
|
|
|
|
|
l |
Provide OS the option of offering its stock as consideration to potential acquisition targets (subject to certain limitations); |
|
|
|
|
|
|
l |
Grant OS flexibility in creating its own capital structure which may include a subsequent raise of equity or debt; and |
|
|
|
|
|
|
l |
Allow potential investors to choose between the contrasting business models of knowledge processing or servicing, each of which may be valued differently by the equity markets. |
On August 10, 2009, the shares of Altisource were distributed to the Ocwen shareholders and Convertible Notes holders of record as of August 4, 2009, in the form of a pro rata stock distribution. OCN shareholders received a tax-free pro rata distribution of one share of Altisource common stock for every three shares of OCN common stock held and received cash in lieu of fractional shares. Each convertible noteholder participated in the distribution of Altisource shares, without converting the notes, by applying the distribution ratio to the conversion ratio of the convertible notes. Accordingly, upon the separation of Altisource and Ocwen, there was no adjustment to the conversion ratio of the Convertible Notes.
Because of the Separation and related transactions, Ocwen incurred income taxes to the extent that the fair market value of Altisource assets exceeded Ocwen’s tax basis in such assets in accordance with Section 367 of the Internal Revenue Code. Ocwen recognized $52,047 of income tax expense, of which $25,649 is current expense and $26,398 is deferred expense.
Altisource’s largest customer will initially be Ocwen, and Altisource entered into long-term services contracts with Ocwen for terms of up to eight years. There are other arrangements between Altisource and Ocwen that will continue following the Separation to govern certain ongoing relationships and to provide for an orderly transition to the status of two independent companies. Under these agreements, Altisource and Ocwen both provide and receive certain corporate services at prevailing market rates.
Although Altisource is a separate company from Ocwen as a result of the Separation, Altisource and Ocwen have the same Chairman of the Board, William C. Erbey. Mr. Erbey is also the current Chief Executive Officer of Ocwen. As a result, he has obligations to Ocwen as well as to Altisource. Mr. Erbey currently owns approximately 18% of the common stock of Ocwen and approximately 26% of the common stock of Altisource.
3
CORPORATE STRATEGY AND OUTLOOK
Overview
Ocwen is among the leaders in our industry in realizing loan values for investors and in keeping Americans in their homes, as evidenced by our high cure rate. Our primary goal is to make our clients’ loans worth more by leveraging our superior processes and innovative technology.
Our competitive strengths are:
|
|
|
|
|
|
• |
Lowest Cost Provider. We believe OLS has the lowest operating cost in the sub-prime mortgage servicing industry. Based on average industry cost information provided by a third party valuation consultant, OLS’ net cost to service a non-performing loan was 60% lower than the average net cost for the subprime industry as of November 30, 2009. |
|
|
|
|
|
|
• |
Superior Loss Mitigation and Cash Management. Two recent independent studies comparing servicer performance in servicing non-performing residential loans confirmed that we lead the industry in realizing cash flows for investors and keeping families in their homes. In July 2009, Bank of America/Merrill Lynch found that we have the highest “roll rate from 90+ days delinquent to current” for both subprime fixed and adjustable rate loans. Similarly, in the most recent study of its kind, a 2008 Credit Suisse study measuring the percentage of greater than 90 days delinquent loans that made at least two payments in a three-month period showed that Ocwen significantly outperformed its competitors. According to the Credit Suisse study, Ocwen achieved at least two payments in a three-month period on almost 50% of greater than 90 days delinquent loans versus the nearest competitor’s just over 30%. We believe these studies, together with our selection by Freddie Mac as a special servicer, demonstrate our capability to work effectively with delinquent borrowers and generate greater cash flows than any other servicer. This success in returning loans to performing status enables us to decrease our need for advances that, in turn, reduces our interest expense. |
|
|
|
|
|
|
• |
High Barriers to Entry. Our servicing platform runs on a proprietary information technology system developed over a 20-year period at a cost of more than $140,000. We license this technology from Altisource under long-term agreements. These licensed tools are augmented by a feedback loop that provides updated information on the latest servicing and property valuation data gathered by Ocwen and its affiliates. Currently, Altisource employs over 270 software developers focused on identifying additional opportunities to automate manual processes, to eliminate variability and to increase the quality and timeliness of decision-making processes and information transfers. |
|
|
|
|
|
|
• |
Scalability and Flexibility. With our highly automated, artificial intelligence driven technology platforms, we can quickly scale our servicing platform to handle acquired loan portfolios with modest additions to infrastructure. |
We plan to leverage our competitive strengths to help us achieve our long-term goals for sustainable growth in revenue, after-tax return on equity and earnings per share. We intend to realize these goals by extending our lead as the lowest cost provider, raising the already high quality of servicing that we deliver and developing a predictable and on-going flow of fee income for our servicing business.
Strategic Priorities
During 2009, we focused on three key initiatives to reinforce our competitive strengths: liquidity and balance sheet strength; revenue opportunities; and quality and cost structure leadership. Our success in these three initiatives led to our strategic priorities for 2010 and beyond:
|
|
|
|
|
|
1. |
Establish predictable and sustainable revenue growth in our servicing operations |
|
|
2. |
Improve process efficiencies to continuously reduce costs |
|
|
3. |
Improve quality |
|
|
4. |
Reduce asset intensity |
These priorities support our long-term goals for return on equity and earnings per share growth.
As for sustainable revenue growth, we have a three-pronged approach:
|
|
|
|
|
|
1. |
Acquisition of Existing Servicing Platforms. We are evaluating four servicing acquisitions, two of which, totaling $35 billion in unpaid principal balance (UPB), are nearing final decisions. |
4
|
|
|
|
|
|
2. |
Special Servicing Opportunities. We continue to pursue opportunities with government-sponsored entities to grow our special servicing portfolio. In February 2009, we were selected as a special servicer of non-performing loans for Freddie Mac under a high-risk-loan pilot program. On August 10, 2009, we entered into an Interim Servicing Master Agreement under which we provide mortgage loan servicing with respect to approximately 24,000 non-performing single family mortgage loans backed by Freddie Mac with an aggregate UPB of approximately $4.4 billion. We added approximately 5,400 additional loans with an aggregate UPB of approximately $1.6 billion through December 31, 2009. Through February 2010, we added approximately 5,700 additional loans with an aggregate UPB of approximately $1.1 billion. As with subservicing, special servicing requires limited capital, reducing asset intensity and increasing return on equity. |
|
|
|
|
|
|
3. |
Flow Servicing. Our goal is to develop flow FHA servicing. The economics of FHA servicing closely match our existing business model than does Fannie or Freddie performing servicing which is very dependent upon a low cost of capital. FHA servicing requires intensive servicing and trades for a lower multiple of servicing fees. |
The latter three 2010 priorities:
|
|
|
|
|
|
l |
improve process efficiencies to reduce costs; |
|
|
|
|
|
|
l |
improve quality; and |
|
|
|
|
|
|
l |
reduce asset intensity; |
are interrelated, reflecting our belief that continual process improvement leads to higher quality and lower cost, both operational and financial.
Our primary lever to accomplish these priorities continues to be to resolve more loans faster. We will focus our resources on first call resolution and self-serve applications. Customers are far happier when their issues are resolved in a single interaction. Furthermore, a growing portion of our customers would prefer to self-serve, particularly if they can choose the timing, and it results in a satisfactory outcome. By resolving more loans faster, we improve quality as perceived by our customers, reduce the level of advances (i.e., reduce asset intensity) and reduce costs.
OPERATING SEGMENTS
Our current and former business segments, aligned within the two lines of business, are as follows:
|
|
|
|
|
|
|
|
|
Ocwen Asset Management |
|
|
Ocwen Solutions |
|
|
|
|
|
|
||
|
|
|
||||
|
Servicing |
Mortgage Services |
||||
|
Loans and Residuals |
Financial Services |
||||
|
Asset Management Vehicles (AMV) |
Technology Products |
||||
In addition to our core residential servicing business, Ocwen Asset Management (OAM) includes our equity investments in asset management vehicles and our remaining investments in subprime loans and residual securities.
With the exception of our interests in BMS Holdings and GSS, we distributed the assets, liabilities and operations of the Ocwen Solutions (OS) line of business. Prior to August 10, 2009, OS included our former unsecured collections business, our former residential fee-based loan processing businesses, our former technology platforms, our equity investment in BMS Holdings and the results of our international commercial loan servicing business conducted through GSS.
5
Segment Results and Assets as of and for the years ended December 31:
|
|
|
|
|
|
|
|
|
|
|
|
|
|
|
|
|
|
|
|
|
|
|
|
2009 |
|
2008 |
|
2007 |
|
||||||||||||
|
|
|
|
|
||||||||||||||||
|
Segment |
|
$ |
|
% |
|
$ |
|
% |
|
$ |
|
% |
|
||||||
|
|
|
|
|
|
|
||||||||||||||
|
External Revenues |
|
|
|
|
|
|
|
|
|
|
|
|
|
|
|
|
|
|
|
|
Servicing |
|
$ |
271,561 |
|
|
71.3 |
% |
$ |
339,278 |
|
|
69.0 |
% |
$ |
342,889 |
|
|
71.3 |
% |
|
Loans and Residuals |
|
|
— |
|
|
— |
|
|
— |
|
|
— |
|
|
353 |
|
|
0.1 |
|
|
Asset Management Vehicles |
|
|
1,381 |
|
|
0.4 |
|
|
2,751 |
|
|
0.6 |
|
|
1,444 |
|
|
0.3 |
|
|
Mortgage Services |
|
|
54,052 |
|
|
14.2 |
|
|
58,706 |
|
|
11.9 |
|
|
73,657 |
|
|
15.3 |
|
|
Financial Services |
|
|
40,293 |
|
|
10.6 |
|
|
73,835 |
|
|
15.0 |
|
|
41,292 |
|
|
8.6 |
|
|
Technology Products |
|
|
12,375 |
|
|
3.2 |
|
|
17,402 |
|
|
3.5 |
|
|
19,864 |
|
|
4.1 |
|
|
Corporate Items and Other |
|
|
1,066 |
|
|
0.3 |
|
|
156 |
|
|
— |
|
|
1,162 |
|
|
0.3 |
|
|
|
|
|
|
|
|
|
|
||||||||||||
|
Consolidated |
|
$ |
380,728 |
|
|
100.0 |
% |
$ |
492,128 |
|
|
100.0 |
% |
$ |
480,661 |
|
|
100.0 |
% |
|
|
|
|
|
|
|
|
|
||||||||||||
|
|
|
|
|
|
|
|
|
|
|
|
|
|
|
|
|
|
|
|
|
|
Income (Loss) from Continuing Operations before Income Taxes |
|
|
|
|
|
|
|
|
|
|
|
|
|
|
|
|
|
|
|
|
Servicing |
|
$ |
87,681 |
|
|
94.0 |
% |
$ |
100,770 |
|
|
325.2 |
% |
$ |
65,349 |
|
|
119.8 |
% |
|
Loans and Residuals |
|
|
(9,121 |
) |
|
(9.8 |
) |
|
(14,682 |
) |
|
(47.4 |
) |
|
(8,650 |
) |
|
(15.9 |
) |
|
Asset Management Vehicles |
|
|
(5,317 |
) |
|
(5.7 |
) |
|
(9,813 |
) |
|
(31.7 |
) |
|
(159 |
) |
|
(0.3 |
) |
|
Mortgage Services |
|
|
17,815 |
|
|
19.1 |
|
|
13,262 |
|
|
42.8 |
|
|
14,002 |
|
|
25.7 |
|
|
Financial Services |
|
|
(5,969 |
) |
|
(6.4 |
) |
|
(7,875 |
) |
|
(25.4 |
) |
|
(7,087 |
) |
|
(13.0 |
) |
|
Technology Products |
|
|
9,590 |
|
|
10.3 |
|
|
3,580 |
|
|
11.6 |
|
|
8,968 |
|
|
16.4 |
|
|
Corporate Items and Other |
|
|
(1,418 |
) |
|
(1.5 |
) |
|
(54,260 |
) |
|
(175.1 |
) |
|
(17,869 |
) |
|
(32.7 |
) |
|
|
|
|
|
|
|
|
|
||||||||||||
|
Consolidated |
|
$ |
93,261 |
|
|
100.0 |
% |
$ |
30,982 |
|
|
100.0 |
% |
$ |
54,554 |
|
|
100.0 |
% |
|
|
|
|
|
|
|
|
|
||||||||||||
|
|
|
|
|
|
|
|
|
|
|
|
|
|
|
|
|
|
|
|
|
|
Total Assets |
|
|
|
|
|
|
|
|
|
|
|
|
|
|
|
|
|
|
|
|
Servicing |
|
$ |
1,191,212 |
|
|
67.3 |
% |
$ |
1,416,615 |
|
|
63.3 |
% |
$ |
1,710,947 |
|
|
71.5 |
% |
|
Loans and Residuals |
|
|
48,690 |
|
|
2.8 |
|
|
67,317 |
|
|
3.0 |
|
|
102,398 |
|
|
4.3 |
|
|
Asset Management Vehicles |
|
|
15,271 |
|
|
0.9 |
|
|
26,755 |
|
|
1.2 |
|
|
74,242 |
|
|
3.1 |
|
|
Mortgage Services |
|
|
— |
|
|
— |
|
|
3,558 |
|
|
0.2 |
|
|
24,149 |
|
|
1.0 |
|
|
Financial Services |
|
|
— |
|
|
— |
|
|
58,707 |
|
|
2.6 |
|
|
67,149 |
|
|
2.8 |
|
|
Technology Products |
|
|
— |
|
|
— |
|
|
8,906 |
|
|
0.4 |
|
|
17,885 |
|
|
0.8 |
|
|
Corporate Items and Other |
|
|
514,177 |
|
|
29.0 |
|
|
664,962 |
|
|
29.7 |
|
|
404,122 |
|
|
16.9 |
|
|
Corporate Eliminations |
|
|
— |
|
|
— |
|
|
(9,720 |
) |
|
(0.4 |
) |
|
(8,968 |
) |
|
(0.4 |
) |
|
|
|
|
|
|
|
|
|
||||||||||||
|
Consolidated |
|
$ |
1,769,350 |
|
|
100.0 |
% |
$ |
2,237,100 |
|
|
100.0 |
% |
$ |
2,391,924 |
|
|
100.0 |
% |
|
|
|
|
|
|
|
|
|
||||||||||||
See “Management’s Discussion and Analysis of Financial Condition and Results of Operations—Segments” and Note 29 to the Consolidated Financial Statements for additional financial information regarding each of our segments.
Servicing
We earn fees for providing services to owners of mortgage loans and foreclosed real estate. In most cases, we provide these services either because we purchased the mortgage servicing right (MSR) from the owner of the mortgage or because we entered into a subservicing or special servicing agreement with the entity that owns the MSR.
We are one of the largest servicers of subprime residential mortgage loans. As of December 31, 2009, we serviced 351,595 loans and real estate properties with an aggregate UPB of $49,980,077 under 547 servicing agreements for over 33 clients. These clients include firms such as Deutsche Bank, Credit Suisse and Goldman Sachs. The mortgaged properties securing the loans that we service are geographically dispersed throughout all 50 states, the District of Columbia and two U.S. territories. The five largest concentrations of properties are located in California, Florida, New York, Texas and Illinois which, taken together, comprise 40% of the loans serviced at December 31, 2009. California has the largest concentration with 38,008 loans or 11% of the total.
Subprime mortgage loan servicing involves special loss mitigation challenges not usually present in prime loan servicing. Over a period of years, we have developed proprietary best practices for reducing loan losses, and we continue to refine and enhance these practices to meet the challenges posed by the current market. Our proactive measures help borrowers who become delinquent begin paying again on their loans and avoid foreclosure. In the current environment, loan modifications often provide a better outcome for loan investors than foreclosures or forbearance plans. We pride ourselves on keeping more borrowers in their homes than other servicers and avoiding foreclosure. This is a “win-win” situation for both the investors and the borrowers that we serve.
6
Our largest source of revenue is servicing fees. Most purchased MSRs entitle us generally to earn an annual fee of up to 50 basis points of average UPB of the loans serviced. Under subservicing arrangements, where we do not pay for the MSR, we generally earn an annual fee of between 5 and 45 basis points of the average UPB. As a result, our revenue is a function of UPB and the number of delinquent loans that resolve either through borrower payments, modifications (HAMP and non-HAMP) or through a sale of the underlying mortgaged property following foreclosure (Real Estate Owned or REO).
These fees are supplemented by ancillary income, including late fees from borrowers who are delinquent in remitting their monthly mortgage payments, Speedpay® fees from borrowers who pay by telephone or through the Internet and interest earned on loan payments that we have collected but have not yet remitted to the owner of the mortgage (float earnings).
Loan Resolution (Modification and REO Sales). The importance of loan resolution is heightened by our revenue recognition policies. We do not recognize delinquent servicing fees or late fees until cash is collected. The following loan modification scenarios describe the timing of our revenue recognition. The following amounts, which are not presented in thousands, are illustrative and can fluctuate:
|
|
|
|
|
|
1. |
When a loan becomes current via our non-HAMP modification process, we earn $500 of deferred servicing fees and $500 of late fees. |
|
|
2. |
When a loan becomes current via our HAMP modification process we earn $500 on deferred servicing fees, forfeit $500 of late fees and accrue $1,000 in HAMP success fees, or $1,500 if the loan was in imminent risk of default. However, if the loan is in imminent risk of default there will be no deferred servicing fees. |
Loan modification activities are a pipeline leading to modification of the loan or to foreclosure and sale of the resulting REO. The following process describes our modification pipeline:
|
|
|
|
|
|
1. |
First, the loan and borrower are evaluated for HAMP eligibility. If HAMP criteria are met, HAMP documentation and trial offer phases proceed. The three most common reasons for failure to qualify for HAMP are inability to meet the debt to income (DTI) ratio, inadequate documentation or inadequate or inconsistent income. |
|
|
2. |
If the criteria to qualify for HAMP are not met, the loan and borrower are evaluated utilizing non-HAMP criteria that are more flexible and focus on the borrower’s ability to pay and on maximizing net present value for investors. If the criteria are met, non-HAMP documentation and trial offer phases proceed. |
|
|
3. |
If the loan and borrower qualify for neither a HAMP nor a non-HAMP modification, liquidation proceeds via either a short sale or foreclosure and REO sale. |
The majority of loans that we modify are delinquent although we do modify some performing loans proactively under the American Securitization Forum guidelines. The most common term modified is the interest rate. Some modifications also involve the forgiveness or rescheduling of delinquent principal and interest. To select the best resolution option for a delinquent loan, we perform a structured analysis of all options using information provided by the borrower as well as external data. We use recent broker price opinions to value the property. We then determine the option with the highest net present value for the loan investor.
The number of completed modifications correlates with the number of trial offers made to borrowers in the prior quarter. Active trial modifications represent an inventory of potential completed modifications in the following quarter. The 6,937 active trial modifications in the third quarter of 2009 contributed approximately half of the completed modifications in the fourth quarter of 2009 with the remainder coming from non-HAMP modifications initiated and completed in the fourth quarter.
Advance Obligation. As a servicer or subservicer, we have a variety of contractual obligations including the obligation to service the mortgages according to certain standards and to advance funds to securitization trusts in the event that borrowers are delinquent on their monthly mortgage payments. When a borrower becomes delinquent, we “advance” cash to the REMIC Trustees on the scheduled remittance date thus creating a receivable due us from the REMIC Trust. We advance principal and interest (P&I Advances), taxes and insurance (T&I Advances) and legal fees, maintenance and preservation costs on properties that have already been foreclosed (Corporate Advances). If we determine that our P&I Advances cannot be recovered from the projected proceeds, we generally have the right to cease making P&I advances, declare advances in excess of net proceeds to be non-recoverable and, in most cases, immediately recover any excess advances from the general collections accounts of the respective REMIC Trustee. With T&I Advances and Corporate Advances, we continue to advance if net proceeds exceed projected future advances without regard to advances already made. Most of our advances have the highest standing and are “top of the waterfall” so that we are entitled to repayment from loan proceeds before any interest or principal is paid on the bonds, and in the majority of cases, advances in excess of loan proceeds may be recovered from pool level proceeds. The costs incurred in meeting these obligations include, but are not limited to, the interest expense incurred to finance the servicing advances.
7
Significant Variables. The key variables that significantly affect operating results in the Servicing segment are aggregate UPB, delinquencies and prepayment speed.
Aggregate Unpaid Principal Balance (UPB). Aggregate UPB is a key revenue driver. As noted earlier, servicing fees are a percentage of UPB, and growth in the portfolio means growth in servicing fees. Additionally, a larger servicing portfolio generates increased ancillary fees and leads to larger custodial balances generating greater float income. A larger servicing portfolio also increases expenses although, generally, less rapidly than the growth in UPB. To the extent that we grow UPB through the purchase of MSRs, our amortization of MSRs will generally increase with our servicing revenues. We will also incur additional interest expense to finance servicing advances, and our compensating interest expense will generally increase as the size of our portfolio increases.
Delinquencies. Delinquencies also have a significant impact on our results of operations. Non-performing loans are more expensive to service than performing loans because our cost of servicing is higher and, although collectability is generally not a concern, advances to our investors increase which results in higher financing costs. Performing loans include those loans that are current or have been delinquent for less than 90 days in accordance with their original terms and those loans for which borrowers are making scheduled payments under loan modifications, forbearance plans or bankruptcy plans. We consider all other loans to be non-performing.
When borrowers are delinquent, the amount of funds that we are required to advance to the investors on behalf of the borrowers increases. While the collectibility of advances generally is not an issue, we do incur significant costs to finance those advances. We utilize both securitization, (i.e., match funded liabilities) and revolving credit facilities to finance our advances. As a result, increased delinquencies result in increased interest expense.
In addition, the cost of servicing non-performing loans is higher than the cost of servicing performing loans primarily because the loss mitigation techniques that we employ to keep borrowers in their homes are more costly than the techniques used in handling a performing loan. When loans are performing, we have limited interaction with the borrowers, and relatively low-cost customer service personnel conduct most of those interactions. Once a loan becomes delinquent, however, we must employ our loss mitigation capabilities to work with the borrower to return the loan to performing status. These procedures involve increased contact with the borrower and the development of forbearance plans or loan modifications by highly skilled consultants who command higher compensation. This increase in operating expenses should be somewhat offset by increased late fees for loans that become delinquent but do not enter the foreclosure process.
Prepayment Speed. The rate at which the UPB for a pool or pools of loans declines has a significant impact on our business. Items reducing UPB include normal principal and interest payments, refinancing, voluntary property sales and involuntary property sales such as foreclosures. Prepayment speed impacts future servicing fees, amortization of servicing rights, float income, interest expense on advances and compensating interest expense. When prepayment speeds increase, our servicing fees decrease faster, which results in a shorter amortization period and higher amortization expense, since servicing rights are amortized in proportion to total expected income over the life of a portfolio. The converse is true when prepayment speeds decrease.
Prepayment speeds affect our float balances and float income as decreased prepayment speeds lead to lower float balances and lower float income due to lower invested balances. Lower prepayments have been associated with higher delinquency rates, higher advances balances and interest expense, but lower compensating interest expense. Compensating interest expense represents the difference between the full month of interest that we are required to remit to the REMIC Trustee in the month that a loan pays off and the amount of interest that we actually collect from the borrower for that month, and is included in “Servicing and origination expenses” in our consolidated statements of operations.
Third-Party Servicer Ratings. The U.S. Department of Housing and Urban Development, Freddie Mac and Fannie Mae have approved OLS as a loan servicer. Standard & Poor’s Rating Services (Standard & Poor’s) has rated OLS “Strong” as a Residential Subprime Servicer and Residential Special Servicer. “Strong” represents Standard & Poor’s highest ratings category. Moody’s Investors Services, Inc. (Moody’s) has rated OLS “SQ2–” as a Residential Subprime Servicer and “SQ2” as a Residential Special Servicer. “SQ2” represents Moody’s second highest rating category. Fitch Ratings (Fitch) has rated OLS “RPS2” for Residential Subprime Servicing and “RSS2” for Residential Special Servicing. These represent Fitch’s second highest categories.
8
Loans and Residuals
Our Loans and Residuals segment consists of two components:
Trading and investing activities. During 2007, we de-emphasized our whole loan purchase and securitization activities. Long-term, the key driver of our results is the performance of our assets. The default risk associated with our loans held for resale and with the loans underlying our mortgage backed securities and the success of our loan modification initiatives are particularly important to asset performance.
Subprime originations. In January 2007, we decided to close our subprime loan origination operation and no longer originate loans. Our loan origination operation included the results of Funding America, LLC (Funding America) which we began to include in our consolidated financial statements as of December 31, 2005. Our decision to discontinue the subprime loan origination component included closing Funding America.
Asset Management Vehicles
In 2007, we began developing asset management vehicles that benefit from our servicing and loss mitigation capabilities. These entities provide us with a source of servicing. By involving third parties in the funding of these entities, we are able to realize a greater benefit from our capabilities than would be possible if we were to engage in these ventures using only our own financial resources.
Ocwen Structured Investments, LLC (OSI). To date we have invested $37,500 in OSI. Our commitment to invest up to an additional $37,500 in OSI expired on September 18, 2008. OSI began operations during the second quarter of 2007. Our ownership interest in OSI is 25%. OSI invests primarily in MSRs and the related lower tranches and residuals of residential mortgage-backed securities, the credit risk of which is partially mitigated by credit default swaps. Under agreements that we entered into with OSI, we are responsible for providing various management services and for subservicing the portfolio of loans underlying its MSRs. During 2009, we received distributions from OSI totaling $4,875 that represent return of capital.
Ocwen Nonperforming Loans, LLC (ONL). Our investments in ONL and its related entities represent approximately a 25% equity interest. To date we have invested a combined $37,623 in ONL and its related entities and have committed to invest up to an additional $33,840. This commitment expires on September 13, 2010. These entities invest in non-performing residential loans purchased at a discount and in foreclosed real estate. Under agreements that we have entered into with ONL and affiliates, we provide various management services and act as the servicer of the loans and foreclosed real estate. During 2009, we received distributions from ONL and related entities totaling $1,783 that represent return of capital.
Mortgage Services, Financial Services and Technology Products
Substantially all of the Mortgage Services, Financial Services and Technology Products operations were separated as of August 10, 2009 as part of the Separation of the Ocwen Solutions line of business, except for GSS and BMS which remain at Ocwen. As a separate, publicly traded company, Altisource Portfolio Solutions S.A. will file a Form 10-K with the SEC.
Corporate Items and Other
In Corporate Items and Other, we report business activities that are individually insignificant, items of revenue and expense not directly related to a business unit, interest income on short-term investments of cash and the related costs of financing these investments and certain other corporate expenses. Our corporate debt is also included in Corporate Items and Other. Insignificant business activities include our affordable housing investment activities, among others. We report the results of operations of BOK in the consolidated financial statements as discontinued operations.
SOURCES OF FUNDS
We meet our current need for funds through financings, such as match funded liabilities, lines of credit and other secured borrowings, through funds generated by operations, such as servicing fees (including float earnings and ancillary fees), through collections of advances that were not financed and through payments received on loans held for resale and trading securities. Our primary uses of funds are the funding of servicing advances, the payment of interest and operating expenses and the repayments of borrowings. We closely monitor our liquidity position and ongoing funding requirements, and we invest available funds in short-term investment grade securities.
Our ability to sustain and grow our Servicing business depends in part on our ability to maintain and expand sources of financing to fund servicing advances and to purchase new servicing rights. We finance most of our advances using variable and fixed rate match funded securitization facilities. From time to time, we also finance other assets with debt, as we believe to be appropriate.
9
Delinquency rates determine the amount of funds that we, as servicer, must advance to meet contractual requirements. Meeting the need to advance these funds requires readily available unused borrowing capacity. However, as noted earlier, we are generally obligated to advance funds only to the extent that we believe that the advances are recoverable. The risk of loss on advances is low because advances generally have priority over the securities that the securitization trust has issued.
See “Management’s Discussion and Analysis of Financial Condition and Results of Operations—Liquidity and Capital Resources” for additional financial information regarding our sources of funds.
COMPETITION
A discussion of competition as it relates to our primary businesses appears in Item 1A, “Risk Factors.”
SUBSIDIARIES
A list of our significant subsidiaries is set forth in Exhibit 21.0.
EMPLOYEES
As of December 31, 2009, we had 1,894 employees, of which 328 were resident in our U.S. facilities, 1,469 were resident in our India operations centers and 97 were based in other countries. We have developed our India operations centers over the past eight years.
In the U.S., our principal location as of December 31, 2009 included our headquarters in West Palm Beach, Florida, which had 241 employees. We had 87 employees at various other locations in the U.S.
Of our employees in India as of December 31, 2009, 778 were in the city of Bangalore and 691 were in the city of Mumbai. Our India workforce is deployed as follows:
|
|
|
|
|
|
• |
86% are in Servicing, |
|
|
• |
12% are in support functions, including Human Resources, Corporate Services, Accounting, Legal and Risk Management and |
|
|
• |
2% are in other business segments. |
REGULATION
Our business is subject to extensive regulation by federal, state and local governmental authorities including the Federal Trade Commission, the SEC and the state agencies that license our servicing and collection entities. We also must comply with a number of federal, state and local consumer protection laws including, among others, the Gramm-Leach-Bliley Act, the Fair Debt Collection Practices Act, the Real Estate Settlement Procedures Act, the Truth in Lending Act, the Fair Credit Reporting Act and the Homeowners Protection Act. These statutes apply to debt collection, foreclosure and claims handling, investment of and interest payments on escrow balances and escrow payment features, and they mandate certain disclosures and notices to borrowers. These requirements can and do change as statutes and regulations are enacted, promulgated or amended.
We are also subject to licensing and regulation as a mortgage service provider and/or debt collector in a number of states. We are subject to audits and examinations conducted by the states. From time to time, we receive requests from state and other agencies for records, documents and information regarding our policies, procedures and practices regarding our loan servicing and debt collection business activities. We incur significant ongoing costs to comply with governmental regulations.
Effective June 30, 2005, we voluntarily terminated our status as a federal savings bank, a process we refer to as “debanking.” Prior to returning our original thrift charter to the Office of Thrift Supervision (OTS), we operated as a federal savings bank, and OCN was a registered savings and loan holding company. Our primary regulatory authority was the OTS.
Following debanking, we continued the Bank’s non-depository businesses, including its residential mortgage servicing business, under OLS, a licensed mortgage servicer in all 50 states, the District of Columbia and two U.S. territories. We entered into various agreements to obtain the approval of our regulator, the OTS, for our debanking plan. We directly or indirectly received assignment of all of the assets, liabilities and business remaining after the consummation of the debanking transactions (the Assignment). We entered into an agreement (the Guaranty) in favor of the OTS and any holders of claims with respect to the liabilities we assumed in connection with the Assignment. The Guaranty contains affirmative covenants relating to the maintenance of a $5,000 cash collateral account, reporting requirements, transactions with affiliates, preservation of the existence of our subsidiaries and maintenance of not less than $35,000 of unencumbered assets.
10
The Guaranty also contains negative covenants that restrict our ability to (i) incur indebtedness if certain financial ratios are not achieved or if we fail to maintain a specified minimum net worth, (ii) enter into merger transactions or a sale of substantially all of our assets, (iii) sell, lease, transfer or otherwise dispose of our assets, or (iv) pay dividends or acquire our capital stock. We agreed not to declare or pay any dividends on or acquire any of our capital stock or other ownership interests or make any distributions or return of capital to our stockholders, partners or members, except for (i) such dividends or distributions that are payable only in OCN’s common stock or (ii) such declarations, dividends, acquisitions, distributions or returns of capital in cash or other property if we maintain a minimum net worth of $333,000 and rating of B2 from Moody’s and B- from S&P on our unsecured, non credit-enhanced debt and any such capital distributions do not exceed our consolidated net income for the year plus our retained earnings for the two preceding years.
The Guaranty will remain in effect until the later of (a) the sixth anniversary of the date on which our federal bank charter was cancelled or (b) the date on which we have paid in full (i) any obligations that arise out of certain assumed liabilities with respect to which a claim has been asserted on or prior to the sixth anniversary of the date on which our federal bank charter was cancelled and (ii) all other amounts payable by us under the Guaranty.
While we do not expect that compliance with the Guaranty will have a material adverse impact on our financial condition, results of operations or cash flows, if an event of default were to occur, we would be obligated to increase the cash collateral amount. Furthermore, the OTS and other beneficiaries of the Guaranty are entitled to initiate enforcement proceedings against us, which, in the case of the OTS, could result in monetary civil penalties.
There are a number of foreign regulations that are applicable to our operations in India including acts that govern licensing, employment, safety, taxes, insurance and the basic law which governs the creation, continuation and the winding up of companies as well as the relationships between the shareholders, the company, the public and the government. The Central Act is applicable to all of India while various state acts may be applicable to certain locations in India. Non-compliance with the laws and regulations of India could result in fines, penalties or sanctions to our operations. In addition, non-compliance could lead to loss of reputation and other penalties and prosecution.
AVAILABLE INFORMATION
Our annual report on Form 10-K, quarterly reports on Form 10-Q, current reports on Form 8-K and all amendments to those reports are made available free of charge through our website (http://www.ocwen.com) as soon as such material is electronically filed with or furnished to the SEC. The public may read or copy any materials we file with the SEC at the SEC’s Public Reference Room at 100 F Street, NE, Room 1580, Washington DC 20549. The public may obtain information on the operation of the Public Reference Room by calling the SEC at 1-800-SEC-0330. The SEC maintains an Internet site that contains reports, proxy and information statements and other information regarding issuers, including OCN, that file electronically with the SEC. The address of that site is www.sec.gov. We have also posted on our website, and have available in print upon request, the charters for our Audit Committee, Compensation Committee and Governance Committee, our Governance Guidelines and our Code of Ethics and Code of Ethics for Senior Financial Officers. Within the time period required by the SEC and the New York Stock Exchange, we will post on our website any amendment to or waiver of the Code of Ethics for Senior Financial Officers, as well as any amendment to the Code of Ethics or waiver thereto applicable to any executive officer or director. The information provided on our website is not part of this report and is therefore not incorporated herein by reference.
|
|
|
|
RISK FACTORS (Dollars in thousands, except share data or unless otherwise indicated) |
An investment in our common stock involves significant risks that are inherent to our business. We describe below the principal risks and uncertainties that management believes affect or could affect us. The risks and uncertainties described below are not the only ones facing us. Additional risks and uncertainties that management is not aware of or focused on or that management currently deems immaterial may also impair our business operations. You should carefully read and consider the risks and uncertainties described below together with all of the other information included or incorporated by reference in this report before you decide to invest in our common stock. If any of the following risks actually occur, our financial condition and results of operations could be materially and adversely affected. If this were to happen, the value of our common stock could significantly decline, and you could lose all or part of your investment.
Risks Related to the Company
Continued economic slowdown and/or continued deterioration of the housing market could increase delinquencies, defaults, foreclosures and advances. An increase in delinquencies, defaults and foreclosure rates could increase both operating expenses and interest expense on advances and could cause a reduction in income from, and the value of, our servicing portfolio as well as loans and subordinate and residual securities.
11
During any period in which the borrower is not making payments, we are required under most of our servicing agreements to advance our own funds to meet contractual principal and interest remittance requirements for investors, pay property taxes and insurance premiums and process foreclosures. We also advance funds to maintain, repair and market real estate properties on behalf of investors. Most of our advances have the highest standing and are “top of the waterfall” so that we are entitled to repayment from loan proceeds before any interest or principal is paid on the bonds, and in the majority of cases, advances in excess of loan proceeds may be recovered from pool level proceeds.
|
|
|
|
|
|
• |
Revenue. An increase in delinquencies may delay the timing of revenue recognition because we recognize servicing fees as earned which is generally upon collection. An increase in delinquencies also leads to lower float balances and float earnings. |
|
|
• |
Expenses. An increase in advances outstanding relative to the change in the size of the servicing portfolio can result in substantial strain on our financial resources. This occurs because excess growth of advances increases financing costs with no offsetting increase in revenue, thus reducing profitability. If we are unable to fund additional advances, we could breach the requirements of our servicing contracts. Such developments could result in our losing our servicing rights, which would have a substantial negative impact on our financial condition and results of operations and could trigger cross-defaults under our various credit agreements. |
|
|
• |
Valuation of MSRs. Apart from the risk of losing our servicing rights, defaults are involuntary prepayments resulting in a reduction in UPB. This may result in higher amortization and an impairment in the value of our MSRs such that revenue may decline and interest expense may increase. |
We may be unable to obtain sufficient capital to meet the financing requirements of our business. Our financing strategy includes the use of significant leverage. Accordingly, our ability to finance our operations and repay maturing obligations rests in large part on our ability to borrow money. Our ability to borrow money is affected by a variety of factors including:
|
|
|
|
|
|
• |
limitations imposed on us by existing lending and similar agreements that contain restrictive covenants that may limit our ability to raise additional debt; |
|
|
• |
the recent decline in liquidity in the credit markets due in part to the recent turmoil in the subprime mortgage market; |
|
|
• |
the strength of the lenders from whom we borrow; and |
|
|
• |
limitations on borrowing on advance facilities which is limited by the amount of eligible collateral pledged and may be less than the borrowing capacity of the facility. |
An event of default, a negative ratings action by a rating agency, the perception of financial weakness, an adverse action by a regulatory authority or a general deterioration in the economy that constricts the availability of credit may increase our cost of funds and make it difficult for us to renew existing credit facilities and obtain new lines of credit. We are currently exploring other methods of raising capital including bank financing, conduit financing or equity or debt offerings. We cannot predict whether any additional financing will be available at all or on acceptable terms.
Our advance facilities are revolving facilities, and in a typical monthly cycle, we repay up to one-third of the borrowings under these facilities from collections. During the remittance cycle, which starts in the middle of each month, we depend on our lenders to provide the cash necessary to make remittances to the Servicing investors where such new advances represent eligible collateral under our advance facilities. If one or more of these lenders were to fail, we may not have sufficient funds to meet our obligations.
A significant increase in prepayment speeds or delinquencies could adversely affect our financial results. Prepayment speed is a significant driver of our business. Prepayment speed is the measurement of how quickly borrowers pay down the UPB of their loans. Prepayment speeds have a significant impact on our revenues, our expenses and on the valuation of our MSRs as follows:
|
|
|
|
|
|
• |
Revenue. If prepayment speeds increase, our servicing fees will decline more rapidly because of the greater than expected decrease in the UPB on which those fees are based. The reduction in servicing fees would be somewhat offset by increased float earnings because the faster repayment of loans will result in higher balances in the custodial accounts that generate the float earnings. Conversely, decreases in prepayment speeds drive increased servicing fees and lead to lower float balances and float earnings. An increase in delinquencies may delay the timing of revenue recognition because we recognize servicing fees as earned which is generally upon collection. An increase in delinquencies also leads to lower float balances and float earnings and more borrowing and interest expense. |
12
|
|
|
|
|
|
• |
Expenses. Amortization of MSRs is our largest operating expense. Since we amortize servicing rights in proportion to total expected income over the life of a portfolio, an increase in prepayment speeds will lead to increased amortization expense as we revise downward our estimate of total expected income. Faster prepayment speeds would also result in higher compensating interest expense. Compensating interest expense represents the difference, in the month in which a loan is repaid, between the full month of interest that we are required to remit to the trust and the amount of interest that we actually collect from the borrower. Decreases in prepayment speeds lead to decreased amortization expense as the period over which we amortize MSRs is extended. Slower prepayment speeds also lead to lower compensating interest expense. |
|
|
|
|
|
|
• |
Valuation of MSRs. We base the price we pay for MSRs and the rate of amortization of those rights on, among other things, our projection of the cash flows from the related pool of mortgage loans. Our expectation of prepayment speeds is a significant assumption underlying those cash flow projections. If prepayment speeds were significantly greater than expected, the carrying value of our MSRs could exceed their estimated fair value. When the carrying value of MSRs exceeds their fair value, we are required to record an impairment charge which has a negative impact on our financial results. |
We may be unable to maintain the size of our servicing portfolio. With strong competition in our primary business segment, special servicing contracts and purchases of servicing portfolios may not be sufficient to maintain scale in the servicing business given the continued absence of new securitizations. The lack of subprime originations in 2008 and 2009 has had and may continue to have an adverse impact on our ability to maintain or expand our servicing portfolio. The market for new special servicing contracts, at present, remains relatively small. The strategy of purchasing servicing portfolios requires willing sellers and sufficient advance financing. As a result, we can provide no assurance that we will be able to acquire the servicing required to implement our strategy.
If we are unable to acquire substantial new servicing or subservicing business, our revenues may continue to decline as a result of the net runoff of the portfolio. As a result, we may be unable to sustain growth or even to maintain our current level of business. In determining the purchase price for servicing rights, management makes assumptions regarding the following:
|
|
|
|
|
|
|
|
|
• |
the rates of prepayment and repayment within the underlying pools of mortgage loans; |
|
• |
our cost to
service the loans; |
|
|
• |
projected rates of delinquencies and defaults; |
|
• |
amount of future servicing advances. |
|
|
• |
future interest rates; |
|
|
|
If these assumptions are inaccurate or the bases for the assumptions change, the price we pay to acquire servicing rights may prove to be too high. This could result in lower than expected profitability or a loss. To the degree that we purchase servicing rights in the future, our success is highly dependent upon accurate pricing of servicing rights.
We are subject to investment risks. We have, in some cases, retained subordinate and residual interests in connection with the securitization of our loans and have acquired other residual interests directly. In addition, we have invested in certain asset management vehicles that invest principally in the same classes of assets. The performance of these types of securities has, at times, been negatively impacted by higher than expected prepayment speeds and credit losses experienced on the mortgage loans collateralizing the securities. We remain subject to the risk of loss on our remaining securities primarily to the extent that actual credit losses exceed expected credit losses in the future.
We also have invested in loans that we hold for resale. We believe that we have established adequate valuation allowances for declines in fair values below the cost of these loans in accordance with GAAP. However, future increases to these valuation allowances may be necessary due to changes in economic conditions and the performance of these loans prior to their sale or securitization. Increases in our valuation allowance for declines in fair value below cost could adversely affect our results of operations.
We use estimates in determining the fair value of certain assets, such as MSRs, auction rate securities and residual securities. If our estimates prove to be incorrect, we may be required to write down the value of these assets which could adversely affect our earnings. We use internal financial models that use, wherever possible, market participant data to value our MSRs, auction rate securities and residual securities. These models are complex and use asset-specific collateral data and market inputs for interest and discount rates and liquidity dates. For residual securities, these valuation models consider the complex cash flow structure which may differ on each securitization.
13
Valuations are highly dependent upon the reasonableness of our assumptions and the predictability of the relationships that drive the results of the models. If prepayment speeds increase, more than estimated, loan loss levels are higher than anticipated or financial market illiquidity continues beyond our estimate, we may be required to write down the value of certain assets, which could adversely affect our earnings.
A downgrade in our servicer ratings could have an adverse effect on our business, financial condition or results of operations. Standard & Poor’s, Moody’s and Fitch rate us as a mortgage servicer. Our current favorable servicer ratings from these entities are important to the conduct of our loan servicing business. We can provide no assurance that these ratings would not be downgraded in the future. Any such downgrade could have an adverse effect on our business, financing activities, financial condition or results of operations.
Governmental and legal proceedings and related costs could adversely affect our financial results. An adverse judgment in various lawsuits, including purported class action lawsuits, could affect our financial condition and results of operations. We and certain of our affiliates have been named as defendants in a number of purported class action lawsuits challenging our residential loan servicing practices. At least one of our competitors has paid significant sums to settle lawsuits brought against it that raised claims similar to those raised in the lawsuits brought against us and our affiliates. Although we believe that we have meritorious legal and factual defenses to the lawsuits, we can provide no assurance that we will ultimately prevail. Litigation and other proceedings may require that we pay settlement costs, damages, penalties or other charges which could adversely affect our financial results. For more information about our legal proceedings, see “Legal Proceedings.”
The OTS and other beneficiaries of the Guaranty could initiate enforcement proceedings against us which, in the case of the OTS, could result in civil money penalties. Accordingly, there can be no assurance that any such events, were they to occur, would not have a material adverse effect on our financial condition, results of operations or cash flows.
The expanding body of federal, state and local regulation and/or the licensing of loan servicing, collections or other aspects of our business may increase the cost of compliance and the risks of noncompliance. As noted in “Regulation,” our business is subject to extensive regulation by federal, state and local governmental authorities and is subject to various laws and judicial and administrative decisions imposing requirements and restrictions on a substantial portion of our operations. The volume of new or modified laws and regulations has increased in recent years and, in addition, some individual municipalities have begun to enact laws that restrict loan servicing activities including delaying or preventing foreclosures or forcing the modification of certain mortgages. If our regulators impose new or more restrictive requirements, we may incur additional significant costs to comply with such requirements which could further adversely affect our results of operations or financial condition. In addition, our failure to comply with these laws and regulations could possibly lead to civil and criminal liability; loss of licensure; damage to our reputation in the industry; fines and penalties and litigation, including class action lawsuits; or administrative enforcement actions. Any of these outcomes could harm our results of operations or financial condition.
Future legislative changes and other actions and changes may adversely affect future incremental revenues. Under government programs such as the Home Affordable Modification Program (HAMP), a participating servicer may be entitled to receive financial incentives in connection with any modification plans it enters into with eligible borrowers and subsequent “pay for success” fees to the extent that a borrower remains current in any agreed upon loan modification. Changes in current legislative actions regarding such loan modification and refinance programs, future U.S. federal, state and/or local legislative or regulatory actions that result in the modification of outstanding mortgage loans, and changes in the requirements necessary to qualify for refinancing mortgage loans may impact the future extent to which we participate in and receive financial benefits from such programs and may have a material effect on our business. Additionally, the U.S. Congress and/or various states and local legislators may enact additional legislation or regulatory action designed to address the current economic crisis or for other purposes that could have an effect on the execution of our business strategies. To the extent we participate in the HAMP, there is no guarantee as to the continued expectation of future incremental revenues.
The Secure and Fair Enforcement for Mortgage Licensing Act of 2008 (the S.A.F.E. Act) requires the individual licensing and registration of those engaged in the business of a loan originator. The S.A.F.E. Act is designed to improve the accountability on the part of loan originators, combat fraud and enhance consumer protections by encouraging states to establish a national licensing system and minimum qualification requirements for applicants. The Department of Housing and Urban Development (HUD) is the federal agency charged with establishing and enforcing a licensing and registration system for states that fail to establish one that meets the minimum requirements of the S.A.F.E. Act. In a proposed rule published by HUD on December 15, 2009, HUD has proposed extending the licensing requirements for loan originators to servicing personnel that are performing modifications. The servicing industry has responded to this proposed rule by requesting HUD reconsider its position as the licensing costs and impact to the modification process will increase the cost of servicing. With comments due on the proposed rule on March 5, 2010, it is not known at this time whether HUD will change its position.
14
Our earnings may be inconsistent. Our past financial performance should not be considered a reliable indicator of future performance, and historical trends may not be reliable indicators of anticipated financial performance or trends in future periods.
The consistency of our operating results may be significantly affected by inter-period variations in our current operations including the amount of servicing rights acquired and the changes in realizable value of those assets due to, among other factors, increases or decreases in prepayment speeds.
Certain non-recurring gains and losses that have significantly affected our operating results may result in substantial inter-period variations in financial performance.
Our hedging strategies may not be successful in mitigating our risks associated with interest rate risk. At present, we have entered into two interest rate caps to fix our exposure to variable interest rates under two of our match funded securitizations. If we are successful in acquiring additional servicing or sub-servicing rights, there is no assurance that we will be able to obtain the fixed rate financing that would be necessary to protect us from rising interest rates. Therefore, we may consider utilizing various derivative financial instruments. Nevertheless, no hedging strategy can completely protect us. The derivative financial instruments that we select may not have the effect of reducing our interest rate risks. Poorly designed strategies, improperly executed and documented transactions or inaccurate assumptions could actually increase our risks and losses. In addition, hedging strategies involve transaction and other costs. We cannot be assured that our hedging strategies and the derivatives that we use will adequately offset the risks of interest rate volatility or that our hedging transactions will not result in or magnify losses.
We have significant operations in India that could be adversely affected by changes in the political or economic stability of India or by government policies in India or the U.S. Nearly 1,500 of our employees are located in India. A significant change in India’s economic liberalization and deregulation policies could adversely affect business and economic conditions in India generally and our business in particular. The political or regulatory climate in the U.S. or elsewhere also could change so that it would not be lawful or practical for us to use international operations centers. For example, changes in privacy regulations could require us to curtail our use of lower-cost operations in India to service our businesses. If we were to cease our operations in India and transfer these operations to another geographic area, we could incur increased overhead costs that could materially and adversely affect our results of operations.
We may need to increase the levels of our employee compensation more rapidly than in the past to retain talent. Unless we are able to continue to enhance the efficiency and productivity of our employees, wage increases in the long term may reduce our profitability.
Technology failures could damage our business operations and increase our costs. The financial services industry as a whole is characterized by rapidly changing technologies, and system disruptions and failures may interrupt or delay our ability to provide services to our customers. The secure transmission of confidential information over the Internet is essential to our maintaining consumer confidence in certain of our services. Security breaches, acts of vandalism and developments in computer capabilities could result in a compromise or breach of the technology that we use to protect our customers’ personal information and transaction data. Consumers generally are concerned with security breaches and privacy on the Internet, and Congress or individual states could enact new laws regulating the electronic commerce market that could adversely affect us.
The loss of the services of our senior managers could have an adverse effect on us. The experience of our senior managers is a valuable asset to us. Our chairman and chief executive officer, William C. Erbey, has been with us since our founding in 1987, and our president, Ronald M. Faris, joined us in 1991. Other senior managers have been with us for 10 years or more. We do not have employment agreements with, or maintain key man life insurance relating to, Mr. Erbey, Mr. Faris or any of our other executive officers. The loss of the services of our senior managers could have an adverse effect on us.
Our directors and executive officers collectively own a large percentage of our common shares and could influence or control matters requiring shareholder approval. Our directors and executive officers and their affiliates collectively own or control approximately 24% of our outstanding common shares. This includes approximately 18% owned or controlled by our chairman and chief executive officer, William C. Erbey, and approximately 6% owned or controlled by our director and former chairman, Barry N. Wish. As a result, these shareholders could influence or control virtually all matters requiring shareholder approval, including the amendment of our articles of incorporation, the approval of mergers or similar transactions and the election of all directors.
15
We are exposed to market risk, including, among other things, liquidity risk, prepayment risk and foreign currency exchange risk. We are exposed to liquidity risk primarily because of the high variable daily cash requirements to support our servicing business including the requirement to make advances pursuant to servicing contracts and the process of remitting borrower payments to the custodial accounts. In general, we finance our operations through operating cash flows and various other sources of funding including match funded agreements, secured lines of credit and repurchase agreements. We believe that we have adequate financing for the next twelve months. On April 30, 2009, we were successful in negotiating an extension of the term note secured by our auction rate securities to June 30, 2010. However, because of the failed auctions, the market for auction rate securities is not currently liquid. In the event we need to liquidate our investment, we may not be able to do so without a loss of capital.
We are exposed to interest rate risk to the degree that our interest-bearing liabilities mature or reprice at different speeds, or different bases, that our interest earning assets or when financed assets are not interest-bearing. Our servicing business is characterized by non-interest earning assets financed by interest bearing liabilities. Among the more significant non-interest earning assets are servicing advances and MSRs. At December 31, 2009, we had total advances and match funded advances of $968,529. We are also exposed to interest rate risk because a portion of our outstanding debt is variable rate. Rising interest rates may increase our interest expense. Nevertheless, earnings on float balances (assets) partially offset this variability. We have also entered into interest rate caps to hedge our exposure to rising interest rates.
We are exposed to foreign currency exchange rate risk in connection with our investment in non-U.S. dollar functional currency operations to the extent that our foreign exchange positions remain unhedged. Our operations in Canada, Uruguay and India expose us to foreign currency exchange rate risk, but we consider this risk to be insignificant.
The tax liability to Ocwen as a result of the Separation could be substantial. In the pre-spin-off restructuring, any assets that were transferred to Altisource or non-U.S. subsidiaries were taxable pursuant to Section 367(a) of the Code, or other applicable provisions of the Internal Revenue Code (the “Code”) and Treasury regulations. Taxable gains not recognized in the restructuring were generally recognized pursuant to the Separation itself under Section 367(b). The taxable gain recognized by Ocwen attributable to the transfer of assets to Altisource equaled the excess of the fair market value of each asset transferred over Ocwen’s basis in such asset. Ocwen’s basis in some assets transferred to Altisource may have been low or zero which could result in a substantial tax liability to Ocwen. In addition, the amount of taxable gain was based on a determination of the fair market value of Ocwen’s transferred assets. The determination of fair market values of non-publicly traded assets is subjective and could be subject to closing date adjustments or future challenge by the Internal Revenue Service (the “IRS”) which could result in an increased U.S. federal income tax liability to Ocwen.
Risks Relating to Ownership of Our Common Shares
Our common share price may experience substantial volatility which may affect your ability to sell our common shares at an advantageous price. The market price of our common shares has been and may continue to be volatile. For example, the closing market price of our common shares on the New York Stock Exchange has fluctuated during the twelve months ended December 31, 2009 between $8.37 per share and $14.30 per share and may continue to fluctuate. Therefore, the volatility may affect your ability to sell our common shares at an advantageous price. Market price fluctuations in our common shares may be due to acquisitions, dispositions, the Separation or other material public announcements along with a variety of additional factors including, without limitation, those set forth under “Risk Factors” and “Forward-Looking Statements.” In addition, the stock markets in general, including the New York Stock Exchange, recently have experienced extreme price and trading fluctuations. These fluctuations have resulted in volatility in the market prices of securities that often has been unrelated or disproportionate to changes in operating performance. These broad market fluctuations may adversely affect the market prices of our common shares.
There may be future sales or other dilution of our equity, which may adversely affect the market price of our common stock. We are not restricted from issuing additional shares of our common stock, including securities that are convertible into or exchangeable for, or that represent the right to receive, common stock.
We also have currently outstanding, as of December 31, 2009 $56,435 aggregate principal amount of 3.25% contingent convertible senior unsecured notes due 2024. We may issue additional shares of common stock in satisfaction of our make-whole obligations relating to our 3.25% contingent convertible senior unsecured notes due 2024. The issuance of additional shares of our common stock upon conversion of the 3.25% contingent convertible senior unsecured notes due 2024 or other issuances of our common stock or convertible or other equity linked securities, including options, and warrants, or otherwise, will dilute the ownership interest of our common stockholders.
16
Sales of a substantial number of shares of our common stock or other equity-related securities in the public market could depress the market price of our common stock and impair our ability to raise capital through the sale of additional equity securities. We cannot predict the effect that future sales of our common stock or other equity-related securities would have on the market price of our common stock.
There may be future sales or other dilution of our equity, which may adversely affect the market price of our common stock. We are not restricted from issuing additional shares of our common stock, including securities that are convertible into or exchangeable for, or that represent the right to receive, common stock.
Because of certain provisions of our organizational documents, takeovers may be more difficult possibly preventing you from obtaining an optimal share price. Our amended and restated articles of incorporation provide that the total number of shares of all classes of capital stock that we have authority to issue is 220 million, of which 200 million are common shares and 20 million are preferred shares. Our Board of Directors has the authority, without a vote of the shareholders, to establish the preferences and rights of any preferred or other class or series of shares to be issued and to issue such shares. The issuance of preferred shares could delay or prevent a change in control. Since our Board of Directors has the power to establish the preferences and rights of the preferred shares without a shareholder vote, our Board of Directors may give the holders of preferred shares preferences, powers and rights, including voting rights, senior to the rights of holders of our common shares.
Risks Relating to the Separation of Altisource
We could have conflicts with Altisource, and our Chief Executive Officer and Chairman of the Board, and other officers and directors, could have conflicts of interest due to their relationships with Ocwen and Altisource which may be resolved in a manner adverse to us. Conflicts may arise between Ocwen and Altisource as a result of our ongoing agreements and the nature of our respective businesses. Among other things, we became a party to a variety of agreements with Altisource in connection with the Separation, and we may enter into further agreements with Altisource after the Separation. Certain of our executive officers and directors may be subject to conflicts of interest with respect to such agreements and other matters due to their relationships with Altisource.
William C. Erbey, Ocwen’s Chief Executive Officer and Chairman of the Board, became Altisource’s non-executive Chairman of the Board as a result of the Separation. As a result, he has obligations to us as well as to Altisource and may potentially have conflicts of interest with respect to matters potentially or actually involving or affecting Ocwen and Altisource.
Mr. Erbey owns substantial amounts of Altisource common stock and stock options because of his relationships with Altisource. This ownership could create or appear to create potential conflicts of interest when our Chairman of the Board is faced with decisions that involve Ocwen, Altisource or any of their respective subsidiaries.
Matters that could give rise to conflicts between Ocwen and Altisource include, among other things:
|
|
|
|
|
|
• |
our ongoing and future relationships with Altisource, including related party agreements and other arrangements with respect to the administration of tax matters, employee benefits, indemnification and other matters; |
|
|
• |
the quality and pricing of services that Altisource has agreed to provide to us or that we have agreed to provide to Altisource and |
|
|
• |
any competitive actions by Altisource. |
We will also seek to manage these potential conflicts through dispute resolution and other provisions of our agreements with Altisource and through oversight by independent members of our Board of Directors. There can be no assurance that such measures will be effective, that we will be able to resolve all conflicts with Altisource or that the resolution of any such conflicts will be no less favorable to us than if we were dealing with a third party.
17
New prospective tax regulations, if held applicable to the Separation, could materially increase tax costs to Ocwen. On June 10, 2009, the IRS issued new regulations under Section 7874 of the Code. The IRS further indicated that it intends to issue additional regulations with respect to transactions where a U.S. corporation contributes assets, including subsidiary equity interests, to a foreign corporation and distributes the shares of such corporation, as in the Separation and the related transactions. Our understanding of the IRS’s plans regarding these forthcoming regulations is that they would apply to the Separation only if the value of assets held by Ocwen’s corporate or partnership subsidiary entities (either currently, or those that were distributed from such entities as part of the plan encompassing the Separation) exceeded, in the aggregate, 60% of the value of Altisource when contributed to Altisource. It is not certain, however, what these regulations will provide for once adopted. Prior to completing the Separation, Ocwen’s board of directors required Ocwen and Altisource to receive a valuation from an independent valuation firm that enabled the Company to determine whether the value of these assets was less than 60% of the value of Altisource. Because we believe the value of these assets does not exceed the 60% threshold, as we confirmed by information we derived from the independent valuation, we do not believe that Section 7874 of the Code applies to the Separation. The independent valuation is not binding on the IRS. If the IRS were to successfully challenge this valuation, and find that the value of these assets exceeded 60% of the value of Altisource, then Ocwen would not be permitted to offset gain recognized on the transfer of these assets to Altisource with net operating losses, tax credits or other tax attributes. This could materially increase the tax cost to Ocwen of the Separation.
We may not realize all of the anticipated benefits of potential future acquisitions. Our ability to realize the anticipated benefits of potential future acquisitions of assets and/or companies will depend, in part, on our ability to scale-up to appropriately service any such assets and/or integrate the businesses of such acquired companies with our business. The process of acquiring assets and/or companies may disrupt our business, and may not result in the full benefits expected. The risks associated with acquisitions include, among others:
|
|
|
|
|
|
|
|
• |
coordinating market functions; |
|
|
|
• |
unanticipated issues in integrating information, communications and other systems; |
|
|
|
• |
unanticipated incompatibility of purchasing, logistics, marketing and administration methods; |
|
|
|
• |
retaining key employees; and |
|
|
|
• |
the diversion of management’s attention from ongoing business concerns. |
There is no assurance that we will realize the full benefits anticipated for any future acquisitions, or that we will be able to consummate any future acquisitions. In order to finance potential future acquisitions, we may, among other alternatives, issue additional shares of our common stock or convertible or other equity linked securities, including options, and warrants, or otherwise, which will dilute the ownership interest of our common stockholders.
|
|
|
|
UNRESOLVED STAFF COMMENTS |
None.
18
|
|
|
|
PROPERTIES |
The following table sets forth information relating to our primary facilities at December 31, 2009:
|
|
|
|
|
|
|
|
Location |
|
Owned/Leased |
|
Square Footage |
|
|
|
|
|
|||
|
Executive office and headquarters: |
|
|
|
|
|
|
West Palm Beach, Florida |
|
Leased |
|
41,860 |
|
|
Document storage and imaging facility: |
|
|
|
|
|
|
Riviera Beach, Florida |
|
Leased |
|
30,000 |
|
|
|
|
|
|
|
|
|
Business operations and technology support offices: |
|
|
|
|
|
|
Bangalore, India |
|
Leased |
|
56,530 |
|
|
Mumbai, India |
|
Leased |
|
23,140 |
|
|
Montevideo, Uruguay |
|
Leased |
|
16,668 |
|
In addition to the facilities listed above, we also lease small offices in Atlanta, Georgia and Washington, D.C. We no longer occupy our former mortgage fulfillment center located in Lisle, Illinois and have sublet the space to a third party for the remaining term of the lease.
|
|
|
|
LEGAL PROCEEDINGS (Dollars in thousands) |
A description of material pending or recently settled legal proceedings to which OCN or its subsidiaries are a party follows:
We are named as a defendant in lawsuits brought in various federal and state courts challenging the Bank’s mortgage servicing practices, including charging improper or unnecessary fees, misapplying borrower payments, etc. In April 2004, our petition was granted to transfer and consolidate a number of lawsuits filed against the Bank, OCN and various third parties into a single proceeding pending in the United States District Court for the Northern District of Illinois (the MDL Proceeding). Additional lawsuits similar to the MDL proceeding have been brought in other courts, some of which may be transferred to and consolidated in the MDL Proceeding. The borrowers in many of these lawsuits seek class action certification. Others have brought individual actions. No class has been certified in the MDL Proceeding or any related lawsuits. In April 2005, the trial court entered a partial summary judgment in favor of defendants holding that plaintiffs’ signed loan contracts authorized the collection of certain fees by Ocwen as servicer for the related mortgages. In May 2006, plaintiffs filed an amended complaint containing various claims under several federal statutes, state deceptive trade practices statutes and common law. No specific amounts of damages are asserted, however, plaintiffs may amend the complaint to seek damages should the matter proceed to trial. In June 2007, the United States Court of Appeals for the Seventh Circuit issued an opinion holding that many of the claims were preempted or failed to satisfy the pleading requirements of the applicable rules of procedure and directing the trial judge to seek clarification from the plaintiffs so as to properly determine which particular claims are to be dismissed. In March 2009, the trial court struck the amended complaint in its entirety on the grounds of vagueness. Plaintiffs filed a third amended complaint on April 20, 2009. Ocwen has moved to dismiss the third amended complaint. The motion is fully briefed and pending decision by the trial court. We believe the allegations in the MDL Proceeding are without merit and will continue to vigorously defend against them.
In November 2004, a final judgment was entered in litigation brought by Cartel Asset Management, Inc. (Cartel) against OCN, the Bank and Ocwen Technology Xchange, Inc. (OTX), a subsidiary that has been dissolved. This matter involved allegations of misappropriation of trade secrets and contract-related claims brought by a former vendor. Initially, a jury verdict awarded damages of $9,320. However, the November 2004 judgment by the trial court awarded $520 against OTX and nominal damages of two dollars against the Bank. Additionally, the Bank was assessed a statutory award to Cartel for attorneys’ fees in an additional amount of $170. The Bank and OTX were further assessed costs in the amount of $9. In September 2007, the United States Court of Appeals for the Tenth Circuit upheld the damage award against OTX and remanded the case for a new trial on damages against the Bank. In December 2007, we paid the full amount of the judgment against OTX, including accrued interest. In March 2008, the trial court entered an order joining OLS, as the Bank’s successor-in-interest, and OCN, as guarantor of the Bank’s obligations, as additional defendants. The trial court has set a date of September 13, 2010 for the new trial against the Bank, OLS and OCN. We do not believe that Cartel is entitled to additional damages, if any, in an amount that would be material to our financial condition, results of operations or cash flows, and we intend to continue to vigorously defend against this matter.
19
In September 2006, the Bankruptcy Trustee in Chapter 7 proceedings involving American Business Financial Services, Inc. (ABFS) brought an action against multiple defendants, including OLS, in Bankruptcy Court. The action arises out of Debtor-in-Possession financing to ABFS by defendant Greenwich Capital Financial Products, Inc. and the subsequent purchases by OLS of MSRs and certain residual interests in mortgage-backed securities previously held by ABFS. OLS brought a separate action against the Trustee seeking damages of approximately $2,500 arising out of the ABFS MSRs purchase transaction. OLS’ separate action against the Trustee was dismissed by agreement without prejudice with the right to replead such claims or otherwise file a separate action should the Trustee’s action be dismissed. In February 2007, the court granted OLS’ motion to dismiss some claims but refused to dismiss others. The Trustee filed an amended complaint in March 2007. This complaint sets forth claims against all of the original defendants. The claims against OLS include turnover, fraudulent transfers, accounting, breach of fiduciary duty, aiding and abetting breach of fiduciary duty, breach of contract, fraud, civil conspiracy and conversion. The Trustee seeks compensatory damages in excess of $100,000 and punitive damages jointly and severally against all defendants. In March 2008, the court denied OLS’ motion to dismiss. In April 2008, OLS filed an answer denying all charges and a counterclaim for breach of contract, fraud, negligent misrepresentation and indemnification in connection with the MSR purchase transaction. Fact discovery is complete and both Ocwen and the Trustee have filed motions for partial summary judgment. We believe that the Trustee’s allegations against OLS are without merit and intend to continue to vigorously defend against this matter.
OCN commenced separate arbitrations before the Financial Industry Regulatory Authority against certain Broker/Dealers primarily alleging fraud, breach of duty and statutory violations arising out of the sale of AAA-rated student loan auction rate securities (SLARS) backed by the Federal Family Education Loan Program. In October 2009 and subsequently in early 2010, we settled these arbitration proceedings for cash proceeds.
OCN is subject to various other pending legal proceedings. In our opinion, the resolution of those proceedings will not have a material effect on our financial condition, results of operations or cash flows.
|
|
|
|
SUBMISSION OF MATTERS TO A VOTE OF SECURITY HOLDERS |
There were no matters submitted to a vote of stockholders during the quarter ended December 31, 2009.
|
|
|
|
MARKET FOR REGISTRANT’S COMMON EQUITY, RELATED STOCKHOLDER MATTERS AND ISSUER PURCHASES OF EQUITY SECURITIES |
Price Range of the Company’s Common Stock
The common stock of Ocwen Financial Corporation is traded under the symbol “OCN” on the New York Stock Exchange (NYSE). The following table sets forth the high and low closing sales prices for our common stock:
|
|
|
|
|
|
|
|
|
|
|
|
|
|
High |
|
Low |
|
||||
|
|
|
|
|
||||||
|
|
|
|
|
|
|
|
|
|
|
|
2009 |
|
|
|
|
|
|
|
|
|
|
First quarter |
|
$ |
12.02 |
|
|
$ |
8.37 |
|
|
|
Second quarter |
|
|
13.30 |
|
|
|
10.80 |
|
|
|
Third quarter |
|
|
14.30 |
|
|
|
9.02 |
|
|
|
Fourth quarter |
|
|
11.95 |
|
|
|
9.05 |
|
|
|
|
|
|
|
|
|
|
|
|
|
|
2008 |
|
|
|
|
|
|
|
|
|
|
First quarter |
|
$ |
6.53 |
|
|
$ |
3.98 |
|
|
|
Second quarter |
|
|
7.04 |
|
|
|
3.69 |
|
|
|
Third quarter |
|
|
8.05 |
|
|
|
4.52 |
|
|
|
Fourth quarter |
|
|
9.18 |
|
|
|
5.49 |
|
|
The closing sales price of our common stock on February 26, 2010, was $10.81.
We do not currently pay cash dividends on our common stock and have no current plans to do so in the future. The timing and amount of future dividends, if any, will be determined by our Board of Directors and will depend, among other factors, upon our earnings, financial condition, cash requirements, the capital requirements of subsidiaries and investment opportunities at the time any such payment is considered. In addition, the Guaranty agreement with the OTS and the indentures and covenants relating to certain of our borrowings contain limitations on our payment of dividends. See Note 31 to the Consolidated Financial Statements for additional information regarding limitations on the payment of dividends on our common stock.
20
The following graph compares the cumulative total return on the common stock of Ocwen Financial Corporation, exclusive of the significant value distributed to Ocwen investors in the form of Altisource common equity, since December 31, 2004, with the cumulative total return on the stocks included in Standard & Poor’s 500 Market Index and Standard & Poor’s Diversified Financials Market Index.
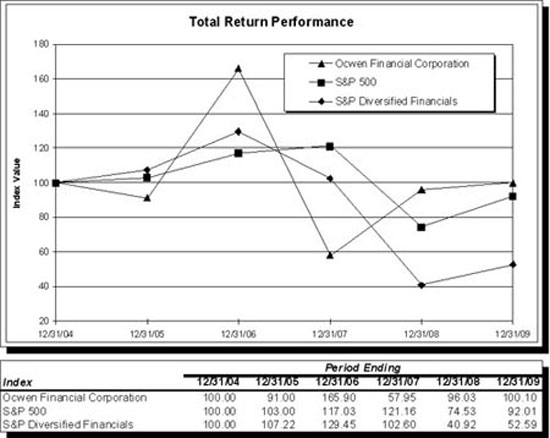
Purchases of Equity Securities by the Issuer and Affiliates
We did not purchase any shares of our own common stock during the fourth quarter of 2009.
Our ability to repurchase shares of our common stock is restricted under the terms of the Guaranty that we entered into with the OTS in connection with debanking. See Notes 21 and 31 to the Consolidated Financial Statements for additional information regarding common stock repurchases in prior periods and limitations on the repurchase of our common stock, respectively.
Number of Holders of Common Stock
At February 26, 2010, 99,958,162 shares of our common stock were outstanding and held by approximately 132 holders of record. Such number of stockholders does not reflect the number of individuals or institutional investors holding our stock in nominee name through banks, brokerage firms and others.
21
Securities authorized for issuance under equity compensation plans
The information required by this item with respect to securities authorized for issuance under equity compensation plans is incorporated by reference from the section entitled “Security Ownership Of Certain Beneficial Owners And Related Shareholder Matters—Equity Compensation Plan Information” in our definitive Proxy Statement with respect to our Annual Meeting of Shareholders to be held on May 6, 2010 and as filed with the SEC on or about March 30, 2010 (the 2010 Proxy Statement).
22
|
|
|
|
SELECTED FINANCIAL DATA (Dollars in thousands, except share data) |
The following tables present selected consolidated financial information of Ocwen and its subsidiaries at the dates and for the years indicated. Our historical balance sheet and operations data at and for the five years ended December 31, 2009 have been derived from our audited financial statements. As a result of the Separation, we eliminated the assets and liabilities of Altisource from our consolidated balance sheet effective at the close of business on August 9, 2009. Beginning August 10, 2009, the operating results of Altisource are no longer included in our operating results. We do not report the historical operating results of Altisource as a discontinued operation because of the significance of the continuing involvement between Altisource and Ocwen under long-term services agreements. Accordingly, for periods prior to August 10, 2009, the historical operating results of Altisource are included in continuing operations. We have reclassified certain amounts included in the prior years to conform to the 2009 presentation.
The selected consolidated financial information should be read in conjunction with the information we have provided in Management’s Discussion and Analysis of Financial Condition and Results of Operations, the Consolidated Financial Statements and the Notes to the Consolidated Financial Statements.
|
|
|
|
|
|
|
|
|
|
|
|
|
|
|
|
|
|
|
|
|
December 31, |
|
|||||||||||||
|
|
|
|
||||||||||||||
|
|
|
2009 |
|
2008 |
|
2007 |
|
2006 |
|
2005 |
|
|||||
|
|
|
|
|
|
|
|
||||||||||
|
Selected balance sheet data |
|
|
|
|
|
|
|
Adjusted (1) |
|
Adjusted (1) |
|
|||||
|
|
|
|
|
|
|
|
|
|
|
|
||||||
|
Cash |
|
$ |
90,919 |
|
$ |
201,025 |
|
$ |
114,243 |
|
$ |
236,581 |
|
$ |
269,611 |
|
|
Investment grade auction rate securities |
|
|
247,464 |
|
|
239,301 |
|
|
— |
|
|
— |
|
|
— |
|
|
Other investment grade securities |
|
|
— |
|
|
— |
|
|
34,876 |
|
|
74,986 |
|
|
1,685 |
|
|
Subordinate and residual securities |
|
|
3,692 |
|
|
4,369 |
|
|
7,362 |
|
|
65,242 |
|
|
30,277 |
|
|
Investment in certificates of deposit |
|
|
— |
|
|
— |
|
|
— |
|
|
72,733 |
|
|
— |
|
|
Loans held for resale, at lower of cost or fair value (2) |
|
|
33,197 |
|
|
49,918 |
|
|
75,240 |
|
|
99,064 |
|
|
624,671 |
|
|
Advances |
|
|
145,914 |
|
|
102,085 |
|
|
292,887 |
|
|
324,137 |
|
|
219,716 |
|
|
Match funded advances |
|
|
822,615 |
|
|
1,100,555 |
|
|
1,126,097 |
|
|
572,708 |
|
|
377,105 |
|
|
Mortgage servicing rights |
|
|
117,802 |
|
|
139,500 |
|
|
197,295 |
|
|
183,743 |
|
|
148,663 |
|
|
Deferred tax assets, net (3) |
|
|
132,683 |
|
|
175,145 |
|
|
175,669 |
|
|
172,202 |
|
|
14,818 |
|
|
Intangibles, including goodwill (4) |
|
|
— |
|
|
46,227 |
|
|
58,301 |
|
|
7,053 |
|
|
7,053 |
|
|
Investment in unconsolidated entities (5) |
|
|
15,008 |
|
|
25,663 |
|
|
76,465 |
|
|
46,151 |
|
|
79 |
|
|
Other |
|
|
160,056 |
|
|
153,312 |
|
|
233,489 |
|
|
150,794 |
|
|
154,439 |
|
|
|
|
|
|
|
|
|
||||||||||
|
Total assets |
|
$ |
1,769,350 |
|
$ |
2,237,100 |
|
$ |
2,391,924 |
|
$ |
2,005,394 |
|
$ |
1,848,117 |
|
|
|
|
|
|
|
|
|
||||||||||
|
|
|
|
|
|
|
|
|
|
|
|
|
|
|
|
|
|
|
Match funded liabilities |
|
$ |
465,691 |
|
$ |
961,939 |
|
$ |
1,001,403 |
|
$ |
510,236 |
|
$ |
339,292 |
|
|
Debt securities, lines of credit and other secured borrowings: |
|
|
|
|
|
|
|
|
|
|
|
|
|
|
|
|
|
Short-term |
|
|
7,979 |
|
|
182,860 |
|
|
339,976 |
|
|
310,149 |
|
|
611,787 |
|
|
Long-term (1) |
|
|
143,395 |
|
|
67,377 |
|
|
143,111 |
|
|
153,462 |
|
|
153,385 |
|
|
Investment line |
|
|
156,968 |
|
|
200,719 |
|
|
— |
|
|
— |
|
|
— |
|
|
Servicer liabilities |
|
|
38,672 |
|
|
135,751 |
|
|
204,484 |
|
|
383,549 |
|
|
298,892 |
|
|
Other |
|
|
90,782 |
|
|
78,813 |
|
|
110,429 |
|
|
81,340 |
|
|
85,952 |
|
|
|
|
|
|
|
|
|
||||||||||
|
Total liabilities |
|
|
903,487 |
|
|
1,627,459 |
|
|
1,799,403 |
|
|
1,438,736 |
|
|
1,489,308 |
|
|
|
|
|
|
|
|
|
||||||||||
|
Ocwen Financial Corporation stockholders’ equity (1) |
|
|
865,611 |
|
|
609,235 |
|
|
590,542 |
|
|
564,868 |
|
|
356,956 |
|
|
Non-controlling interest in subsidiaries (6) |
|
|
252 |
|
|
406 |
|
|
1,979 |
|
|
1,790 |
|
|
1,853 |
|
|
|
|
|
|
|
|
|
||||||||||
|
Total equity |
|
|
865,863 |
|
|
609,641 |
|
|
592,521 |
|
|
566,658 |
|
|
358,809 |
|
|
|
|
|
|
|
|
|
||||||||||
|
Total liabilities and equity |
|
$ |
1,769,350 |
|
$ |
2,237,100 |
|
$ |
2,391,924 |
|
$ |
2,005,394 |
|
$ |
1,848,117 |
|
|
|
|
|
|
|
|
|
||||||||||
|
|
|
|
|
|
|
|
|
|
|
|
|
|
|
|
|
|
|
Residential loans and real estate |
|
|
|
|
|
|
|
|
|
|
|
|
|
|
|
|
|
|
|
|
|
|
|
|
|
|
|
|
|
|
|
|
|
|
|
Count |
|
|
351,595 |
|
|
322,515 |
|
|
435,616 |
|
|
473,665 |
|
|
368,802 |
|
|
Amount |
|
$ |
49,980,077 |
|
$ |
40,171,532 |
|
$ |
53,545,985 |
|
$ |
52,834,028 |
|
$ |
42,779,048 |
|
23
|
|
|
|
|
|
|
|
|
|
|
|
|
|
|
|
|
|
|
|
|
For the Years Ended December 31, |
|
|||||||||||||
|
|
|
|
||||||||||||||
|
|
|
2009 |
|
2008 |
|
2007 |
|
2006 |
|
2005 |
|
|||||
|
|
|
|
|
|
|
|
||||||||||
|
Selected operations data |
|
|
|
|
|
|
|
|
|
Adjusted (1) |
|
|||||
|
|
|
|
|
|
|
|
|
|
|
|
||||||
|
Revenue: |
|
|
|
|
|
|
|
|
|
|
|
|
|
|
|
|
|
Servicing and subservicing fees |
|
$ |
264,467 |
|
$ |
368,026 |
|
$ |
379,277 |
|
$ |
340,584 |
|
$ |
293,382 |
|
|
Other |
|
|
116,261 |
|
|
124,102 |
|
|
101,384 |
|
|
90,746 |
|
|
81,703 |
|
|
|
|
|
|
|
|
|
||||||||||
|
Total revenue |
|
|
380,728 |
|
|
492,128 |
|
|
480,661 |
|
|
431,330 |
|
|
375,085 |
|
|
Operating expenses |
|
|
235,654 |
|
|
323,355 |
|
|
351,866 |
|
|
339,655 |
|
|
345,271 |
|
|
|
|
|
|
|
|
|
||||||||||
|
Income from operations |
|
|
145,074 |
|
|
168,773 |
|
|
128,795 |
|
|
91,675 |
|
|
29,814 |
|
|
|
|
|
|
|
|
|
||||||||||
|
Other income (expense): |
|
|
|
|
|
|
|
|
|
|
|
|
|
|
|
|
|
Interest income |
|
|
8,786 |
|
|
14,696 |
|
|
29,651 |
|
|
47,609 |
|
|
24,551 |
|
|
Interest expense (1) |
|
|
(62,954 |
) |
|
(86,574 |
) |
|
(76,586 |
) |
|
(56,979 |
) |
|
(42,464 |
) |
|
Other (1) |
|
|
2,355 |
|
|
(65,913 |
) |
|
(27,306 |
) |
|
(3,717 |
) |
|
408 |
|
|
|
|
|
|
|
|
|
||||||||||
|
Other expense, net |
|
|
(51,813 |
) |
|
(137,791 |
) |
|
(74,241 |
) |
|
(13,087 |
) |
|
(17,505 |
) |
|
|
|
|
|
|
|
|
||||||||||
|
|
|
|
|
|
|
|
|
|
|
|
|
|
|
|
|
|
|
Income from continuing operations before income taxes |
|
|
93,261 |
|
|
30,982 |
|
|
54,554 |
|
|
78,588 |
|
|
12,309 |
|
|
Income tax expense (benefit) (3) |
|
|
96,110 |
|
|
12,006 |
|
|
15,186 |
|
|
(127,720 |
) |
|
3,373 |
|
|
|
|
|
|
|
|
|
||||||||||
|
Income (loss) from continuing operations |
|
|
(2,849 |
) |
|
18,976 |
|
|
39,368 |
|
|
206,308 |
|
|
8,936 |
|
|
Income (loss) from discontinued operations, net of taxes (7) |
|
|
3,121 |
|
|
(5,767 |
) |
|
(3,172 |
) |
|
(2,094 |
) |
|
(1,801 |
) |
|
|
|
|
|
|
|
|
||||||||||
|
Net income |
|
|
272 |
|
|
13,209 |
|
|
36,196 |
|
|
204,214 |
|
|
7,135 |
|
|
Net loss (income) attributable to non-controlling interest in subsidiaries (6) |
|
|
25 |
|
|
41 |
|
|
(92 |
) |
|
(69 |
) |
|
(905 |
) |
|
|
|
|
|
|
|
|
||||||||||
|
Net income attributable to OCN |
|
$ |
297 |
|
$ |
13,250 |
|
$ |
36,104 |
|
$ |
204,145 |
|
$ |
6,230 |
|
|
|
|
|
|
|
|
|
||||||||||
|
|
|
|
|
|
|
|
|
|
|
|
|
|
|
|
|
|
|
Basic earnings per share |
|
|
|
|
|
|
|
|
|
|
|
|
|
|
|
|
|
Income (loss) from continuing operations |
|
$ |
(0.04 |
) |
$ |
0.30 |
|
$ |
0.63 |
|
$ |
3.28 |
|
$ |
0.13 |
|
|
Income (loss) from discontinued operations (7) |
|
|
0.04 |
|
|
(0.09 |
) |
|
(0.05 |
) |
|
(0.03 |
) |
|
(0.03 |
) |
|
|
|
|
|
|
|
|
||||||||||
|
Net income |
|
$ |
— |
|
$ |
0.21 |
|
$ |
0.58 |
|
$ |
3.25 |
|
$ |
0.10 |
|
|
|
|
|
|
|
|
|
||||||||||
|
|
|
|
|
|
|
|
|
|
|
|
|
|
|
|
|
|
|
Diluted earnings per share |
|
|
|
|
|
|
|
|
|
|
|
|
|
|
|
|
|
Income (loss) from continuing operations |
|
$ |
(0.04 |
) |
$ |
0.30 |
|
$ |
0.62 |
|
$ |
2.95 |
|
$ |
0.13 |
|
|
Income (loss) from discontinued operations (7) |
|
|
0.04 |
|
|
(0.09 |
) |
|
(0.05 |
) |
|
(0.03 |
) |
|
(0.03 |
) |
|
|
|
|
|
|
|
|
||||||||||
|
Net income |
|
$ |
— |
|
$ |
0.21 |
|
$ |
0.57 |
|
$ |
2.92 |
|
$ |
0.10 |
|
|
|
|
|
|
|
|
|
||||||||||
|
|
|
|
|
|
|
|
|
|
|
|
|
|
|
|
|
|
|
Weighted average common shares outstanding |
|
|
|
|
|
|
|
|
|
|
|
|
|
|
|
|
|
Basic |
|
|
78,252,000 |
|
|
62,670,957 |
|
|
62,712,076 |
|
|
62,871,613 |
|
|
62,912,768 |
|
|
Diluted (8) |
|
|
78,252,000 |
|
|
62,935,314 |
|
|
63,496,339 |
|
|
71,864,311 |
|
|
63,885,439 |
|
|
|
|
|
(1) |
On January 1, 2009, we adopted new accounting guidance that changed the manner in which we recognize interest expense over the life of convertible notes. We were required to apply the new guidance retrospectively for all periods presented. Specific line items impacted by these changes are indicated above. |
|
(2) |
During 2005 and 2006, we acquired loans held for resale through whole loan purchases and subprime loan origination activities. We funded these acquisitions with repurchase agreements and other short-term credit facilities. The majority of these loans were disposed of during 2006 through securitization transactions and whole loan sales, and the related debt was repaid. In 2007, we decided to discontinue our subprime loan origination activities. |
|
(3) |
In 2009, as a consequence of the Separation and related transactions, Ocwen incurred income taxes to the extent that the fair market value of Altisource assets exceeded Ocwen’s tax basis in such assets in accordance with Section 367 of the Internal Revenue Code. Ocwen recognized $52,047 of income tax expense in 2009, of which $25,649 is current expense and $26,398 is deferred expense. The income tax benefit for 2006 reflects the reversal of $155,377 of valuation allowances on our deferred tax assets in order to increase the net deferred tax asset to the amount that is more likely than not to be realized in future periods. |
24
|
|
|
|
(4) |
The operations of NCI are included in our consolidated financial statements effective June 6, 2007, the date of acquisition, to the date of the Separation. Total goodwill and intangibles were $44,609 and $53,260 at December 31, 2008 and 2007, respectively. NCI revenues and operating expenses for 2008 were $71,331 and $76,470, respectively. For the 2007 period, NCI revenues and operating expenses were $38,157 and $40,578, respectively. |
|
(5) |
We account for our investments in unconsolidated entities using the equity method. In 2006, we acquired an equity interest in BMS Holdings. During 2008, our 45% equity interest in the losses of BMS Holdings reduced our investment to zero. Because we are not required to advance funds to BMS Holdings to finance operations and we are not a guarantor of any obligations of BMS Holdings, we suspended the recognition of losses from our investment in BMS Holdings. We will not resume recording income or losses until our share of BMS Holdings’ earnings exceeds our share of their losses that we did not recognize during the period when we suspended recording losses. In 2007, we acquired 25% equity interests in OSI and in ONL and affiliates. |
|
(6) |
On January 1, 2009, we began to apply the provisions of the codification of SFAS 160 in ASC 810, Consolidations. This accounting codification established new accounting and reporting standards for non-controlling interest, resulting in a change in presentation, but no earnings impact. |
|
(7) |
In the fourth quarter of 2009, we completed the sale of our investment in BOK. We have reported the results of operations of BOK in the consolidated financial statements as discontinued operations. |
|
(8) |
The assumed conversion of the 3.25% Convertible Notes has been reflected in the calculation of weighted average common shares outstanding in computing diluted earnings per share for 2006. Conversion of the Convertible Notes to common stock was not assumed for 2009, 2008, 2007 and 2005 because the effect was antidilutive. Interest expense on the Convertible Notes, net of income tax, has been added to net income for purposes of computing diluted earnings per share for 2006. |
25
|
|
|
|
MANAGEMENT’S DISCUSSION AND ANALYSIS OF FINANCIAL CONDITION AND RESULTS OF OPERATIONS (Dollars in thousands, except share data) |
INTRODUCTION
Unless specifically stated otherwise, all references to December 2009, December 2008 and December 2007 refer to our fiscal periods ended, or the dates, as the context requires, December 31, 2009, December 31, 2008 and December 31, 2007, respectively. As described below in greater detail under “Recent Accounting Pronouncements—ASC 470, Debt,” we were required to retroactively apply a change to the accounting for convertible debt instruments. This change resulted in adjustments to amounts reported for periods ended before or on dates prior to January 1, 2009.
The following discussion of our results of operations, consolidated financial condition and capital resources and liquidity should be read in conjunction with our Consolidated Financial Statements and the related notes, all included elsewhere in this annual report on Form 10-K.
OVERVIEW
Impact of the Separation of Altisource on 2009 Comparisons
On August 10, 2009, we completed the Separation of Altisource by distributing all of the shares of Altisource common stock to Ocwen shareholders and convertible noteholders of record as of August 4, 2009, in the form of a pro rata stock distribution. Altisource consists of the operations of our former Ocwen Solutions line of business and related assets comprising the Mortgage Services, Financial Services and Technology Products segments except for BMS Holdings and GSS.
As a consequence of the Separation and related transactions, Ocwen incurred income taxes to the extent that the fair market value of Altisource assets exceeded Ocwen’s tax basis in such assets in accordance with Section 367 of the Internal Revenue Code. Ocwen recognized $52,047 of income tax expense, of which $25,649 is current expense and $26,398 is deferred expense.
We eliminated the assets and liabilities of Altisource from our consolidated balance sheet effective at the close of business on August 9, 2009. The following table summarizes the assets and liabilities transferred to Altisource in the Separation:
|
|
|
|
|
|
|
Assets: |
|
|
|
|
|
Cash |
|
$ |
20,028 |
|
|
Receivables |
|
|
13,888 |
|
|
Goodwill and intangibles, net |
|
|
43,767 |
|
|
Premises and equipment, net |
|
|
8,615 |
|
|
Other assets |
|
|
2,180 |
|
|
|
|
|
||
|
|
|
|
88,478 |
|
|
|
|
|
||
|
Liabilities |
|
|
|
|
|
Deferred tax liability, net |
|
|
1,336 |
|
|
Accrued expenses and other liabilities |
|
|
14,996 |
|
|
|
|
|
||
|
|
|
|
16,332 |
|
|
|
|
|
||
|
|
|
|
|
|
|
Reduction in Additional paid-in capital |
|
$ |
72,146 |
|
|
|
|
|
Beginning August 10, 2009, the operating results of Altisource are no longer included in our operating results. We do not report the historical operating results of Altisource as a discontinued operation because of the significance of the continuing involvement between Altisource and OCN under the long-term services agreements. The Separation contributed significantly to the declines in revenues, operating expenses, income from operations and income from continuing operations.
In comparisons to our results of operations in 2009 and the summary of changes in our financial condition as of December 31, 2009, compared to 2008, we focus our discussion below on additional factors, other than the Separation, that affected our results of operations and/or change in financial condition.
Operations Summary
As discussed above the percent change in our consolidated operating results from 2008 to 2009 were significantly impacted by the Separation of Altisource from Ocwen on August 10, 2009. In addition to the $52,047 income tax expense related to the Separation, Ocwen ceased, beginning on August 10, 2009, to record operating results from Mortgage Services, Financial Services and Technology Products segments except for BMS Holdings and GSS. The 2008 to 2009 comparative discussion below focuses primarily on changes other than those related to the Separation.
26
The following table summarizes our consolidated operating results for the years indicated. We have provided a more complete discussion of operating results by line of business in the Segments section.
|
|
|
|
|
|
|
|
|
|
|
|
|
|
|
|
|
|
|
|
|
For the years ended December 31, |
|
% Change |
|
|||||||||||
|
|
|
|
|
|||||||||||||
|
|
|
2009 |
|
2008 |
|
2007 |
|
2009 to |
|
2008 to |
|
|||||
|
|
|
|
|
|
|
|
||||||||||
|
Consolidated: |
|
|
|
|
|
|
|
|
|
|
|
|
|
|
|
|
|
Revenue |
|
$ |
380,728 |
|
$ |
492,128 |
|
$ |
480,661 |
|
(23 |
)% |
|
2 |
% |
|
|
Operating expenses |
|
|
235,654 |
|
|
323,355 |
|
|
351,866 |
|
(27 |
) |
|
(8 |
) |
|
|
|
|
|
|
|
|
|
|
|
|
|
||||||
|
Income from operations |
|
|
145,074 |
|
|
168,773 |
|
|
128,795 |
|
(14 |
) |
|
31 |
|
|
|
Other expense, net |
|
|
(51,813 |
) |
|
(137,791 |
) |
|
(74,241 |
) |
(62 |
) |
|
86 |
|
|
|
|
|
|
|
|
|
|
|
|
|
|
||||||
|
Income from continuing operations before taxes |
|
|
93,261 |
|
|
30,982 |
|
|
54,554 |
|
201 |
|
|
(43 |
) |
|
|
Income tax expense |
|
|
96,110 |
|
|
12,006 |
|
|
15,186 |
|
701 |
|
|
(21 |
) |
|
|
|
|
|
|
|
|
|
|
|
|
|
||||||
|
Income (loss) from continuing operations |
|
|
(2,849 |
) |
|
18,976 |
|
|
39,368 |
|
(115 |
) |
|
(52 |
) |
|
|
Income (loss) from discontinued operations, net of taxes |
|
|
3,121 |
|
|
(5,767 |
) |
|
(3,172 |
) |
(154 |
) |
|
82 |
|
|
|
|
|
|
|
|
|
|
|
|
|
|
||||||
|
Net income |
|
|
272 |
|
|
13,209 |
|
|
36,196 |
|
(98 |
) |
|
(64 |
) |
|
|
Net income (loss) attributable to non-controlling interest in subsidiaries |
|
|
25 |
|
|
41 |
|
|
(92 |
) |
(39 |
) |
|
(145 |
) |
|
|
|
|
|
|
|
|
|
|
|
|
|
||||||
|
Net income attributable to Ocwen |
|
$ |
297 |
|
$ |
13,250 |
|
$ |
36,104 |
|
(98 |
) |
|
(63 |
) |
|
|
|
|
|
|
|
|
|
|
|
|
|
||||||
|
|
|
|
|
|
|
|
|
|
|
|
|
|
|
|
|
|
|
Segment income (loss) from continuing operations before taxes: |
|
|
|
|
|
|
|
|
|
|
|
|
|
|
|
|
|
Servicing |
|
$ |
87,681 |
|
$ |
100,770 |
|
$ |
65,349 |
|
(13 |
)% |
|
54 |
% |
|
|
Loans and Residuals |
|
|
(9,121 |
) |
|
(14,682 |
) |
|
(8,650 |
) |
(38 |
) |
|
70 |
|
|
|
Asset Management Vehicles |
|
|
(5,317 |
) |
|
(9,813 |
) |
|
(159 |
) |
(46 |
) |
|
6,072 |
|
|
|
Mortgage Services |
|
|
17,815 |
|
|
13,262 |
|
|
14,002 |
|
34 |
|
|
(5 |
) |
|
|
Financial Services |
|
|
(5,969 |
) |
|
(7,875 |
) |
|
(7,087 |
) |
(24 |
) |
|
11 |
|
|
|
Technology Products |
|
|
9,590 |
|
|
3,580 |
|
|
8,968 |
|
168 |
|
|
(60 |
) |
|
|
Corporate items and other |
|
|
(1,418 |
) |
|
(54,260 |
) |
|
(17,869 |
) |
(97 |
) |
|
204 |
|
|
|
|
|
|
|
|
|
|
|
|
|
|
||||||
|
|
|
$ |
93,261 |
|
$ |
30,982 |
|
$ |
54,554 |
|
201 |
|
|
(43 |
) |
|
|
|
|
|
|
|
|
|
|
|
|
|
||||||
2009 versus 2008. Our servicing revenues declined from 2008 due to a lower annual average UPB and fewer total completed loan modifications due in large part to the delays associated with the implementation of the HAMP. Operating expenses in 2009 benefited from lower amortization expense on a smaller mortgage servicing rights portfolio, reduced staffing levels and fewer loan payoffs. Income from operations declined by $23,699, or 14% in 2009 as compared to 2008.
Other expense, net declined dramatically due to gains on auction rate securities in 2009 compared to losses in 2008, representing a $41,476 improvement, and a reduction in interest expense as advances and advance financing balances declined, despite higher average spreads and facility fees in 2009 compared to 2008. Income from continuing operations before taxes climbed to $93,261 in 2009 from $30,982 in 2008.
As subservicing and special servicing arrangements represent a larger portion of our portfolio, we expect revenues to decline. However, we anticipate such declines to be more than offset by lower amortization and interest expense.
We incurred a significant one-time tax expense associated with the Separation and increased our liability for selected tax items by $8,489, representing the full amount of recognized deferred tax assets arising from deductibility of losses in a finance vehicle. These two items contributed to a higher effective tax rate in 2009, the deferred portion of which was non-cash. As a result, income from continuing operations declined $21,825 or 115% in 2009 as compared to 2008. Discontinued operations for 2009 includes a pre-tax gain of $4,034 realized on the sale of BOK.
Primarily due to the tax impact of the Separation and the increase in our liability for selected tax items, net income declined 98% from 2008 to 2009.
27
2008 versus 2007. Servicing revenues declined slightly from 2007 to 2008 due to declines in float earnings and servicing fees, offset by increases in late charges. Float earnings declined because of lower interest rates and lower average float balances which declined because of higher delinquencies and a smaller servicing portfolio. Late charges, which are not recognized as revenue until collected, increased to normal levels as delinquency rates stabilized. Operating expenses declined primarily due to significantly lower amortization expense on a smaller mortgage servicing right portfolio and fewer loan payoffs. Income from operations increased 31% in 2008 as compared to 2007.
The drastic increase in other expense, net of $63,550 from 2007 to 2008 was principally caused by unrealized fair value losses, higher financing costs and lower interest income. Income from continuing operations declined 43% or $23,572 from 2007 to 2008.
Discontinued operations experienced increased losses from 2007 to 2008 of $2,595, further contributing to an overall 63% drop in net income from 2007 to 2008.
Change in Financial Condition Summary
The overall decline in our assets of 21% was principally due to the following:
|
|
|
|
|
|
l |
We implemented a strategy in the third quarter to reduce interest expense by using our cash reserves and proceeds from our equity offering to reduce advance finance borrowings. |
|
|
l |
Total advances declined by $234,111 primarily because of a decline in UPB serviced combined with relatively stable loan delinquency rates and lower average advances per loan. This decline is the net result of a $277,940 decline in match funded advances and a $43,829 increase in advances as a result of moving collateral from match funded advance facilities to a non-match funded facility. |
|
|
l |
Amortization expense exceeded the fair value of acquisitions, causing a reduction in MSRs. |
|
|
l |
Foreclosures, charge-offs, payoffs and declines in estimated values reduced loans held for resale. |
|
|
l |
We realized tax benefits in connection with the sale of MSRs and the Separation and applied tax benefits to offset our taxable earnings, all of which led to a decline in our net deferred tax assets. |
|
|
l |
We distributed assets of $88,478 as part of the Separation of Altisource. |
|
|
|
|
|
|
Liabilities declined 44% primarily as a result of the following items: |
|
|
|
|
|
|
|
l |
Match funded liabilities declined $496,248 reflecting both the decline in advances and our decision to use excess cash to reduce borrowings and interest expense. |
|
|
l |
We repaid $43,751 on the investment line term note. |
|
|
l |
Servicer liabilities declined by $97,079 largely because of a decrease in the amount of borrower payments that have not yet been remitted to custodial accounts. The decline in borrower payments is the result of slower repayments and a decline in UPB serviced. |
|
|
l |
Debt securities declined by $37,803 as a result of repurchases. During 2009, we repurchased $25,910 par value of our 3.25% Convertible Notes and $14,250 par value of our 10.875% Capital Trust Securities, both at a discount to par value in the open market. |
|
|
l |
We distributed liabilities of $16,332 as part of the Separation of Altisource. |
We increased our total equity by raising $60,165 net proceeds in a private placement in April and $274,964 net proceeds in a public equity offering in August. In connection with the April private placement, we repurchased $11,000 worth of common stock.
Liquidity Summary
We define liquidity as unencumbered cash balances plus unused, collateralized advance financing capacity. Following our successful capital raise in August 2009, we implemented a strategy to deploy excess cash balances to reduce outstanding debt levels and interest expense. At December 31, 2009, our cash position was $90,919 compared to $201,025 one year ago. Since we used available cash to fund advance balances, our available credit on collateralized but unused advance financing capacity was $201,200 at December 31, 2009 compared to zero a year ago. Our liquidity as of December 31, as measured by cash and available credit, increased by $91,094, or 45%, from 2008 to 2009.
Excluding the investment line, which is used to finance the auction rate securities, our borrowings have decreased by $595,111 since December 31, 2008. The decline in borrowings of the Servicing segment reflects a decline in advances and the $97,987 repayment of our MSR facility, including a final payment of $41,994 on August 21, 2009. The decline in borrowings of the Loans and Residuals segment represents the early redemption of the $18,154 note on which the loans had been pledged as collateral, including a final payment of $11,315 on September 23, 2009. Corporate Items and Other borrowings declined as a result of the repayments on the investment line of $43,751 and the repurchase of debt securities with a face value of $40,160.
28
The fair value of auction rate securities was $247,464 (representing securities with $263,925 total principal) as of December 31, 2009. The remaining balance on the investment line was $156,968. We are successfully executing on our liquidation strategy. In January and March 2010, we settled two of our litigation actions related to auction rate securities resulting in the sale of $103,625 par value for $92,775 cash proceeds. On February 5, 2010, we sold $33,350 par value of securities. Also in February, we exercised a liquidity option related to $88,150 par value of auction rate securities, resulting in a secured borrowing of $74,928. We used the majority of these proceeds to repay the investment line in full on February 17, 2010.
At December 31, 2009, excluding the investment line, $894,309 of our total maximum borrowing capacity remained unused, all attributable to the Servicing business. The unused borrowing capacity in the Servicing business may be utilized in the future by pledging additional qualifying collateral to our facilities.
CRITICAL ACCOUNTING POLICIES
Our ability to measure and report our operating results and financial position is heavily influenced by the need to estimate the impact or outcome of risks in the marketplace or other future events. Our critical accounting policies are those that relate to the estimation and measurement of these risks. Because they inherently involve significant judgments and uncertainties, an understanding of these policies is fundamental to understanding Management’s Discussion and Analysis of Results of Operations and Financial Condition. The following is a summary of our more subjective and complex accounting policies as they relate to our overall business strategy.
Valuation and Amortization of Residential Mortgage Servicing Rights
Our most significant business is our Servicing business. MSRs are an intangible asset representing the right to service a portfolio of mortgage loans. We generally obtain MSRs by purchasing them from the owners of the mortgage loans. As of December 31, 2009, we held residential MSRs with a carrying value of $117,802 and an estimated fair value of $127,268.
We account for our residential servicing assets using the amortization method. All newly acquired MSRs are initially measured at fair value. We amortize the balance of servicing assets or liabilities in proportion to and over the period of estimated net servicing income or net servicing loss and assess servicing assets or liabilities for impairment or increased obligation based on fair value at each reporting date. We determine estimated net servicing income using the estimated future balance of the underlying mortgage loan portfolio, which, absent new purchases, declines over time from prepayments and scheduled loan amortization. We adjust amortization prospectively in response to changes in estimated projections of future cash flows.
We group the loans that we service into strata based on one or more of the predominant risk characteristics of the underlying loans. The risk factors used to assign loans to strata include the credit score (FICO) of the borrower, the loan to value ratio and the default risk. Our strata include:
|
|
|
|
|
|
|
|
l |
Subprime |
l |
Re-performing |
|
|
l |
ALT A |
l |
Special servicing |
|
|
l |
High-loan-to-value |
l |
Other |
We estimate the fair value of our MSRs by calculating the present value of expected future cash flows utilizing assumptions that we believe are used by market participants. The significant components of the estimated future cash inflows for MSRs include servicing fees, late fees, prepayment penalties, float earnings and other ancillary fees. Significant cash outflows include the cost of servicing, the cost of financing servicing advances and compensating interest payments.
The most significant assumptions used in our internal valuation are the speed at which mortgages prepay and become delinquent, both of which we derive from our historical experience and available market data. Other assumptions used in our internal valuation are:
|
|
|
|
|
|
|
|
l |
Cost of servicing |
l |
Interest rate used for computing float earnings |
|
|
l |
Discount rate |
l |
Interest rate used for computing the cost of Servicing advances |
|
|
l |
Compensating interest expense |
|
|
29
At December 31, 2009, we had MSRs relating to the Subprime, ALT A and High-loan-to-value strata. The following table provides the range of prepayment speed and delinquency assumptions (expressed as a percentage) by strata projected over the five-year period beginning December 31, 2009:
|
|
|
|
|
|
|
|
|
|
Prepayment Speed |
|
Delinquency |
|
|
|
|
|
|
||
|
Subprime |
|
15% – 20% |
|
17% – 24% |
|
|
ALT A |
|
19% – 24% |
|
23% – 26% |
|
|
High-loan-to-value |
|
42% – 43% |
|
12% – 13% |
|
Additional assumptions we use to estimate the fair value of MSRs by strata as of December 31, 2009 include the cost of financing advances (1-month LIBOR plus 4%), float earnings (1-month LIBOR), a 20% discount rate and the cost of servicing (representing industry averages, which vary by strata and ranged from $110 per year for a performing ALT A loan to $900 per year for a loan in foreclosure).
We perform an impairment analysis of our MSRs by strata based on the difference between the carrying amount and estimated fair value. To the extent the estimated fair value is less than the carrying amount for any strata we recognize an impairment valuation allowance.
Changes in these assumptions are generally expected to affect our results of operations as summarized below:
|
|
|
|
|
|
l |
Increases in prepayment speeds generally reduce the value of our MSRs as the underlying loans prepay faster which causes accelerated MSR amortization, higher compensating interest payments and lower overall servicing fees, partially offset by a lower overall cost of servicing, increased float earnings on higher float balances and lower interest expense on decreased servicing advance balances. |
|
|
|
|
|
|
l |
Increases in delinquencies generally reduce the value of our MSRs as the cost of servicing increases during the delinquency period, and the amount of servicing advances and related interest expense also increase. |
|
|
|
|
|
|
l |
Increases in the discount rate reduce the value of our MSRs due to the lower overall net present value of the net cash flows. |
|
|
|
|
|
|
l |
Increases in interest rate assumptions for the cost of servicing advances will increase interest expense although this effect is partially offset because rate increases will also increase the amount of float earnings we recognize. |
Fair Value of Trading Securities
We recognize trading securities at fair value. We report changes in fair value as a gain or loss in our Consolidated Statement of Operations.
Auction Rate Securities. We estimated the fair value of the auction rate securities based on a combination of observable market inputs provided by actual orderly sales of similar auction rate securities and a discounted cash flow analysis. This discounted cash flow analysis incorporates expected future cash flows based on our best estimate of market participant assumptions. In periods of market illiquidity, the fair value of auction rate securities is determined after consideration of the credit quality of the securities held and the underlying collateral, market activity and general market conditions affecting auction rate securities.
The discounted cash flow analysis included the following range of assumptions at December 31, 2009:
|
|
|
|
|
|
|
l |
Expected term |
24 months |
|
|
l |
Illiquidity premium |
1.14% |
|
|
l |
Discount rate |
1.32% – 4.05% |
The expected term was based upon our best estimate of market participants’ expectations of future successful auctions. The discount rate and illiquidity premium are consistent with prevailing rates for similar securities. Other significant assumptions that we considered in our analysis included the credit risk profiles of the issuers, the impact on the issuers of the increased debt service costs associated with the payment of penalty interest rates and the collateralization of the securitization trusts. We do not assume defaults in our valuation due to the high credit quality of both the securities we hold and the underlying collateral.
As of December 31, 2009, auction rate securities had a fair value of $247,464 net of unrealized losses of $16,274. Subsequently, in January, February and March of 2010, we liquidated $136,975 par value of securities for $122,640 cash. We recognized no gain or loss on these three transfers. Furthermore, we sold $88,150 par value of securities with the option to repurchase the same securities at the same sales price until October 2012, resulting in a secured borrowing of $74,928. We used the majority of these proceeds to pay down the investment line subsequent to December 31, 2009.
30
Subordinates and Residuals. Our subordinate and residual securities are not actively traded, and, therefore, we estimate the fair value of these securities based on the present value of expected future cash flows from the underlying mortgage pools. We use our best estimate of the key assumptions we believe are used by market participants. We calibrate our internally developed discounted cash flow models for trading activity when appropriate to do so in light of market liquidity levels. Key inputs include expected prepayment rates, delinquency and cumulative loss curves and discount rates commensurate with the risks. Where possible, we use observable inputs in the valuation of our securities. However, the subordinate and residual securities in which we invest typically trade infrequently and therefore have few or no observable inputs and little price transparency. Additionally, during periods of market dislocation the observability of inputs is further reduced.
Discount rates for the subordinate and residual securities range from 21% to 22% and are determined based upon an assessment of prevailing market conditions and prices for similar assets. We project the delinquency, loss and prepayment assumptions based on a comparison to actual historical performance curves adjusted for prevailing market conditions. Peak delinquency assumptions range from 20% to 30%, and loss assumptions on current balances range from 20% to 29%. Average prepayment assumptions range from 5% to 6%.
Residual and subordinate securities had a fair value of $3,692 at December 31, 2009, net of unrealized losses of $31,561.
Loans Held for Resale
Loans held for resale are reported at the lower of cost or fair value. We account for the excess of cost over fair value as a valuation allowance with changes in the valuation allowance included in gain (loss) on loans held for resale, net, in the period in which the change occurs. All loans held for resale were measured at fair value because the cost of $49,160 exceeded the estimated fair value of $33,197 at December 31, 2009.
When we enter into an agreement to sell a loan to an investor at a set price, the loan is valued at the commitment price. The fair value of loans for which we do not have a firm commitment to sell is based upon a discounted cash flow analysis. We stratify our fair value estimate of uncommitted loans held for resale based upon the delinquency status of the loans. We base the fair value of our performing loans on the expected future cash flows discounted at a rate commensurate with the risk of the estimated cash flows. Significant assumptions include collateral and loan characteristics, prevailing market conditions and the creditworthiness of the borrower. The fair value of our non-performing loans is determined based upon the underlying collateral of the loan and the estimated period and cost of disposition.
Deferred Tax Assets
The use of estimates and the application of judgment are involved in the determination of our overall tax provision and the evaluation of the realizability of our gross deferred tax assets. As of December 31, 2009, we had gross deferred tax assets of $132,758 and gross deferred tax liabilities of $75 resulting in a net deferred tax asset of $132,683. We increased our liability for selected tax items by $8,489, representing the full amount of recognized deferred tax assets arising from deductibility of losses in a finance vehicle. We conduct periodic evaluations of positive and negative evidence to determine whether it is more likely than not that the deferred tax asset can be realized in future periods. Among the factors considered in this evaluation are estimates of future taxable income, future reversals of temporary differences, tax character (ordinary versus capital) and the impact of tax planning strategies that may be implemented, if warranted. We assess the amount of the valuation allowance each quarter.
Litigation
We monitor our litigation matters, including advice from external legal counsel, and regularly perform assessments of these matters for potential loss accrual and disclosure. We establish reserves for settlements, judgments on appeal and filed and/or threatened claims for which we believe it is probable that a loss has been or will be incurred and the amount can be reasonably estimated.
SEGMENT RESULTS AND FINANCIAL CONDITION
For each of our business segments, the following section provides a discussion of the changes in financial condition during the year ended December 31, 2009 and a discussion of pre-tax results of operations for the three annual periods ended December 31, 2009, 2008 and 2007. Due to the Separation, as of August 10, 2009, neither the assets and liabilities, nor the subsequent operations of the Mortgage Services, Financial Services and Technology Products segments, except for BMS and GSS, are included in our results. These partial year results of Ocwen Solutions may not be indicative of results for the full year. As a separate, publicly-traded company, Altisource Portfolio Solutions S.A. (NASDAQ:ASPS) will file a Form 10-K with the Securities and Exchange Commission.
31
The following table presents the selected results of operations for each of our business segments for the years ended December 31, 2009, 2008 and 2007:
|
|
|
|
|
|
|
|
|
|
|
|
|
|
|
|
|
|
|
|
|
|
|
|
|
|
|
|
|
|
|
|
|
Ocwen Asset Management |
|
Ocwen Solutions |
|
|
|
|
|
|
|
|
|
|
||||||||||||||
|
|
|
|
|
|
|
|
|
|
|
|
|
|
||||||||||||||||
|
|
|
Servicing |
|
Loans and Residuals |
|
Asset Management Vehicles |
|
Mortgage Services |
|
Financial Services |
|
Technology Products |
|
Corporate Items and Other |
|
Corporate Eliminations |
|
Business Segments Consolidated |
|
|||||||||
|
|
|
|||||||||||||||||||||||||||
|
Results of Operations |
|
|
|
|
|
|
|
|
|
|
|
|
|
|
|
|
|
|
|
|
|
|
|
|
|
|||
|
For the year ended December 31, 2009 |
|
|
|
|
|
|
|
|
|
|
|
|
|
|
|
|
|
|
|
|
|
|
|
|
|
|
|
|
|
Revenue |
|
$ |
272,725 |
|
$ |
— |
|
$ |
1,851 |
|
$ |
54,052 |
|
$ |
40,293 |
|
$ |
28,331 |
|
$ |
1,066 |
|
$ |
(17,590 |
) |
$ |
380,728 |
|
|
Operating expenses |
|
|
129,252 |
|
|
2,831 |
|
|
3,108 |
|
|
37,040 |
|
|
45,002 |
|
|
18,638 |
|
|
16,308 |
|
|
(16,525 |
) |
|
235,654 |
|
|
|
|
|
|
|
|
|
|
|
|
|
||||||||||||||||||
|
Income (loss) from operations |
|
|
143,473 |
|
|
(2,831 |
) |
|
(1,257 |
) |
|
17,012 |
|
|
(4,709 |
) |
|
9,693 |
|
|
(15,242 |
) |
|
(1,065 |
) |
|
145,074 |
|
|
|
|
|
|
|
|
|
|
|
|
|
||||||||||||||||||
|
Other income (expense): |
|
|
|
|
|
|
|
|
|
|
|
|
|
|
|
|
|
|
|
|
|
|
|
|
|
|
|
|
|
Interest income |
|
|
266 |
|
|
7,183 |
|
|
— |
|
|
2 |
|
|
— |
|
|
— |
|
|
1,335 |
|
|
— |
|
|
8,786 |
|
|
Interest expense |
|
|
(59,458 |
) |
|
(1,447 |
) |
|
— |
|
|
(28 |
) |
|
(1,285 |
) |
|
(289 |
) |
|
(447 |
) |
|
— |
|
|
(62,954 |
) |
|
Other |
|
|
3,400 |
|
|
(12,026 |
) |
|
(4,060 |
) |
|
829 |
|
|
25 |
|
|
186 |
|
|
12,936 |
|
|
1,065 |
|
|
2,355 |
|
|
|
|
|
|
|
|
|
|
|
|
|
||||||||||||||||||
|
Other income (expense), net |
|
|
(55,792 |
) |
|
(6,290 |
) |
|
(4,060 |
) |
|
803 |
|
|
(1,260 |
) |
|
(103 |
) |
|
13,824 |
|
|
1,065 |
|
|
(51,813 |
) |
|
|
|
|
|
|
|
|
|
|
|
|
||||||||||||||||||
|
Income (loss) from continuing operations before income taxes |
|
$ |
87,681 |
|
$ |
(9,121 |
) |
$ |
(5,317 |
) |
$ |
17,815 |
|
$ |
(5,969 |
) |
$ |
9,590 |
|
$ |
(1,418 |
) |
$ |
— |
|
$ |
93,261 |
|
|
|
|
|
|
|
|
|
|
|
|
|
||||||||||||||||||
|
|
|
|
|
|
|
|
|
|
|
|
|
|
|
|
|
|
|
|
|
|
|
|
|
|
|
|
|
|
|
For the year ended December 31, 2008 |
|
|
|
|
|
|
|
|
|
|
|
|
|
|
|
|
|
|
|
|
|
|
|
|
|
|
||
|
Revenue |
|
$ |
340,725 |
|
$ |
— |
|
$ |
3,664 |
|
$ |
58,733 |
|
$ |
73,835 |
|
$ |
45,283 |
|
$ |
156 |
|
$ |
(30,268 |
) |
$ |
492,128 |
|
|
Operating expenses |
|
|
164,292 |
|
|
3,025 |
|
|
4,113 |
|
|
46,299 |
|
|
79,757 |
|
|
35,895 |
|
|
18,743 |
|
|
(28,769 |
) |
|
323,355 |
|
|
|
|
|
|
|
|
|
|
|
|
|
||||||||||||||||||
|
Income (loss) from operations |
|
|
176,433 |
|
|
(3,025 |
) |
|
(449 |
) |
|
12,434 |
|
|
(5,922 |
) |
|
9,388 |
|
|
(18,587 |
) |
|
(1,499 |
) |
|
168,773 |
|
|
|
|
|
|
|
|
|
|
|
|
|
||||||||||||||||||
|
Other income (expense): |
|
|
|
|
|
|
|
|
|
|
|
|
|
|
|
|
|
|
|
|
|
|
|
|
|
|
|
|
|
Interest income |
|
|
1,004 |
|
|
11,361 |
|
|
— |
|
|
147 |
|
|
16 |
|
|
— |
|
|
2,168 |
|
|
— |
|
|
14,696 |
|
|
Interest expense |
|
|
(75,835 |
) |
|
(3,177 |
) |
|
— |
|
|
(200 |
) |
|
(1,977 |
) |
|
(573 |
) |
|
(4,812 |
) |
|
— |
|
|
(86,574 |
) |
|
Other |
|
|
(832 |
) |
|
(19,841 |
) |
|
(9,364 |
) |
|
881 |
|
|
8 |
|
|
(5,235 |
) |
|
(33,029 |
) |
|
1,499 |
|
|
(65,913 |
) |
|
|
|
|
|
|
|
|
|
|
|
|
||||||||||||||||||
|
Other income (expense), net |
|
|
(75,663 |
) |
|
(11,657 |
) |
|
(9,364 |
) |
|
828 |
|
|
(1,953 |
) |
|
(5,808 |
) |
|
(35,673 |
) |
|
1,499 |
|
|
(137,791 |
) |
|
|
|
|
|
|
|
|
|
|
|
|
||||||||||||||||||
|
Income (loss) from continuing operations before income taxes |
|
$ |
100,770 |
|
$ |
(14,682 |
) |
$ |
(9,813 |
) |
$ |
13,262 |
|
$ |
(7,875 |
) |
$ |
3,580 |
|
$ |
(54,260 |
) |
$ |
— |
|
$ |
30,982 |
|
|
|
|
|
|
|
|
|
|
|
|
|
||||||||||||||||||
|
|
|
|
|
|
|
|
|
|
|
|
|
|
|
|
|
|
|
|
|
|
|
|
|
|
|
|
|
|
|
For the year ended December 31, 2007 |
|
|
|
|
|
|
|
|
|
|
|
|
|
|
|
|
|
|
|
|
|
|
|
|
|
|
||
|
Revenue |
|
$ |
343,648 |
|
$ |
352 |
|
$ |
1,444 |
|
$ |
73,852 |
|
$ |
41,292 |
|
$ |
36,235 |
|
$ |
1,162 |
|
$ |
(17,324 |
) |
$ |
480,661 |
|
|
Operating expenses |
|
|
219,322 |
|
|
4,191 |
|
|
829 |
|
|
59,603 |
|
|
47,110 |
|
|
33,714 |
|
|
5,775 |
|
|
(18,678 |
) |
|
351,866 |
|
|
|
|
|
|
|
|
|
|
|
|
|
||||||||||||||||||
|
Income (loss) from operations |
|
|
124,326 |
|
|
(3,839 |
) |
|
615 |
|
|
14,249 |
|
|
(5,818 |
) |
|
2,521 |
|
|
(4,613 |
) |
|
1,354 |
|
|
128,795 |
|
|
|
|
|
|
|
|
|
|
|
|
|
||||||||||||||||||
|
Other income (expense): |
|
|
|
|
|
|
|
|
|
|
|
|
|
|
|
|
|
|
|
|
|
|
|
|
|
|
|
|
|
Interest income |
|
|
1,146 |
|
|
20,485 |
|
|
— |
|
|
110 |
|
|
6 |
|
|
— |
|
|
7,904 |
|
|
— |
|
|
29,651 |
|
|
Interest expense |
|
|
(57,978 |
) |
|
(7,499 |
) |
|
— |
|
|
(504 |
) |
|
(1,305 |
) |
|
(537 |
) |
|
(8,763 |
) |
|
— |
|
|
(76,586 |
) |
|
Other |
|
|
(2,145 |
) |
|
(17,797 |
) |
|
(774 |
) |
|
147 |
|
|
30 |
|
|
6,984 |
|
|
(12,397 |
) |
|
(1,354 |
) |
|
(27,306 |
) |
|
|
|
|
|
|
|
|
|
|
|
|
||||||||||||||||||
|
Other income (expense), net |
|
|
(58,977 |
) |
|
(4,811 |
) |
|
(774 |
) |
|
(247 |
) |
|
(1,269 |
) |
|
6,447 |
|
|
(13,256 |
) |
|
(1,354 |
) |
|
(74,241 |
) |
|
|
|
|
|
|
|
|
|
|
|
|
||||||||||||||||||
|
Income (loss) from continuing operations before income taxes |
|
$ |
65,349 |
|
$ |
(8,650 |
) |
$ |
(159 |
) |
$ |
14,002 |
|
$ |
(7,087 |
) |
$ |
8,968 |
|
$ |
(17,869 |
) |
$ |
— |
|
$ |
54,554 |
|
|
|
|
|
|
|
|
|
|
|
|
|
||||||||||||||||||
32
Servicing
The following table presents selected results of operations of our Servicing segment for the years ended December 31:
|
|
|
|
|
|
|
|
|
|
|
|
|
|
|
2009 |
|
2008 |
|
2007 |
|
|||
|
|
|
|
|
|||||||
|
Revenue |
|
|
|
|
|
|
|
|
|
|
|
Servicing and subservicing fees |
|
$ |
233,759 |
|
$ |
304,572 |
|
$ |
333,128 |
|
|
Process management fees |
|
|
38,965 |
|
|
36,153 |
|
|
10,509 |
|
|
Other |
|
|
1 |
|
|
— |
|
|
11 |
|
|
|
|
|
|
|
||||||
|
Total revenue |
|
|
272,725 |
|
|
340,725 |
|
|
343,648 |
|
|
|
|
|
|
|
||||||
|
Operating expenses |
|
|
|
|
|
|
|
|
|
|
|
Compensation and benefits |
|
|
32,256 |
|
|
40,539 |
|
|
37,202 |
|
|
Amortization of servicing rights |
|
|
32,228 |
|
|
52,187 |
|
|
99,118 |
|
|
Servicing and origination |
|
|
8,071 |
|
|
16,893 |
|
|
29,934 |
|
|
Technology and communications |
|
|
14,215 |
|
|
12,516 |
|
|
8,403 |
|
|
Professional services |
|
|
8,095 |
|
|
10,577 |
|
|
9,724 |
|
|
Occupancy and equipment |
|
|
10,848 |
|
|
11,307 |
|
|
13,225 |
|
|
Other operating expenses |
|
|
23,539 |
|
|
20,273 |
|
|
21,716 |
|
|
|
|
|
|
|
||||||
|
Total operating expenses |
|
|
129,252 |
|
|
164,292 |
|
|
219,322 |
|
|
|
|
|
|
|
||||||
|
Income from operations |
|
|
143,473 |
|
|
176,433 |
|
|
124,326 |
|
|
|
|
|
|
|
||||||
|
Other income (expense) |
|
|
|
|
|
|
|
|
|
|
|
Interest income |
|
|
266 |
|
|
1,004 |
|
|
1,146 |
|
|
Interest expense |
|
|
(59,458 |
) |
|
(75,835 |
) |
|
(57,978 |
) |
|
Other, net |
|
|
3,400 |
|
|
(832 |
) |
|
(2,145 |
) |
|
|
|
|
|
|
||||||
|
Total other expense, net |
|
|
(55,792 |
) |
|
(75,663 |
) |
|
(58,977 |
) |
|
|
|
|
|
|
||||||
|
Income from continuing operations before income taxes |
|
$ |
87,681 |
|
$ |
100,770 |
|
$ |
65,349 |
|
|
|
|
|
|
|
||||||
33
The following table provides selected operating statistics at or for the years ended December 31:
|
|
|
|
|
|
|
|
|
|
|
|
|
|
|
|
|
|
|
|
|
|
|
|
|
|
|
|
|
|
Change from |
|
||||
|
|
|
|
|
|
|
|
|
|
|
|
|
|||||
|
|
|
2009 |
|
2008 |
|
2007 |
|
2008 to 2009 |
|
2007 to 2008 |
|
|||||
|
|
|
|
|
|
|
|
||||||||||
|
Residential Assets Serviced |
|
|
|
|
|
|
|
|
|
|
|
|
|
|
|
|
|
Unpaid principal balance: |
|
|
|
|
|
|
|
|
|
|
|
|
|
|
|
|
|
Performing loans (1) |
|
$ |
35,090,126 |
|
$ |
30,416,049 |
|
$ |
42,389,849 |
|
15 |
% |
|
(28 |
)% |
|
|
Non-performing loans |
|
|
11,638,689 |
|
|
6,937,002 |
|
|
7,433,386 |
|
68 |
|
|
(7 |
) |
|
|
Non-performing real estate (2) |
|
|
3,251,262 |
|
|
2,818,481 |
|
|
3,722,750 |
|
15 |
|
|
(24 |
) |
|
|
|
|
|
|
|
|
|
|
|
|
|
||||||
|
Total residential assets serviced (3) |
|
$ |
49,980,077 |
|
$ |
40,171,532 |
|
$ |
53,545,985 |
|
24 |
|
|
(25 |
) |
|
|
|
|
|
|
|
|
|
|
|
|
|
||||||
|
Average residential assets serviced |
|
$ |
41,093,085 |
|
$ |
46,193,422 |
|
$ |
55,067,769 |
|
(11 |
) |
|
(16 |
) |
|
|
|
|
|
|
|
|
|
|
|
|
|
|
|
|
|
|
|
|
Prepayment speed (average CPR) |
|
|
19.0 |
% |
|
25.0 |
% |
|
23.0 |
% |
(24 |
) |
|
9 |
|
|
|
|
|
|
|
|
|
|
|
|
|
|
|
|
|
|
|
|
|
Percent of total UPB: |
|
|
|
|
|
|
|
|
|
|
|
|
|
|
|
|
|
Servicing portfolio |
|
|
54.8 |
% |
|
74.3 |
% |
|
71.0 |
% |
(26 |
)% |
|
5 |
% |
|
|
Subservicing portfolio |
|
|
45.2 |
|
|
25.7 |
|
|
29.0 |
|
76 |
|
|
(11 |
) |
|
|
Non-performing residential assets serviced, excluding Freddie Mac and VA |
|
|
25.6 |
% |
|
24.3 |
% |
|
19.6 |
% |
5 |
|
|
24 |
|
|
|
|
|
|
|
|
|
|
|
|
|
|
|
|
|
|
|
|
|
Number of: |
|
|
|
|
|
|
|
|
|
|
|
|
|
|
|
|
|
Performing loans (1) |
|
|
272,656 |
|
|
261,387 |
|
|
356,937 |
|
4 |
% |
|
(27 |
)% |
|
|
Non-performing loans |
|
|
62,717 |
|
|
47,611 |
|
|
54,330 |
|
32 |
|
|
(12 |
) |
|
|
Non-performing real estate (2) |
|
|
16,222 |
|
|
13,517 |
|
|
24,349 |
|
20 |
|
|
(44 |
) |
|
|
|
|
|
|
|
|
|
|
|
|
|
||||||
|
Total number of residential assets serviced (3) |
|
|
351,595 |
|
|
322,515 |
|
|
435,616 |
|
9 |
|
|
(26 |
) |
|
|
|
|
|
|
|
|
|
|
|
|
|
||||||
|
|
|
|
|
|
|
|
|
|
|
|
|
|
|
|
|
|
|
Average number of residential assets serviced |
|
|
305,871 |
|
|
373,416 |
|
|
465,029 |
|
(18 |
) |
|
(20 |
) |
|
|
Percent of total number: |
|
|
|
|
|
|
|
|
|
|
|
|
|
|
|
|
|
Servicing portfolio |
|
|
55.4 |
% |
|
67.0 |
% |
|
66.1 |
% |
(17 |
)% |
|
1 |
% |
|
|
Subservicing portfolio |
|
|
44.6 |
|
|
33.0 |
|
|
33.9 |
|
35 |
|
|
(3 |
) |
|
|
Non-performing residential assets serviced, excluding Freddie Mac and VA |
|
|
18.8 |
% |
|
19.0 |
% |
|
16.4 |
% |
(1 |
) |
|
16 |
|
|
|
|
|
|
|
|
|
|
|
|
|
|
|
|
|
|
|
|
|
Other Servicing and Subservicing Income |
|
|
|
|
|
|
|
|
|
|
|
|
|
|
|
|
|
Average custodial account balances |
|
$ |
378,100 |
|
$ |
416,200 |
|
$ |
677,200 |
|
(9 |
)% |
|
(39 |
)% |
|
|
Float earnings (4) |
|
|
4,802 |
|
|
11,005 |
|
|
29,299 |
|
(56 |
) |
|
(62 |
) |
|
|
Yield |
|
|
1.27 |
% |
|
2.64 |
% |
|
4.33 |
% |
(52 |
) |
|
(39 |
) |
|
|
|
|
|
|
|
|
|
|
|
|
|
|
|
|
|
|
|
|
Financing Costs |
|
|
|
|
|
|
|
|
|
|
|
|
|
|
|
|
|
Average balance of advances and match funded advances |
|
$ |
1,042,044 |
|
$ |
1,251,388 |
|
$ |
861,402 |
|
(17 |
)% |
|
45 |
% |
|
|
Average borrowings |
|
|
728,217 |
|
|
1,119,569 |
|
|
719,668 |
|
(35 |
) |
|
56 |
|
|
|
Interest expense on borrowings |
|
|
51,247 |
|
|
67,516 |
|
|
52,555 |
|
(24 |
) |
|
28 |
|
|
|
Facility costs included in interest expense |
|
|
25,530 |
|
|
12,586 |
|
|
6,538 |
|
103 |
|
|
93 |
|
|
|
Effective average interest rate |
|
|
7.04 |
% |
|
6.03 |
% |
|
7.30 |
% |
17 |
|
|
(17 |
) |
|
|
Average 1-month LIBOR |
|
|
0.33 |
% |
|
2.67 |
% |
|
5.25 |
% |
(88 |
) |
|
(49 |
) |
|
|
|
|
|
|
|
|
|
|
|
|
|
|
|
|
|
|
|
|
Average Employment |
|
|
|
|
|
|
|
|
|
|
|
|
|
|
|
|
|
India and other |
|
|
1,134 |
|
|
1,135 |
|
|
1,114 |
|
— |
% |
|
2 |
% |
|
|
United States |
|
|
287 |
|
|
442 |
|
|
422 |
|
(35 |
) |
|
5 |
|
|
|
|
|
|
|
|
|
|
|
|
|
|
||||||
|
Total |
|
|
1,421 |
|
|
1,577 |
|
|
1,536 |
|
(10 |
) |
|
3 |
|
|
|
|
|
|
|
|
|
|
|
|
|
|
||||||
|
|
|
|
|
|
|
|
|
|
|
|
|
|
|
|
|
|
|
Collections on loans serviced for others |
|
$ |
6,593,399 |
|
$ |
10,683,541 |
|
$ |
16,223,124 |
|
(38 |
)% |
|
(34 |
)% |
|
|
|
|
|
(1) |
Performing loans include those loans that are current or have been delinquent for less than 90 days in accordance with their original terms and those loans for which borrowers are making scheduled payments under loan modification, forbearance or bankruptcy plans. We consider all other loans to be non-performing. |
|
(2) |
Includes $798,148 of foreclosed properties serviced for the VA at December 31, 2007. |
|
(3) |
At December 31, 2009, we serviced 243,593 subprime loans with a UPB of $35,682,666. This compares to 227,929 subprime loans with a UPB of $32,776,696 at December 31, 2008 and 292,148 subprime loans with a UPB of $41,947,660 at December 31, 2007. |
34
|
|
|
|
(4) |
A component of Servicing and subservicing fees. Includes $4,745 in 2009, $10,696 in 2008 and $12,998 in 2007 of interest income from auction rate securities. |
The following table provides information regarding the changes in our portfolio of residential assets serviced:
|
|
|
|
|
|
|
|
|
|
|
|
|
|
|
|
|
|
|
|
|
|
|
|
Amount of UPB |
|
Count |
|
||||||||||||||
|
|
|
|
|
||||||||||||||||
|
|
|
2009 |
|
2008 |
|
2007 |
|
2009 |
|
2008 |
|
2007 |
|
||||||
|
|
|
|
|
|
|
|
|
||||||||||||
|
Servicing portfolio at beginning of year |
|
$ |
40,171,532 |
|
$ |
53,545,985 |
|
$ |
52,834,028 |
|
|
322,515 |
|
|
435,616 |
|
|
473,665 |
|
|
Additions |
|
|
18,821,679 |
|
|
1,597,351 |
|
|
21,074,550 |
|
|
101,622 |
|
|
9,769 |
|
|
129,709 |
|
|
Runoff |
|
|
(9,013,134 |
) |
|
(14,971,804 |
) |
|
(20,362,593 |
) |
|
(72,542 |
) |
|
(122,870 |
) |
|
(167,758 |
) |
|
|
|
|
|
|
|
|
|
||||||||||||
|
Servicing portfolio at end of year |
|
$ |
49,980,077 |
|
$ |
40,171,532 |
|
$ |
53,545,985 |
|
|
351,595 |
|
|
322,515 |
|
|
435,616 |
|
|
|
|
|
|
|
|
|
|
||||||||||||
2009 versus 2008. Servicing and subservicing fees declined due to the 11% decline in the average UPB of residential assets serviced and lower modifications in 2009 due to the implementation of HAMP. Compliance with HAMP borrower documentation requirements caused loan modifications that would ordinarily have been completed in 2009 to be delayed. Lower average custodial account balances, due to lower UPB and reduced loan payoff collections, and lower interest rates also contributed to the overall decline in total revenues.
As subservicing and special servicing arrangements represent a larger portion of our portfolio, we expect revenues to decline. However, we anticipate such declines to be more than offset by lower amortization and interest expense.
We estimate that during 2009 the balance of uncollected and unrecognized servicing fees related to delinquent borrower payments increased by $5,511 to $55,612 as of December 31, 2009.
Operating expenses benefited from lower MSR amortization expense, reduced staffing levels and lower servicing and origination expense. Amortization expense declined in 2009 as the projected average prepayment speed (CPR) fell and we shifted our portfolio composition to more subservicing arrangements, leading to a 22% lower average MSR balance in 2009, as compared to 2008. Our efforts to reduce staffing levels resulted in a 20% decline in compensation and benefits expense as we reduced our average US headcount and maintained our India staffing level. Approximately two-thirds of the decline in average U.S. employment was due to our decision in July 2008 not to renew our contract with the VA. Servicing and origination expense declined as a result of a decline in voluntary loan payoffs.
The delinquency rate remained relatively stable in 2009. Total advances have continued to decline in 2009; however, the effects of implementing HAMP slowed the rate of decline. Lower UPB and increased sales of foreclosed real estate also contributed to the decline in advances. We expect delinquency rates to remain flat or decline somewhat in 2010, which will lead to further reductions in advances as our seasoned portfolio matures.
Prepayment speed was lower in 2009 primarily due to a decline in loan payoffs partly offset by an increase in real estate sales. Real estate sales and other involuntary liquidations accounted for approximately 82% of prepayments during 2009 as compared to approximately 80% for 2008.
We completed 51,485 modifications in 2009 as compared to 60,839 in 2008. In 2009, 11% of completed modifications were HAMP and the remaining 89% non-HAMP. The split between HAMP and non-HAMP modifications is to be expected since the earliest period in which completed HAMP modifications could occur was the third quarter.
We completed 15,677 modifications in the fourth quarter of 2009, of which 4,296 were HAMP and 11,381 were non-HAMP. The number of completed modifications in the fourth quarter of 2009 was 124% higher than the 7,000 modifications completed in the third quarter of 2009. Completed modifications were lower in the second and third quarters of 2009 than in prior quarters because of the challenges imposed by the need to collect the requisite documentation from borrowers and make the changes in our work streams necessitated by the HAMP program. HAMP modification offers were extended to 17,630 borrowers in 2009.
Interest expense in 2009 was lower than in 2008 principally because of the decline in match funded advances coupled with our strategy of reducing advance financing through the use of cash reserves and the proceeds of our equity offering. At December 31, 2009, 57% of match funded advances were funded through borrowings as compared to 87% at December 31, 2008. Although the majority of our credit facilities bear interest at rates that are adjusted regularly based on 1-Month LIBOR, our average effective interest rate for 2009 did not decline in proportion to the decline in LIBOR. This is principally the result of the higher spreads over LIBOR charged on the new match funded facilities that we added in 2009 and 2008 and higher facility fees charged by the lenders on the new facilities and on the renewal of existing facilities regardless of the amount of borrowing.
35
The following table shows selected assets and liabilities of our Servicing segment as of December 31:
|
|
|
|
|
|
|
|
|
|
|
|
2009 |
|
2008 |
|
||
|
|
|
|
|||||
|
Advances (1) |
|
$ |
141,429 |
|
$ |
97,098 |
|
|
Match funded advances |
|
|
822,615 |
|
|
1,100,555 |
|
|
Mortgage servicing rights (Residential) |
|
|
117,802 |
|
|
139,500 |
|
|
Receivables (1) |
|
|
43,079 |
|
|
7,936 |
|
|
Debt service accounts |
|
|
50,221 |
|
|
58,468 |
|
|
Other |
|
|
16,066 |
|
|
13,058 |
|
|
|
|
|
|
||||
|
Total assets |
|
$ |
1,191,212 |
|
$ |
1,416,615 |
|
|
|
|
|
|
||||
|
|
|
|
|
|
|
|
|
|
Match funded liabilities |
|
$ |
465,691 |
|
$ |
961,939 |
|
|
Lines of credit and other secured borrowings |
|
|
55,810 |
|
|
97,987 |
|
|
Servicer liabilities (2) |
|
|
38,570 |
|
|
135,649 |
|
|
Other |
|
|
39,999 |
|
|
23,138 |
|
|
|
|
|
|
||||
|
Total liabilities |
|
$ |
600,070 |
|
$ |
1,218,713 |
|
|
|
|
|
|
||||
|
|
|
|
(1) |
Includes $37,226 due in connection with a loan subservicing agreement for reimbursable advances, the majority of which we have collected subsequent to December 31, 2009. |
|
(2) |
Represents amounts collected, primarily from residential borrowers whose loans we service, which we will deposit in custodial accounts, pay directly to an investment trust or refund to borrowers. The primary factor in the decline from 2008 is low collection volume resulting from slower voluntary prepayments and a smaller servicing portfolio. |
2008 versus 2007. Servicing was our most profitable segment in 2008, despite absorbing the negative impact, first, of higher delinquencies, as compared to 2007, and lower float balances and, second, of increased interest expense that resulted from our need to finance higher servicing advance balances.
Servicing and subservicing fees declined due to the 16% decline in the average UPB of residential assets serviced and lower float earnings attributable to lower average custodial account balances and lower interest rates. The decline in the average custodial account balance is the result of the decline in the average UPB of residential assets serviced and lower collections related to loan payoffs. However, process management fees, revenues associated with foreclosed residential and real estate marketing activities, increased in 2008 reflecting more effective marketing and pricing related to foreclosed residential real estate. This increase was partially offset by declines in both the number of properties sold and the average price. Total revenues also benefited from the increase in late charges for 2008, due to higher delinquencies and higher collections of previously assessed late charges.
We estimate that during 2008 the balance of uncollected and unrecognized servicing fees related to delinquent borrower payments increased by $551 to $50,101 as of December 31, 2008.
Operating expenses benefited from lower MSR amortization expense and lower servicing and origination expense, partially offset by increased technology and communication expenses. Amortization expense declined in 2008 due to a decrease in projected average prepayment speed, leading to a 19% lower average MSR balance in 2008, as compared to 2007. Slower projected mortgage prepayment speeds and higher projected delinquencies have reduced the rate of amortization as we expect to earn the servicing income over a longer period of time. Servicing and origination expense declined as a result of a decline in voluntary loan payoffs, system automation and process improvements. The increase in technology and communication expense in 2008 is due to higher technology support charges from the former Technology Products segment, now part of Altisource. The higher charges principally reflect the implementation of a market-based rate card in the second quarter of 2008 that replaced the cost-based method used in all prior periods. Due to lower operating expenses, income from operations improved by $52,107, or 42% in 2008 as compared to 2007.
Delinquencies were relatively stable and advances declined during 2008. This is due to both a decline in the UPB of residential assets serviced and to our success in stabilizing the delinquency rate of these loans. Management initiatives designed to maximize the return to the loan investors resulted in increased loan modifications and faster sales of foreclosed real estate and were the primary factor in stabilizing delinquencies.
Prepayment speed increased in 2008 due to a larger number of real estate sales. Such involuntary liquidations accounted for approximately 80% of prepayments during 2008 as compared to approximately 20% for 2007.
36
Interest expense increased in 2008 principally because of increased financing costs associated with the growth in residential servicing advances. In 2008, we also experienced an increase in facility fees and in interest rates spreads charged by the lenders. Although the majority of our credit facilities bear interest at rates that are adjusted regularly based on 1-Month LIBOR, our average effective interest rate for 2008 did not decline in proportion to the decline in LIBOR. This is principally the result of the higher spreads over LIBOR charged on the new match funded facilities that we added in 2008 and higher facility fees charged by the lenders on the new facilities and on the renewal of existing facilities.
Loans and Residuals
The following table presents selected results of operations of our Loans and Residuals segment for the years ended December 31:
|
|
|
|
|
|
|
|
|
|
|
|
|
|
|
2009 |
|
2008 |
|
2007 |
|
|||
|
|
|
|
|
|||||||
|
Revenue |
|
$ |
— |
|
$ |
— |
|
$ |
352 |
|
|
Operating expenses |
|
|
2,831 |
|
|
3,025 |
|
|
4,191 |
|
|
|
|
|
|
|
||||||
|
Loss from operations |
|
|
(2,831 |
) |
|
(3,025 |
) |
|
(3,839 |
) |
|
|
|
|
|
|
||||||
|
Other income (expense) |
|
|
|
|
|
|
|
|
|
|
|
Interest income |
|
|
7,183 |
|
|
11,361 |
|
|
20,485 |
|
|
Interest expense |
|
|
(1,447 |
) |
|
(3,177 |
) |
|
(7,499 |
) |
|
Loss on trading securities |
|
|
(569 |
) |
|
(2,837 |
) |
|
(3,379 |
) |
|
Loss on loans held for resale, net |
|
|
(11,132 |
) |
|
(17,096 |
) |
|
(16,671 |
) |
|
Other, net |
|
|
(325 |
) |
|
92 |
|
|
2,253 |
|
|
|
|
|
|
|
||||||
|
Other expense, net |
|
|
(6,290 |
) |
|
(11,657 |
) |
|
(4,811 |
) |
|
|
|
|
|
|
||||||
|
|
|
|
|
|
|
|
|
|
|
|
|
Loss from continuing operations before income taxes |
|
$ |
(9,121 |
) |
$ |
(14,682 |
) |
$ |
(8,650 |
) |
|
|
|
|
|
|
||||||
2009 versus 2008. Interest expense declined in 2009, compared to 2008, due to a lower average loan principal balance, the repayment of debt and lower interest rates. We repaid the remaining outstanding notes on September 2009. Interest income declined due to a lower average loan principal balance, increase in the percentage of nonperforming loans (increased defaults and unrecoverable losses on the underlying mortgage loans) and lower interest rates.
Losses on trading securities reflect the change in fair value on mortgage-backed securities. Losses on loans held for resale includes the adjustment necessary to present loans and real estate on our balance sheet at the estimated fair value, loan payoffs, foreclosures and charge-offs.
The UPB of nonperforming loans as a percentage of total UPB was 56% at December 31, 2009 compared to 48% at December 31, 2008. There were no loan sales during 2009.
The weighted average remaining life of the subordinated and residual securities was 1.28 years at December 31, 2009.
The following table shows selected assets and liabilities of our Loans and Residuals segment as of December 31:
|
|
|
|
|
|
|
|
|
|
|
|
2009 |
|
2008 |
|
||
|
|
|
|
|||||
|
Subordinate and residual trading securities |
|
$ |
3,634 |
|
$ |
4,204 |
|
|
Loans held for resale (1) |
|
|
33,197 |
|
|
49,918 |
|
|
Advances on loans held for resale |
|
|
4,321 |
|
|
4,867 |
|
|
Real estate (2) |
|
|
5,030 |
|
|
4,682 |
|
|
Other |
|
|
2,508 |
|
|
3,646 |
|
|
|
|
|
|
||||
|
Total assets |
|
$ |
48,690 |
|
$ |
67,317 |
|
|
|
|
|
|
||||
|
|
|
|
|
|
|
|
|
|
Lines of credit and other secured borrowings |
|
$ |
— |
|
$ |
17,760 |
|
|
Other |
|
|
1,164 |
|
|
1,409 |
|
|
|
|
|
|
||||
|
Total liabilities |
|
$ |
1,164 |
|
$ |
19,169 |
|
|
|
|
|
|
||||
|
|
|
|
(1) |
Loans held for resale at December 31, 2009 and 2008 include non-performing loans with a carrying value of $14,382 and $19,193, respectively. |
|
|
|
|
(2) |
Comprised of foreclosed properties that are reported net of fair value allowances of $4,810 and $4,748 at December 31, 2009 and 2008, respectively. During 2009, transfers from loans held for resale more than offset sales of real estate. |
2008 versus 2007. Interest expense declined in 2008, compared to 2007, primarily due to a 68% reduction in the average outstanding balances financing subordinate and residual trading securities and lower interest rates. Interest income declined due to a lower average balance of loans and securities and lower interest rates.
37
Losses on trading securities reflect the change in fair value on mortgage-backed securities. Losses on loans held for resale includes the adjustment necessary to present loans and real estate on our balance sheet at the estimated fair value, loan payoffs, foreclosures and charge-offs.
The UPB of nonperforming loans as a percentage of total UPB was 48% at December 31, 2008 compared to 50% at December 31, 2007. There were no loan sales during 2008.
The weighted average remaining life of the subordinated and residual securities was 1.62 years at December 31, 2008.
Asset Management Vehicles
The following table presents selected results of operations of our Asset Management Vehicles segment for the years ended December 31:
|
|
|
|
|
|
|
|
|
|
|
|
|
|
|
2009 |
|
2008 |
|
2007 |
|
|||
|
|
|
|
|
|
||||||
|
Revenue (1) |
|
$ |
1,851 |
|
$ |
3,664 |
|
$ |
1,444 |
|
|
Operating expenses |
|
|
3,108 |
|
|
4,113 |
|
|
829 |
|
|
|
|
|
|
|
||||||
|
Income (loss) from operations |
|
|
(1,257 |
) |
|
(449 |
) |
|
615 |
|
|
|
|
|
|
|
||||||
|
Other income (expense) |
|
|
|
|
|
|
|
|
|
|
|
OSI |
|
|
(2,650 |
) |
|
(5,643 |
) |
|
1,095 |
|
|
ONL and affiliates |
|
|
(1,410 |
) |
|
(3,525 |
) |
|
(1,920 |
) |
|
|
|
|
|
|
||||||
|
Equity in losses of unconsolidated entities |
|
|
(4,060 |
) |
|
(9,168 |
) |
|
(825 |
) |
|
Other, net |
|
|
— |
|
|
(196 |
) |
|
51 |
|
|
|
|
|
|
|
||||||
|
Other expense, net |
|
|
(4,060 |
) |
|
(9,364 |
) |
|
(774 |
) |
|
|
|
|
|
|
||||||
|
Loss from continuing operations before income taxes |
|
$ |
(5,317 |
) |
$ |
(9,813 |
) |
$ |
(159 |
) |
|
|
|
|
|
|
||||||
|
|
|
|
(1) |
Management fees earned from OSI and ONL and affiliates. |
2009 versus 2008. Management fee revenue continues to decline as the equity of the assets managed continues to decline. Lower equity losses in 2009 were primarily attributable to declines in the losses incurred by OSI and by ONL and affiliates. Losses incurred by these entities in 2009 and 2008 largely resulted from charges to reduce loans, real estate and residual securities to their fair values.
The following table shows selected assets and liabilities of our Asset Management Vehicles segment as of December 31:
|
|
|
|
|
|
|
|
|
|
|
|
2009 |
|
2008 |
|
||
|
|
|
|
|
||||
|
Receivables |
|
$ |
334 |
|
$ |
1,171 |
|
|
|
|
|
|
||||
|
OSI (1) |
|
|
7,885 |
|
|
15,410 |
|
|
ONL and affiliates (2) |
|
|
7,044 |
|
|
10,174 |
|
|
|
|
|
|
||||
|
Investments in unconsolidated entities |
|
|
14,929 |
|
|
25,584 |
|
|
|
|
|
|
||||
|
Other |
|
|
8 |
|
|
— |
|
|
|
|
|
|
||||
|
Total assets |
|
$ |
15,271 |
|
$ |
26,755 |
|
|
|
|
|
|
||||
|
|
|
|
(1) |
We received distributions totaling $4,875 during 2009. We did not make any investments in OSI during 2009 because our commitment to invest additional capital has expired. |
|
(2) |
During 2009, we received distributions totaling $1,783 and invested an additional $62 in ONL and its affiliates. At December 31, 2009, we had committed to invest up to an additional $33,840 in ONL and affiliated entities. The commitment expires in September 2010. |
2008 versus 2007. We began investing in these entities in the second and third quarters of 2007. Equity losses in 2008 were primarily attributable to losses incurred by OSI and by ONL and affiliates due to charges to reduce loans, real estate and residual securities to their fair values.
Mortgage Services, Financial Services and Technology Products
Mortgage Services, Financial Services and Technology Products were separated as of August 10, 2009 as part of the Separation of the Ocwen Solutions line of business, except for GSS and BMS Holdings which remain at Ocwen. The partial year results of Ocwen Solutions may not be indicative of results for the full year. As a separate, publicly-traded company, Altisource Portfolio Solutions S.A. (NASDAQ:ASPS) will file a Form 10-K with the Securities and Exchange Commission.
38
Corporate Items and Other
The following table presents selected results of operations of Corporate Items and Other for the years ended December 31:
|
|
|
|
|
|
|
|
|
|
|
|
|
|
|
2009 |
|
2008 |
|
2007 |
|
|||
|
|
|
|
|
|
||||||
|
Revenue |
|
$ |
1,066 |
|
$ |
156 |
|
$ |
1,162 |
|
|
Operating expenses |
|
|
16,308 |
|
|
18,743 |
|
|
5,775 |
|
|
|
|
|
|
|
||||||
|
Loss from operations |
|
|
(15,242 |
) |
|
(18,587 |
) |
|
(4,613 |
) |
|
|
|
|
|
|
||||||
|
Other income (expense) |
|
|
|
|
|
|
|
|
|
|
|
Interest income |
|
|
1,335 |
|
|
2,168 |
|
|
7,904 |
|
|
Interest expense |
|
|
(447 |
) |
|
(4,812 |
) |
|
(8,763 |
) |
|
Gain (loss) on trading securities |
|
|
11,756 |
|
|
(32,643 |
) |
|
(3,284 |
) |
|
Gain (loss) on debt redemption |
|
|
1,415 |
|
|
(86 |
) |
|
(3 |
) |
|
Other, net |
|
|
(235 |
) |
|
(300 |
) |
|
(9,110 |
) |
|
|
|
|
|
|
||||||
|
Other income (expense), net |
|
|
13,824 |
|
|
(35,673 |
) |
|
(13,256 |
) |
|
|
|
|
|
|
||||||
|
|
|
|
|
|
|
|
|
|
|
|
|
Loss from continuing operations before income taxes |
|
$ |
(1,418 |
) |
$ |
(54,260 |
) |
$ |
(17,869 |
) |
|
|
|
|
|
|
||||||
2009 versus 2008. Operating expenses declined primarily due to reduced professional service fees. In 2008, we incurred $11,396 of expenses related to strategic initiatives, including $9,532 in connection with the “going private” transaction which the parties mutually terminated in March 2008. In 2009, our legal fees and settlements increased by $4,577, and we recorded $3,477 of expenses related to the Separation.
We repurchased debt securities, thereby reducing interest expense and recognizing a gain on redemption. The unrealized gains on trading securities in 2009 were principally based on improvements in the underlying collateral markets and liquidity solution discussions for auction rate securities. In contrast, the unrealized losses on trading securities in 2008 primarily reflected worsening collateral markets and the failure of the auction rate securities markets.
The following table shows selected assets and liabilities of Corporate Items and Other as of December 31:
|
|
|
|
|
|
|
|
|
|
|
|
2009 |
|
2008 |
|
||
|
|
|
|
|
||||
|
Cash |
|
$ |
90,778 |
|
$ |
197,874 |
|
|
Trading securities, at fair value |
|
|
|
|
|
|
|
|
Auction rate (1) |
|
|
247,464 |
|
|
239,301 |
|
|
Subordinates and residuals |
|
|
58 |
|
|
165 |
|
|
Receivables, net (2) |
|
|
4,811 |
|
|
24,104 |
|
|
Income taxes receivable |
|
|
17,865 |
|
|
5,386 |
|
|
Deferred tax assets, net |
|
|
132,683 |
|
|
175,145 |
|
|
Premises and equipment, net |
|
|
3,214 |
|
|
3,415 |
|
|
Other |
|
|
17,304 |
|
|
19,572 |
|
|
|
|
|
|
||||
|
Total assets |
|
$ |
514,177 |
|
$ |
664,962 |
|
|
|
|
|
|
||||
|
|
|
|
|
|
|
|
|
|
Investment line (1) |
|
$ |
156,968 |
|
$ |
200,719 |
|
|
Debt securities (3) |
|
|
95,564 |
|
|
133,367 |
|
|
Other liabilities |
|
|
49,721 |
|
|
51,005 |
|
|
|
|
|
|
||||
|
Total liabilities |
|
$ |
302,253 |
|
$ |
385,091 |
|
|
|
|
|
|
||||
|
|
|
|
(1) |
In January, February and March of 2010, we liquidated $136,975 par value of securities for $122,640 cash. We recognized no gain or loss on these three transfers. Furthermore, we sold $88,150 par value of securities with the option to repurchase the same securities at the same sales price until October 2012. We used the majority of these proceeds to pay down the investment line subsequent to December 31, 2009. |
|
(2) |
The balance at December 31, 2008 included $8,286 of mortgage loans originated by BOK, net of allowances of $1,392. |
|
(3) |
February 2009, we repurchased $25,910 par value of our 3.25% Convertible Notes at a discount to par in the open market which generated a gain of $534, net of the write-off of unamortized issuance costs. In November 2009, we repurchased $14,250 par value of our 10.875% Capital Trust Securities at a discount to par in the open market resulting in a gain of $882, net of the write-off of unamortized issuance costs. |
2008 versus 2007. Operating expenses increased primarily due to higher professional service fees. In 2008, we incurred $11,396 of expenses related to strategic initiatives including $9,532 in connection with the “going private” transaction which the parties mutually terminated in March 2008.
39
The decline in interest income is principally due to a decline in the average balance of our investment in short-term investment grade securities including CMOs and commercial paper. Similarly, the decline in interest expense is due to repurchases of our debt securities during 2008.
The unrealized losses on auction rate securities in 2008 were principally determined based on extremely constrained collateral and credit markets and the failure of the auction markets supporting these securities.
In August 2007, we redeemed our investment in certificates of deposit prior to their maturity in order to meet an unanticipated liquidity need. The cash received from the issuer upon redemption was less than the adjusted cost basis of the certificates of deposit resulting in a loss of $8,673.
EQUITY
Total equity increased due to the net proceeds of $274,964 from the public offering of 32,200,000 shares of common stock in August 2009 and proceeds of $60,165 from the private placement of 5,471,500 shares of common stock in April 2009. The exercise of stock options and the compensation related to employee share-based awards along with net income of $272 also contributed to the increase in equity in 2009. Offsetting these increases were the distribution of $72,146 of net assets in connection with the Separation and the repurchase of 1,000,000 shares of common stock for $11,000.
Non-controlling interests of $252 and $406 at December 31, 2009 and December 31, 2008, respectively, primarily represented the 30% investment in GSS held by ML IBK Positions, Inc. With our adoption on January 1, 2009 of the new accounting guidance related to non-controlling interests, we reclassified non-controlling interest from a separate classification in our consolidated balance sheets to classification as a component of equity.
INCOME TAX EXPENSE (BENEFIT)
Income tax expense was $96,110, $12,006 and $15,186 for 2009, 2008 and 2007, respectively. In the third quarter of 2009, we incurred income tax expense of $52,047 in connection with the Separation of which $26,398 was deferred tax expense. Income tax expense for prior periods reflects the impact of the change in accounting for the Convertible Notes due to the adoption of FSP APB 14-1 (Codified within FASB Accounting Standards Codification (ASC) 470), “Debt.” See Note 1 to the financial statements for additional details relating to the impact of the adoption of this new accounting pronouncement.
Our effective tax rate for 2009, excluding the Separation, was 48.42% as compared to 38.71% and 28.45% for 2008 and 2007, respectively. Excluding the effect of increasing our liability for selected tax items in 2009, the increase in valuation allowances in 2008 and the reversal of valuation allowances in 2007, our effective tax rate was 36.42%, 34.25% and 39.38% for 2009, 2008 and 2007, respectively. For the years 2007 through 2009, we paid cash taxes at rates less than our effective tax rate due to the utilization of tax benefits including low income housing tax credits. Our Federal US cash tax rate for 2009, 2008 and 2007 approximates 20.00%. When combined with U.S state and international cash taxes, the rates are 24.80%, 29.29% and 26.68%, respectively. At December 31, 2009, we no longer have any low income housing tax credits available to reduce future taxable income. Income tax expense on income before income taxes differs from amounts that would be computed by applying the Federal corporate income tax rate of 35% primarily because of the effect of foreign taxes, foreign income with an indefinite deferral from U.S. taxation, losses from consolidated VIEs, state taxes, low-income housing tax credits, changes in the valuation allowance and changes in the liability for selected tax items. See Note 26 to our Consolidated Financial Statements for a reconciliation of taxes at the statutory rate to actual income tax expense.
Our effective tax rate for 2009 includes a non-cash benefit of approximately 1.17% associated with the recognition of certain foreign deferred tax assets, offset by 12.00% resulting from a non-cash increase in our liability for selected tax items related to recognized deferred tax assets arising from deductibility of losses in a finance vehicle.
Our effective tax rate for 2008 includes a benefit of approximately 1.56% associated with the recognition of certain foreign deferred tax assets. The effective tax rate for 2008 would have been 32.85% but was increased by approximately 4.50% due to the recognition of a valuation allowance on certain NCI related state net operating losses and 1.40% due to recognition of additional tax expense associated with the expiration of certain vested stock options.
Our effective tax rate for 2007 includes a benefit of approximately 3.32% associated with the recognition of certain foreign deferred tax assets and 5.23% associated with certain provision-to-return reconciling items recognized in the fourth quarter. These reconciling items are a result of certain estimates we used in our 2006 year-end tax provision for which we obtained additional information as part of the tax return preparation process.
40
LIQUIDITY AND CAPITAL RESOURCES
We define liquidity as unencumbered cash balances plus unused, collateralized advance financing capacity. Our liquidity as of December 31, as measured by cash and available credit, increased by $91,094, or 45%, from 2008 to 2009. At December 31, 2009, our cash position was $90,919 compared to $201,025 one year ago. Our available credit on collateralized but unused advance financing capacity was $201,200 at December 31, 2009 compared to zero a year ago. We used available cash to fund advance balances, as part of our debt and interest expense reduction strategy (more fully described below). We also distributed $20,028 of cash in connection with the Separation and made income tax payments of $52,910.
Investment policy and funding strategy. Our primary sources of funds for near-term liquidity are:
|
|
|
|
|
|
|
|
|
|
l |
Match funded liabilities |
l |
Payments received on loans held for resale |
|
|
|
l |
Lines of credit and other secured borrowings |
l |
Payments received on trading securities |
|
|
|
l |
Servicing fees, including float earnings |
l |
Debt securities |
In addition to these near-term sources, additional long-term sources of liquidity include debt securities and equity capital.
Our primary uses of funds are the funding of servicing advances, the payment of interest and operating expenses, the purchase of servicing rights and the repayment of borrowings. We closely monitor our liquidity position and ongoing funding requirements.
Our investment policies emphasize principal preservation by limiting investments to include:
|
|
|
|
|
|
l |
Securities issued by the U.S. government, a U.S. agency or a U.S. government-sponsored enterprise |
|
|
l |
Money market mutual funds |
|
|
l |
Money market demand deposits |
Currently, we are primarily invested in money market demand deposits. Furthermore, our investment policies are intended to minimize credit and counterparty risk by establishing risk limits based on each counterparty’s equity size and long-term credit ratings. We regularly monitor and project cash flow timing in connection with our efforts to optimize the risk-adjusted yield of our portfolio of investments.
During the global financial crises of 2007 and 2008, we made preservation of capital and expansion of advance financing capacity our top priorities in order to ensure we could meet our liquidity and operating needs.
In August 2009, we implemented a strategy to deploy excess cash balances to reduce outstanding debt levels and interest expense. We also began to execute on a strategy to increase the duration of our advance financing. As part of this strategy, we issued multi-year fixed rate notes under the Term Asset Loan Facility (TALF) program administered by the Federal Reserve Bank of New York and created a new advance facility structure which allows for multiple notes with staggering maturity dates to reduce roll-over risk.
Outlook. In 2010, we expect to reduce up-front facility fees and execute at tighter spreads over LIBOR and commercial paper rates. While we expect to benefit from the fixed interest rates on our $210,000 December 2009 and $200,000 February 2010 TALF notes, these rates are currently higher than LIBOR and commercial paper as of December 31, 2009.
We also expect to benefit from the increase in the duration of our funding sources. Our recent TALF issuances of $210,000 in December 2009 and $200,000 in February 2010 increased the maturity for 42% of our advance financing needs at fixed interest rates.
Following the repayment of the investment line in full in February 2010 and the transfers of auction rate securities for cash proceeds, we continue our efforts to release cash by liquidating the remaining auction rate securities with a fair value of $38,083 and par value of $38,800. We expect to complete this in 2010.
Debt financing summary. During 2009, we reduced our outstanding liabilities by:
|
|
|
|
|
|
l |
Repurchasing Convertible Notes with a face value of $25,910; |
|
|
l |
Repurchasing Capital Trust Securities with a face value of $14,250; |
|
|
l |
Repaying our $97,987 MSR financing facility; |
|
|
l |
Repaying $43,751 on our auction rate securities investment line; and |
|
|
l |
Repaying our Class A-1 notes, representing financing of our loans held for resale. |
41
Despite a credit environment that remains challenged, during 2009 we:
|
|
|
|
|
|
l |
Renewed a $200,000 advance note; |
|
|
l |
Obtained $67,000 in new term advance financing; |
|
|
l |
Renewed our investment line in support of the auction rate securities through June 30, 2010; |
|
|
l |
Increased the maximum borrowing capacity of a $300,000 advance financing facility to $500,000; |
|
|
l |
Issued a new variable funding note with a maximum borrowing capacity of $300,000; and |
|
|
l |
Issued $210,000 of advance receivable backed notes under the TALF program. |
As a result of our ability to renew and increase advance facility notes before they entered their amortization period and to issue the TALF notes, maximum borrowing capacity for match funded advances increased by $145,000 from $1,215,000 at December 31, 2008 to $1,360,000 at December 31, 2009. When coupled with a reduction in advances and match funded advances of $234,111, we increased our unused advance borrowing capacity from $257,893 at December 31, 2008 to $894,309 at December 31, 2009. Our prospects for advance financing have improved due to the inclusion of servicer advances in TALF which was announced by the Federal Reserve Bank of New York in on March 19, 2009. TALF allows lenders to invest a relatively small amount of equity while borrowing the remainder from the Federal Reserve Bank at a modest spread over LIBOR, with a note term of up to three years for servicer advances. On December 10, 2009, we issued $210,000 of TALF notes to replace the $165,000 term advance note that we repaid on August 11, 2009. The TALF note enters its amortization period in July 2012.
The amortization date is the date on which the revolving period ends under each advance facility note and repayment of the outstanding balance must begin if the note is not renewed or extended. The maturity date is the date on which all outstanding balances must be repaid. In all but one advance facility, there is a single note outstanding. For each of these facilities, after the amortization date, all collections that represent the repayment of advances pledged to the facility must be applied to reduce the balance of the note outstanding, and any new advances are ineligible to be financed. In order for us to maintain liquidity and the ability to finance new advances, we repay borrowings under facilities that have entered their amortization period and pledge them to another facility. Our new advance facility structure, which has four notes outstanding as of February 2010, permits collateral to be apportioned between notes when one or more notes are in amortization. This feature permits us to continue to finance new advances provided there is sufficient capacity on other revolving notes in the structure that are not in amortization.
42
In the table below, we provide the amortization dates and maturity dates for notes under each of our credit facilities as of December 31, 2009, excluding the investment line.
|
|
|
|
|
|
|
|
|
|
|
|
|
|
|
|
|
|
|
|
|
Maturity |
|
Amortization |
|
Maximum |
|
Unused |
|
Balance |
|
|||||
|
|
|
|
|
|
|
|
||||||||||
|
Servicing |
|
|
|
|
|
|
|
|
|
|
|
|
|
|
|
|
|
Match funded liabilities: |
|
|
|
|
|
|
|
|
|
|
|
|
|
|
|
|
|
Advance Receivable Backed Note Series 2009-3 (2) |
|
|
Jul. 2023 |
|
|
Jul. 2012 |
|
$ |
210,000 |
|
$ |
— |
|
$ |
210,000 |
|
|
Variable Funding Note Series 2009-1 (2) |
|
|
Dec. 2020 |
|
|
Feb. 2010 |
|
|
300,000 |
|
|
300,000 |
|
|
— |
|
|
Variable Funding Note |
|
|
Dec. 2013 |
|
|
Dec. 2010 |
|
|
250,000 |
|
|
91,588 |
|
|
158,412 |
|
|
Advance Receivable Backed Notes (3) |
|
|
Jan. 2019 |
|
|
Feb 2010 |
|
|
100,000 |
|
|
72,579 |
|
|
27,421 |
|
|
Advance Receivable Backed Notes |
|
|
May 2011 |
|
|
May 2010 |
|
|
500,000 |
|
|
430,142 |
|
|
69,858 |
|
|
|
|
|
|
|
|
|
||||||||||
|
Total match funded liabilities |
|
|
|
|
|
|
|
|
1,360,000 |
|
|
894,309 |
|
|
465,691 |
|
|
Fee reimbursement advance (4) |
|
|
Mar. 2014 |
|
|
Mar 2010 |
|
|
60,000 |
|
|
— |
|
|
60,000 |
|
|
Term note |
|
|
Mar. 2014 |
|
|
Mar. 2014 |
|
|
7,000 |
|
|
— |
|
|
7,000 |
|
|
|
|
|
|
|
|
|
||||||||||
|
|
|
|
|
|
|
|
|
|
1,427,000 |
|
|
894,309 |
|
|
532,691 |
|
|
|
|
|
|
|
|
|
||||||||||
|
Corporate Items and Other: |
|
|
|
|
|
|
|
|
|
|
|
|
|
|
|
|
|
Convertible notes (5) |
|
|
Aug. 2024 |
|
|
N/A |
|
|
— |
|
|
— |
|
|
56,435 |
|
|
Capital trust securities |
|
|
Aug. 2027 |
|
|
N/A |
|
|
— |
|
|
— |
|
|
39,129 |
|
|
|
|
|
|
|
|
|
|
|
|
|
||||||
|
|
|
|
|
|
|
|
|
|
— |
|
|
— |
|
|
95,564 |
|
|
|
|
|
|
|
|
|
|
|
|
|
||||||
|
Discount (4) |
|
|
|
|
|
|
|
|
— |
|
|
— |
|
|
(11,190 |
) |
|
|
|
|
|
|
|
|
|
|
|
|
||||||
|
|
|
|
|
|
|
|
|
$ |
1,427,000 |
|
$ |
894,309 |
|
$ |
617,065 |
|
|
|
|
|
|
|
|
|
|
|
|
|
||||||
|
|
|
|
(1) |
Unused borrowing capacity is available for use only to the extent that there are assets that have been pledged as collateral to a facility but against which no funds have been drawn. With respect to our match funded facilities, all eligible advances had been pledged to a facility at December 31, 2009. However, we had $201,200 of unused borrowing capacity readily available to us on December 31, 2009 because we had pledged collateral to, but fully drawn on, our facilities. |
|
(2) |
On December 10, 2009, we issued $210,000 of notes under the TALF program. These notes carry a 4.14% fixed rate of interest and enter their amortization period in July 2012. In addition, we issued two variable funding notes. One note with a maximum borrowing capacity of $300,000 enters its amortization period in February 2010. The second note has a maximum borrowing capacity of $100,000; however, the purchaser had no obligation to fund any borrowing under the note until January 2010, at which time the maximum funding obligation was $28,000. The maximum funding obligation under this note increases to $88,000 in November 2010 and to $100,000 in November 2011. |
|
(3) |
Effective December 31, 2009, we reduced the maximum borrowing capacity from $200,000 to $100,000. We extended this note through March 19, 2010. |
|
(4) |
The fee reimbursement advance is payable annually in five installments of $12,000. The advance does not carry a stated rate of interest. However, we are compensating the lender for the advance of funds by forgoing payment of fees due from the lender over the five-year term of the advance. Accordingly, we recorded the advance as a zero-coupon bond issued at an initial implied discount of $14,627. |
|
(5) |
On January 29, 2010, we repurchased $12,930 face amount of our Capital Trust Securities for a gain of $717. |
Our ability to finance servicing advances continues to be a significant factor that affects our liquidity. Three of our match funded advance facilities that are rated are subject to increases in the financing discount if deemed necessary by the rating agency in order to maintain the minimum rating required for the facility. While several rating agencies have adjusted their methodology for rating servicer advances and advance rates for newly issued notes are somewhat lower than in the past, we do not expect future advance rate changes to have a material effect on our liquidity. Our ability to continue to pledge collateral under each advance facility depends on the performance of the collateral. Currently, the majority of our collateral qualifies for financing under the advance facility to which it is pledged.
43
Some of our existing debt covenants limit our ability to incur additional debt in relation to our equity, require that we do not exceed maximum levels of delinquent loans and require that we maintain minimum levels of liquid assets and earnings. Failure to comply with these covenants could result in restrictions on new borrowings or the early termination of our borrowing facilities. We are currently in compliance with these covenants and do not expect them to restrict our activities.
Equity financing summary. In a private placement transaction that closed on April 3, 2009, we sold 5,471,500 shares of common stock at a price of $11.00 per share for $60,165 in proceeds. On the same date, we also purchased 1,000,000 shares of common stock from our Chairman of the Board at a price of $11.00 per share. These transactions generated net cash of $49,165.
On August 18, 2009, we completed the public offering of 32,200,000 shares of common stock which includes 4,200,000 shares of common stock purchased by the underwriters pursuant to the full exercise of the over-allotment option granted under the underwriting agreement. We received net proceeds of $274,964 from the offering after deducting underwriting discounts and other offering costs
Auction rate securities. In early 2008, we suffered a significant adverse liquidity event when the auction markets failed for our $300,000 investment in AAA-rated securities backed by securitized Federal Family Education Loan Program student loans. We financed this investment in auction rate securities through the investment line. With the failure of the auction markets for these securities, we were unable to sell our investment because the market mechanism no longer functioned.
At December 31, 2009, the fair value of this investment was $247,464 (representing $263,925 par value securities), and the remaining balance on the investment line was $156,968. We are successfully executing on our liquidation strategy.
|
|
|
|
|
|
l |
On January 16, 2010 and March 4, 2010, we settled two of our litigation actions related to auction rate securities resulting in the sale of a combined $103,625 par value for $92,775 cash proceeds. Proceeds from one settlement were used to pay down the investment line. |
|
|
l |
On February 5, 2010, we sold $33,350 par value of securities for cash proceeds of $29,865. These proceeds were used to pay down the investment line. |
|
|
l |
On February 12, 2010, we sold $88,150 par value of auction rate securities with the option to repurchase the same securities at the same sales price until October 2012, resulting in a secured borrowing of $74,928. Under this option, we sold the securities at the strike price, but we retain the ability to benefit from future increases in the value of the securities above the strike price over the term of the option. We used these proceeds to repay the investment line. |
On February 17, 2010, we repaid, in full, the investment line.
Cash flows for the year ended December 31, 2009. Our operating activities generated $206,646 of cash primarily due to lower investment in trading activities, declining delinquencies and lower collections. Trading activities provided $3,700 of cash from redemptions of auction rate securities at par.
Our investing activities used $3,161 cash primarily due to purchases of MSRs, offset by lower distributions received from asset management vehicles and reduced proceeds from sales of real estate.
Our financing activities used $313,591 cash as we made net repayments of $585,037 on match funded liabilities, other secured borrowings and the investment line, repurchased debt securities for $37,289 and distributed $20,028 of cash in connection with the Separation, offset in part by $324,129 of net proceeds from the issuance and repurchase of common stock.
Cash flows for the year ended December 31, 2008. Our operating activities provided $123,091 reflecting increased investment in trading activities, declining delinquencies and lower collections. Trading activities used $236,710 net cash reflecting our investment in auction rate securities, offset in part by the sale or maturity of CMOs and other short-term investment grade securities.
Our investing activities provided $40,440 net cash due to distributions received from asset management vehicles, purchases of MSRs and proceeds from sales of real estate and commercial MSRs.
Our financing activities used $76,749 cash as we made $262,960 of net repayments of borrowings under our match funded advance facilities and lines of credit, offset by $200,719 of net borrowing under the investment line to fund our investment in auction rate securities.
44
Cash flows for the year ended December 31, 2007. Our operating activities used $512,044 of cash primarily due to rising delinquencies and lower collections, which used $523,602 of net funding requirements for advances and match funded advances and $179,065 due to the change in servicer liabilities, offset in part by proceeds from our sale of the UK residuals and the maturity of commercial paper investments.
Our investing activities used $122,957 net cash due to purchases of MSRs of $113,502, investments in asset management entities totaling $73,513 and net cash paid to acquire NCI of $48,918, partially offset by $66,260 of cash received from our early redemption of certificates of deposit and the return of $45,894 of our investment in BMS Holdings.
Our financing activities provided $512,663 of cash primarily due to net proceeds from match funded liabilities and lines of credit of our Servicing business totaling $529,292 that were principally related to increased borrowings on servicing advances.
CONTRACTUAL OBLIGATIONS AND OFF BALANCE SHEET ARRANGEMENTS
Contractual Obligations
The following table sets forth certain information regarding amounts we owe to others under contractual obligations as of December 31, 2009:
|
|
|
|
|
|
|
|
|
|
|
|
|
|
|
|
|
|
|
|
|
Less Than |
|
After One |
|
After Three |
|
After Five |
|
Total |
|
|||||
|
|
|
|
|
|
|
|
||||||||||
|
3.25% Convertible Notes (1) |
|
$ |
— |
|
$ |
— |
|
$ |
56,435 |
|
$ |
— |
|
$ |
56,435 |
|
|
10.875% Capital Trust Securities (2) |
|
|
— |
|
|
— |
|
|
— |
|
|
39,129 |
|
|
39,129 |
|
|
Investment line (3) |
|
|
156,968 |
|
|
— |
|
|
— |
|
|
— |
|
|
156,968 |
|
|
Lines of credit and other secured borrowings |
|
|
12,000 |
|
|
24,000 |
|
|
31,000 |
|
|
— |
|
|
67,000 |
|
|
Contractual interest payments (4) |
|
|
6,978 |
|
|
13,050 |
|
|
12,867 |
|
|
55,319 |
|
|
88,214 |
|
|
Operating leases |
|
|
2,559 |
|
|
3,525 |
|
|
964 |
|
|
2,109 |
|
|
9,157 |
|
|
|
|
|
|
|
|
|
||||||||||
|
|
|
$ |
178,505 |
|
$ |
40,575 |
|
$ |
101,266 |
|
$ |
96,557 |
|
$ |
416,903 |
|
|
|
|
|
|
|
|
|
||||||||||
|
|
|
|
(1) |
The Convertible Notes will mature on August 1, 2024. However, beginning August 1, 2009, we may redeem all or a portion of the notes for cash for a price equal to 100% of the principal amount of the notes to be redeemed plus accrued and unpaid interest, if any. Holders may also require that we repurchase all or a portion of their notes for cash on August 1, 2014 and August 1, 2019. Also, upon the occurrence of a “fundamental change,” Holders may redeem the notes at a redemption price equal to 100% of the principal amount of the notes to be redeemed plus accrued and unpaid interest, if any. A fundamental change is a change of control or a termination of trading in our common stock. |
|
(2) |
On January 29, 2010, we repurchased and retired Capital Trust Securities in the face amount of $12,930. |
|
(3) |
The investment line will mature on June 30, 2010. Interest on the term note is 0.35% on that portion of the outstanding balance that does not exceed the available balances on deposit with the lender. For any portion of the outstanding balance of the term note that is in excess of the demand deposits, the interest rate is 1-month LIBOR plus 35 basis points. The 0.35% rate may be adjusted upward by the lender to a maximum of 3.35% if the lender determines that the 0.35% rate does not fairly reflect the cost to the lender of providing the funds. Future interest may vary depending on demand deposit levels, changes in LIBOR and sales or redemptions of auction rate securities. |
|
(4) |
Represents estimated future interest payments on borrowings, including capital leases, based on applicable interest rates as of December 31, 2009. |
45
We exclude match funded liabilities from the contractual obligation table above because it represents non-recourse debt that has been collateralized by match funded advances which are not available to satisfy general claims against Ocwen. Except for a guarantee by OLS of payment by one of the SPEs, holders of the notes issued by the SPEs have no recourse against any assets other than the match funded advances that serve as collateral for the securitized debt. OLS’ liability under the guaranty is limited to 10% of the notes outstanding at the end of the revolving period of the related match funded financing facility. At December 31, 2009, the debt outstanding under that facility was $69,858. Actual interest on match funded liabilities was $47,561 in 2009. Future interest may vary depending on utilization and changes in LIBOR and spreads.
Off-Balance Sheet Arrangements
In the normal course of business, we engage in transactions with a variety of financial institutions and other companies that are not reflected on our balance sheet. In addition, through our investment in subordinate and residual securities, we provide credit support to the senior classes of securities. We are subject to potential financial loss if the counterparties to our off-balance sheet transactions are unable to complete an agreed upon transaction. We seek to limit counterparty risk through financial analysis, dollar limits and other monitoring procedures. We have also entered into non-cancelable operating leases and have committed to invest up to an additional $33,840 in ONL and related entities.
Derivatives. We record all derivative transactions at fair value on our consolidated balance sheets. We use these derivatives primarily to manage our interest rate risk. The notional amounts of our derivative contracts do not reflect our exposure to credit loss. See Note 22 to our Consolidated Financial Statements for additional information regarding derivatives.
Involvement with SPEs. We use SPEs for a variety of purposes but principally in the financing of our servicing advances and in the securitization of mortgage loans.
Our securitizations of mortgage loans were structured as sales. The SPEs to which we have transferred the mortgage loans are qualifying special purpose entities (QSPEs) and therefore have not been subject to consolidation through 2009. We have retained both subordinated and residual interests in these QSPEs. Where we are the servicer of the securitized loans, we generally have the right to repurchase the mortgage loans from the QSPE when the costs exceed the benefits of servicing the remaining loans. See Note 1 to our Consolidated Financial Statements for information regarding accounting changes that eliminated the QSPE concept effective January 1, 2010.
We generally use match funded securitization facilities to finance our servicing advances. The SPEs to which the advances are transferred in the securitization transaction are included in our consolidated financial statements either because the transfer did not qualify for sales accounting treatment or because the SPE is not a QSPE, and we have the majority equity interest in the SPE, or we are the primary beneficiary where the SPE is also a VIE. The holders of the debt of these SPEs can look only to the assets of the SPEs for satisfaction of the debt and have no recourse against OCN. However, OLS has guaranteed the payment of the obligations of the issuer under a match funded facility that closed in April 2008. The maximum amount payable under the guarantee is limited to 10% of the notes outstanding at the end of the facility’s revolving period.
VIEs. In addition to certain of our financing SPEs, we have invested in several other VIEs primarily in connection with purchases of whole loans. If we determine that we are the primary beneficiary of a VIE, we report the VIE in our consolidated financial statements.
RECENT ACCOUNTING DEVELOPMENTS
Recent Accounting Pronouncements
Listed below are recent accounting pronouncements which did or are expected to have a significant impact upon adoption. For additional information regarding these and other recent accounting pronouncements, see Note 1 to our Consolidated Financial Statements.
ASC 860, Transfers and Servicing. This statement clarifies that the objective of the standard is to determine whether a transferor and all of the entities included in the transferor’s financial statements being presented have surrendered control over transferred financial assets. That determination must consider the transferor’s continuing involvements in the transferred financial asset, including all arrangements or agreements made contemporaneously with, or in contemplation of, the transfer, even if they were not entered into at the time of the transfer. This statement modifies the financial-components approach currently used and limits the circumstances in which a financial asset, or portion of a financial asset, should be derecognized when the transferor has not transferred the entire original financial asset to an entity that is not consolidated with the transferor in the financial statements being presented and/or when the transferor has continuing involvement with the transferred financial asset.
46
This statement defines the term participating interest to establish specific conditions for reporting a transfer of a portion of a financial asset as a sale. If the transfer does not meet those conditions, a transferor should account for the transfer as a sale only if it transfers an entire financial asset or a group of entire financial assets and surrenders control over the entire transferred asset(s). This statement requires that a transferor recognize and initially measure at fair value all assets obtained (including a transferor’s beneficial interest) and liabilities incurred as a result of a transfer of financial assets accounted for as a sale. Enhanced disclosures are required to provide financial statement users with greater transparency about transfers of financial assets and a transferor’s continuing involvement with transferred financial assets.
The provisions for guaranteed mortgage securitizations are removed to require those securitizations to be treated the same as any other transfer of financial assets within the scope of the standard. If such a transfer does not meet the requirements for sale accounting, the securitized mortgage loans should continue to be classified as loans in the transferor’s statement of financial position.
We are currently evaluating the impact of this standard upon adoption effective January 1, 2010.
ASC 810, Consolidation. This standard requires an enterprise to perform ongoing periodic assessments to determine whether the enterprise’s variable interest or interests give it a controlling financial interest in a VIE. We adopted this standard effective January 1, 2010. This analysis identifies the primary beneficiary of a VIE as the enterprise that has both of the following characteristics:
|
|
|
|
|
|
(a) |
The power to direct the activities of a variable interest entity that most significantly impact the entity’s economic performance |
|
|
|
|
|
|
(b) |
The obligation to absorb losses of the entity that could potentially be significant to the VIE or the right to receive benefits from the entity that could potentially be significant to the VIE. |
In addition to reintroducing the concept of control into the determination of the primary beneficiary of a VIE, this statement makes numerous other amendments to the current standards to primarily reflect the elimination of the concept of a QSPE under ASC 860 (above). This statement also amends the current standards to require enhanced disclosures that will provide users of financial statements with more transparent information about an enterprise’s involvement in a variable interest entity. The enhanced disclosures are required for any enterprise that holds a variable interest in a VIE. The additional disclosures required by this statement are included in Note 1—Principles of Consolidation.
This standard became effective as of January 1, 2010.
As disclosed in Note 1—Securitizations of Residential Mortgage Loans, we currently exclude certain loan securitization trusts from our consolidated financial statements because each is a QSPE. Effective January 1, 2010, we are required to reevaluate these QSPEs as well as all other potentially significant interests in other unconsolidated entities, such as our asset management vehicles and the securitization trusts underlying our servicing portfolio, to determine if we should include them in our consolidated financial statements. We are currently evaluating the potential impact of this new standard, in connection with the new guidance issued under ASC 860 (above).
ASC 470, Debt. The FASB issued FSP No. APB 14-1 (Codified within ASC 470) providing guidance on convertible debt instruments that may be settled in cash upon conversion (including partial cash settlement). Under this guidance, issuers of such instruments should separately account for the liability and equity components in a manner that will reflect the entity’s nonconvertible debt borrowing rate when interest cost is recognized in subsequent periods. Upon adoption of this standard on January 1, 2009, we recognized a discount to reduce the carrying value of the 3.25% Convertible Notes and an offsetting increase to stockholders’ equity. The cumulative effect of adoption resulted in: (1) a reduction of retained earnings of $12,678 due to the retrospective accretion of the resulting debt discount to interest expense over the expected life of the notes; (2) adjustments to debt issue cost amortization and gains or losses recognized on previous redemptions; and (3) an increase in additional paid-in capital of $19,567. The adjustment to additional paid-in capital includes the recognized debt discount, adjusted for note redemptions, and the effect of deferred taxes, as well as net gains or losses attributable to redemptions of the equity component. Interest expense for the years ended December 31, 2008 and 2007 have been adjusted to include amortization of debt discount of $3,886 and $4,069, respectively, and a reduction in the amortization of debt issue costs of $136 and $153, respectively. The gain previously recognized on the redemption of debt securities during 2008 of $3,595 has been adjusted to reflect a loss of $86 on the debt component of the convertible notes in the statement of operations and a gain of $2,800 in additional paid in capital for the equity component.
47
|
|
|
|
QUANTITATIVE AND QUALITATIVE DISCLOSURES ABOUT MARKET RISK (Dollars in thousands) |
Market risk includes liquidity risk, interest rate risk and foreign currency exchange rate risk. Market risk also reflects the risk of declines in the valuation of financial instruments and the collateral underlying loans. Our Investment Committee reviews significant transactions that may impact market risk and is authorized to utilize a wide variety of techniques and strategies to manage market risk including, in particular, interest rate and foreign currency exchange rate risk.
Liquidity Risk
We are exposed to liquidity risk primarily because of the cash requirements to support the Servicing business including the requirement to make advances pursuant to servicing contracts and the process of remitting borrower payments to the custodial accounts. In general, we finance our operations through operating cash flows and various other sources of funding including match funded agreements and secured lines of credit. On April 30, 2009, we were successful in negotiating a one-year extension of the investment line to June 30, 2010. However, because of the failed auctions, the market for auction rate securities is currently not liquid. In the event we need to liquidate our investment, we may not be able to do so without a loss of principal.
Interest Rate Risk
We are exposed to interest rate risk to the degree that our interest-bearing liabilities mature or reprice at different speeds, or different bases, than our interest-earning assets or when we use debt to finance assets that are non-interest earning. Our Servicing business is characterized by non-interest earning assets financed by interest-bearing liabilities. Among the more significant non-interest earning assets are servicing advances and MSRs. At December 31, 2009, we had total advances and match funded advances of $968,529. We are indirectly exposed to interest risk by our funding of advances because approximately 55% of our total advances and match funded advances are funded through borrowings, most of which are variable rate debt. Earnings on float balances (assets) partially offset this risk.
Following our successful equity capital raise in August 2009, we implemented a strategy to deploy excess cash balances to reduce outstanding debt levels and interest expense. We significantly reduced our ratio of interest-rate sensitive assets to interest rate sensitive liabilities from 2008 to 2009. This reduction helps to reduce our exposure to interest rate volatility. In 2010, we expect to reduce up-front facility fees and execute at tighter spreads over LIBOR and commercial paper rates. We also expect to benefit from the increase in the duration of our funding sources. Our recent Term Asset Loan Facility (TALF) issuances of $210,000 in December 2009 and $200,000 in February 2010 increased the maturity for 42% of our advance financing needs at fixed interest rates.
48
The tables below present the notional amounts of our financial instruments that are sensitive to changes in interest rates categorized by expected maturity and the related fair value of these instruments at December 31, 2009 and 2008. We use certain assumptions to estimate the expected maturity and fair value of these instruments. We base expected maturities upon contractual maturity and projected repayments and prepayments of principal based on our historical experience. The actual maturities of these instruments could vary substantially if future prepayments differ from our historical experience. Average interest rates are based on the contractual terms of the instrument and, in the case of variable rate instruments, reflect estimates of applicable forward rates as of December 31, 2009. The average presented is the weighted average.
|
|
|
|
|
|
|
|
|
|
|
|
|
|
|
|
|
|
|
|
|
|
|
|
|
|
|
|
|
|
Expected Maturity Date at December 31, 2009 |
|
|
|
|
|
|
|
||||||||||||||||
|
|
|
|
|
|
|
|
|
|
|||||||||||||||||
|
|
|
2010 |
|
2011 |
|
2012 |
|
2013 |
|
2014 |
|
There- |
|
Total |
|
Fair |
|
||||||||
|
|
|
|
|
|
|
|
|
|
|
||||||||||||||||
|
Rate-Sensitive Assets: |
|
|
|
|
|
|
|
|
|
|
|
|
|
|
|
|
|
|
|
|
|
|
|
|
|
|
Interest-earning cash |
|
$ |
50,373 |
|
$ |
— |
|
$ |
— |
|
$ |
— |
|
$ |
— |
|
$ |
— |
|
$ |
50,373 |
|
$ |
50,373 |
|
|
Average interest rate |
|
|
0.50 |
% |
|
— |
|
|
— |
|
|
— |
|
|
— |
|
|
— |
|
|
0.50 |
% |
|
|
|
|
Trading securities: |
|
|
|
|
|
|
|
|
|
|
|
|
|
|
|
|
|
|
|
|
|
|
|
|
|
|
Auction rate |
|
|
122,877 |
|
|
124,587 |
|
|
— |
|
|
— |
|
|
— |
|
|
— |
|
|
247,464 |
|
|
247,464 |
|
|
Average interest rate |
|
|
1.01 |
% |
|
1.59 |
% |
|
— |
|
|
— |
|
|
— |
|
|
— |
|
|
1.29 |
% |
|
|
|
|
Subordinates and residuals |
|
|
593 |
|
|
421 |
|
|
189 |
|
|
312 |
|
|
496 |
|
|
1,681 |
|
|
3,692 |
|
|
3,692 |
|
|
Average interest rate |
|
|
19.65 |
% |
|
19.68 |
% |
|
19.51 |
% |
|
18.79 |
% |
|
18.78 |
% |
|
18.73 |
% |
|
19.04 |
% |
|
|
|
|
Loans held for resale (2) |
|
|
12,271 |
|
|
12,024 |
|
|
3,631 |
|
|
1,698 |
|
|
1,049 |
|
|
2,524 |
|
|
33,197 |
|
|
33,197 |
|
|
Average interest rate |
|
|
9.74 |
% |
|
9.45 |
% |
|
8.76 |
% |
|
8.69 |
% |
|
8.63 |
% |
|
8.63 |
% |
|
9.35 |
% |
|
|
|
|
Interest–earning collateral and debt service deposits |
|
|
53,892 |
|
|
5,000 |
|
|
— |
|
|
— |
|
|
— |
|
|
— |
|
|
58,892 |
|
|
58,892 |
|
|
Average interest rate |
|
|
0.44 |
% |
|
0.10 |
% |
|
— |
|
|
— |
|
|
— |
|
|
— |
|
|
0.41 |
% |
|
|
|
|
|
|
|
|
|
|
|
|
|
|
||||||||||||||||
|
Total rate-sensitive assets |
|
$ |
240,006 |
|
$ |
142,032 |
|
$ |
3,820 |
|
$ |
2,010 |
|
$ |
1,545 |
|
$ |
4,205 |
|
$ |
393,618 |
|
$ |
393,618 |
|
|
|
|
|
|
|
|
|
|
|
|
||||||||||||||||
|
Rate-Sensitive Liabilities: |
|
|
|
|
|
|
|
|
|
|
|
|
|
|
|
|
|
|
|
|
|
|
|
|
|
|
Match funded liabilities: |
|
|
|
|
|
|
|
|
|
|
|
|
|
|
|
|
|
|
|
|
|
|
|
|
|
|
Fixed rate |
|
$ |
— |
|
$ |
— |
|
$ |
150,000 |
|
$ |
60,000 |
|
$ |
— |
|
$ |
— |
|
$ |
210,000 |
|
$ |
208,025 |
|
|
Average interest rate |
|
|
— |
|
|
— |
|
|
4.14 |
% |
|
4.14 |
% |
|
— |
|
|
— |
|
|
4.14 |
% |
|
|
|
|
Variable interest rate |
|
|
255,691 |
|
|
— |
|
|
— |
|
|
— |
|
|
— |
|
|
— |
|
|
255,691 |
|
|
255,691 |
|
|
Average interest rate |
|
|
2.12 |
% |
|
— |
|
|
— |
|
|
— |
|
|
— |
|
|
— |
|
|
2.12 |
% |
|
|
|
|
Lines of credit and other secured borrowings |
|
|
7,979 |
|
|
8,785 |
|
|
9,672 |
|
|
10,649 |
|
|
18,725 |
|
|
— |
|
|
55,810 |
|
|
56,220 |
|
|
Average interest rate |
|
|
10.10 |
% |
|
10.10 |
% |
|
10.10 |
% |
|
10.10 |
% |
|
7.72 |
% |
|
— |
|
|
9.30 |
% |
|
|
|
|
Investment Line |
|
|
156,968 |
|
|
— |
|
|
— |
|
|
— |
|
|
— |
|
|
— |
|
|
156,968 |
|
|
156,968 |
|
|
Average interest rate |
|
|
0.35 |
% |
|
— |
|
|
— |
|
|
— |
|
|
— |
|
|
— |
|
|
0.35 |
% |
|
|
|
|
Debt securities (4) |
|
|
— |
|
|
— |
|
|
— |
|
|
— |
|
|
56,435 |
|
|
39,129 |
|
|
95,564 |
|
|
84,551 |
|
|
Average interest rate |
|
|
— |
|
|
— |
|
|
— |
|
|
— |
|
|
3.25 |
% |
|
10.88 |
% |
|
6.37 |
% |
|
|
|
|
|
|
|
|
|
|
|
|
|
|
||||||||||||||||
|
Total rate-sensitive liabilities |
|
$ |
420,638 |
|
$ |
8,785 |
|
$ |
159,672 |
|
$ |
70,649 |
|
$ |
75,160 |
|
$ |
39,129 |
|
$ |
774,033 |
|
$ |
761,455 |
|
|
|
|
|
|
|
|
|
|
|
|
||||||||||||||||
|
Rate-Sensitive Derivative Financial Instruments: |
|
||||||||||||||||||||||||
|
Interest rate caps: |
|
|
|
|
|
|
|
|
|
|
|
|
|
|
|
|
|
|
|
|
|
|
|
|
|
|
Outstanding notional |
|
$ |
99,996 |
|
$ |
91,665 |
|
$ |
83,328 |
|
$ |
83,344 |
|
$ |
— |
|
$ |
— |
|
$ |
358,333 |
|
$ |
781 |
|
|
|
|
|
|
|
|
|
|
|
|
||||||||||||||||
|
Average strike rate (6) |
|
|
6.50 |
% |
|
6.50 |
% |
|
6.50 |
% |
|
6.50 |
% |
|
— |
|
|
— |
|
|
— |
|
|
|
|
|
Forward LIBOR curve (6) |
|
|
1.49 |
% |
|
2.88 |
% |
|
3.86 |
% |
|
4.32 |
% |
|
— |
|
|
— |
|
|
— |
|
|
|
|
49
|
|
|
|
|
|
|
|
|
|
|
|
|
|
|
|
|
|
|
|
|
|
|
|
|
|
|
|
|
|
Expected Maturity Date at December 31, 2008 |
|
|
|
|
|
||||||||||||||||||
|
|
|
|
|
|
|
|
|||||||||||||||||||
|
|
|
2009 |
|
2010 |
|
2011 |
|
2012 |
|
2013 |
|
There- |
|
Total |
|
Fair |
|
||||||||
|
|
|
|
|
|
|
|
|
|
|
||||||||||||||||
|
Rate-Sensitive Assets: |
|
|
|
|
|
|
|
|
|
|
|
|
|
|
|
|
|
|
|
|
|
|
|
|
|
|
Interest-earning cash |
|
$ |
7,371 |
|
$ |
— |
|
$ |
— |
|
$ |
— |
|
$ |
— |
|
$ |
— |
|
$ |
7,371 |
|
$ |
7,371 |
|
|
Average interest rate |
|
|
3.30 |
% |
|
— |
|
|
— |
|
|
— |
|
|
— |
|
|
— |
|
|
3.30 |
% |
|
|
|
|
Trading securities: |
|
|
|
|
|
|
|
|
|
|
|
|
|
|
|
|
|
|
|
|
|
|
|
|
|
|
Auction rate |
|
|
— |
|
|
— |
|
|
239,301 |
|
|
— |
|
|
— |
|
|
— |
|
|
239,301 |
|
|
239,301 |
|
|
Average interest rate |
|
|
— |
|
|
— |
|
|
3.30 |
% |
|
— |
|
|
— |
|
|
— |
|
|
3.30 |
% |
|
|
|
|
Subordinates and residuals |
|
|
1,027 |
|
|
234 |
|
|
12 |
|
|
299 |
|
|
517 |
|
|
2,280 |
|
|
4,369 |
|
|
4,369 |
|
|
Average interest rate |
|
|
20.04 |
% |
|
20.40 |
% |
|
21.38 |
% |
|
19.71 |
% |
|
19.75 |
% |
|
20.40 |
% |
|
20.19 |
% |
|
|
|
|
Loans held for resale (2) |
|
|
16,325 |
|
|
17,678 |
|
|
7,091 |
|
|
2,850 |
|
|
1,755 |
|
|
4,219 |
|
|
49,918 |
|
|
49,918 |
|
|
Average interest rate |
|
|
8.16 |
% |
|
8.75 |
% |
|
9.69 |
% |
|
9.39 |
% |
|
9.50 |
% |
|
8.22 |
% |
|
8.67 |
% |
|
|
|
|
Interest–earning collateral and debt service deposits |
|
|
68,152 |
|
|
— |
|
|
— |
|
|
— |
|
|
— |
|
|
— |
|
|
68,152 |
|
|
68,152 |
|
|
Average interest rate |
|
|
1.31 |
% |
|
— |
|
|
— |
|
|
— |
|
|
— |
|
|
— |
|
|
1.31 |
% |
|
|
|
|
|
|
|
|
|
|
|
|
|
|
||||||||||||||||
|
Total rate-sensitive assets |
|
$ |
92,875 |
|
$ |
17,912 |
|
$ |
246,404 |
|
$ |
3,149 |
|
$ |
2,272 |
|
$ |
6,499 |
|
$ |
369,111 |
|
$ |
369,111 |
|
|
|
|
|
|
|
|
|
|
|
|
||||||||||||||||
|
|
|
|
|
|
|
|
|
|
|
|
|
|
|
|
|
|
|
|
|
|
|
|
|
|
|
|
Rate-Sensitive Liabilities: |
|
|
|
|
|
|
|
|
|
|
|
|
|
|
|
|
|
|
|
|
|
|
|
|
|
|
Match funded liabilities: |
|
|
|
|
|
|
|
|
|
|
|
|
|
|
|
|
|
|
|
|
|
|
|
|
|
|
Fixed rate |
|
$ |
165,000 |
|
$ |
— |
|
$ |
— |
|
$ |
— |
|
$ |
— |
|
$ |
— |
|
$ |
165,000 |
|
$ |
173,126 |
|
|
Average interest rate |
|
|
5.34 |
% |
|
— |
|
|
— |
|
|
— |
|
|
— |
|
|
— |
|
|
5.34 |
% |
|
|
|
|
Variable interest rate |
|
|
457,226 |
|
|
334,881 |
|
|
— |
|
|
— |
|
|
— |
|
|
— |
|
|
792,107 |
|
|
792,107 |
|
|
Average interest rate |
|
|
4.85 |
% |
|
4.30 |
% |
|
— |
|
|
— |
|
|
— |
|
|
— |
|
|
4.62 |
% |
|
|
|
|
Lines of credit and other secured borrowings |
|
|
102,872 |
|
|
13,998 |
|
|
— |
|
|
— |
|
|
— |
|
|
— |
|
|
116,870 |
|
|
116,870 |
|
|
Average interest rate |
|
|
5.07 |
% |
|
4.47 |
% |
|
— |
|
|
— |
|
|
— |
|
|
— |
|
|
5.07 |
% |
|
|
|
|
Investment Line |
|
|
200,719 |
|
|
— |
|
|
— |
|
|
— |
|
|
— |
|
|
— |
|
|
200,719 |
|
|
200,719 |
|
|
Average interest rate |
|
|
0.35 |
% |
|
— |
|
|
— |
|
|
— |
|
|
— |
|
|
— |
|
|
0.35 |
% |
|
|
|
|
Debt securities (4) (5) |
|
|
79,988 |
|
|
— |
|
|
— |
|
|
— |
|
|
— |
|
|
53,379 |
|
|
133,367 |
|
|
112,764 |
|
|
Average interest rate |
|
|
8.25 |
% |
|
— |
|
|
— |
|
|
— |
|
|
— |
|
|
10.88 |
% |
|
9.30 |
% |
|
|
|
|
|
|
|
|
|
|
|
|
|
|
||||||||||||||||
|
Total rate-sensitive liabilities |
|
$ |
1,005,805 |
|
$ |
348,879 |
|
$ |
— |
|
$ |
— |
|
$ |
— |
|
$ |
53,379 |
|
$ |
1,408,063 |
|
$ |
1,395,586 |
|
|
|
|
|
|
|
|
|
|
|
|
||||||||||||||||
|
|
|
|
|
|
|
|
|
|
|
|
|
|
|
|
|
|
|
|
|
|
|
|
|
|
|
|
Rate-Sensitive Derivative Financial Instruments: |
|
|
|
|
|
|
|
|
|
|
|
|
|
|
|
|
|
|
|
||||||
|
Interest rate caps: |
|
|
|
|
|
|
|
|
|
|
|
|
|
|
|
|
|
|
|
|
|
|
|
|
|
|
Outstanding notional |
|
$ |
91,667 |
|
$ |
99,996 |
|
$ |
91,665 |
|
$ |
83,328 |
|
$ |
83,344 |
|
$ |
— |
|
$ |
450,000 |
|
$ |
193 |
|
|
|
|
|
|
|
|
|
|
|
|
||||||||||||||||
|
Average strike rate (6) |
|
|
6.50 |
% |
|
6.50 |
% |
|
6.50 |
% |
|
6.50 |
% |
|
6.50 |
% |
|
— |
|
|
— |
|
|
|
|
|
Forward LIBOR curve (6) |
|
|
1.40 |
% |
|
2.08 |
% |
|
2.50 |
% |
|
2.68 |
% |
|
2.72 |
% |
|
— |
|
|
— |
|
|
|
|
|
|
|
|
(1) |
See Note 3 to our Consolidated Financial Statements for additional fair value information for financial instruments. |
|
(2) |
Net of market valuation allowances and including non-performing loans. |
|
(3) |
Represents two interest rate caps purchased to hedge our exposure to rising interest rates on two match funded liabilities. The average interest rate presented is the weighted-average cap rate for these instruments. One cap begins amortizing in February 2009. |
|
(4) |
The Convertible Notes mature on August 1, 2024. Holders may require that we repurchase all or a portion of their notes for cash on August 1, 2014 and August 1, 2019. Also, investors may redeem the notes at par, plus accrued and unpaid interest, if any, in the event of a change of control or termination of trading in our common stock. |
|
(5) |
On August 3, 2009, holders of the Convertible Notes had the right to require that we repurchase all or a portion of their notes for cash. There were no material redemptions. |
|
(6) |
The strike rate is 1-month LIBOR. |
50
Foreign Currency Exchange Rate Risk
We are exposed to foreign currency exchange rate risk in connection with our investment in non-U.S. dollar functional currency operations to the extent that our foreign exchange positions remain unhedged. Our operations in Germany, Uruguay and India expose us to foreign currency exchange rate risk, but we consider this risk to be insignificant. During 2009, as a result of the sale of BOK, we closed the hedge of our investment in BOK by covering the short sale of foreign currency futures that we used to effect the hedge.
|
|
|
|
FINANCIAL STATEMENTS AND SUPPLEMENTARY DATA |
The information required by this section is contained in the Consolidated Financial Statements of Ocwen Financial Corporation and Report of Deloitte & Touche LLP, Independent Registered Certified Public Accounting Firm, beginning on Page F-1.
|
|
|
|
CHANGES IN AND DISAGREEMENTS WITH ACCOUNTANTS ON ACCOUNTING AND FINANCIAL DISCLOSURE |
On August 31, 2009, the Audit Committee of the Board of Directors of Ocwen approved the dismissal of PricewaterhouseCoopers LLP as Ocwen’s independent registered public accounting firm for the year ending December 31, 2009 and the engagement of Deloitte & Touche LLP as Ocwen’s independent registered public accounting firm for the year ending December 31, 2009. The dismissal of PricewaterhouseCoopers LLP was effective as of August 31, 2009.
The report of PricewaterhouseCoopers LLP on our consolidated financial statements for each of the two years in the period ended December 31, 2008, which was included in our 2008 Annual Report on Form 10-K, did not contain any adverse opinion or disclaimer of opinion, nor was such report qualified or modified as to uncertainty, audit scope or accounting principle.
During each of the two years in the period ended December 31, 2008 and through August 31, 2009, (i) there were no disagreements with PricewaterhouseCoopers LLP on any matter of accounting principles or practices, financial statement disclosure, or auditing scope or procedure, which disagreements, if not resolved to the satisfaction of PricewaterhouseCoopers LLP, would have caused PricewaterhouseCoopers LLP to make reference to the subject matter of the disagreements in connection with its reports on the financial statements for such years, and (ii) there were no “reportable events” as defined in Item 304(a)(1)(v) of Regulation S-K.
During each of the two years in the period ended December 31, 2008 and through August 31, 2009, neither Ocwen nor anyone on its behalf consulted with Deloitte & Touche LLP with respect to either (i) the application of accounting principles to a specified transaction, either completed or proposed, or the type of audit opinion that might be rendered on Ocwen’s consolidated financial statements, and no written report or oral advice was provided by Deloitte & Touche LLP to Ocwen that Deloitte & Touche LLP concluded was an important factor considered by Ocwen in reaching a decision as to the accounting, auditing or financial reporting issue, or (ii) any matter that was either the subject of a disagreement (as defined in Item 304(a)(1)(iv) of Regulation S-K and the related instructions to that Item) or a reportable event (as described in Item 304(a)(1)(v) of Regulation S-K).
|
|
|
|
CONTROLS AND PROCEDURES |
Evaluation of Disclosure Controls and Procedures
Our management, under the supervision of and with the participation of our Chief Executive Officer and Chief Financial Officer, has evaluated the effectiveness of our disclosure controls and procedures, as such term is defined in Rules 13a-15(e) and 15d-15(e) under the Securities Exchange Act of 1934, as amended (the Exchange Act), as of the end of the period covered by this Annual Report. Based on such evaluation, our Chief Executive Officer and Chief Financial Officer have concluded that, as of the end of such period, our disclosure controls and procedures are effective.
Management’s Report on Internal Control over Financial Reporting
Our management is responsible for establishing and maintaining adequate internal control over financial reporting, as that term is defined in Exchange Act Rules 13a-15(f) and 15d-15(f).
Under the supervision of and with the participation of our management, including our Chief Executive Officer and Chief Financial Officer, we have conducted an evaluation of our internal control over financial reporting as of December 31, 2009, based on the framework set forth by the Committee of Sponsoring Organizations of the Treadway Commission (COSO) in Internal Control—Integrated Framework. Based on that evaluation, our management concluded that, as of December 31, 2009, internal control over financial reporting is effective based on criteria established in Internal Control—Integrated Framework issued by the COSO.
51
The effectiveness of OCN’s internal control over financial reporting as of December 31, 2009, has been audited by Deloitte & Touche LLP, an independent registered certified public accounting firm, as stated in their report that appears herein.
Limitations on the Effectiveness of Controls
A company’s internal control over financial reporting is a process designed to provide reasonable assurance regarding the reliability of financial reporting and the preparation of financial statements for external purposes in accordance with accounting principles generally accepted in the United States of America. A company’s internal control over financial reporting includes those policies and procedures that (i) pertain to the maintenance of records that, in reasonable detail, accurately and fairly reflect the transactions and dispositions of the assets of the company; (ii) provide reasonable assurance that transactions are recorded as necessary to permit preparation of financial statements in accordance with accounting principles generally accepted in the United States of America and that receipts and expenditures of the company are being made only in accordance with authorizations of management and directors of the company; and (iii) provide reasonable assurance regarding prevention or timely detection of unauthorized acquisition, use or disposition of the company’s assets that could have a material effect on the financial statements.
Because of its inherent limitations, internal control over financial reporting may not prevent or detect misstatements. In addition, projections of any evaluation of effectiveness to future periods are subject to the risk that controls may become inadequate because of changes in conditions or that the degree of compliance with the policies or procedures may deteriorate.
Changes in Internal Control over Financial Reporting
There have not been any changes in our internal control over financial reporting during our fiscal quarter ended December 31, 2009 that have materially affected, or are reasonably likely to materially affect, our internal control over financial reporting.
|
|
|
|
OTHER INFORMATION |
There was no information required to be reported on Form 8-K during the fourth quarter of the year covered by this Form 10-K that was not so reported.
|
|
|
|
DIRECTORS, EXECUTIVE OFFICERS AND CORPORATE GOVERNANCE |
The information contained in our 2010 Proxy Statement under the captions “Election of Directors—Nominees for Director,” “Executive Officers Who Are Not Directors,” “Board of Directors and Corporate Governance—Committees of the Board of Directors—Audit committee”, “Security Ownership of Certain Beneficial Owners and Related Stockholder Matters—Section 16(a) Beneficial Ownership Reporting Compliance” and “Board of Directors and Corporate Governance—Code of Ethics” is incorporated herein by reference.
|
|
|
|
EXECUTIVE COMPENSATION |
The information contained in our 2010 Proxy Statement under the captions “Executive Compensation” and “Board of Directors Compensation” is incorporated herein by reference
|
|
|
|
SECURITY OWNERSHIP OF CERTAIN BENEFICIAL OWNERS AND MANAGEMENT AND RELATED STOCKHOLDER MATTERS |
The information contained in our 2010 Proxy Statement under the captions “Security Ownership of Certain Beneficial Owners and Related Stockholder Matters—Beneficial Ownership of Common Stock” and “Security Ownership of Certain Beneficial Owners and Related Stockholder Matters—Equity Compensation Plan Information” is incorporated herein by reference.
|
|
|
|
CERTAIN RELATIONSHIPS AND RELATED TRANSACTIONS, AND DIRECTOR INDEPENDENCE |
The information contained in our 2010 Proxy Statement under the captions “Board of Directors and Corporate Governance—Independence of Directors” and “Business Relationships and Related Transactions” is incorporated herein by reference.
52
|
|
|
|
PRINCIPAL ACCOUNTING FEES AND SERVICES |
The information required by this item is included in our 2010 Proxy Statement under the caption “Ratification of Appointment of Independent Registered Certified Public Accounting Firm” and is incorporated herein by reference.
|
|
|
|
EXHIBITS, FINANCIAL STATEMENT SCHEDULES |
(1) and (2) Financial Statements and Schedules. The information required by this section is contained in the Consolidated Financial Statements of Ocwen Financial Corporation and Report of Deloitte & Touche LLP, Independent Registered Certified Public Accounting Firm, beginning on Page F-1.
|
|
|
|
|
(3) |
Exhibits. (Exhibits marked with a “ * ” denote management contracts or compensatory plans or agreements) |
|
|
|
2.1 |
Agreement of Merger dated as of July 25, 1999 among Ocwen Financial Corporation, Ocwen Asset Investment Corp. and Ocwen Acquisition Company (1) |
|
|
2.2 |
Separation Agreement, dated as of August 10, 2009, by and between Ocwen Financial Corporation and Altisource Portfolio Solutions S.A. (2) |
|
|
3.1 |
Amended and Restated Articles of Incorporation (3) |
|
|
3.2 |
Amended and Restated Bylaws (4) |
|
|
4.0 |
Form of Certificate of Common Stock (3) |
|
|
4.1 |
Certificate of Trust of Ocwen Capital Trust I (5) |
|
|
4.2 |
Amended and Restated Declaration of Trust of Ocwen Capital Trust I (5) |
|
|
4.3 |
Form of Capital Security of Ocwen Capital Trust I (included in Exhibit 4.4) (5) |
|
|
4.4 |
Form of Indenture relating to 10.875% Junior Subordinated Debentures due 2027 of OCN (5) |
|
|
4.5 |
Form of 10.875% Junior Subordinated Debentures due 2027 of OCN (included in Exhibit 4.6) (5) |
|
|
4.6 |
Form of Guarantee of OCN relating to the Capital Securities of Ocwen Capital Trust I (5) |
|
|
4.7 |
Indenture dated as of July 28, 2004, between OCN and the Bank of New York Trust Company, N.A., as trustee (6) |
|
|
10.1* |
Ocwen Financial Corporation 1996 Stock Plan for Directors, as amended (7) |
|
|
10.2* |
Ocwen Financial Corporation 1998 Annual Incentive Plan (8) |
|
|
10.3 |
Compensation and Indemnification Agreement, dated as of May 6, 1999, between Ocwen Asset Investment Corp. (OAC) and the independent committee of the Board of Directors (9) |
|
|
10.4 |
Indemnity agreement, dated August 24, 1999, among OCN and OAC’s directors (10) |
|
|
10.5* |
Amended Ocwen Financial Corporation 1991 Non-Qualified Stock Option Plan, dated October 26, 1999 (10) |
|
|
10.6 |
First Amendment to Agreement, dated March 30, 2000 between HCT Investments, Inc. and OAIC Partnership I, L.P. (10) |
|
|
10.7* |
Ocwen Financial Corporation Deferral Plan for Directors, dated March 7, 2005 (11) |
|
|
10.8 |
Collateral Trust Agreement, dated June 28, 2005, between OCN and the Bank of New York Trust Company, N.A. (12) |
|
|
10.9 |
Guaranty, dated June 28, 2005, from OCN to the Guaranteed Parties (12) |
|
|
10.10 |
Cash Collateral Agreement, dated June 28, 2005, among OCN, Bank of New York Trust Company, N.A. as collateral Trustee and Bank of New York Trust Company, N.A. as Account Bank (12) |
|
|
10.11* |
Ocwen Financial Corporation 2007 Equity Incentive Plan dated May 10, 2007 (13) |
|
|
10.12 |
Tax Matters Agreement, dated as of August 10, 2009, by and between Ocwen Financial Corporation and Altisource Solutions S.à r.l. (2) |
|
|
10.13 |
Transition Services Agreement, dated as of August 10, 2009, by and between Ocwen Financial Corporation and Altisource Solutions S.à r.l. (2) |
|
|
10.14 |
Employee Matters Agreement, dated as of August 10, 2009, by and between Ocwen Financial Corporation and Altisource Solutions S.à r.l. (2) |
|
|
10.15 |
Technology Products Services Agreement, dated as of August 10, 2009, by and between Ocwen Financial Corporation and Altisource Solutions S.à r.l. (2) |
|
|
10.16 |
Services Agreement, dated as of August 10, 2009, by and between Ocwen Financial Corporation and Altisource Solutions S.à r.l. (2) |
|
|
10.17 |
Data Center and Disaster Recovery Agreement, dated as of August 10, 2009, by and between Ocwen Financial Corporation and Altisource Solutions S.à r.l. (2) |
53
|
|
|
|
|
|
10.18 |
Intellectual Property Agreement, dated as of August 10, 2009, by and between Ocwen Financial Corporation and Altisource Solutions S.à r.l. (2) |
|
|
11.1 |
Computation of earnings per share (14) |
|
|
12.1 |
Ratio of earnings to fixed charges (filed herewith) |
|
|
21.0 |
Subsidiaries (filed herewith) |
|
|
23.1 |
Consent of Independent Registered Public Accounting Firm (filed herewith) |
|
|
23.2 |
Consent of Independent Registered Certified Public Accounting Firm (filed herewith) |
|
|
31.1 |
Certification of the Chief Executive Officer pursuant to Section 302 of the Sarbanes-Oxley Act of 2002 (filed herewith) |
|
|
31.2 |
Certification of the Chief Financial Officer pursuant to Section 302 of the Sarbanes-Oxley Act of 2002 (filed herewith) |
|
|
32.1 |
Certification of the Chief Executive Officer pursuant to 18 U.S.C. Section 1350, as adopted pursuant to Section 906 of the Sarbanes-Oxley Act of 2002 (filed herewith) |
|
|
32.2 |
Certification of the Chief Financial Officer pursuant to 18 U.S.C. Section 1350, as adopted pursuant to Section 906 of the Sarbanes-Oxley Act of 2002 (filed herewith) |
|
|
|
|
|
|
|
(1) |
Incorporated by reference from a similarly described exhibit included with the Registrant’s Current Report on Form 8-K filed with the SEC on July 26, 1999. |
|
(2) |
Incorporated by reference from the similarly described exhibit included with the Registrant’s Form 8-K filed with the SEC on August 12, 2009. |
|
(3) |
Incorporated by reference from the similarly described exhibit filed in connection with the Registrant’s Registration Statement on Form S-1 (File No. 333-5153) as amended, declared effective by the SEC on September 25, 1996. |
|
(4) |
Incorporated by reference from the similarly described exhibit included with the Registrant’s Annual Report on Form 10-K for the year ended December 31, 2007. |
|
(5) |
Incorporated by reference from the similarly described exhibit filed in connection with our Registration Statement on Form S-1 (File No. 333-28889), as amended, declared effective by the SEC on August 6, 1997. |
|
(6) |
Incorporated by reference from the similarly described exhibit included with Registrant’s Quarterly Report on Form 10-Q for the quarterly period ended June 30, 2004. |
|
(7) |
Incorporated by reference from the similarly described exhibit filed in connection with the Registrant’s Registration Statement on Form S-8 (File No. 333-44999), effective when filed with the SEC on January 28, 1998. |
|
(8) |
Incorporated by reference from the similarly described exhibit to our definitive Proxy Statement with respect to our 2003 Annual Meeting of Shareholders as filed with the SEC on March 28, 2003. |
|
(9) |
Incorporated by reference from OAC’s Quarterly Report on Form 10-Q for the quarterly period ended September 30, 1999. |
|
(10) |
Incorporated by reference from the similarly described exhibit included with the Registrant’s Quarterly Report on Form 10-Q for the quarterly period ended March 31, 2000. |
|
(11) |
Incorporated by reference from the similarly described exhibit included with the Registrant’s Annual Report on Form 10-K for the year ended December 31, 2004. |
|
(12) |
Incorporated by reference from the similarly described exhibit included with the Registrant’s Quarterly Report on Form 10-Q for the quarterly period ended June 30, 2005. |
|
(13) |
Incorporated by reference from the similarly described exhibit to our definitive Proxy Statement with respect to our 2007 Annual Meeting of Shareholders as filed with the SEC on March 30, 2007. |
|
(14) |
Incorporated by reference from “Note 27 Basic and Diluted Earnings per Share” on page F-41 of our Consolidated Financial Statements. |
54
Pursuant to the requirements of Section 13 or 15(d) of the Securities Exchange Act of 1934, as amended, the Registrant has duly caused this report to be signed on our behalf by the undersigned, thereunto duly authorized.
|
|
|
|
|
|
Ocwen Financial Corporation |
|
|
|
|
|
|
|
By: |
/s/ William C. Erbey |
|
|
|
|
|
|
|
William C. Erbey |
|
|
|
Chairman of the Board and |
|
|
|
Chief Executive Officer |
|
|
|
(duly authorized representative) |
|
Date: March 8, 2010 |
|
|
Pursuant to the requirements of the Securities Exchange Act of 1934, as amended, this Report has been signed below by the following persons on behalf of the registrant and in the capacities and on the dates indicated:
|
|
|
|
|
|
/s/ William C. Erbey |
|
Date: |
March 8, 2010 |
|
|
|
|
|
|
William C. Erbey, Chairman of the Board |
|
|
|
|
and Chief Executive Officer |
|
|
|
|
(principal executive officer) |
|
|
|
|
|
|
|
|
|
/s/ Ronald M. Faris |
|
Date: |
March 8, 2010 |
|
|
|
|
|
|
Ronald M. Faris, President and Director |
|
|
|
|
|
|
|
|
|
/s/ Martha C. Goss |
|
Date: |
March 8, 2010 |
|
|
|
|
|
|
Martha C. Goss, Director |
|
|
|
|
|
|
|
|
|
/s/ Ronald J. Korn |
|
Date: |
March 8, 2010 |
|
|
|
|
|
|
Ronald J. Korn, Director |
|
|
|
|
|
|
|
|
|
/s/ William H. Lacy |
|
Date: |
March 8, 2010 |
|
|
|
|
|
|
William H. Lacy, Director |
|
|
|
|
|
|
|
|
|
/s/ Barry N. Wish |
|
Date: |
March 8, 2010 |
|
|
|
|
|
|
Barry N. Wish, Director |
|
|
|
|
|
|
|
|
|
/s/ David B. Reiner |
|
Date: |
March 8, 2010 |
|
|
|
|
|
|
David B. Reiner, Director |
|
|
|
|
|
|
|
|
|
/s/ David J. Gunter |
|
Date: |
March 8, 2010 |
|
|
|
|
|
|
David J. Gunter, Executive Vice President and |
|
|
|
|
Chief Financial Officer |
|
|
|
|
(principal financial officer) |
|
|
|
|
|
|
|
|
|
/s/ Daniel J. Seguine |
|
Date: |
March 8, 2010 |
|
|
|
|
|
|
Daniel J. Seguine, Vice President and |
|
|
|
|
Chief Accounting Officer |
|
|
|
|
(principal accounting officer) |
|
|
|
55
OCWEN FINANCIAL CORPORATION AND SUBSIDIARIES
CONSOLIDATED FINANCIAL STATEMENTS AND
REPORT OF INDEPENDENT REGISTERED CERTIFIED PUBLIC ACCOUNTING FIRM
December 31, 2009
OCWEN FINANCIAL CORPORATION AND SUBSIDIARIES
INDEX TO CONSOLIDATED FINANCIAL STATEMENTS AND SCHEDULES
December 31, 2009
F-1
REPORT OF INDEPENDENT REGISTERED PUBLIC ACCOUNTING FIRM
To the Board of Directors and Stockholders of Ocwen Financial Corporation:
We have audited the accompanying consolidated balance sheet of Ocwen Financial Corporation and subsidiaries (the “Company”) as of December 31, 2009, and the related consolidated statements of operations, changes in equity, comprehensive income, and cash flows for the year then ended. These financial statements are the responsibility of the Company’s management. Our responsibility is to express an opinion on these financial statements based on our audit.
We conducted our audit in accordance with the standards of the Public Company Accounting Oversight Board (United States). Those standards require that we plan and perform the audit to obtain reasonable assurance about whether the financial statements are free of material misstatement. An audit includes examining, on a test basis, evidence supporting the amounts and disclosures in the financial statements. An audit also includes assessing the accounting principles used and significant estimates made by management, as well as evaluating the overall financial statement presentation. We believe that our audit provides a reasonable basis for our opinion.
In our opinion, such consolidated financial statements present fairly, in all material respects, the financial position of Ocwen Financial Corporation and subsidiaries as of December 31, 2009, and the results of their operations and their cash flows for the year then ended, in conformity with accounting principles generally accepted in the United States of America.
As described in Note 1 to the consolidated financial statements, the Company adopted new accounting provisions with respect to exchangeable debt instruments and noncontrolling interests and retrospectively adjusted all periods presented in the consolidated financial statements.
We have also audited, in accordance with the standards of the Public Company Accounting Oversight Board (United States), the Company’s internal control over financial reporting as of December 31, 2009, based on the criteria established in Internal Control—Integrated Framework issued by the Committee of Sponsoring Organizations of the Treadway Commission and our report dated March 8, 2010 expressed an unqualified opinion on the Company’s internal control over financial reporting.
|
|
|
|
/s/ DELOITTE & TOUCHE LLP |
|
|
|
|
|
|
|
|
Atlanta, Georgia |
|
|
March 8, 2010 |
|
F-2
REPORT OF INDEPENDENT REGISTERED PUBLIC ACCOUNTING FIRM
To the Board of Directors and Stockholders of Ocwen Financial Corporation:
We have audited the internal control over financial reporting of Ocwen Financial Corporation and subsidiaries (the “Company”) as of December 31, 2009, based on criteria established in Internal Control — Integrated Framework issued by the Committee of Sponsoring Organizations of the Treadway Commission. The Company’s management is responsible for maintaining effective internal control over financial reporting and for its assessment of the effectiveness of internal control over financial reporting, included in the accompanying Report of Management on Internal Control over Financial Reporting. Our responsibility is to express an opinion on the Company’s internal control over financial reporting based on our audit.
We conducted our audit in accordance with the standards of the Public Company Accounting Oversight Board (United States). Those standards require that we plan and perform the audit to obtain reasonable assurance about whether effective internal control over financial reporting was maintained in all material respects. Our audit included obtaining an understanding of internal control over financial reporting, assessing the risk that a material weakness exists, testing and evaluating the design and operating effectiveness of internal control based on the assessed risk, and performing such other procedures as we considered necessary in the circumstances. We believe that our audit provides a reasonable basis for our opinion.
A company’s internal control over financial reporting is a process designed by, or under the supervision of, the company’s principal executive and principal financial officers, or persons performing similar functions, and effected by the company’s board of directors, management, and other personnel to provide reasonable assurance regarding the reliability of financial reporting and the preparation of financial statements for external purposes in accordance with generally accepted accounting principles. A company’s internal control over financial reporting includes those policies and procedures that (1) pertain to the maintenance of records that, in reasonable detail, accurately and fairly reflect the transactions and dispositions of the assets of the company; (2) provide reasonable assurance that transactions are recorded as necessary to permit preparation of financial statements in accordance with generally accepted accounting principles, and that receipts and expenditures of the company are being made only in accordance with authorizations of management and directors of the company; and (3) provide reasonable assurance regarding prevention or timely detection of unauthorized acquisition, use, or disposition of the company’s assets that could have a material effect on the financial statements.
Because of the inherent limitations of internal control over financial reporting, including the possibility of collusion or improper management override of controls, material misstatements due to error or fraud may not be prevented or detected on a timely basis. Also, projections of any evaluation of the effectiveness of the internal control over financial reporting to future periods are subject to the risk that the controls may become inadequate because of changes in conditions, or that the degree of compliance with the policies or procedures may deteriorate.
In our opinion, the Company maintained, in all material respects, effective internal control over financial reporting as of December 31, 2009, based on the criteria established in Internal Control — Integrated Framework issued by the Committee of Sponsoring Organizations of the Treadway Commission.
We have also audited, in accordance with the standards of the Public Company Accounting Oversight Board (United States), the consolidated financial statements as of and for the year ended December 31, 2009 of the Company and our report dated March 8, 2010 expressed an unqualified opinion on those consolidated financial statements (and includes an explanatory paragraph related to the adoption of new accounting provisions with respect to exchangeable debt instruments and noncontrolling interests).
|
|
|
|
/s/ DELOITTE & TOUCHE LLP |
|
|
|
|
|
|
|
|
Atlanta, Georgia |
|
|
March 8, 2010 |
|
F-3
REPORT OF INDEPENDENT REGISTERED CERTIFIED PUBLIC ACCOUNTING FIRM
To the Board of Directors and Stockholders of Ocwen Financial Corporation:
In our opinion, the consolidated balance sheet as of December 31, 2008 and the related consolidated statements of operations, comprehensive income, changes in equity and cash flows for each of two years in the period ended December 31, 2008 present fairly, in all material respects, the financial position of Ocwen Financial Corporation and its subsidiaries at December 31, 2008, and the results of their operations and their cash flows for each of the two years in the period ended December 31, 2008 in conformity with accounting principles generally accepted in the United States of America. These financial statements are the responsibility of the Company’s management. Our responsibility is to express an opinion on these financial statements based on our audits. We conducted our audits of these statements in accordance with the standards of the Public Company Accounting Oversight Board (United States). Those standards require that we plan and perform the audit to obtain reasonable assurance about whether the financial statements are free of material misstatement. An audit includes examining, on a test basis, evidence supporting the amounts and disclosures in the financial statements, assessing the accounting principles used and significant estimates made by management, and evaluating the overall financial statement presentation. We believe that our audits provide a reasonable basis for our opinion.
As discussed in Note 1 to the consolidated financial statements, the Company changed the manner in which it accounts for certain convertible debt instruments and the manner in which it accounts for noncontrolling interests effective January 1, 2009.
|
|
|
|
/s/ PRICEWATERHOUSECOOPERS LLP |
|
|
|
|
|
PricewaterhouseCoopers LLP |
|
|
Fort Lauderdale, Florida |
|
F-4
OCWEN FINANCIAL CORPORATION AND SUBSIDIARIES
CONSOLIDATED BALANCE SHEETS
(Dollars in thousands, except share data)
|
|
|
|
|
|
|
|
|
|
|
|
December 31, |
|
December 31, |
|
||
|
|
|
|
|
||||
|
Assets |
|
|
|
|
|
|
|
|
Cash |
|
$ |
90,919 |
|
$ |
201,025 |
|
|
Trading securities, at fair value |
|
|
|
|
|
|
|
|
Auction rate |
|
|
247,464 |
|
|
239,301 |
|
|
Subordinates and residuals |
|
|
3,692 |
|
|
4,369 |
|
|
Loans held for resale, at lower of cost or fair value |
|
|
33,197 |
|
|
49,918 |
|
|
Advances |
|
|
145,914 |
|
|
102,085 |
|
|
Match funded advances |
|
|
822,615 |
|
|
1,100,555 |
|
|
Mortgage servicing rights |
|
|
117,802 |
|
|
139,500 |
|
|
Receivables, net |
|
|
67,095 |
|
|
39,907 |
|
|
Deferred tax assets, net |
|
|
132,683 |
|
|
175,145 |
|
|
Intangibles, including goodwill of $9,836 at December 31, 2008 |
|
|
— |
|
|
46,227 |
|
|
Premises and equipment, net |
|
|
3,325 |
|
|
12,926 |
|
|
Investments in unconsolidated entities |
|
|
15,008 |
|
|
25,663 |
|
|
Other assets |
|
|
89,636 |
|
|
100,479 |
|
|
|
|
|
|
||||
|
Total assets |
|
$ |
1,769,350 |
|
$ |
2,237,100 |
|
|
|
|
|
|
||||
|
|
|
|
|
|
|
|
|
|
Liabilities and Equity |
|
|
|
|
|
|
|
|
Liabilities |
|
|
|
|
|
|
|
|
Match funded liabilities |
|
$ |
465,691 |
|
$ |
961,939 |
|
|
Lines of credit and other secured borrowings |
|
|
55,810 |
|
|
116,870 |
|
|
Investment line |
|
|
156,968 |
|
|
200,719 |
|
|
Servicer liabilities |
|
|
38,672 |
|
|
135,751 |
|
|
Debt securities |
|
|
95,564 |
|
|
133,367 |
|
|
Other liabilities |
|
|
90,782 |
|
|
78,813 |
|
|
|
|
|
|
||||
|
Total liabilities |
|
|
903,487 |
|
|
1,627,459 |
|
|
|
|
|
|
||||
|
|
|
|
|
|
|
|
|
|
Commitments and Contingencies (Note 32) |
|
|
|
|
|
|
|
|
|
|
|
|
|
|
|
|
|
Equity |
|
|
|
|
|
|
|
|
Ocwen Financial Corporation stockholders’ equity Common stock, $.01 par value; 200,000,000 shares authorized; 99,956,833 and 62,716,530 shares issued and outstanding at December 31, 2009 and 2008, respectively |
|
|
1,000 |
|
|
627 |
|
|
Additional paid-in capital |
|
|
459,542 |
|
|
201,831 |
|
|
Retained earnings |
|
|
405,198 |
|
|
404,901 |
|
|
Accumulated other comprehensive income (loss), net of income taxes |
|
|
(129 |
) |
|
1,876 |
|
|
|
|
|
|
||||
|
Total Ocwen Financial Corporation (OCN) stockholders’ equity |
|
|
865,611 |
|
|
609,235 |
|
|
Non-controlling interest in subsidiaries |
|
|
252 |
|
|
406 |
|
|
|
|
|
|
||||
|
Total equity |
|
|
865,863 |
|
|
609,641 |
|
|
|
|
|
|
||||
|
Total liabilities and equity |
|
$ |
1,769,350 |
|
$ |
2,237,100 |
|
|
|
|
|
|
||||
The accompanying notes are an integral part of these consolidated financial statements
F-5
OCWEN FINANCIAL CORPORATION AND SUBSIDIARIES
CONSOLIDATED STATEMENTS OF OPERATIONS
(Dollars in thousands, except share data)
|
|
|
|
|
|
|
|
|
|
|
|
|
|
|
For the Years Ended December 31, |
|
|||||||
|
|
|
|
||||||||
|
|
|
2009 |
|
2008 |
|
2007 |
|
|||
|
|
|
|
|
|
||||||
|
Revenue |
|
|
|
|
|
|
|
|
|
|
|
Servicing and subservicing fees |
|
$ |
264,467 |
|
$ |
368,026 |
|
$ |
379,277 |
|
|
Process management fees |
|
|
108,082 |
|
|
113,244 |
|
|
87,767 |
|
|
Other revenues |
|
|
8,179 |
|
|
10,858 |
|
|
13,617 |
|
|
|
|
|
|
|
||||||
|
Total revenue |
|
|
380,728 |
|
|
492,128 |
|
|
480,661 |
|
|
|
|
|
|
|
||||||
|
|
|
|
|
|
|
|
|
|
|
|
|
Operating expenses |
|
|
|
|
|
|
|
|
|
|
|
Compensation and benefits |
|
|
87,620 |
|
|
125,549 |
|
|
108,870 |
|
|
Amortization of servicing rights |
|
|
32,228 |
|
|
52,461 |
|
|
99,950 |
|
|
Servicing and origination |
|
|
38,653 |
|
|
52,951 |
|
|
62,938 |
|
|
Technology and communications |
|
|
20,066 |
|
|
22,327 |
|
|
22,514 |
|
|
Professional services |
|
|
26,200 |
|
|
34,615 |
|
|
22,972 |
|
|
Occupancy and equipment |
|
|
18,985 |
|
|
22,978 |
|
|
24,466 |
|
|
Other operating expenses |
|
|
11,902 |
|
|
12,474 |
|
|
10,156 |
|
|
|
|
|
|
|
||||||
|
Total operating expenses |
|
|
235,654 |
|
|
323,355 |
|
|
351,866 |
|
|
|
|
|
|
|
||||||
|
|
|
|
|
|
|
|
|
|
|
|
|
Income from operations |
|
|
145,074 |
|
|
168,773 |
|
|
128,795 |
|
|
|
|
|
|
|
||||||
|
|
|
|
|
|
|
|
|
|
|
|
|
Other income (expense) |
|
|
|
|
|
|
|
|
|
|
|
Interest income |
|
|
8,786 |
|
|
14,696 |
|
|
29,651 |
|
|
Interest expense |
|
|
(62,954 |
) |
|
(86,574 |
) |
|
(76,586 |
) |
|
Gain (loss) on trading securities |
|
|
11,187 |
|
|
(35,480 |
) |
|
(6,663 |
) |
|
Loss on loans held for resale, net |
|
|
(11,132 |
) |
|
(17,096 |
) |
|
(16,671 |
) |
|
Equity in earnings (losses) of unconsolidated entities |
|
|
(2,933 |
) |
|
(13,110 |
) |
|
4,663 |
|
|
Other, net |
|
|
5,233 |
|
|
(227 |
) |
|
(8,635 |
) |
|
|
|
|
|
|
||||||
|
Other expense, net |
|
|
(51,813 |
) |
|
(137,791 |
) |
|
(74,241 |
) |
|
|
|
|
|
|
||||||
|
|
|
|
|
|
|
|
|
|
|
|
|
Income from continuing operations before income taxes |
|
|
93,261 |
|
|
30,982 |
|
|
54,554 |
|
|
Income tax expense |
|
|
96,110 |
|
|
12,006 |
|
|
15,186 |
|
|
|
|
|
|
|
||||||
|
Income (loss) from continuing operations |
|
|
(2,849 |
) |
|
18,976 |
|
|
39,368 |
|
|
Income (loss) from discontinued operations, net of income taxes |
|
|
3,121 |
|
|
(5,767 |
) |
|
(3,172 |
) |
|
|
|
|
|
|
||||||
|
Net income |
|
|
272 |
|
|
13,209 |
|
|
36,196 |
|
|
Net loss (income) attributable to non-controlling interests |
|
|
25 |
|
|
41 |
|
|
(92 |
) |
|
|
|
|
|
|
||||||
|
Net income attributable to OCN |
|
$ |
297 |
|
$ |
13,250 |
|
$ |
36,104 |
|
|
|
|
|
|
|
||||||
|
|
|
|
|
|
|
|
|
|
|
|
|
Basic earnings per share |
|
|
|
|
|
|
|
|
|
|
|
Income (loss) from continuing operations |
|
$ |
(0.04 |
) |
$ |
0.30 |
|
$ |
0.63 |
|
|
Income (loss) from discontinued operations |
|
|
0.04 |
|
|
(0.09 |
) |
|
(0.05 |
) |
|
|
|
|
|
|
||||||
|
Net income attributable to OCN |
|
$ |
— |
|
$ |
0.21 |
|
$ |
0.58 |
|
|
|
|
|
|
|
||||||
|
|
|
|
|
|
|
|
|
|
|
|
|
Diluted earnings per share |
|
|
|
|
|
|
|
|
|
|
|
Income (loss) from continuing operations |
|
$ |
(0.04 |
) |
$ |
0.30 |
|
$ |
0.62 |
|
|
Income (loss) from discontinued operations |
|
|
0.04 |
|
|
(0.09 |
) |
|
(0.05 |
) |
|
|
|
|
|
|
||||||
|
Net income attributable to OCN |
|
$ |
— |
|
$ |
0.21 |
|
$ |
0.57 |
|
|
|
|
|
|
|
||||||
|
|
|
|
|
|
|
|
|
|
|
|
|
Weighted average common shares outstanding |
|
|
|
|
|
|
|
|
|
|
|
Basic |
|
|
78,252,000 |
|
|
62,670,957 |
|
|
62,712,076 |
|
|
Diluted |
|
|
78,252,000 |
|
|
62,935,314 |
|
|
63,496,339 |
|
The accompanying notes are an integral part of these consolidated financial statements
F-6
OCWEN
FINANCIAL CORPORATION AND SUBSIDIARIES
CONSOLIDATED STATEMENTS OF COMPREHENSIVE INCOME
(Dollars in thousands)
|
|
|
|
|
|
|
|
|
|
|
|
|
|
|
For the Years Ended December 31, |
|
|||||||
|
|
|
|
||||||||
|
|
|
2009 |
|
2008 |
|
2007 |
|
|||
|
|
|
|
|
|
||||||
|
Net income |
|
$ |
272 |
|
$ |
13,209 |
|
$ |
36,196 |
|
|
|
|
|
|
|
|
|
|
|
|
|
|
Other comprehensive income (loss), net of taxes: |
|
|
|
|
|
|
|
|
|
|
|
|
|
|
|
|
|
|
|
|
|
|
|
Change in unrealized foreign currency translation (loss) income arising during the year (1) |
|
|
(254 |
) |
|
433 |
|
|
117 |
|
|
|
|
|
|
|
|
|
|
|
|
|
|
Reclassification adjustment for foreign currency translation (loss) gain included in net income (2) |
|
|
(1,751 |
) |
|
— |
|
|
347 |
|
|
|
|
|
|
|
||||||
|
Net change in unrealized foreign currency translation (loss) gain |
|
|
(2,005 |
) |
|
433 |
|
|
464 |
|
|
|
|
|
|
|
|
|
|
|
|
|
|
Change in deferred gain (loss) on cash flow hedge (3) |
|
|
— |
|
|
151 |
|
|
(151 |
) |
|
|
|
|
|
|
||||||
|
|
|
|
|
|
|
|
|
|
|
|
|
|
|
|
(2,005 |
) |
|
584 |
|
|
313 |
|
|
|
|
|
|
|
||||||
|
|
|
|
|
|
|
|
|
|
|
|
|
Comprehensive income |
|
|
(1,733 |
) |
|
13,793 |
|
|
36,509 |
|
|
|
|
|
|
|
|
|
|
|
|
|
|
Comprehensive loss (income) attributable to non-controlling interests |
|
|
154 |
|
|
73 |
|
|
(189 |
) |
|
|
|
|
|
|
||||||
|
|
|
|
|
|
|
|
|
|
|
|
|
Comprehensive income (loss) attributable to OCN |
|
$ |
(1,579 |
) |
$ |
13,866 |
|
$ |
36,320 |
|
|
|
|
|
|
|
||||||
|
|
|
(1) Net of tax benefit (expense) of $148, $(254) and $(68) for 2009, 2008 and 2007, respectively. |
|
(2) Net of tax benefit of $1,029 and $(204) for 2009 and 2007, respectively. |
|
(3) Net of tax benefit (expense) of $(89) and $89 for 2008 and 2007, respectively. |
The accompanying notes are an integral part of these consolidated financial statements
F-7
OCWEN FINANCIAL CORPORATION AND SUBSIDIARIES
CONSOLIDATED STATEMENTS OF CHANGES IN EQUITY
FOR THE YEARS ENDED DECEMBER 31, 2008, 2007 and 2006
(Dollars in thousands, except share data)
|
|
|
|
|
|
|
|
|
|
|
|
|
|
|
|
|
|
|
|
|
|
|
|
|
|
|
OCN Shareholders |
|
|
|
|
|
|
|
|||||||||||||
|
|
|
|
|
|
|
|
|
|
||||||||||||||
|
|
|
|
|
Additional |
|
Retained |
|
Accumulated |
|
Non- |
|
Total |
|
|||||||||
|
|
|
|
|
|
|
|
|
|
||||||||||||||
|
|
|
|
|
|
|
|
|
|
||||||||||||||
|
|
|
Common Stock |
|
|
|
|
|
|
||||||||||||||
|
|
|
|
|
|
|
|
|
|||||||||||||||
|
|
|
Shares |
|
Amount |
|
|
|
|
|
|
||||||||||||
|
|
|
|
|
|
|
|
|
|
||||||||||||||
|
Balance at December 31, 2006 |
|
|
63,184,867 |
|
$ |
632 |
|
$ |
206,227 |
|
$ |
357,030 |
|
$ |
979 |
|
$ |
1,790 |
|
$ |
566,658 |
|
|
Cumulative effect of adoption of ASC 740 |
|
|
— |
|
|
— |
|
|
— |
|
|
(1,483 |
) |
|
— |
|
|
— |
|
|
(1,483 |
) |
|
Net income |
|
|
— |
|
|
— |
|
|
— |
|
|
36,104 |
|
|
— |
|
|
92 |
|
|
36,196 |
|
|
Equity offering costs of unconsolidated entities |
|
|
— |
|
|
— |
|
|
(1,969 |
) |
|
— |
|
|
— |
|
|
— |
|
|
(1,969 |
) |
|
Issuance of common stock awards to employees |
|
|
72,723 |
|
|
— |
|
|
(383 |
) |
|
— |
|
|
— |
|
|
— |
|
|
(383 |
) |
|
Exercise of common stock options |
|
|
263,398 |
|
|
3 |
|
|
1,875 |
|
|
— |
|
|
— |
|
|
— |
|
|
1,878 |
|
|
Expiration of common stock options |
|
|
— |
|
|
— |
|
|
835 |
|
|
— |
|
|
— |
|
|
— |
|
|
835 |
|
|
Repurchase of common stock |
|
|
(1,000,000 |
) |
|
(10 |
) |
|
(14,510 |
) |
|
— |
|
|
— |
|
|
— |
|
|
(14,520 |
) |
|
Equity-based compensation |
|
|
6,372 |
|
|
— |
|
|
4,899 |
|
|
— |
|
|
— |
|
|
— |
|
|
4,899 |
|
|
Other comprehensive income, net of income taxes |
|
|
— |
|
|
— |
|
|
— |
|
|
— |
|
|
313 |
|
|
97 |
|
|
410 |
|
|
|
|
|
|
|
|
|
|
|
||||||||||||||
|
Balance at December 31, 2007 |
|
|
62,527,360 |
|
|
625 |
|
|
196,974 |
|
|
391,651 |
|
|
1,292 |
|
|
1,979 |
|
|
592,521 |
|
|
Net income (loss) |
|
|
— |
|
|
— |
|
|
— |
|
|
13,250 |
|
|
— |
|
|
(41 |
) |
|
13,209 |
|
|
Repurchase of Convertible Notes |
|
|
— |
|
|
— |
|
|
1,726 |
|
|
— |
|
|
— |
|
|
— |
|
|
1,726 |
|
|
Issuance of common stock awards to employees |
|
|
169,632 |
|
|
2 |
|
|
(137 |
) |
|
— |
|
|
— |
|
|
— |
|
|
(135 |
) |
|
Exercise of common stock options |
|
|
3,008 |
|
|
— |
|
|
8 |
|
|
— |
|
|
— |
|
|
— |
|
|
8 |
|
|
Expiration of common stock options (1) |
|
|
— |
|
|
— |
|
|
1,060 |
|
|
— |
|
|
— |
|
|
— |
|
|
1,060 |
|
|
Equity-based compensation |
|
|
16,530 |
|
|
— |
|
|
2,200 |
|
|
— |
|
|
— |
|
|
— |
|
|
2,200 |
|
|
Distribution to noncontrolling interest holder |
|
|
— |
|
|
— |
|
|
— |
|
|
— |
|
|
— |
|
|
(1,500 |
) |
|
(1,500 |
) |
|
Other comprehensive income (loss), net of income taxes |
|
|
— |
|
|
— |
|
|
— |
|
|
— |
|
|
584 |
|
|
(32 |
) |
|
552 |
|
|
|
|
|
|
|
|
|
|
|
||||||||||||||
|
Balance at December 31, 2008 |
|
|
62,716,530 |
|
|
627 |
|
|
201,831 |
|
|
404,901 |
|
|
1,876 |
|
|
406 |
|
|
609,641 |
|
|
Net income (loss) |
|
|
— |
|
|
— |
|
|
— |
|
|
297 |
|
|
— |
|
|
(25 |
) |
|
272 |
|
|
Net assets distributed in connection with the spin-off of Altisource Portfolio Solutions S.A. (formerly Ocwen Solutions) |
|
|
— |
|
|
— |
|
|
(72,146 |
) |
|
— |
|
|
— |
|
|
— |
|
|
(72,146 |
) |
|
Issuance of common stock |
|
|
37,671,500 |
|
|
377 |
|
|
334,752 |
|
|
— |
|
|
— |
|
|
— |
|
|
335,129 |
|
|
Repurchase of common stock |
|
|
(1,000,000 |
) |
|
(10 |
) |
|
(10,990 |
) |
|
— |
|
|
— |
|
|
— |
|
|
(11,000 |
) |
|
Repurchase of 3.25% Convertible Notes |
|
|
— |
|
|
— |
|
|
(4 |
) |
|
— |
|
|
— |
|
|
— |
|
|
(4 |
) |
|
Issuance of common stock awards to employees |
|
|
29,907 |
|
|
— |
|
|
(138 |
) |
|
— |
|
|
— |
|
|
— |
|
|
(138 |
) |
|
Exercise of common stock options |
|
|
526,749 |
|
|
6 |
|
|
3,740 |
|
|
— |
|
|
— |
|
|
— |
|
|
3,746 |
|
|
Equity-based compensation |
|
|
12,147 |
|
|
— |
|
|
2,497 |
|
|
— |
|
|
— |
|
|
— |
|
|
2,497 |
|
|
Other comprehensive loss, net of income taxes |
|
|
— |
|
|
— |
|
|
— |
|
|
— |
|
|
(2,005 |
) |
|
(129 |
) |
|
(2,134 |
) |
|
|
|
|
|
|
|
|
|
|
||||||||||||||
|
Balance at December 31, 2009 |
|
|
99,956,833 |
|
$ |
1,000 |
|
$ |
459,542 |
|
$ |
405,198 |
|
$ |
(129 |
) |
$ |
252 |
|
$ |
865,863 |
|
|
|
|
|
|
|
|
|
|
|
||||||||||||||
|
|
|
|
(1) |
Net of tax effect of $347 resulting from the reduction of the deferred tax asset. |
The accompanying notes are an integral part of these consolidated financial statements
F-8
OCWEN FINANCIAL CORPORATION AND SUBSIDIARIES
CONSOLIDATED STATEMENTS OF CASH FLOWS
(Dollars in thousands)
|
|
|
|
|
|
|
|
|
|
|
|
|
|
|
For the Years Ended December 31, |
|
|||||||
|
|
|
|
||||||||
|
|
|
2009 |
|
2008 |
|
2007 |
|
|||
|
|
|
|
|
|
||||||
|
Cash flows from operating activities |
|
|
|
|
|
|
|
|
|
|
|
Net income |
|
$ |
272 |
|
$ |
13,209 |
|
$ |
36,196 |
|
|
Adjustments to reconcile net income to net cash provided (used) by operating activities: |
|
|
|
|
|
|
|
|
|
|
|
Amortization of mortgage servicing rights |
|
|
32,228 |
|
|
52,461 |
|
|
99,950 |
|
|
Premium amortization and discount accretion |
|
|
1,735 |
|
|
3,803 |
|
|
29 |
|
|
Depreciation and other amortization |
|
|
6,366 |
|
|
12,271 |
|
|
10,799 |
|
|
Provision for (reversal of) valuation allowance on mortgage servicing assets |
|
|
(670 |
) |
|
3,624 |
|
|
— |
|
|
Provision for (reversal of) valuation allowance on discontinued operations |
|
|
(1,227 |
) |
|
4,980 |
|
|
2,012 |
|
|
Gain on disposition of subsidiaries |
|
|
(4,749 |
) |
|
— |
|
|
— |
|
|
Loss (gain) on trading securities |
|
|
(11,187 |
) |
|
35,480 |
|
|
6,663 |
|
|
Loss on loans held for resale, net |
|
|
11,132 |
|
|
17,096 |
|
|
16,671 |
|
|
Equity in (earnings) losses of unconsolidated entities |
|
|
2,933 |
|
|
13,110 |
|
|
(4,663 |
) |
|
Net cash provided (used) by trading activities |
|
|
3,700 |
|
|
(236,710 |
) |
|
96,246 |
|
|
Net cash provided by loans held for resale activities |
|
|
4,576 |
|
|
7,020 |
|
|
3,485 |
|
|
Decrease (increase) in advances and match funded advances |
|
|
227,271 |
|
|
215,078 |
|
|
(523,602 |
) |
|
Decrease (increase) in deferred tax assets, net |
|
|
40,758 |
|
|
2,812 |
|
|
(3,467 |
) |
|
Decrease (increase) in receivables and other assets, net |
|
|
(32,846 |
) |
|
53,884 |
|
|
(79,105 |
) |
|
Decrease in servicer liabilities |
|
|
(97,079 |
) |
|
(68,733 |
) |
|
(179,065 |
) |
|
Increase (decrease) in other liabilities |
|
|
22,824 |
|
|
(8,971 |
) |
|
(10,838 |
) |
|
Other, net |
|
|
609 |
|
|
2,677 |
|
|
16,645 |
|
|
|
|
|
|
|
||||||
|
Net cash provided (used) by operating activities |
|
|
206,646 |
|
|
123,091 |
|
|
(512,044 |
) |
|
|
|
|
|
|
||||||
|
|
|
|
|
|
|
|
|
|
|
|
|
Cash flows from investing activities |
|
|
|
|
|
|
|
|
|
|
|
Purchase of mortgage servicing rights |
|
|
(10,241 |
) |
|
(3,757 |
) |
|
(113,502 |
) |
|
Proceeds from the sale of mortgage servicing rights |
|
|
— |
|
|
5,985 |
|
|
— |
|
|
Distributions of capital from unconsolidated entities |
|
|
6,658 |
|
|
37,046 |
|
|
45,894 |
|
|
Investment in unconsolidated entities |
|
|
(62 |
) |
|
(1,548 |
) |
|
(73,513 |
) |
|
Additions to premises and equipment, net |
|
|
(3,700 |
) |
|
(5,709 |
) |
|
(3,947 |
) |
|
Proceeds from sales of real estate owned |
|
|
2,600 |
|
|
8,269 |
|
|
2,933 |
|
|
Proceeds from the sale of subsidiaries, net of cash sold |
|
|
1,584 |
|
|
— |
|
|
— |
|
|
Cash paid to acquire subsidiaries, net of cash acquired |
|
|
— |
|
|
— |
|
|
(48,918 |
) |
|
Redemption of certificates of deposit |
|
|
— |
|
|
— |
|
|
66,260 |
|
|
Other |
|
|
— |
|
|
154 |
|
|
1,836 |
|
|
|
|
|
|
|
||||||
|
Net cash provided (used) by investing activities |
|
|
(3,161 |
) |
|
40,440 |
|
|
(122,957 |
) |
|
|
|
|
|
|
||||||
The accompanying notes are an integral part of these consolidated financial statements
F-9
OCWEN FINANCIAL CORPORATION AND SUBSIDIARIES
CONSOLIDATED STATEMENTS OF CASH FLOWS – (Continued)
(Dollars in thousands)
|
|
|
|
|
|
|
|
|
|
|
|
|
|
|
For the Years Ended December 31, |
|
|||||||
|
|
|
|
||||||||
|
|
|
2009 |
|
2008 |
|
2007 |
|
|||
|
|
|
|
|
|
||||||
|
Cash flows from financing activities |
|
|
|
|
|
|
|
|
|
|
|
Distribution of cash in connection with the spin-off of Altisource Portfolio Solutions |
|
|
(20,028 |
) |
|
— |
|
|
— |
|
|
Proceeds from (repayment of) match funded liabilities, net |
|
|
(491,416 |
) |
|
(39,854 |
) |
|
486,223 |
|
|
Proceeds from (repayment of) lines of credit and other secured borrowings, net |
|
|
— |
|
|
(223,106 |
) |
|
29,337 |
|
|
Proceeds from lines of credit and other secured borrowings |
|
|
102,106 |
|
|
— |
|
|
— |
|
|
Repayments of lines of credit and other secured borrowings |
|
|
(151,976 |
) |
|
— |
|
|
— |
|
|
Proceeds from investment line |
|
|
— |
|
|
299,964 |
|
|
— |
|
|
Repayment of investment line |
|
|
(43,751 |
) |
|
(99,245 |
) |
|
— |
|
|
Repurchase of debt securities, net |
|
|
(37,289 |
) |
|
(10,797 |
) |
|
(52 |
) |
|
Issuance of common stock |
|
|
335,129 |
|
|
— |
|
|
— |
|
|
Repurchase of common stock |
|
|
(11,000 |
) |
|
— |
|
|
(14,520 |
) |
|
Exercise of common stock options |
|
|
3,358 |
|
|
3 |
|
|
1,529 |
|
|
Net proceeds from sale-leaseback of Orlando property |
|
|
— |
|
|
— |
|
|
9,547 |
|
|
Net cash paid in connection with assignment of Orlando property lease |
|
|
— |
|
|
(3,835 |
) |
|
— |
|
|
Other |
|
|
1,276 |
|
|
121 |
|
|
599 |
|
|
|
|
|
|
|
||||||
|
Net cash provided (used) by financing activities |
|
|
(313,591 |
) |
|
(76,749 |
) |
|
512,663 |
|
|
|
|
|
|
|
||||||
|
|
|
|
|
|
|
|
|
|
|
|
|
Net increase (decrease) in cash |
|
|
(110,106 |
) |
|
86,782 |
|
|
(122,338 |
) |
|
Cash at beginning of year |
|
|
201,025 |
|
|
114,243 |
|
|
236,581 |
|
|
|
|
|
|
|
||||||
|
Cash at end of year |
|
$ |
90,919 |
|
$ |
201,025 |
|
$ |
114,243 |
|
|
|
|
|
|
|
||||||
|
|
|
|
|
|
|
|
|
|
|
|
|
Supplemental cash flow information |
|
|
|
|
|
|
|
|
|
|
|
Interest paid |
|
$ |
56,692 |
|
$ |
83,628 |
|
$ |
72,444 |
|
|
Income tax (payments) refunds |
|
|
(52,910 |
) |
|
8,474 |
|
|
(23,571 |
) |
|
|
|
|
|
|
|
|
|
|
|
|
|
Supplemental non-cash investing and financing activities |
|
|
|
|
|
|
|
|
|
|
|
Real estate acquired through foreclosure |
|
$ |
11,473 |
|
$ |
17,230 |
|
$ |
13,827 |
|
|
Equipment acquired through capital leases |
|
|
— |
|
|
— |
|
|
1,610 |
|
|
Mortgage assumed by buyer in connection with sale-leaseback of Orlando property |
|
|
— |
|
|
— |
|
|
14,088 |
|
|
Derecognition of premises and equipment |
|
|
— |
|
|
18,521 |
|
|
— |
|
|
Derecognition of lease obligation |
|
|
— |
|
|
24,322 |
|
|
— |
|
|
Net assets distributed in connection with the spin-off of Altisource Portfolio Solutions, excluding cash |
|
|
52,118 |
|
|
— |
|
|
— |
|
|
|
|
|
|
|
|
|
|
|
|
|
|
Supplemental business acquisitions information |
|
|
|
|
|
|
|
|
|
|
|
Fair value of assets acquired |
|
$ |
— |
|
$ |
— |
|
$ |
(69,475 |
) |
|
Fair value of liabilities assumed |
|
|
— |
|
|
— |
|
|
12,475 |
|
|
|
|
|
|
|
||||||
|
Cash paid |
|
|
— |
|
|
— |
|
|
(57,000 |
) |
|
Less cash acquired |
|
|
— |
|
|
— |
|
|
8,082 |
|
|
|
|
|
|
|
||||||
|
Net cash paid |
|
$ |
— |
|
$ |
— |
|
$ |
(48,918 |
) |
|
|
|
|
|
|
||||||
The accompanying notes are an integral part of these consolidated financial statements
F-10
OCWEN FINANCIAL CORPORATION AND SUBSIDIARIES
NOTES TO CONSOLIDATED FINANCIAL STATEMENTS
DECEMBER 31, 2009, 2008 AND 2007
(Dollars in thousands, except share data)
|
|
|
|
NOTE 1 |
SUMMARY OF SIGNIFICANT ACCOUNTING POLICIES |
Organization
Ocwen Financial Corporation (Ocwen or OCN), through its subsidiaries, is a leading provider of residential and commercial mortgage loan servicing, special servicing and asset management services. Ocwen is headquartered in West Palm Beach, Florida with offices in California, the District of Columbia, Florida and Georgia and global operations in India and Uruguay. OCN is a Florida corporation organized in February 1988. Ocwen Loan Servicing, LLC (OLS), a wholly-owned subsidiary of Ocwen, is a licensed mortgage servicer in all 50 states, the District of Columbia and two U.S. territories.
At December 31, 2009, OCN owned all of the outstanding stock of its primary subsidiaries: Ocwen Loan Servicing, LLC (OLS); Ocwen Financial Solutions, Private Limited (OFSPL); and Investors Mortgage Insurance Holding Company. OCN also holds a 45% interest in BMS Holdings, Inc. (BMS Holdings), a 25% interest in Ocwen Structured Investments, LLC (OSI) and approximately a 25% interest in Ocwen Nonperforming Loans, LLC (ONL) and Ocwen REO, LLC (OREO). While OCN continues to own 70% of Global Servicing Solutions, LLC (GSS) with the remaining 30% interest held by ML IBK Positions, Inc., GSS had no material operations during 2009 and no material assets as of December 31, 2009.
On August 10, 2009, we completed the distribution of our Ocwen Solutions line of business, except for BMS Holdings and GSS, via the spin-off of a separate publicly-traded company, Altisource Portfolio Solutions S.A. (Altisource). Altisource common stock is listed on the NASDAQ market under the ticker symbol “ASPS.” We distributed all of the shares of Altisource common stock to OCN’s shareholders of record as of August 4, 2009 (the Separation). See Note 2.
Principles of Consolidation
Our financial statements include the accounts of OCN and its majority-owned subsidiaries. We apply the equity method of accounting to investments when the entity is not a variable interest entity (VIE) and we are able to exercise significant influence, but not control, over the policies and procedures of the entity but own less than 50% of the voting securities. We have eliminated intercompany accounts and transactions in consolidation.
Variable Interest Entities
We evaluate each special purpose entity (SPE) for classification as a qualifying special purpose entity (QSPE). We do not consolidate QSPEs in our financial statements. Where we determine that an SPE is not classified as a QSPE, we further evaluate it for classification as a VIE. When an SPE meets the definition of a VIE and we determine that OCN is the primary beneficiary, we include the SPE in our consolidated financial statements.
We have determined that the SPEs created in connection with the match funded financing facilities discussed below are VIEs of which we are the primary beneficiary. The accounts of those SPEs are included in our consolidated financial statements.
Securitizations or Asset Backed Financing Arrangements
OCN or its subsidiaries have been the transferor in connection with a number of securitizations or asset-backed financing arrangements. As of December 31, 2009, we have continuing involvement with the financial assets of eight of these securitizations or asset-backed financing arrangements. We have aggregated these securitizations or asset-backed financing arrangements into two groups: (1) securitizations of residential mortgage loans that were accounted for as sales and (2) financings of advances on loans serviced for others that were accounted for as secured borrowings.
Securitizations of Residential Mortgage Loans. Previously, we securitized residential mortgage loans using certain trusts. These transactions were accounted for as sales even though we continued to be involved with the trusts, typically as the servicer or sub-servicer for the loans held by the trust and by retaining a beneficial ownership interest in the trust. The beneficial interests we held consisted of both subordinate and residual securities that were either retained at the time of the securitization or acquired subsequently. The trusts are currently excluded from our consolidated financial statements because each one is a QSPE.
F-11
The following table presents a summary of the involvement of Ocwen with these SPEs and summary financial information for the trusts.
|
|
|
|
|
|
|
|
|
|
|
|
|
|
|
As of or For the year ended December 31, |
|
|||||||
|
|
|
|
||||||||
|
|
|
2009 |
|
2008 |
|
2007 |
|
|||
|
|
|
|
|
|
||||||
|
Summary—Ocwen |
|
|
|
|
|
|
|
|
|
|
|
Cash received on beneficial interests held |
|
$ |
2,600 |
|
$ |
3,324 |
|
$ |
15,819 |
|
|
Servicing and subservicing revenues from trusts |
|
|
4,509 |
|
|
5,581 |
|
|
6,826 |
|
|
Servicing advances |
|
|
21,715 |
|
|
30,683 |
|
|
20,093 |
|
|
Beneficial interests held at fair value (1) |
|
|
1,327 |
|
|
2,216 |
|
|
5,088 |
|
|
Mortgage servicing rights at amortized cost |
|
|
1,659 |
|
|
2,066 |
|
|
2,764 |
|
|
Summary Financial Information—Securitization Trusts |
|
|
|
|
|
|
|
|
|
|
|
Collateral balance at trusts |
|
$ |
606,316 |
|
$ |
740,477 |
|
$ |
910,104 |
|
|
Non-performing collateral (2) |
|
|
209,229 |
|
|
219,613 |
|
|
196,837 |
|
|
Certificate balance at trusts |
|
|
605,108 |
|
|
740,121 |
|
|
908,431 |
|
|
|
|
|
(1) |
Includes investments in subordinate and residual securities that we retained in connection with the loan securitization transactions completed in prior years (primarily 2006). These retained interests had a fair value of $58 and $167 at December 31, 2009 and 2008, respectively. |
|
(2) |
Non-performing collateral includes loans past due 90 days or more, loans in foreclosure, loans in bankruptcy and foreclosed real estate owned. |
We have no obligation to provide financial support to the trusts and have provided no such support. Our exposure to loss as a result of our continuing involvement is limited to the carrying values of our investments in the residual and subordinate securities of the trusts, our mortgage servicing rights that are related to the trusts and our advances to the trusts. We consider the probability of loss arising from our advances to be remote because of their position ahead of most of the other liabilities of the trusts. See Note 5, Note 7, Note 8 and Note 9 for additional information regarding trading securities, advances, match funded advances and mortgage servicing rights.
Match Funded Advances on Loans Serviced for Others. Match funded advances on loans serviced for others result from our transfers of residential loan servicing advances to SPEs in exchange for cash. These four SPEs issue debt supported by collections on the transferred advances. We made these transfers under the terms of four advance facility agreements. These transfers do not qualify for sales accounting because we retain control over the transferred assets. As a result, we account for these transfers as financings and classify the transferred advances on our balance sheet as match funded advances and the related liabilities as match funded liabilities. Collections on the advances pledged to the SPEs are used to repay principal and interest and to pay the expenses of the entity. Holders of the debt issued by these entities can look only to the assets of the entities themselves for satisfaction of the debt and have no recourse against OCN. However, OLS has guaranteed the payment by one of the entities, Ocwen Servicer Advance Funding (Wachovia), LLC (OSAFW), of its obligations under the securitization documents. The maximum amount payable under the guarantee is limited to 10% of the notes outstanding at the end of the facility’s revolving period in May 2010. As of December 31, 2009, OSAFW had notes outstanding of $69,858.
The following table summarizes the assets and liabilities of the four special purpose entities formed in connection with our match funded advance facilities:
|
|
|
|
|
|
|
|
|
|
|
|
December 31, |
|
||||
|
|
|
|
|||||
|
|
|
2009 |
|
2008 |
|
||
|
|
|
|
|
||||
|
Total assets |
|
$ |
841,958 |
|
$ |
1,122,404 |
|
|
Match funded advances |
|
|
822,615 |
|
|
1,100,555 |
|
|
Total liabilities |
|
|
603,901 |
|
|
994,244 |
|
|
Match funded liabilities |
|
|
465,691 |
|
|
961,939 |
|
Reclassification
Certain immaterial amounts in our 2008 and 2007 consolidated financial statements have been reclassified to conform to the 2009 presentation. We reclassified gains and losses on debt redemptions to Other, net on the consolidated statements of operations. On the consolidated statements of changes in equity we condensed share-based compensation amounts and associated excess tax benefits into one line item, Equity-based compensation. Within the operating activities section of the consolidated statements of cash flows we condensed several immaterial items to Other, net. Similarly, in the financing section of the consolidated statements of cash flows we condensed several immaterial items to Other.
F-12
Cash
Cash includes both interest-bearing and non-interest-bearing demand deposits with financial institutions with original maturities of 90 days or less.
Trading Securities
Trading securities includes other investments with original maturities of three months or less that we do not treat as cash equivalents.
We currently account for our auction rate, investment grade, residual and subordinate securities as trading securities at fair value. We report changes in fair value in gain (loss) on trading securities in the period of the change. We determine fair value based either on third party dealer quotations, where available, or on internal values determined using market based assumptions.
We recognize interest income on subordinate and residual securities through an “effective yield” method with changes in expected future cash flows reflected in the yield on a prospective basis. We adjust the prospective yield each time the estimates of expected future cash flows change or the actual cash flows differ from projections. We use the newly calculated yield in the accrual of interest income for subsequent reporting periods.
Loans Held for Resale
We classify loans that we do not intend to hold to maturity as loans held for resale, and we report them at the lower of cost or fair value computed on an aggregate basis. We account for the excess of cost over fair value as a valuation allowance and include changes in the valuation allowance in gain (loss) on loans held for resale, net, in the period in which the change occurs. We have deferred loan origination fees and direct loan origination costs until the loans are sold. These fees and costs are included in the carrying value of the loans when determining a valuation allowance.
We accrue interest income as earned. We place loans on non-accrual status after any portion of principal or interest has been delinquent greater than 89 days or earlier if management determines the borrower is unable to continue performance. When we place a loan on non-accrual status, we reverse interest accrued but not received. We return loans to accrual status only when we reinstate the loan and have no significant uncertainty as to collectibility.
Mortgage Servicing Rights (MSRs)
MSRs are an intangible asset representing the right to service a portfolio of mortgage loans. We generally obtain MSRs by purchasing them from the owners of the mortgage loans.
An agreement between the various parties to a mortgage securitization transaction typically specifies the rights and obligations of the holder of the MSRs which include guidelines and procedures for servicing the loans. Two examples of these guidelines and procedures include remittance and reporting requirements. Assets serviced for others are not included on our balance sheet.
Custodial accounts, which hold funds representing collections of principal and interest we receive from borrowers, are escrowed with an unaffiliated bank and excluded from our balance sheet. Custodial accounts amounted to approximately $234,100 and $370,200 at December 31, 2009 and 2008, respectively.
We account for our residential and commercial classes of servicing assets using the amortization method. All newly acquired MSRs are initially measured at fair value. We amortize the balance of servicing assets or liabilities in proportion to and over the period of estimated net servicing income or net servicing loss and assess servicing assets or liabilities for impairment or increased obligation based on fair value at each reporting date. We determine estimated net servicing income using the estimated future balance of the underlying mortgage loan portfolio, which, absent new purchases, declines over time from prepayments and scheduled loan amortization. We adjust amortization prospectively in response to changes in estimated projections of future cash flows. We perform an impairment analysis based on the difference between the carrying amount and estimated fair value after grouping our loans into the applicable strata based on one or more of the predominant risk characteristics of the underlying loans (see Note 3—Fair Value—Mortgage Servicing Rights).
Mortgage Servicing Fees and Advances
We earn fees for servicing mortgage loans. We collect servicing fees, generally expressed as a percent of unpaid principal balance, from the borrowers’ payments. We also include late fees, prepayment penalties, float earnings and other ancillary fees in servicing income. We recognize servicing fees when the fees are earned which is generally when the borrowers’ payments are collected.
F-13
During any period in which the borrower does not make payments, most of our servicing agreements require that we advance our own funds to meet contractual principal and interest remittance requirements for the investors, pay property taxes and insurance premiums and process foreclosures. We also advance funds to maintain, repair and market foreclosed real estate properties on behalf of investors. These advances are made pursuant to the terms of each servicing contract. Each servicing contract is associated with specific loans, identified as a pool.
When we make an advance on a loan under each servicing contract, we are entitled to recover that advance either from the borrower, for reinstated and performing loans, or from investors, for foreclosed loans. Most of our servicing contracts provide that the advances made under the respective agreement have priority over all other cash payments from the proceeds of the loan, and in the majority of cases, the proceeds of the pool of loans, which are the subject of that servicing contract. As a result, we are entitled to repayment from loan proceeds before any interest or principal is paid on the bonds, and in the majority of cases, advances in excess of loan proceeds may be recovered from pool level proceeds.
We record a charge to earnings to the extent that we believe advances are uncollectible under the provisions of each servicing contract taking into consideration historical loss and delinquency experience, length of delinquency and the amount of the advance. However, we are generally only obligated to advance funds to the extent that we believe the advances are recoverable from expected proceeds from the loan. We assess collectibility using proprietary cash flow projection models which incorporate a number of different factors, depending on the characteristics of the mortgage loan or pool, including, for example, time to a foreclosure sale, estimated costs of foreclosure action, future property tax payments and the value of the underlying property net of carrying costs, commissions and closing costs.
Goodwill and Intangible Assets
Goodwill and intangible assets were distributed as part of the Separation (see Note 2). Goodwill represents the cost of acquired businesses in excess of the fair value of the net assets acquired including identifiable intangible assets.
Prior to the Separation, we utilized a two-step method to test goodwill for impairment in the fourth quarter each year or sooner if an event occurred or circumstances changed that would more likely than not reduce the fair value of an operating segment below its net carrying value. We tested goodwill in each of our operating segments at the component level, which comprises each of our six business segments. In the first step, we compared the fair value of the operating segment with its net carrying value, including goodwill. If the net carrying value of the operating segment exceeded its fair value, we then performed the second step of the impairment test to measure the amount of impairment loss, if any. The second step required allocation of the operating segment’s fair value to all of its assets and liabilities in a manner similar to a purchase price allocation, with any residual fair value being allocated to goodwill (implied fair value of goodwill). If the carrying amount of the operating segment’s goodwill exceeded the implied fair value of that goodwill, we recognized an impairment loss in an amount equal to that excess up to the carrying value of goodwill.
We reported intangible assets of acquired businesses at their fair value at the date of the acquisition, net of related amortization, if any. We amortized intangible assets with a finite life over their expected useful lives. Amortization of intangible assets reflected the pattern in which the economic benefits of the asset were consumed or realized. We tested identifiable intangible assets for impairment annually or more frequently if events or changes in circumstances indicated that the carrying amount might not be recoverable.
In performing our impairment analyses for goodwill and other intangibles, we used an approach based on the fair value of the assets and liabilities. We performed this analysis using projections of future income discounted at a market rate. The determination of market discount rates is subjective and could vary by product based on the nature of the underlying business, stage of development and sales to date. The projections of future cash flows and assumptions concerning future operating performance and economic conditions may differ from actual results.
Premises and Equipment
We report premises and equipment at cost and, except for land, depreciate them over their estimated useful lives on the straight-line method as follows:
|
|
|
|
|
|
|
Buildings |
39 years |
|
Office equipment |
5 years |
|
Land improvements |
39 years |
|
Computer hardware and software |
2 - 3 years |
|
Furniture and fixtures |
5 years |
|
Leasehold improvements |
Term of the
lease not |
F-14
Investment in Unconsolidated Entities
We account for our investments in unconsolidated entities using the equity method. These investments include both entities in which we hold a significant, but less than controlling, ownership interest and VIEs in which we are not deemed to be the primary beneficiary. Under the equity method of accounting, investments are initially recorded at cost and thereafter adjusted for additional investments, distributions and the proportionate share of earnings or losses of the investee. We evaluate our equity method investments for impairment when events or changes in circumstances indicate that an other-than-temporary decline in value may have occurred. We stop recording our share of investee losses if our share of losses reduces our investment to zero unless we have guaranteed the obligations of or are otherwise committed to provide further financial support to the investee. If the investee subsequently reports net income, we will only continue to record our share of the net income after our share of net income equals the share of net losses not recognized during the periods that the recording of losses was suspended.
Litigation
We monitor our legal matters, including advice from external legal counsel, and periodically perform assessments of these matters for potential loss accrual and disclosure. We establish reserves for settlements, judgments on appeal and filed and/or threatened claims for which we believe it is probable that a loss has been or will be incurred and the amount can be reasonably estimated.
Derivative Financial Instruments
We recognize all derivatives on our consolidated balance sheet at fair value. On the date we enter into a derivative contract, we designate and document each derivative contract as one of the following at the time the contract is executed: (a) a hedge of a recognized asset or liability (fair value hedge); (b) a hedge of a forecasted transaction or the variability of cash flows to be received or paid related to a recognized asset or liability (cash flow hedge); (c) a hedge of a net investment in a foreign operation; or (d) a derivative instrument not designated as a hedging instrument. For a fair value hedge, we record changes in the fair value of the derivative and, to the extent that it is effective, changes in the fair value of the hedged asset or liability attributable to the hedged risk, in the same financial statement category as the hedged item on the face of the statement of operations. For a cash flow hedge, to the extent that it is effective, we record changes in the estimated fair value of the derivative in other comprehensive income. We subsequently reclassify these changes in estimated fair value to net income in the same period, or periods, that the hedged transaction affects earnings and in the same financial statement category as the hedged item. For a hedge of a net investment in a foreign operation, to the extent that it is effective, we record changes in the fair value of the derivative in the net change in unrealized foreign currency translation adjustments in accumulated other comprehensive income. Upon sale or upon complete or substantially complete liquidation of an investment in a foreign entity, the amount accumulated in the translation adjustment component of other comprehensive income is removed and reported as part of the gain or loss on sale or liquidation of the investment in the period during which the sale or liquidation occurs. For a derivative instrument not designated as a hedging instrument, we report changes in the fair values in current period other income (expense), net.
Match Funded Liabilities, Lines of Credit, Investment Line and Other Secured Borrowings
Match funded liabilities, lines of credit, other secured borrowings and the investment line are collateralized by specific assets. Under the terms of these borrowing agreements, we are subject to various qualitative and quantitative covenants. Collectively, these covenants include:
|
|
|
|
|
|
• |
Specified net worth requirements |
|
|
• |
Restrictions on future indebtedness |
|
|
• |
Monitoring and reporting of various specified transactions or events, including specific reporting on defined events affecting collateral underlying certain borrowing agreements |
We believe that we are currently in compliance with these covenants.
F-15
The interest rate for 1-Month LIBOR was 0.23% and 0.44%, respectively, at December 31, 2009 and 2008. Aggregate long-term borrowings by maturity date are set forth below:
|
|
|
|
|
|
|
|
|
|
|
|
|
|
|
|
|
|
|
|
|
|
|
|
|
|
|
|
|
|
Expected Maturity Date at December 31, 2009 |
|
|
|
|
|
||||||||||||||||||
|
|
|
|
|
|
|
|
|||||||||||||||||||
|
|
|
2010 |
|
2011 |
|
2012 |
|
2013 |
|
2014 |
|
There- |
|
Total |
|
Fair |
|
||||||||
|
|
|
|
|
|
|
|
|
|
|
||||||||||||||||
|
Match funded liabilities: |
|
|
|
|
|
|
|
|
|
|
|
|
|
|
|
|
|
|
|
|
|
|
|
|
|
|
Fixed rate |
|
$ |
— |
|
$ |
— |
|
$ |
150,000 |
|
$ |
60,000 |
|
$ |
— |
|
$ |
— |
|
$ |
210,000 |
|
$ |
208,025 |
|
|
Variable interest rate |
|
|
255,691 |
|
|
— |
|
|
— |
|
|
— |
|
|
— |
|
|
— |
|
|
255,691 |
|
|
255,691 |
|
|
Lines of credit and other secured borrowings |
|
|
7,979 |
|
|
8,785 |
|
|
9,672 |
|
|
10,649 |
|
|
18,725 |
|
|
— |
|
|
55,810 |
|
|
56,220 |
|
|
Investment line |
|
|
156,968 |
|
|
— |
|
|
— |
|
|
— |
|
|
— |
|
|
— |
|
|
156,968 |
|
|
156,968 |
|
|
Debt securities |
|
|
— |
|
|
— |
|
|
— |
|
|
— |
|
|
56,435 |
|
|
39,129 |
|
|
95,564 |
|
|
84,551 |
|
|
|
|
|
|
|
|
|
|
|
|
||||||||||||||||
|
|
|
$ |
420,638 |
|
$ |
8,785 |
|
$ |
159,672 |
|
$ |
70,649 |
|
$ |
75,160 |
|
$ |
39,129 |
|
$ |
774,033 |
|
$ |
761,455 |
|
|
|
|
|
|
|
|
|
|
|
|
||||||||||||||||
Foreign Currency Translation
Where the functional currency is not the U.S. dollar, we translate assets and liabilities of foreign entities into U.S. dollars at the current rate of exchange existing at the balance sheet date, while revenues and expenses are translated at average monthly exchange rates. We report the resulting translation adjustments as a component of accumulated other comprehensive income in stockholders’ equity. Where the functional currency of a foreign entity is the U.S. dollar, re-measurement adjustments of foreign-denominated amounts are included in the results of operations.
Income Taxes
We file consolidated federal income tax returns. We allocate consolidated income tax among all subsidiaries included in the consolidated return as if each subsidiary filed a separate return or, in certain cases, a consolidated return.
We account for income taxes using the asset and liability method which requires the recognition of deferred tax liabilities and assets for the expected future tax consequences of temporary differences between the carrying amounts and the tax bases of assets and liabilities. Additionally, we adjust deferred taxes to reflect estimated tax rate changes. We conduct periodic evaluations to determine whether it is more likely than not that some or all of our deferred tax assets will not be realized. Among the factors considered in this evaluation are estimates of future earnings, the future reversal of temporary differences and the impact of tax planning strategies that we can implement if warranted. We provide a valuation allowance for any portion of our deferred tax assets that, more likely than not, will not be realized. We recognize the financial statement benefit of a tax position only after determining that the relevant tax authority would more likely than not sustain the position following an audit. For tax positions meeting the more-likely-than-not threshold, the amount recognized in the financial statements is the largest benefit that has a greater than 50 percent likelihood of being realized upon ultimate settlement with the relevant tax authority. We recognize interest and penalties related to income tax matters in income tax expense.
Basic and Diluted Earnings per Share
We calculate basic earnings per share based upon the weighted average number of shares of common stock outstanding during the year. We calculate diluted earnings per share based upon the weighted average number of shares of common stock outstanding and all dilutive potential common shares outstanding during the year. The computation of diluted earnings per share includes the estimated impact of the exercise of the outstanding options to purchase common stock using the treasury stock method. The computation of diluted earnings per share also includes the potential shares of converted common stock associated with our 3.25% Contingent Convertible Senior Unsecured Notes (Convertible Notes) using the if-converted method.
Use of Estimates
The preparation of financial statements in conformity with generally accepted accounting principles requires that we make estimates and assumptions that affect the reported amounts of assets and liabilities and disclosure of contingent assets and liabilities at the date of the financial statements and the reported amounts of revenues and expenses during the reporting period. Actual results could materially differ from those estimates. Material estimates that are particularly significant in the near or medium term relate to fair value measurements and the provision for potential losses that may arise from litigation proceedings.
F-16
Stock-Based Compensation
We measure the cost of employee services received in exchange for an award of equity instruments based on the grant-date fair value of the award.
Recent Accounting Pronouncements
In June 2009, the Financial Accounting Standards Board (FASB) issued SFAS No. 168, The FASB Accounting Standards Codification and the Hierarchy of Generally Accepted Accounting Principles. This establishes the FASB Accounting Standards Codification (ASC) as the only source of authoritative accounting principles recognized by the FASB to be applied by nongovernmental entities in the preparation of financial statements in conformity with GAAP, with the exception of Statements of Financial Accounting Standards not yet included in the Codification. We adopted the FASB ASC as required for the period ended September 30, 2009 with no impact on our consolidated financial statements.
ASC 820, Fair Value Measures. In April 2009, the FASB issued additional guidance for estimating fair value when the level of activity for the asset or liability has significantly decreased. Our initial adoption of this standard during the second quarter of 2009 did not have a material effect on our consolidated financial statements.
ASC 805, Business Combinations. The FASB issued changes to ASC 805 which modify certain elements of the acquisition method of accounting used for all business combinations. These changes require an acquirer to recognize the assets acquired, the liabilities assumed, and any noncontrolling interest in the acquiree at the acquisition date, measured at the full amounts of their fair values, with limited exceptions specified in the statement. If the business combination is achieved in stages (a step acquisition), an acquirer is also required to recognize the identifiable assets and liabilities, as well as the noncontrolling interest in the acquiree, at the full amounts of their fair values. The acquirer must recognize restructuring and acquisition costs separately from the business combination. Sufficient information must now be disclosed in order to understand the nature and effect of the business combination. The adoption of these changes on January 1, 2009 did not have an impact on our consolidated financial statements.
ASC 810, Consolidations. The FASB issued SFAS No. 160 (Codified within ASC 810) on December 4, 2007. The statement establishes new accounting and reporting standards for a non-controlling interest in a subsidiary and for the deconsolidation of a subsidiary. Specifically, this statement requires the recognition of a non-controlling interest (minority interest) as equity in the consolidated financial statements separate from the parent’s equity. The amount of net income attributable to the non-controlling interest is included in consolidated net income on the face of the income statement. The statement clarifies that changes in a parent’s ownership interest in a subsidiary that do not result in deconsolidation are equity transactions if the parent retains its controlling financial interest. In addition, when a subsidiary is deconsolidated, this statement requires that a parent recognize a gain or loss in net income based on the fair value of the entire entity, irrespective of any retained ownership, on the deconsolidation date. Such a gain or loss will be measured using the fair value of the non-controlling equity investment on the deconsolidation date. We adopted this standard on January 1, 2009 by retrospectively applying the provisions of the new guidance to all prior periods. Because the outstanding non-controlling interests in consolidated subsidiaries are not significant, the implementation of this standard did not have a material effect on our consolidated financial statements.
ASC 470, Debt. The FASB issued FSP No. APB 14-1 (Codified within ASC 470) providing guidance on convertible debt instruments that may be settled in cash upon conversion (including partial cash settlement). Under this guidance, issuers of such instruments should separately account for the liability and equity components in a manner that will reflect the entity’s nonconvertible debt borrowing rate when interest cost is recognized in subsequent periods. Upon adoption of this standard on January 1, 2009, we recognized a discount to reduce the carrying value of the 3.25% Convertible Notes and an offsetting increase to stockholders’ equity. The cumulative effect of adoption resulted in: (1) a reduction of retained earnings of $12,678 due to the retrospective accretion of the resulting debt discount to interest expense over the expected life of the notes; (2) adjustments to debt issue cost amortization and gains or losses recognized on previous redemptions; and (3) an increase in additional paid-in capital of $19,567. The adjustment to additional paid-in capital includes the recognized debt discount, adjusted for note redemptions, and the effect of deferred taxes, as well as net gains or losses attributable to redemptions of the equity component. Interest expense for the years ended December 31, 2008 and 2007 has been adjusted to include amortization of debt discount of $3,886 and $4,069, respectively, and a reduction in the amortization of debt issue costs of $136 and $153, respectively. The gain previously recognized on the redemption of debt securities during 2008 of $3,595 has been adjusted to reflect a loss of $86 on the debt component of the convertible notes in the statement of operations and a gain of $2,800 in additional paid in capital for the equity component.
F-17
ASC 320, Investments. The FASB issued FSP No. FAS 115-2 and FAS 124-2 (Codified within ASC 320) which amends the other-than-temporary impairment guidance for debt securities and improves the presentation and disclosure of other-than-temporary impairments on debt and equity securities in the financial statements. This standard does not amend existing recognition and measurement guidance related to other-than-temporary impairments of equity securities. Because our current investments in debt securities are classified as trading securities and therefore measured at fair value on a recurring basis, this standard did not have a material effect on our consolidated financial statements upon adoption during the second quarter of 2009.
ASC 855, Subsequent Events. This statement, which we adopted during the quarter ended June 30, 2009. It requires the disclosure of the date through which an entity has evaluated subsequent events and the basis for that date, that is, whether that date represents the date the financial statements were issued or were available to be issued. A public entity is required to evaluate subsequent events through the date that the financial statements are issued. This statement did not result in changes in the subsequent events that we report, either through recognition or disclosure, in our financial statements upon adoption.
ASC 860, Transfers and Servicing. This statement clarifies that the objective of the standard is to determine whether a transferor and all of the entities included in the transferor’s financial statements being presented have surrendered control over transferred financial assets. That determination must consider the transferor’s continuing involvements in the transferred financial asset, including all arrangements or agreements made contemporaneously with, or in contemplation of, the transfer, even if they were not entered into at the time of the transfer. This statement modifies the financial-components approach currently used and limits the circumstances in which a financial asset, or portion of a financial asset, should be derecognized when the transferor has not transferred the entire original financial asset to an entity that is not consolidated with the transferor in the financial statements being presented and/or when the transferor has continuing involvement with the transferred financial asset.
This statement defines the term participating interest to establish specific conditions for reporting a transfer of a portion of a financial asset as a sale. If the transfer does not meet those conditions, a transferor should account for the transfer as a sale only if it transfers an entire financial asset or a group of entire financial assets and surrenders control over the entire transferred asset(s). This statement requires that a transferor recognize and initially measure at fair value all assets obtained (including a transferor’s beneficial interest) and liabilities incurred as a result of a transfer of financial assets accounted for as a sale. Enhanced disclosures are required to provide financial statement users with greater transparency about transfers of financial assets and a transferor’s continuing involvement with transferred financial assets.
The provisions for guaranteed mortgage securitizations are removed to require those securitizations to be treated the same as any other transfer of financial assets within the scope of the standard. If such a transfer does not meet the requirements for sale accounting, the securitized mortgage loans should continue to be classified as loans in the transferor’s statement of financial position.
We are currently evaluating the impact of this standard upon adoption effective January 1, 2010.
ASC 810, Consolidation. This standard requires an enterprise to perform ongoing periodic assessments to determine whether the enterprise’s variable interest or interests give it a controlling financial interest in a VIE. We adopted this standard effective January 1, 2010. This analysis identifies the primary beneficiary of a VIE as the enterprise that has both of the following characteristics:
|
|
|
|
|
|
(a) |
The power to direct the activities of a variable interest entity that most significantly impact the entity’s economic performance |
|
|
|
|
|
|
(b) |
The obligation to absorb losses of the entity that could potentially be significant to the VIE or the right to receive benefits from the entity that could potentially be significant to the VIE. |
In addition to reintroducing the concept of control into the determination of the primary beneficiary of a VIE, this statement makes numerous other amendments to the current standards to primarily reflect the elimination of the concept of a QSPE under ASC 860 (above). This statement also amends the current standards to require enhanced disclosures that will provide users of financial statements with more transparent information about an enterprise’s involvement in a variable interest entity. The enhanced disclosures are required for any enterprise that holds a variable interest in a VIE.
As disclosed in Note 1—Securitizations of Residential Mortgage Loans, we currently exclude certain loan securitization trusts from our consolidated financial statements because each is a QSPE. Effective January 1, 2010, we are required to reevaluate these QSPEs as well as all other potentially significant interests in other unconsolidated entities such as our asset management vehicles and the securitization trusts underlying our servicing portfolio, to determine if we should include them in our consolidated financial statements. We are currently evaluating the potential impact of this new standard, in connection with the new guidance issued under ASC 860 (above).
F-18
|
|
|
|
NOTE 2 |
ALTISOURCE (FORMERLY OCWEN SOLUTIONS) SEPARATION TRANSACTION |
On August 10, 2009, we completed the separation of Altisource by distributing all of the shares of Altisource common stock to OCN shareholders and convertible noteholders of record as of August 4, 2009 (the Separation), in the form of a pro rata stock distribution. Altisource consists of the operations of our former Ocwen Solutions line of business and related assets comprising the Mortgage Services, Financial Services and Technology Products segments except for BMS Holdings and GSS.
OCN shareholders received a tax-free pro rata distribution of one share of Altisource common stock for every three shares of OCN common stock held and received cash in lieu of fractional shares. Each convertible noteholder participated in the distribution of Altisource shares, without converting the notes described in Note 19, by applying the distribution ratio to the conversion ratio of the convertible notes. Accordingly, upon the separation of Altisource and Ocwen, there was no adjustment to the conversion ratio of the Convertible Notes.
As a consequence of the Separation and related transactions, Ocwen incurred income taxes to the extent that the fair market value of Altisource assets exceeded Ocwen’s tax basis in such assets in accordance with Section 367 of the Internal Revenue Code. Ocwen recognized $52,047 of income tax expense, of which $25,649 is current expense and $26,398 is deferred expense. Additional disclosure of the impact of the Separation on our deferred tax assets is included in Note 26.
We eliminated the assets and liabilities of Altisource from our consolidated balance sheet effective at the close of business on August 9, 2009. Beginning August 10, 2009, the operating results of Altisource are no longer included in our operating results. We do not report the historical operating results of Altisource as a discontinued operation because of the significance of the continuing involvement between Altisource and OCN under the long-term services agreements described in Note 30. Accordingly, for periods prior to August 10, 2009, the historical operating results of Altisource are presented in continuing operations.
In connection with the Separation, we recognized $3,477 of advisory expenses in 2009.
Carrying value of the net assets transferred to Altisource in the Separation:
|
|
|
|
|
|
|
Assets: |
|
|
|
|
|
Cash |
|
$ |
20,028 |
|
|
Receivables |
|
|
13,888 |
|
|
Goodwill and intangibles, net |
|
|
43,767 |
|
|
Premises and equipment, net |
|
|
8,615 |
|
|
Other assets |
|
|
2,180 |
|
|
|
|
|
||
|
|
|
|
88,478 |
|
|
|
|
|
||
|
Liabilities |
|
|
|
|
|
Deferred tax liability, net |
|
|
1,336 |
|
|
Accrued expenses and other liabilities |
|
|
14,996 |
|
|
|
|
|
||
|
|
|
|
16,332 |
|
|
|
|
|
||
|
|
|
|
|
|
|
Reduction in Additional paid-in capital |
|
$ |
72,146 |
|
|
|
|
|
Impact of the Separation on Equity-based Compensation. OCN stock options outstanding under Ocwen’s various equity compensation plans have been adjusted to reflect the value of Altisource stock distributed to OCN shareholders. At the date of the Separation, all holders of OCN stock awards, including Altisource employees and those who remained with Ocwen after the Separation, received the following:
|
|
|
|
|
|
l |
New Altisource stock options (issued by Altisource) to acquire the number of shares of Altisource common stock equal to the product of (a) the number of OCN stock options held on the date of the Separation and (b) the distribution ratio of one share of Altisource common stock for every three shares of OCN common stock; and |
|
|
|
|
|
|
l |
Adjusted OCN stock options for the same number of shares of OCN common stock with a reduced exercise price per stock option. |
We determined the exercise price of the new Altisource options and the adjusted OCN options based on the exercise price ratio. We calculated the exercise price ratio for each individual stock option based on the ratio of the grant-date exercise price of the individual stock option to the trading value of the OCN stock immediately prior to the Separation. We then applied this exercise price ratio to the trading value of the OCN stock and the Altisource stock on the date the Altisource stock began regular-way trading on the NASDAQ market to determine the exercise price of the new Altisource stock option and the adjusted OCN stock option.
F-19
Similarly, each holder of OCN restricted stock retained his or her unvested shares and received one unvested Altisource stock share for every three OCN unvested shares held.
Consequently, the fair value of the adjusted OCN stock award and the new Altisource stock award immediately following the Separation was equivalent to the fair value of such OCN stock award immediately prior to the Separation.
As of December 31, 2009, the following OCN stock incentive awards were outstanding:
|
|
|
|
|
|
|
|
|
|
|
|
OCN Stock |
|
OCN Restricted |
|
||
|
|
|
|
|
||||
|
Held by current and former OCN employees |
|
|
6,970,484 |
|
|
7,484 |
|
|
Held by Altisource employees |
|
|
2,203,097 |
|
|
2,381 |
|
|
|
|
|
|
||||
|
Total |
|
|
9,173,581 |
|
|
9,865 |
|
|
|
|
|
|
||||
In addition, as of December 31, 2009, our current and former employees held 2,310,205 options to purchase Altisource common stock and 2,498 unvested shares of Altisource common stock.
We are responsible for fulfilling all stock incentive awards related to OCN common stock, and Altisource is responsible for fulfilling all stock incentive awards related to Altisource common stock regardless of whether such stock incentive awards are held by our or Altisource’s employees. Notwithstanding the foregoing, our stock-based compensation expense, resulting from awards outstanding at the Separation date, is based on the stock incentive awards held by our employees regardless of whether such awards were issued by OCN or Altisource. Accordingly, stock-based compensation that we recognize as expense with respect to Altisource stock incentive awards is included in “Additional paid-in capital” on our Consolidated Balance Sheet. See Note 28 for additional information regarding our employee compensation and benefit plans.
|
|
|
|
NOTE 3 |
FAIR VALUE |
The carrying amounts and the estimated fair values of our financial instruments are as follows at December 31:
|
|
|
|
|
|
|
|
|
|
|
|
|
|
|
|
|
|
2009 |
|
2008 |
|
||||||||
|
|
|
|
|
||||||||||
|
|
|
Carrying |
|
Fair |
|
Carrying |
|
Fair |
|
||||
|
|
|
|
|
|
|
||||||||
|
Financial assets: |
|
|
|
|
|
|
|
|
|
|
|
|
|
|
Trading securities: |
|
|
|
|
|
|
|
|
|
|
|
|
|
|
Auction rate |
|
$ |
247,464 |
|
$ |
247,464 |
|
$ |
239,301 |
|
$ |
239,301 |
|
|
Subordinates and residuals |
|
|
3,692 |
|
|
3,692 |
|
|
4,369 |
|
|
4,369 |
|
|
Loans held for resale |
|
|
33,197 |
|
|
33,197 |
|
|
49,918 |
|
|
49,918 |
|
|
Advances |
|
|
968,529 |
|
|
968,529 |
|
|
1,202,640 |
|
|
1,202,640 |
|
|
Receivables |
|
|
67,095 |
|
|
67,095 |
|
|
39,907 |
|
|
39,907 |
|
|
Financial liabilities: |
|
|
|
|
|
|
|
|
|
|
|
|
|
|
Match funded liabilities |
|
$ |
465,691 |
|
$ |
463,716 |
|
$ |
961,939 |
|
$ |
965,233 |
|
|
Lines of credit and other secured borrowings |
|
|
55,810 |
|
|
56,220 |
|
|
116,870 |
|
|
116,870 |
|
|
Investment line |
|
|
156,968 |
|
|
156,968 |
|
|
200,719 |
|
|
200,719 |
|
|
Servicer liabilities |
|
|
38,672 |
|
|
38,672 |
|
|
135,751 |
|
|
135,751 |
|
|
Debt securities |
|
|
95,564 |
|
|
84,551 |
|
|
133,367 |
|
|
112,764 |
|
|
Derivative financial instruments, net |
|
$ |
781 |
|
$ |
781 |
|
$ |
(533 |
) |
$ |
(533 |
) |
Fair value is estimated based on a hierarchy that maximizes the use of observable inputs and minimizes the use of unobservable inputs. Observable inputs are inputs that reflect the assumptions market participants would use in pricing the asset or liability developed based on market data obtained from sources independent of the reporting entity. Unobservable inputs are inputs that reflect the reporting entity’s own assumptions about the assumptions market participants would use in pricing the asset or liability developed based on the best information available in the circumstances. The fair value hierarchy prioritizes the inputs to valuation techniques into three broad levels whereby the highest priority is given to Level 1 inputs and the lowest to Level 3 inputs. The three broad categories are:
|
|
|
|
|
|
Level 1: |
Quoted prices in active markets for identical assets or liabilities. |
|
|
|
|
|
|
Level 2: |
Inputs other than quoted prices that are observable for the asset or liability, either directly or indirectly for substantially the full term of the financial instrument. |
F-20
|
|
|
|
|
|
Level 3: |
Unobservable inputs for the asset or liability. |
Where available, we utilize quoted market prices or observable inputs rather than unobservable inputs to determine fair value. We classify assets in their entirety based on the lowest level of input that is significant to the fair value measurement. The following table sets forth assets and liabilities measured at fair value categorized by input level within the fair value hierarchy:
|
|
|
|
|
|
|
|
|
|
|
|
|
|
|
|
|
|
Carrying value |
|
Level 1 |
|
Level 2 |
|
Level 3 |
|
||||
|
|
|
|
|
|
|
||||||||
|
At December 31, 2009: |
|
|
|
|
|
|
|
|
|
|
|
|
|
|
Measured at fair value on a recurring basis: |
|
|
|
|
|
|
|
|
|
|
|
|
|
|
Trading securities (1): |
|
|
|
|
|
|
|
|
|
|
|
|
|
|
Auction rate |
|
$ |
247,464 |
|
$ |
— |
|
$ |
— |
|
$ |
247,464 |
|
|
Subordinates and residuals |
|
|
3,692 |
|
|
— |
|
|
— |
|
|
3,692 |
|
|
Derivative financial instruments, net (2) |
|
|
781 |
|
|
— |
|
|
— |
|
|
781 |
|
|
Measured at fair value on a non-recurring basis: |
|
|
|
|
|
|
|
|
|
|
|
|
|
|
Loans held for resale (3) |
|
|
33,197 |
|
|
— |
|
|
— |
|
|
33,197 |
|
|
Mortgage servicing rights (4) |
|
|
613 |
|
|
— |
|
|
— |
|
|
613 |
|
|
|
|
|
|
|
|
|
|
|
|
|
|
|
|
|
At December 31, 2008: |
|
|
|
|
|
|
|
|
|
|
|
|
|
|
Measured at fair value on a recurring basis: |
|
|
|
|
|
|
|
|
|
|
|
|
|
|
Trading securities (1): |
|
|
|
|
|
|
|
|
|
|
|
|
|
|
Auction rate |
|
$ |
239,301 |
|
$ |
— |
|
$ |
— |
|
$ |
239,301 |
|
|
Subordinates and residuals |
|
|
4,369 |
|
|
— |
|
|
— |
|
|
4,369 |
|
|
Derivative financial instruments, net (2) |
|
|
(533 |
) |
|
(726 |
) |
|
— |
|
|
193 |
|
|
Measured at fair value on a non-recurring basis: |
|
|
|
|
|
|
|
|
|
|
|
|
|
|
Loans held for resale (3) |
|
|
49,918 |
|
|
— |
|
|
— |
|
|
49,918 |
|
|
Mortgage servicing rights (4) |
|
|
— |
|
|
— |
|
|
— |
|
|
— |
|
|
|
|
|
(1) |
Because our internal valuation model requires significant use of unobservable inputs, these securities are classified within Level 3 of the fair value hierarchy. |
|
(2) |
Derivative financial instruments consist of interest rate caps that we use to protect against our exposure to rising interest rates on two of our match funded variable funding notes. At December 31, 2008, derivative financial instruments also included foreign currency futures contracts that we used to hedge our net investment in Bankhaus Oswald Kruber GmbH & Co. KG (BOK), a wholly-owned German banking subsidiary that we sold in 2009, against adverse changes in the value of the Euro versus the U.S. Dollar. We classified the interest rate caps within Level 3 of the fair value hierarchy and the futures contracts within Level 1. See Note 22 for additional information on our derivative financial instruments. |
|
(3) |
Loans held for resale are measured at fair value on a non-recurring basis. At December 31, 2009 and 2008, the carrying value of loans held for resale is net of a valuation allowance of $15,963 and $17,491, respectively. Current market illiquidity has reduced the availability of observable pricing data. Consequently, we classify loans within level 3 of the fair value hierarchy. |
|
(4) |
The carrying value of MSRs at December 31, 2009 and 2008 is net of a valuation allowance for impairment of $2,954 and $3,624, respectively. The valuation allowance, which relates exclusively to the high-loan-to-value stratum of our residential MSRs, reduced the carrying value of the stratum to $613 and zero at December 31, 2009 and 2008, respectively. The estimated fair value exceeded amortized cost for all other strata. See Note 9 for additional information on MSRs. |
F-21
The following table sets forth a reconciliation of the changes in fair value of our Level 3 assets that we measure at fair value on a recurring basis:
|
|
|
|
|
|
|
|
|
|
|
|
|
|
|
|
|
|
|
|
|
Fair value at |
|
Purchases, |
|
Total |
|
Transfers in |
|
Fair value |
|
|||||
|
|
|
|
|
|
|
|
||||||||||
|
For the year ended December 31, 2009: |
|
|
|
|
|
|
|
|
|
|
|
|
|
|
|
|
|
Trading securities: |
|
|
|
|
|
|
|
|
|
|
|
|
|
|
|
|
|
Auction rate |
|
$ |
239,301 |
|
$ |
(3,700 |
) |
$ |
11,863 |
|
$ |
— |
|
$ |
247,464 |
|
|
Subordinates and residuals |
|
|
4,369 |
|
|
— |
|
|
(677 |
) |
|
— |
|
|
3,692 |
|
|
|
|
|
|
|
|
|
|
|
|
|
|
|
|
|
|
|
|
Derivative financial instruments |
|
|
193 |
|
|
— |
|
|
588 |
|
|
— |
|
|
781 |
|
|
|
|
|
|
|
|
|
|
|
|
|
|
|
|
|
|
|
|
For the year ended December 31, 2008: |
|
|
|
|
|
|
|
|
|
|
|
|
|
|
|
|
|
Trading securities: |
|
|
|
|
|
|
|
|
|
|
|
|
|
|
|
|
|
Auction rate |
|
$ |
— |
|
$ |
268,913 |
|
$ |
(29,612 |
) |
$ |
— |
|
$ |
239,301 |
|
|
Subordinates and residuals |
|
|
7,362 |
|
|
24 |
|
|
(3,017 |
) |
|
— |
|
|
4,369 |
|
|
|
|
|
|
|
|
|
|
|
|
|
|
|
|
|
|
|
|
Derivative financial instruments |
|
|
4,867 |
|
|
(7,064 |
) |
|
2,390 |
|
|
— |
|
|
193 |
|
|
|
|
|
(1) |
Purchases, collections and settlements, net, related to trading securities exclude interest received. |
|
(2) |
Total gains and (losses) on auction rate securities include unrealized gains (losses) of $11,772 and $(28,137) on auction rate securities held at December 31, 2009 and 2008, respectively. The total gains and (losses) attributable to subordinates and residuals and derivative financial instruments were comprised exclusively of unrealized gains (losses) on assets held at December 31, 2009 and 2008. |
The methodologies that we use and key assumptions that we make to estimate the fair value of instruments are described in more detail by instrument below:
Trading Securities
Auction Rate Securities. We estimated the fair value of the auction rate securities based on a combination of observable market inputs provided by actual orderly sales of similar auction rate securities and a discounted cash flow analysis. This discounted cash flow analysis incorporates expected future cash flows based on our best estimate of market participant assumptions. In periods of market illiquidity, the fair value of auction rate securities is determined after consideration of the credit quality of the securities held and the underlying collateral, market activity and general market conditions affecting auction rate securities.
The discounted cash flow analysis included the following range of assumptions at December 31, 2009:
|
|
|
|
|
|
|
l |
Expected term |
24 months |
|
|
l |
Illiquidity premium |
1.14% |
|
|
l |
Discount rate |
1.32% – 4.05% |
The expected term was based upon our best estimate of market participants’ expectations of future successful auctions. The discount rate and illiquidity premium are consistent with prevailing rates for similar securities. Other significant assumptions that we considered in our analysis included the credit risk profiles of the issuers, the impact on the issuers of the increased debt service costs associated with the payment of penalty interest rates and the collateralization of the securitization trusts. We do not assume defaults in our valuation due to the high credit quality of both the securities we hold and the underlying collateral.
Subordinates and Residuals. Our subordinate and residual securities are not actively traded, and, therefore, we estimate the fair value of these securities based on the present value of expected future cash flows from the underlying mortgage pools. We use our best estimate of the key assumptions we believe are used by market participants. We calibrate our internally developed discounted cash flow models for trading activity when appropriate to do so in light of market liquidity levels. Key inputs include expected prepayment rates, delinquency and cumulative loss curves and discount rates commensurate with the risks. Where possible, we use observable inputs in the valuation of our securities. However, the subordinate and residual securities in which we invest typically trade infrequently and therefore have few or no observable inputs and little price transparency. Additionally, during periods of market dislocation the observability of inputs is further reduced.
F-22
Discount rates for the subordinate and residual securities range from 21% to 22% and are determined based upon an assessment of prevailing market conditions and prices for similar assets. We project the delinquency, loss and prepayment assumptions based on a comparison to actual historical performance curves adjusted for prevailing market conditions. Peak delinquency assumptions range from 20% to 30%, and loss assumptions on current balances range from 20% to 29%. Average prepayment assumptions range from 5% to 6%.
Derivative Financial Instruments
Exchange-traded derivative financial instruments are valued based on quoted market prices. If quoted market prices or other observable inputs are not available, fair value is based on estimates provided by third-party pricing sources.
Loans Held for Resale
Loans held for resale are reported at the lower of cost or fair value. We account for the excess of cost over fair value as a valuation allowance with changes in the valuation allowance included in gain (loss) on loans held for resale, net, in the period in which the change occurs. All loans held for resale were measured at fair value because the cost of $49,160 exceeded the estimated fair value of $33,197 at December 31, 2009.
When we enter into an agreement to sell a loan to an investor at a set price, the loan is valued at the commitment price. The fair value of loans for which we do not have a firm commitment to sell is based upon a discounted cash flow analysis. We stratify our fair value estimate of uncommitted loans held for resale based upon the delinquency status of the loans. We base the fair value of our performing loans on the expected future cash flows discounted at a rate commensurate with the risk of the estimated cash flows. Significant assumptions include collateral and loan characteristics, prevailing market conditions and the creditworthiness of the borrower. The fair value of our non-performing loans is determined based upon the underlying collateral of the loan and the estimated period and cost of disposition.
Mortgage Servicing Rights
We estimate the fair value of our MSRs by calculating the present value of expected future cash flows utilizing assumptions that we believe are used by market participants. The most significant assumptions used in our internal valuation are the speed at which mortgages prepay and delinquency experience, both of which we derive from our historical experience and available market data. Other assumptions used in our internal valuation are:
|
|
|
|
|
|
|
|
l |
Cost of servicing |
l |
Interest rate used for computing float earnings |
|
|
l |
Discount rate |
l |
Interest rate used for computing the cost of Servicing advances |
|
|
l |
Compensating interest expense |
|
The significant components of the estimated future cash inflows for MSRs include servicing fees, late fees, prepayment penalties, float earnings and other ancillary fees. Significant cash outflows include the cost of servicing, the cost of financing servicing advances and compensating interest payments. We derive prepayment speeds and delinquency assumptions from historical experience adjusted for prevailing market conditions. We develop the discount rate internally, and we consider external market-based assumptions in determining the interest rate for the cost of financing advances, the interest rate for float earnings and the cost of servicing. The more significant assumptions used in the December 31, 2009 valuation include prepayment speeds ranging from 16% to 23% (depending on loan type) and delinquency rates ranging from 15% to 23% (depending on loan type). Other assumptions include an interest rate of 1-month LIBOR plus 4% for computing the cost of financing advances, an interest rate of 1-month LIBOR for computing float earnings and a discount rate of 20%.
We perform an impairment analysis based on the difference between the carrying amount and fair value after grouping our loans into the applicable strata based on one or more of the predominant risk characteristics of the underlying loans. The risk factors used to assign loans to strata include the credit score (FICO) of the borrower, the loan to value ratio and the default risk. Our strata include:
|
|
|
|
|
|
|
|
l |
Subprime |
l |
Re-performing |
|
|
l |
ALT A |
l |
Special servicing |
|
|
l |
High-loan-to-value |
l |
Other |
|
|
|
|
|
|
|
|
|
|
|
F-23
Advances
We value advances that we make on loans that we service for others at their carrying amounts because they have no stated maturity, generally are realized within a relatively short period of time and do not bear interest.
Receivables
The carrying value of receivables generally approximates fair value because of the relatively short period of time between their origination and realization. We carry long-term receivables with an implicit fixed rate or floating rate at a discounted value or approximate face value, respectively, which we believe approximates fair value.
Servicer Liabilities
The carrying value of servicer liabilities approximates fair value due to the short period of time the funds are held until they are deposited in collection accounts, paid directly to an investment trust or refunded to borrowers.
|
|
|
|
NOTE 4 |
DISCONTINUED OPERATIONS |
In the fourth quarter of 2007, management of OCN approved and committed to a plan to sell its investment in BOK. Management has concluded that BOK met and continued to meet the definition of a discontinued operation. Accordingly, the results of BOK are classified as discontinued in the accompanying consolidated financial statements. For segment reporting purposes, the operations of BOK are included in Corporate Items and Other.
We recorded a charge of $2,012 to write down the carrying value of goodwill as of December 31, 2007. In the second quarter of 2008, we recorded a charge of $4,980 that included the impairment of the remaining $3,423 carrying value of goodwill and intangibles, a $1,377 valuation adjustment to write-down receivables and a $180 valuation adjustment to write-down premises and equipment.
On December 3, 2009, we finalized and consummated the transaction to dispose of our investment in BOK for proceeds of $11,443 and recognized a pre-tax gain of $4,034 on the disposition.
Results of discontinued operations, including both the operations of BOK and the gain on the disposition of BOK, for the years ended December 31 are as follows:
|
|
|
|
|
|
|
|
|
|
|
|
|
|
|
2009 |
|
2008 |
|
2007 |
|
|||
|
|
|
|
|
|
||||||
|
Revenue |
|
$ |
78 |
|
$ |
358 |
|
$ |
309 |
|
|
Operating expenses (1) |
|
|
298 |
|
|
7,337 |
|
|
4,349 |
|
|
|
|
|
|
|
||||||
|
Loss from operations |
|
|
(220 |
) |
|
(6,979 |
) |
|
(4,040 |
) |
|
Other income, net (2) |
|
|
4,709 |
|
|
1,212 |
|
|
868 |
|
|
|
|
|
|
|
||||||
|
Income (loss) before income taxes |
|
|
4,489 |
|
|
(5,767 |
) |
|
(3,172 |
) |
|
Income tax expense (benefit) |
|
|
1,368 |
|
|
— |
|
|
— |
|
|
|
|
|
|
|
||||||
|
Net income (loss) |
|
$ |
3,121 |
|
$ |
(5,767 |
) |
$ |
(3,172 |
) |
|
|
|
|
|
|
||||||
|
|
|
|
(1) |
Operating expenses include the impairment charges and valuation adjustments we recorded in 2008 and 2007, and the partial reversal of the valuation adjustments in 2009. |
|
(2) |
Other income includes the $4,034 gain on the disposition that we recognized in 2009. |
The following table presents BOK’s assets and liabilities at December 31, 2008:
|
|
|
|
|
|
|
Cash |
|
$ |
4,613 |
|
|
Receivables |
|
|
10,250 |
|
|
Other |
|
|
33 |
|
|
|
|
|
||
|
Total assets |
|
$ |
14,896 |
|
|
|
|
|
||
|
|
|
|
|
|
|
Total liabilities (including customer deposits of $5,820) |
|
$ |
6,280 |
|
|
|
|
|
F-24
|
|
|
|
NOTE 5 |
TRADING SECURITIES |
Trading securities consisted of the following at December 31:
|
|
|
|
|
|
|
|
|
|
|
|
2009 |
|
2008 |
|
||
|
|
|
|
|
||||
|
|
|
|
|
|
|
||
|
Auction rate (Corporate Items and Other) |
|
$ |
247,464 |
|
$ |
239,301 |
|
|
|
|
|
|
||||
|
|
|
|
|
|
|
|
|
|
Subordinates and residuals: |
|
|
|
|
|
|
|
|
Loans and Residuals |
|
$ |
3,634 |
|
$ |
4,204 |
|
|
Corporate Items and Other |
|
|
58 |
|
|
165 |
|
|
|
|
|
|
||||
|
|
|
$ |
3,692 |
|
$ |
4,369 |
|
|
|
|
|
|
||||
Gain (loss) on trading securities for the years ended December 31 was comprised of the following:
|
|
|
|
|
|
|
|
|
|
|
|
|
|
|
2009 |
|
2008 |
|
2007 |
|
|||
|
|
|
|
|
|
||||||
|
Unrealized gains (losses), net (1) |
|
$ |
11,096 |
|
$ |
(33,784 |
) |
$ |
(31,849 |
) |
|
Realized gains (losses), net (2) (3) |
|
|
91 |
|
|
(1,696 |
) |
|
25,186 |
|
|
|
|
|
|
|
||||||
|
|
|
$ |
11,187 |
|
$ |
(35,480 |
) |
$ |
(6,663 |
) |
|
|
|
|
|
|
||||||
|
|
|
|
(1) |
Unrealized gains for 2009 include $11,772 related to auction rate securities as compared to unrealized losses of $28,950 on auction rate securities for 2008. |
|
(2) |
Realized losses for 2008 include a loss of $662 on the sale of auction rate securities in the second quarter. |
|
(3) |
During the second quarter of 2007, we sold residual securities that were backed by subprime residential loans originated in the United Kingdom (the UK residuals) and realized a gain of $25,587 in our Loans and Residuals segment. |
Auction Rate Securities
During the first quarter of 2008, we invested investment line borrowings (see Note 1) in AAA-rated auction rate securities backed by student loans originated under the U. S. Department of Education’s Federal Family Education Loan Program (FFELP). Auction rate securities are long-term variable rate bonds tied to short-term interest rates that reset through an auction process that historically occurred every 7 to 35 days. The student loans underlying the auction rate securities carry a U.S Government guarantee of at least 97% of the unpaid principal balance in the event of default. The auction rate securities that we hold are in the senior-most position and are smaller in amount than the federally guaranteed portion of the underlying loans. Historically, the par value of auction rate securities approximated fair value due to the frequent auctions of these securities at par. In the first quarter of 2008, the auction rate security market began experiencing illiquidity, and auctions began to fail because there were not enough orders to purchase all of the securities being offered at the auction. Within the context of a failed auction, the issuer pays the investor interest based on a calculation mechanism until the auction returns to clearing status, the notes mature at par or the notes are called or redeemed.
On January 21, 2009, Fitch Ratings announced that it had downgraded several tranches of auction rate securities from ‘AAA’ to ‘BBB’. Auction rate securities we hold, with a par value of $70,350 at December 31, 2009, were affected by this ratings action. On January 28, 2009 and February 19, 2009, respectively, Moody’s Investors Services, Inc. announced that it had downgraded several tranches of auction rate securities from ‘BBB’ to ‘B’ and from ‘AAA’ to ‘A’. Auction rate securities we hold, with a par value of $70,350 and $3,800 at December 31, 2009, were affected by the ratings actions from ‘BBB’ to ‘B’ and from ‘AAA’ to ‘A’, respectively. The AAA rating from Standard and Poor’s Ratings Services has not been revised. To date we have received all interest payments when due.
We did not sell any of our auction rate securities during 2009. During the year, issuers redeemed, at par, auction rate securities we held with a face value of $3,700. We recognized unrealized gains of $11,772 in 2009. These gains were due to the increased probability of a near term liquidity solution for $70,350 principal amount of the auction rate securities and continued improvement in the underlying FFELP student loan market since December 31, 2008.
In October 2009, Ocwen entered into a liquidity option related to $92,850 face amount of auction rate securities. Under the terms of this agreement, we have the right to sell specific securities for cash. We also have the right to repurchase the same following the initial sale at the same price. When the first option is exercised, we expect to record the arrangement as a borrowing secured by contractually specified auction rate securities. We will continue to report these auction rate securities as pledged securities at fair value on the balance sheet until maturity of the liquidity option in three years or such time as the underlying auction rate securities are sold. Once exercised, we will no longer receive cash interest income on the pledged securities nor will we pay cash interest on the secured borrowing. From October 2009 through December 2009, $1,200 face amount of auction rate securities subject to this option were redeemed at par.
F-25
See Note 34 for subsequent events related to auction rate securities.
Subordinates and Residuals
Through our investment in subordinate and residual securities, we support senior classes of securities. Principal from the underlying mortgage loans generally is allocated first to the senior classes, with the most senior class having a priority right to the cash flow from the mortgage loans until its payment requirements are satisfied. To the extent that there are defaults and unrecoverable losses on the underlying mortgage loans, resulting in reduced cash flows, the most subordinate security will be the first to bear this loss.
|
|
|
|
NOTE 6 |
LOANS HELD FOR RESALE |
Loans held for resale primarily represent subprime single family residential loans that we do not intend to hold to maturity. The carrying value of these loans amounted to $33,197 and $49,918 at December 31, 2009 and 2008, respectively. The balances at December 31, 2009 and 2008 are net of market valuation allowances of $15,963 and $17,491, respectively. Loans held for resale at December 31, 2009 and 2008 include non-performing loans with a carrying value of $14,382 and $19,193, respectively.
|
|
|
|
NOTE 7 |
ADVANCES |
Advances, representing payments made on behalf of borrowers or on foreclosed properties, as more fully described in Note 1—Mortgage Servicing Fees and Advances, consisted of the following at December 31:
|
|
|
|
|
|
|
|
|
|
|
|
2009 |
|
2008 |
|
||
|
|
|
|
|
||||
|
Servicing: |
|
|
|
|
|
|
|
|
Principal and interest |
|
$ |
51,598 |
|
$ |
36,183 |
|
|
Taxes and insurance |
|
|
52,813 |
|
|
32,812 |
|
|
Foreclosures and bankruptcy costs |
|
|
28,021 |
|
|
23,122 |
|
|
Real estate servicing costs |
|
|
— |
|
|
225 |
|
|
Other |
|
|
8,998 |
|
|
4,756 |
|
|
|
|
|
|
||||
|
|
|
|
141,430 |
|
|
97,098 |
|
|
Loans and Residuals |
|
|
4,321 |
|
|
4,867 |
|
|
Corporate Items and Other |
|
|
163 |
|
|
120 |
|
|
|
|
|
|
||||
|
|
|
$ |
145,914 |
|
$ |
102,085 |
|
|
|
|
|
|
||||
|
|
|
|
(1) |
Includes servicing advances of $72,670 pledged as collateral under the terms of the term reimbursement advance borrowing as of December 31, 2009. |
|
|
|
|
NOTE 8 |
MATCH FUNDED ADVANCES |
Match funded advances on residential loans we service for others, as more fully described in Note 1—Mortgage Servicing Fees and Advances, are comprised of the following at December 31:
|
|
|
|
|
|
|
|
|
|
|
|
2009 |
|
2008 |
|
||
|
|
|
|
|
||||
|
Principal and interest |
|
$ |
345,924 |
|
$ |
615,344 |
|
|
Taxes and insurance |
|
|
332,326 |
|
|
324,605 |
|
|
Foreclosures and bankruptcy costs |
|
|
72,385 |
|
|
70,142 |
|
|
Real estate servicing costs |
|
|
49,446 |
|
|
70,658 |
|
|
Other |
|
|
22,534 |
|
|
19,806 |
|
|
|
|
|
|
||||
|
|
|
$ |
822,615 |
|
$ |
1,100,555 |
|
|
|
|
|
|
||||
See also Note 1—Principles of Consolidation—Match Funded Advances on Loans Serviced for Others.
F-26
|
|
|
|
NOTE 9 |
MORTGAGE- SERVICING RIGHTS |
|
|
|
|
|
|
|
|
|
|
|
|
|
|
|
Residential |
|
Commercial |
|
Total |
|
|||
|
|
|
|
|
|
||||||
|
Balance at December 31, 2006 |
|
$ |
179,246 |
|
$ |
4,497 |
|
$ |
183,743 |
|
|
Purchases |
|
|
111,807 |
|
|
1,695 |
|
|
113,502 |
|
|
Amortization |
|
|
(99,118 |
) |
|
(832 |
) |
|
(99,950 |
) |
|
|
|
|
|
|
||||||
|
Balance at December 31, 2007 |
|
|
191,935 |
|
|
5,360 |
|
|
197,295 |
|
|
Purchases |
|
|
3,757 |
|
|
— |
|
|
3,757 |
|
|
Sales |
|
|
— |
|
|
(5,036 |
) |
|
(5,036 |
) |
|
Servicing transfers and adjustments |
|
|
(3,620 |
) |
|
(50 |
) |
|
(3,670 |
) |
|
Reclassification of servicing liability (1) |
|
|
3,239 |
|
|
— |
|
|
3,239 |
|
|
Increase in impairment valuation allowance |
|
|
(3,624 |
) |
|
— |
|
|
(3,624 |
) |
|
Amortization |
|
|
(52,187 |
) |
|
(274 |
) |
|
(52,461 |
) |
|
|
|
|
|
|
||||||
|
Balance at December 31, 2008 |
|
|
139,500 |
|
|
— |
|
|
139,500 |
|
|
Purchases |
|
|
10,241 |
|
|
— |
|
|
10,241 |
|
|
Servicing transfers and adjustments |
|
|
(20 |
) |
|
— |
|
|
(20 |
) |
|
Decrease in impairment valuation allowance |
|
|
670 |
|
|
— |
|
|
670 |
|
|
Amortization |
|
|
(32,589 |
) |
|
— |
|
|
(32,589 |
) |
|
|
|
|
|
|
||||||
|
Balance at December 31, 2009 |
|
$ |
117,802 |
|
$ |
— |
|
$ |
117,802 |
|
|
|
|
|
|
|
||||||
|
|
|
|
(1) |
At December 31, 2007, the servicing liability of $1,459 was not material. |
The estimated amortization expense for mortgage servicing rights, calculated based on assumptions used at December 31, 2009, is projected as follows over the next five years:
|
|
|
|
|
|
|
2010 |
|
$ |
24,621 |
|
|
2011 |
|
|
19,555 |
|
|
2012 |
|
|
15,439 |
|
|
2013 |
|
|
12,814 |
|
|
2014 |
|
|
10,989 |
|
The following table presents the composition of our servicing and subservicing portfolios by type of property serviced as measured by UPB. The servicing portfolio represents purchased mortgage servicing rights while subservicing generally represents all other mortgage servicing rights.
|
|
|
|
|
|
|
|
|
|
|
|
|
|
|
Residential |
|
Commercial |
|
Total |
|
|||
|
|
|
|
|
|
||||||
|
UPB of Assets Serviced: |
|
|
|
|
|
|
|
|
|
|
|
Balance at December 31, 2007 |
|
|
|
|
|
|
|
|
|
|
|
Servicing |
|
$ |
38,005,999 |
|
$ |
2,385,343 |
|
$ |
40,391,342 |
|
|
Subservicing (1) |
|
|
15,539,986 |
|
|
2,764,634 |
|
|
18,304,620 |
|
|
|
|
|
|
|
||||||
|
|
|
$ |
53,545,985 |
|
$ |
5,149,977 |
|
$ |
58,695,962 |
|
|
|
|
|
|
|
||||||
|
Balance at December 31, 2008 |
|
|
|
|
|
|
|
|
|
|
|
Servicing |
|
$ |
29,830,654 |
|
$ |
— |
|
$ |
29,830,654 |
|
|
Subservicing |
|
|
10,340,878 |
|
|
1,319,175 |
|
|
11,660,053 |
|
|
|
|
|
|
|
||||||
|
|
|
$ |
40,171,532 |
|
$ |
1,319,175 |
|
$ |
41,490,707 |
|
|
|
|
|
|
|
||||||
|
Balance at December 31, 2009 |
|
|
|
|
|
|
|
|
|
|
|
Servicing |
|
$ |
27,408,436 |
|
$ |
— |
|
$ |
27,408,436 |
|
|
Subservicing (2) |
|
|
22,571,641 |
|
|
211,603 |
|
|
22,783,244 |
|
|
|
|
|
|
|
||||||
|
|
|
$ |
49,980,077 |
|
$ |
211,603 |
|
$ |
50,191,680 |
|
|
|
|
|
|
|
||||||
|
|
|
|
(1) |
Includes $798,148 of foreclosed residential properties serviced for the United States Department of Veterans Affairs (VA). We elected to allow our contract with the VA to expire in July 2008. We completed the transition of the remaining properties to the new service provider in October 2008. |
|
(2) |
Includes non-performing loans serviced for Freddie Mac. |
F-27
At December 31, 2009, the geographic distribution of the UPB and count of residential loans and real estate we serviced was as follows:
|
|
|
|
|
|
|
|
|
|
|
|
Amount |
|
Count |
|
||
|
|
|
|
|
||||
|
California |
|
$ |
10,358,332 |
|
|
38,008 |
|
|
Florida |
|
|
5,540,895 |
|
|
37,200 |
|
|
New York |
|
|
4,242,108 |
|
|
19,518 |
|
|
Texas |
|
|
2,406,556 |
|
|
30,394 |
|
|
Illinois |
|
|
2,265,067 |
|
|
16,084 |
|
|
Other (1) |
|
|
25,167,119 |
|
|
210,391 |
|
|
|
|
|
|
||||
|
|
|
$ |
49,980,077 |
|
|
351,595 |
|
|
|
|
|
|
||||
|
|
|
|
(1) |
Consisted of loans and properties in 45 other states, the District of Columbia and two U.S. territories. No other single location had aggregate loans and properties over $1,746,336. |
Valuation Allowance for Impairment. During 2008, we established a valuation allowance for impairment of $3,624 on the high-loan-to-value stratum of our mortgage servicing rights as the estimated fair value was less than the carrying value. The decline in fair value was primarily attributable to an increase in the industry averages for delinquencies on loans in the second lien position. Our servicing portfolio experienced lower than the industry average for such delinquencies. During the third and fourth quarters of 2009, the valuation increased, and we reduced the valuation allowance by $670. Changes in the valuation allowance for impairment are reflected in servicing and origination expenses in the statement of operations. Net of the valuation allowance of $2,954, the carrying value of this stratum was $613 at December 31, 2009. For all other strata, the fair value was above the carrying value at December 31, 2009.
|
|
|
|
|
|
|
|
|
|
|
|
|
|
|
Residential |
|
Commercial |
|
Total |
|
|||
|
|
|
|
|
|
||||||
|
Estimated Fair Value of MSRs: |
|
|
|
|
|
|
|
|
|
|
|
Balance at December 31, 2007 |
|
$ |
271,108 |
|
$ |
5,781 |
|
$ |
276,889 |
|
|
|
|
|
|
|
||||||
|
Balance at December 31, 2008 |
|
$ |
148,135 |
|
$ |
— |
|
$ |
148,135 |
|
|
|
|
|
|
|
||||||
|
Balance at December 31, 2009 |
|
$ |
127,268 |
|
$ |
— |
|
$ |
127,268 |
|
|
|
|
|
|
|
||||||
Servicing Liability. We recognize a servicing liability for those agreements that are not expected to adequately compensate us for performing the servicing. Servicing liabilities were $2,878 and $3,239 at December 31, 2009 and 2008, respectively, and are included in other liabilities. During 2009, amortization of servicing liabilities exceeded the amount of charges we recognized to increase servicing liability obligations by $361 and we have reported this net amount as a reduction of amortization of servicing rights in the statement of operations.
|
|
|
|
NOTE 10 |
RECEIVABLES |
Receivables consisted of the following at December 31:
|
|
|
|
|
|
|
|
|
|
|
|
2009 |
|
2008 |
|
||
|
|
|
|
|
||||
|
Accounts receivable by segment: |
|
|
|
|
|
|
|
|
Servicing (1) |
|
$ |
41,940 |
|
$ |
6,495 |
|
|
Loans and Residuals |
|
|
845 |
|
|
1,169 |
|
|
Asset Management Vehicles |
|
|
334 |
|
|
1,171 |
|
|
Mortgage Services |
|
|
— |
|
|
2,668 |
|
|
Financial Services |
|
|
— |
|
|
5,747 |
|
|
Technology Products |
|
|
— |
|
|
975 |
|
|
Corporate Items and Other (2) |
|
|
1,795 |
|
|
13,593 |
|
|
|
|
|
|
||||
|
|
|
|
44,914 |
|
|
31,818 |
|
|
Other receivables: |
|
|
|
|
|
|
|
|
Income taxes |
|
|
17,865 |
|
|
5,386 |
|
|
Receivable from Altisource |
|
|
3,310 |
|
|
— |
|
|
Other |
|
|
1,006 |
|
|
2,703 |
|
|
|
|
|
|
||||
|
|
|
$ |
67,095 |
|
$ |
39,907 |
|
|
|
|
|
|
||||
|
|
|
|
(1) |
The balances at December 31, 2009 and 2008 primarily include reimbursable expenditures due from investors. The total balance of receivables for this segment is net of reserves of $547 and $1,604 at December 31, 2009 and 2008, respectively. The balance at December 31, 2009 includes $37,226 due from Freddie Mac in connection with loans we service under a subservicing agreement. |
F-28
|
|
|
|
(2) |
The balances at December 31, 2009 and 2008 include receivables totaling $1,680 and $3,324, respectively, that primarily represent payments to be received in future years (through June 2014) of proceeds from the sales of investments in affordable housing properties. These affordable housing receivables are net of reserves for doubtful accounts of $6,609 and $6,400, respectively. The balance at December 31, 2008 also includes $8,286 of mortgage loans originated by BOK, net of allowances of $1,392. |
|
|
|
|
NOTE 11 |
GOODWILL AND INTANGIBLES |
Goodwill and intangible assets were distributed as part of the Separation (see Note 2). Goodwill and intangible assets remaining at the time of the Separation related to the acquisitions of NCI and the company that developed the predecessor to the REALTransSM vendor management platform. At December 31, 2008, goodwill and intangibles included: goodwill of $8,218 and intangibles of $36,391, net of amortization, both of which are related to the acquisition of NCI and included in the Financial Services segment and $1,618 of goodwill related to REALTrans and reported in the Technology Products segment.
Goodwill and intangibles is comprised as follows as of December 31, 2008:
|
|
|
|
|
|
|
|
|
|
|
|
|
|
|
|
|
Weighted |
|
Cost |
|
Aggregate |
|
Net Book Value |
|
|||
|
|
|
|
|
|
|
|||||||
|
Goodwill |
|
— |
|
$ |
13,530 |
|
$ |
3,694 |
|
$ |
9,836 |
|
|
|
|
|
|
|
|
|
||||||
|
Intangibles: |
|
|
|
|
|
|
|
|
|
|
|
|
|
Non-amortizing |
|
|
|
|
|
|
|
|
|
|
|
|
|
Licenses |
|
— |
|
|
1,741 |
|
|
1,741 |
|
|
— |
|
|
|
|
|
|
|
|
|
||||||
|
Amortizing |
|
|
|
|
|
|
|
|
|
|
|
|
|
Trademarks |
|
5 |
|
|
2,800 |
|
|
887 |
|
|
1,913 |
|
|
Customer lists |
|
19 |
|
|
37,700 |
|
|
3,222 |
|
|
34,478 |
|
|
|
|
|
|
|
|
|
||||||
|
Total amortizing |
|
|
|
|
40,500 |
|
|
4,109 |
|
|
36,391 |
|
|
|
|
|
|
|
|
|
||||||
|
Total intangibles |
|
|
|
|
42,241 |
|
|
5,850 |
|
|
36,391 |
|
|
|
|
|
|
|
|
|
||||||
|
Total goodwill and intangibles |
|
|
|
$ |
55,771 |
|
$ |
9,544 |
|
$ |
46,227 |
|
|
|
|
|
|
|
|
|
||||||
Prior to our acquisition of NCI in 2007, NCI made a taxable acquisition which created tax-deductible goodwill that amortizes over time. When we acquired NCI in 2007, we recorded a lesser amount of goodwill for financial reporting purposes than what had previously been recorded at NCI for tax purposes. This difference between the amount of goodwill recorded for financial reporting purposes and the amount recorded for taxes is amortized in our consolidated financial statements. In 2008, the amortization resulted in a $4,891 reduction of goodwill and a corresponding increase in current and deferred taxes.
Amortization of intangibles for 2009, 2008 and 2007 was $1,624, $2,554 and $1,555, respectively.
|
|
|
|
NOTE 12 |
PREMISES AND EQUIPMENT |
Our premises and equipment are summarized as follows at December 31:
|
|
|
|
|
|
|
|
|
|
|
|
2009 |
|
2008 |
|
||
|
|
|
|
|
||||
|
Computer hardware and software |
|
$ |
13,072 |
|
$ |
91,522 |
|
|
Leasehold improvements |
|
|
5,838 |
|
|
7,795 |
|
|
Land and land improvements |
|
|
— |
|
|
522 |
|
|
Furniture and fixtures |
|
|
6,286 |
|
|
7,691 |
|
|
Office equipment and other |
|
|
2,228 |
|
|
7,349 |
|
|
|
|
|
|
||||
|
|
|
|
27,424 |
|
|
114,879 |
|
|
Less accumulated depreciation and amortization |
|
|
(24,099 |
) |
|
(101,953 |
) |
|
|
|
|
|
||||
|
|
|
$ |
3,325 |
|
$ |
12,926 |
|
|
|
|
|
|
||||
As disclosed in Note 2, premises and equipment with a net carrying value of $8,615 were transferred to Altisource in connection with the Separation.
Depreciation and other amortization expense amounted to $4,742, $9,717 and $9,244 for 2009, 2008 and 2007, respectively, of which $899, $1,926, and $2,012 related to computer software.
F-29
In December 2007, we executed a sale-leaseback agreement whereby we sold and immediately leased back our customer service and collection facility in Orlando, Florida. This transaction did not initially qualify for sale-leaseback accounting because of our continuing involvement in the form of a significant sublease and a collateral deposit securing a letter of credit that guarantees our lease payments. We accounted for the transaction as a financing and recorded the sales proceeds of $24,515 as a financing obligation in other liabilities. We continued to depreciate the building, improvements and equipment. The net book value of the building, land, improvements and equipment was $19,052 at December 31, 2007. In December 2008, we assigned the lease to a third party resulting in the termination of the sublease and guarantee and the return of our collateral deposit. Because we have no significant continuing involvement, we recognized the sale in December 2008, derecognized the assets and the related financing liability and recorded a gain of $450.
|
|
|
|
NOTE 13 |
INVESTMENT IN UNCONSOLIDATED ENTITIES |
Investment in unconsolidated entities consisted of the following at December 31:
|
|
|
|
|
|
|
|
|
|
|
|
2009 |
|
2008 |
|
||
|
|
|
|
|
||||
|
Asset Management Vehicles: |
|
|
|
|
|
|
|
|
Investment in OSI (1) |
|
$ |
7,885 |
|
$ |
15,410 |
|
|
Investment in ONL and affiliates (2) |
|
|
7,044 |
|
|
10,174 |
|
|
|
|
|
|
||||
|
|
|
|
14,929 |
|
|
25,584 |
|
|
Corporate Items and Other |
|
|
79 |
|
|
79 |
|
|
|
|
|
|
||||
|
|
|
$ |
15,008 |
|
$ |
25,663 |
|
|
|
|
|
|
||||
Equity in earnings (losses) of unconsolidated entities was as follows for the years ended December 31:
|
|
|
|
|
|
|
|
|
|
|
|
|
|
|
2009 |
|
2008 |
|
2007 |
|
|||
|
|
|
|
|
|
||||||
|
OSI (1) (3) |
|
$ |
(1,756 |
) |
$ |
(4,619 |
) |
$ |
1,095 |
|
|
ONL and affiliates (2) (3) |
|
|
(1,177 |
) |
|
(2,825 |
) |
|
(1,920 |
) |
|
BMS Holdings (4) |
|
|
— |
|
|
(5,666 |
) |
|
5,488 |
|
|
|
|
|
|
|
||||||
|
|
|
$ |
(2,933 |
) |
$ |
(13,110 |
) |
$ |
4,663 |
|
|
|
|
|
|
|
||||||
|
|
|
|
(1) |
Our investment in OSI represents a 25% equity interest. OSI invests in the lower tranches and residuals of residential mortgage-backed securities, the related mortgage servicing rights and other similar assets. During 2009, we received distributions from OSI totaling $4,875. We have no remaining commitment to invest in OSI. |
|
(2) |
Our investment in ONL and affiliates represent equity interests of approximately 25%. ONL resolves non-performing loans purchased at a discount. An affiliate purchases real estate for sale, including real estate that ONL may obtain through foreclosure. During 2009, we received distributions totaling $1,783 from ONL and affiliates and invested an additional $62 in these entities. We have a remaining commitment which expires on September 13, 2010, to invest up to an additional $33,840 in ONL and affiliates, collectively. |
|
(3) |
We earn loan servicing and management fees from OSI and from ONL and affiliates. In determining the amount of consolidated equity in earnings to recognize, we add back our share of the loan servicing and management fee expense recognized by OSI, ONL and affiliates. During 2009 and 2008, OLS earned fees of $4,481 and $6,918, respectively, from OSI and from ONL and affiliates. On a consolidated basis, we have recognized approximately 75% of the loan servicing and management fee revenue. |
|
(4) |
Our investment in BMS Holdings represents an equity interest of approximately 45%. During the second quarter of 2008, our share of the losses of BMS Holdings reduced our investment to zero. Because we are not required to advance funds to BMS Holdings to finance operations and we are not a guarantor of any obligations of BMS Holdings, we suspended the recognition of losses from our investment in BMS Holdings. We will not resume recording income or losses until our share of BMS Holdings’ earnings exceeds our share of their losses that we did not recognize during the period when we suspended recording losses. |
F-30
Summarized combined financial information of our unconsolidated entities at and for the years ended December 31 is as follows:
|
|
|
|
|
|
|
|
|
|
|
|
|
|
|
2009 |
|
2008 |
|
2007 |
|
|||
|
|
|
|
|
|
||||||
|
Operations |
|
|
|
|
|
|
|
|
|
|
|
Revenues, net, and investment income, net |
|
$ |
(9,641 |
) |
$ |
66,715 |
|
$ |
65,587 |
|
|
Gains (losses) on investments and derivatives, net |
|
|
(10,611 |
) |
|
(45,357 |
) |
|
(11,030 |
) |
|
Net income (loss) |
|
|
(42,206 |
) |
|
(70,998 |
) |
|
8,285 |
|
|
Financial Condition |
|
|
|
|
|
|
|
|
|
|
|
Total assets |
|
$ |
1,001,751 |
|
$ |
1,131,819 |
|
$ |
1,317,762 |
|
|
Total liabilities |
|
|
987,784 |
|
|
1,048,279 |
|
|
1,021,913 |
|
|
Total equity |
|
|
13,967 |
|
|
83,540 |
|
|
295,849 |
|
|
|
|
|
NOTE 14 |
OTHER ASSETS |
Other assets consisted of the following at December 31:
|
|
|
|
|
|
|
|
|
|
|
|
2009 |
|
2008 |
|
||
|
|
|
|
|
||||
|
Debt service accounts (1) |
|
$ |
50,221 |
|
$ |
58,468 |
|
|
Debt issuance costs, net (2) |
|
|
8,223 |
|
|
14,758 |
|
|
Real estate |
|
|
8,133 |
|
|
7,771 |
|
|
Interest earning collateral deposits |
|
|
8,671 |
|
|
9,684 |
|
|
Term note (3) |
|
|
7,000 |
|
|
— |
|
|
Security deposits |
|
|
3,138 |
|
|
2,891 |
|
|
Prepaid expenses and other |
|
|
4,250 |
|
|
6,907 |
|
|
|
|
|
|
||||
|
|
|
$ |
89,636 |
|
$ |
100,479 |
|
|
|
|
|
|
||||
|
|
|
|
(1) |
Under our four advance funding facilities, we are contractually required to remit collections on pledged advances to the trustee within two days of receipt. The collected funds are not applied to reduce the related match funded debt until the payment dates specified in the indenture. The balance also includes amounts that have been set aside from the proceeds of our four match funded advance facilities to provide for possible shortfalls in the funds available to pay certain expenses and interest. These funds are held in interest earning accounts. |
|
(2) |
Issuance costs are amortized to the earliest contractual maturity date of the debt. |
|
(3) |
In March 2009, we issued a note receivable, maturing on April 1, 2014, in connection with advances funded by the Ocwen Servicer Advance Funding, LLC (OSAF) term note pledged as collateral, as described in Note 16. We receive 1-Month LIBOR plus 300 basis points (bps) under the terms of this note receivable. We are obligated to pay 1-Month LIBOR plus 350 bps under the terms of a five-year note payable to the same counterparty. We do not have a contractual right to offset these payments. |
F-31
|
|
|
|
NOTE 15 |
MATCH FUNDED LIABILITIES |
Match funded liabilities, as more full described in Note 1—Mortgage Servicing Fees and Advances, are comprised of the following at December 31:
|
|
|
|
|
|
|
|
|
|
|
|
|
|
|
|
|
|
|
|
|
|
|
|
|
Amortization |
|
Unused |
|
|
|
|
|
|
|
|
|
|
|
|
|
|
|
|
|
Balance Outstanding |
|
|||||||
|
|
|
|
|
|
|
|
|
|
||||||||
|
Borrowing Type |
|
Interest Rate |
|
Maturity |
|
|
|
2009 |
|
2008 |
|
|||||
|
|
|
|
|
|
|
|
||||||||||
|
Advance Receivable |
|
4.14% |
|
Jul. 2023 |
|
Jul. 2012 |
|
$ |
— |
|
$ |
210,000 |
|
$ |
— |
|
|
Variable Funding |
|
1-Month
LIBOR + |
|
Nov. 2023 |
|
Nov. 2012 |
|
|
— |
|
|
— |
|
|
— |
|
|
Variable Funding |
|
Commercial
paper |
|
Dec. 2020 |
|
Feb. 2010 |
|
|
300,000 |
|
|
— |
|
|
— |
|
|
Variable Funding |
|
Commercial
paper |
|
Dec. 2014 |
|
Dec. 2009 |
|
|
— |
|
|
— |
|
|
219,722 |
|
|
Term Note Series |
|
5.335% |
|
Nov. 2015 |
|
Nov. 2009 |
|
|
— |
|
|
— |
|
|
165,000 |
|
|
Variable Funding |
|
Commercial
paper |
|
Dec 2013 |
|
Dec 2010 |
|
|
91,588 |
|
|
158,412 |
|
|
192,520 |
|
|
Advance Receivable |
|
1-Month LIBOR + 400 bps |
|
Jan. 2019 |
|
Feb. 2010 |
|
|
72,579 |
|
|
27,421 |
|
|
142,361 |
|
|
Advance Receivable |
|
1-Month LIBOR + 275 bps |
|
May 2011 |
|
May 2010 |
|
|
430,142 |
|
|
69,858 |
|
|
237,504 |
|
|
|
|
|
|
|
|
|
|
|
|
|
||||||
|
|
|
|
|
|
|
|
|
|
894,309 |
|
|
465,691 |
|
|
957,107 |
|
|
Basis adjustment (6) |
|
|
|
|
|
|
|
|
— |
|
|
— |
|
|
4,832 |
|
|
|
|
|
|
|
|
|
|
|
|
|
||||||
|
|
|
|
|
|
|
|
|
$ |
894,309 |
|
$ |
465,691 |
|
$ |
961,939 |
|
|
|
|
|
|
|
|
|
|
|
|
|
||||||
|
Weighted average interest rate |
|
|
|
|
|
|
|
|
|
3.03 |
% |
|
4.74 |
% |
||
|
|
|
|
(1) |
Our unused borrowing capacity is available to us provided that we have additional eligible collateral to pledge. Collateral may only be pledged to one facility. |
|
(2) |
These notes were issued under the Term Asset-Backed Securities Loan Facility (TALF) program administered by the Federal Reserve Bank of New York. |
|
(3) |
Under the terms of the note purchase agreement, the purchaser has no obligation to fund borrowings under this note until January 2010 at which time the maximum funding obligation is $28,000. The maximum funding obligation increases to $88,000 in November 2010 and to $100,000 in November 2011. |
|
(4) |
The interest rate for this note is determined using a commercial paper rate that reflects the borrowing costs of the lender plus a margin of 200 bps |
|
(5) |
The interest rate for this note is determined using a commercial paper rate that reflects the borrowing costs of the lender plus a margin of 200 bps which has approximated LIBOR plus 200 bps over time. In December 2008, the amortization date for this note was extended to December 2009. We repaid this note in November 2009 and transferred the majority of the borrowing to the Advance Receivable Backed Note Series 2009-3. |
|
(6) |
On August 11, 2009, we repaid this note and transferred the majority of the borrowing to the Variable Funding Note Series 2007-1. We previously carried this note on the balance sheet at fair value as the result of a designated fair value hedging relationship that we established in December 2006 using an interest rate swap. We terminated the swap agreement in February 2008 and began amortizing the basis adjustment to earnings over the expected remaining term of the note. In connection with the repayment of this note, we recognized a gain on debt redemption of $1,600, representing the reversal of the fair value hedging basis adjustment less early termination fees and the write-off of unamortized debt issue costs. |
|
(7) |
The interest rate for this note is determined using a commercial paper rate that reflects the borrowing costs of the lender plus a margin of 150 bps which has approximated 1-Month LIBOR plus 150 bps over time. |
|
(8) |
In January 2009, the lender agreed to renew this facility and to extend the amortization date from February 2009 to January 2010. The interest rate was increased from 1-Month LIBOR plus 200 bps to 1-Month LIBOR plus 400 bps. Effective December 31, 2009, we negotiated a decrease in the maximum borrowing capacity under this facility from $200,000 to $100,000 and an extension of the amortization date to February 15, 2010. Subsequently, the amortization date was extended to March 19, 2010. |
F-32
|
|
|
|
|
(9) |
In May 2009, we negotiated an increase in the maximum borrowing capacity from $300,000 to $500,000 and extended the amortization date from April 2009 to May 2010. Under the terms of the new facility, we pay interest on drawn balances at 1-Month LIBOR plus 275 bps. The previous interest rate was 1-Month LIBOR plus 250 bps. In addition, we pay, in twelve monthly installments, a facility fee of 2.25% of the maximum borrowing capacity of $500,000. |
|
|
|
|
|
|
NOTE 16 |
LINES OF CREDIT AND OTHER SECURED BORROWINGS |
|
Secured lines of credit and other borrowings are as follows at December 31:
|
|
|
|
|
|
|
|
|
|
|
|
|
|
|
|
|
|
|
|
|
|
|
|
Balance Outstanding |
|
||||
|
|
|
|
|
|
|
|
|
|
|||||
|
Borrowing Type |
|
Collateral |
|
Interest Rate |
|
Maturity |
|
2009 |
|
2008 |
|
||
|
|
|
|
|
|
|
||||||||
|
Servicing |
|
|
|
|
|
|
|
|
|
|
|
|
|
|
Fee reimbursement advance (1) |
|
Term note |
|
Zero Coupon |
|
Mar. 2014 |
|
$ |
60,000 |
|
$ |
— |
|
|
Term note (2) |
|
Advances |
|
1-Month LIBOR + 350 bps |
|
Mar. 2014 |
|
|
7,000 |
|
|
— |
|
|
Senior secured |
|
MSRs |
|
1-Month LIBOR +187.5 bps |
|
Feb. 2010 |
|
|
— |
|
|
97,987 |
|
|
|
|
|
|
|
|
|
|
|
|
||||
|
|
|
|
|
|
|
|
|
|
67,000 |
|
|
97,987 |
|
|
|
|
|
|
|
|
|
|
|
|
||||
|
|
|
|
|
|
|
|
|
|
|
|
|
|
|
|
Loans and Residuals |
|
|
|
|
|
|
|
|
|
|
|
|
|
|
Class A-1 notes (4) |
|
Loans held
for resale |
|
1-Month LIBOR + 600 bps |
|
Apr. 2037 |
|
|
— |
|
|
17,760 |
|
|
|
|
|
|
|
|
|
|
|
|
||||
|
|
|
|
|
|
|
|
|
|
|
|
|
|
|
|
Financial Services |
|
|
|
|
|
|
|
|
|
|
|
|
|
|
Revolving note (5) |
|
Receivables |
|
1, 3, 6 or
12-Month LIBOR + |
|
See (5) below |
|
|
— |
|
|
1,123 |
|
|
|
|
|
|
|
|
|
|
|
|
||||
|
|
|
|
|
|
|
|
|
|
|
|
|
|
|
|
Discount (1) |
|
|
|
|
|
|
|
|
(11,190 |
) |
|
— |
|
|
|
|
|
|
|
|
|
|
|
|
||||
|
|
|
|
|
|
|
|
|
$ |
55,810 |
|
$ |
116,870 |
|
|
|
|
|
|
|
|
|
|
|
|
||||
|
Weighted average interest rate |
|
|
|
|
|
|
9.43 |
% |
|
5.07 |
% |
||
|
|
|
|
|
(1) |
This advance is secured by the pledge to the lender of our interest in a $60,000 term note issued by OSAF on March 31, 2009. The OSAF note, in turn, is secured by advances on loans serviced for others, similar to match funded advances and liabilities. The fee reimbursement advance is payable annually in five installments of $12,000. The advance does not carry a stated rate of interest. However, we are compensating the lender for the advance of funds by forgoing the receipt of fees due from the lender over the five-year term of the advance. Accordingly, we recorded the advance as a zero-coupon bond issued at an initial implied discount of $14,627. We used an implicit market rate of 10.1% to compute the discount that we are amortizing to interest expense over the five-year term of the advance. |
|
|
(2) |
This note was issued by OSAF and is secured by advances on loans serviced for others, similar to match funded advances and liabilities. The lender has pledged its interest in this note to us as collateral against the $7,000 term note receivable due on April 1, 2014. |
|
|
(3) |
The interest incurred on this facility is based on LIBOR plus 187.5 bps but could be reduced to as low as 0.10% to the extent that we have available balances on deposit with the lender. We repaid this note in full on August 21, 2009. |
|
|
(4) |
In 2007, we issued A-rated securities in connection with the transfer of loan and real estate collateral to OREALT, a bankruptcy remote VIE that we consolidate. In August 2008, we sold a portion of these A-rated securities with a face value of $23,200 to a third party. The notes were sold net of an original discount of $928 that was amortized to interest expense over the estimated life of the notes. On September 23, 2009, we repaid the remaining principal balance of the notes held by a third party and retired the notes. |
|
|
(5) |
We terminated this agreement in June 2009. There were no borrowings outstanding at the time that we terminated the agreement. |
|
|
|
|
|
|
NOTE 17 |
INVESTMENT LINE |
|
|
|
|
|
Under this agreement, we borrowed funds each month under a revolving demand note equal to the projected average float balance and invested those funds in certain permitted investments, including auction rate securities. The custodial funds comprising most of the float balance remained on deposit in bank accounts that meet the requirements of each trust. The terms of the investment line required that we sell the investments and repay the associated borrowings prior to the end of each quarter.
F-33
As a result of failed auctions in the first quarter of 2008, we were unable to liquidate our investment in auction rate securities. We recognized these securities and a corresponding liability on our balance sheet in the first quarter of 2008.
On July 10, 2008, we amended the investment line to create a term note maturing on June 30, 2009 that was secured by our investment in the auction rate securities. Interest on the term note was 0.35% to the extent that we had available balances on deposit with the lender. For any portion of the outstanding balance of the term note that was in excess of the available balances, the interest rate was 1-month LIBOR plus 35 bps. In the event that the 0.35% rate did not fairly reflect the cost to the lender in providing the funds, the lender could, with notice, adjust the rate upward to a rate not exceeding 3.35%.
Under the term note, we receive the interest on the auction rate securities while the proceeds from the redemption or sale of auction rate securities are applied to the outstanding balance. If the proceeds are below the then-effective maximum borrowing percentage, we are required to make up the shortfall. On April 30, 2009, we negotiated a one-year extension of the term note maturity to June 30, 2010. This agreement was renewed under terms substantially similar to the previous agreement. However, in lieu of quarterly advance rate reductions, we now make monthly amortization payments of $3,000. During 2009, we made payments totaling $43,751 that reduced the investment line obligation to $156,968.
See Note 34 for a subsequent event relating to the investment line.
|
|
|
|
NOTE 18 |
SERVICER LIABILITIES |
Servicer liabilities represent amounts we have collected, primarily from residential borrowers, whose loans we service, that will be deposited in custodial accounts and paid directly to an investment trust or refunded to borrowers. The following table sets forth the components of servicer liabilities at December 31:
|
|
|
|
|
|
|
|
|
|
|
|
2009 |
|
2008 |
|
||
|
|
|
|
|
||||
|
Borrower payments due to custodial accounts |
|
$ |
3,185 |
|
$ |
67,227 |
|
|
Escrow payments due to custodial accounts |
|
|
6,225 |
|
|
5,488 |
|
|
Partial payments and other unapplied balances |
|
|
29,262 |
|
|
63,036 |
|
|
|
|
|
|
||||
|
|
|
$ |
38,672 |
|
$ |
135,751 |
|
|
|
|
|
|
||||
|
|
|
|
NOTE 19 |
DEBT SECURITIES |
Our debt securities consisted of the following at December 31:
|
|
|
|
|
|
|
|
|
|
|
|
2009 |
|
2008 |
|
||
|
|
|
|
|
||||
|
3.25% Convertible Notes due August 1, 2024 |
|
$ |
56,435 |
|
$ |
79,988 |
|
|
10.875% Capital Trust Securities due August 1, 2027 |
|
|
39,129 |
|
|
53,379 |
|
|
|
|
|
|
||||
|
|
|
$ |
95,564 |
|
$ |
133,367 |
|
|
|
|
|
|
||||
Convertible Notes. In July 2004, OCN issued $175,000 aggregate principal amount of 3.25% Convertible Notes due 2024. The Convertible Notes are senior general unsecured obligations not guaranteed by any of our subsidiaries and bear interest at the rate of 3.25% per year. We amortized the debt discount over the period from the date of issuance to August 1, 2009, the first date at which holders could require us to repurchase their notes.
The principal outstanding on December 31, 2008 of $82,355 is reported net of the unamortized debt discount of $2,367. Interest expense on the Convertible Notes for the years ended December 31, 2009, 2008 and 2007 respectively, includes amortization of debt discount of $1,735, $3,886 and $4,069 and cash interest expense of $1,948, $2,825 and $3,149 at the contractual rate. We recognized interest on the debt at an effective annual rate of 8.25% from the date of issuance to August 1, 2009. Since August 1, 2009, the effective interest rate on the debt is the coupon rate of 3.25%.
In February 2009, we repurchased $25,910 of our 3.25% Convertible Notes in the open market at a price equal to 95% of the principal amount. We recognized a gain of $534 on these repurchases, net of the write-off of unamortized issuance costs and debt discount. During 2008, we repurchased $14,545 of the Convertible Notes in the open market resulting in total losses of $86, including the write-off of unamortized issuance costs and debt discount.
Holders may convert all or a portion of their notes into shares of our common stock under the following circumstances: (1) at any time during any calendar quarter (and only during such calendar quarter) commencing after December 31, 2004, if the closing sale price of our common stock for at least 20 consecutive trading days in a period of 30 consecutive trading days ending on the last trading day of the preceding calendar quarter is greater than 125% of the conversion price per share of common stock on such last day; (2) subject to certain exceptions, during the five business day period after any five-consecutive-trading-day period in which the trading price per $1 principal amount of the notes for each day of the five-consecutive-trading-day period was less than 98% of the product of the closing sale price of our common stock and the number of shares issuable upon conversion of $1 principal amount of the notes; (3) if the notes have been called for redemption; or (4) upon the occurrence of specified corporate transactions.
F-34
The conversion rate is 82.1693 shares of our common stock per $1,000 (actual dollars) principal amount of the notes, subject to adjustment. Events that may cause the conversion rate to be adjusted primarily relate to cash dividends or other distributions to holders of our common stock. Upon conversion, we may, at our option, choose to deliver, in lieu of our common stock, cash or a combination of cash and common stock. At December 31, 2009 and 2008, the if-converted value of the Convertible Notes was $44,378 and $62,106, respectively.
On June 26, 2009, we provided notice to holders of the Convertible Notes of their right to request that we repurchase all or a portion of their notes for cash on August 3, 2009 at a redemption price equal to 100% of the principal amount of the notes to be redeemed plus accrued and unpaid interest, if any. There were no material redemptions on August 3, 2009. Holders that did not choose to exercise their repurchase right on August 3, 2009 will receive the same right to request that we repurchase all or a portion of their notes for cash on August 1, 2014 and August 1, 2019. A similar right is also available to holders of the Convertible Notes in the event of a “fundamental change.” A “fundamental change” is a change of control or a termination of trading in our common stock.
Beginning August 1, 2009, we may redeem all or a portion of the notes for cash for a price equal to 100% of the principal amount of the notes to be redeemed plus accrued and unpaid interest, if any.
Each convertible noteholder participated in the distribution of Altisource shares, without converting, receiving Altisource shares equal to the conversion ratio of the convertible notes times the distribution ratio (one (1) Altisource share for three (3) Ocwen shares). Accordingly, upon the separation of Altisource and Ocwen, there was no adjustment to the conversion ratio of the Convertible Notes.
Capital Trust Securities. In August 1997, Ocwen Capital Trust (OCT) issued $125,000 of 10.875% Capital Securities (the Capital Trust Securities). OCT invested the proceeds from issuance of the Capital Trust Securities in 10.875% Junior Subordinated Debentures issued by OCN. The Junior Subordinated Debentures, which represent the sole assets of OCT, will mature on August 1, 2027. For financial reporting purposes, we treat OCT as a subsidiary and, accordingly, the accounts of OCT are included in our consolidated financial statements. We consolidate OCT because we own all of the Common Securities that were issued by OCT and have repurchased 69% of the Capital Trust Securities that were originally issued. We eliminate intercompany balances and transactions with OCT, including the balance of Junior Subordinated Debentures outstanding, in our consolidated financial statements.
During the fourth quarter of 2009, we repurchased $14,250 of the Capital Securities and recognized a gain of $882 on these repurchases, net of the write-off of unamortized issuance costs.
Holders of the Capital Trust Securities are entitled to receive cumulative cash distributions accruing from the date of original issuance and payable semiannually in arrears on February 1 and August 1 of each year at an annual rate of 10.875% of the liquidation amount of $1,000 (actual dollars) per Capital Security. OCN guarantees payment of distributions out of moneys held by OCT and payments on liquidation of OCT or the redemption of Capital Trust Securities to the extent OCT has funds available. If OCN does not make principal or interest payments on the Junior Subordinated Debentures, OCT will not have sufficient funds to make distributions on the Capital Trust Securities in which event the guarantee shall not apply to such distributions until OCT has sufficient funds available. Accumulated distributions payable on the Capital Trust Securities amounted to $1,773 and $2,419 at December 31, 2009 and 2008, respectively, and are included in other liabilities.
We have the right to defer payment of interest on the Junior Subordinated Debentures at any time or from time to time for a period not exceeding 10 consecutive semiannual periods with respect to each deferral period provided that no extension period may extend beyond the stated maturity of the Junior Subordinated Debentures. Upon the termination of any such extension period and the payment of all amounts then due on any interest payment date, we may elect to begin a new extension period. Accordingly, there could be multiple extension periods of varying lengths throughout the term of the Junior Subordinated Debentures. If we defer interest payments on the Junior Subordinated Debentures, distributions on the Capital Trust Securities will also be deferred, and we may not, nor may any of our subsidiaries, (i) declare or pay any dividends or distributions on, or redeem, purchase, acquire, or make a liquidation payment with respect to, their capital stock or (ii) make any payment of principal, interest or premium, if any, on or repay, repurchase or redeem any debt securities that rank pari passu with or junior to the Junior Subordinated Debentures. During an extension period, interest on the Junior Subordinated Debentures will continue to accrue at the rate of 10.875% per annum, compounded semiannually.
F-35
We may redeem the Junior Subordinated Debentures before maturity at our option subject to the receipt of any necessary prior regulatory approval, in whole or in part at the redemption prices (expressed as a percentage of the principal amount) set forth below, plus accrued interest thereon, if redeemed during the twelve-month period beginning on August 1 of the years indicated below:
|
|
|
|
|
|
|
|
Percentages |
|
|
|
|
||
|
2009 |
|
104.350 |
% |
|
2010 |
|
103.806 |
|
|
2011 |
|
103.263 |
|
|
2012 |
|
102.719 |
|
|
2013 |
|
102.175 |
|
|
2014 |
|
101.631 |
|
|
2015 |
|
101.088 |
|
|
2016 |
|
100.544 |
|
|
2017 to maturity |
|
100.000 |
|
We may also redeem the Junior Subordinated Debentures at any time upon the occurrence and continuation of a special event (defined as a tax event, regulatory capital event or an investment company event) at 100%. The Capital Trust Securities are subject to mandatory redemption upon repayment of the Junior Subordinated Debentures in an amount equal to the amount of the related Junior Subordinated Debentures maturing or being redeemed and at a redemption price equal to the redemption price of the Junior Subordinated Debentures, plus accumulated and unpaid distributions thereon to the date of redemption.
|
|
|
|
NOTE 20 |
OTHER LIABILITIES |
The following table sets forth the components of other liabilities at December 31:
|
|
|
|
|
|
|
|
|
|
|
|
2009 |
|
2008 |
|
||
|
|
|
|
|||||
|
Accrued expenses |
|
$ |
21,381 |
|
$ |
33,362 |
|
|
Deferred income |
|
|
13,599 |
|
|
2,551 |
|
|
Checks held for escheat |
|
|
12,827 |
|
|
13,162 |
|
|
Payable to Altisource |
|
|
10,655 |
|
|
— |
|
|
Liability for selected tax items |
|
|
15,326 |
|
|
2,042 |
|
|
Accrued interest payable |
|
|
3,588 |
|
|
4,649 |
|
|
Servicing liability |
|
|
2,878 |
|
|
3,239 |
|
|
Customer deposits (BOK) |
|
|
— |
|
|
5,820 |
|
|
Other |
|
|
10,528 |
|
|
13,988 |
|
|
|
|
|
|
||||
|
|
|
$ |
90,782 |
|
$ |
78,813 |
|
|
|
|
|
|
||||
|
|
|
|
NOTE 21 |
EQUITY |
On May 9, 2000, we announced that our Board of Directors authorized the repurchase of up to 6,000,000 of our issued and outstanding shares of common stock. To date, we have repurchased 431,100 shares under this plan (all in 2004). We may still purchase a total of 5,568,900 shares under this plan. On May 1, 2007, we purchased an additional 1,000,000 shares from two companies controlled by a member of OCN’s Board of Directors at a price of $14.52 per share. We did not purchase any of our common shares during 2008.
In a private placement transaction that closed on April 3, 2009, OCN sold 5,471,500 shares of its common stock for a price of $11.00 per share. We realized $60,165 in proceeds from this issuance. In addition to making customary representations, warranties and covenants, the purchasers agreed to certain restrictions on the sale of the shares for a one-year period following the closing date.
On April 3, 2009, OCN repurchased from William C. Erbey, its Chairman of the Board and Chief Executive Officer, 1,000,000 shares of its common stock at a per-share price of $11.00. We used a portion of the proceeds received from the above-described private placement transaction to acquire the shares from Mr. Erbey. In addition to making customary representations and warranties, Mr. Erbey agreed to certain restrictions on the sale or transfer of the remainder of his shares for a one-year period following the closing date.
On August 18, 2009, OCN completed the public offering of 32,200,000 shares of common stock at a per share price of $9.00, including 4,200,000 shares of common stock purchased by the underwriters pursuant to the full exercise of the over-allotment option granted under the underwriting agreement. We received net proceeds of $274,964 from the offering after deducting underwriting fees and other offering costs.
F-36
|
|
|
|
NOTE 22 |
DERIVATIVE FINANCIAL INSTRUMENTS |
Because our current derivative agreements are not exchange-traded, we are exposed to credit loss in the event of nonperformance by the counterparty to the agreements. We control this risk through credit monitoring procedures, including financial analysis, dollar limits and other monitoring procedures. The notional amount of our contracts does not represent our exposure to credit loss.
Foreign Currency Exchange Rate Risk Management
In June 2008, we entered into foreign currency futures contracts to hedge our net investment in BOK against adverse changes in the value of the Euro versus the U.S. Dollar. We designated these derivatives as a foreign-currency net investment hedge. Net gain (losses) on these foreign currency futures were $740 and $1,038 for 2009 and 2008, respectively. We initially recorded these gains and losses as part of the net change in unrealized foreign currency translation adjustment in accumulated other comprehensive income. In November 2009, in connection with the sale of BOK, we closed this hedge and recognized accumulated gains of $298 on the hedge as part of the gain on the sale.
Our operations in India and Canada also expose us to foreign currency exchange rate risk, but we consider this risk to be insignificant.
Interest Rate Management
In our Servicing segment, we have entered into interest rate caps to hedge our exposure to rising interest rates. In connection with our issuance of a match funded variable funding note in December 2007 with a variable rate of interest and a $250,000 maximum borrowing capacity, we entered into interest rate caps with a notional amount of $250,000. We designated this cap as a cash flow hedge but de-designated it as of March 31, 2008 because of ineffectiveness. As a result, we reclassified to earnings the unrealized loss of $239 included in other comprehensive income at December 31, 2007. In connection with our renewal and upsizing of a match funded variable funding note in February 2008 that carried a variable interest rate and a maximum borrowing capacity of $200,000, we entered into an interest rate cap with a notional amount of $200,000. This cap began amortizing at the rate of $8,333 per month in February 2009. We did not designate this cap as a hedge.
The following table summarizes our use of derivative financial instruments during 2009:
|
|
|
|
|
|
|
|
|
|
|
|
Notional Amounts |
|
||||
|
|
|
|
|||||
|
|
|
Interest Rate Caps |
|
Euro Currency |
|
||
|
|
|
|
|
||||
|
Notional balance at December 31, 2008 |
|
$ |
450,000 |
|
$ |
10,125 |
|
|
Additions |
|
|
— |
|
|
31,289 |
|
|
Maturities |
|
|
(91,667 |
) |
|
(41,414 |
) |
|
|
|
|
|
||||
|
Notional balance at December 31, 2009 |
|
$ |
358,333 |
|
$ |
— |
|
|
|
|
|
|
||||
|
|
|
|
|
|
|
|
|
|
Fair value (1): |
|
|
|
|
|
|
|
|
December 31, 2009 |
|
$ |
781 |
|
$ |
— |
|
|
|
|
|
|
||||
|
December 31, 2008 |
|
$ |
193 |
|
$ |
(726 |
) |
|
|
|
|
|
||||
|
|
|
|
|
|
|
|
|
|
Maturity |
|
January 2011 and December 2013 |
|
|
— |
|
|
Net realized and unrealized gains (losses) included in other income (expense), net related to derivative financial instruments were $587, $2,151 and $4,670 for 2009, 2008 and 2007, respectively, including in 2008 the $239 loss related to the interest rate cap that we de-designated as a cash flow hedge. In addition, we recorded unrealized (losses) gains of $(3,149) and $(4,944) in 2008 and 2007, respectively, that represented fair value basis adjustments on the $165,000 fixed-rate match funded term note that we had designated as part of a fair value hedging relationship. The fair value hedge was established in 2007 using an interest rate swap that we subsequently terminated in the first quarter of 2008.
F-37
|
|
|
|
NOTE 23 |
SERVICING AND SUBSERVICING FEES |
The following table presents the components of servicing and subservicing fees for the years ended December 31:
|
|
|
|
|
|
|
|
|
|
|
|
|
|
|
2009 |
|
2008 |
|
2007 |
|
|||
|
|
|
|
|
|
||||||
|
Loan servicing and subservicing fees |
|
$ |
175,691 |
|
$ |
215,817 |
|
$ |
233,688 |
|
|
Receivables management and recovery fees |
|
|
29,207 |
|
|
56,186 |
|
|
35,536 |
|
|
Late charges |
|
|
28,292 |
|
|
45,985 |
|
|
39,665 |
|
|
Loan collection fees |
|
|
7,569 |
|
|
11,336 |
|
|
12,817 |
|
|
Custodial accounts (float earnings) (1) |
|
|
4,803 |
|
|
11,005 |
|
|
29,318 |
|
|
Other |
|
|
18,905 |
|
|
27,697 |
|
|
28,253 |
|
|
|
|
|
|
|
||||||
|
|
|
$ |
264,467 |
|
$ |
368,026 |
|
$ |
379,277 |
|
|
|
|
|
|
|
||||||
|
|
|
|
(1) |
For 2009, 2008 and 2007, float earnings included $4,745, $10,696 and $12,998, respectively, of interest income from our investment in auction rate securities. |
|
|
|
|
NOTE 24 |
INTEREST INCOME |
The following table presents the components of interest income for each category of our interest-earning assets for the years ended December 31:
|
|
|
|
|
|
|
|
|
|
|
|
|
|
|
2009 |
|
2008 |
|
2007 |
|
|||
|
|
|
|
|
|
||||||
|
Interest earning cash and short-term investments |
|
$ |
1,543 |
|
$ |
2,011 |
|
$ |
2,153 |
|
|
Trading securities: |
|
|
|
|
|
|
|
|
|
|
|
Investment grade |
|
|
— |
|
|
598 |
|
|
4,412 |
|
|
Subordinates and residuals |
|
|
2,600 |
|
|
4,259 |
|
|
10,445 |
|
|
Certificates of deposit |
|
|
— |
|
|
— |
|
|
2,200 |
|
|
Loans |
|
|
4,643 |
|
|
7,828 |
|
|
10,441 |
|
|
|
|
|
|
|
||||||
|
|
|
$ |
8,786 |
|
$ |
14,696 |
|
$ |
29,651 |
|
|
|
|
|
|
|
||||||
|
|
|
|
NOTE 25 |
INTEREST EXPENSE |
The following table presents the components of interest expense for each category of our interest-bearing liabilities for the years ended December 31:
|
|
|
|
|
|
|
|
|
|
|
|
|
|
|
2009 |
|
2008 |
|
2007 |
|
|||
|
|
|
|
|
|
||||||
|
Match funded liabilities |
|
$ |
47,561 |
|
$ |
57,985 |
|
$ |
41,541 |
|
|
Lines of credit and other secured borrowings |
|
|
2,668 |
|
|
13,987 |
|
|
20,661 |
|
|
Investment line |
|
|
2,618 |
|
|
1,055 |
|
|
— |
|
|
Debt securities: |
|
|
|
|
|
|
|
|
|
|
|
Convertible Notes |
|
|
3,898 |
|
|
7,238 |
|
|
7,812 |
|
|
Capital Trust Securities |
|
|
5,728 |
|
|
5,805 |
|
|
5,808 |
|
|
Other |
|
|
481 |
|
|
504 |
|
|
764 |
|
|
|
|
|
|
|
||||||
|
|
|
$ |
62,954 |
|
$ |
86,574 |
|
$ |
76,586 |
|
|
|
|
|
|
|
||||||
|
|
|
|
NOTE 26 |
INCOME TAXES |
For income tax purposes, the domestic and foreign components of income from continuing operations before taxes were as follows:
|
|
|
|
|
|
|
|
|
|
|
|
|
|
|
2009 |
|
2008 |
|
2007 |
|
|||
|
|
|
|
|
|
||||||
|
Domestic |
|
$ |
89,847 |
|
$ |
23,649 |
|
$ |
45,149 |
|
|
Foreign |
|
|
3,414 |
|
|
7,333 |
|
|
9,405 |
|
|
|
|
|
|
|
||||||
|
|
|
$ |
93,261 |
|
$ |
30,982 |
|
$ |
54,554 |
|
|
|
|
|
|
|
||||||
F-38
The components of income tax expense (benefit) were as follows for the years ended December 31:
|
|
|
|
|
|
|
|
|
|
|
|
|
|
|
2009 |
|
2008 |
|
2007 |
|
|||
|
|
|
|
|
|
||||||
|
Current: |
|
|
|
|
|
|
|
|
|
|
|
Federal |
|
$ |
51,341 |
|
$ |
9,959 |
|
$ |
16,237 |
|
|
State |
|
|
300 |
|
|
1,581 |
|
|
3,064 |
|
|
Foreign |
|
|
933 |
|
|
1,304 |
|
|
2,880 |
|
|
|
|
|
|
|
||||||
|
|
|
|
52,574 |
|
|
12,844 |
|
|
22,181 |
|
|
|
|
|
|
|
||||||
|
Deferred: |
|
|
|
|
|
|
|
|
|
|
|
Federal |
|
|
40,067 |
|
|
(1,424 |
) |
|
(4,032 |
) |
|
State |
|
|
4,564 |
|
|
(325 |
) |
|
(481 |
) |
|
Foreign |
|
|
(1,095 |
) |
|
(482 |
) |
|
(1,939 |
) |
|
Provision for (reversal of) valuation allowance on deferred tax assets |
|
|
— |
|
|
1,393 |
|
|
(543 |
) |
|
|
|
|
|
|
||||||
|
|
|
|
43,536 |
|
|
(838 |
) |
|
(6,995 |
) |
|
|
|
|
|
|
||||||
|
Total |
|
$ |
96,110 |
|
$ |
12,006 |
|
$ |
15,186 |
|
|
|
|
|
|
|
||||||
Income tax expense (benefit) differs from the amounts computed by applying the U.S. Federal corporate income tax rate of 35% as follows for the years ended December 31:
|
|
|
|
|
|
|
|
|
|
|
|
|
|
|
2009 |
|
2008 |
|
2007 |
|
|||
|
|
|
|
|
|
||||||
|
Expected income tax expense (benefit) at statutory rate |
|
$ |
32,641 |
|
$ |
10,844 |
|
$ |
19,094 |
|
|
Differences between expected and actual income tax expense (benefit): |
|
|
|
|
|
|
|
|
|
|
|
Indefinite deferral on earnings of non-U.S. affiliates |
|
|
(1,006 |
) |
|
(2,566 |
) |
|
(3,292 |
) |
|
State tax (after Federal tax benefit) |
|
|
5,274 |
|
|
918 |
|
|
1,731 |
|
|
Low-income housing tax credits |
|
|
(23 |
) |
|
(59 |
) |
|
(1,326 |
) |
|
Tax effect of Altisource Separation |
|
|
48,577 |
|
|
— |
|
|
— |
|
|
Provision for selected tax items |
|
|
11,196 |
|
|
— |
|
|
— |
|
|
Deferred tax asset valuation allowance benefit |
|
|
— |
|
|
1,393 |
|
|
(543 |
) |
|
Foreign tax |
|
|
(161 |
) |
|
822 |
|
|
941 |
|
|
Capital loss utilization |
|
|
— |
|
|
— |
|
|
(1,586 |
) |
|
Equity-based compensation tax expense |
|
|
(510 |
) |
|
435 |
|
|
— |
|
|
Other |
|
|
122 |
|
|
219 |
|
|
167 |
|
|
|
|
|
|
|
||||||
|
Actual income tax expense (benefit) |
|
$ |
96,110 |
|
$ |
12,006 |
|
$ |
15,186 |
|
|
|
|
|
|
|
||||||
F-39
Net deferred tax assets were comprised of the following at December 31:
|
|
|
|
|
|
|
|
|
|
|
|
2009 |
|
2008 |
|
||
|
|
|
|
|
||||
|
Deferred tax assets: |
|
|
|
|
|
|
|
|
Tax residuals and deferred income on tax residuals |
|
$ |
3,415 |
|
$ |
3,725 |
|
|
State taxes |
|
|
3,311 |
|
|
9,780 |
|
|
Accrued incentive compensation |
|
|
3,739 |
|
|
4,208 |
|
|
Valuation allowance on real estate |
|
|
1,712 |
|
|
3,502 |
|
|
Bad debt and allowance for loan losses |
|
|
7,220 |
|
|
8,296 |
|
|
Mortgage servicing rights amortization |
|
|
50,065 |
|
|
79,658 |
|
|
Net operating loss carryforward |
|
|
22,098 |
|
|
31,281 |
|
|
Partnership losses and low-income housing tax credits |
|
|
10,245 |
|
|
23,963 |
|
|
Foreign deferred assets |
|
|
3,211 |
|
|
1,458 |
|
|
Net unrealized gains and losses on securities |
|
|
16,742 |
|
|
20,883 |
|
|
Foreign basis differences |
|
|
8,489 |
|
|
— |
|
|
Other |
|
|
2,511 |
|
|
2,744 |
|
|
|
|
|
|
||||
|
|
|
|
132,758 |
|
|
189,498 |
|
|
|
|
|
|
||||
|
Deferred tax liabilities: |
|
|
|
|
|
|
|
|
Deferred interest income on loans |
|
|
75 |
|
|
75 |
|
|
Intangibles amortization |
|
|
— |
|
|
12,533 |
|
|
|
|
|
|
||||
|
|
|
|
75 |
|
|
12,608 |
|
|
|
|
|
|
||||
|
|
|
|
132,683 |
|
|
176,890 |
|
|
Valuation allowances |
|
|
— |
|
|
(1,745 |
) |
|
|
|
|
|
||||
|
Net deferred tax assets |
|
$ |
132,683 |
|
$ |
175,145 |
|
|
|
|
|
|
||||
We conduct periodic evaluations of positive and negative evidence to determine whether it is more likely than not that the deferred tax asset can be realized in future periods. Among the factors considered in this evaluation are estimates of future taxable income, future reversals of temporary differences, tax character and the impact of tax planning strategies that may be implemented if warranted. As a result of this evaluation, we included in the tax provision an increase of $1,393 to the valuation allowance for 2008 and no change to the valuation allowance in 2009.
At December 31, 2008, the deferred tax asset valuation allowance of $1,745 related to certain NCI-related state net operating losses that are not likely to be realized in future periods. In 2009, we transferred certain deferred tax assets and liabilities and our remaining valuation allowance to Altisource as part of the Separation. See Note 2.
We adopted ASC 740 effective January 1, 2007. We recognized total interest and penalties of $278 in 2009, while the cumulative post-adoption interest and penalties through December 31, 2009 were $751. We decided to classify interest and penalties as a component of income tax expense. We recognized a $1,483 increase in the liability for selected tax items that was accounted for as a reduction to the January 1, 2007 balance of retained earnings. As of December 31, 2009 and 2008, we had a total liability for selected tax items of approximately $15,326 and $2,042, respectively, all but $2,088 of which if recognized would affect the effective tax rate. The increase in the 2009 balance was due to a reserve against the full amount of recognized deferred tax assets arising from deductibility of losses in a finance vehicle.
Our major jurisdiction tax years that remain subject to examination are our U.S. federal tax return for the years ended December 31, 2005 through the present and our India corporate tax returns for the years ended March 31, 2003 through the present. A reconciliation of the beginning and ending amount of the liability for selected tax items is as follows for the years ended December 31:
|
|
|
|
|
|
|
|
|
|
|
|
2009 |
|
2008 |
|
||
|
|
|
|
|
||||
|
Balance at January 1 |
|
$ |
2,042 |
|
$ |
1,759 |
|
|
Additions based on tax positions related to current year |
|
|
11,196 |
|
|
— |
|
|
Additions for tax positions of prior years |
|
|
2,088 |
|
|
1,068 |
|
|
Reductions for tax positions of prior years |
|
|
— |
|
|
(540 |
) |
|
Lapses in statutes of limitation |
|
|
— |
|
|
(245 |
) |
|
|
|
|
|
||||
|
Balance at December 31 |
|
$ |
15,326 |
|
$ |
2,042 |
|
|
|
|
|
|
||||
At December 31, 2009, we had net operating loss carryforwards of $22,097 that related to realized built-in losses from the acquisition of Ocwen Asset Investment Corporation. Utilization of these carryforwards is subject to an annual IRC section 382 limitation of $5,700. We no longer had any remaining capital loss carryforwards or any tax credit carryforwards related to our low-income housing tax credits.
F-40
|
|
|
|
NOTE 27 |
BASIC AND DILUTED EARNINGS PER SHARE |
Basic EPS excludes common stock equivalents and is calculated by dividing net income (loss) attributable to OCN by the weighted average number of common shares outstanding during the year. We calculate diluted EPS by dividing net income attributable to OCN, as adjusted to add back interest expense net of income tax on the Convertible Notes, by the weighted average number of common shares outstanding including the potential dilutive common shares related to outstanding stock options, restricted stock awards and the Convertible Notes. The following is a reconciliation of the calculation of basic EPS to diluted EPS for the years ended December 31:
|
|
|
|
|
|
|
|
|
|
|
|
|
|
|
2009 |
|
2008 |
|
2007 |
|
|||
|
|
|
|
|
|
||||||
|
Basic EPS: |
|
|
|
|
|
|
|
|
|
|
|
Net income attributable to OCN |
|
$ |
297 |
|
$ |
13,250 |
|
$ |
36,104 |
|
|
|
|
|
|
|
||||||
|
|
|
|
|
|
|
|
|
|
|
|
|
Weighted average shares of common stock |
|
|
78,252,000 |
|
|
62,670,957 |
|
|
62,712,076 |
|
|
|
|
|
|
|
||||||
|
|
|
|
|
|
|
|
|
|
|
|
|
Basic EPS |
|
$ |
— |
|
$ |
0.21 |
|
$ |
0.58 |
|
|
|
|
|
|
|
||||||
|
|
|
|
|
|
|
|
|
|
|
|
|
Diluted EPS: |
|
|
|
|
|
|
|
|
|
|
|
Net income attributable to OCN |
|
$ |
297 |
|
$ |
13,250 |
|
$ |
36,104 |
|
|
Interest expense on Convertible Notes, net of income tax (1) |
|
|
— |
|
|
— |
|
|
— |
|
|
|
|
|
|
|
||||||
|
Adjusted net income attributable to OCN |
|
$ |
297 |
|
$ |
13,250 |
|
$ |
36,104 |
|
|
|
|
|
|
|
||||||
|
|
|
|
|
|
|
|
|
|
|
|
|
Weighted average shares of common stock |
|
|
78,252,000 |
|
|
62,670,957 |
|
|
62,712,076 |
|
|
Effect of dilutive elements: |
|
|
|
|
|
|
|
|
|
|
|
Convertible Notes (1) |
|
|
— |
|
|
— |
|
|
— |
|
|
Stock options (2) |
|
|
— |
|
|
241,205 |
|
|
709,855 |
|
|
Common stock awards |
|
|
— |
|
|
23,152 |
|
|
74,408 |
|
|
|
|
|
|
|
||||||
|
Dilutive weighted average shares of common stock |
|
|
78,252,000 |
|
|
62,935,314 |
|
|
63,496,339 |
|
|
|
|
|
|
|
||||||
|
|
|
|
|
|
|
|
|
|
|
|
|
Diluted EPS |
|
$ |
— |
|
$ |
0.21 |
|
$ |
0.57 |
|
|
|
|
|
|
|
||||||
|
|
|
|
(1) |
The effect of our Convertible Notes on diluted EPS is computed using the if-converted method. Interest expense and related amortization costs applicable to the Convertible Notes, net of income tax, are added back to net income. Conversion of the Convertible Notes into shares of common stock has not been assumed for purposes of computing diluted EPS for the three years because the effect would be anti-dilutive. The effect is anti-dilutive whenever interest expense on the Convertible Notes, net of income tax, per common share obtainable on conversion exceeds basic EPS. |
|
(2) |
An average of 557,080; 3,062,166 and 1,208,391 options have been excluded from the computation of diluted EPS for 2009, 2008 and 2007, respectively. These options were anti-dilutive because their exercise price was greater than the average market price of our stock. Excluded from the computation of diluted EPS were 1,710,000 of the 5,130,000 options that we granted on July 14, 2008, for shares that are issuable upon the achievement of certain performance criteria related to OCN’s stock price and an annualized rate of return to investors. On August 10, 2009, the market performance criterion was met for 3,420,000 of these options. Also excluded were 78,750 options granted with similar conditions on November 4, 2009. |
|
|
|
|
NOTE 28 |
EMPLOYEE COMPENSATION AND BENEFIT PLANS |
We maintain a defined contribution plan to provide post retirement benefits to our eligible employees. We also maintain additional compensation plans for certain employees. We designed these plans to facilitate a pay-for-performance policy, further align the interests of our officers and key employees with the interests of our shareholders and assist in attracting and retaining employees vital to our long-term success. These plans are summarized below.
Retirement Plan
We maintain a defined contribution 401(k) plan. We match 50% of each employee’s contributions, limited to 2% of the employee’s compensation. Our contributions to the 401(k) plan were $403, $469 and $453 for the years ended December 31, 2009, 2008 and 2007, respectively.
Annual Incentive Plan
The Ocwen Financial Corporation Amended 1998 Annual Incentive Plan (the AIP) is our primary incentive compensation plan for executives and other key employees. Under the terms of the AIP, participants can earn cash and equity-based awards as determined by the Compensation Committee of the Board of Directors. The awards are generally based on objective performance criteria established by the Committee which includes corporate profitability, growth in our core businesses, meeting budget objectives and achieving cost savings through Six Sigma initiatives. The Committee may at its discretion adjust performance measurements to reflect significant unforeseen events. In 2007, the stockholders approved the 2007 Equity Incentive Plan (the 2007 Equity Plan) to replace the 1991 Non-Qualified Stock Option Plan. The 2007 Equity Plan authorizes the grant of stock options, restricted stock or other equity-based awards to employees.
F-41
For service years 2009, 2008 and 2007, we awarded annual incentive compensation entirely in cash. However, in July 2008 and November 2009, we awarded stock options to members of senior management under the 2007 Equity Plan. The vesting schedule for these options has a time-based component in which 25% of the options vest in equal increments over four years. The vesting schedule also has a market-based component in which up to 75% of the options will vest in four equal increments commencing upon the achievement of certain performance criteria related to OCN’s stock price and the annualized rate of return to investors. Upon meeting the market performance criteria, one-fourth of the market-based options immediately vest. Thereafter, one-fourth of these options vests on each of the three consecutive anniversaries of the initial vesting. Two-thirds of the market-based options begin to vest if the stock price realizes a compounded annual gain of at least 20% over the exercise price, so long as the stock price is at least double the exercise price. The remaining third of the market-based options begin to vest if the stock price realizes a 25% gain, so long as it is at least triple the exercise price. On August 10, 2009, the market performance criterion was met for 3,420,000 of the market-based options awarded in July 2008.
Stock option activity for the years ended December 31:
|
|
|
|
|
|
|
|
|
|
|
|
|
|
|
|
|
|
|
|
|
|
|
|
2009 |
|
2008 |
|
2007 |
|
||||||||||||
|
|
|
|
|
|
|||||||||||||||
|
|
|
Number of |
|
Weighted |
|
Number of |
|
Weighted |
|
Number of |
|
Weighted |
|
||||||
|
|
|
|
|
|
|
|
|
||||||||||||
|
Outstanding at beginning of year |
|
|
9,428,952 |
|
$ |
8.14 |
|
|
3,230,526 |
|
$ |
9.50 |
|
|
3,212,031 |
|
$ |
8.42 |
|
|
Granted |
|
|
415,000 |
|
|
8.68 |
|
|
6,530,000 |
|
|
8.00 |
|
|
475,999 |
|
|
11.88 |
|
|
Exercised |
|
|
(526,749 |
) |
|
6.37 |
|
|
(3,008 |
) |
|
2.30 |
|
|
(263,398 |
) |
|
5.80 |
|
|
Forfeited |
|
|
(38,622 |
) |
|
12.12 |
|
|
(328,566 |
) |
|
18.82 |
|
|
(194,106 |
) |
|
18.01 |
|
|
|
|
|
|
|
|
|
|
|
|
|
|
|
|
||||||
|
Outstanding at end of year |
|
|
9,278,581 |
|
|
4.97 |
|
|
9,428,952 |
|
|
8.14 |
|
|
3,230,526 |
|
|
9.50 |
|
|
|
|
|
|
|
|
|
|
|
|
|
|
|
|
||||||
|
Exercisable at end of year |
|
|
3,486,405 |
|
|
4.98 |
|
|
2,585,799 |
|
|
8.20 |
|
|
2,567,886 |
|
|
9.20 |
|
|
|
|
|
|
|
|
|
|
|
|
|
|
|
|
||||||
See Note 2 for information regarding the effect of the Separation on our employee compensation programs.
Stock options outstanding at December 31, 2009:
|
|
|
|
|
|
|
|
|
|
|
|
|
|
|
|
|
|
|
|
|
|
|
Options Outstanding |
|
Options Exercisable |
|
|||||||||
|
|
|
|
|
|||||||||||||
|
Award Year |
|
Exercise |
|
Number |
|
Weighted |
|
Weighted |
|
Number |
|
Weighted |
|
|||
|
|
|
|
|
|
|
|
||||||||||
|
2009 |
|
$4.82 - 10.97 |
|
415,000 |
|
$ |
6.30 |
|
10 |
|
|
58,125 |
|
$ |
4.82 |
|
|
2008 |
|
4.82 |
|
6,530,000 |
|
|
4.82 |
|
9 |
|
|
1,224,374 |
|
|
4.82 |
|
|
2006 |
|
7.16 |
|
398,597 |
|
|
7.16 |
|
7 |
|
|
324,921 |
|
|
7.16 |
|
|
2005 |
|
5.81 |
|
276,362 |
|
|
5.81 |
|
6 |
|
|
220,363 |
|
|
5.81 |
|
|
2004 |
|
2.96 – 6.39 |
|
253,731 |
|
|
5.01 |
|
4 |
|
|
253,731 |
|
|
5.01 |
|
|
2003 |
|
3.72 – 6.47 |
|
222,095 |
|
|
5.97 |
|
4 |
|
|
222,095 |
|
|
5.97 |
|
|
2002 |
|
1.13 – 1.69 |
|
214,426 |
|
|
1.49 |
|
3 |
|
|
214,426 |
|
|
1.49 |
|
|
2001 |
|
3.49 – 7.56 |
|
667,664 |
|
|
5.61 |
|
2 |
|
|
667,664 |
|
|
5.61 |
|
|
2000 |
|
2.46 – 4.46 |
|
258,934 |
|
|
2.87 |
|
1 |
|
|
258,934 |
|
|
2.87 |
|
|
1999 |
|
3.77 |
|
41,772 |
|
|
3.77 |
|
0 |
|
|
41,772 |
|
|
3.77 |
|
|
|
|
|
|
|
|
|
|
|
|
|
|
|
|
|||
|
|
|
|
|
9,278,581 |
|
|
|
|
|
|
|
3,486,405 |
|
|
|
|
|
|
|
|
|
|
|
|
|
|
|
|
|
|
|
|||
Stock options awarded prior to 2008 generally vest ratably over a five–year period including the award year. The contractual term of all options granted is ten years from the grant date, except where employment terminates by reason of retirement, in which case the option will terminate no later than three years after such retirement or the end of the option term, whichever is earlier. At December 31, 2009 the weighted average remaining contractual term of options outstanding and options exercisable was 7.4 years and 5.4 years, respectively.
F-42
Excluding 1,710,000 and 78,750 market-based options awarded in 2008 and 2009, respectively, that have not met their performance criteria, the net aggregate intrinsic value of stock options outstanding and stock options exercisable at December 31, 2009 was $34,648 and $16,014, respectively.
Compensation expense related to options is measured based on the grant-date fair value of the options using an appropriate valuation model based on the vesting condition of the award. The fair value of the time-based options was determined using the Black-Scholes options pricing model, while a lattice (binomial) model was used to determine the fair value of the market-based options. The following assumptions were used to value the 2009 and 2008 equity incentive award as of the grant dates.
|
|
|
|
|
|
|
|
|
|
|
|
|
2009 |
|
2008 |
||||
|
|
|
|
||||||
|
|
|
Black-Scholes |
|
Binomial |
|
Black-Scholes |
|
Binomial |
|
|
|
|
|
|
||||
|
Risk-free interest rate |
|
2.51% |
|
0.38 – 3.94% |
|
3.48% |
|
2.15 – 4.28% |
|
Expected stock price volatility |
|
38% |
|
38 - 46% |
|
38% |
|
38 – 46% |
|
Expected dividend yield |
|
— |
|
— |
|
— |
|
— |
|
Expected option life (in years) |
|
5 |
|
— |
|
5 |
|
— |
|
Contractual life (in years) |
|
— |
|
10 |
|
— |
|
10 |
|
Fair value |
|
$3.96 |
|
$3.99 and $3.40 |
|
$1.01 |
|
$0.87 and $0.65 |
The following table sets forth equity-based compensation related to stock options and stock awards and the related excess tax benefit as of December 31:
|
|
|
|
|
|
|
|
|
|
|
|
|
|
|
2009 |
|
2008 |
|
2007 |
|
|||
|
|
|
|
|
|
||||||
|
Employee compensation expense: |
|
|
|
|
|
|
|
|
|
|
|
Stock option awards |
|
$ |
1,675 |
|
$ |
1,569 |
|
$ |
3,048 |
|
|
Stock awards |
|
|
28 |
|
|
420 |
|
|
1,182 |
|
|
Excess tax benefit related to share-based awards |
|
|
551 |
|
|
121 |
|
|
599 |
|
As of December 31, 2009, unrecognized compensation costs related to non-vested stock options amounted to $3,297, which will be recognized over a weighted-average remaining requisite service period of approximately 2.3 years.
In addition to stock options, the Compensation Committee has also awarded common stock to employees. These awards are granted at no cost to the employee and vest ratably over a three-year period including the award year. The shares are issued to the employee upon vesting. We did not grant any shares for the 2009, 2008 and 2007 service years; however, during 2007 we awarded 154,553 shares to compensate employees for the loss in fair value from the exchange of stock options that were noncompliant under IRC section 409A. At December 31, 2009, a total of 9,865 shares relating to the IRC section 409A remediation were unvested. These remaining shares vested on January 1, 2010. The fair value of these stock awards is recognized as compensation expense ratably over the vesting period.
|
|
|
|
NOTE 29 |
BUSINESS SEGMENT REPORTING |
Prior to the Separation on August 10, 2009, we managed our business through two distinct lines of business, Ocwen Asset Management and Ocwen Solutions. Ocwen Asset Management includes our core residential servicing business, equity investments in asset management vehicles and our remaining investments in subprime loans and residual securities. Ocwen Solutions, our knowledge-based business process outsourcing (BPO) operation, included our residential fee-based loan processing businesses, all of our technology platforms, our unsecured collections business and our equity interest in BMS Holdings. Due to the Separation, as of August 10, 2009, neither the assets and liabilities, nor the subsequent operations of the Ocwen Solutions line of business comprising the Mortgage Services, Financial Services and Technology Products segments, except for BMS Holdings and GSS, are included in our results.
Our business segments reflect the internal reporting that we have used to evaluate operating performance and to assess the allocation of our resources. Our segments are based upon our organizational structure that focuses primarily on the products and services offered. Segment results for prior periods have been restated to conform to the current segment structure.
F-43
A brief description of our current and former business segments, aligned within our two lines of business, is as follows:
Ocwen Asset Management
|
|
|
|
|
|
• |
Servicing. This segment provides loan servicing for a fee, including asset management and resolution services, primarily to owners of subprime residential mortgages. Subprime loans represent residential loans we service that were made to borrowers who generally did not qualify under guidelines of Fannie Mae and Freddie Mac (nonconforming loans). This segment is primarily comprised of our core residential servicing business. |
|
|
• |
Loans and Residuals. This segment includes our trading and investing activities and our former subprime loan origination operation. Our trading and investing activities include our investments in subprime residual mortgage backed trading securities as well as the results of our whole loan purchase and securitization activities. |
|
|
• |
Asset Management Vehicles. This segment is comprised of our 25% equity investment in OSI and approximately a 25% equity investment in ONL and affiliates, unconsolidated entities engaged in the management of residential assets. |
Ocwen Solutions (distributed as part of the Separation, except for BMS Holdings and GSS)
|
|
|
|
|
|
• |
Mortgage Services. This segment provided due diligence, valuation, real estate sales, default processing services, property inspection and preservation services, homeowner outreach, closing and title services and knowledge process outsourcing services. Services provided spanned the lifecycle of a mortgage loan from origination through the disposition of real estate properties. Prior to August 10, 2009, this segment also includes international servicing for commercial loans which we conducted through GSS. |
|
|
• |
Financial Services. This segment comprised our asset recovery management and customer relationship management offerings to the financial services, consumer products, telecommunications and utilities industries. The primary sources of revenues for this segment were contingency collections and customer relationship management for credit card issuers and other consumer credit providers. Effective June 6, 2007, this segment included the operations of NCI, a receivables management company specializing in contingency collections and customer relationship management for credit card issuers and other consumer and credit providers. |
|
|
• |
Technology Products. This segment included revenues from the REAL suite of applications that support our Servicing business as well as the servicing and origination businesses of external customers. These products include REALServicing™, REALResolution™, REALTransSM, REALSynergy™ and REALRemit™. REALServicing is the core residential loan servicing application used by OCN. This segment also earned fees from providing technology support services to OCN that cover IT enablement, call center services and third-party applications. Prior to August 10, 2009, the results of our 45% equity investment in BMS Holdings, which provides technology-based case management solutions to trustees, law firms and debtor companies that administer cases in the federal bankruptcy system, is also included in this segment. |
|
|
|
|
|
|
Corporate Items and Other. We report items of revenue and expense that are not directly related to a business, business activities that are individually insignificant, interest income on short-term investments of cash and the related costs of financing these investments and certain other corporate expenses in Corporate Items and Other. Our Convertible Notes and Capital Trust Securities are also included in Corporate Items and Other. |
|
We allocate interest income and expense to each business segment for funds raised or funding of investments made. We also allocate expenses generated by corporate support services to each business segment.
F-44
Financial information for our segments is as follows:
|
|
|
|
|
|
|
|
|
|
|
|
|
|
|
|
|
|
|
|
|
|
|
|
|
|
|
|
|
|
|
|
|
Ocwen Asset Management |
|
Ocwen Solutions |
|
|
|
|
|
|
|
|||||||||||||||||
|
|
|
|
|
|
|
|
|
|
|
|||||||||||||||||||
|
|
|
Servicing |
|
Loans and |
|
Asset |
|
Mortgage |
|
Financial |
|
Technology |
|
Corporate |
|
Corporate |
|
Business |
|
|||||||||
|
Results of Operations |
|
|
|
|
|
|
|
|
|
|
|
|
|
|
|
|
|
|
|
|
|
|
|
|
|
|
|
|
|
For the year ended December 31, 2009 |
|
|
|
|
|
|
|
|
|
|
|
|
|
|
|
|
|
|
|
|
|
|
|
|
|
|
|
|
|
Revenue (1) (2) |
|
$ |
272,725 |
|
$ |
— |
|
$ |
1,851 |
|
$ |
54,052 |
|
$ |
40,293 |
|
$ |
28,331 |
|
$ |
1,066 |
|
$ |
(17,590 |
) |
$ |
380,728 |
|
|
Operating expenses (1) (3) (4) (5) |
|
|
129,252 |
|
|
2,831 |
|
|
3,108 |
|
|
37,040 |
|
|
45,002 |
|
|
18,638 |
|
|
16,308 |
|
|
(16,525 |
) |
|
235,654 |
|
|
|
|
|
|
|
|
|
|
|
|
|
||||||||||||||||||
|
Income (loss) from operations |
|
|
143,473 |
|
|
(2,831 |
) |
|
(1,257 |
) |
|
17,012 |
|
|
(4,709 |
) |
|
9,693 |
|
|
(15,242 |
) |
|
(1,065 |
) |
|
145,074 |
|
|
|
|
|
|
|
|
|
|
|
|
|
||||||||||||||||||
|
Other income (expense): |
|
|
|
|
|
|
|
|
|
|
|
|
|
|
|
|
|
|
|
|
|
|
|
|
|
|
|
|
|
Interest income |
|
|
266 |
|
|
7,183 |
|
|
— |
|
|
2 |
|
|
— |
|
|
— |
|
|
1,335 |
|
|
— |
|
|
8,786 |
|
|
Interest expense |
|
|
(59,458 |
) |
|
(1,447 |
) |
|
— |
|
|
(28 |
) |
|
(1,285 |
) |
|
(289 |
) |
|
(447 |
) |
|
— |
|
|
(62,954 |
) |
|
Other (1) (2) |
|
|
3,400 |
|
|
(12,026 |
) |
|
(4,060 |
) |
|
829 |
|
|
25 |
|
|
186 |
|
|
12,936 |
|
|
1,065 |
|
|
2,355 |
|
|
|
|
|
|
|
|
|
|
|
|
|
||||||||||||||||||
|
Other income (expense), net |
|
|
(55,792 |
) |
|
(6,290 |
) |
|
(4,060 |
) |
|
803 |
|
|
(1,260 |
) |
|
(103 |
) |
|
13,824 |
|
|
1,065 |
|
|
(51,813 |
) |
|
|
|
|
|
|
|
|
|
|
|
|
||||||||||||||||||
|
Income (loss) from continuing operations before income taxes |
|
$ |
87,681 |
|
$ |
(9,121 |
) |
$ |
(5,317 |
) |
$ |
17,815 |
|
$ |
(5,969 |
) |
$ |
9,590 |
|
$ |
(1,418 |
) |
$ |
— |
|
$ |
93,261 |
|
|
|
|
|
|
|
|
|
|
|
|
|
||||||||||||||||||
|
For the year ended December 31, 2008 |
|
|
|
|
|
|
|
|
|
|
|
|
|
|
|
|
|
|
|
|
|
|
|
|
|
|
|
|
|
Revenue (1) |
|
$ |
340,725 |
|
$ |
— |
|
$ |
3,664 |
|
$ |
58,733 |
|
$ |
73,835 |
|
$ |
45,283 |
|
$ |
156 |
|
$ |
(30,268 |
) |
$ |
492,128 |
|
|
Operating expenses (1) (3) |
|
|
164,292 |
|
|
3,025 |
|
|
4,113 |
|
|
46,299 |
|
|
79,757 |
|
|
35,895 |
|
|
18,743 |
|
|
(28,769 |
) |
|
323,355 |
|
|
|
|
|
|
|
|
|
|
|
|
|
||||||||||||||||||
|
Income (loss) from operations |
|
|
176,433 |
|
|
(3,025 |
) |
|
(449 |
) |
|
12,434 |
|
|
(5,922 |
) |
|
9,388 |
|
|
(18,587 |
) |
|
(1,499 |
) |
|
168,773 |
|
|
|
|
|
|
|
|
|
|
|
|
|
||||||||||||||||||
|
Other income (expense): |
|
|
|
|
|
|
|
|
|
|
|
|
|
|
|
|
|
|
|
|
|
|
|
|
|
|
|
|
|
Interest income |
|
|
1,004 |
|
|
11,361 |
|
|
— |
|
|
147 |
|
|
16 |
|
|
— |
|
|
2,168 |
|
|
— |
|
|
14,696 |
|
|
Interest expense |
|
|
(75,835 |
) |
|
(3,177 |
) |
|
— |
|
|
(200 |
) |
|
(1,977 |
) |
|
(573 |
) |
|
(4,812 |
) |
|
— |
|
|
(86,574 |
) |
|
Other (1) (6) (7) |
|
|
(832 |
) |
|
(19,841 |
) |
|
(9,364 |
) |
|
881 |
|
|
8 |
|
|
(5,235 |
) |
|
(33,029 |
) |
|
1,499 |
|
|
(65,913 |
) |
|
|
|
|
|
|
|
|
|
|
|
|
||||||||||||||||||
|
Other income (expense), net |
|
|
(75,663 |
) |
|
(11,657 |
) |
|
(9,364 |
) |
|
828 |
|
|
(1,953 |
) |
|
(5,808 |
) |
|
(35,673 |
) |
|
1,499 |
|
|
(137,791 |
) |
|
|
|
|
|
|
|
|
|
|
|
|
||||||||||||||||||
|
Income (loss) from continuing operations before income taxes |
|
$ |
100,770 |
|
$ |
(14,682 |
) |
$ |
(9,813 |
) |
$ |
13,262 |
|
$ |
(7,875 |
) |
$ |
3,580 |
|
$ |
(54,260 |
) |
$ |
— |
|
$ |
30,982 |
|
|
|
|
|
|
|
|
|
|
|
|
|
||||||||||||||||||
|
For the year ended December 31, 2007 |
|
|
|
|
|
|
|
|
|
|
|
|
|
|
|
|
|
|
|
|
|
|
|
|
|
|
|
|
|
Revenue (1) |
|
$ |
343,648 |
|
$ |
352 |
|
$ |
1,444 |
|
$ |
73,852 |
|
$ |
41,292 |
|
$ |
36,235 |
|
$ |
1,162 |
|
$ |
(17,324 |
) |
$ |
480,661 |
|
|
Operating expenses (1) (3) |
|
|
219,322 |
|
|
4,191 |
|
|
829 |
|
|
59,603 |
|
|
47,110 |
|
|
33,714 |
|
|
5,775 |
|
|
(18,678 |
) |
|
351,866 |
|
|
|
|
|
|
|
|
|
|
|
|
|
||||||||||||||||||
|
Income (loss) from operations |
|
|
124,326 |
|
|
(3,839 |
) |
|
615 |
|
|
14,249 |
|
|
(5,818 |
) |
|
2,521 |
|
|
(4,613 |
) |
|
1,354 |
|
|
128,795 |
|
|
|
|
|
|
|
|
|
|
|
|
|
||||||||||||||||||
|
Other income (expense): |
|
|
|
|
|
|
|
|
|
|
|
|
|
|
|
|
|
|
|
|
|
|
|
|
|
|
|
|
|
Interest income |
|
|
1,146 |
|
|
20,485 |
|
|
— |
|
|
110 |
|
|
6 |
|
|
— |
|
|
7,904 |
|
|
— |
|
|
29,651 |
|
|
Interest expense |
|
|
(57,978 |
) |
|
(7,499 |
) |
|
— |
|
|
(504 |
) |
|
(1,305 |
) |
|
(537 |
) |
|
(8,763 |
) |
|
— |
|
|
(76,586 |
) |
|
Other (1) |
|
|
(2,145 |
) |
|
(17,797 |
) |
|
(774 |
) |
|
147 |
|
|
30 |
|
|
6,984 |
|
|
(12,397 |
) |
|
(1,354 |
) |
|
(27,306 |
) |
|
|
|
|
|
|
|
|
|
|
|
|
||||||||||||||||||
|
Other income (expense), net |
|
|
(58,977 |
) |
|
(4,811 |
) |
|
(774 |
) |
|
(247 |
) |
|
(1,269 |
) |
|
6,447 |
|
|
(13,256 |
) |
|
(1,354 |
) |
|
(74,241 |
) |
|
|
|
|
|
|
|
|
|
|
|
|
||||||||||||||||||
|
Income (loss) from continuing operations before income taxes |
|
$ |
65,349 |
|
$ |
(8,650 |
) |
$ |
(159 |
) |
$ |
14,002 |
|
$ |
(7,087 |
) |
$ |
8,968 |
|
$ |
(17,869 |
) |
$ |
— |
|
$ |
54,554 |
|
|
|
|
|
|
|
|
|
|
|
|
|
||||||||||||||||||
|
Total Assets |
|
|
|
|
|
|
|
|
|
|
|
|
|
|
|
|
|
|
|
|
|
|
|
|
|
|
|
|
|
December 31, 2009 |
|
$ |
1,191,212 |
|
$ |
48,690 |
|
$ |
15,271 |
|
$ |
— |
|
$ |
— |
|
$ |
— |
|
$ |
514,177 |
|
$ |
— |
|
$ |
1,769,350 |
|
|
|
||||||||||||||||||||||||||||
|
December 31, 2008 |
|
|
1,416,615 |
|
|
67,317 |
|
|
26,755 |
|
|
3,558 |
|
|
58,707 |
|
|
8,906 |
|
|
664,962 |
|
|
(9,720 |
) |
|
2,237,100 |
|
|
|
||||||||||||||||||||||||||||
|
December 31, 2007 |
|
|
1,710,947 |
|
|
102,398 |
|
|
74,242 |
|
|
24,149 |
|
|
67,149 |
|
|
17,885 |
|
|
404,122 |
|
|
(8,968 |
) |
|
2,391,924 |
|
|
|
|
|
(1) |
Intersegment billings for services rendered to other segments are recorded as revenues, as contra-expense or as other income, depending on the type of service that is rendered. Intersegment billings are as follows: |
|
|
|
|
|
|
|
|
|
|
|
|
|
|
|
|
|
|
|
|
|
Servicing |
|
Asset |
|
Mortgage |
|
Technology |
|
Business |
|
|||||
|
|
|
|
|
|
|
|
||||||||||
|
For the year ended December 31, 2009 |
|
$ |
5,668 |
|
$ |
471 |
|
$ |
59 |
|
$ |
20,425 |
|
$ |
26,623 |
|
|
For the year ended December 31, 2008 |
|
|
7,148 |
|
|
913 |
|
|
27 |
|
|
33,720 |
|
|
41,808 |
|
|
For the year ended December 31, 2007 |
|
|
2,758 |
|
|
— |
|
|
194 |
|
|
19,499 |
|
|
22,451 |
|
|
|
|
|
(2) |
Servicing has a contractual right to receive interest income on float balances. However, Corporate controls investment decisions associated with the float balances. Accordingly, Servicing receives revenues generated by those investments that are associated with float balances but are reported in Corporate Items and Other. Gains and losses associated with corporate investment decisions are recognized in Corporate Items and Other. |
F-45
|
|
|
|
(3) |
Depreciation and amortization expense are as follows: |
|
|
|
|
|
|
|
|
|
|
|
|
|
|
|
|
|
|
|
|
|
|
|
|
|
|
|
Servicing |
|
Loans |
|
Mortgage |
|
Financial |
|
Technology |
|
Corporate |
|
Business |
|
|||||||
|
|
|
|
|
|
|
|
|
|
||||||||||||||
|
For the year ended December 31, 2009: |
|
|
|
|
|
|
|
|
|
|
|
|
|
|
|
|
|
|
|
|
|
|
|
Depreciation expense |
|
$ |
54 |
|
$ |
— |
|
$ |
19 |
|
$ |
283 |
|
$ |
3,204 |
|
$ |
1,182 |
|
$ |
4,742 |
|
|
Amortization of MSRs |
|
|
32,228 |
|
|
— |
|
|
— |
|
|
— |
|
|
— |
|
|
— |
|
|
32,228 |
|
|
Amortization of intangibles |
|
|
— |
|
|
— |
|
|
— |
|
|
1,624 |
|
|
— |
|
|
— |
|
|
1,624 |
|
|
|
|
|
|
|
|
|
|
|
|
|
|
|
|
|
|
|
|
|
|
|
|
|
|
For the year ended December 31, 2008: |
|
|
|
|
|
|
|
|
|
|
|
|
|
|
|
|
|
|
|
|
|
|
|
Depreciation expense |
|
$ |
54 |
|
$ |
10 |
|
$ |
70 |
|
$ |
415 |
|
$ |
7,443 |
|
$ |
1,725 |
|
$ |
9,717 |
|
|
Amortization of MSRs |
|
|
52,187 |
|
|
— |
|
|
274 |
|
|
— |
|
|
— |
|
|
— |
|
|
52,461 |
|
|
Amortization of intangibles |
|
|
— |
|
|
— |
|
|
— |
|
|
2,554 |
|
|
— |
|
|
— |
|
|
2,554 |
|
|
|
|
|
|
|
|
|
|
|
|
|
|
|
|
|
|
|
|
|
|
|
|
|
|
For the year ended December 31, 2007: |
|
|
|
|
|
|
|
|
|
|
|
|
|
|
|
|
|
|
|
|
|
|
|
Depreciation expense |
|
$ |
82 |
|
$ |
12 |
|
$ |
366 |
|
$ |
558 |
|
$ |
6,289 |
|
$ |
1,937 |
|
$ |
9,244 |
|
|
Amortization of MSRs |
|
|
99,118 |
|
|
— |
|
|
832 |
|
|
— |
|
|
— |
|
|
— |
|
|
99,950 |
|
|
Amortization of intangibles |
|
|
— |
|
|
— |
|
|
— |
|
|
1,555 |
|
|
— |
|
|
— |
|
|
1,555 |
|
|
|
|
|
(4) |
Operating expenses for 2009 include advisory expenses related to the Separation transaction of $3,477 recorded in Corporate Items and Other. |
|
(5) |
Other income (expense) for 2009 and 2008 includes gains (losses) on auction rate securities of $11,863 and $(29,612), respectively, recorded in Corporate Items and Other. |
|
(6) |
Operating expenses for 2008 include $9,532 of due diligence and other costs recorded in Corporate Items and Other related to the “going private” proposal terminated in March 2008 by mutual agreement of the parties. |
|
(7) |
Other income (expense) for 2007 includes a loss of $8,673 recorded in Corporate Items and Other that resulted from the early redemption of CDs that we had acquired at a discount. |
|
(8) |
Other income (expense) for 2007 includes unrealized losses on subordinate and residual trading securities of $29,031 and a gain of $25,587 from the sale of the UK residuals recorded in the Loans and Residuals segment. |
NOTE 30 RELATED PARTY TRANSACTIONS
Although Altisource is a separate company from Ocwen after the Separation, Altisource and Ocwen have the same Chairman of the Board, William C. Erbey. Mr. Erbey is also the Chief Executive Officer of Ocwen. As a result, he has obligations to Ocwen as well as to Altisource. Mr. Erbey currently owns approximately 18% of the common stock of Ocwen and owns approximately 26 % of the common stock of Altisource.
For purposes of governing certain of the ongoing relationships between Ocwen and Altisource after the Separation, and to provide for an orderly transition to the status of two independent companies, we entered into certain agreements with Altisource. A brief description of these agreements follows.
|
|
|
|
|
|
l |
Separation Agreement. This agreement provides for, among other things, the principal corporate transactions required to effect the Separation and certain other agreements relating to the continuing relationship between Altisource and Ocwen after the Separation. |
|
|
l |
Transition Services Agreement. Under this agreement, Altisource and Ocwen provide to each other services in such areas as human resources, vendor management, corporate services, six sigma, quality assurance, quantitative analytics, treasury, accounting, risk management, legal, strategic planning, compliance and other areas where we, and Altisource, may need transition assistance and support following the Separation. |
|
|
l |
Tax Matters Agreement. This agreement sets out each party’s rights and obligations with respect to deficiencies and refunds, if any, of federal, state, local or foreign taxes for periods before and after the Separation and related matters such as the filing of tax returns and the conduct of Internal Revenue Service and other audits. |
|
|
l |
Employee Matters Agreement. This agreement provides for the transition of employee benefit plans and programs sponsored by us for employees of Altisource. |
|
|
l |
Services Agreement. This agreement provides for Altisource’s offering of certain services to us in connection with our business following the Separation for an initial term of eight years, subject to renewal, with pricing terms intended to reflect market rates. Services provided to us under this agreement include residential property valuation, residential property preservation and inspection services, title services and REO sales. |
F-46
|
|
|
|
|
|
l |
Technology Products Services Agreement. This agreement provides for Altisource’s offering of certain technology products and support services to us in connection with our business, also for an initial term of eight years, subject to renewal, with pricing terms intended to reflect market rates. Technology products provided to us under this agreement include the REAL suite of applications that support our Servicing business. |
|
|
l |
Intellectual Property Agreement. This agreement provides for the transfer of intellectual property assets to Altisource. |
|
|
l |
Data Center and Disaster Recovery Services Agreement. This agreement provides for Altisource’s offering of certain data center and disaster recovery services in connection with our business. |
Our business is currently dependent on many of the services and products provided under these long-term contracts with Altisource. These contracts are effective for up to eight years with renewal rights. Certain services provided by Altisource under these contracts are charged to the borrower and/or loan investor. Accordingly, such services, while derived from our loan servicing portfolio, are not presented as expenses to Ocwen. We believe the rates charged under these agreements are market rates as they are materially consistent with one or more of the following: the fees charged by Altisource to other customers for comparable services and the rates Ocwen pays to or observes from other service providers.
Altisource provides the following services under the terms of the foregoing commercial agreements:
|
|
|
|
|
|
|
|
|
Mortgage Services |
|
Technology Products |
||||
|
|
l |
Valuation services |
|
|
l |
Residential loan servicing software |
|
|
l |
Residential due diligence |
|
|
l |
Vendor management and order fulfillment software |
|
|
l |
Residential fulfillment support services |
|
|
l |
Default resolution services |
|
|
l |
Real estate management and sales |
|
|
l |
IT infrastructure support |
|
|
l |
Property inspection and preservation services |
|
|
l |
Invoice presentment and payment software |
|
|
l |
Closing and title services |
|
|
l |
Commercial loan servicing software |
|
|
l |
Homeowner outreach |
|
Financial Services |
||
|
|
l |
Trustee foreclosure services |
|
|
l |
Mortgage charge-off and deficiency collections |
As of December 31, 2009, the net payable to Altisource was $7,345. For the period from August 10, 2009 through December 31, 2009, no charges were incurred under the transition services agreement with Altisource.
NOTE 31 REGULATORY REQUIREMENTS
Our business is subject to extensive regulation by federal, state and local governmental authorities, including the Federal Trade SEC and the state agencies that license our servicing and collection entities. We also must comply with a number of federal, state and local consumer protection laws, including, among others, the Gramm-Leach-Bliley Act, the Fair Debt Collection Practices Act, the Real Estate Settlement Procedures Act, the Truth in Lending Act, the Fair Credit Reporting Act and the Homeowners Protection Act. These statutes apply to debt collection, foreclosure and claims handling, investment of and interest payments on escrow balances and escrow payment features, and they mandate certain disclosures and notices to borrowers. These requirements can and do change as statutes and regulations are enacted, promulgated or amended.
We are also subject to licensing and regulation as a mortgage service provider and/or debt collector in a number of states. We are subject to audits and examinations that are conducted by the states. From time to time, we receive requests from state and other agencies for records, documents and information regarding our policies, procedures and practices regarding our loan servicing and debt collection business activities.
Effective June 30, 2005, we voluntarily terminated our status as a federal savings bank, a process we refer to as “debanking.” Prior to returning our original thrift charter to the Office of Thrift Supervision (OTS), we operated as a federal savings bank, and OCN was a registered savings and loan holding company. Our primary regulatory authority was the OTS.
Following debanking, we continued the Bank’s non-depository businesses, including its residential mortgage servicing business, under OLS, a licensed mortgage servicer in all 50 states, the District of Columbia and two U.S. territories. We entered into various agreements to obtain the approval of our regulator, the Office of Thrift Supervision (OTS), for our debanking plan. We directly or indirectly received assignment of all of the assets, liabilities and business remaining after the consummation of the debanking transactions (the Assignment). We entered into an agreement (the Guaranty) in favor of the OTS and any holders of claims with respect to the liabilities we assumed in connection with the Assignment. The Guaranty contains affirmative covenants relating to the maintenance of a $5,000 cash collateral account, reporting requirements, transactions with affiliates, preservation of the existence of our subsidiaries and maintenance of not less than $35,000 of unencumbered financial assets. As of December 31, 2009, we were in compliance with all of the covenants specified in the Guaranty.
F-47
The Guaranty also contains negative covenants that restrict our ability to (i) incur indebtedness if certain financial ratios are not achieved or if we fail to maintain a specified minimum net worth, (ii) enter into merger transactions or a sale of substantially all of our assets, (iii) sell, lease, transfer or otherwise dispose of our assets, or (iv) pay dividends or acquire our capital stock. We agreed not to declare or pay any dividends on or acquire any of our capital stock or other ownership interests or make any distributions or return of capital to our stockholders, partners or members, except for (i) such dividends or distributions that are payable only in OCN’s common stock or (ii) such declarations, dividends, acquisitions, distributions or returns of capital in cash or other property if we maintain a minimum net worth of $333,000 and rating of B2 from Moody’s and B- from S&P on our unsecured, non credit-enhanced debt and any such capital distributions do not exceed our consolidated net income for the year plus our retained earnings for the two preceding years.
The Guaranty will remain in effect until the later of (a) the sixth anniversary of the date on which the Bank’s federal bank charter was cancelled or (b) the date on which we have paid in full (i) any obligations that arise out of certain assumed liabilities with respect to which a claim has been asserted on or prior to the sixth anniversary of the date on which our federal bank charter was cancelled and (ii) all other amounts payable by us under the Guaranty.
There are a number of foreign regulations that are applicable to our operations in India, including acts that govern licensing, employment, safety, taxes, insurance, and the basic law which governs the creation, continuation and the winding up of companies as well as the relationships between the shareholders, the company, the public and the government. The Central Act is applicable to all of India, while various state acts may be applicable to certain locations in India.
NOTE 32 COMMITMENTS AND CONTINGENCIES
Litigation
We are named as a defendant in lawsuits brought in various federal and state courts challenging the Bank’s mortgage servicing practices, including charging improper or unnecessary fees, misapplying borrower payments, etc. In April 2004, our petition was granted to transfer and consolidate a number of lawsuits filed against the Bank, OCN and various third parties into a single proceeding pending in the United States District Court for the Northern District of Illinois (the MDL Proceeding). Additional lawsuits similar to the MDL proceeding have been brought in other courts, some of which may be transferred to and consolidated in the MDL Proceeding. The borrowers in many of these lawsuits seek class action certification. Others have brought individual actions. No class has been certified in the MDL Proceeding or any related lawsuits. In April 2005, the trial court entered a partial summary judgment in favor of defendants holding that plaintiffs’ signed loan contracts authorized the collection of certain fees by Ocwen as servicer for the related mortgages. In May 2006, plaintiffs filed an amended complaint containing various claims under several federal statutes, state deceptive trade practices statutes and common law. No specific amounts of damages are asserted, however, plaintiffs may amend the complaint to seek damages should the matter proceed to trial. In June 2007, the United States Court of Appeals for the Seventh Circuit issued an opinion holding that many of the claims were preempted or failed to satisfy the pleading requirements of the applicable rules of procedure and directing the trial judge to seek clarification from the plaintiffs so as to properly determine which particular claims are to be dismissed. In March 2009, the trial court struck the amended complaint in its entirety on the grounds of vagueness. Plaintiffs filed a third amended complaint on April 20, 2009. Ocwen has moved to dismiss the third amended complaint. The motion is fully briefed and pending decision by the trial court. We believe the allegations in the MDL Proceeding are without merit and will continue to vigorously defend against them.
In November 2004, a final judgment was entered in litigation brought by Cartel Asset Management, Inc. (Cartel) against OCN, the Bank and Ocwen Technology Xchange, Inc. (OTX), a subsidiary that has been dissolved. This matter involved allegations of misappropriation of trade secrets and contract-related claims brought by a former vendor. Initially, a jury verdict awarded damages of $9,320. However, the November 2004 judgment by the trial court awarded $520 against OTX and nominal damages of two dollars against the Bank. Additionally, the Bank was assessed a statutory award to Cartel for attorneys’ fees in an additional amount of $170. The Bank and OTX were further assessed costs in the amount of $9. In September 2007, the United States Court of Appeals for the Tenth Circuit upheld the damage award against OTX and remanded the case for a new trial on damages against the Bank. In December 2007, we paid the full amount of the judgment against OTX, including accrued interest. In March 2008, the trial court entered an order joining OLS, as the Bank’s successor-in-interest, and OCN, as guarantor of the Bank’s obligations, as additional defendants. The trial court has set a date of September 13, 2010 for the new trial against the Bank, OLS and OCN. We do not believe that Cartel is entitled to additional damages, if any, in an amount that would be material to our financial condition, results of operations or cash flows, and we intend to continue to vigorously defend against this matter.
F-48
In September 2006, the Bankruptcy Trustee in Chapter 7 proceedings involving American Business Financial Services, Inc. (ABFS) brought an action against multiple defendants, including OLS, in Bankruptcy Court. The action arises out of Debtor-in-Possession financing to ABFS by defendant Greenwich Capital Financial Products, Inc. and the subsequent purchases by OLS of MSRs and certain residual interests in mortgage-backed securities previously held by ABFS. OLS brought a separate action against the Trustee seeking damages of approximately $2,500 arising out of the ABFS MSRs purchase transaction. OLS’ separate action against the Trustee was dismissed by agreement without prejudice with the right to replead such claims or otherwise file a separate action should the Trustee’s action be dismissed. In February 2007, the court granted OLS’ motion to dismiss some claims but refused to dismiss others. The Trustee filed an amended complaint in March 2007. This complaint sets forth claims against all of the original defendants. The claims against OLS include turnover, fraudulent transfers, accounting, breach of fiduciary duty, aiding and abetting breach of fiduciary duty, breach of contract, fraud, civil conspiracy and conversion. The Trustee seeks compensatory damages in excess of $100,000 and punitive damages jointly and severally against all defendants. In March 2008, the court denied OLS’ motion to dismiss. In April 2008, OLS filed an answer denying all charges and a counterclaim for breach of contract, fraud, negligent misrepresentation and indemnification in connection with the MSR purchase transaction. Fact discovery is complete and both Ocwen and the Trustee have filed motions for partial summary judgment. We believe that the Trustee’s allegations against OLS are without merit and intend to continue to vigorously defend against this matter.
OCN commenced separate arbitrations before the Financial Industry Regulatory Authority against certain Broker/Dealers primarily alleging fraud, breach of duty and statutory violations arising out of the sale of AAA-rated student loan auction rate securities (SLARS) backed by the Federal Family Education Loan Program. In October 2009 and subsequently in early 2010, we settled these arbitration proceedings for cash proceeds. See Note 34.
OCN is subject to various other pending legal proceedings. In our opinion, the resolution of those proceedings will not have a material effect on our financial condition, results of operations or cash flows.
Tax matters
On December 28, 2006, the India tax authorities issued an income tax assessment order (the Order) with respect to IT Enabled services performed for OCN by its wholly-owned Indian subsidiary, OFSPL. The Order relates to the assessment year 2004-05 and determined that the percent mark-up on operating costs with respect to the IT enabled and software development services that OFSPL provided to OCN was insufficient. The proposed adjustment would impose upon OFSPL additional tax of INR 45,290 ($970) and interest of INR 14,922 ($320) for the Assessment Year 2004-05. On December 15, 2008, the India tax authorities issued an additional income tax assessment order (the Second Order) with respect to assessment year 2005-06. The proposed adjustment would impose upon OFSPL additional tax of INR 23,225 ($498) and interest of INR 10,200 ($218) for the Assessment Year 2005-06. In accordance with standard Indian procedures, penalties may also be assessed in the future in connection with the assessment.
OCN and OFSPL intend to vigorously contest the Order, the Second Order and the imposition of tax and interest and do not believe they have violated any statutory provision or rule. OFSPL has filed domestic appeals with the India Commissioner of Income Tax (Appeals) in response to the Order and Second Order. On March 16, 2007, OCN filed a request for Competent Authority Assistance with the Internal Revenue Service under the United States – India Income Tax Treaty. On January 23, 2009, OCN filed a request with the Internal Revenue Service to include Assessment Year 2005-2006 in its Competent Authority case.
Due to the uncertainties inherent in the Appeals and Competent Authority processes, OCN and OFSPL cannot currently estimate any additional exposure beyond the amount detailed in the Order. We also cannot predict when these tax matters will be resolved. The Competent Authority Assistance filing should preserve OCN’s right to credit any potential India taxes against OCN’s U.S. taxes.
F-49
Commitments and Other
We lease certain of our premises and equipment under non-cancelable operating leases with terms expiring through 2018 exclusive of renewal option periods. Our annual aggregate minimum rental commitments under these leases are summarized as follows:
|
|
|
|
|
|
|
2010 |
|
$ |
2,559 |
|
|
2011 |
|
|
2,329 |
|
|
2012 |
|
|
1,196 |
|
|
2013 |
|
|
475 |
|
|
2014 |
|
|
489 |
|
|
Thereafter |
|
|
2,109 |
|
|
|
|
|
||
|
Total minimum lease payments |
|
$ |
9,157 |
|
|
|
|
|
We converted rental commitments for our facilities outside the United States of America to U.S. dollars using exchange rates in effect at December 31, 2009. Rent expense for 2009, 2008 and 2007 was $6,156, $7,815 and $6,530, respectively.
|
|
|
|
NOTE 33 |
QUARTERLY RESULTS OF OPERATIONS (UNAUDITED) |
|
|
|
|
|
|
|
|
|
|
|
|
|
|
|
|
|
|
Quarters Ended |
|
||||||||||
|
|
|
|
|||||||||||
|
|
|
December 31, |
|
September 30, |
|
June 30, |
|
March 31, |
|
||||
|
|
|
|
|
|
|
||||||||
|
Revenue |
|
$ |
72,748 |
|
$ |
84,211 |
|
$ |
109,179 |
|
$ |
114,590 |
|
|
Operating expenses |
|
|
36,506 |
|
|
54,232 |
|
|
72,650 |
|
|
72,266 |
|
|
|
|
|
|
|
|
||||||||
|
Income from operations |
|
|
36,242 |
|
|
29,979 |
|
|
36,529 |
|
|
42,324 |
|
|
Other expense |
|
|
(16,048 |
) |
|
(6,521 |
) |
|
(10,184 |
) |
|
(19,060 |
) |
|
|
|
|
|
|
|
||||||||
|
Income from continuing operations before income taxes |
|
|
20,194 |
|
|
23,458 |
|
|
26,345 |
|
|
23,264 |
|
|
Income tax expense |
|
|
13,307 |
|
|
65,294 |
|
|
9,472 |
|
|
8,037 |
|
|
|
|
|
|
|
|
||||||||
|
Income (loss) from continuing operations |
|
|
6,887 |
|
|
(41,836 |
) |
|
16,873 |
|
|
15,227 |
|
|
Income (loss) from discontinued operations, net of taxes |
|
|
2,488 |
|
|
(231 |
) |
|
1,052 |
|
|
(188 |
) |
|
|
|
|
|
|
|
||||||||
|
Net income (loss) |
|
|
9,375 |
|
|
(42,067 |
) |
|
17,925 |
|
|
15,039 |
|
|
Net loss (income) attributable to non-controlling interest in subsidiaries |
|
|
14 |
|
|
36 |
|
|
(95 |
) |
|
70 |
|
|
|
|
|
|
|
|
||||||||
|
Net income (loss) attributable to OCN |
|
$ |
9,389 |
|
$ |
(42,031 |
) |
$ |
17,830 |
|
$ |
15,109 |
|
|
|
|
|
|
|
|
||||||||
|
|
|
|
|
|
|
|
|
|
|
|
|
|
|
|
Basic earnings per share: |
|
|
|
|
|
|
|
|
|
|
|
|
|
|
Income (loss) from continuing operations |
|
$ |
0.07 |
|
$ |
(0.51 |
) |
$ |
0.25 |
|
$ |
0.24 |
|
|
Income (loss) from discontinued operations |
|
|
0.02 |
|
|
— |
|
|
0.01 |
|
|
— |
|
|
|
|
|
|
|
|
||||||||
|
Net income (loss) attributable to OCN |
|
$ |
0.09 |
|
$ |
(0.51 |
) |
$ |
0.26 |
|
$ |
0.24 |
|
|
|
|
|
|
|
|
||||||||
|
|
|
|
|
|
|
|
|
|
|
|
|
|
|
|
Diluted earnings per share: |
|
|
|
|
|
|
|
|
|
|
|
|
|
|
Income (loss) from continuing operations |
|
$ |
0.07 |
|
$ |
(0.51 |
) |
$ |
0.24 |
|
$ |
0.24 |
|
|
Income (loss) from discontinued operations |
|
|
0.02 |
|
|
— |
|
|
0.02 |
|
|
— |
|
|
|
|
|
|
|
|
||||||||
|
Net income (loss) attributable to OCN |
|
$ |
0.09 |
|
$ |
(0.51 |
) |
$ |
0.26 |
|
$ |
0.24 |
|
|
|
|
|
|
|
|
||||||||
F-50
|
|
|
|
|
|
|
|
|
|
|
|
|
|
|
|
|
|
Quarters Ended |
|
||||||||||
|
|
|
|
|||||||||||
|
|
|
December 31, |
|
September 30, |
|
June 30, |
|
March 31, |
|
||||
|
|
|
|
|
|
|
||||||||
|
Revenue |
|
$ |
111,391 |
|
$ |
121,261 |
|
$ |
131,225 |
|
$ |
128,251 |
|
|
Operating expenses |
|
|
76,556 |
|
|
77,458 |
|
|
81,266 |
|
|
88,075 |
|
|
|
|
|
|
|
|
||||||||
|
Income from operations |
|
|
34,835 |
|
|
43,803 |
|
|
49,959 |
|
|
40,176 |
|
|
Other income (expense) |
|
|
(38,792 |
) |
|
(20,393 |
) |
|
(46,847 |
) |
|
(31,759 |
) |
|
|
|
|
|
|
|
||||||||
|
Income (loss) from continuing operations before income taxes |
|
|
(3,957 |
) |
|
23,410 |
|
|
3,112 |
|
|
8,417 |
|
|
Income tax expense (benefit) |
|
|
313 |
|
|
8,330 |
|
|
424 |
|
|
2,939 |
|
|
|
|
|
|
|
|
||||||||
|
Income (loss) from continuing operations |
|
|
(4,270 |
) |
|
15,080 |
|
|
2,688 |
|
|
5,478 |
|
|
Loss from discontinued operations, net of taxes |
|
|
(195 |
) |
|
(186 |
) |
|
(5,182 |
) |
|
(204 |
) |
|
|
|
|
|
|
|
||||||||
|
Net income (loss) |
|
|
(4,465 |
) |
|
14,894 |
|
|
(2,494 |
) |
|
5,274 |
|
|
Net loss (income) attributable to non-controlling interest in subsidiaries |
|
|
184 |
|
|
82 |
|
|
(223 |
) |
|
(2 |
) |
|
|
|
|
|
|
|
||||||||
|
Net income (loss) attributable to OCN |
|
$ |
(4,281 |
) |
$ |
14,976 |
|
$ |
(2,717 |
) |
$ |
5,272 |
|
|
|
|
|
|
|
|
||||||||
|
|
|
|
|
|
|
|
|
|
|
|
|
|
|
|
Basic earnings per share |
|
|
|
|
|
|
|
|
|
|
|
|
|
|
Income (loss) from continuing operations |
|
$ |
(0.07 |
) |
$ |
0.24 |
|
$ |
0.04 |
|
$ |
0.09 |
|
|
Income (loss) from discontinued operations |
|
|
— |
|
|
— |
|
|
(0.08 |
) |
|
(0.01 |
) |
|
|
|
|
|
|
|
||||||||
|
Net income (loss) attributable to OCN |
|
$ |
(0.07 |
) |
$ |
0.24 |
|
$ |
(0.04 |
) |
$ |
0.08 |
|
|
|
|
|
|
|
|
||||||||
|
|
|
|
|
|
|
|
|
|
|
|
|
|
|
|
Diluted earnings per share |
|
|
|
|
|
|
|
|
|
|
|
|
|
|
Income (loss) from continuing operations |
|
$ |
(0.07 |
) |
$ |
0.23 |
|
$ |
0.04 |
|
$ |
0.09 |
|
|
Income (loss) from discontinued operations |
|
|
— |
|
|
— |
|
|
(0.08 |
) |
|
(0.01 |
) |
|
|
|
|
|
|
|
||||||||
|
Net income (loss) attributable to OCN |
|
$ |
(0.07 |
) |
$ |
0.23 |
|
$ |
(0.04 |
) |
$ |
0.08 |
|
|
|
|
|
|
|
|
||||||||
|
|
|
|
NOTE 34 |
SUBSEQUENT EVENTS |
On January 21, 2010 and March 4, 2010, we negotiated settlements of two of our auction rate securities litigation actions. Under the terms of these settlements, the Broker/Dealers repurchased $103,625 par value of auction rate securities for cash proceeds of $92,775. We recognized no gain or loss on these negotiated settlements. Proceeds from one settlement were used to pay down the investment line.
On January 29, 2010, we repurchased $12,930 face amount of our Capital Trust Securities for a gain of $717.
On February 5, 2010, we sold auction rate securities with a par value of $33,350 for cash proceeds of $29,865. We recognized no gain or loss on this sale. The proceeds from this sale were used to pay down the investment line.
On February 11, 2010, we exercised a portion of our option to sell auction rate securities with a par value of $88,150. We continue to retain a liquidity option in respect of $3,500 par value of auction rate securities. As described in Note 5—Trading Securities—Auction Rate Securities, this sale was recognized as a secured borrowing because of our ability to repurchase the same securities until the maturity of the liquidity option in October 2012. We continue to report these auction rate securities, with a fair value of $86,504 as of December 31, 2009, on the balance sheet. However, these securities are pledged to collateralize a $74,928 borrowing, reflecting the proceeds received upon exercise of the option. We will no longer receive cash interest income on the pledged securities nor will we pay cash interest on this secured borrowing.
On February 12, 2010, we issued $200,000 of notes under the Term Asset Lending Facility (TALF) program. These notes are secured by servicing advances and are scheduled to begin amortizing in 12 months with a final maturity date of September 2023. The interest rate on the notes is fixed at 3.59%.
On February 17, 2010, we used the proceeds from the exercise of the February 11, 2010 liquidity option and an additional $4,039 cash to repay the investment line. As of December 31, 2009, the carrying value of the investment line was $156,968. The investment line was paid off and the remaining auction rate securities, excluding those subject to the secured borrowing incurred under the liquidity option, are no longer pledged as collateral. The fair value of these remaining auction rate securities is $38,083 ($38,800 par value) at December 31, 2009.
F-51