Attached files
| file | filename |
|---|---|
| 8-K - FORM 8-K - Chaparral Energy, Inc. | d8k.htm |
 $300mm Senior Notes due 2020
September 2010
$300mm Senior Notes due 2020
September 2010
Exhibit 99.1 |
 Company information
2
2
701 Cedar Lake Blvd.
Oklahoma City, Oklahoma 73114
Phone: 405.478.8770
Fax: 405.478.1947
www.chaparralenergy.com
This presentation contains "forward-looking statements"
within the meaning of Section 27A of the Securities Act of 1933, as amended, and Section 21E of the Securities Exchange Act of 1934, as
amended. These forward-looking statements are subject to
certain risks, trends and uncertainties that could cause actual results to differ materially from those projected. Among those risks, trends
and uncertainties are our ability to find oil and natural gas reserves
that are economically recoverable, the volatility of oil and natural gas prices and significantly depressed natural gas prices since
the middle of 2008, the uncertain economic conditions in the United
States and globally, the decline in the values of our properties that have resulted in and may in the future result in additional
ceiling test write-downs, our ability to replace reserves and sustain
production, our estimate of the sufficiency of our existing capital sources, our ability to raise additional capital to fund cash
requirements for future operations, the uncertainties involved in
prospect development and property acquisitions or dispositions and in projecting future rates of production or future reserves, the
timing of development expenditures and drilling of wells, hurricanes and
other natural disasters, including the impact of the oil spill in the Gulf of Mexico on our present and future operations, the
impact of government regulation, and the operating hazards attendant to
the oil and natural gas business. In particular, careful consideration should be given to cautionary statements made in the
various reports we have filed with the Securities and Exchange
Commission. We undertake no duty to update or revise these forward-looking statements. |
 3
3
Presenters
Presenters
Joe Evans, Chief Financial Officer
& Executive Vice President
Mark Fischer, Chief Executive Officer
& President |
 4
4
Sources and uses and pro forma capitalization
Sources and uses and pro forma capitalization
Sources
Uses
New senior unsecured notes
$300.0
Repay revolver
$172.0
Cash to balance sheet
121.0
Estimated fees and expenses
7.0
Total sources
$300.0
Total uses
$300.0
Capitalization as of June 30, 2010 ($ millions)
Existing
Pro forma
% of cap.
xLTM
Adj. EBITDA
Cash and cash equivalents
$16.0
$137.0
--
--
Senior secured revolving credit facility due 2014
172.0
--
--
--
Other installment notes and capital leases
20.5
20.5
1.5%
0.1x
Total senior secured debt
192.5
20.5
1.5%
0.1x
8.500% senior unsecured notes due 2015
325.0
325.0
24.3%
1.3x
8.875% senior unsecured notes due 2017
323.0
323.0
24.2%
1.2x
New senior unsecured notes due 2020
--
300.0
22.5%
1.1x
Total debt
$840.5
$968.5
72.5%
3.7x
Net debt
824.5
831.5
62.2%
3.2x
Book value of equity
367.3
367.3
27.5%
1.4x
Total book capitalization
$1,207.8
$1,335.8
100.0%
5.1x
Debt/Reserves ($/Boe)
$5.92
$6.83
Debt/Proved developed reserves ($/Boe)
$8.95
$10.31
Net Debt/Reserves ($/Boe)
$5.81
$5.85
Net Debt/Proved developed reserves ($/Boe)
$8.78
$8.86
Liquidity:
Borrowing base
$450.0
$375.0
Plus: cash
16.0
137.0
Less: revolver drawn(and LC’s)
(173.9)
(1.9)
Total liquidity
$292.1
$510.1
1
As of 6/30/2010; source: 10-Q
2
Based on LTM 6/30/2010 Adjusted EBITDA of $263.0mm
1
2 |
 Key
Transformational Events Key Transformational Events
5
5 |
 CCMP’s
investment enhances Chaparral’s
position to execute its growth strategy
CCMP’s
investment enhances Chaparral’s
position to execute its growth strategy
Key Transformational Event
On April 12, 2010, Chaparral completed a $325 million private equity common stock
investment
in
the
company
–
from
CCMP
Capital
Advisors
The above transaction combined with the proposed offering will result in:
Significant liquidity
Improved financial flexibility & stability
Financial capacity to execute on Chaparral’s operational plan
Executive Summary: Private Equity
6
6
¹Based on 12/31/2009 SEC Reserves
Credit Statistics
12/31/2009
6/30/2010 Post-CCMP
Investment
Total Leverage (“TL”) ($mm)
$1,177.0
$840.5
TL / Proved Reserves ($/BOE)¹
$8.29
$5.92
TL / Proved Developed Reserves ($/BOE)¹
$12.53
$8.95
TL / LTM EBITDAX (x)
5.3x
3.2x
Liquidity ($mm)
$76.6
$292.1 |
 CCMP
Capital – Leading Equity Sponsor
CCMP Capital –
Leading Equity Sponsor
CCMP and its predecessor firm (JP Morgan
Partners) have been leading private equity
sponsors since 1984
CCMP currently manages $7.2 billion in assets
across a broad portfolio of companies in
Energy as well as Media, Consumer / Retail,
Industrial and Healthcare
CCMP’s proprietary operating capabilities
enable management teams to drive
operational efficiency, growth and profitability
CCMP appointed partners Karl Kurz (former
COO of Anadarko Petroleum) and Chris
Behrens to the board
Past Energy Investments:
Latigo Petroleum
Bill Barrett Corporation
Encore Acquisition
Carrizo Oil and Gas
Patina Oil and Gas
CCMP Capital
Karl Kurz
7
7
Karl Kurz is a Managing Director in the
Houston office of CCMP Capital and a
member of the firm’s Investment Committee.
Before joining CCMP in 2009, he was Chief
Operating Officer of Anadarko Petroleum
Corporation, where he oversaw the
Company’s global exploration and production,
marketing, midstream, land, technology and
services.
He was a member of the Company’s Executive
Committee from 2004 to 2009.
Chris Behrens
Chris Behrens is Managing Director in the New
York office of CCMP Capital and a member of
the firm’s Investment Committee.
Since joining CCMP in 1994, Chris has
overseen the firm’s E&P and energy investing.
|
 Governance based on a partnership approach to
development/growth of the Company
Governance based on a partnership approach to
development/growth of the Company
Ownership
Fischer
Investments
-
25.54%
Altoma
energy –
14.98%
Chesapeake Energy –
19.98%
CCMP
Advisors
–
35.98%
Employees
-
3.52%
(includes
MAF
at
1.08%)
CCMP
Approval
Rights
include:
Incur or refinance indebtedness in excess of
$100 million in any year
Approval of Annual Budget and Capex
in excess
of cash flow and material deviations
Mergers and acquisitions over $100 million/year
Material changes to senior management
Issue equity outside of a Demand IPO
Distribute dividends
Enter a new business
Right to require sale of the Company after 6 yrs
8
8
Mark A. Fischer
25.5%
CCMP Capital
Advisors
36.0%
Altoma
Energy G.P.
15.0%
Employee
Ownership
3.5%
CHK Holdings,
L.L.C.
20.0%
Ownership Summary
Chaparral Rights
Operational control over expenditures within
cash flow
Demand IPO after 18 months if value exceeds
1.75x CCMP purchase price
Right to make acquisitions up to $100 million
Blocking right on sale of Company for 6 years |
 Business Update
9
9 |
 Chaparral’s strategy is focused on capital efficiency,
operational improvement and production growth
Chaparral’s strategy is focused on capital efficiency,
operational improvement and production growth
Over
the past few months, Chaparral has begun executing on its operational
objectives: Prioritized and accelerated conventional drilling program
Increased focus on EOR planning and development strategies and securing additional
CO
2
supply
Increased production growth rate
Executed on tuck-in acquisitions where Chaparral can enhance operations,
production and reserves
Management continued to focus on risk management through hedges
Executive Summary: Strategy
10
10 |
 Chaparral’s assets provide stability, predictability
and growth potential
Chaparral’s assets provide stability, predictability
and growth potential
Chaparral’s proved reserves are oil-weighted
Chaparral’s proved reserves are 63% crude oil and 37% natural gas
Long-lived assets with predictable cash flow profile
Company has an R/P of 18.6 years
Large, focused asset base with attractive play-level economics
90% of Chaparral’s proved reserves are in the Mid-Continent and Permian
Basins with 8.8% decline rate from 2010 to 2023
14% of Chaparral’s proved reserves are from low risk Enhanced Oil Recovery
(EOR) Program
Significant near term growth potential from developmental drilling
Executive Summary: Assets Overview
11
11
* Based on 12/31/2009 SEC reserves and 2009 production
|
 12
12
Operating Areas
Operating Areas
As of December 31, 2009 (SEC)
Core Area
Growth Area
Acreage
Field Offices
Headquarters
North Texas
Reserves: 2.4 MMBoe, 2% of total
Production: 0.4 Mboe/d, 2% of total
Acreage (gross / net): 26,254 / 18,360
Permian Basin
Reserves: 16.2 MMBoe, 11% of total
Production: 4.4 Mboe/d, 21% of total
Acreage (gross / net): 90,063 / 66,285
Rocky Mountains
Reserves: 2.2 MMBoe, 1% of total
Production: 0.4 MBoe/d, 2% of total
Acreage (gross / net): 52,088 / 18,532
Company Total
December
2009
proved
reserves
–
142
MMBoe
2009
average
daily
production
–
21
MBoe/d
Acreage (gross / net): 1,248,929 / 620,557
Gulf Coast
Reserves: 6.8 MMBoe, 5% of total
Production: 1.3 MBoe/d, 6% of total
Acreage (gross / net): 98,902 / 63,367
Mid-Continent
Reserves: 111.6 MMBoe, 79% of total
Production: 13.7 MBoe/d, 66% of total
Acreage (gross / net): 959,256 / 443,907
Ark-La-Tex
Reserves: 2.7 MMBoe, 2% of total
Production: 0.7 MBoe/d, 3% of total
Acreage (gross / net): 22,366 / 10,106
Val Verde
Basin
Sabine
Uplift
Midland
Basin
Delaware
Basin
Ouachita
Uplift
Arkoma
Basin
Fort
Worth
Basin
Williston
Basin
Powder
River
Basin
Greater
Green
River
Basin
San
Juan
Basin
Anadarko
Woodford
Basin
OKC |
 Strong Record of Reserve and Production Growth
Year-End SEC Reserves (MMBoe)
(1)(2)
141466
51
73
103
151
164
113
0
25
50
75
100
125
150
175
2003
2004
2005
2006
2007
2008
2009
2003 –
2009 CAGR = 19%
Annual Production (MMBoe)
2.6
3.2
4.2
5.4
6.8
7.1
7.6
8.2
0
2
4
6
8
10
12
2003
2004
2005
2006
2007
2008
2009
2010E
2003 –
2009 CAGR = 20%
142
Note:
1)Reserves
as
of
December
31,
2008
are
based
on
flat
SEC
pricing
of
$44.60/Bbl
and
$5.62.Mcf
2)Reserves
as
of
December
31,
2009
are
based
on
flat
SEC
pricing
of
$61.18/Bbl
and
$3.87/Mcf
Chaparral’s reserve replacement ratio has averaged 514% per year since
2002 13
13 |
 PV-10 Value ($Billions)
Reserve Price Sensitivity
Reserve Price Sensitivity
Note:
1) New
SEC
pricing
method
-
$61.18
oil
and
$3.87
gas
2) Old
SEC
pricing
method
-
$79.36
oil
and
$5.79
gas
3) 01/14/2010
Nymex
Strip
–
Avg
14
14
December 31, 2009 Reserves (MMBoe)
0
50
100
150
200
New SEC
Pricing Method
Old SEC
Pricing Method
Flat Pricing
$60 and $6
01/14/2010
Nymex Strip
PD
PUD
142
158
153
161
$0.0
$1.0
$2.0
$3.0
New SEC
Pricing Method
Old SEC
Pricing Method
Flat Pricing
$60 and $6
01/14/2010
Nymex Strip
PD
PUD
$1.3
$2.2
$1.6
$2.7 |
 Stable Base and Growth Potential
Stable Producing Base
Long-lived reserve base
•
8.8% projected annual
decline in PDP production
from
2010
to
2023
(1)
63% oil concentration (SEC
pricing)
66% proved developed
reserves
86% of proved reserves
operated
76% of PDP production
hedged over the next 16
months to stabilize cash flow
Highly diversified production
across fields (8,174 wells)
Note:
1)
Percent
decline
is
average
annual
decline
rate
of
PDP
production
from
third-party
reserve
reports
Low-Risk Long-Term
Upside
Significant Near-Term
Growth
213 MMbo
potentially
recoverable through EOR
properties
Reserve
growth
through
CO
2
infrastructure
Woodford Shale
developments
3,485 identified additional
potential drilling locations
16-year inventory of drilling
locations at 2010 drilling rate
of 299 wells (150 operated
wells and 149 outside
operated wells)
299
wells
planned
for
2010
with
expected
net
exit
rate
production
of
6.9
MBoepd
Low-risk
infill
or
step-out
wells
(99%
success
rate
in
2007-
2009)
1,333 identified proved
undeveloped
drilling
locations
•
Primarily focused on the
Mid-Continent
region
with
1,061 locations
Undeveloped
acreage:
84,396
net acres
15
15 |
 16
16
Capital Budget
Capital Budget
Component
2006
2007
2008
2009
2010
Forecast
2010 -
%
Drilling
134
121
176
83
171
55%
Enhancements
31
44
55
35
27
9%
Acquisitions
(2)
489
50
46
18
46
15%
Tertiary
Recovery
13
15
25
15
66
21%
Total
667
230
302
151
310
100%
Note:
(1) Includes allocation of capitalized general and administrative
costs (2) 2006 Includes major acquisition of Calumet Oil Company
2010E Oil and Gas Capital Expenditures
2010E Drilling CAPEX by Major Plays ($MM)
Conventional Drilling
EOR Drilling
Oil
&
Gas
Capital
Expenditures
($MM)
(1)
Drilling
EOR
Enhancements
Acquisitions
Mid-Continent
Other
Gulf Coast
Permian
Basin
63%
12%
15%
18%
7%
9%
55%
21% |
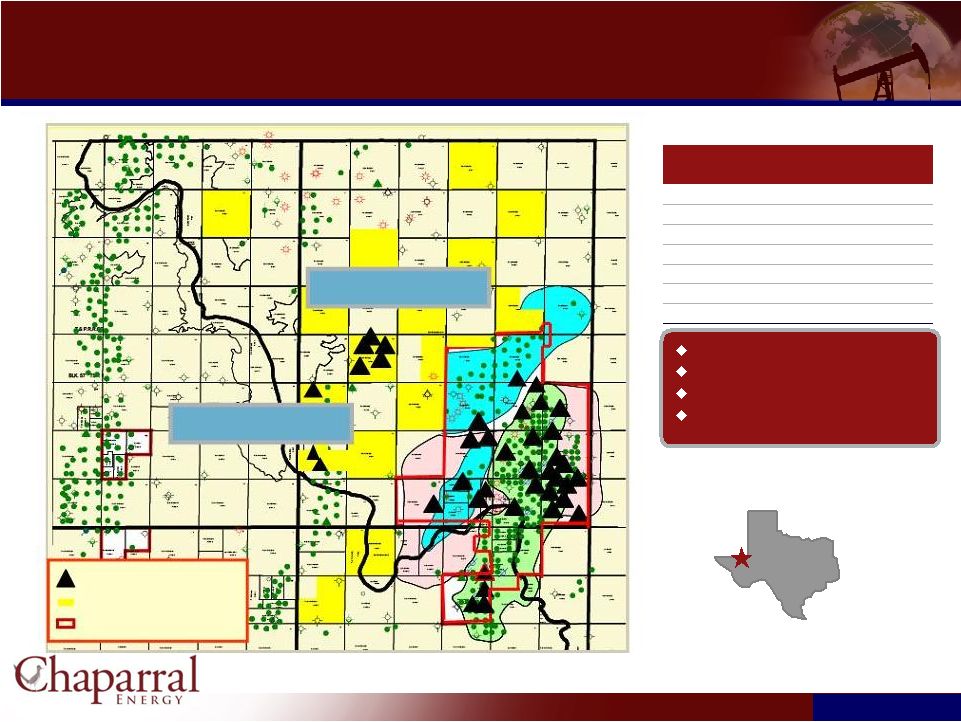
 Cleveland Sand Play
Ellis County Area
Horizontal drilling
Tight sand play
Depth:
7,900
–
9,700
feet
Scheduled to drill 16 wells in
2010
8
operated,
avg
WI
98%
8
non-op,
avg
WI
5%
Aledo-Bray Area
Gilson 2H-24, Chap Op with 100% WI
1.8 MMcf/d, 240 BOPD
State A 6H-36, Chap Op with 100% WI
2.8 MMcf/d, 250 BOPD
Bray #3-4H Chap Op 98%
IP 3.2 MMcf/d, 320 BOPD
Play Statistics
Gross reserves / well (MMboe):
0.2 –
0.4
Gross CapEx
/ well ($MM):
$3.5 -
$5.4
Chaparral net acres:
9,000
Avg
working interest:
66%
Potential drill locations:
89
ROR
39%
ROI
2.8
Robertson #3-34H Chap Op 100% WI
Recently completed
Bray #4-4H Chap Op 98% WI
Milton #3H-26 Recently Completed
Recently Drilled Wells
Proposed Wells
Sections w/Chap Interests
Robertson #4-34H Chap Op 100% WI
Recently completed
17
17 |
       18
18
(2)
Granite Wash Play
Granite Wash Play
Stiles Ranch Area
Colony Wash Area
Play Statistics
Gross reserves / well (MMboe):
0.7 –
1.3
Gross CapEx
/ well ($MM):
$6.4
Chaparral net acres:
12,634
Horizontal Drilling Depth
12,500’-14,500’
Potential drill locations:
46
Scheduled to drill 10 wells in 2010
ROR
41.9%
ROI
2.5
18
18 |
 North Burbank Unit
South Burbank Unit
FEET
0
12,441
PETRA 1/18/2010 4:24:50 PM
Osage And Creek Counties, OK
Osage And Creek Counties, OK
Osage County, OK
West Fairfax Chat
Play Statistics
Gross reserves / well (MMBoe):
0.1
Gross CapEx / well ($MM):
$.4
Chaparral net acres:
66,380
Avg working interest:
99.5%
Potential drill locations:
293
ROR
70%
ROI
3.2
Held by production
Leasehold
FEET
0
2,643
PETRA 1/18/2010 4:37:45 PM
SBU Area Burbank & Chat
FEET
0
1,471
19
19
Formations: Burbank, Miss. Chat
Producing Depth: 3,000 feet
1 company rig currently running
Scheduled to drill 55 operated wells in
2010 |
 Tunstill
Field Play
Tunstill
Field Play
Play Statistics
Gross reserves / well (MMBoe):
0.1
Gross CapEx
/ well ($MM):
$0.9
Chaparral net acres:
20,440
Avg
working interest:
100%
Potential drill locations:
253
ROR
41.3%
ROI
2.5
20
20
Delaware Basin
Multi-pay environment
Depth: 3200-5400 feet
Scheduled to drill 15 operated wells
in 2010
Loving Co.
Reeves Co.
Recently
Drilled
Locations
Farm-In
Acreage:
10,920
acres
Existing
Acreage:
9.400
acres
BELL CANYON SAND
CHERRY CANYON SAND |
 Haley
Play Area Haley Play Area
Bowdle
47-2, Chap Op & 98% WI
TD: 3Q08, IP 18.8 MMcfe/d
Haley 36-4, Chap Op, 91% WI, IP Aug ’06
IP: 8.1 MMcfe/d
Bowdle
47-4, Chap Op & 98% WI
TD: 1Q10, IP 18.0 MMcfe/d
Deep Drilling Locations
Drilling or Recent Completions
Chaparral Acreage
Atoka and Morrow Play
(17,500’
depth)
Expensive wells
High production rates
Large reserve potential
Haley 36-5, Chap op, 78% WI,
Next proposed location
Play Statistics
Atoka
Morrow
Gross reserves / well (MMBoe):
1.5
Gross CapEx
/ well ($MM):
$10.5
Chaparral net acres:
2,605
Avg
working interest:
78%
2010 Scheduled drill locations: (Operated)
1
ROR
22%
ROI
3.3
21
21 |
 Bone
Spring Play Bone Spring Play
22
22
Play Economics
(1)
200
–
400
MBoe
gross
per
well
Reservoir
depths
of
6,000’
to
13,500’
Completed well costs: $3
–
$5 million
Recent Industry Bone Springs Gross IPs
So. Calif. 29 Fed 15H:
1,100 Boe/d
Parkway St 17 Com 2H:
970 Boe/d
Blacktip
Johnson 1-39H:
872 Boe/d
Parkway St 14 Com 3H:
760 Boe/d
W. Shugart
31
3H: 560 Boe/d
Note: 1) Play economics sourced from Concho August 2010 presentation
Chaparral Acreage
Industry Completed Horizontal Wells
Industry Completed Vertical Wells |
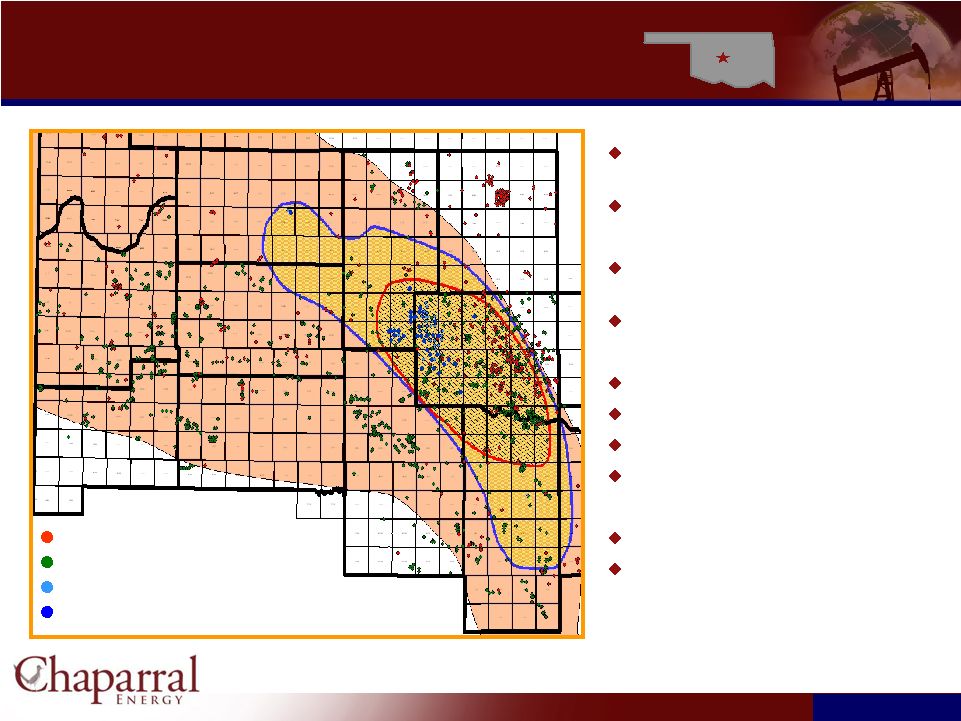 Anadarko Basin -
Woodford Shale
Anadarko Basin -
Woodford Shale
Chaparral Operated Wells
Chaparral Non-Operated Wells
Industry Recently Permitted or Currently Drilling Locations
Industry Completed Woodford Horizontal Wells
Ellis
Blaine
Dewey
Kingfisher
Grady
Caddo
Washita
Beckham
Roger Mills
Custer
Canadian
Chaparral’s Acreage
21,183 (+/-) net acres held by
production (HBP), 1,087 non-producing acres
Potential drilling locations 682 (160 net)
Play Economics
(1)
6.5
–
8.5
Bcfe
gross
per
well
with
4,000 foot lateral
Completed
well
costs:
$7
–
$9
million
Recent Industry Woodford Gross Ips
Kurtz 1-14H:
8.4 MMcfe/d
Guinn 1
–
10H:
7.1 MMcfe/d
Nuckols
1-31H:
6.4 MMcfe/d
Young 2-22H:
6.8 MMcfe/d
Drilling Activity
Expect to drill 1 operated well in 2010
Expect to drill 6 non-operated wells in 2010
23
23
Note: 1) Play economics sourced from Cimarex June 2010
presentation |
 Enhanced Oil Recovery Opportunities
Chaparral
utilizes
CO
2
and
polymer
EOR
techniques
CO
2
EOR
involves
injection
of
CO
2
and
water
to
enhance
hydrocarbon
mobility to drive hydrocarbons to wells
Polymer EOR improves areal sweep efficiency and minimizes channeling
The Oil is There
-
U.S. Oil -
24
24 |
 CO
2
EOR Focused Areas
CO
2
EOR Focused Areas
CO
2
project inventory
82 units with 1P, 2P & 3P EOR reserves
9 units with proved reserves
10 units with CO
2
injection
CO
2
Infrastructure
380 miles of existing line
49 MMcfe/d of CO2 supply
Includes connecting 12 -
15 MMcf/d
of CO2 from Arkalon
CO
2
Tertiary Recovery Projects
Panhandle Area
Permian Basin
Central
Oklahoma
Area
Burbank
Area
25
25 |
 26
26
Currently Owned CO
2
Development Potential and
Infrastructure
Currently Owned CO
2
Development Potential and
Infrastructure
Total OOIP
4,195 MMBO
Primary Production
714 MMBO
Secondary Recovery
638 MMBO
Tertiary Potential
403 MMBO
Net Tertiary Potential
215 MMBO
Existing
CELLC
CO
2
Pipelines
Existing
Third
Party
CO
2
Pipelines
Proposed
CELLC
CO
2
Pipelines
Owned
Active
CO
2
fields
Owned
Potential
CO
2
fields
CO
2
Source
Locations |
 Panhandle Area
27
27
Total OOIP
709.4 MMBO
Primary Production
73.8 MMBO
Secondary Recovery
116.5 MMBO
Tertiary Potential
73.7 MMBO
Net Tertiary Potential
42.6 MMBO
Existing CELLC CO
Pipelines
Proposed CELLC CO
Pipelines
CO
Pipelines of Others
Panhandle Area
Net Potential: 43 MMBoe, 20% of
total
Number of Projects in Area = 24
Core Projects:
Camrick
Area –
7.0 MMBO (Active)
Farnsworth –
10.4 MMBO
Booker
Area
–
2.0
MMBO
(Active)
RHF
Unit
–
4.0
MMBO
2
2
2 |
 Camrick
Area CO
2
Tertiary Recovery
Camrick
Area CO
2
Tertiary Recovery
Consists of three unitized fields
Operated with an average working interest of
54%
CO
2
injection has improved gross production in
Camrick
Area from 175 Bbls/day to 1,950
Bbls/day
Expansion of CO
2
injection operations from 15
MMcfpd
to 25 MMcfpd
has been completed
NW Camrick, Camrick
and Perryton Units: 8/8 Basis
Reservoir
Morrow
Net Acreage
15,200
OOIP (MMBO)
125.6
Primary oil recovery (MMBO)
16.6
Secondary oil recovery (MMBO)
13.9
Estimated tertiary CO
2
recovery (MMBO)
14.4
Beaver & Texas Counties, OK
Lipscomb County, TX
Camrick
Area, OK
Projected and Actual Response
28
28 |
 Burbank Area Potential CO
2
Projects
Burbank Area Potential CO
2
Projects
Total OOIP
1,205 MMBO
Primary Production
257 MMBO
Secondary Recovery
199 MMBO
Tertiary Potential
119 MMBO
Net Tertiary Potential
98 MMBO
Burbank Area
Net
Potential:
98
MMBoe,
46%
of
total
Number of Projects in Area= 17
Core Projects:
North
Burbank
Unit
–
71.6
MMBO
South
Burbank
Unit
-
9.5
MMBO
29
29 |
 WI
–
99.25%
(operated
property)
Size –
23,080 acres; Depth -
3,000’
Cum.
Rec.
–
317
MMBO
(primary
&
secondary
recovery)
Producing
zone
-
Burbank
reservoir
–
2
zones
Wells -
275 producing, 205 injection, 472 TA.
Upside Potential
Polymer EOR
Phillips instituted polymer EOR Program from 1980-1986 as
pilot area
1,440 acres
Production increased from 500 BOPD to 1,200 BOPD
Shut down in 1986 due to low oil price
Phillips estimated an incremental oil recovery for the
polymer block A, 1,440 acre polymer pilot flood to be 2.36
MMBO
Calumet reinstituted polymer flood on 320 acres; $6MM
cost, 15 well pattern
Return 369 wells to production
History
shows
8
–
15
BOPD
per
well
C02
Enhanced Oil recovery
North Burbank Unit
North Burbank Polymer 57 Project
30
30
Phillips’
Polymer Project
Chaparral
Polymer Pilot |
 Central Oklahoma Area
31
31
Total OOIP
1,861 MMBO
Primary Production
314 MMBO
Secondary Recovery
252 MMBO
Tertiary Potential
172 MMBO
Net Tertiary Potential
60 MMBO
Existing
CELLC
CO
Pipelines
Central Oklahoma Area
Net Potential: 60 MMBoe, 28% of total
Number of Projects in Area = 33
Core Projects:
Dover -
4.5 MMBO
NW Tecumseh-
2.7 MMBO
EVWB Sims Sand Unit-
.9 MMBO (Active)
NW
Velma
Hoxbar
Unit-
.8
MMBO
(Active)
2 |
 Permian Basin Area
32
32
Total OOIP
419.9 MMBO
Primary Production
69.3 MMBO
Secondary Recovery
70.3 MMBO
Tertiary Potential
38.7 MMBO
Net Tertiary Potential
13.6 MMBO
CO
Pipelines
of
Others
Permian Basin
Net Potential: 14 MMBoe, 6% of total
Number of Projects in Area = 14
Core Projects:
West
Goldsmith
Unit
–
3.4
MMBO
West
Dollarhide
Queens
Unit
–
2.6
MMBO
Vinnie
Linker
–
.4
MMBO
2 |
 Financial Performance and Credit
Statistics
Financial Performance and Credit
Statistics
33
33 |
 $450
Million Senior Secured Credit Facility $450 Million Senior Secured Credit
Facility 34
34
Facility: $450 million Senior Secured
Revolving Credit Facility ($375 million borrowing
base -
Pro forma for Bond Transaction)
Subject to semi-annual borrowing base redetermination
$100 million accordion feature
Maturity:
4 Year term, maturing April 2014
Covenants:
Current Ratio: 1.0 to 1.0
Debt/EBITDA
:
4.5 to 1.0 for annualized periods commencing on April 1, 2010 and ending
on June 30, 2010, September 30, 2010 and December 31, 2010
4.25 to 1.0 for rolling periods ending March 31, 2011, June 30, 2011 and
September 30, 2011; and
4.0 to 1.0 for period ending December 31, 2011 and each rolling period
thereafter |
 35
35
Financial Summary
Financial Summary
2009
TTM
06/30/2010
Proforma
2010E
Price
Oil –
Wellhead ($/Bbl)
57.37
71.57
73.33
Gas –
Wellhead ($/Mcf)
3.51
4.25
4.31
NGL –
Wellhead ($/Bbl)
35.38
46.04
51.11
Production (MMBoe)
7.6
7.7
8.2
Oil (MMBbls)
3.5
3.5
3.8
Gas (Bcf)
22.6
22.7
24.1
NGL (MMBbls)
.4
.4
.4
Revenue Including Cash Settled Derivatives ($MM)
348.0
409.4
451.2
Lease Operating Expenses
94.2
94.7
110.9
Production and Ad Valorem Taxes
20.3
24.7
28.4
General
and
Administrative
Expenses
(excludes
noncash
deferred
comp)
22.6
25.8
29.4
Operating Expenses
137.1
145.2
168.7
Interest (Expense)
(90.1)
(87.2)
(82.9)
Other Income / (Expense)
12.7
(1.2)
1.5
EBITDA
224
263
284
Discretionary Cash Flow
134
176
201
Total Capex
(2)
151
210
310
(1)
Note:
1)
2010E includes additional interest from potential $300 million bond
issuance 2)
Includes oil & gas CAPEX and Capitalized G&A. Excludes
Property & Equipment |
 Debt
and Liquidity Debt and Liquidity
Net Debt / EBITDA
Liquidity
36
36
325
325
172
300
2011
2012
2013
2014
2015
2016
2017
2018
2019
2020
7.9x
5.6x
4.4x
4.9x
3.2x
5.3x
2.3x
2.0x
2.0x
0.0x
2006
2007
2008
2009
06/30/2010
Proforma
Total net debt to EBITDA
Net secured debt to EBITDA
120.9m
88.0m
55.4m
76.6m
292.1m
510.1m
2006
2007
2008
2009
06/30/2010
06/30/2010
Proforma
Current Maturity Profile ($mm)
(1)
(1) Represents outstanding revolver balance at 06/30/2010. Will be paid off with new
$300 million bond issuance. |
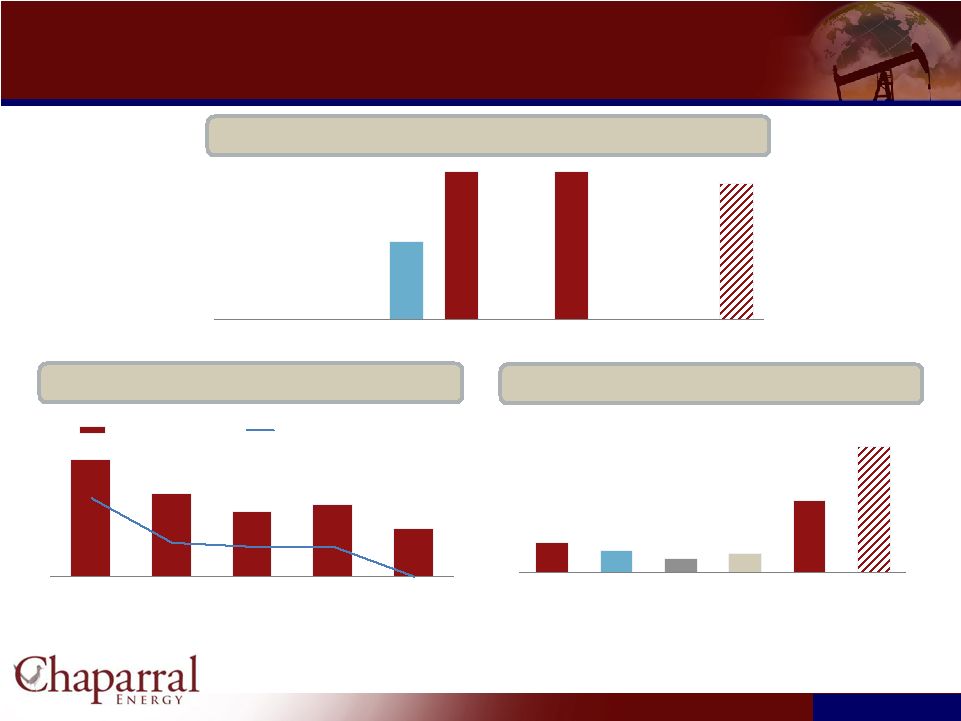
 Overview of recent cost improvements
Historical LOE Cost ($/Boe)
Historical Proved Developed F&D Cost
37
37
$13.28
$15.42
$17.05
$12.33
$13.40-
13.75
2006
2007
2008
2009
2010
Guidance
Prioritizing capital and operational efficiency will remain a
key focus
FY’08 to first half of 2010 LOE improved 22.6% to $13.19/Boe
FY’08 to FY’09 Proved Developed F&D cost improved 31% to $15.90/Boe
|
 Hedge
Portfolio Hedge Portfolio
Note:
1)
Dollars represent average strike price of hedges (includes all derivative
instruments) Gas Basis Hedges
Price
% Gas
PDP
July-Dec 2010
$0.72
77%
Jan-Dec 2011
$0.67
82%
Jan-Dec 2012
$0.30
46%
$7.34
$68.40
$10.00
$11.53
In 2008 and 2009 -
various derivative
contracts monetized resulting in net
cash proceeds of $144 million
2Q 2010 –
In connection with
execution of new credit facility,
monetized hedges held with banks
exiting credit facility; net cash
payments $545 thousand
June 2010 –
monetized 2012 oil
hedges; net cash proceeds $7.6
million
%
of
Proved
Developed
Producing
Hedged
(As
of
June
30,
2010)
$90.46
38
38 |
 $7.37
$7.54
$8.43
$8.71
$8.78
$8.86
$13.34
$13.41
$13.49
$16.92
4.5X
3.8X
3.6X
3.3X
3.2X
3.2X
2.6X
2.0X
1.5X
0.9X
Benchmarking Chaparral’s credit ratios
Benchmarking Chaparral’s credit ratios
39
39
Net Leverage / LTM Adj. EBITDA
Net Leverage / Proved Developed Reserves
($/Boe)
Note:
Balance
sheet
and
income
statement
as
of
6/30/10,
reserves
as
of
12/31/09;
pro
forma
for
announced
M&A
and
capital
market
transactions
(SD
LTM
Adj.
EBITDA
as
of
3/31/10
PF
for
acquisition of ARD)
¹
DNR LTM Adj. EBITDA estimated based on EAC and DNR filings and company presentations
²
Chaparral rating “Corporate Family Rating”
³
Credit rating for bond issuance
Corporate
rating:
Corporate rating:
SD
B2/B+
DNR
Ba3/BB
SFY
B2/B+
BRY
B1/BB-
VQ
B3/B
SGY
B3/B
Antero³
Caa1/B
Chaparral²
B3/B
CWEI
B3/B
SD
B2/B+
DNR
Ba3/BB
SFY
B2/B+
BRY
B1/BB-
VQ
B3/B
SGY
B3/B
Antero³
Caa1/B
Chaparral²
B3/B
CWEI
B3/B |
 Key
Investment Considerations Key Investment Considerations
Low-risk, high quality reserves with long-lived production profile
141.9
Mmboe
proved
reserves
as
of
12/31/2009¹
63% crude oil; 66% proved developed
18.6 R/P ratio
Asset concentration (90% of proved reserves) in the Mid-Continent and Permian
Basin Significant upside potential and growth opportunities
Over 1,300 proved undeveloped drilling locations
EOR
activities
ramping
up
with
current
anthropogenic
CO
2
injection
rate
of
approximately
60
Mmcf/d;
existing
ownership
interests
in
380
miles
of
CO
2
pipelines
2010 oil and gas capital budget of $310mm, primarily focused on the
Mid-Continent Strong financial position and liquidity profile
Common equity investment of $325mm by CCMP to reduce leverage
Over $500mm of liquidity adjusted for the proposed transaction
Active hedging program with over 70% of 2011E PD production hedged above $7.00 gas
/ $70.00 oil 40
40
¹Based on 12/31/2009 SEC methodology |