Attached files
 1
2010 Barclays Capital
Back-To-School Consumer Conference
Presentation
September 8, 2010
Exhibit 99.2 |
 2
Cliff Fleet
Vice President
Investor Relations
Altria Client Services |
 3
Safe Harbor Statement
Statements
in
this
presentation
that
are
not
reported
financial
results
or
other
historical
information
are
“forward-looking
statements”
within
the
meaning
of
the
Private
Securities
Litigation
Reform
Act
of
1995.
Such
forward-looking
statements
are
based
on
current
plans,
estimates
and
expectations,
and
are
not
guarantees
of
future
performance.
They
are
based
on
management’s
expectations
that
involve
a
number
of
business
risks
and
uncertainties,
any
of
which
could
cause
actual
results
to
differ
materially
from
those
expressed
in
or
implied
by
the
forward-looking
statements.
The
Company
undertakes
no
obligation
to
publicly
update
or
revise
any
forward-looking
statement
other
than
in
the
normal
course
of
its
public
disclosure
obligations.
The
risks
and
uncertainties
relating
to
the
forward-looking
statements
in
this
presentation
include
those
described
under
the
caption
“Cautionary
Factors
that
May
Affect
Future
Results”
in
the
Company’s
2009
Annual
Report
and
its
Quarterly
Report
on
Form
10-Q
for
the
quarter
ended
June
30,
2010.
Reconciliations
of
non-GAAP
measures
included
in
this
presentation
to
the
most
comparable
GAAP
measures
are
shown
at
the
end
of
this
slide
show
presentation
and
are
available
on
the
Company’s
website
at
www.altria.com. |
 4
Dave Beran
EVP and
Chief Financial Officer
Altria Group, Inc. |
 5
Dave Beran
EVP and Chief Financial Officer, Altria
Craig Johnson
EVP, Altria
Marty Barrington
EVP, Chief Compliance & Administrative
Officer, Altria
Murray Garnick
SVP of Litigation, ALCS
Altria’s Executive Management |
 6
Today’s Remarks
Altria’s plans to continue delivering superior shareholder returns
Why we believe Altria continues to be a compelling investment
|
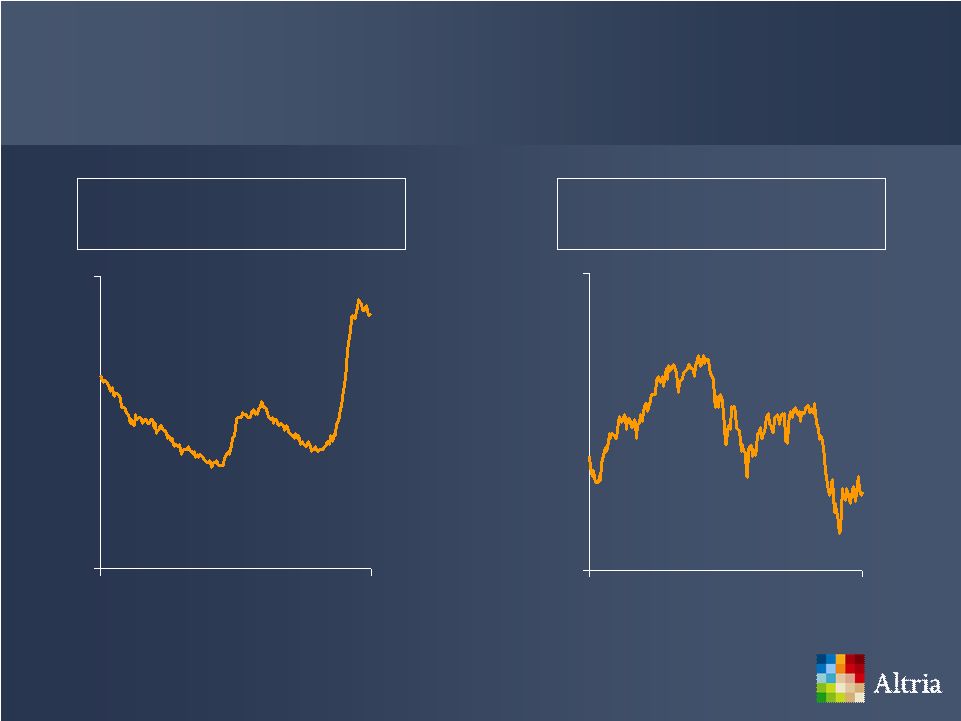 Economic Conditions
Unemployment Rate
Consumer Confidence
54
77
0
200
Jan-93
Aug-10
9.6
7.3
0
11
Jan-93
Aug-10
Source: U.S. Department of Labor Bureau of Labor Statistics. Blue Chip
Economic Indicators: The Conference Board 7 |
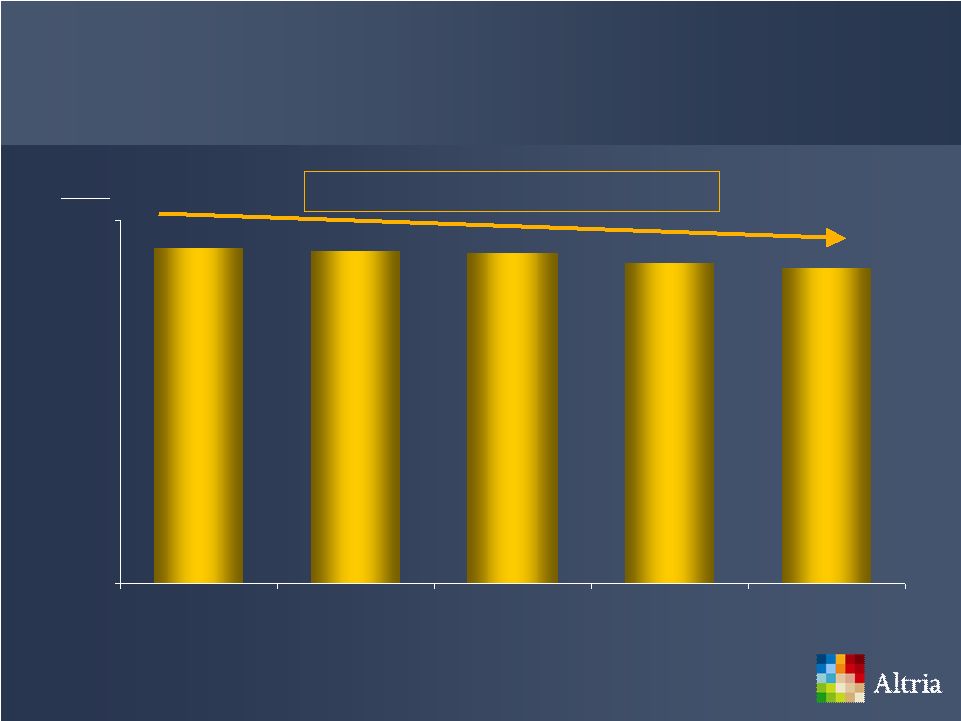
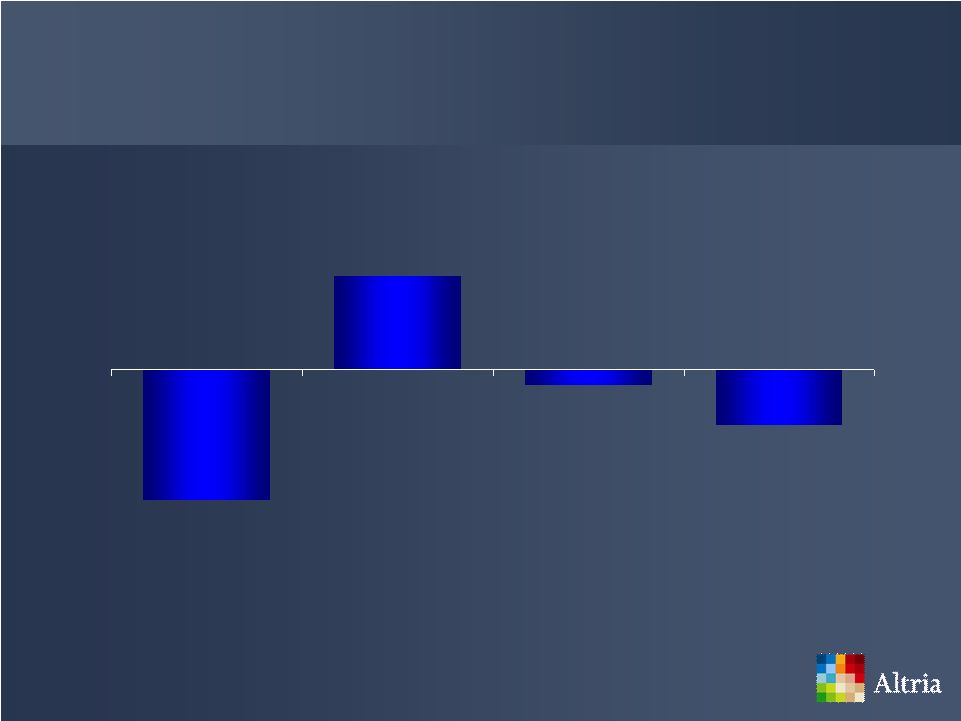 8
S&P 500’s Total Shareholder Return
*
* Assumes reinvestment of dividends
(March 28, 2008 –
August 31, 2010)
Source: Bloomberg; 2010 YTD through Aug 31, 2010; Post PMI Spin-off Mar 28, 2008
vs. Aug 31, 2010 (4.6%)
(36.6%)
(15.6%)
25.9%
2008
2009
2010 YTD
Post PMI spin-off |
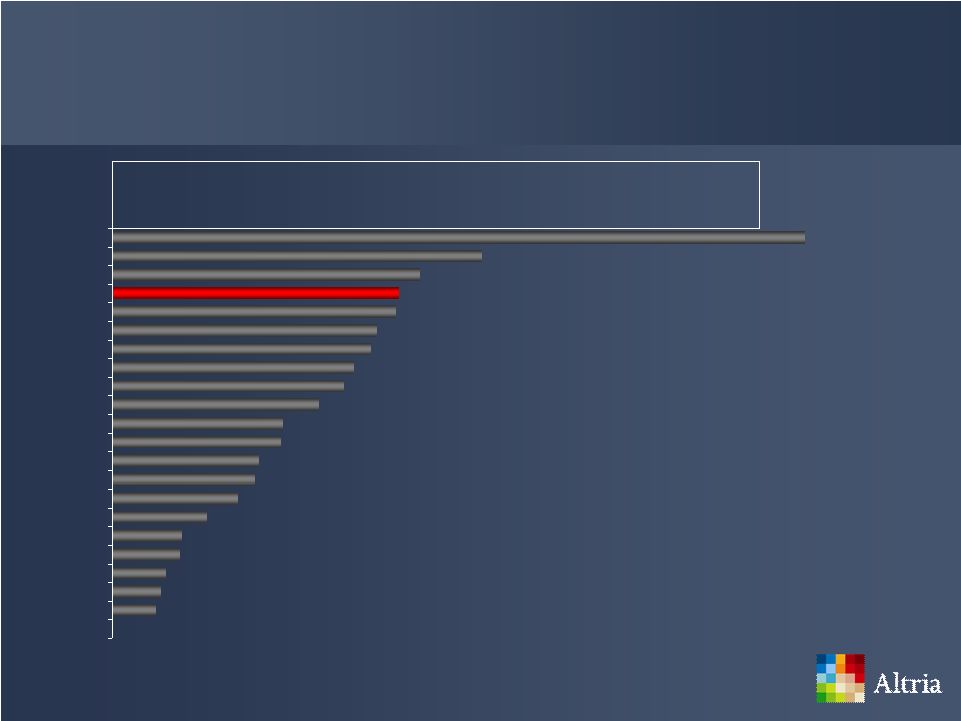
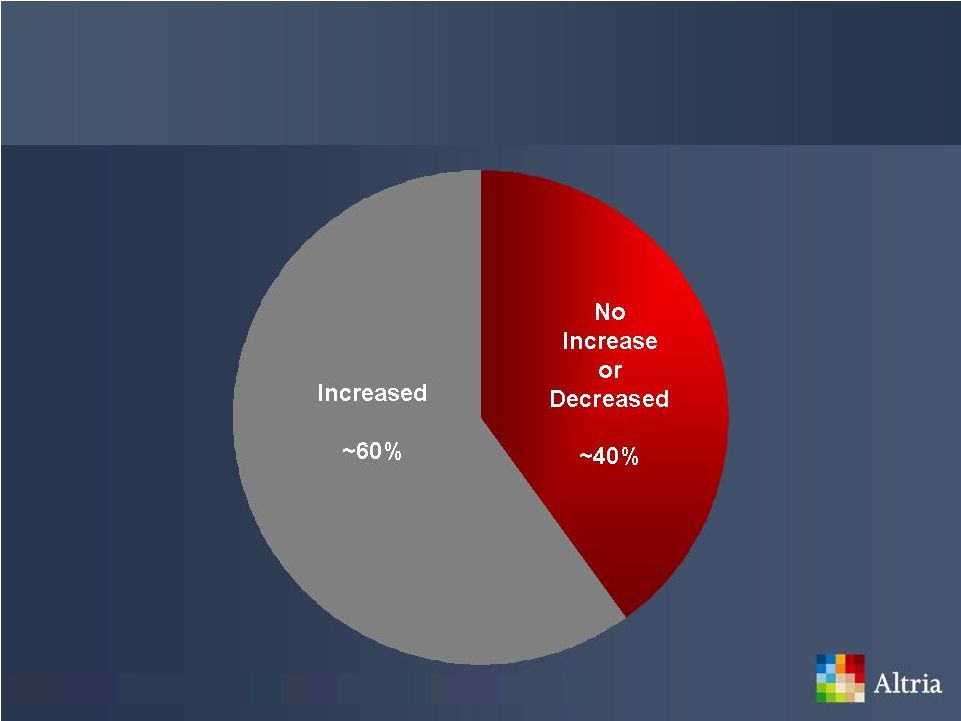 S&P 500 Companies’
Dividends
9
Source: FactSet; Dividend paying companies at Mar 28, 2008 vs. Aug 31, 2010
|
 10
Acquisitions of Middleton and UST
Restructuring the internal functions of Altria’s companies
Largest federal excise tax increase in history on tobacco products
in April 2009
FDA regulatory oversight over tobacco products
Tobacco litigation environment
Altria’s Business Environment |
 11
Altria’s Adjusted Earnings Per Share Growth
Adjusted Diluted EPS* Growth
Source: Altria company reports
* For reconciliation of non-GAAP to GAAP numbers visit www.altria.com. EPS
= Earnings per share. 10.0%
6.1%
7% to 9%
2008
2009
2010 Estimate |
 12
Altria’s Dividend Increases Since PMI Spin-off
Source: Altria company reports
+31%
* Annualized rate
Note:
2008
annualized
dividend
rate
is
based
on
$0.29
per
common
share,
declared
May
28,
2008
2010 annualized dividend rate is based on $0.38 per common share, declared Aug 27,
2010 2.9%
6.3%
10.3%
$1.52
8.6%
$1.16
$0.50
$1.75
2008
Aug-08
Aug-09
Feb-10
Aug-10
2010
*
* |
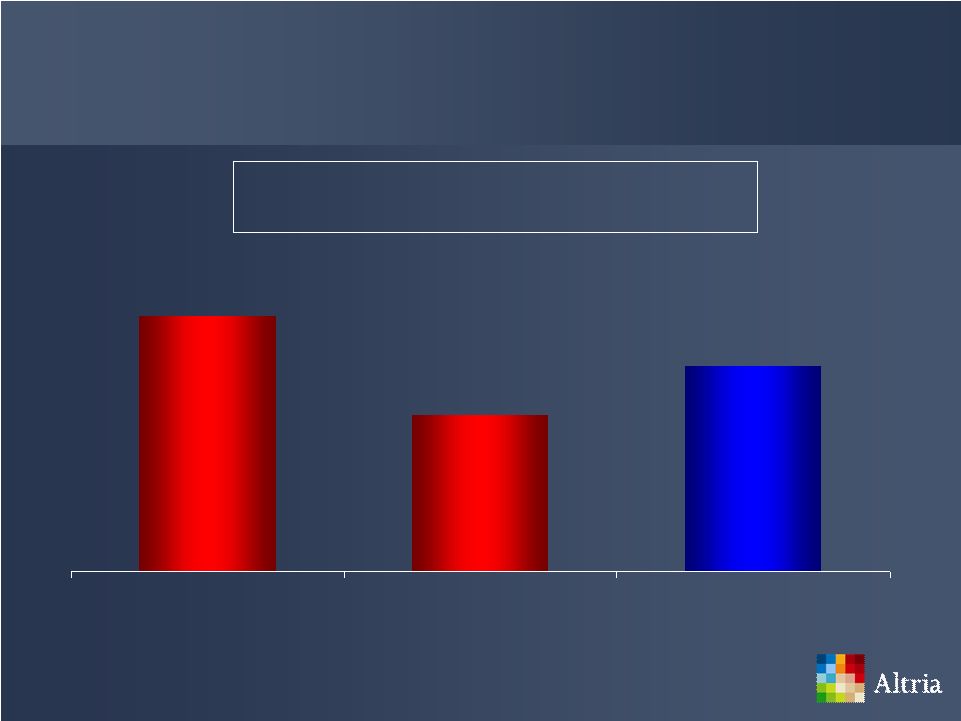
 13
Altria Delivered Superior Returns to Shareholders
* Assumes reinvestment of dividends as of Aug 31, 2010
Source:
Bloomberg
Daily
Return
(Mar
28,
2008
–
Aug
31,
2010)
Total Shareholder Return*
(Since PMI Spin-off)
11.1%
14.9%
(15.6%)
Altria
S&P 500
S&P Food, Beverage &
Tobacco |
 14
Company Name
Market Cap.
(in Bil.)
TSR
(%)
1
Altria Group, Inc.
$40.7
39.1
2
Coca-Cola Co
$132.1
29.5
3
Kellogg Co
$20.2
24.6
4
General Mills Inc
$23.3
19.5
5
Philip Morris Int'l Inc
$91.8
15.9
2009
Source:
Bloomberg
Monthly
Return;
2010
YTD
through
Aug
31,
2010;
Bloomberg
Yearly
Return;
2009
full-year
Total Shareholder Return
Note : Food, Beverage & Tobacco companies with a market capitalization greater
than $20 billion as of Aug 31, 2010 Company Name
Market Cap.
(in Bil.)
TSR
(%)
Altria Group, Inc.
$46.5
17.7
Kraft Foods Inc
$52.2
12.3
Philip Morris Int'l Inc
$94.1
9.1
PepsiCo Inc
$102.1
7.1
General Mills Inc
$23.5
4.4
YTD 2010 |
 15
Four strong brands of our tobacco operating companies
Superior brand-building infrastructure
Financial discipline with solid cost management
Strong balance sheet with a commitment to return cash to
shareholders in the form of dividends
Altria’s Competitive Advantages |
 16
This space is blank because brand images
which appeared in the original presentation
have been removed. |
 17
’s
Source: CATTS Database (12mm ending June 2010)
Marlboro
Adult
Tobacco
Demographics
25%
50%
Overall Share
21 -
29
30 -
39
40 -
49
50+ |
 ’s
Marlboro
Retail
Share
18
Source: Maxwell; Shipments; IRI/Capstone – Total Retail Panel; IRP SymphonyIRI Group/Capstone
Projected Retail Panel |
 19
Source: IRP SymphonyIRI Group/Capstone Projected Retail Panel
Marlboro
Non-Menthol
Retail Share
(2Q 2010)
36.9%
31.9%
Marlboro Non-Menthol
Next 50 Non-Menthol Brands |
 20
This space is blank because brand images
which appeared in the original presentation
have been removed. |
 21
+2.1pp
Source: IRP SymphonyIRI Group/Capstone Projected Retail Panel
Marlboro
Non-Menthol
Retail Share
of
Non-Menthol Segment
This space is blank because
brand images which
appeared in the original
presentation have been
removed.
50.2%
52.3%
45%
55%
2Q 2009
2Q 2010 |
 22
This space is blank because brand images
which appeared in the original presentation
have been removed. |
 23
Marlboro
Menthol
Retail Share of Menthol Segment
13.7%
14.4%
16.1%
18.0%
18.3%
19.4%
20.1%
2Q 04
2Q 05
2Q 06
2Q 07
2Q 08
2Q 09
2Q 10
Source: IRI/Capstone Projected Retail Panel Database, 2004 – 2007; IRP SymphonyIRI Group/Capstone
Projected Retail Panel, 2008 - 2010 |
 24
This space is blank because brand images
which appeared in the original presentation
have been removed. |
 25
Source: CATTS Database (12mm ending June 2010)
’s
Adult
Tobacco
Demographics
15%
30%
Overall Share
21 -
29
30 -
39
40 -
49
50+
Copenhagen |
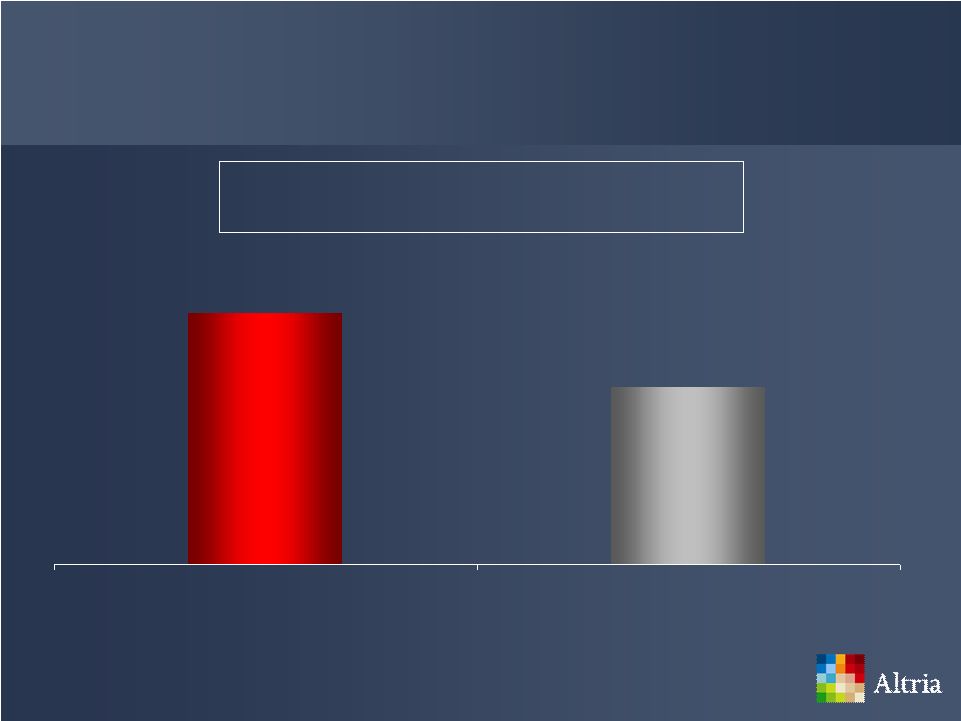
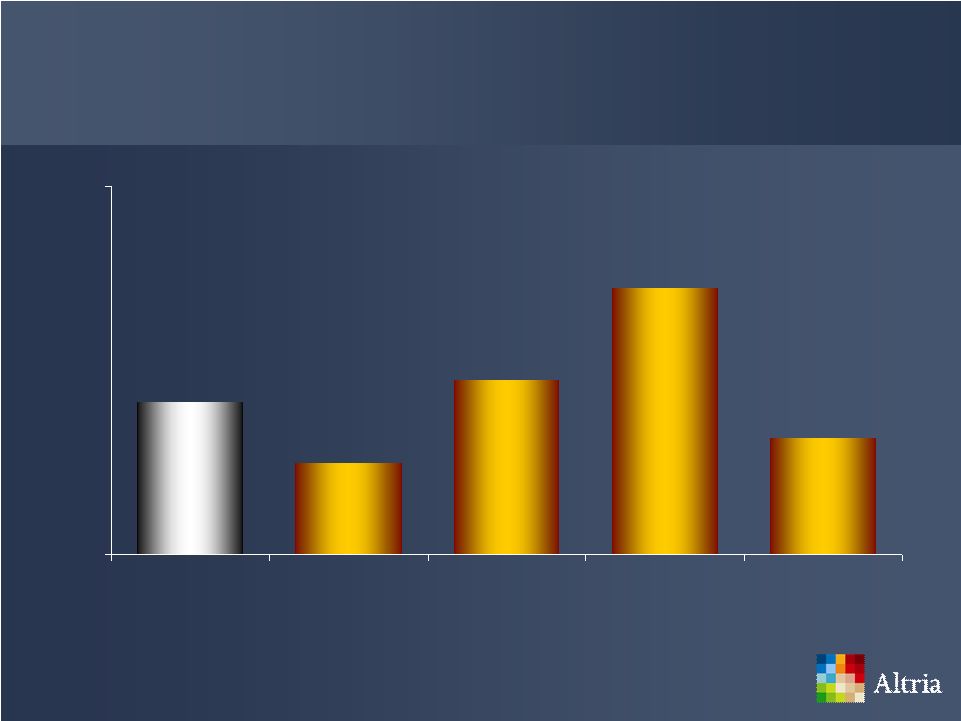
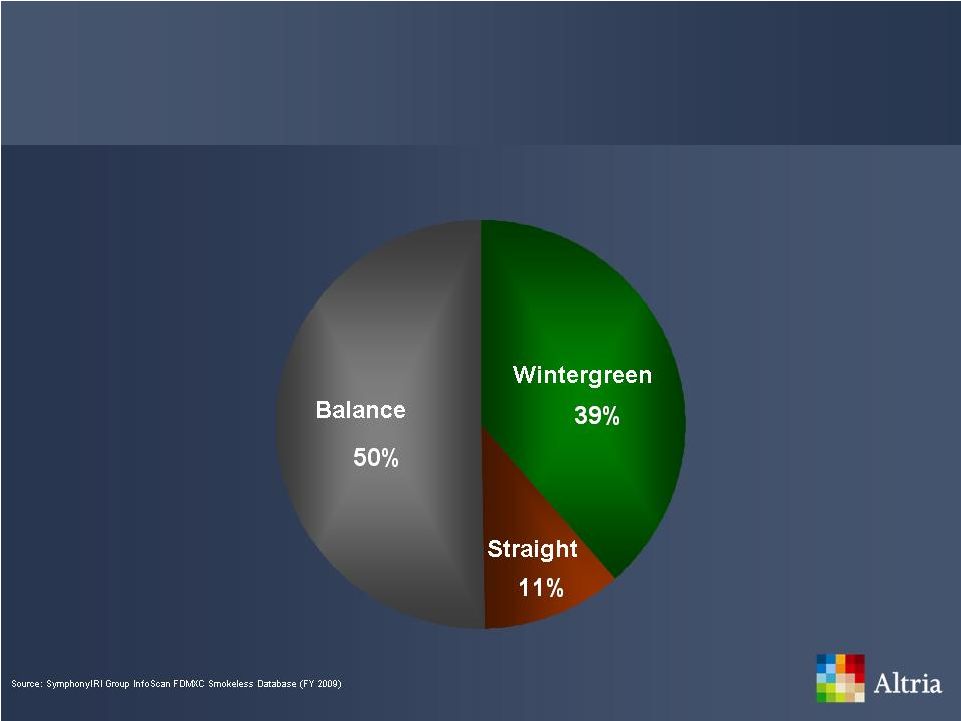 Smokeless Products Flavor Segments’
Retail Share
26 |
 27
This space is blank because brand images
which appeared in the original presentation
have been removed. |
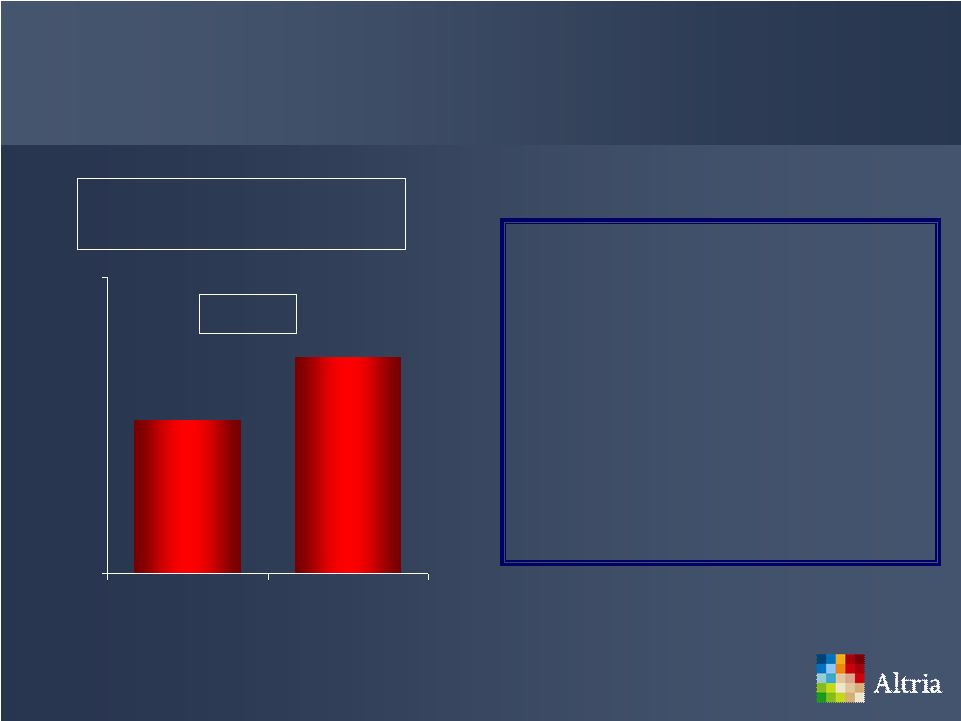
 28
’s
Retail
Share
Retail Share
+2.3pp
Source: SymphonyIRI Group InfoScan Smokeless FDMXC Database
This space is blank because
brand images which
appeared in the original
presentation have been
removed.
23.3%
25.6%
1H 2009
1H 2010
Copenhagen |
 29
Skoal
Strengths
’s
Number one smokeless brand among adult dippers ages 21-29
Number one smokeless brand among adults who use both MST
and cigarettes
Number one MST brand in the fast growing pouch segment
The smokeless brand with the highest brand loyalty among adult
dippers
Strong brand equity in the wintergreen segment
Source: CATTS Database (12mm ending June 2010); SymphonyIRI Group InfoScan Smokeless
FDMXC database |
 30
This space is blank because brand images
which appeared in the original presentation
have been removed. |
 31
25% of adult cigarette smokers are interested in smokeless
tobacco alternatives to cigarettes
Product opportunity is to provide them an enjoyable, smoke-free
tobacco product
We believe the best brand to do this is Marlboro
Smokeless Tobacco Alternatives
Source:
Smokeless
Tobacco
Attitudes
and
Usage
Study
[conducted
June,
2005
among
adult
smokers,
ages
21+] |
 32
This space is blank because brand images
which appeared in the original presentation
have been removed. |
 33
’s
Adult
Tobacco
Demographics
Source: CATTS Database (I2mm ending June 2010)
10%
40%
Overall Share
21 -
29
30 -
39
40 -
49
50+
Black
&
Mild |
 34
This space is blank because brand images
which appeared in the original presentation
have been removed. |
 35
’s
Retail
Distribution
Source: SymphonyIRI Group Convenience Cigar Store Level Database
Average Number of Packings Per Store
+50%
4Q 2007
2Q 2010
Black
&
Mild |
 36
Share of Machine-made Large Cigars Segments
Source: SymphonyIRI Group InfoScan Cigar Database 2010 FDMC
0%
100%
Tipped Cigarillo
Untipped Cigarillo
Non-Cigarillo
Middleton
Balance of Industry |
 37
Altria’s Tobacco Companies’
New Products
Products Introduced*
* Year of introduction based on national launch date
Source: PM USA, USSTC and Middleton
4
8
14
2008
2009
YTD 2010
Cigarettes
Smokeless
Cigars |
 38
Altria’s Tobacco Companies’
New Products
Retail Share
(1H 2010)
Note: Retail share of products introduced by Altria’s tobacco operating
companies from 2008 to 1H 2010 0%
7%
Cigarette Category
Smokeless Category
Cigar Category
Source: SymphonyIRI Group/Capstone IRP Projected Retail Database; SymphonyIRI Group Projected Retail
Smokeless & Cigar Databases |
 39
Superior Brand-Building Infrastructure
Executes trade programs to grow
Altria's tobacco companies'
businesses and their customers'
businesses
Executes Consumer Engagement
Programs and designs &
communicates retail promotion
plans for Altria’s tobacco
companies |
 40
This space is blank because brand images
which appeared in the original presentation
have been removed. |
 41
ALS&D Programs
Present brands to adult tobacco consumers in the best
positions
Allocate merchandising space to help brands stay in stock and
fresh
Communicate price and promotional offers
Prevent tobacco product access by minors |
 42
Altria Sales & Distribution Retail Volume Coverage
Over three million retail
contacts per year
Coverage offers our tobacco
companies reach and speed
to market
Source:
STARS
OTP
Geo
Aggregate
–
Full;
ALS&D
Internal
Estimates
Over
95% |
 43
Copenhagen
Product Distribution
Long Cut Wintergreen
Distribution*
Source: STARS OTP Store Level
* Distribution is as % of targeted workload stores with greater than ten industry
smokeless cans per week This space is blank because
brand images which
appeared in the original
presentation have been
removed.
80%
91%
Week 1
Week 2 |
 44
Altria Sales & Distribution’s Initiatives
Reallocated sales personnel to high volume areas
Implementing a total tobacco merchandising solution
Introducing new information management tools for the trade
|
 45
Altria Consumer Engagement Services
Executes adult consumer engagement programs
–
Build affinity
–
Loyalty
–
Brand awareness |
 46
Altria Consumer Engagement Services
Online
Websites
Events
Ranch/Bar
200+ Million
Annual Adult
Tobacco
Consumer
Interactions
Source: ALCES internal estimates
Direct Mail
Sweeps &
Giveaways |
 47
ALCES Programs –
Online Experience
This space is blank because brand images
which appeared in the original presentation
have been removed. |
 48
This space is blank because brand images
which appeared in the original presentation
have been removed. |
 49
Altria’s Financial Discipline
Managing costs
–
Improves efficiency
–
Helps income growth
–
Allows resources to be used on brand-building initiatives
Restructured and centralized various internal functions into
Altria Client Services
Making excellent progress against the cost reduction program
|
 50
Altria’s Cost Management Program
Source: Altria company reports
($ in Millions)
$290
$1,500
$1,210
$0
$1,500
2007 -
1H 2010 Savings
Add. Cost Savings
Expected by the end of
2011
Total Cost Savings
Expected by the end of
2011 |
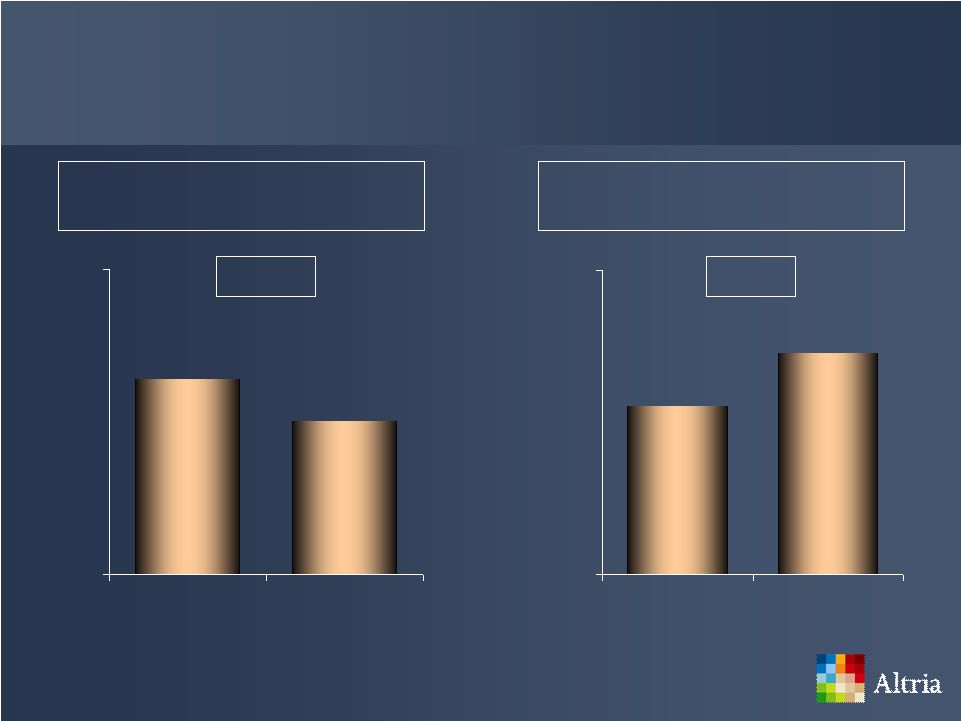
 51
Adjusted OCI* Margin
(2007 –
2009)
Cigarette Manufacturers’
Margins
Adjusted OCI* Margin
(1H 2009 –
1H 2010)
* For reconciliation of non-GAAP to GAAP numbers visit www.altria.com
1.7pp
0.4pp
0.9pp
PM USA
RJRT
Lorillard
4.0pp
3.0pp
1.0pp
PM USA
RJRT
Lorillard
Source: Altria
company
reports,
Lorillard,
Inc.
and
Reynolds
American
Inc.
company
reports,
and
ALCS
estimates.
Adjusted
OCI
for
RJRT
is
reported
income
plus
reported
amortization
expense
and
one-time
reported
implementation,
asset
impairment
and
exit
costs
of
$27
million
in
the
first-half
of
2010.
Adjusted
OCI
for
Lorillard
is reported
operating income, plus $66 million in reported one time legal expenses in 2007.
Adjusted OCI margins is adjusted OCI divided by reported net revenue excluding FET. |
 52
Smokeless Segment’s Costs
Adjusted Costs Per Can*
Source: 1H 2008: UST Inc.; 1H 2009 & 2010: Altria company reports
* For reconciliation of non-GAAP to GAAP numbers visit www.altria.com. Adjusted
Costs Per Can for 1H 2009 & 1H 2010 include MST and Snus $1.01
$0.96
$0.89
$0.80
$1.05
1H 2008
1H 2009
1H 2010 |
 53
Smokeless Segment’s Adjusted OCI Margins*
Source:
UST
and
Altria
company
reports
* For reconciliation of non-GAAP to GAAP numbers visit www.altria.com
~56%
~56%
2007
2Q 2010 |
 54
Strong Balance Sheet
Protects the company’s investment grade credit rating
Preserves access to the capital markets for short-
and long-
term debt
Secures the cash flow generated by the operating companies
Sustains our ability to grow earnings and dividends over time
|
 55
Benefits of a Strong Balance Sheet
Strong balance sheet helped Altria make ~$1 billion payment
to the IRS in July 2010
–
~$945 million of this payment is associated with the
disallowance of certain leverage leasing transactions
entered into by PMCC in 1996 through 2003
–
Intend to contest these disallowances vigorously
Payment did not impact company’s ability to raise 2010 EPS
guidance or increase quarterly dividend
Source: Altria company reports |
 56
Altria’s Debt
Debt to EBITDA ratio is in line with peers and under
requirements of covenants
High carrying costs due to timing of financing activities related
to UST acquisition
Focus on reducing financing costs |
 57
Altria’s Debt Transactions
Retired $775 million in notes with a coupon of 7.125% in 2Q 2010
Issued $800 million in notes with a coupon of 4.125% in 2Q 2010
Issued $200 million in notes with a coupon of 4.125%
in 3Q 2010
Decision to refinance or retire future debt depends upon:
–
Condition of capital markets
–
Interest rates
–
Altria’s business needs and conditions and other factors
Source: Altria company reports |
 58
Altria’s Economic Interest in SABMiller
Important component of
balance sheet
Maintaining position for the
foreseeable future
Strengthens Altria’s financial
profile
This space is blank because
brand images which
appeared in the original
presentation have been
removed. |
 59
Altria’s Economic Interest in SABMiller
Source: Altria company reports; Bloomberg Closing Stock Price in GBP converted to
USD as of Aug 31, 2010. Market Value
($ in Billions)
This space is blank because
brand images which
appeared in the original
presentation have been
removed.
$3.4
$12.3
$0
$18
Jul-02
Aug-10 |
 60
Yield
Payout Ratios
Source:
Bloomberg
DVD,
Thomson
One
Financial
2010
FY
adjusted
EPS
Estimates.
Payout
Ratio
and
Yield
compares
Food,
Beverage
&
Tobacco
companies
with
a
market
capitalization greater than $10 billion as of Aug 31, 2010. Altria’s
stated 80% payout ratio is a target. Altria’s Dividend
80%
72%
69%
61%
61%
57%
51%
51%
48%
46%
45%
44%
22%
20%
MO
RAI
LO
PM
HNZ
KFT
KO
HSY
GIS
PEP
CPB
K
ADM
CCE
6.8%
6.6%
5.9%
4.5%
3.9%
3.9%
3.1%
3.1%
3.0%
3.0%
3.0%
2.8%
1.9%
1.3%
MO
RAI
LO
PM
HNZ
KFT
KO
GIS
K
PEP
CPB
HSY
ADM
CCE |
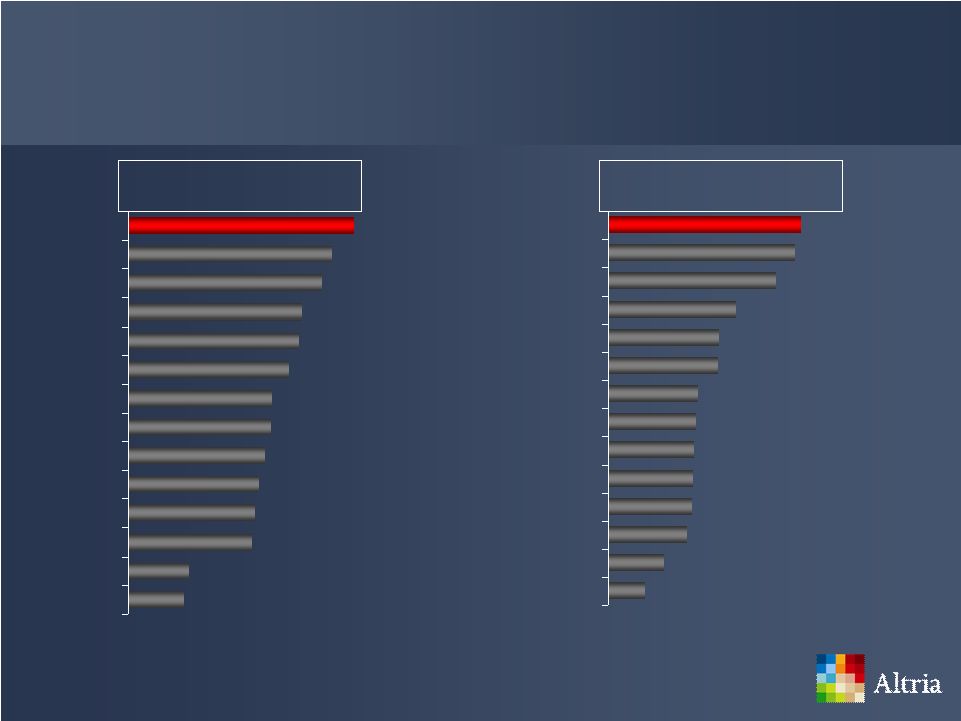
 61
S&P 500 -
Food, Beverage & Tobacco Index
(March 2008 to August 2010)
Source: Bloomberg DVD as of Aug 31, 2010
Dividend Increases
* Philip Morris Int’l calculation is from first declared dividend date
6/18/2008 * Lorillard Inc. calculation is from first declared dividend date
8/21/2008 Companies not shown:
DPS –
first dividend declared was 11/20/2009
STZ –
no regular dividend (no dividend, only stock splits (last one 2005))
DF –
no regular dividend (one special dividend $15 paid 4/2/07)
75%
40%
33%
31%
31%
29%
28%
26%
25%
22%
18%
18%
16%
15%
14%
10%
8%
7%
6%
5%
5%
0%
TAP
GIS
SJM
MO
K
CCE
PEP
PM*
CPB
LO*
HNZ
MKC
KO
ADM
HRL
BF/B
HSY
KFT
RAI
CAG
SLE
TSN |
 62
Altria’s 2010 Dividend Increases
Raised dividend twice for a total increase of 11.8% since the
end of 2009
–
2.9% in February 2010
–
8.6% in August 2010
All future dividend payments remain subject to the discretion of
Altria’s Board of Directors
Source: Altria company reports |
 63
Altria’s Adjusted Diluted EPS Guidance
Mid-term
adjusted
diluted
EPS
growth
target
is
7%
to
9%
Altria
reaffirms
that
its
2010
adjusted
*
diluted
earnings
per
share
(EPS)
is
expected
to
increase
to
a
range
of
$1.87
to
$1.91
per
share,
representing
a
7%
to
9%
growth
rate
from
an
adjusted
base
of
$1.75
per
share
in
2009
* For reconciliation of non-GAAP to GAAP numbers visit www.altria.com. EPS
= Earnings per share. Source: Altria company reports
|
 64
Four strong brands of our tobacco operating companies
Superior brand-building infrastructure
Financial discipline with solid cost management
Strong balance sheet with a commitment to return cash to
shareholders in the form of dividends
Altria’s Competitive Advantages |
 65
Areas Requiring Continuing Focus
Business Environment
FDA Regulation
Tobacco Litigation |
 66
Business Environment
Tobacco volumes
Profit pools
Competitive environment |
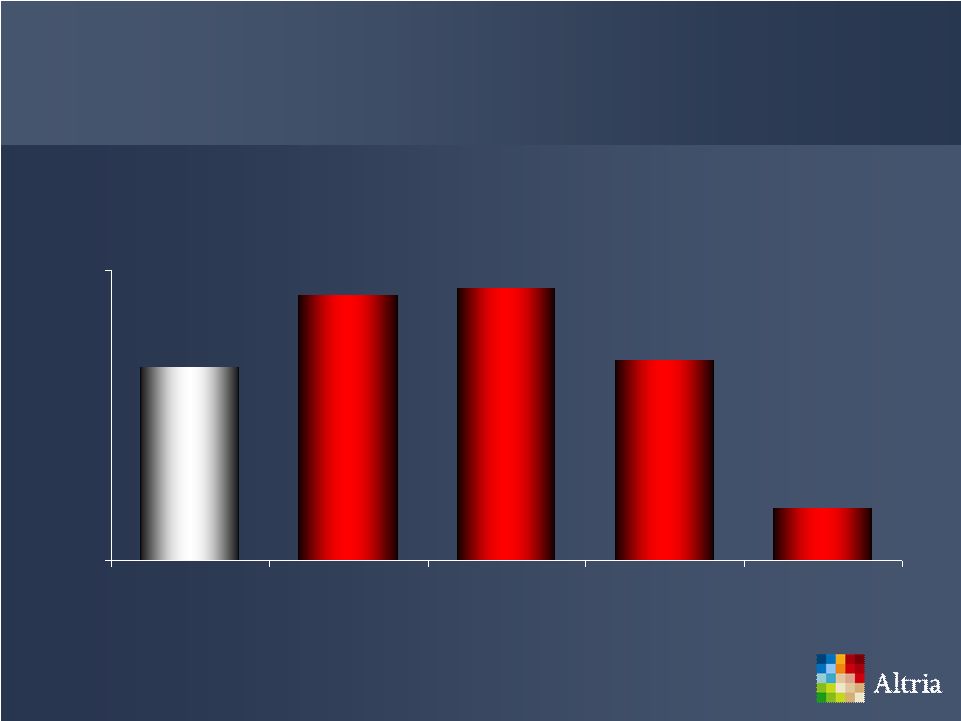
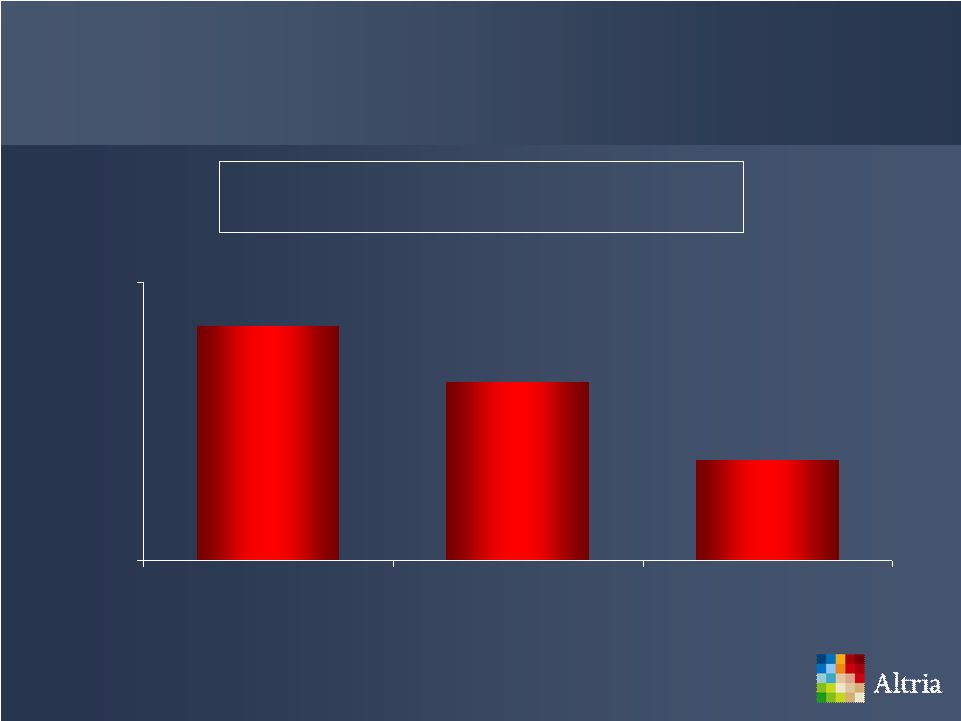
 67
Pounds in
Millions
Source: ALCS MICR Industry estimates for cigarettes; TTB all other tobacco segments;
cigarettes, small cigars & RYO based on 0.0325 oz./stick [FY 2008] 5 year
CAGR (~1%) Historical Total Tobacco Volume
0
1,100
2004
2005
2006
2007
2008 |
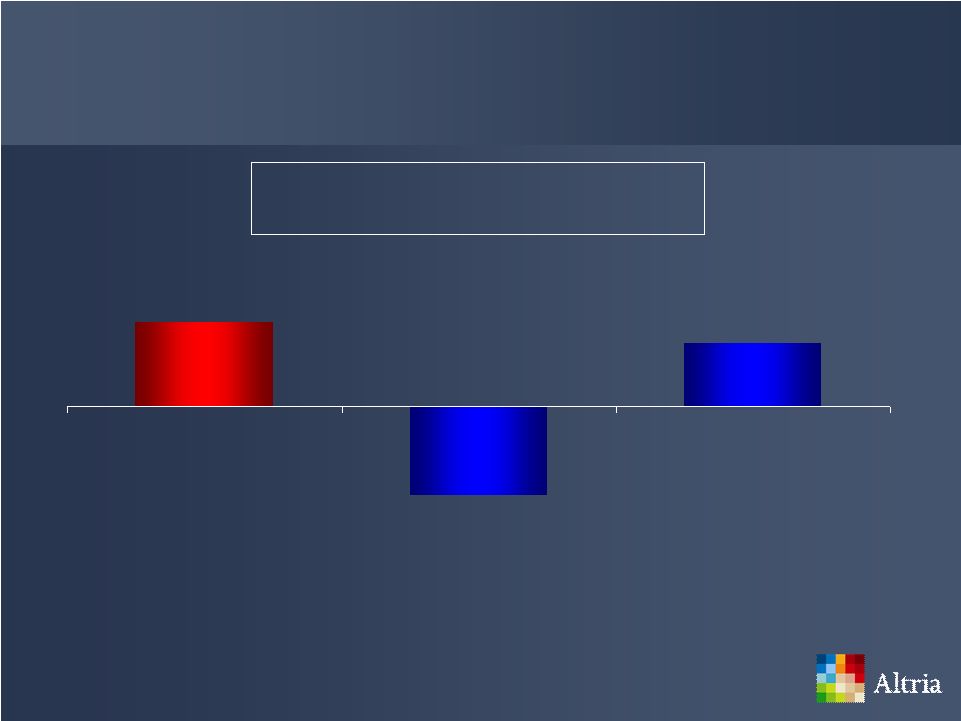
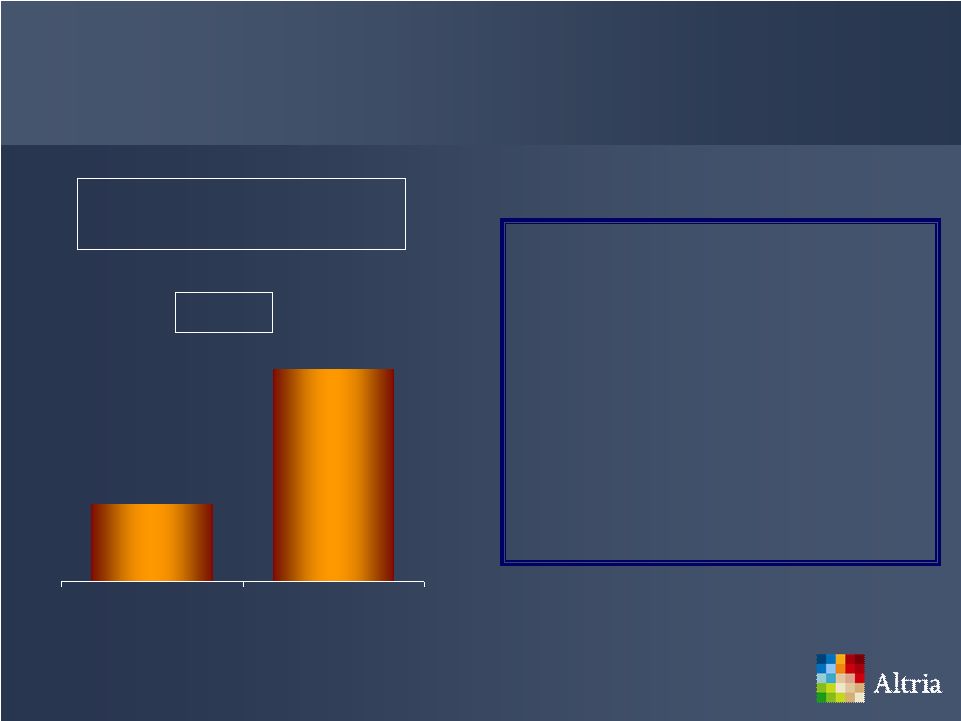
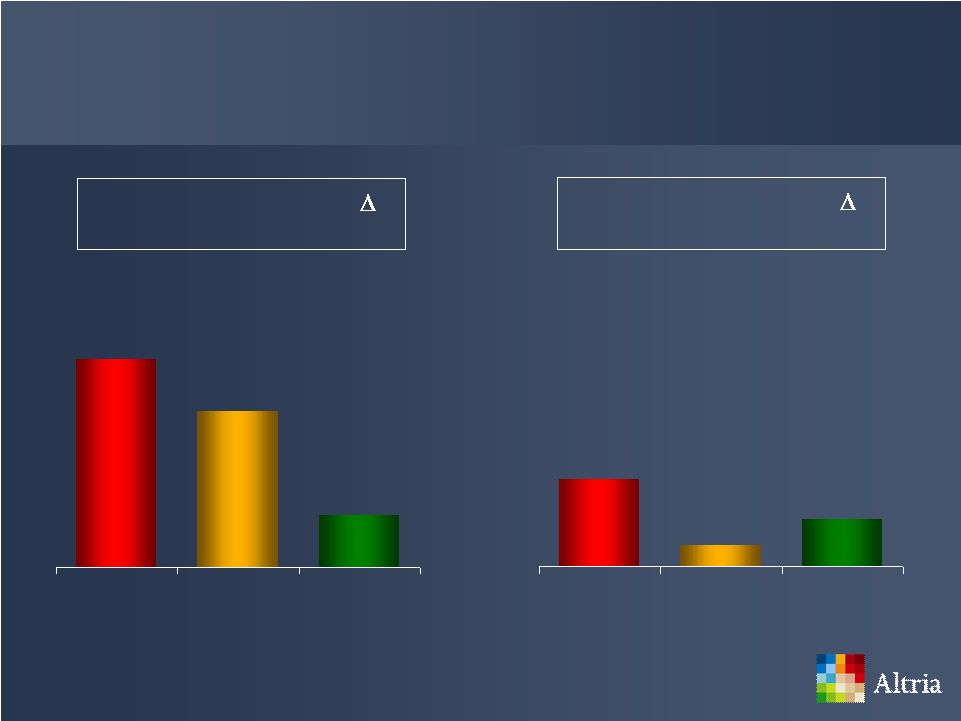
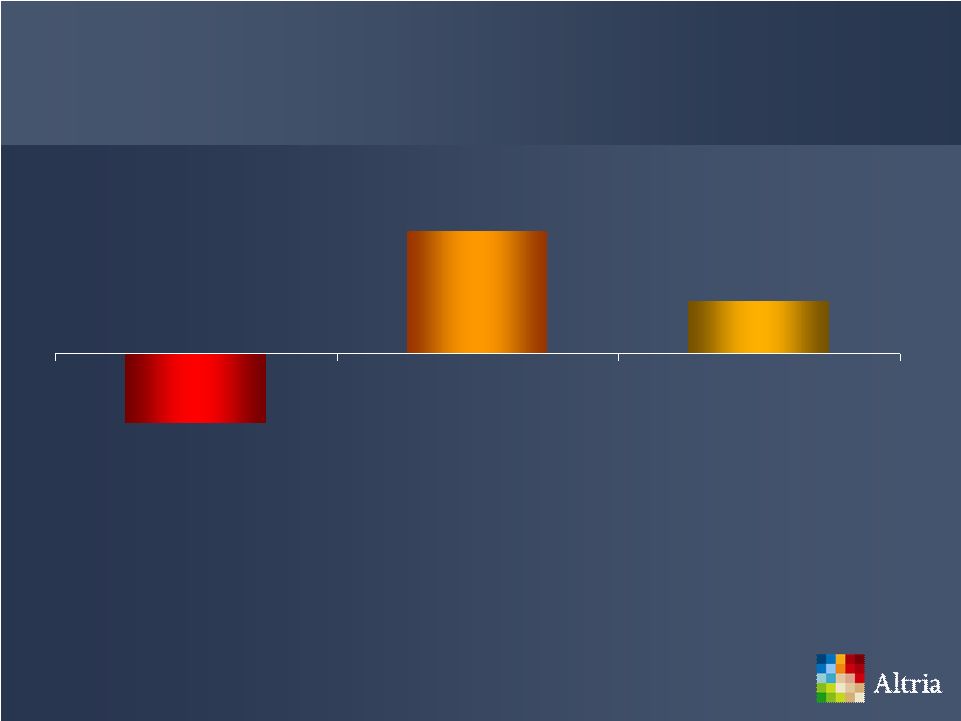 68
Tobacco Categories’
2008 Volume Change
Source: Altria company reports; ALCS MICR estimates
Note: Smokeless is defined as moist smokeless tobacco and spit-less tobacco
products ~3%
~7%
(~4%)
Cigarettes
Smokeless
Machine-made Large
Cigars |
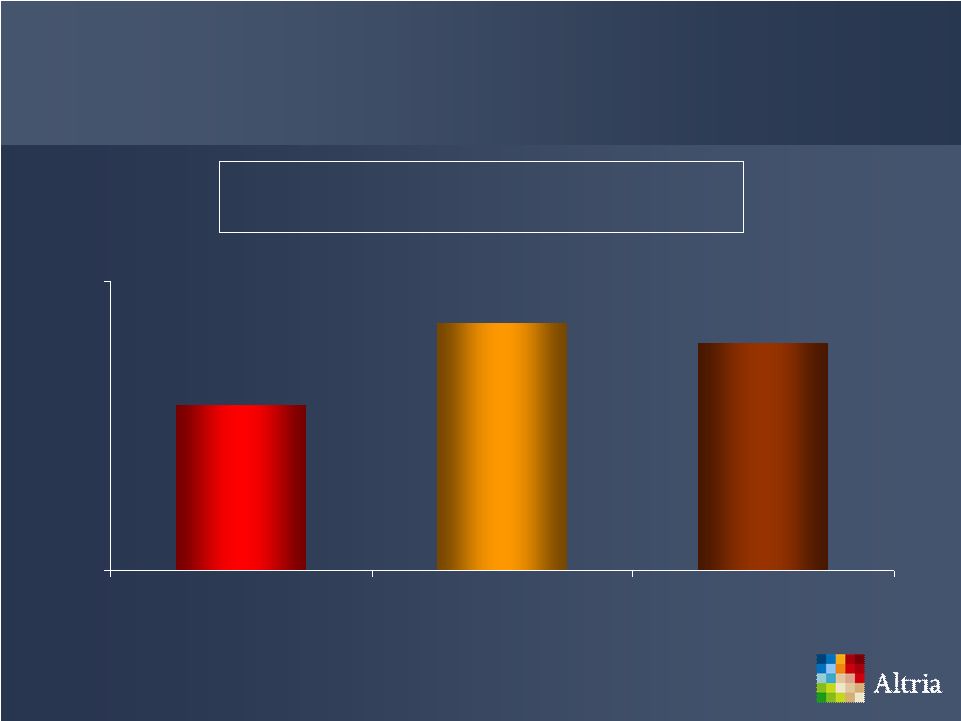
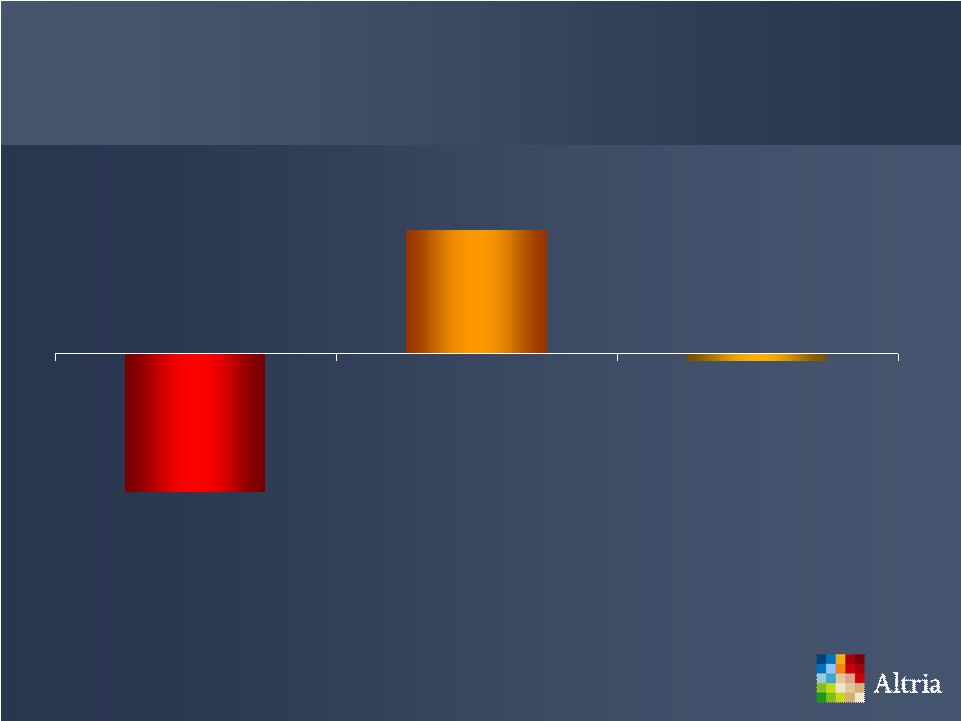 69
Tobacco Categories’
2009 Volume Change
Source: Altria company reports; ALCS MICR estimates
Note: Smokeless is defined as moist smokeless tobacco and spit-less tobacco
products (~0.5%)
~7%
(~8%)
Cigarettes
Smokeless
Machine-made Large
Cigars |
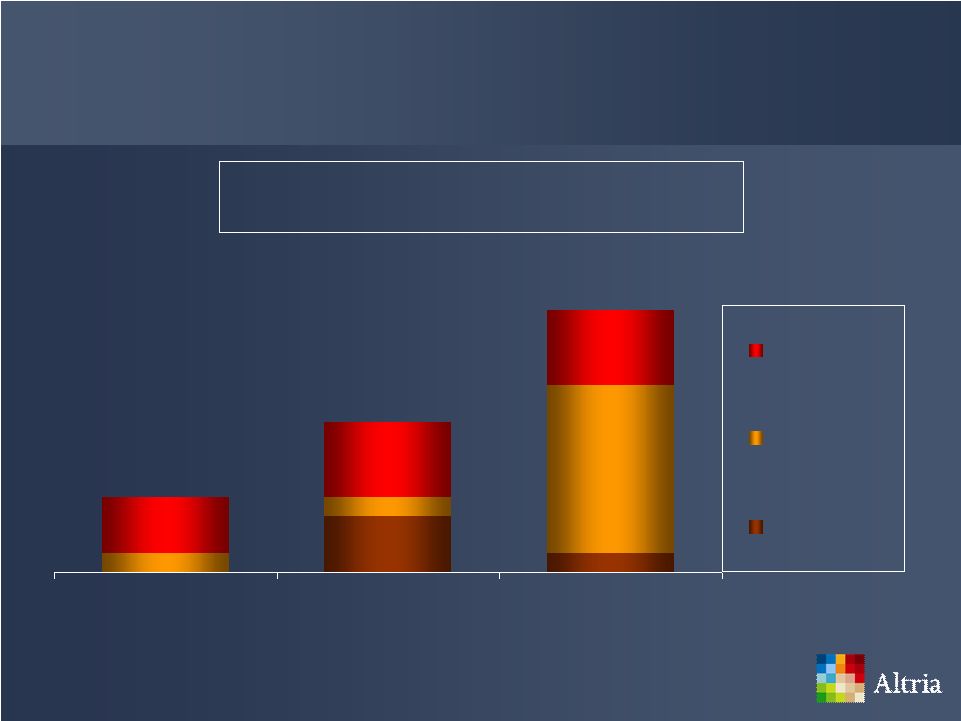
 70
Tobacco Categories’
Volume Change
2008
2Q 2010
Source: Altria company reports; ALCS MICR estimates
Note: Smokeless is defined as moist smokeless tobacco and spit-less tobacco
products ~3%
~7%
(4.0%)
~7%
Grew
Slightly
(4.5%)
Cigarettes
Smokeless
Machine-made Large
Cigars |
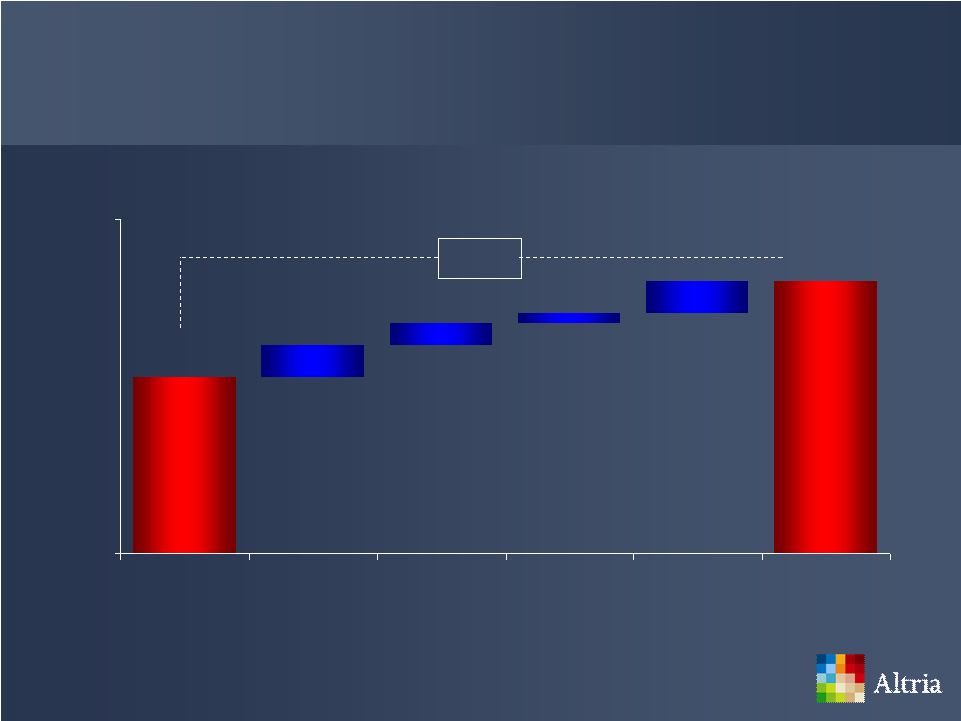
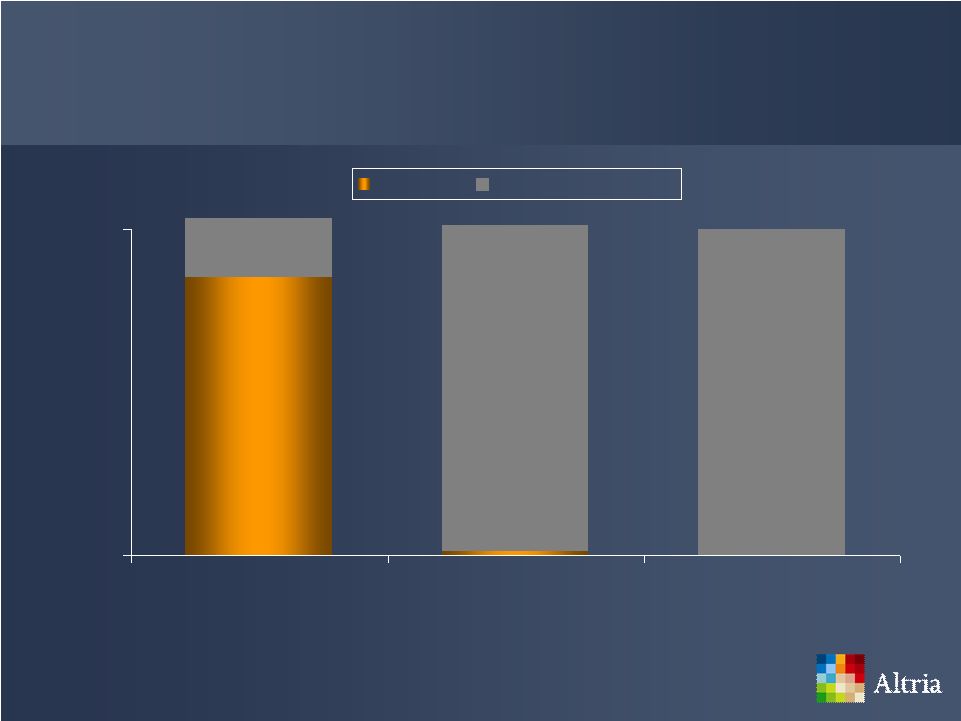
 71
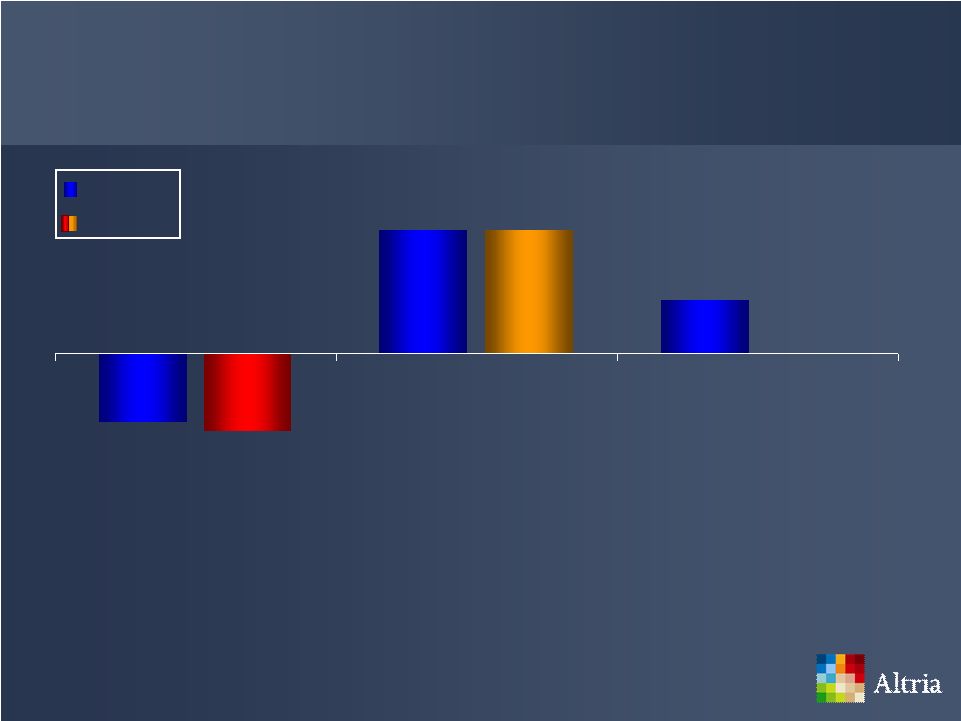
*
Altria’s Share of Profit Pool
+9.0pp
* Excludes USSTC
Tobacco Manufacturers’
Profit Pool
Total Profit Pool
($ in Billions)
+5.7%
Source: Altria company reports; ALCS BS&D estimates
$10.6
$11.2
$9.5
$12.5
2007
2009
46%
55%
30%
70%
2007
2009 |
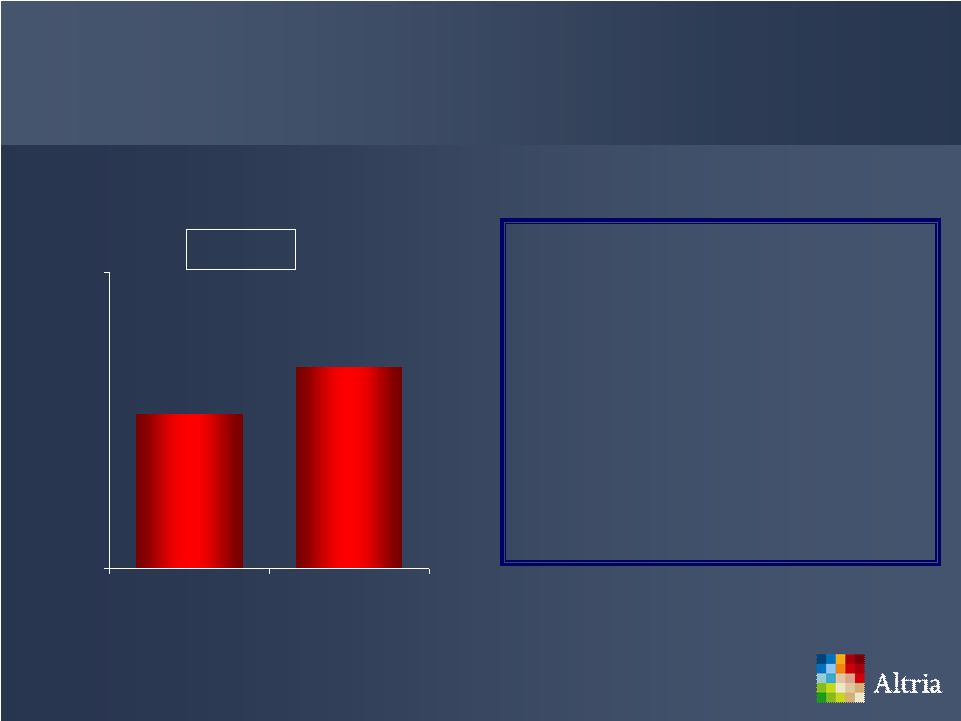
 |
 73
Cigarettes Segment
Grow cigarette income while maintaining share momentum on
Marlboro
Maximize income by expanding margins, while investing where
appropriate to enhance long-term profitability |
 74
Cigarettes Segment’s Results
Source: Altria company reports
Adjusted OCI*
($ in Billions)
+8.8%
+3.8%
$2.7
$2.8
$2.4
$2.3
$2.9
1H 2008
1H 2009
1H 2010
* For reconciliation of non-GAAP to GAAP numbers visit www.altria.com.
|
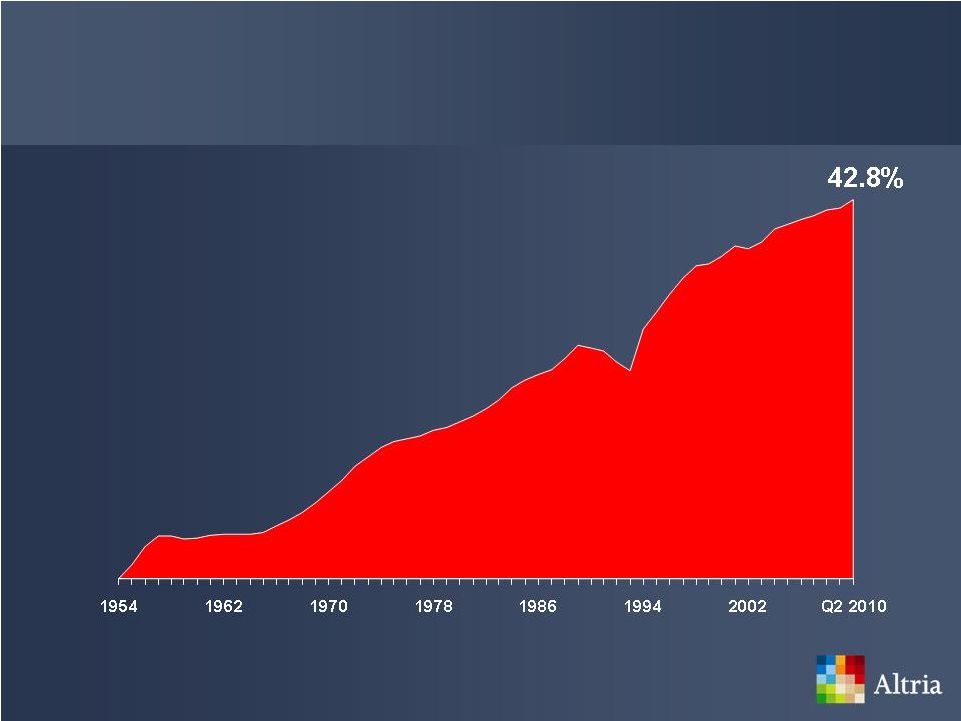
 75
’s
Marlboro
Retail
Share
Source: IRP SymphonyIRI Group/Capstone Projected Retail Panel Database
+1.6pp
This space is blank because
brand images which
appeared in the original
presentation have been
removed.
42.8%
41.2%
36%
46%
2Q 2009
2Q 2010 |
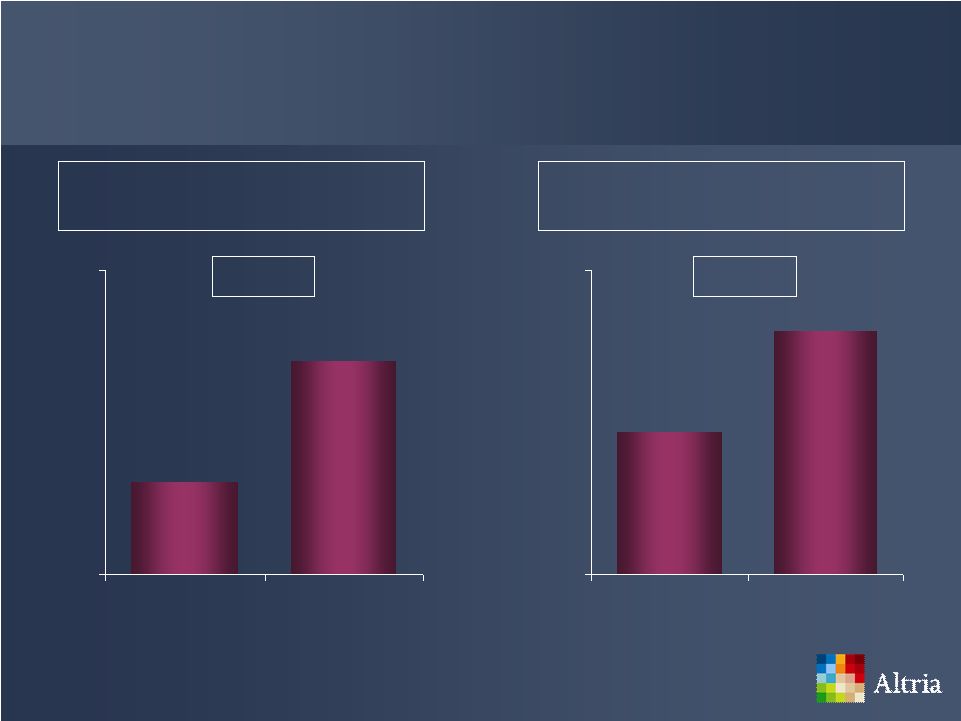
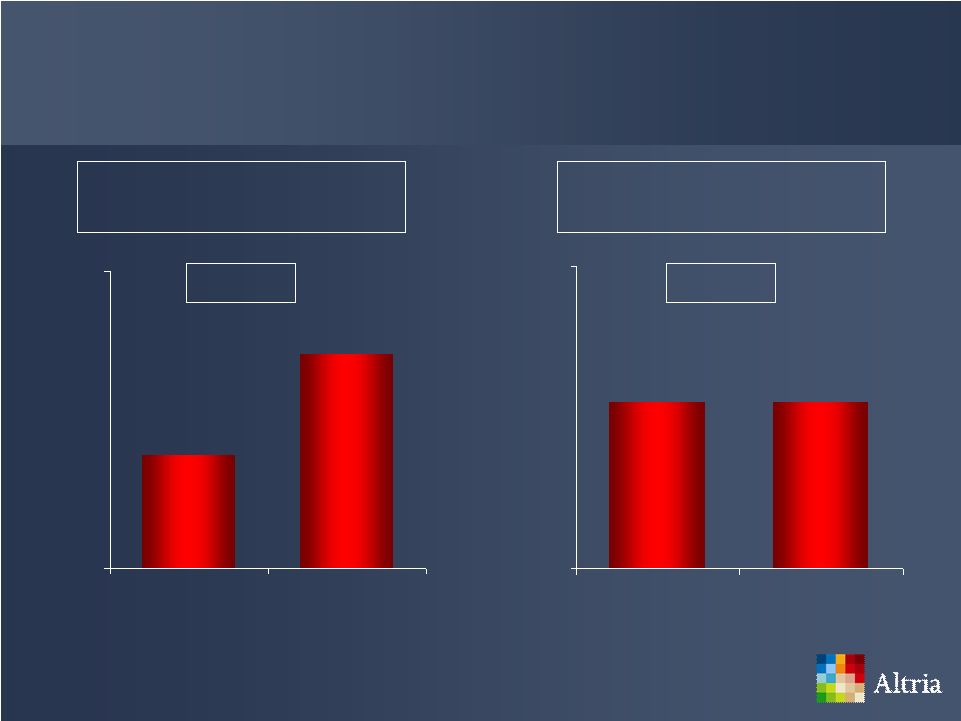 76
Cigarettes Segment’s Results
+1.7pp
Adjusted OCI* Margins
(Percent)
* For reconciliations of non-GAAP to GAAP numbers visit www.altria.com
0.0pp
PM USA’s
Retail Share
50.2%
50.2%
48%
52%
1H 2009
1H 2010
38.6%
36.9%
35%
40%
1H 2009
1H 2010
Source: Altria company reports; IRP SymphonyIRI Group/Capstone Projected Retail Panel Database
|
 77
Smokeless Products Segment
Growing volume in-line or slightly ahead of the category’s
growth rate
A retail share point is potentially worth more in income
tomorrow due to category volume growth*
Investing to build category share profitably should grow future
segment income
* Assumes the same profits per can/pack |
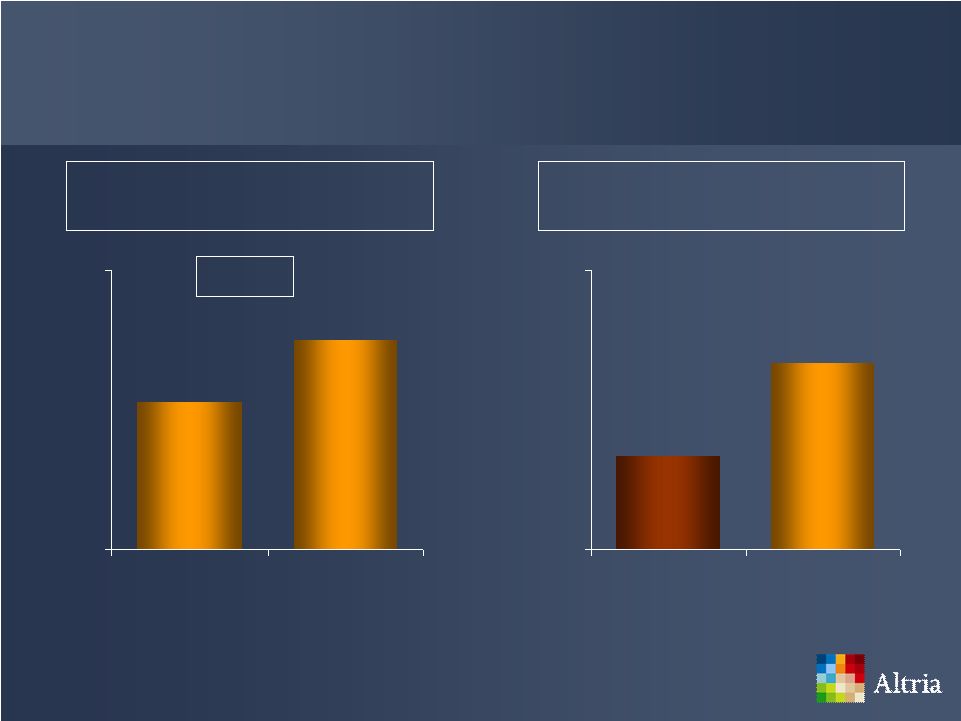 78
Retail Share
+1.8pp
Smokeless Products’
Results
Adjusted Volume Growth
(2Q 2010)
Source: SymphonyIRI Group InfoScan FDMXC Smokeless Tobacco Database; Altria company
reports ~7%
~9%
5%
11%
Smokeless
Category
USSTC & PM
USA combined
54.2%
56.0%
50%
58%
2Q 2009
2Q 2010 |
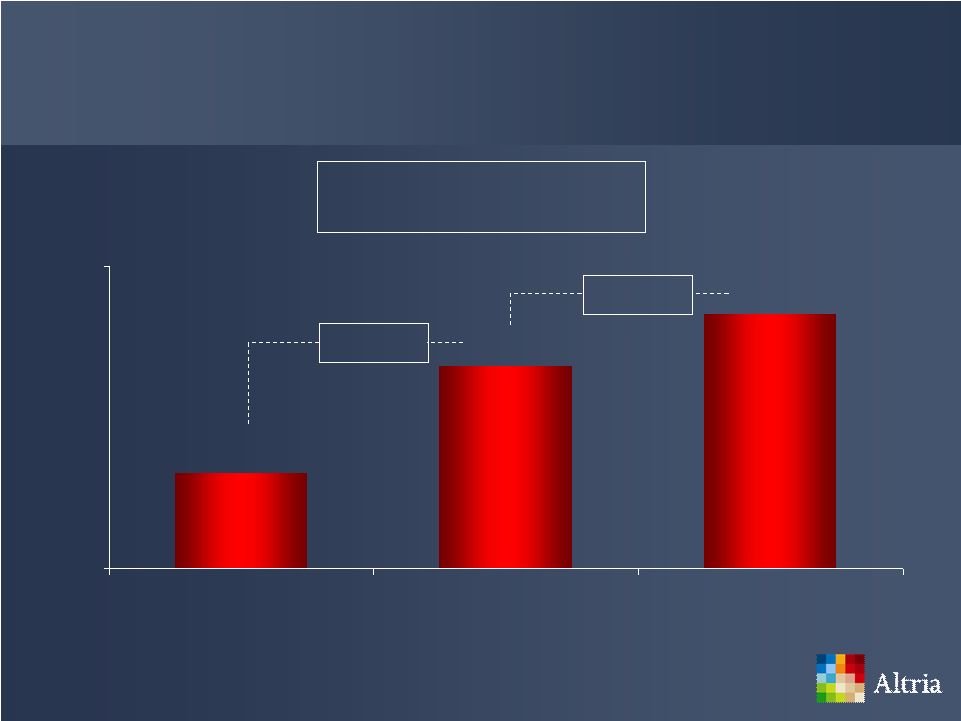
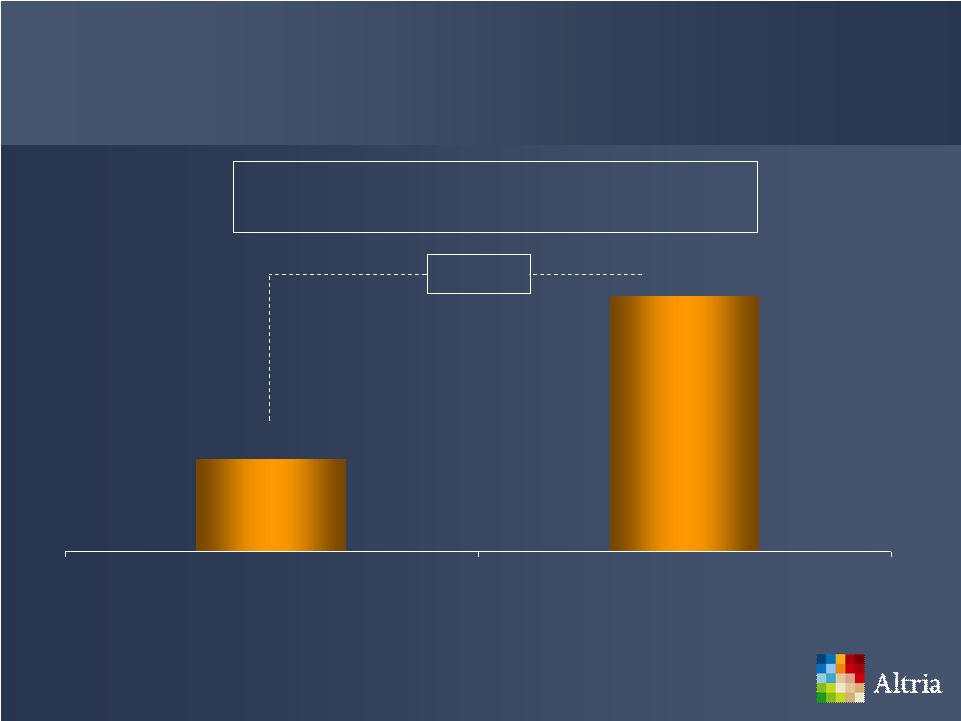 79
Smokeless Products’
Results
Adjusted OCI*
($ in Millions)
* For reconciliation of non-GAAP to GAAP numbers visit www.altria.com
Source: Altria company reports
+15.0%
$339
$390
1H 2009
1H 2010 |
 80
Cigars Segment
Grow strong position in machine-made large cigar category
behind Black & Mild
A retail share point today is potentially worth more income
tomorrow because of category volume growth*
* Assumes the same profits per cigar |
 81
Retail Share
+2.8pp
Black
&
Mild
’s
Retail
Share
Source: SymphonyIRI Group InfoScan Cigar Database
This space is blank because
brand images which
appeared in the original
presentation have been
removed.
27.8%
30.6%
25%
33%
4Q 2007
4Q 2009 |
 82
(1.1)pp
Cigar Segment’s Results
Source: SymphonyIRI Group InfoScan Cigar Database; Altria company reports
Adjusted OCI*
($ in Millions)
+7.2%
* For reconciliation of non-GAAP to GAAP numbers visit www.altria.com
$97
$104
$75
$115
1H 2009
1H 2010
29.1%
28.0%
24%
32%
1H 2009
1H 2010
’s
Black
&
Mild
Retail
Share |
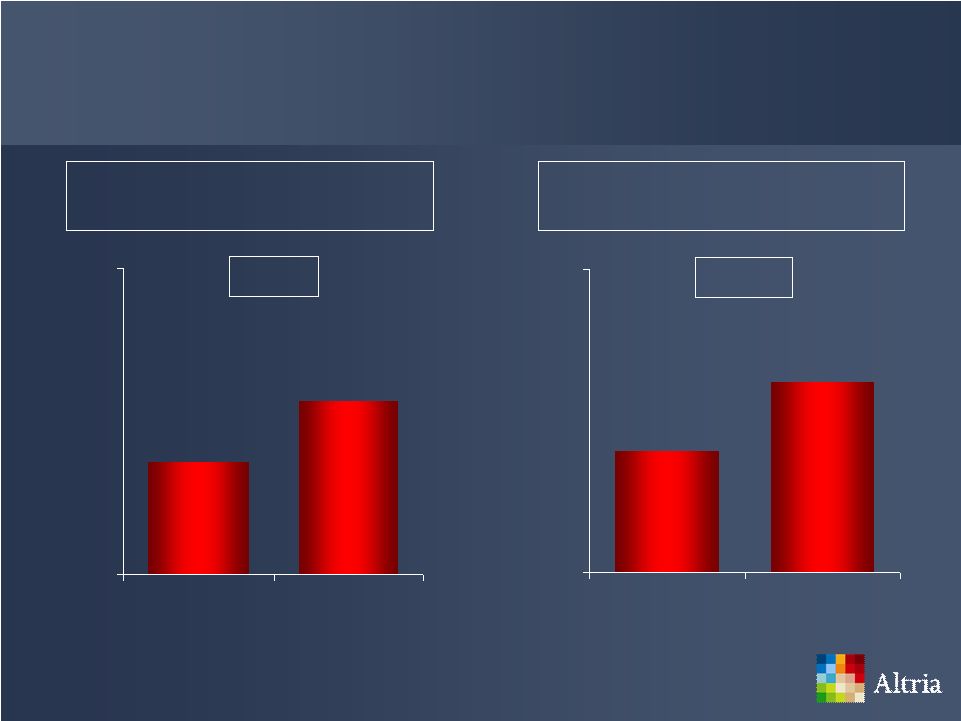
 83
Volume
(Case in Millions)
+15.4%
Wine Segment’s 1H 2010 Results
Source: Altria company reports
Adjusted OCI*
($ in Millions)
+20.8%
* For reconciliation of non-GAAP to GAAP numbers visit www.altria.com
$24
$29
$17
$32
1H 2009
1H 2010
2.6
3.0
2.3
3.3
1H 2009
1H 2010 |
 84
Altria’s Adult Consumer Products Businesses
Successful execution of programs can continue to grow income,
despite challenging environment and competitive marketplace
Solid first-half 2010 adjusted operating companies income growth
Remain confident about our ability to continue building our
positions in these profitable segments with our strong premium
brands |
 85
FDA Regulation
June 2010 marked first anniversary of FDA regulation over
cigarettes and smokeless tobacco
We believe that thoughtfully implemented federal regulation
should benefit tobacco consumers in the long-term
Should contribute to resolving many of the complex issues that
surround cigarettes and smokeless tobacco |
 86
Altria’s Approach to FDA Regulation
Actively participating in processes established by FDA
PM USA submitted and presented information to the FDA’s
Tobacco Products Scientific Advisory Committee (TPSAC)
Shared our belief that there is no science-
or evidence-based
reason that would support a TPSAC recommendation to:
–
Ban menthol cigarettes
–
Impose additional restrictions on them |
 87
Litigation Environment
Company continues to face challenging litigation
Successfully managed litigation in the past
Detailed discussion in Altria’s recent Form 10-Q
Vigorously defended claims for decades and intend to continue
doing so |
 88 |
 89
Non-GAAP Financial Measures
Altria
reports
its
consolidated
financial
results
in
accordance
with
U.S.
generally
accepted
accounting
principles
(GAAP).
Today’s
remarks
and
related
slides
may
contain
various
operating
results
on
both
a
reported
basis
and
on
an
adjusted
basis,
which
excludes
items
that
affect
the
comparability
of
reported
results.
Altria’s
management
reviews
operating
companies
income
(OCI),
which
is
defined
as
operating
income
before
corporate
expenses
and
amortization
of
intangibles,
to
evaluate
segment
performance
and
allocate
resources.
Altria’s
management
also
reviews
OCI,
operating
margins
and
earnings
per
share
(EPS)
as
well
as
other
financial
measures
on
an
adjusted
basis,
which
excludes
certain
income
and
expense
items
that
management
believes
are
not
part
of
the
underlying
operations
because
such
items
can
obscure
underlying
business
trends.
Management
believes
it
is
appropriate
to
disclose
these
measures
to
help
investors
analyze
underlying
business
performance
and
trends.
Such
adjusted
measures
are
regularly
provided
to
management
for
use
in
the
evaluation
of
segment
performance
and
allocation
of
resources.
Reconciliations
of
non-GAAP
measures
included
in
this
presentation
to
the
most
comparable
GAAP
measures
are
shown
at
the
end
of
this
slide
show
presentation
and
are
available
on
Altria’s
website
at
www.altria.com. |
 90
Adjusted OCI for Reporting Segments
Second-Quarter Results
Source: ALCS Finance, reconciliation between GAAP and non-GAAP financial
measures 2010
2009
2010
2009*
2010
2009
2010
2009*
Reported OCI
1,450
$
1,426
$
1.7%
198
$
177
$
11.9%
56
$
36
$
55.6%
12
$
9
$
33.3%
Asset Impairment, exit, integration
and implementation costs
45
47
4
35
-
4
-
1
UST acquisition-related costs
-
-
-
1
-
-
5
5
Adjusted OCI
1,495
$
1,473
$
1.5%
202
$
213
$
(5.2)%
56
$
40
$
40.0%
17
$
15
$
13.3%
Net Revenues
5,589
$
6,024
$
(7.2)%
390
$
373
$
4.6%
155
$
118
$
31.4%
106
$
94
$
12.8%
Less Excise taxes
1,847
2,052
27
24
55
44
4
5
Net Revenues excluding excise
taxes
3,742
$
3,972
$
(5.8)%
363
$
349
$
4.0%
100
$
74
$
35.1%
102
$
89
$
14.6%
Adjusted OCI Margins
40.0%
37.1%
2.9
pp
55.6%
61.0%
(5.4)
pp
56.0%
54.1%
1.9
pp
* Altria acquired UST and its smokeless tobacco and wine businesses on January 6,
2009. As a result, USSTC and Ste. Michelle's financial results from
January 6 through December 31, 2009 are included in Altria's 2009 segment results
for the quarter ended June 30, 2009. Altria Group, Inc. and Subsidiaries,
Selected Financial Data by Reporting Segment for the Quarter ended June 30,
(dollars in millions)
Wine
Second-Quarter Results
Cigarettes
Smokeless Products
Cigars |
 91
Adjusted OCI for Reporting Segments
First-Half Results
Source: ALCS Finance, reconciliation between GAAP and non-GAAP financial
measures 2010
2009
2008
2010
2009*
2010
2009
2008
2010
2009*
Reported OCI
2,680
$
2,569
$
4.3%
2,377
$
8.1%
376
$
175
$
100%+
103
$
90
$
14.4%
91
$
(1.1)%
19
$
10
$
90.0%
Asset Impairment, exit, integration
and implementation costs
74
84
61
13
151
1
7
3
1
4
UST acquisition-related costs
-
-
-
1
13
-
-
-
9
10
Adjusted OCI
2,754
$
2,653
$
3.8%
2,438
$
8.8%
390
$
339
$
15.0%
104
$
97
$
7.2%
94
$
3.2%
29
$
24
$
20.8%
Net Revenues
10,712
$
9,920
$
8.0%
9,149
$
8.4%
771
$
671
$
14.9%
290
$
233
$
24.5%
192
$
21.4%
201
$
169
$
18.9%
Less Excise taxes
3,578
2,732
1,650
53
36
103
60
31
8
8
Less
Revenues
for
contract
volume
Mfg for PMI
-
-
110
-
-
-
-
-
-
-
Adjusted
Net
Revenues
¹
7,134
$
7,188
$
(0.8)%
7,389
$
(2.7)%
718
$
635
$
13.1%
187
$
173
$
8.1%
161
$
7.5%
193
$
161
$
19.9%
Adjusted OCI Margins
38.6%
36.9%
1.7
pp
33.0%
54.3%
53.4%
0.9
pp
55.6%
56.1%
(0.5)
pp
58.4%
Operating Costs²
328
$
296
$
Domestic
Smokeless
Volume
³
368.0
308.3
Operating
Costs
per
can
4
0.89
$
0.96
$
¹
Adjusted
Net
Revenues
are
net
of
excise
taxes
and
contract
volume
manufactured
for
PMI
²
Adjusted Net Revenues less Adjusted Operating Companies Income
³
Volume
is
millions
of
units.
2009
Excludes
volume
(10.9m
cans)
from
Jan
1
-
Jan
6,
2009
shipped
by
USSTC
prior
to
the
UST
acquisition
Operating Costs per can is Operating Costs divided by Domestic Smokeless
Volume *
Altria
acquired
UST
and
its
smokeless
tobacco
and
wine
businesses
on
January
6,
2009.
As
a
result,
USSTC
and
Ste.
Michelle's
financial
results
from
January 6 through December 31, 2009 are included in Altria's 2009 segment results
for the six months ended June 30, 2009. Altria Group, Inc. and Subsidiaries,
Selected Financial Data by Reporting Segment for the First Six Months ended June 30,
(dollars in millions)
Wine
First-Half Results
Cigarettes
Smokeless Products
Cigars
4 |
 92
Adjusted OCI for Reporting Segments
Full-Year Results
Source: ALCS Finance, reconciliation between GAAP and non-GAAP financial
measures Smokeless
Products
Wine
2009
2008
2007
2009*
2009
2008
2007**
2009*
Reported OCI
5,055
$
4,866
$
4,511
$
381
$
176
$
164
$
7
$
43
$
Asset Impairment, exit, integration
and implementation costs
254
166
371
236
9
18
-
9
Provision for Scott Case
-
-
26
-
-
-
-
-
UST acquisition-related costs
-
-
-
15
-
-
-
21
Adjusted OCI
5,309
$
5,032
$
4,908
$
632
$
185
$
182
$
7
$
73
$
Net Revenues
20,919
$
18,753
$
18,470
$
1,366
$
520
$
387
$
15
$
403
$
Less Excise taxes
6,465
3,338
3,449
88
162
61
3
17
Less Revenues for contract volume
Mfg for PMI
-
298
-
-
-
-
-
-
Adjusted Net Revenues¹
14,454
$
15,117
$
15,021
$
1,278
$
358
$
326
$
12
$
386
$
Adjusted OCI Margins
36.7%
33.3%
32.7%
% point change 2009 adjusted OCI
margin versus 2007 adjusted OCI margin
4.0
pp
¹
Adjusted Net Revenues are net of excise taxes and contract volume manufactured for
PMI * Altria acquired UST and its smokeless tobacco and wine businesses on
January 6, 2009. As a result, USSTC and Ste. Michelle's financial results from
January 6 through December 31, 2009 are included in Altria's 2009 segment results
for the year ended December 31, 2009. ** Altria acquired John Middleton and
its machine-made large cigar business on December 15, 2007. As a result, John Middleton's financial results from
December 15 through December 31, 2007 are included in Altria's 2007 segment results
for the year ended December 31, 2007. Altria Group, Inc. and Subsidiaries,
Selected Financial Data by Reporting Segment for the Years ended December 31,
(dollars in millions)
Full-Year Results
Cigarettes
Cigars |
 93
Altria’s Adjusted Diluted EPS
for Years Ended December 31
Source: ALCS Finance, reconciliation between GAAP and non-GAAP financial
measures Change
Reported diluted EPS
$1.81 -
$1.85
1.54
$
18% to 20%
Asset Impairment, exit, integration and
implementation costs
0.04
0.19
UST acquisition-related costs*
0.01
0.06
SABMiller special items
0.03
-
Tax items
(0.02)
(0.04)
Adjusted diluted EPS
$1.87 -
$1.91
1.75
$
7% to 9%
* Excludes exit and integration costs
2009 Actual
Full Year
Altria’s Full-Year Earnings Per Share Forecast Excluding Special
Items 2007
Reported diluted EPS from continuing
operations
1.54
$
1.48
$
1.48
$
Asset Impairment, exit, integration and
implementation costs
0.19
0.15
0.15
Interest on tax reserve transfers to Kraft
Foods Inc. (Kraft)
-
-
0.02
Recoveries from airline industry exposure
-
-
(0.06)
Gain on sale of corporate headquarters
building
-
(0.12)
-
Loss on early extinguishment of debt
-
0.12
-
UST acquisition-related costs*
0.06
0.02
-
SABMiller special items
-
0.03
-
Tax items
(0.04)
(0.03)
(0.09)
Adjusted diluted EPS from continuing
operations
1.75
$
1.65
$
1.50
$
% change in adjusted diluted EPS
from continuing operations versus
prior-year period
6.1%
10.0%
* Excludes exit and integration costs
Altria’s Adjusted Results Excluding Special Items
Full Year
2009
2008
2010 Estimated |
 94
Source: Reconciliation between GAAP and non-GAAP financial measures from UST
financials UST LLC Adjusted Operating Profits for Reporting
Segments Full-Year and First-Half Results
First-Half Results
Smokeless
Tobacco
2008
Smokeless Tobacco GAAP
Operating Profit
429.8
$
Antitrust litigation
1.5
Restructuring charges
1.3
Adjusted non-GAAP Operating
Profit
432.6
$
Smokeless Tobacco Net Sales
767.3
$
Operating Costs
¹
334.7
$
Domestic Smokeless Volume
²
331.9
Operating Costs per can
1.01
$
¹
Net Sales less Adjusted non-GAAP Operating Profit
²
Volume is millions of units
Source: UST Financials
UST LLC, Selected Financial Data by Reporting
Segment for Six Months ended June 30,
(dollars in millions)
Full-Year Results
Smokeless
Tobacco
2007
Smokeless Tobacco GAAP
Operating Profit
715.7
$
Antitrust litigation
137.1
Restructuring charges
8.2
Adjusted non-GAAP Operating
Profit
861.0
$
Smokeless Tobacco net sales
1,546.6
$
Adjusted Operating Margins
55.7%
UST LLC, Selected Financial Data by Reporting
Segment for the Full-Year ended December 31,
(dollars in millions) |