Attached files
| file | filename |
|---|---|
| 8-K - FORM 8-K - Higher One Holdings, Inc. | d8k.htm |
| EX-99.1 - PRESS RELEASE - Higher One Holdings, Inc. | dex991.htm |
 Higher One
Holdings, Inc. Q2’10 Earnings Results
August 11 , 2010
Exhibit 99.2
th |
 ®
©2010 Higher One and the Higher One logo are registered trademarks of Higher One, Inc.
2
Forward-Looking Statements
This presentation includes forward-looking statements, as defined by the Securities and
Exchange Commission. Management’s projections and expectations are subject
to a number of risks and uncertainties that could cause actual performance to differ
materially from those predicted or implied. These statements speak only as of the
date they are made, and the company does not intend to update or otherwise revise the
forward-looking information to reflect actual results of operations, changes in
financial condition, changes in estimates, expectations or assumptions, changes in general
economic or industry conditions or other circumstances arising and/or existing since
the preparation of this presentation or to reflect the occurrence of any unanticipated
events. The forward-looking statements in this presentation do not include
the potential impact of any acquisitions or divestitures that may be announced and/or
completed after the date hereof. Information about the factors that could affect future
performance
can
be
found
in
our
recent
SEC
filings,
available
on
our
website
at
http://ir.higherone.com/.
This presentation includes certain metrics presented on a non-GAAP basis,
including non-GAAP adjusted EBITDA, non-GAAP adjusted EBITDA margin,
non-GAAP adjusted net income, non-GAAP adjusted diluted EPS, and non-GAAP
Free Cash Flow. We believe that these non-GAAP measures, which exclude
amortization of intangibles, stock based compensation, and certain one-time or
non-cash impacts to our results, all net of taxes, provide useful information
regarding normalized trends relating to the company’s financial condition and
results of operations. Reconciliations of these non-GAAP measures to their closest
comparable GAAP measure are included in the appendix of this presentation.
|
 ®
©2010 Higher One and the Higher One logo are registered trademarks of Higher One, Inc.
3
Q2’10 Summary
•
Strong performance on both top and bottom line
•
Executing against our priorities
–
Increased OneAccount adoption at existing clients
–
Strong YTD sales for both OneDisburse and CASHNet
Suite of Payment Products
•
Completed our Initial Public Offering in June
–
Raised $37.8M in net proceeds
–
Paid down $10.5 outstanding on line of credit |
 ®
©2010 Higher One and the Higher One logo are registered trademarks of Higher One, Inc.
4
Q2’10 Summary…
Revenue
*Calculation of organic revenue growth is included in the appendix of this presentation
Revenue
(in $ millions)
12.5
20.5
25.3
37.6
26.9
Q2'09
Q3'09
Q4'09
Q1'10
Q2'10
Y/Y Revenue Growth
--
--
--
118%
116%
Y/Y Organic Growth*
--
--
--
87%
80%
Gross Profit Margin
61.9%
68.6%
66.4%
70.1%
64.4% |
 ®
©2010 Higher One and the Higher One logo are registered trademarks of Higher One, Inc.
5
Q2’10 Summary…
Net Income
Net Income
(in $ millions)
0.4
4.8
5.0
8.3
1.8
Q2'09
Q3'09
Q4'09
Q1'10
Q2'10
Y/Y Net Income Growth
--
--
--
104%
343%
Net Income Margin
3.3%
23.4%
19.6%
22.0%
6.8% |
 ®
©2010 Higher One and the Higher One logo are registered trademarks of Higher One, Inc.
6
Q2’10 Summary…
Adj. EBITDA
*Calculation of Adj. EBITDA and Adj. EBITDA Margin is included in the appendix of this
presentation Adjusted EBITDA
(in $ millions)
3.0
9.1
10.3
17.9
9.2
Q2'09
Q3'09
Q4'09
Q1'10
Q2'10
Y/Y Adj. EBITDA Growth
--
--
--
121%
207%
Adj. EBITDA Margin*
24.0%
44.3%
40.8%
47.7%
34.2% |
 ®
©2010 Higher One and the Higher One logo are registered trademarks of Higher One, Inc.
7
Q2’10 Summary…
GAAP Diluted EPS
GAAP Diluted EPS
(in $)
0.01
0.09
0.09
0.15
0.03
Q2'09
Q3'09
Q4'09
Q1'10
Q2'10
Y/Y Diluted EPS Growth
--
--
--
95%
324% |
 ®
©2010 Higher One and the Higher One logo are registered trademarks of Higher One, Inc.
8
Q2’10 Summary…
Adj. EPS
*Calculation of Adj. EPS and Adj. Net Income Margin is included in the appendix of this
presentation Adjusted Diluted EPS
(in $)
0.03
0.10
0.11
0.19
0.09
Q2'09
Q3'09
Q4'09
Q1'10
Q2'10
Y/Y Adj. EPS Growth
--
--
--
109%
212%
Adj. Net Income Margin*
12.4%
27.0%
24.4%
28.1%
18.8% |
 ®
©2010 Higher One and the Higher One logo are registered trademarks of Higher One, Inc.
9
Q2’10 Summary…
Operating Cash Flow
Operating Cash Flow
(in $ millions)
(1.2)
6.9
9.2
17.3
(0.1)
Q2'09
Q3'09
Q4'09
Q1'10
Q2'10
Y/Y Operating CF Growth
--
--
--
204%
-89%
Operating CF as a % of Rev
-9.9%
33.8%
36.5%
46.1%
-0.5% |
 ®
©2010 Higher One and the Higher One logo are registered trademarks of Higher One, Inc.
10
Q2’10 Summary…
Free Cash Flow
*Calculation of Free Cash Flow is included in the appendix of this presentation
Free Cash Flow
(in $ millions)
-1.5
6.4
8.1
16.2
-1.4
Q2'09
Q3'09
Q4'09
Q1'10
Q2'10
Y/Y FCF Growth
--
--
--
199%
-4%
FCF Yield
-11.8%
31.4%
32.0%
43.1%
-5.3%
CapEx as % of Rev
1.9%
2.5%
4.6%
3.0%
4.8% |
 ®
©2010 Higher One and the Higher One logo are registered trademarks of Higher One, Inc.
11
Q2’10 Sales Update
*SSE stands for Signed Student Enrollment, and is the total student enrollment (according to
the most current IPEDs data) at all schools
that have signed contracts for either our OneDisburse or at least one of our CASHNet Payment
Suite products. OneDisburse SSE*
CASHNet Suite SSE*
2,094
2,213
2,331
2,663
2,833
Q2'09
Q3'09
Q4'09
Q1'10
Q2'10
1,650
1,765
1,949
2,202
2,315
Q2'09
Q3'09
Q4'09
Q1'10
Q2'10
+35%
+40% |
 ®
©2010 Higher One and the Higher One logo are registered trademarks of Higher One, Inc.
12
Q2’10 OneAccount Growth
OneAccount Growth
678
1,235
314
243
Q2'09 OneAccounts
Change in OneAccounts
at schools launched
before 6/30/09
New OneAccounts from
schools launched after
6/30/09
Q2'10 OneAccounts
+82% |
 ®
©2010 Higher One and the Higher One logo are registered trademarks of Higher One, Inc.
13
Q2’10 Revenue Breakdown*
*The lighter colors in the graph represent Higher One Payments, Inc. revenue prior to the
acquisition, broken down into the different revenue buckets. Year-over-year growth
rates and revenue by bucket as a % of total revenue are calculated off of the Q2’09
combined Higher One, Inc. and Higher One Payments, Inc. revenue. As a % of total
revenue*
Account
(in $ thousands)
Payment Trxn
(in $ thousands)
Higher Ed. Institution
(in $ thousands)
Other
(in $ thousands)
11,248
20,923
Q2'09
Q2'10
2
2,671
2,199
Q2'09
Q2'10
765
2,744
1,308
Q2'09
Q2'10
449
603
161
Q2'09
Q2'10
70%
78%
14%
10%
13%
10%
4%
2%
+86%
+21%
+32%
-1% |
 ®
©2010 Higher One and the Higher One logo are registered trademarks of Higher One, Inc.
14
Q2’10 Operating Expenses
•
Increased operating leverage from
scale and improved efficiencies
•
Decrease in G&A as a percent of
revenue partially offset by public
company expenses
•
Main driver of PD expense is
employee compensation…
not
ramping headcount as fast as
revenue
•
Absolute dollar value of PD expense
up 38% y/y
•
Making the necessary investments
for the future
•
Excluding stock-based and other
customer acquisition expense, S&M
expense as a percent of revenue
would have been 7.5% in Q2’10
(compared to 11.4% in Q2’09)
•
Additional employee-related expenses
•
Increase in S&M as a percent of
revenue partially offset by efficiency
and scale
G&A
(as a % of rev)
PD
(as a % of rev)
S&M
(as a % of rev)
31.2%
28.9%
Q2'09
Q2'10
4.6%
2.9%
Q2'09
Q2'10
19.8%
20.5%
Q2'09
Q2'10 |
 ®
©2010 Higher One and the Higher One logo are registered trademarks of Higher One, Inc.
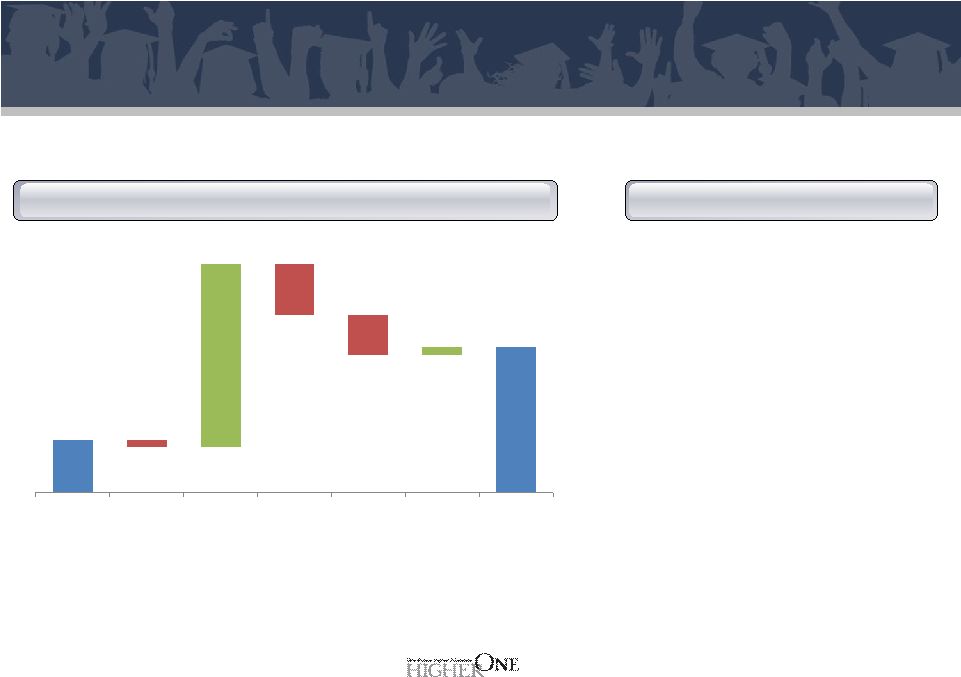
15
Q2’10 Cash Flow / Capital Allocation
•
($1.4M) in FCF
•
Net proceeds of $37.8M from IPO
•
Fully paid down remaining
$10.5M balance on Line of Credit
•
Cash outflow of $8.3M in
acquisition payable
*Other includes proceeds from options exercises and tax benefits
from options exercises
Cash Balance/Flows
(in $ millions)
FCF/Other Movements
$10.6
$29.9
($1.4)
$37.8
($10.5)
($8.3)
$1.7
Q2'10
Beginning
Cash
FCF
Net
Proceeds
from IPO
LoC
Repayment
Acquisition
Payable
Other*
Q2'10
Ending Cash |
 ®
©2010 Higher One and the Higher One logo are registered trademarks of Higher One, Inc.
16
GAAP Guidance Update
FY’10
Q3’10
•
Impacted by stock-based compensation, stock based and other customer
acquisition expense, and amortization of intangibles
•
Stock-based and other customer acquisition expense based on the undergraduate
enrollment at higher education clients acquired relating to the acquisition of
EduCard in 2008 and IDC in 2009 and the market value of shares of ONE at time of
acquisition... difficult to predict both future sales and the share price in the future
Low
High
Low
High
Revenue
$35M
-
$37M
$131M
-
$135M
implied y/y growth
71%
-
80%
73%
-
79%
GAAP Diluted EPS
$0.00
-
$0.08
$0.20
-
$0.32
implied y/y growth
-100%
-
-11%
-25%
-
20% |
 ®
©2010 Higher One and the Higher One logo are registered trademarks of Higher One, Inc.
17
Non-GAAP Guidance Update
*Calculation of Adjusted EPS is included in the appendix of this
presentation
FY’10
Q3’10
•
Continued strength in OneAccount
adoption
•
Full impact of Regulation E begins August 15
•
Higher share count impacting EPS growth in 2H’10
Low
High
Low
High
Revenue
$35M
-
$37M
$131M
-
$135M
implied y/y growth
71%
-
80%
73%
-
79%
Adj. Diluted EPS
$0.12
-
$0.13
$0.48
-
$0.52
implied y/y growth
16%
-
26%
41%
-
53%
th |
 ®
©2010 Higher One and the Higher One logo are registered trademarks of Higher One, Inc.
18
Summary
•
Strong performance on both top and bottom line
•
Executing against our priorities
–
Increased OneAccount adoption at existing clients
–
Strong YTD sales for both OneDisburse and CASHNet
Suite of Payment Products
•
Completed our Initial Public Offering in June
•
Well positioned heading into back half of the year |
 ®
©2010 Higher One and the Higher One logo are registered trademarks of Higher One, Inc.
19
Q & A |
 ®
©2010 Higher One and the Higher One logo are registered trademarks of Higher One, Inc.
20
Appendix |
 ®
©2010 Higher One and the Higher One logo are registered trademarks of Higher One, Inc.
21
Calculation of Organic Revenue
March 31,
June 30,
2010
2010
Total Revenue Growth
118%
116%
Acquisition Impact
(31%)
(36%)
Total Organic Revenue Growth
87%
80%
Three Months Ended |
 ®
©2010 Higher One and the Higher One logo are registered trademarks of Higher One, Inc.
22
Calculation of Free Cash Flow
June 30,
Sept 30,
Dec 31,
March 31,
June 30,
(in thousands)
2009
2009
2009
2010
2010
GAAP Operating Cash Flow
(1,233)
$
6,940
$
9,249
$
17,326
$
(132)
$
Purchases of Fixed Assets, Net of Disposals
(242)
$
(512)
$
(1,158)
$
(1,128)
$
(1,287)
$
Free Cash Flow
(1,475)
$
6,428
$
8,091
$
16,198
$
(1,419)
$
Three Months Ended |
 ®
©2010 Higher One and the Higher One logo are registered trademarks of Higher One, Inc.
23
Calculation of Adjusted EBITDA
June 30,
Sept 30,
Dec 31,
March 31,
June 30,
(in thousands)
2009
2009
2009
2010
2010
GAAP Net Income
413
$
4,793
$
4,967
$
8,264
$
1,830
$
Interest income
(1)
(1)
(2)
(1)
(2)
Interest expense
120
113
164
229
247
Income tax expense
252
2,596
2,810
5,167
1,183
Depreciation and amortization
684
633
1,082
1,626
1,747
EBITDA
1,468
8,134
9,021
15,285
5,005
Other income
-
-
(17)
-
-
Stock-based and other customer acquisition expense
1,050
227
489
1,801
3,508
Stock-based compensation expense
329
341
424
849
692
Milestone bonus
150
375
419
-
-
Adjusted EBITDA
2,997
$
9,077
$
10,336
$
17,935
$
9,205
$
Revenues
12,464
$
20,503
$
25,315
$
37,568
$
26,941
$
Net Income Margin
3.3%
23.4%
19.6%
22.0%
6.8%
Adjusted EBITDA Margin
24.0%
44.3%
40.8%
47.7%
34.2%
Three Months Ended |
 ®
©2010 Higher One and the Higher One logo are registered trademarks of Higher One, Inc.
24
Calculation of Adjusted Diluted EPS
June 30,
Sept 30,
Dec 31,
March 31,
June 30,
(in thousands)
2009
2009
2009
2010
2010
GAAP Net Income
413
$
4,793
$
4,967
$
8,264
$
1,830
$
Stock-based and other customer acquisition expense
1,050
227
489
1,801
3,508
Stock-based compensation expense - ISO
140
152
206
437
373
Stock-based compensation expense - NQO
189
189
218
412
319
Milestone bonus expense
150
375
419
-
-
Amortization of intangibles
143
86
405
767
768
Amortization of finance costs
22
32
37
51
51
Total pre-tax adjustments
1,694
1,061
1,774
3,468
5,019
Tax rate
35.9%
35.9%
35.9%
38.5%
38.7%
Tax adjustment
558
326
563
1,167
1,796
Adjusted net income
1,549
$
5,528
$
6,178
$
10,565
$
5,053
$
Diluted Weighted Average Shares Outstanding
53,344
53,620
53,821
54,872
55,688
Diluted EPS
0.01
$
0.09
$
0.09
$
0.15
$
0.03
$
Adjusted Diluted EPS
0.03
$
0.10
$
0.11
$
0.19
$
0.09
$
Revenues
12,464
$
20,503
$
25,315
$
37,568
$
26,941
$
Net Income Margin
3.3%
23.4%
19.6%
22.0%
6.8%
Adjusted Net Income Margin
12.4%
27.0%
24.4%
28.1%
18.8%
Three Months Ended |
 ®
©2010 Higher One and the Higher One logo are registered trademarks of Higher One, Inc.
25
Reconciliation of GAAP to non-GAAP Guidance
Revenues
$35.0
-
$37.0
$35.0
-
$37.0
Diluted EPS
$0.00
-
$0.08
$0.12
-
$0.13
September 30, 2010
GAAP
Non-GAAP (a)
Three Months Ending
Revenues
$131.0
-
$135.0
$131.0
-
$135.0
Diluted EPS
$0.20
-
$0.32
$0.48
-
$0.52
December 31, 2010
GAAP
Non-GAAP (b)
Twelve Months Ending
(a)
Estimated
Non-GAAP
amounts
above
for
the
three
months
ending
September
30,
2010,
reflect
the
estimated
quarterly
adjustments
that
exclude
(i)
the
amortization
of
intangibles
and
finance
costs
of
approximately
$500,000,
(ii)
stock-based
compensation
expense
of
approximately
$550,000,
and
(iii)
stock-based
and
other
customer
acquisition
expense
of
approximately
$2.0
million
to
$6.0
million.
(b)
Estimated
Non-GAAP
amounts
above
for
the
twelve
months
ending
December
31,
2010,
reflect
the
estimated
annual
adjustments,
net
of
tax,
that
exclude
the
amortization
of
intangibles
and
finance
costs
of
approximately
$2.0
million,
stock-based
compensation
expense
of
approximately
$2.5
million,
and
stock-based
and
other
customer
acquisition
expense
of
approximately
$7.0
million
to
$12.0
million.
Stock-based
and
other
customer
acquisition
expense
primarily
relates
to
our
acquisition
of
EduCard
in
2008
and
IDC
in
2009,
in
connection
with
which
we
issued
restricted
stock.
We
calculate
the
stock-based
and
other
customer
acquisition
expense
based
on
the
undergraduate
enrollment
at
higher
education
clients
acquired
relating
to
the
acquisition,
and
the
market
value
of
our
common
stock
at
the
time
the
client
is
acquired.
It
is
difficult
to
predict
with
any
degree
of
certainty
either
the
number
of
new
higher
education
clients
we
will
acquire,
the
timing
of
future
customer
acquisitions,
or
the
market
value
of
our
common
stock
at
any
time,
resulting
in
a
wide
range
of
expected
expense.
Stock-based
and
other
customer
acquisition
expense
primarily
relates
to
our
acquisition
of
EduCard
in
2008
and
IDC
in
2009,
in
connection
with
which
we
issued
restricted
stock.
We
calculate
the
stock-based
and
other
customer
acquisition
expense
based
on
the
undergraduate
enrollment
at
higher
education
clients
acquired
relating
to
the
acquisition,
and
the
market
value
of
our
common
stock
at
the
time
the
client
is
acquired.
It
is
difficult
to
predict
with
any
degree
of
certainty
either
the
number
of
new
higher
education
clients
we
will
acquire,
the
timing
of
future
customer
acquisitions,
or
the
market
value
of
our
common
stock
at
any
time,
resulting
in
a
wide
range
of
expected
expense. |