Attached files
| file | filename |
|---|---|
| 8-K - 8-K - FiberTower CORP | a10-15354_18k.htm |
| EX-99.1 - EX-99.1 - FiberTower CORP | a10-15354_1ex99d1.htm |
Exhibit 99.2
|
|
FiberTower Corporation Second Quarter 2010 Results August 6, 2010 |
|
|
Safe Harbor Statement Statements included in this presentation which are not historical in nature are “forward-looking” statements, as that term is defined in the Private Securities Litigation Reform Act of 1995 or by the Securities and Exchange Commission, or SEC, in its rules, regulations and releases. Forward-looking statements relate to expectations, beliefs, projections, future plans and strategies, anticipated events or trends and similar expressions concerning matters that are not historical facts. These include statements regarding, among other things, our future financial performance and results of operations, guidance for expected ranges of 2010 revenue, Adjusted EBITDA and capital expenditures, our financial and business prospects, the deployment of services, capital requirements, financing prospects, planned capital expenditures, expected cost per site, anticipated customer growth, expansion plans, and anticipated cash balances. There are many risks, uncertainties and other factors that can prevent the achievement of goals or cause results to differ materially form those expressed or implied by these forward-looking statements including, among other things, negative cash flows and operating losses, additional liquidity requirements, potential loss of significant customers, downturns in the wireless communications industry, regulatory costs and restrictions, potential loss of FCC licenses, equipment supply disruptions and cost increases, competition from alternative backhaul service providers and technologies, along with those risk factors described in the Company’s Annual Reports on Form 10-K and Quarterly Reports on Form 10-Q, as filed with the SEC. |
|
|
Kurt Van Wagenen – Quarterly Achievements |
|
|
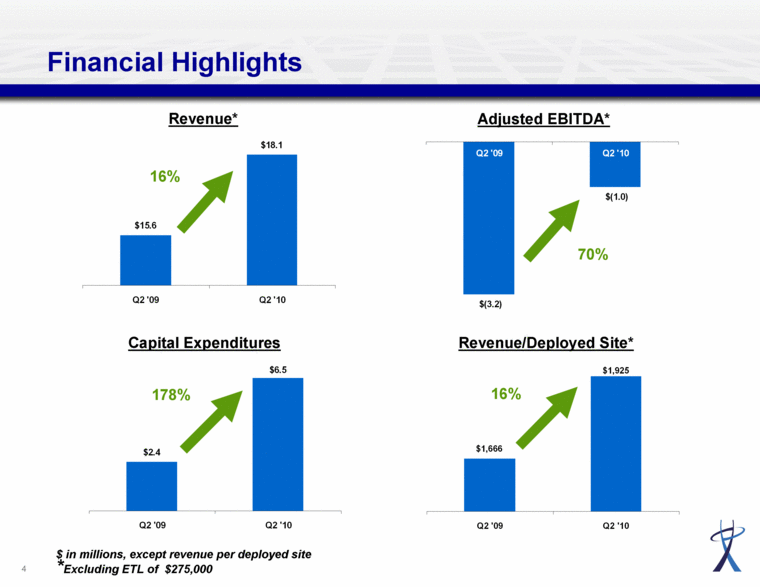
Financial Highlights Adjusted EBITDA* Capital Expenditures Revenue/Deployed Site* Revenue* $ in millions, except revenue per deployed site *Excluding ETL of $275,000 16% 16% 70% 178% $2.4 $6.5 Q2 '09 Q2 '10 $(3.2) $(1.0) Q2 '09 Q2 '10 $1,666 $1,925 Q2 '09 Q2 '10 |
|
|
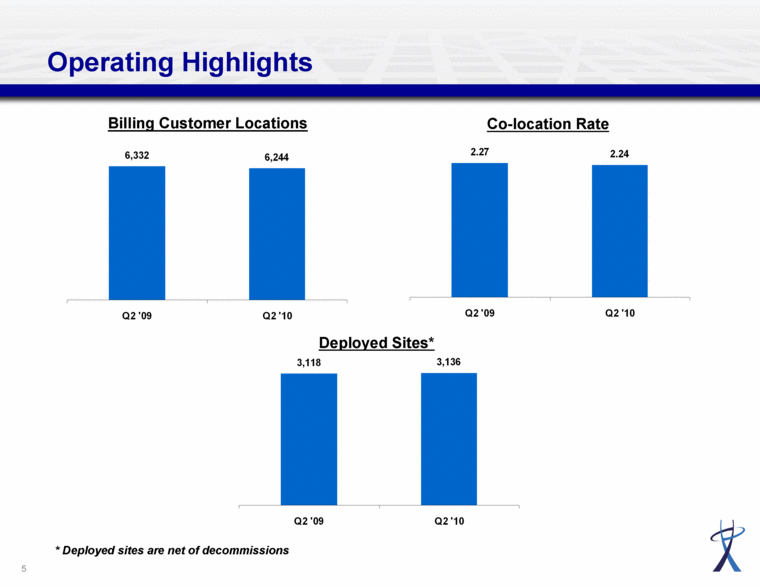
Operating Highlights Billing Customer Locations Co-location Rate Deployed Sites* * Deployed sites are net of decommissions 2.27 2.24 Q2 '09 Q2 '10 3,118 3,136 Q2 '09 Q2 '10 6,332 6,244 Q2 '09 Q2 '10 |
|
|
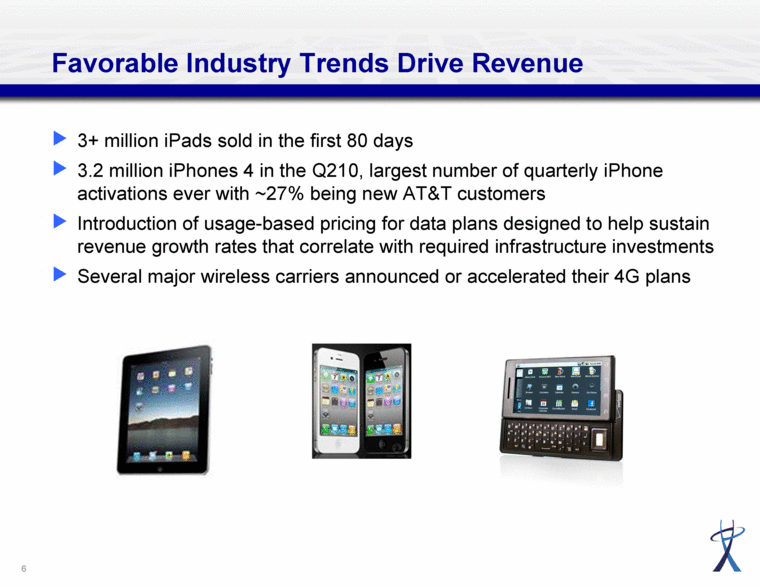
Favorable Industry Trends Drive Revenue 3+ million iPads sold in the first 80 days 3.2 million iPhones 4 in the Q210, largest number of quarterly iPhone activations ever with ~27% being new AT&T customers Introduction of usage-based pricing for data plans designed to help sustain revenue growth rates that correlate with required infrastructure investments Several major wireless carriers announced or accelerated their 4G plans |
|
|
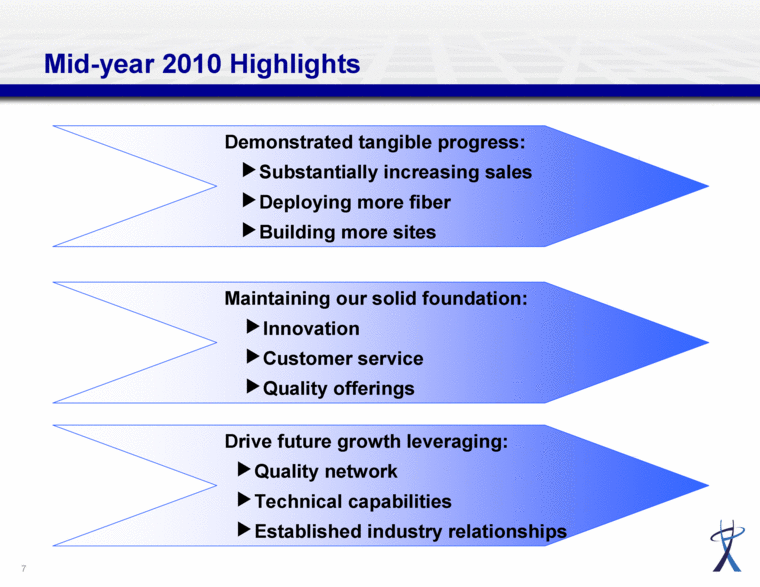
Demonstrated tangible progress: Substantially increasing sales Deploying more fiber Building more sites Drive future growth leveraging: Quality network Technical capabilities Established industry relationships Maintaining our solid foundation: Innovation Customer service Quality offerings Mid-year 2010 Highlights |
|
|
Thomas Scott - Financial Review |
|
|
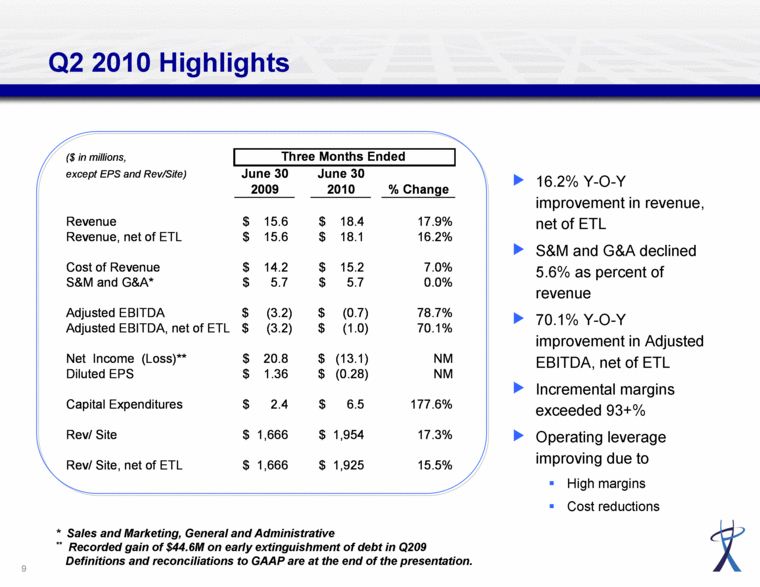
Q2 2010 Highlights 16.2% Y-O-Y improvement in revenue, net of ETL S&M and G&A declined 5.6% as percent of revenue 70.1% Y-O-Y improvement in Adjusted EBITDA, net of ETL Incremental margins exceeded 93+% Operating leverage improving due to High margins Cost reductions * Sales and Marketing, General and Administrative ** Recorded gain of $44.6M on early extinguishment of debt in Q209 Definitions and reconciliations to GAAP are at the end of the presentation. ($ in millions, except EPS and Rev/Site) June 30 June 30 2009 2010 % Change Revenue 15.6 $ 18.4 $ 17.9% Revenue, net of ETL 15.6 $ 18.1 $ 16.2% Cost of Revenue 14.2 $ 15.2 $ 7.0% S&M and G&A* 5.7 $ 5.7 $ 0.0% Adjusted EBITDA (3.2) $ (0.7) $ 78.7% Adjusted EBITDA, net of ETL (3.2) $ (1.0) $ 70.1% Net Income (Loss)** 20.8 $ (13.1) $ NM Diluted EPS 1.36 $ (0.28) $ NM Capital Expenditures 2.4 $ 6.5 $ 177.6% Rev/ Site 1,666 $ 1,954 $ 17.3% Rev/ Site, net of ETL 1,666 $ 1,925 $ 15.5% Three Months Ended |
|
|
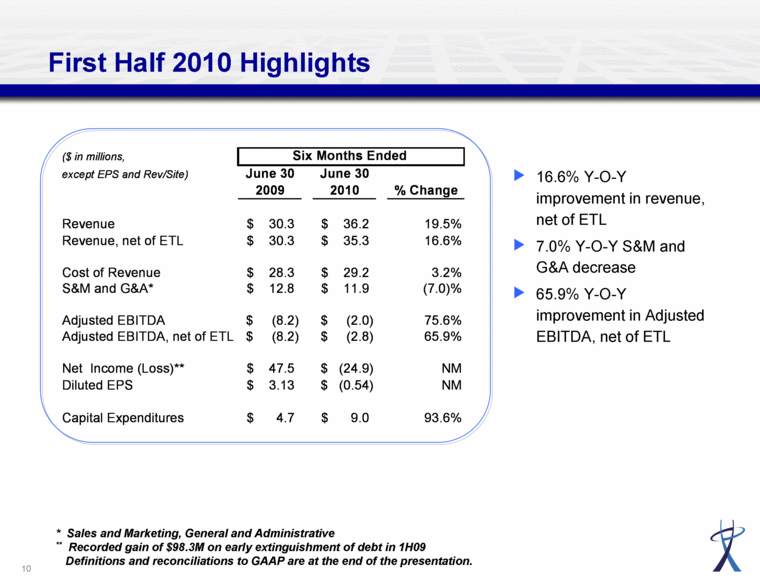
First Half 2010 Highlights 16.6% Y-O-Y improvement in revenue, net of ETL 7.0% Y-O-Y S&M and G&A decrease 65.9% Y-O-Y improvement in Adjusted EBITDA, net of ETL * Sales and Marketing, General and Administrative ** Recorded gain of $98.3M on early extinguishment of debt in 1H09 Definitions and reconciliations to GAAP are at the end of the presentation. ($ in millions, except EPS and Rev/Site) June 30 June 30 2009 2010 % Change Revenue 30.3 $ 36.2 $ 19.5% Revenue, net of ETL 30.3 $ 35.3 $ 16.6% Cost of Revenue 28.3 $ 29.2 $ 3.2% S&M and G&A* 12.8 $ 11.9 $ (7.0)% Adjusted EBITDA (8.2) $ (2.0) $ 75.6% Adjusted EBITDA, net of ETL (8.2) $ (2.8) $ 65.9% Net Income (Loss)** 47.5 $ (24.9) $ NM Diluted EPS 3.13 $ (0.54) $ NM Capital Expenditures 4.7 $ 9.0 $ 93.6% Six Months Ended |
|
|
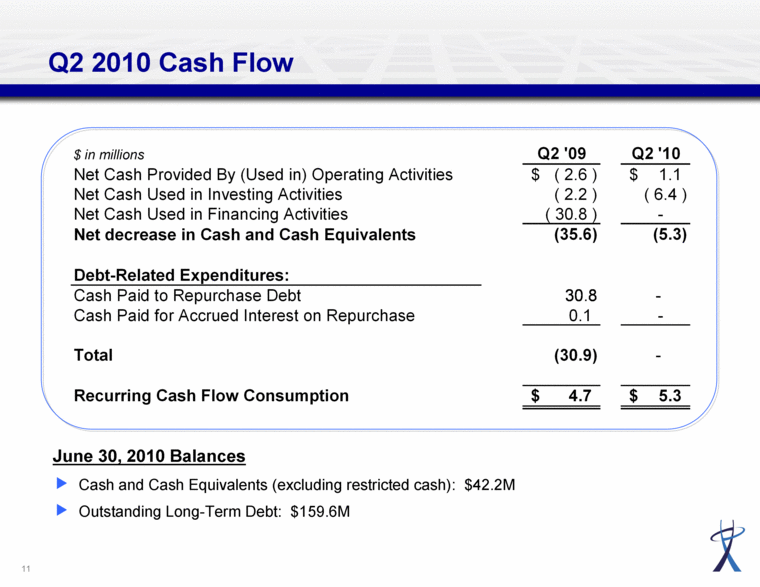
Q2 2010 Cash Flow June 30, 2010 Balances Cash and Cash Equivalents (excluding restricted cash): $42.2M Outstanding Long-Term Debt: $159.6M $ in millions Q2 '09 Q2 '10 Net Cash Provided By (Used in) Operating Activities (2.6) $ 1.1 $ Net Cash Used in Investing Activities (2.2) (6.4) Net Cash Used in Financing Activities (30.8) - Net decrease in Cash and Cash Equivalents (35.6) (5.3) Debt-Related Expenditures: Cash Paid to Repurchase Debt 30.8 - Cash Paid for Accrued Interest on Repurchase 0.1 - Total (30.9) - Recurring Cash Flow Consumption 4.7 $ 5.3 $ |
|
|
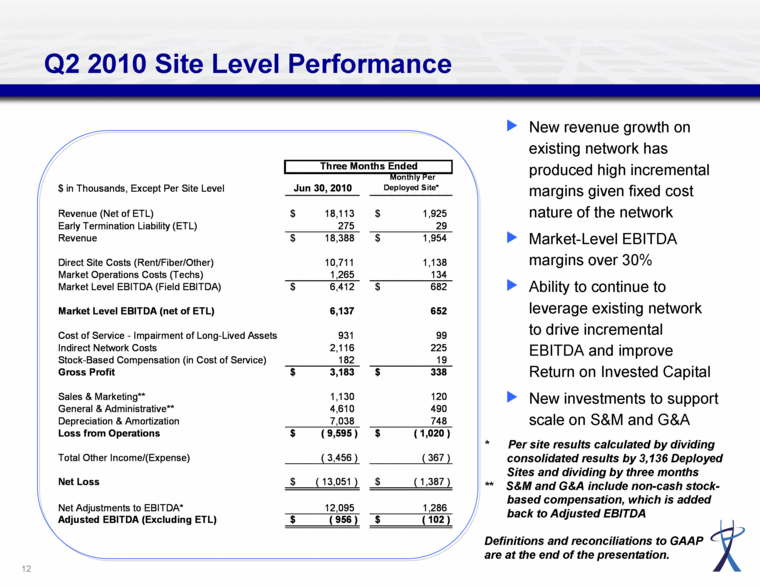
Q2 2010 Site Level Performance New revenue growth on existing network has produced high incremental margins given fixed cost nature of the network Market-Level EBITDA margins over 30% Ability to continue to leverage existing network to drive incremental EBITDA and improve Return on Invested Capital New investments to support scale on S&M and G&A * Per site results calculated by dividing consolidated results by 3,136 Deployed Sites and dividing by three months ** S&M and G&A include non-cash stock- based compensation, which is added back to Adjusted EBITDA Definitions and reconciliations to GAAP are at the end of the presentation. Three Months Ended $ in Thousands, Except Per Site Level Jun 30, 2010 Monthly Per Deployed Site* Revenue (Net of ETL) 18,113 $ 1,925 $ Early Termination Liability (ETL) 275 29 Revenue 18,388 $ 1,954 $ Direct Site Costs (Rent/Fiber/Other) 10,711 1,138 Market Operations Costs (Techs) 1,265 134 Market Level EBITDA (Field EBITDA) 6,412 $ 682 $ Market Level EBITDA (net of ETL) 6,137 652 Cost of Service - Impairment of Long-Lived Assets 931 99 Indirect Network Costs 2,116 225 Stock-Based Compensation (in Cost of Service) 182 19 Gross Profit 3,183 $ 338 $ Sales & Marketing** 1,130 120 General & Administrative** 4,610 490 Depreciation & Amortization 7,038 748 Loss from Operations (9,595) $ (1,020) $ Total Other Income/(Expense) (3,456) (367) Net Loss (13,051) $ (1,387) $ Net Adjustments to EBITDA* 12,095 1,286 Adjusted EBITDA (Excluding ETL) (956) $ (102) $ |
|
|
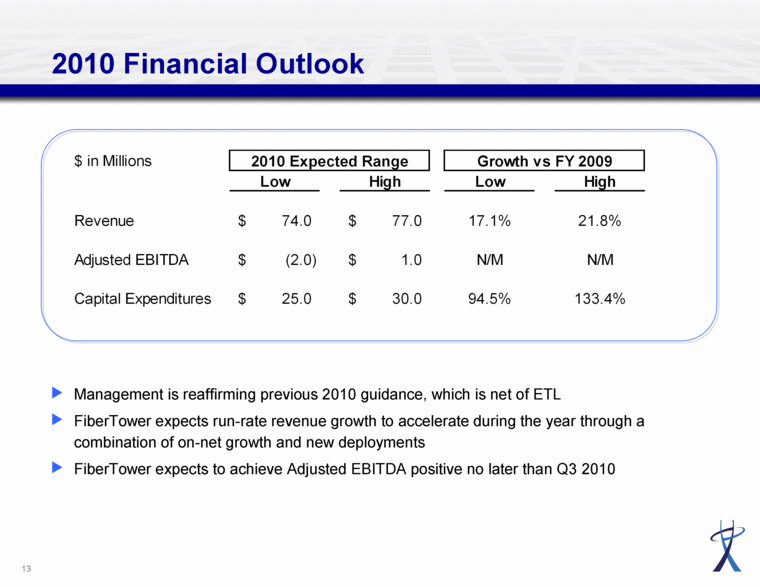
2010 Financial Outlook $ in Millions 2010 Expected Range Growth vs FY 2009 Low High Low High Revenue $74.0 $77.0 17.1% 21.8% Adjusted EBITDA $(2.0) $1.0 N/M N/M Capital Expenditures $25.0 $30.0 94.5% 133.4% Management is reaffirming previous 2010 guidance, which is net of ETL FiberTower expects run-rate revenue growth to accelerate during the year through a combination of on-net growth and new deployments FiberTower expects to achieve Adjusted EBITDA positive no later than Q3 2010 |
|
|
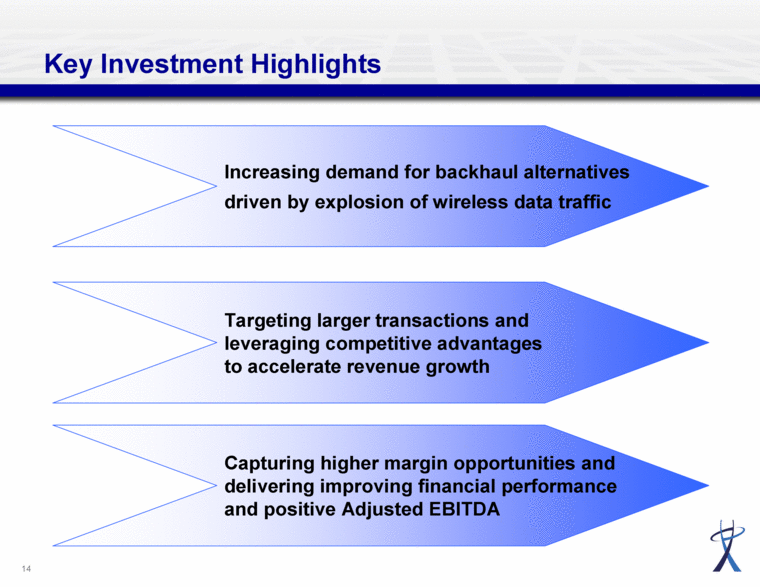
Increasing demand for backhaul alternatives driven by explosion of wireless data traffic Capturing higher margin opportunities and delivering improving financial performance and positive Adjusted EBITDA Targeting larger transactions and leveraging competitive advantages to accelerate revenue growth Key Investment Highlights |
|
|
Q&A |
|
|
Appendix |
|
|
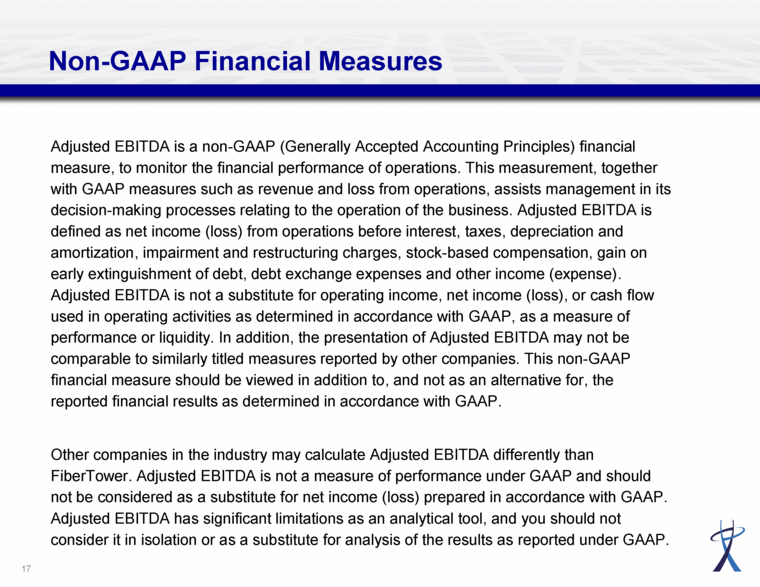
Non-GAAP Financial Measures Adjusted EBITDA is a non-GAAP (Generally Accepted Accounting Principles) financial measure, to monitor the financial performance of operations. This measurement, together with GAAP measures such as revenue and loss from operations, assists management in its decision-making processes relating to the operation of the business. Adjusted EBITDA is defined as net income (loss) from operations before interest, taxes, depreciation and amortization, impairment and restructuring charges, stock-based compensation, gain on early extinguishment of debt, debt exchange expenses and other income (expense). Adjusted EBITDA is not a substitute for operating income, net income (loss), or cash flow used in operating activities as determined in accordance with GAAP, as a measure of performance or liquidity. In addition, the presentation of Adjusted EBITDA may not be comparable to similarly titled measures reported by other companies. This non-GAAP financial measure should be viewed in addition to, and not as an alternative for, the reported financial results as determined in accordance with GAAP. Other companies in the industry may calculate Adjusted EBITDA differently than FiberTower. Adjusted EBITDA is not a measure of performance under GAAP and should not be considered as a substitute for net income (loss) prepared in accordance with GAAP. Other companies in the industry may calculate Adjusted EBITDA differently than FiberTower. Adjusted EBITDA is not a measure of performance under GAAP and should not be considered as a substitute for net income (loss) prepared in accordance with GAAP. Adjusted EBITDA has significant limitations as an analytical tool, and you should not consider it in isolation or as a substitute for analysis of the results as reported under GAAP. |
|
|
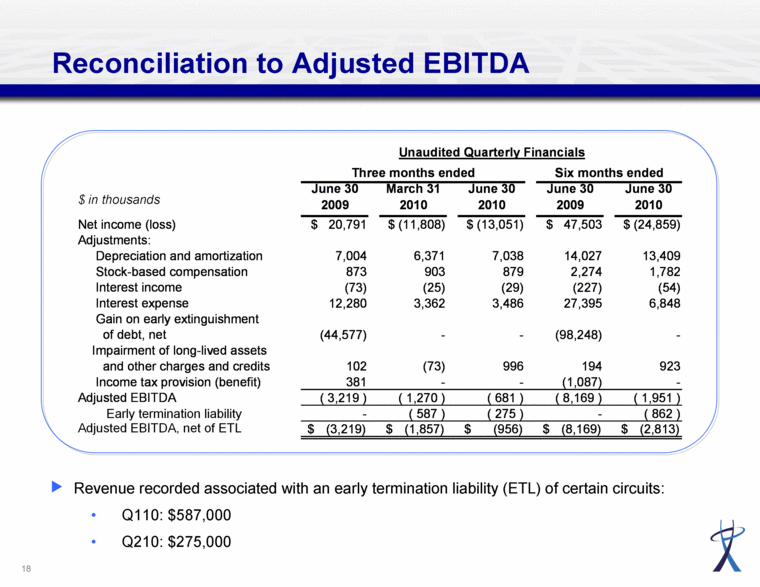
Reconciliation to Adjusted EBITDA Revenue recorded associated with an early termination liability (ETL) of certain circuits: Q110: $587,000 Q210: $275,000 $ in thousands June 30 2009 March 31 2010 June 30 2010 June 30 2009 June 30 2010 Net income (loss) $ 20,791 $ (11,808) $ (13,051) $ 47,503 $ (24,859) Adjustments: Depreciation and amortization 7,004 6,371 7,038 14,027 13,409 Stock-based compensation 873 903 879 2,274 1,782 Interest income (73) (25) (29) (227) (54) Interest expense 12,280 3,362 3,486 27,395 6,848 Gain on early extinguishment of debt, net (44,577) - - (98,248) - Impairment of long-lived assets and other charges and credits 102 (73) 996 194 923 Income tax provision (benefit) 381 - - (1,087) - Adjusted EBITDA (3,219) (1,270) (681) (8,169) (1,951) Early termination liability - (587) (275) - (862) Adjusted EBITDA, net of ETL (3,219) $ (1,857) $ (956) $ (8,169) $ (2,813) $ Three months ended Six months ended Unaudited Quarterly Financials |
|
|
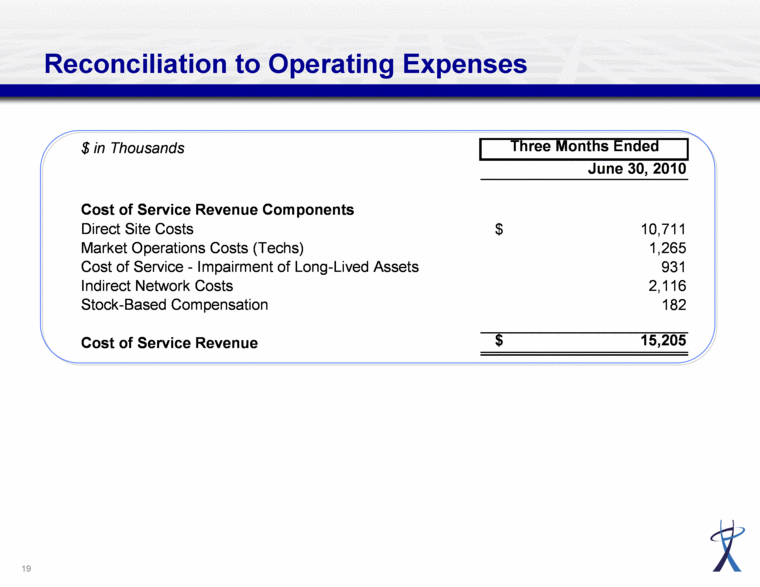
Reconciliation to Operating Expenses $ in Thousands Three Months Ended June 30, 2010 Cost of Service Revenue Components Direct Site Costs $ 10,711 Market Operations Costs (Techs) 1,265 Cost of Service - Impairment of Long-Lived Assets 931 Indirect Network Costs 2,116 Stock-Based Compensation 182 Cost of Service Revenue $ 15,205 |

