Attached files
| file | filename |
|---|---|
| 8-K - 8-K - SCIENTIFIC GAMES CORP | a10-15403_18k.htm |
| EX-99.1 - EX-99.1 - SCIENTIFIC GAMES CORP | a10-15403_1ex99d1.htm |
Exhibit 99.2
|
|
Scientific Games Second Quarter 2010 Earnings Presentation |
|
|
Safe Harbor Statement In this presentation the Company makes "forward-looking statements" within the meaning of the U.S. Private Securities Litigation Reform Act of 1995. Forward-looking statements describe future expectations, plans, results or strategies and can often be identified by the use of terminology such as "may"," "will," "estimate," "intend," "continue," "believe," "expect," "anticipate," "could," "potential," "opportunity," or similar terminology. These statements are based upon management's current expectations, assumptions and estimates and are not guarantees of future results or performance. Actual results may differ materially from those projected in these statements due to a variety of risks and uncertainties and other factors, including, among other things: competition; material adverse changes in economic and industry conditions; technological change; retention and renewal of existing contracts and entry into new or revised contracts; availability and adequacy of cash flow to satisfy obligations and indebtedness or future needs; protection of intellectual property; security and integrity of software and systems; laws and government regulation, including those relating to gaming licenses, permits and operations; inability to identify, complete and integrate future acquisitions; inability to benefit from, and risks associated with, joint ventures and strategic investments and relationships; inability to complete the proposed sale of the racing and venue management businesses; seasonality; inability to identify and capitalize on trends and changes in the lottery and gaming industries; inability to enhance and develop successful gaming concepts; dependence on suppliers and manufacturers; liability for product defects; fluctuations in foreign currency exchange rates and other factors associated with foreign operations; influence of certain stockholders; dependence on key personnel; failure to perform on contracts; resolution of pending or future litigation; labor matters; and stock price volatility. Additional information regarding risks and uncertainties and other factors that could cause actual results to differ materially from those contemplated in forward-looking statements is included from time to time in the Company’s filings with the Securities and Exchange Commission, including under the heading “Risk Factors” in our periodic reports. The date of this presentation is as of August 5, 2010, and the information provided herein is presented through the dates indicated on the applicable slides. Forward-looking statements speak only as of the date they are made and, except for Scientific Games’ ongoing obligations under the U.S. federal securities laws, Scientific Games undertakes no obligation to publicly update any forward-looking statements whether as a result of new information, future events or otherwise. Note Regarding Presentation of Non-GAAP Financial Measures: This presentation and the related discussion include certain financial measures that were not prepared in accordance with U.S. generally accepted accounting principles. Additional information regarding these non-GAAP financial measures, including reconciliations to the most directly comparable U.S. GAAP financial measures, can be found in Scientific Games’ press release dated August 5, 2010. This press release is available on Scientific Games’ website at www.scientificgames.com in the “Investor Information – Press Release” section. |
|
|
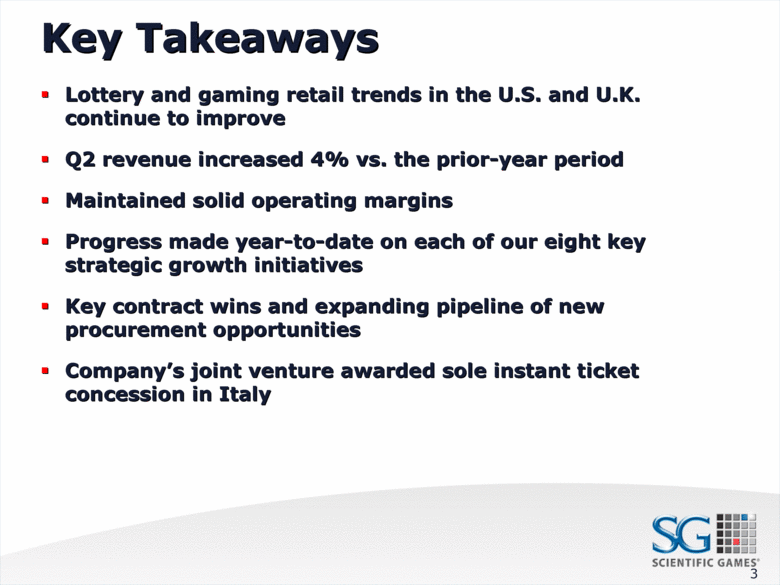
Key Takeaways Lottery and gaming retail trends in the U.S. and U.K. continue to improve Q2 revenue increased 4% vs. the prior-year period Maintained solid operating margins Progress made year-to-date on each of our eight key strategic growth initiatives Key contract wins and expanding pipeline of new procurement opportunities Company’s joint venture awarded sole instant ticket concession in Italy 3 |
|
|
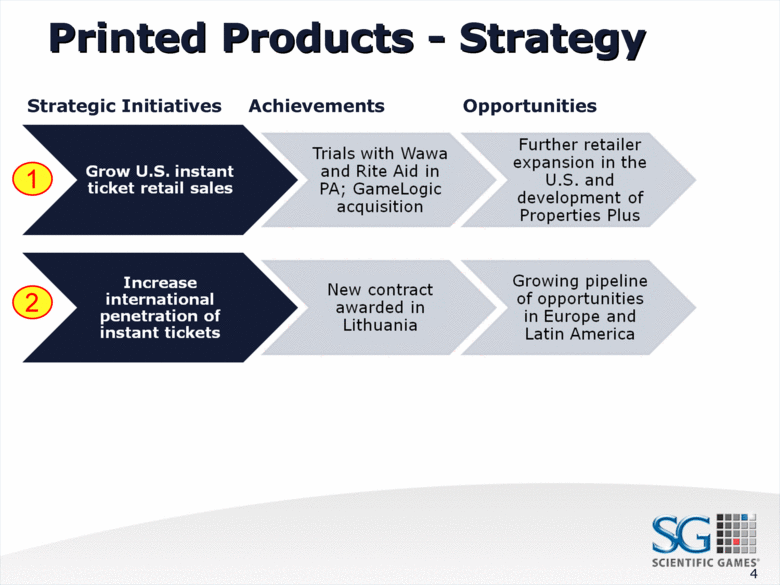
Printed Products - Strategy Strategic Initiatives Achievements Opportunities 4 1 2 |
|
|
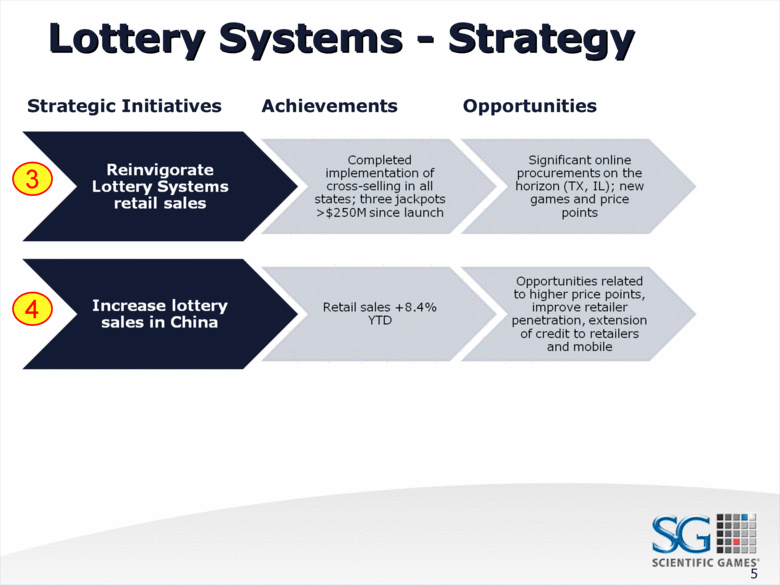
Lottery Systems - Strategy Strategic Initiatives Achievements Opportunities 5 3 4 |
|
|
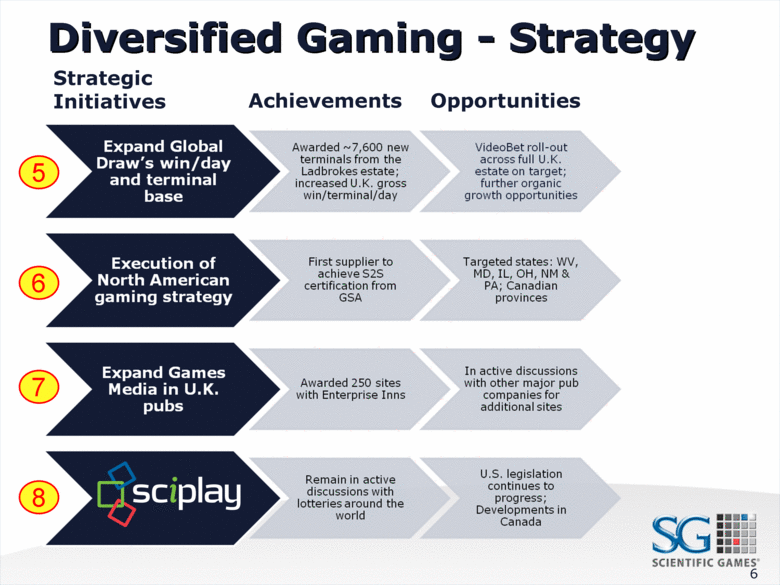
Diversified Gaming - Strategy Strategic Initiatives Achievements Opportunities 6 5 6 7 8 |
|
|
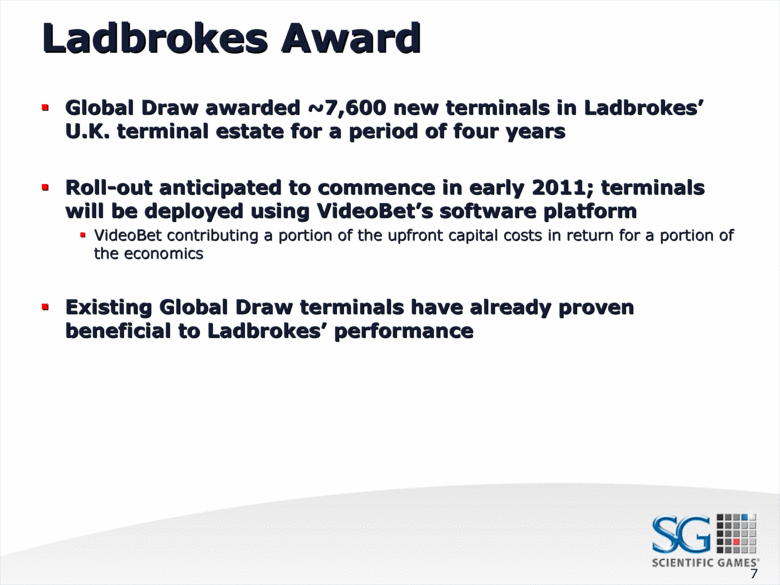
Ladbrokes Award Global Draw awarded ~7,600 new terminals in Ladbrokes’ U.K. terminal estate for a period of four years Roll-out anticipated to commence in early 2011; terminals will be deployed using VideoBet’s software platform VideoBet contributing a portion of the upfront capital costs in return for a portion of the economics Existing Global Draw terminals have already proven beneficial to Ladbrokes’ performance 7 |
|
|
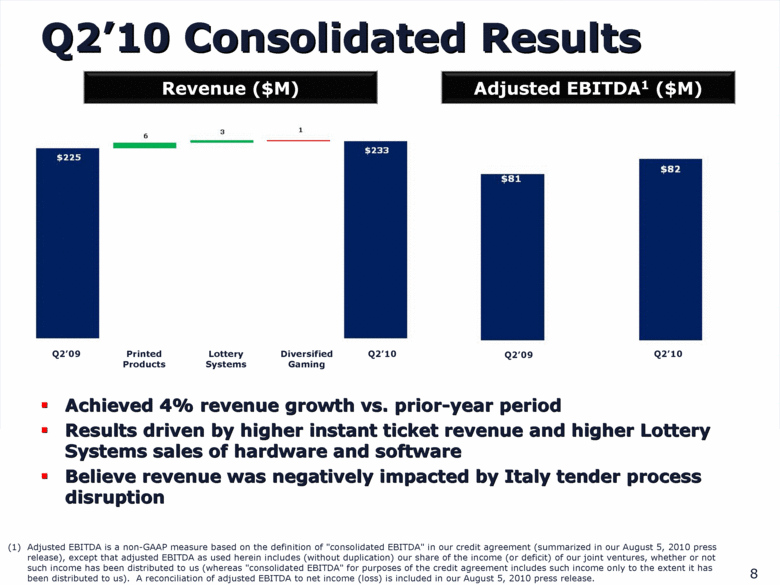
Q2’10 Consolidated Results Achieved 4% revenue growth vs. prior-year period Results driven by higher instant ticket revenue and higher Lottery Systems sales of hardware and software Believe revenue was negatively impacted by Italy tender process disruption Q2’10 Q2’09 Printed Products Lottery Systems Diversified Gaming 8 Adjusted EBITDA is a non-GAAP measure based on the definition of "consolidated EBITDA" in our credit agreement (summarized in our August 5, 2010 press release), except that adjusted EBITDA as used herein includes (without duplication) our share of the income (or deficit) of our joint ventures, whether or not such income has been distributed to us (whereas "consolidated EBITDA" for purposes of the credit agreement includes such income only to the extent it has been distributed to us). A reconciliation of adjusted EBITDA to net income (loss) is included in our August 5, 2010 press release. Q2’09 Q2’10 Adjusted EBITDA1 ($M) Revenue ($M) |
|
|
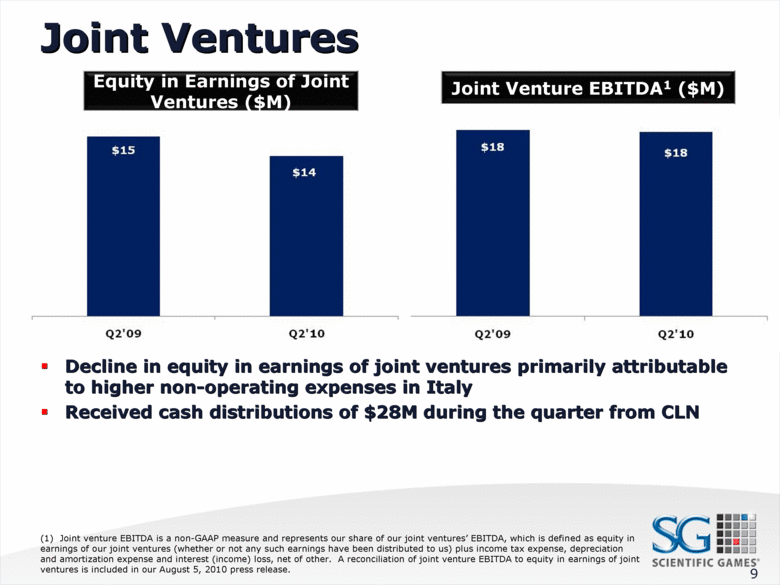
Joint Ventures Decline in equity in earnings of joint ventures primarily attributable to higher non-operating expenses in Italy Received cash distributions of $28M during the quarter from CLN 9 Equity in Earnings of Joint Ventures ($M) Joint Venture EBITDA1 ($M) (1) Joint venture EBITDA is a non-GAAP measure and represents our share of our joint ventures’ EBITDA, which is defined as equity in earnings of our joint ventures (whether or not any such earnings have been distributed to us) plus income tax expense, depreciation and amortization expense and interest (income) loss, net of other. A reconciliation of joint venture EBITDA to equity in earnings of joint ventures is included in our August 5, 2010 press release. |
|
|
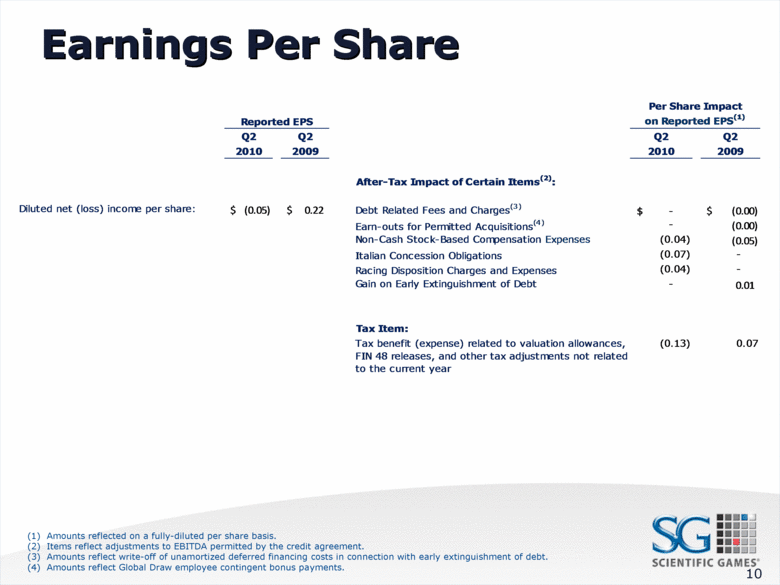
Earnings Per Share Amounts reflected on a fully-diluted per share basis. Items reflect adjustments to EBITDA permitted by the credit agreement. Amounts reflect write-off of unamortized deferred financing costs in connection with early extinguishment of debt. Amounts reflect Global Draw employee contingent bonus payments. 10 Reported EPS Per Share Impact on Reported EPS(1) Q2 Q2 Q2 Q2 2010 2009 2010 2009 Diluted net (loss) income per share: (0.05) $ 0.22 $ Debt Related Fees and Charges(3) - $ (0.00) $ Earn-outs for Permitted Acquisitions(4) - (0.00) Non-Cash Stock-Based Compensation Expenses (0.04) (0.05) Italian Concession Obligations (0.07) - Racing Disposition Charges and Expenses (0.04) - Gain on Early Extinguishment of Debt - 0.01 Tax Item: Tax benefit (expense) related to valuation allowances, FIN 48 releases, and other tax adjustments not related to the current year (0.13) 0.07 After-Tax Impact of Certain Items(2): |
|
|
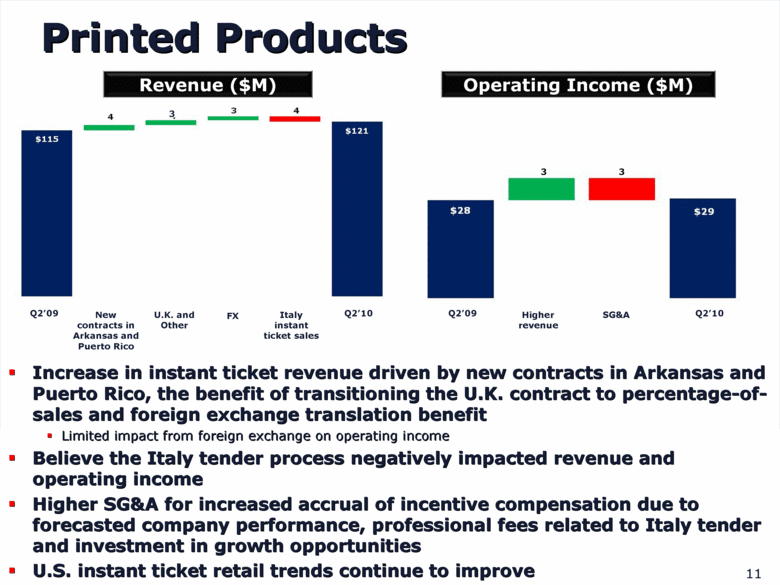
Printed Products Increase in instant ticket revenue driven by new contracts in Arkansas and Puerto Rico, the benefit of transitioning the U.K. contract to percentage-of-sales and foreign exchange translation benefit Limited impact from foreign exchange on operating income Believe the Italy tender process negatively impacted revenue and operating income Higher SG&A for increased accrual of incentive compensation due to forecasted company performance, professional fees related to Italy tender and investment in growth opportunities U.S. instant ticket retail trends continue to improve 11 Q2’10 Q2’09 New contracts in Arkansas and Puerto Rico FX U.K. and Other Italy instant ticket sales Q2’10 Q2’09 3 3 SG&A Higher revenue Operating Income ($M) Revenue ($M) 3 |
|
|
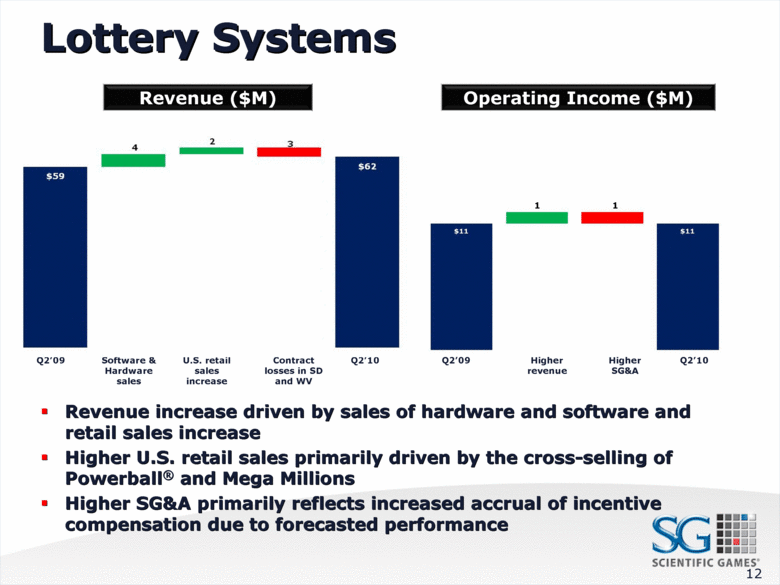
Lottery Systems Revenue increase driven by sales of hardware and software and retail sales increase Higher U.S. retail sales primarily driven by the cross-selling of Powerball® and Mega Millions Higher SG&A primarily reflects increased accrual of incentive compensation due to forecasted performance 12 Revenue ($M) Software & Hardware sales U.S. retail sales increase Contract losses in SD and WV Operating Income ($M) Q2’10 Q2’09 Higher SG&A Higher revenue Q2’10 Q2’09 1 1 |
|
|
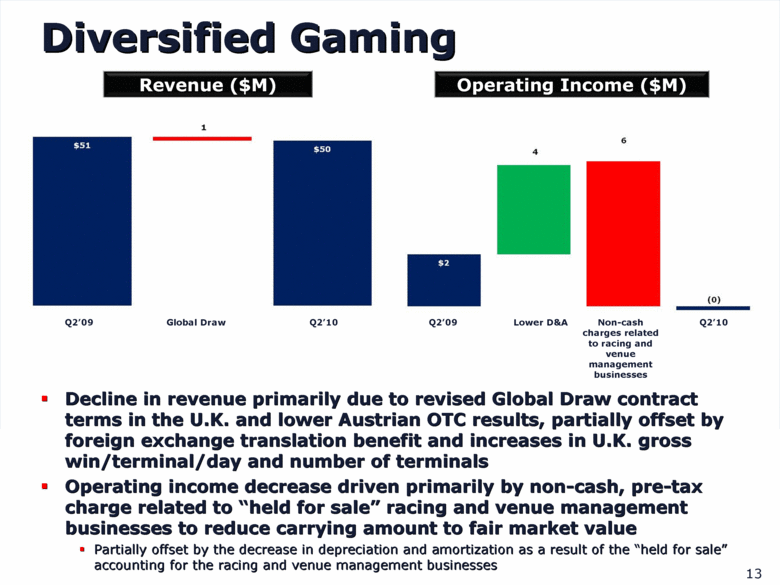
Diversified Gaming Decline in revenue primarily due to revised Global Draw contract terms in the U.K. and lower Austrian OTC results, partially offset by foreign exchange translation benefit and increases in U.K. gross win/terminal/day and number of terminals Operating income decrease driven primarily by non-cash, pre-tax charge related to “held for sale” racing and venue management businesses to reduce carrying amount to fair market value Partially offset by the decrease in depreciation and amortization as a result of the “held for sale” accounting for the racing and venue management businesses 13 Revenue ($M) Operating Income ($M) Q2’10 Q2’09 Global Draw Q2’10 Q2’09 Lower D&A Non-cash charges related to racing and venue management businesses |
|
|
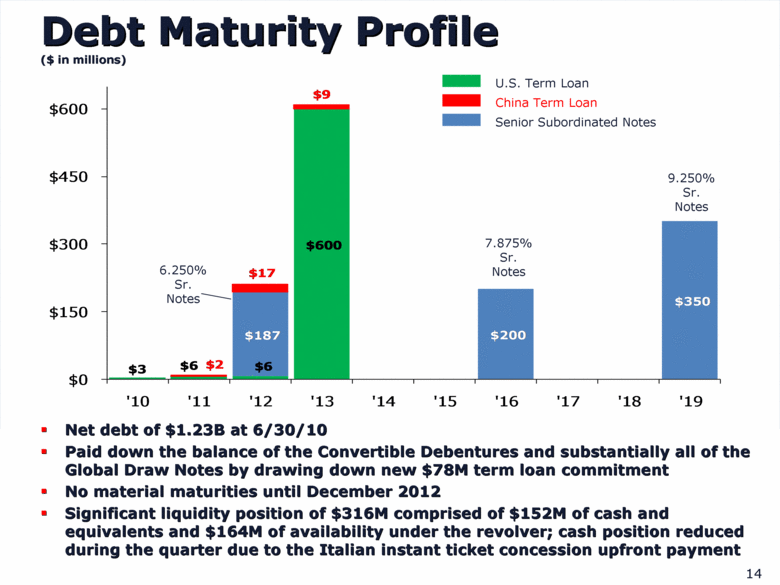
Debt Maturity Profile ($ in millions) Net debt of $1.23B at 6/30/10 Paid down the balance of the Convertible Debentures and substantially all of the Global Draw Notes by drawing down new $78M term loan commitment No material maturities until December 2012 Significant liquidity position of $316M comprised of $152M of cash and equivalents and $164M of availability under the revolver; cash position reduced during the quarter due to the Italian instant ticket concession upfront payment 14 7.875% Sr. Notes 9.250% Sr. Notes 6.250% Sr. Notes U.S. Term Loan China Term Loan Senior Subordinated Notes $3 $6 $6 $600 $187 $200 $350 $2 $17 $9 $0 $150 $300 $450 $600 '10 '11 '12 '13 '14 '15 '16 '17 '18 '19 |
|
|
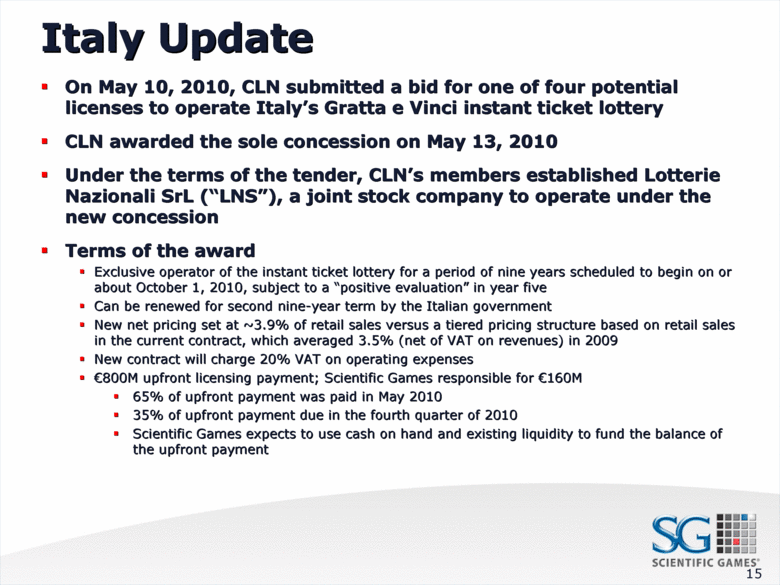
Italy Update On May 10, 2010, CLN submitted a bid for one of four potential licenses to operate Italy’s Gratta e Vinci instant ticket lottery CLN awarded the sole concession on May 13, 2010 Under the terms of the tender, CLN’s members established Lotterie Nazionali SrL (“LNS”), a joint stock company to operate under the new concession Terms of the award Exclusive operator of the instant ticket lottery for a period of nine years scheduled to begin on or about October 1, 2010, subject to a “positive evaluation” in year five Can be renewed for second nine-year term by the Italian government New net pricing set at ~3.9% of retail sales versus a tiered pricing structure based on retail sales in the current contract, which averaged 3.5% (net of VAT on revenues) in 2009 New contract will charge 20% VAT on operating expenses €800M upfront licensing payment; Scientific Games responsible for €160M 65% of upfront payment was paid in May 2010 35% of upfront payment due in the fourth quarter of 2010 Scientific Games expects to use cash on hand and existing liquidity to fund the balance of the upfront payment 15 |
|
|
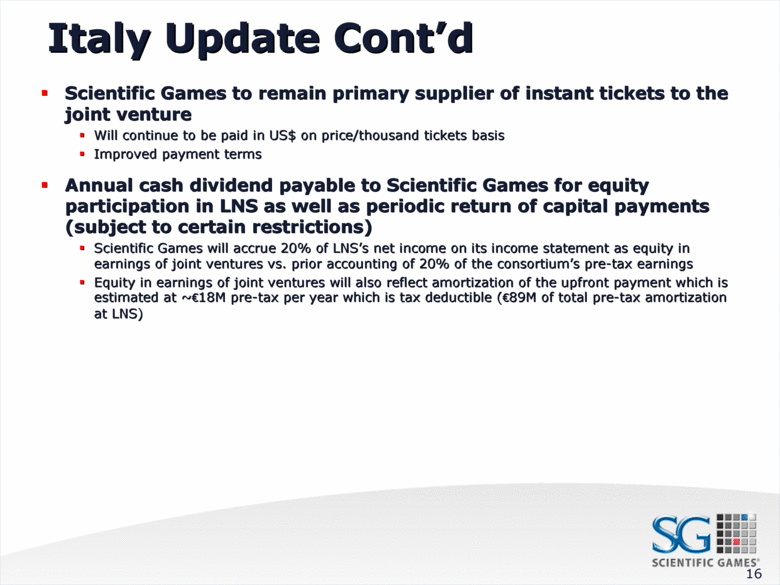
Italy Update Cont’d Scientific Games to remain primary supplier of instant tickets to the joint venture Will continue to be paid in US$ on price/thousand tickets basis Improved payment terms Annual cash dividend payable to Scientific Games for equity participation in LNS as well as periodic return of capital payments (subject to certain restrictions) Scientific Games will accrue 20% of LNS’s net income on its income statement as equity in earnings of joint ventures vs. prior accounting of 20% of the consortium’s pre-tax earnings Equity in earnings of joint ventures will also reflect amortization of the upfront payment which is estimated at ~€18M pre-tax per year which is tax deductible (€89M of total pre-tax amortization at LNS) 16 |

