Attached files
| file | filename |
|---|---|
| 8-K - FORM 8-K - Noranda Aluminum Holding CORP | d8k.htm |
 Gramercy Site Visit
Exhibit 99.1
Noranda Aluminum Holding Corp
August 4, 2010
|
 2
Forward Looking Statements
The
following
information
contains,
or
may
be
deemed
to
contain,
"forward-
looking statements" (as defined in the U.S. Private Securities Litigation Reform
Act of 1995). By their nature, forward-looking statements involve
risks and uncertainties because they relate to events and depend on
circumstances that may or may not occur in the future. The future
results of the issuer may vary from the results expressed in, or implied by,
the following forward looking statements, possibly to a material degree.
For a discussion of some of the important factors that could cause the
issuer's results to differ from those expressed in, or implied by, the
following forward-looking statements, please refer to our filings with the
SEC, including our annual report on Form 10-K. |
 3
Management Presenters
Layle
K. “Kip”
Smith, President and Chief Executive Officer
Robert Mahoney, Chief Financial Officer
Ramon
Gil,
President,
Noranda
Alumina
LLC |
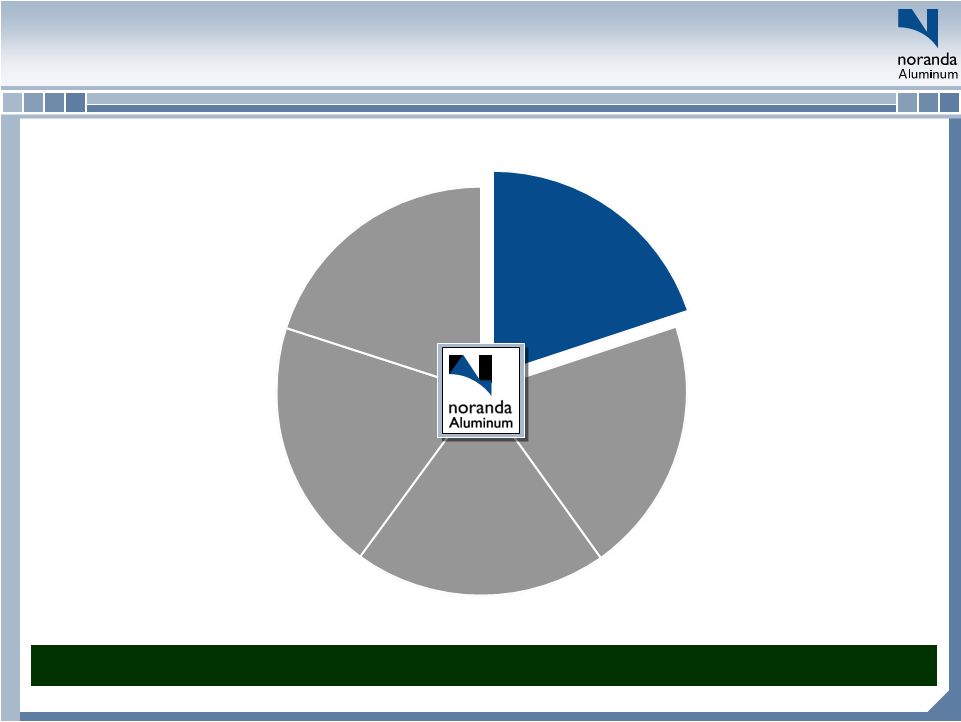 4
Noranda
Strategy
Noranda
Operating
Model
“Off to a
Good Start…”
Industry
Dynamics
Brief Noranda
Alumina History
Second quarter results: Successful performance while completing foundational projects
that strengthened Noranda |
 5
Second Quarter Highlights
Noranda produced strong current quarter results…
–
Net income was $6.9 million ($0.14 per share), and includes the net negative
impact of $11 million, or $0.21 per share, from special items
–
Operating cash flow was $118 million
–
Adjusted EBITDA was $79 million total, and $62 million excluding hedges
–
External volumes grew over 2Q-09 and 1Q-10
–
Integrated cash cost for primary aluminum production improved to $0.66/lb
–
CORE contributed over $15 million in cost reduction, capital avoidance, and cash
generation
–
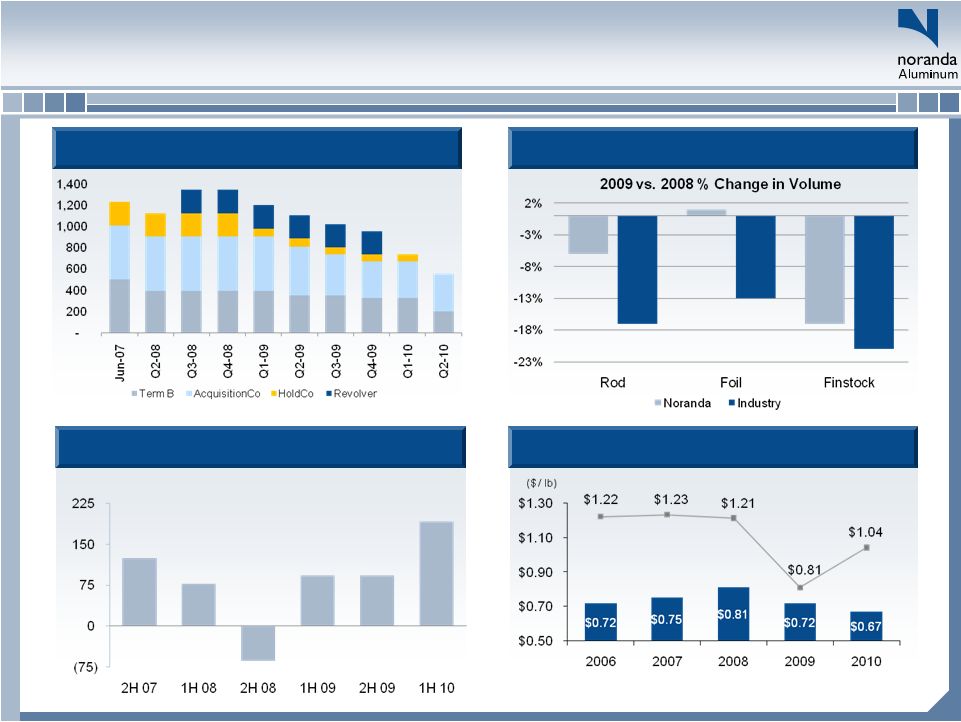
Total indebtedness was $554 million, representing a 24% decrease from 1Q-10
–
Cash and cash equivalents balances totaled $32 million. Senior revolving credit
facility had no outstanding borrowings and $215 million available capacity
… while setting a foundation for long-term value
–
Completed IPO as part of broad program to increase strategic flexibility, position
company for growth and improve financial profile
–
Obtained favorable result in New Madrid power rate case
–
Signed final agreements for Jamaican fiscal regime |
   6
Expect steady demand for billet/rod, subject to
normal seasonal trends
Primary Aluminum Products pricing to follow one
month lag on LME
Peak power rates apply throughout 3Q-10
Most cost inputs contracted through end of year at
fixed prices; upward pressure on others
Integrated cash cost is $0.66 for Q2-10;
normalizing Q1-10 for smelter volume and alumina
ramp up, YTD cost is $0.67
Strong Q2-10 demand in key primary aluminum
product groups. Billet and rod up 40% and 7%
against Q2-09. Billet and rod shipments up 21%
and 22% against Q1-10
CORE initiatives and favorable input prices offset
bauxite shipping delays, alumina ramp-up, and
legal costs related to power case
2009
Normalized
3MOE 6/30/10
6MOE
6/30/10
LME
1.00
0.97
0.98
Midwest Premium
0.06
0.06
0.06
Midwest Transaction Price
1.06
1.04
1.04
Net integrated cash cost of primary aluminum
0.67
0.66
0.67
Integrated upstream margin per pound
0.39
0.38
0.37
Dollars per Pound
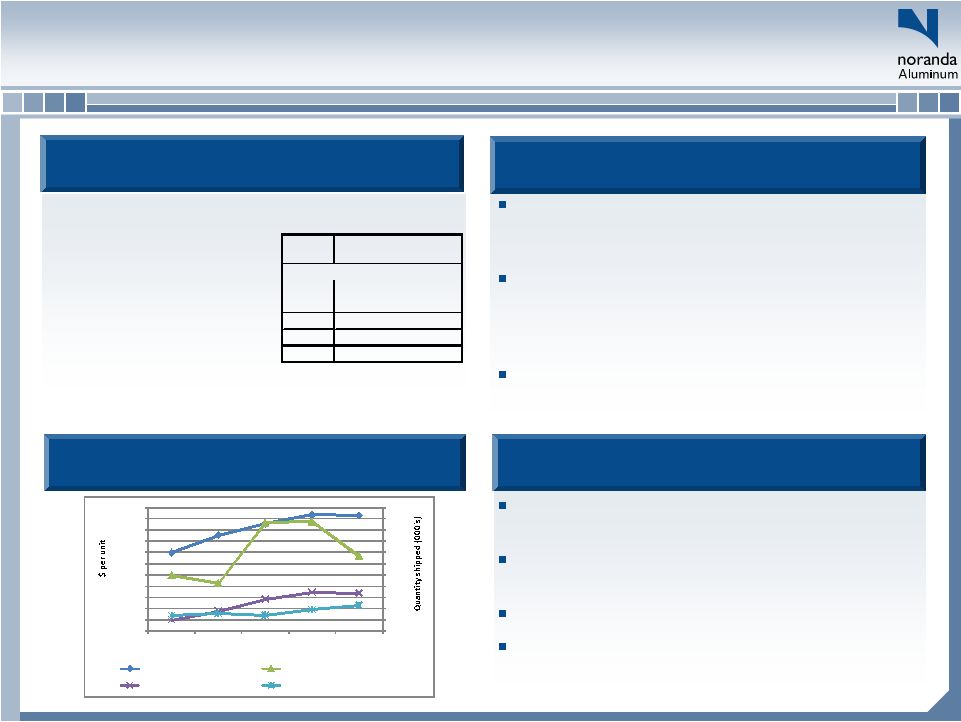
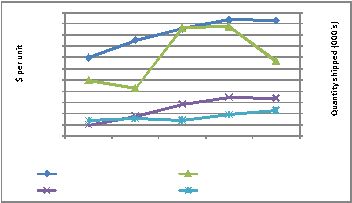
Integrated Upstream Business Review
Trends
Trends
Near-term Outlook
Comments
Comments
Upstream Margin
Upstream Margin
0
50
100
150
200
250
300
350
400
450
500
550
$-
$0.10
$0.20
$0.30
$0.40
$0.50
$0.60
$0.70
$0.80
$0.90
$1.00
$1.10
2Q09
3Q09
4Q09
1Q10
2Q10
LME ($ per lb)
Bauxite (kMt)
Alumina (kMt)
Primary aluminum (000 pounds)
Left Axis
Right Axis
Right Axis
Right Axis |
 7
2009
Normalized(1)
3MOE
6/30/10
6MOE
6/30/10
Total primary aluminum shipments
580
147
267
Integrated upstream margin on cash cost
0.39
$
0.38
$
0.37
$
Integrated upstream EBITDA
224
$
55
$
99
$
Rolled products fabrication margin
35
15
26
Run-rate corporate expenses
(29)
(7)
(14)
Total Unhedged EBITDA
230
$
62
$
111
$
Corporate Summary
Strong Q2-10 performance reflects impact of
productivity programs and management
execution, with help from improved aluminum
prices
Q2-10 improvements in cash cost validate $0.67
annual normalized 2009 benchmark
Q2-10 rolled product results well ahead of 2009
Corporate expenses tracking to 2009 or better
Expected GAAP annual effective tax rate is 33.6%
Still have hedge accounting gains to reclassify
through GAAP earnings, despite termination of
aluminum hedges ($22 million per quarter in 3Q-10
and Q4-10)
(1)
Normalized
based
on
$1.00
LME,
$0.06
Mid-west
Premium
Comments
Comments
Business Summary
Business Summary
Corporate Cost Trends
Corporate Cost Trends
Near-term Outlook
2Q09
3Q09
4Q09
1Q10
2Q10
Corporate SG&A (GAAP)
7.9
9.2
7.2
9.7
28.8
Consulting Fees
(0.7)
(1.7)
(1.1)
(4.1)
Stock Compensation
(0.4)
(1.0)
(0.4)
(0.4)
(3.6)
Apollo Fees
(0.5)
(0.5)
(0.5)
(0.5)
(13.0)
Restructuring
-
-
-
-
(0.2)
Other
(1.4)
3.6
2.3
(1.2)
(0.7)
Run-rate corporate costs
5.0
11.4
6.9
6.5
7.3 |
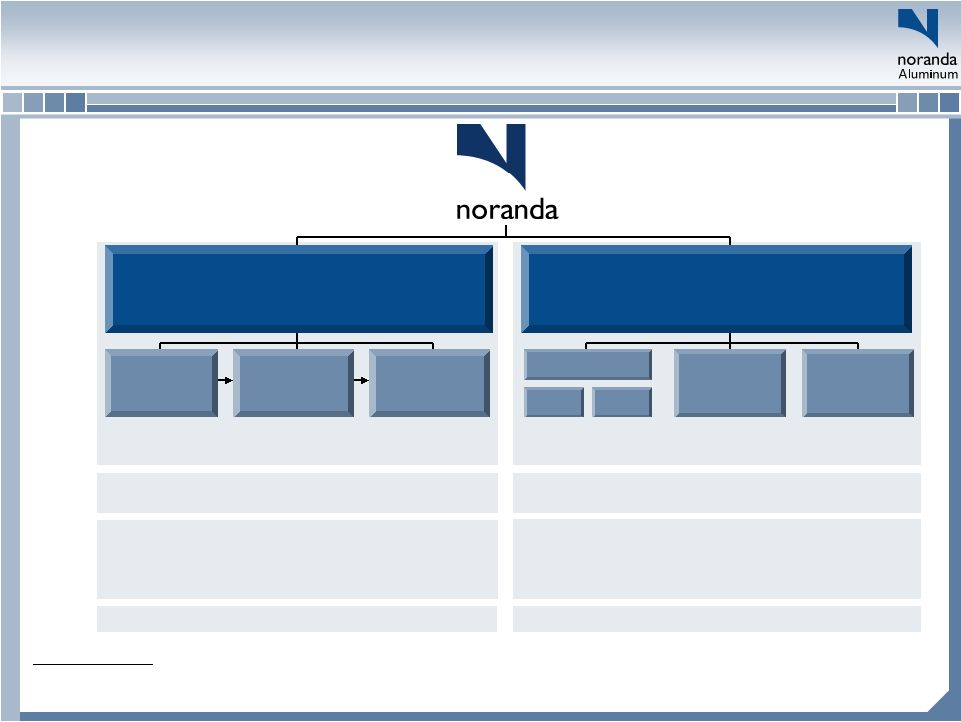
 Noranda
Strategy
Brief Noranda
Alumina History
“Off to a
Good Start…”
Industry
Dynamics
Noranda
Operating
Model
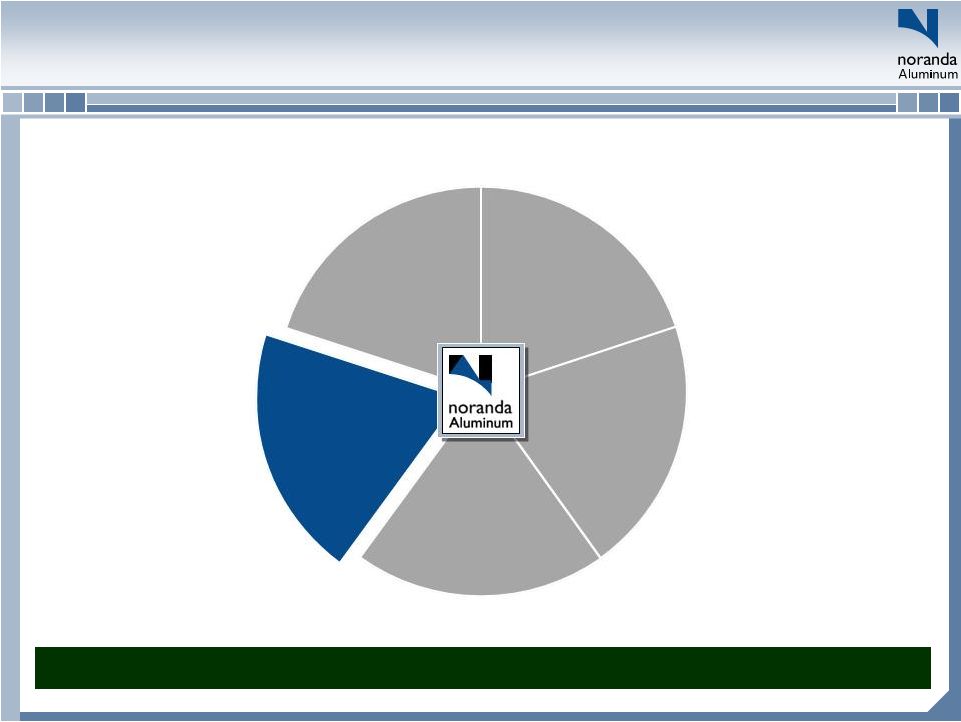
Though
we
can’t
control
the
LME,
we
exercise
significant
control
and
influence
over
the
basic
drivers
of
our
success
8 |
 Mission
Every day we build a sustainable,
integrated aluminum company founded on
growth and successful long-term
relationships with our customers,
co-workers, suppliers,
communities and investors
9 |
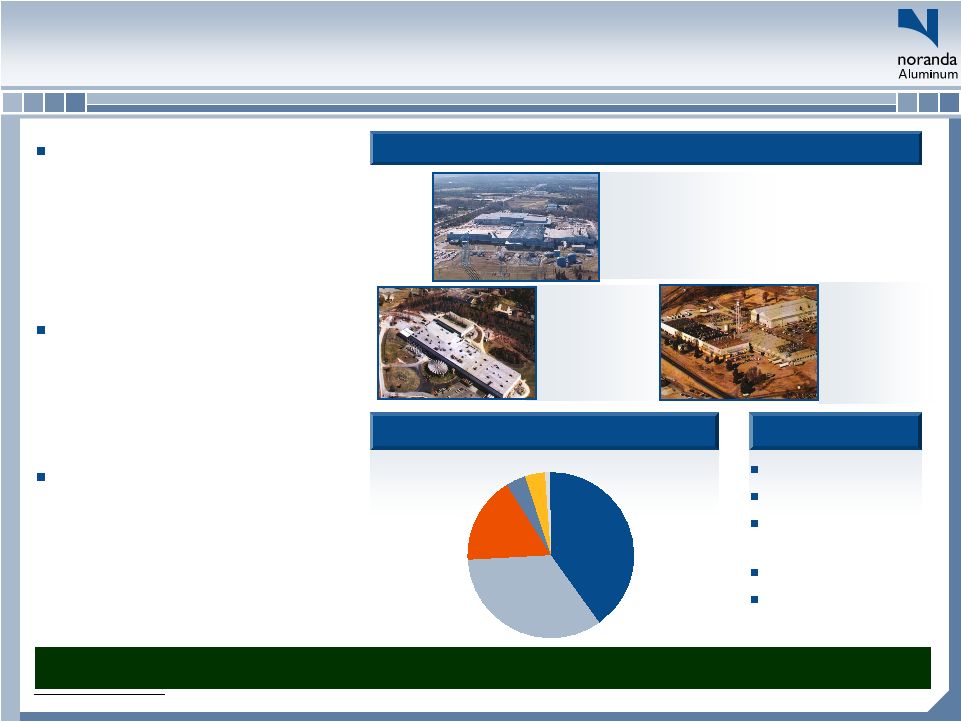
 10
Noranda’s
Integrated Operating Footprint
Downstream Business
Downstream Business
Annual Capacity: 495mm lbs
(2)
St. Ann
Bauxite Mine
New Madrid
Aluminum
Smelter
Newport
Rolling Mills
Salisbury
Rolling Mills
East
Mill
West
Mill
Huntingdon
Rolling Mills
Bauxite
Discovery Bay,
Jamaica
4.5mm Mt
Alumina
Gramercy, LA
1.2mm Mt
Aluminum
Primary Metal
New Madrid, MO
263k Mt (580mm lbs)
Fin stock (HVAC) and Auto, Semi-Rigid Container Stock, Flexible
Packaging, Transformer Windings
Huntingdon, TN
Huntingdon West
235mm lbs
(2)
Huntingdon East
130mm lbs
Newport, AR
35mm lbs
Salisbury, NC
95mm lbs
Products:
Location:
Annual
Capacity:
Upstream Business
Upstream Business
Annual
Capacity:
580mm lbs
2009 Cash Cost at Full Production: $0.72 / lb
(1)
Gramercy
Refinery
Revenue
Drivers:
Volume & LME
Residential construction / remodeling, packaging, U.S. consumer
(1) We estimate that due to lost production volume in 2009 from the smelter outage, which caused lost
efficiency and fixed cost absorption, our upstream cash cost of primary aluminum for FYE 2009
of $0.77 per pound was negatively impacted by $0.05 per pound. (2) Maximum capacity, with
actual capacity depending upon production mix. |
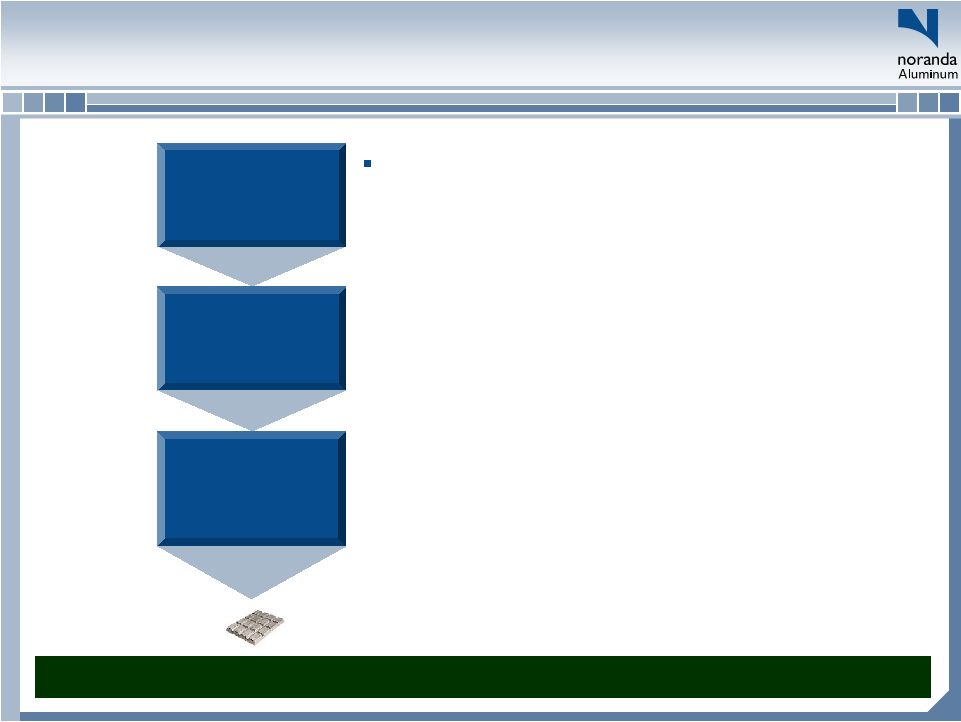 11
Primary
Aluminum
Alumina
Noranda
Bauxite
Mine
Noranda
Alumina
Refinery
New Madrid
Primary Aluminum
Smelter
Bauxite
The integration of our Upstream Business is the lynchpin to
our strategy and sustainability
–
Significant Operating Leverage to LME
•
Integration
provides
for
a
more
“fixed”
cost
base
relative to non-integrated producers whose margins
may be eroded by rising input costs that are correlated
to LME
•
Third party sales of excess raw materials (e.g., bauxite
and alumina) enhance our leverage to LME
–
Secure Supply
•
For our smelter and refinery, we have the ability to
provide over 100% of our needs of alumina and bauxite
–
Low Cost & Operating Flexibility
•
Expanded portfolio of opportunities to drive cost out
and increase productivity and sales
Our strategy is founded on integrated production, cost independence from the LME,
growth & productivity Vertically Integrated Upstream Business
|
 12
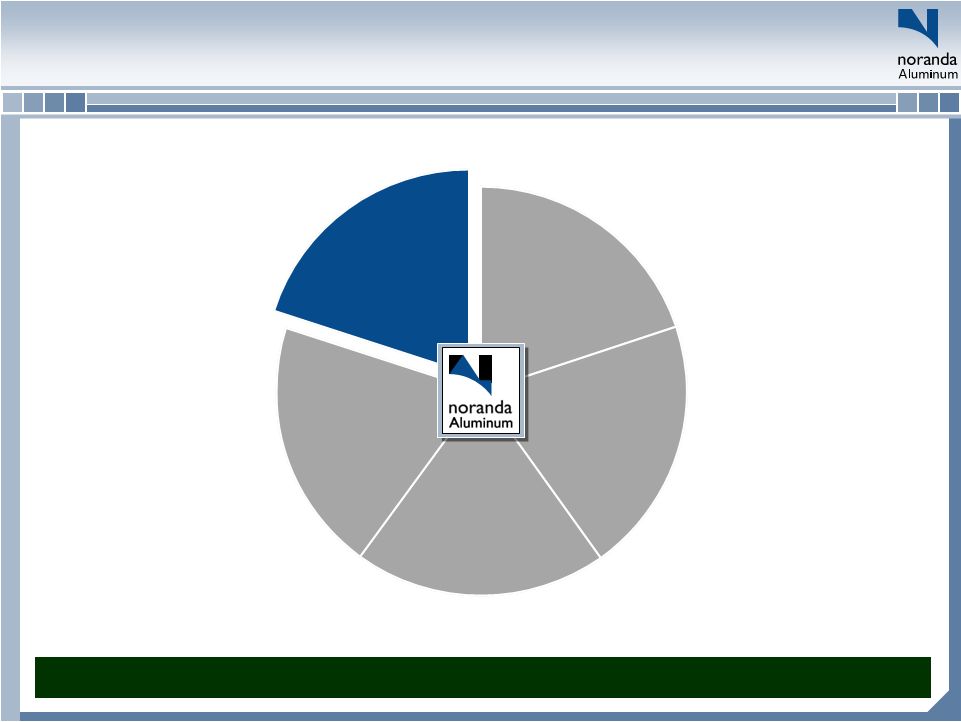
Geographic Mix
Low Cost, Leading –
Rolling Mill Operations
Low cost Production
–
Huntingdon West is the foil
mill with the lowest
conversion cost in North
America according to CRU
–
CORE Productivity
–
Footprint efficiency
Flexibility
–
10-30% of prime metal
comes from New Madrid,
but inter-company volume
can be varied based on
market conditions
Focused Growth
–
Grow with key customers to
“Win with Winners”
–
Increase share of demand
–
Top 10 customers 56% of
sales
Huntingdon, TN
2 plants, East and West
Started 1967 & 2000
Max. East capacity: 130mm lbs
Max. West capacity: 235mm lbs
(1)
Newport, AR
Started 1951
Max. Capacity:
35mm lbs
(1)
Salisbury, NC
Started 1965
Max. Capacity:
95mm lbs
Four Rolling Mills in Three States
40%
17%
4%
4%
Southeast USA
West USA
Northeast USA
Midwest USA
34%
Southwest USA
Mexico
1%
HVAC fin stock
Container
Transformer
sheet
Foil products
Light gauge sheet
Products
Downstream Segment is a stable free cash flow generator
(1) Capacity includes intracompany reroll of approximately 45mm
lbs. |
 13
Noranda
Strategy
Brief Noranda
Alumina
History
“Off to a
Good Start…”
Industry
Dynamics
Noranda
Operating
Model
Gramercy provides a critcial
supply of alumina as part of our intergrated
strategy |
 Noranda
Bauxite and Alumina Overview
On August 31, 2009, Noranda
became the sole owner of the Gramercy refinery and St. Ann Bauxite operation
–
Noranda
Bauxite –
St. Ann
–
Economic joint venture with Government of Jamaica
•
Government
receives
royalties
and
levies,
with
Noranda
controlling
the
business
and
output
•
Noranda
maintains strong government relations with a new 6-year fiscal regime
negotiated in 2009 –
4.5 million tonnes
of annual production capacity with ~60% sold to Gramercy
•
Remaining production sold to Sherwin Alumina pursuant to a contract that was
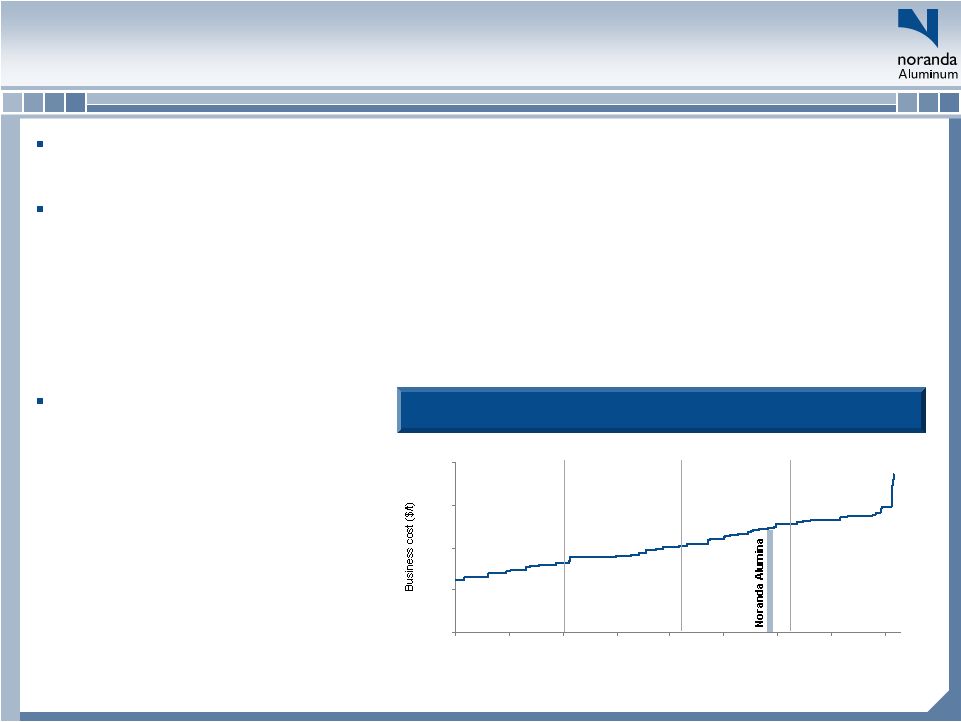
recently extended in principal through 2012 –
CRU estimates that St. Ann was in the 2nd Quartile for site operating costs
globally in 2009 $0
$100
$200
$300
$400
0
10000
20000
30000
40000
50000
60000
70000
80000
1 Quartile
2 Quartile
3 Quartile
4 Quartile
Production (kt)
Noranda
Alumina -
Gramercy
–
1.2M mt
per year production capacity for
Smelter Grade Alumina (SGA) and
Chemical Grade Alumina (CGA)
–
~0.5mm Mt provided to New Madrid
with remainder sold to third parties
–
One of three producers in the U.S.,
providing ~0.2mm Mt of CGA
–
Stable end market with attractive
characteristics that complement the
commodity SGA product group
–
3-years of SGA sales contracted with credit-
worthy customers
CRU’s
2009 Alumina Cost Curve
(1)
_______________________
(1) Noranda
cost
curve
position
excludes
benefits
of
3
party
bauxite
and
alumina
sales.
14
st
nd
rd
th
rd
Strategic drivers: integrated supply, productivity, sales growth – increased leverage to
LME |
 A
Brief History of Noranda Alumina, LLC
Construction on the alumina refinery began in 1957 with the first
shipment of alumina occurring two years later. The Gramercy facility
was originally owned by Kaiser.
The refinery utilizes the Bayer process to chemically extract alumina
from bauxite.
Construction on the first red mud pond began in 1974.
The refinery has undergone several expansions and modernizations
since 1957 to increase annual capacity from .4 million metric tonnes
to 1.2 million metric tonnes.
In July 1999 the refinery
shut down due to an explosion of the
digestion unit. The refinery
reopened in December 2000.
In 2004, Noranda
formed a joint partnership with Century Aluminum
and purchased the Gramercy refinery and the St. Ann bauxite mining
operations from Kaiser.
In 2009, Noranda
became sole owner of the refinery, which now
operates as Noranda
Alumina, LLC.
15 |
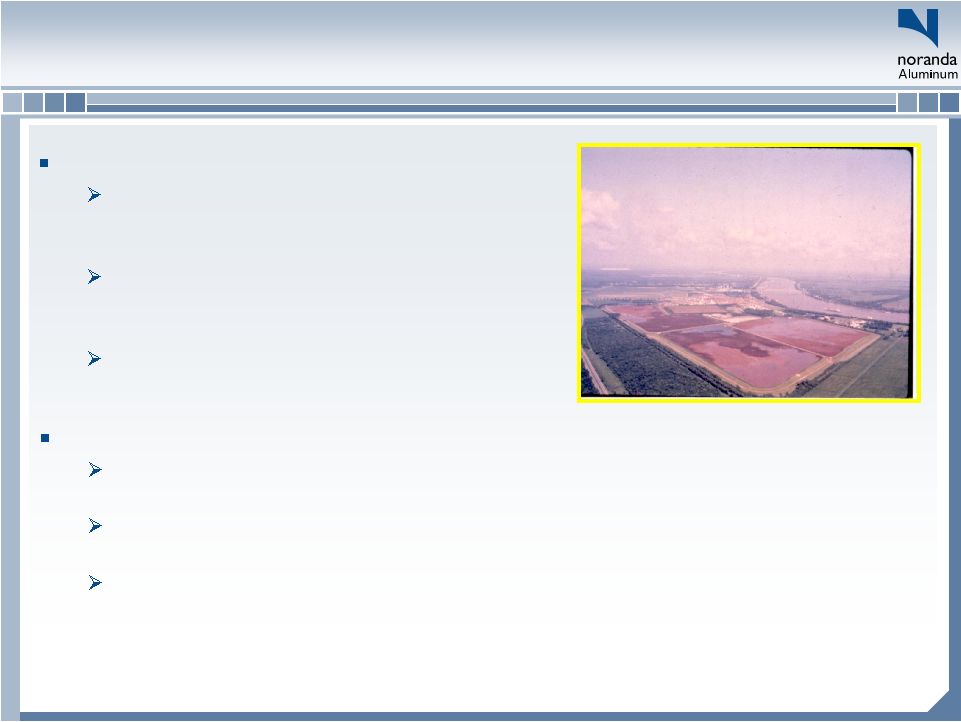 Red Mud Lakes
Once alumina has been extracted, spent
bauxite (‘red mud”) is managed in one of 4
Mud Lakes.
Mud Lakes are permitted solid waste units
designed to dewater the material and act as a
final repository.
Noranda
Alumina has obligation to seal the
Mud Lakes once they are no longer used.
Environmental
Bona Fide Prospective Purchase (BFPP) Protection
Noranda
and Century commissioned a pre-purchase due diligence investigation of
the environmental conditions present at the refinery in 2004.
State environmental officials ruled Gramercy met conditions for BFPP protections
against liability for preexisting environmental conditions.
Gramercy recorded a liability for the estimated cost for the BFPP remediation work
and
continues
to
monitor
and
update
such
estimates
as
necessary;
Kaiser
provided
cash funding as part of transaction.
16 |
 Safety is a Core Value
MSHA Regulated Facility
Maintains Process Safety
Management program in
addition to Occupational
Safety
Employee Involvement
(ERT, Safe Start, JSC,
Safety Recognition)
Maintenance activities
planned and scheduled
Supported by SAP (CMMS)
Health & Safety
17 |
 Noranda
Strategy
Brief Noranda
Alumina History
“Off to a
Good Start…”
Industry
Dynamics
Noranda
Operating
Model
We have two #1 Priorities: Get the Results, and Do the Right Things the Right
Way 18 |
 Our
Two #1 Priorities Noranda
has two number one priorities
Do the right things
the right way
Get the results
•Individual Behaviors
•Team Disciplines
•Sustainable Relationships
•Legal
•Ethical
•Credible
19 |
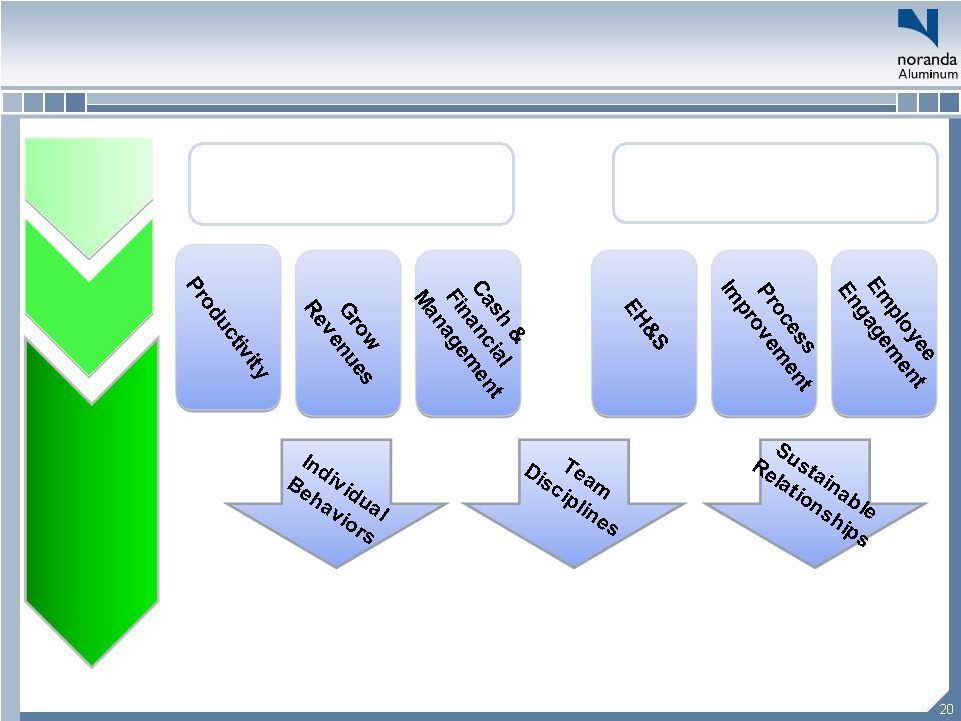 Get
the Results Get the Results
Do the Right Things
Do the Right Things
the Right Way
the Right Way
Action oriented
Ethics and Values
Drive for results
Process Management
Safety Focus
Problem solving
Peer relationships
Priority setting
Managing through
systems
Existing for Customers
Caring for Customers
Respecting Suppliers
Enriching Communities
Rewarding Investors
Two #1
Two #1
Priorities
Priorities
Sustainable
Sustainable
Goals
Goals
Core
Core
Values
Values
Noranda
Mission |
 Financial success in adverse conditions
Reduced Production Cost
Reduced Production Cost
Improved Demand Share
Improved Demand Share
Reduced Debt
Reduced Debt
Generated More Cash (Free Cash Flow)
Generated More Cash (Free Cash Flow)
(Millions of dollars)
21 |
 Reconciliation of EBITDA to Net Income
22
Comments
Adjusted EBITDA for three months ended June 30, 2010
78.8
$
Interest (Expense)/Income, Net
(8.5)
prospectively,
based
on
post-IPO
debt
balances
at
applicable
interest
rates
(1)
Depreciation & Amortization
(25.1)
2Q
is
reasonable
proxy
going
forward,
at
$25
million
per
quarter
(2)
LIFO/LCM
(9.9)
Will vary from period-to-period with LME and inventory levels
Interest Rate Swap MTM
(5.6)
Will
vary
from
period-to-period
with
change
in
notional
and
market
LIBOR
(3)
MTM (Loss)/Gain on NatGas
(5.8)
Will
vary
from
period-to-period
with
change
in
hedged
volume
and
Henry
Hub
(3)
AOCI Reclassification of Alim. Hedges
22.2
Set
amount,
with
next
12
months
disclosed
(4)
AOCI Reclassification of NatGas
Hedges
(1.5)
Relatively
predictable
amount,
with
estimate
for
next
12
months
disclosed
(4)
Stock Compensation Expense
(3.8)
2Q-10 contained $3.2 million of acceleration
Non-Cash Pension Expense
(1.8)
Approximately
$1.8
million
per
quarter,
based
on
2Q
amounts
(5)
Other on-going items
(1.0)
Represents
gains
and
losses
on
asset
disposals,
other,
say
$1
million
per
quarter
(6)
Gain) loss on debt repurchase
(2.5)
Would continue after 2Q-10 only when there are are
debt paydowns
Charges related to termination of derivatives
(4.9)
Doesn't continue after 2Q-10
Restructuring and sponsor fees
(20.3)
Doesn't continue after 2Q-10
Pre-Tax Income
10.3
Income tax expense
3.4
At
2Q,
forecasted
annual
GAAP
rate
was
disclosed
as
33.6%
(7)
6.9
$
Weighted average shares
49.1
3Q
will
be
based
on
amount
outstanding
at
end
of
2Q-10
(8)
Diluted options
1.0
Will
vary
based
on
stock
price,
but
Q2-10
is
appropriate
proxy
(9)
Diluted shares
50.1
Diluted EPS
0.14
$
(1)
See page 12 of June 2010 Form 10-Q for balance and rate information.
(2)
See page 50 of June 2010 Form 10-Q for 2Q-10 actual amount.
(3)
See page 19 of June 2010 Form 10-Q for hedged quantities and rates.
(4)
See page 19 of June 2010 Form 10-Q for amounts to be reclassified in future.
(5)
See page 52 of June 2010 Form 10-Q for Q2-10 actual amount.
(6)
See page 52 of June 2010 Form 10-Q for LTM "Loss on disposal" (0.4 million) and
"other" (0.6 million). (7)
See page 17 of June 2010 Form 10-Q for 33.6% annual 2010 rate.
(8)
See cover of June 2010 Form 10-Q for most recent share number.
(9)
See page 23 of June 2010 Form 10-Q for Q2-10 impact of dilutive securities.
Note: Amounts in millions, except per share data |
 Noranda
Strategy
Brief Noranda
Alumina History
“Off to a
Good Start…”
Industry
Dynamics
Noranda
Operating
Model
Noranda
is well positioned to take advantage of a recovery in Aluminum prices
23 |
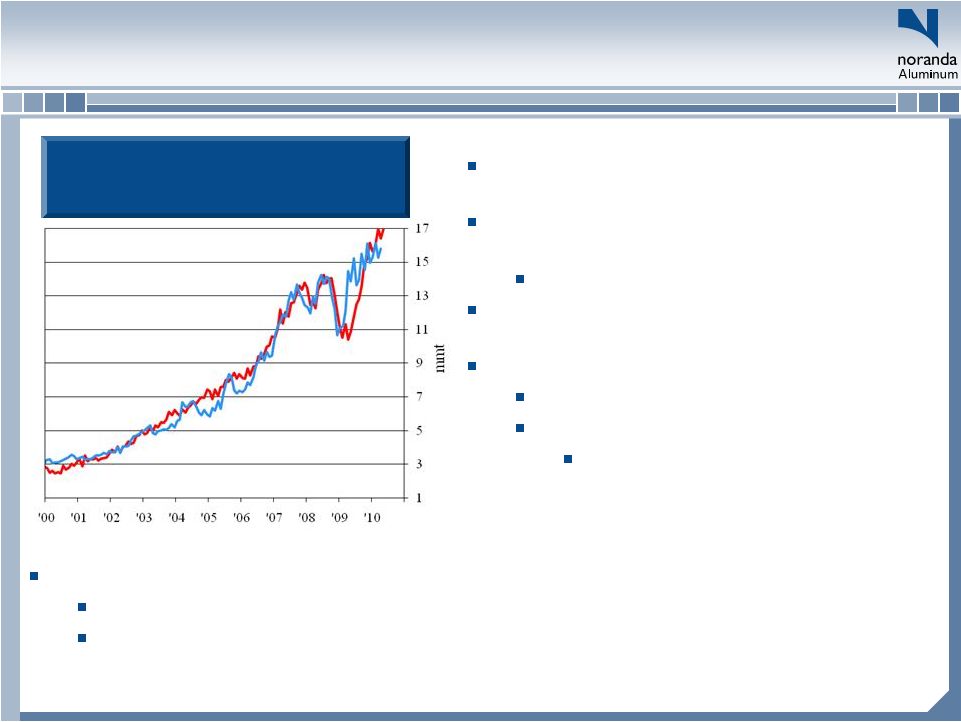
 1300
1500
1700
1900
2100
2300
2500
2700
2000
2001
2002
2003
2004
2005
2006
2007
2008
2009
2010
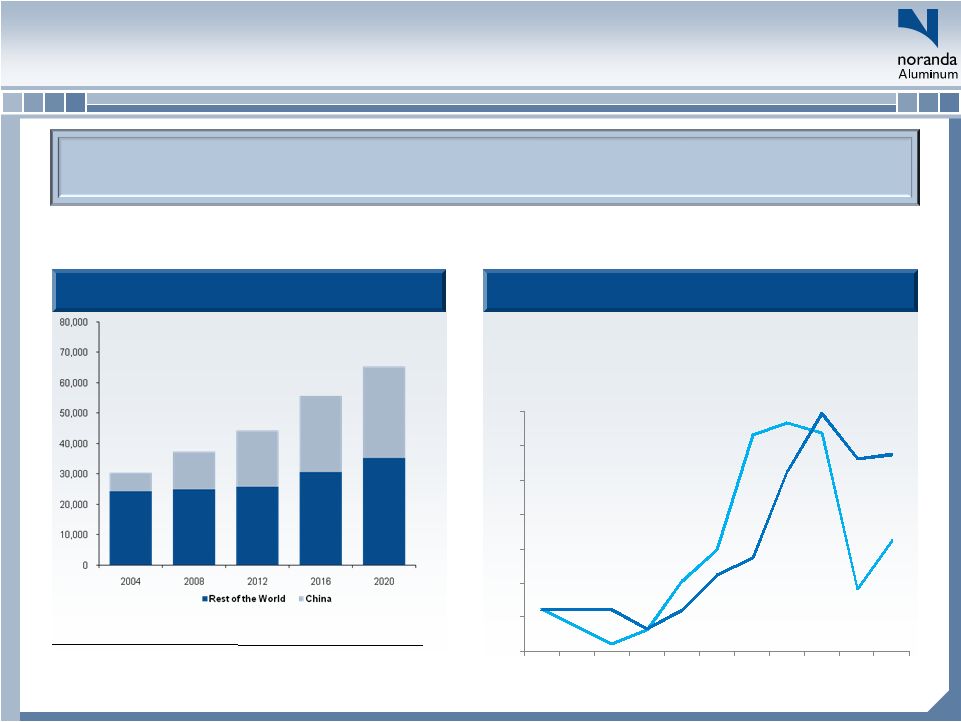
Market Fundamentals
Global demand for aluminum is expected
to continue to increase…
Aluminum’s consensus estimated sustainable
price is meaningfully above current prices…
We hold a positive outlook for Aluminum’s fundamentals
over the medium and long-term, based on two views:
Consumption Growth Driven by China
Total
Consumption
(1)
30.4
37.4
44.3
55.6
65.4
China
Consumption
(1)
6.1
12.6
18.4
25.0
30.1
--
23%
18%
26%
18%
% Growth
--
108%
46%
36%
20%
% Growth
Source:
CRU
(1) In millions of tonnes
Prices Below Consensus Sustainable Level
Source:
Harbor intelligence
ALUMINUM LONG TERM MINIMUM EQUILIBRIUM PRICE
(annual average; consensus forecasts from up to 20 analysts)
ESTIMATED
LT MINIMUM
EQUILIBRIUM
$2,450
CASH PRICE
$2,109 so far
2010
24 |
 Source: Davenport
Chinese Aluminum Consumption &
Production
China –
Analysis
Revaluation
of
the
RMB
–
stronger
RMB
relative
to
the
dollar
Increases purchasing
power
of
RMB
–
increased
ability
to
import
products
(aluminum)
Dollar
denominated
prices
increase
–
LME
price
per
tonne
will
increase
in
USD,
supporting smelters located in the US
China historically has produced at or near its
aluminum consumption
China has imposed severe export taxes on
aluminum
Exports are highly unlikely
CRU forecasts China being net importers of
Aluminum in the medium term
Power –
China is already short of power
Unstable prices
Job creation as a primary goal
More efficient uses of power exist
that create more jobs per kilowatt
hour of electricity
25 |