Attached files
| file | filename |
|---|---|
| EX-99.1 - EX-99.1 - ACCURIDE CORP | a10-15165_1ex99d1.htm |
| 8-K - 8-K - ACCURIDE CORP | a10-15165_18k.htm |
Exhibit 99.2
|
|
1 2nd Quarter 2010 Earnings Call August 3, 2010 |
|
|
2 Industry Update Corporate Initiatives Second Quarter Results Restructuring Update 2010 Outlook Q&A Closing Comments Bill Lasky Bill Lasky Jim Woodward Jim Woodward Jim Woodward Bill Lasky Jim Woodward Bill Lasky Agenda |
|
|
3 Statements contained in this news release that are not purely historical are forward-looking statements within the meaning of Section 27A of the Securities Act of 1933, as amended, and Section 21E of the Securities Exchange Act of 1934, as amended, including statements regarding Accuride’s expectations, hopes, beliefs and intentions with respect to future results. Such statements are subject to the impact on Accuride’s business and prospects generally of, among other factors, market demand in the commercial vehicle industry, general economic, business and financing conditions, labor relations, governmental action, competitor pricing activity, expense volatility and other risks detailed from time to time in Accuride’s Securities and Exchange Commission filings, including those described in Item 1A of Accuride’s Annual Report on Form 10-K for the fiscal year ended December 31, 2009. Any forward-looking statement reflects only Accuride’s belief at the time the statement is made. Although Accuride believes that the expectations reflected in these forward-looking statements are reasonable, it cannot guarantee its future results, levels of activity, performance or achievements. Except as required by law, Accuride undertakes no obligation to update any forward-looking statements to reflect events or developments after the date of this news release. Forward Looking Statements |
|
|
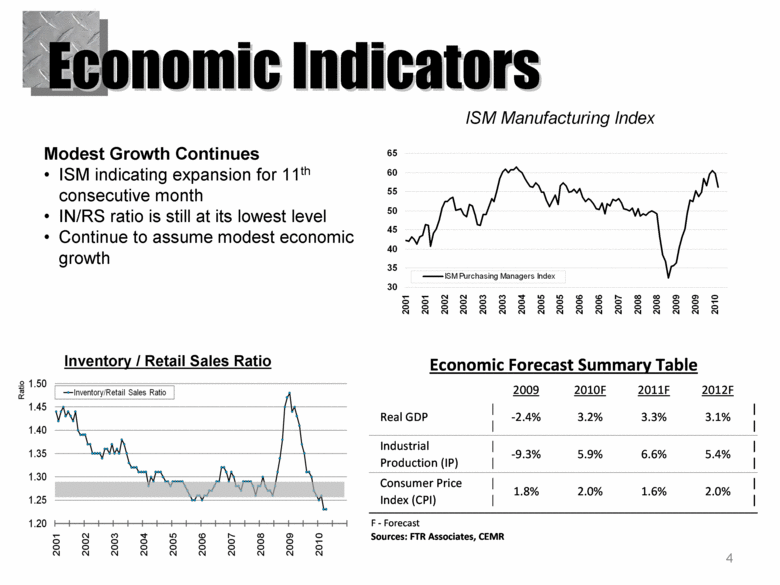
4 Economic Indicators Modest Growth Continues ISM indicating expansion for 11th consecutive month IN/RS ratio is still at its lowest level Continue to assume modest economic growth Inventory / Retail Sales Ratio ISM Manufacturing Index 30 35 40 45 50 55 60 65 2001 2001 2002 2002 2003 2003 2004 2005 2005 2006 2006 2007 2008 2008 2009 2009 2010 ISM Purchasing Managers Index Economic Forecast Summary Table 2009 2010F 2011F 2012F Real GDP | | -2.4% 3.2% 3.3% 3.1% | | Industrial Production (IP) | | -9.3% 5.9% 6.6% 5.4% | | Consumer Price Index (CPI) | | 1.8% 2.0% 1.6% 2.0% | | F - Forecast Sources: FTR Associates, CEMR |
|
|
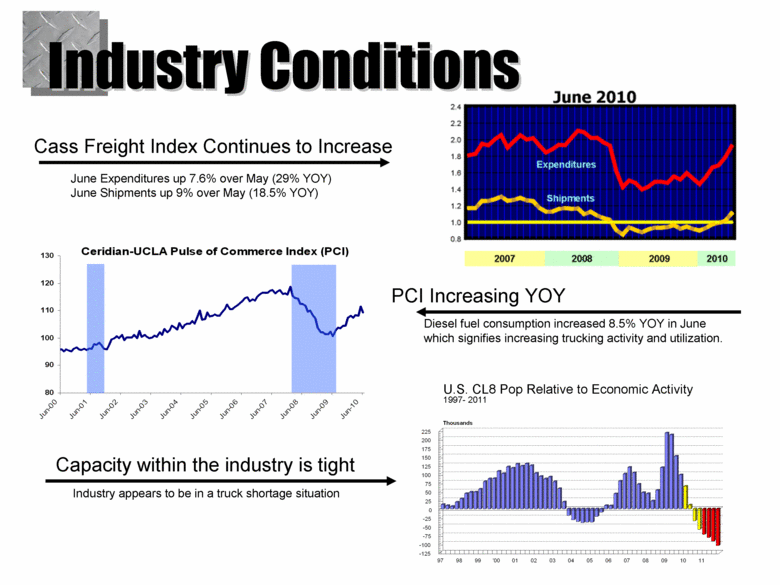
Industry Conditions Cass Freight Index Continues to Increase June Expenditures up 7.6% over May (29% YOY) June Shipments up 9% over May (18.5% YOY) PCI Increasing YOY Diesel fuel consumption increased 8.5% YOY in June which signifies increasing trucking activity and utilization. U.S. CL8 Pop Relative to Economic Activity 1997- 2011 Capacity within the industry is tight Industry appears to be in a truck shortage situation 80 90 100 110 120 130 Jun-00 Jun-01 Jun-02 Jun-03 Jun-04 Jun-05 Jun-06 Jun-07 Jun-08 Jun-09 Jun-10 Ceridian-UCLA Pulse of Commerce Index (PCI) 97 98 99 '00 01 02 03 04 05 06 07 08 09 10 11 0 25 50 75 100 125 150 175 200 225 -25 -50 -75 -100 -125 Thousands |
|
|
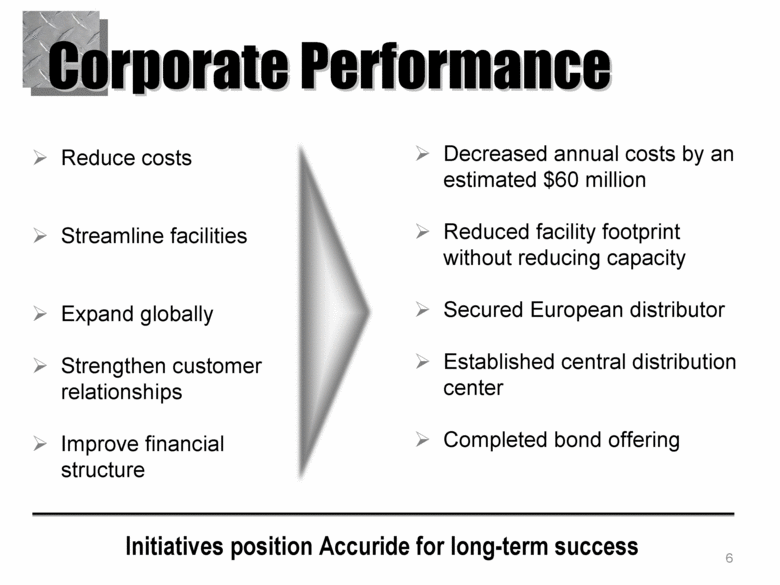
6 Corporate Performance Reduce costs Streamline facilities Expand globally Strengthen customer relationships Improve financial structure Decreased annual costs by an estimated $60 million Reduced facility footprint without reducing capacity Secured European distributor Established central distribution center Completed bond offering Initiatives position Accuride for long-term success |
|
|
Financials 7 |
|
|
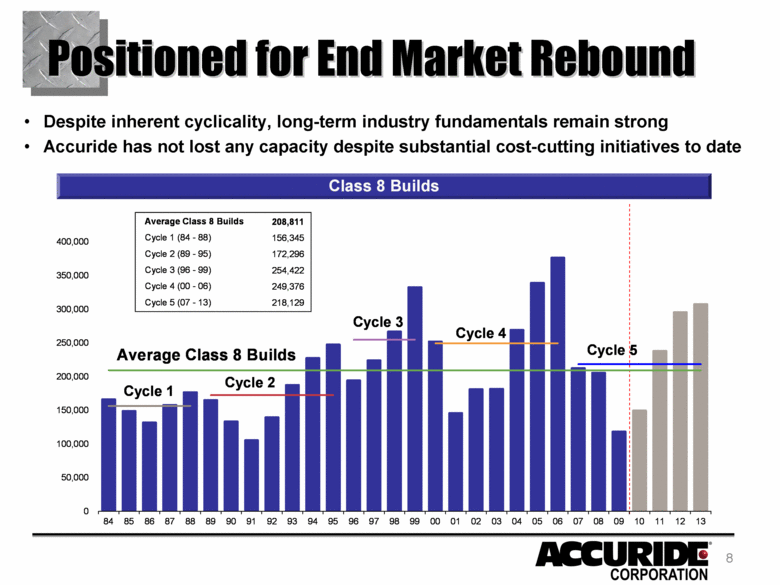
8 Positioned for End Market Rebound Despite inherent cyclicality, long-term industry fundamentals remain strong Accuride has not lost any capacity despite substantial cost-cutting initiatives to date Cycle 2 Cycle 1 Cycle 3 Cycle 4 Average Class 8 Builds Cycle 5 Average Class 8 Builds Cycle 1 (84 - 88) Cycle 2 (89 - 95) Cycle 3 (96 - 99) Cycle 4 (00 - 06) Cycle 5 (07 - 13) 208,811 156,345 172,296 254,422 249,376 218,129 Class 8 Builds 0 50,000 100,000 150,000 200,000 250,000 300,000 350,000 400,000 84 85 86 87 88 89 90 91 92 93 94 95 96 97 98 99 00 01 02 03 04 05 06 07 08 09 10 11 12 13 |
|
|
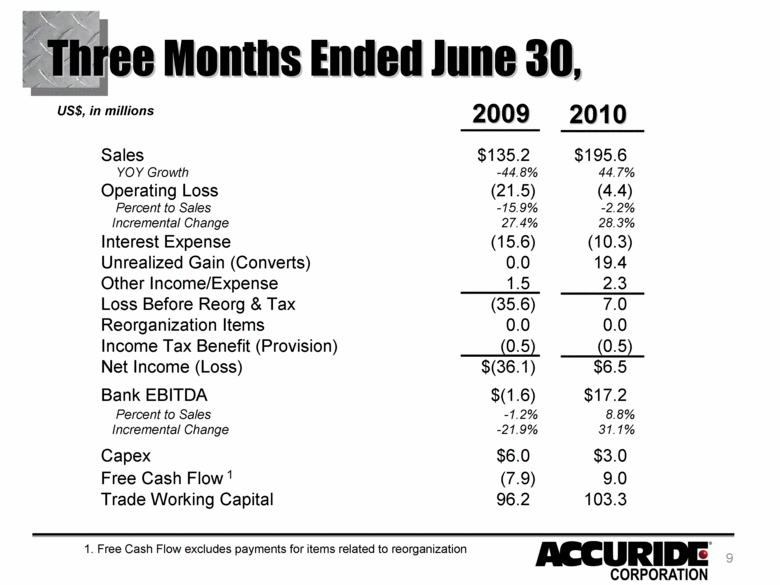
Three Months Ended June 30, 2009 2010 US$, in millions Sales $135.2 $195.6 YOY Growth -44.8% 44.7% Operating Loss (21.5) (4.4) Percent to Sales -15.9% -2.2% Incremental Change 27.4% 28.3% Interest Expense (15.6) (10.3) Unrealized Gain (Converts) 0.0 19.4 Other Income/Expense 1.5 2.3 Loss Before Reorg & Tax (35.6) 7.0 Reorganization Items 0.0 0.0 Income Tax Benefit (Provision) (0.5) (0.5) Net Income (Loss) $(36.1) $6.5 Bank EBITDA $(1.6) $17.2 Percent to Sales -1.2% 8.8% Incremental Change -21.9% 31.1% Capex $6.0 $3.0 Free Cash Flow 1 (7.9) 9.0 Trade Working Capital 96.2 103.3 1. Free Cash Flow excludes payments for items related to reorganization 9 |
|
|
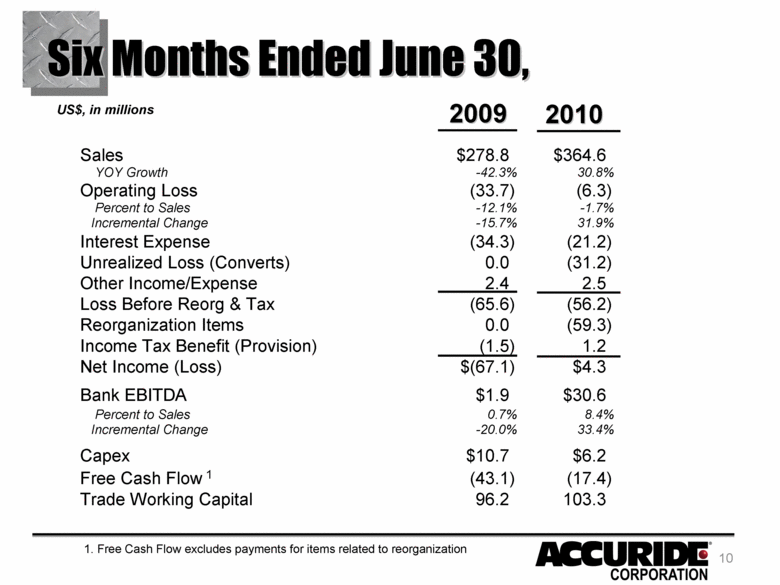
Six Months Ended June 30, 2009 2010 US$, in millions Sales $278.8 $364.6 YOY Growth -42.3% 30.8% Operating Loss (33.7) (6.3) Percent to Sales -12.1% -1.7% Incremental Change -15.7% 31.9% Interest Expense (34.3) (21.2) Unrealized Loss (Converts) 0.0 (31.2) Other Income/Expense 2.4 2.5 Loss Before Reorg & Tax (65.6) (56.2) Reorganization Items 0.0 (59.3) Income Tax Benefit (Provision) (1.5) 1.2 Net Income (Loss) $(67.1) $4.3 Bank EBITDA $1.9 $30.6 Percent to Sales 0.7% 8.4% Incremental Change -20.0% 33.4% Capex $10.7 $6.2 Free Cash Flow 1 (43.1) (17.4) Trade Working Capital 96.2 103.3 1. Free Cash Flow excludes payments for items related to reorganization 10 |
|
|
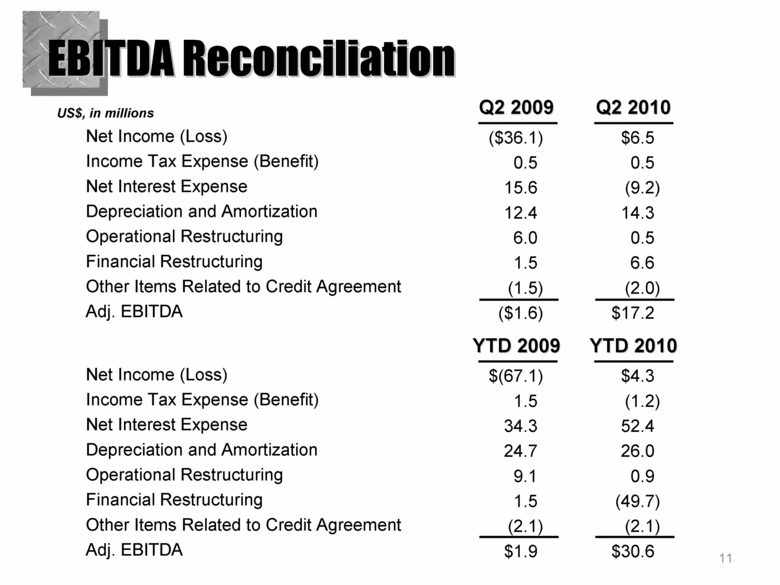
EBITDA Reconciliation ($36.1) $6.5 0.5 0.5 15.6 (9.2) 12.4 14.3 6.0 0.5 1.5 6.6 (1.5) (2.0) ($1.6) $17.2 Net Income (Loss) Income Tax Expense (Benefit) Net Interest Expense Depreciation and Amortization Operational Restructuring Financial Restructuring Other Items Related to Credit Agreement Adj. EBITDA Q2 2009 Q2 2010 US$, in millions $(67.1) $4.3 1.5 (1.2) 34.3 52.4 24.7 26.0 9.1 0.9 1.5 (49.7) (2.1) (2.1) $1.9 $30.6 Net Income (Loss) Income Tax Expense (Benefit) Net Interest Expense Depreciation and Amortization Operational Restructuring Financial Restructuring Other Items Related to Credit Agreement Adj. EBITDA YTD 2009 YTD 2010 11 |
|
|
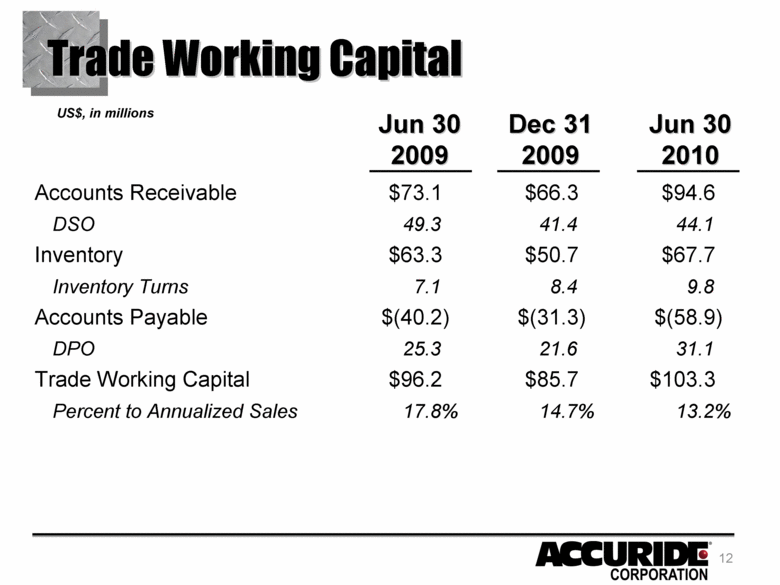
Trade Working Capital Accounts Receivable $73.1 $66.3 $94.6 DSO 49.3 41.4 44.1 Inventory $63.3 $50.7 $67.7 Inventory Turns 7.1 8.4 9.8 Accounts Payable $(40.2) $(31.3) $(58.9) DPO 25.3 21.6 31.1 Trade Working Capital $96.2 $85.7 $103.3 Percent to Annualized Sales 17.8% 14.7% 13.2% Jun 30 2009 Dec 31 2009 Jun 30 2010 US$, in millions 12 |
|
|
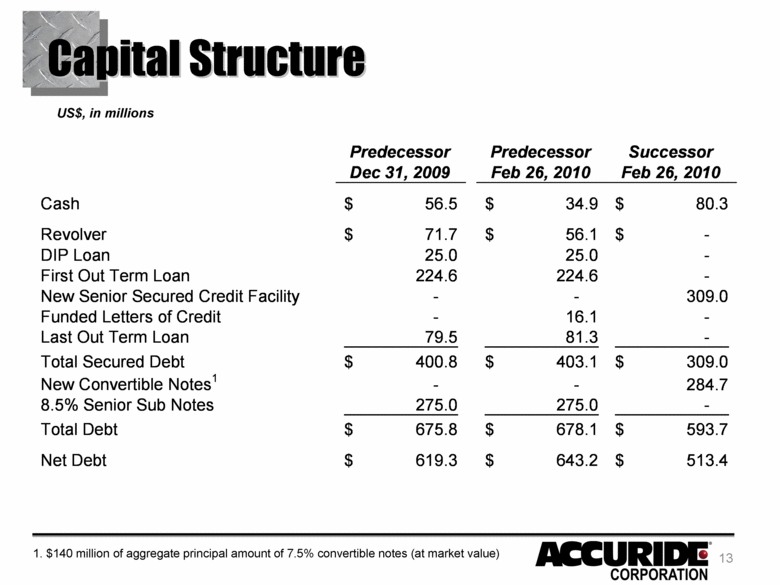
Capital Structure US$, in millions 1. $140 million of aggregate principal amount of 7.5% convertible notes (at market value) Predecessor Predecessor Successor Dec 31, 2009 Feb 26, 2010 Feb 26, 2010 Cash 56.5 $ 34.9 $ 80.3 $ Revolver 71.7 $ 56.1 $ - $ DIP Loan 25.0 25.0 - First Out Term Loan 224.6 224.6 - New Senior Secured Credit Facility - - 309.0 Funded Letters of Credit - 16.1 - Last Out Term Loan 79.5 81.3 - Total Secured Debt 400.8 $ 403.1 $ 309.0 $ New Convertible Notes 1 - - 284.7 8.5% Senior Sub Notes 275.0 275.0 - Total Debt 675.8 $ 678.1 $ 593.7 $ Net Debt 619.3 $ 643.2 $ 513.4 $ 13 |
|
|
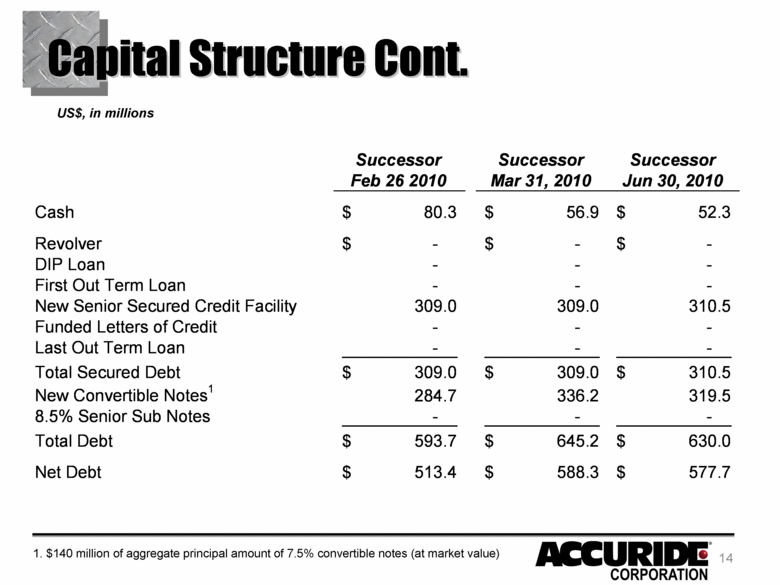
Capital Structure Cont. US$, in millions 1. $140 million of aggregate principal amount of 7.5% convertible notes (at market value) Successor Successor Successor Feb 26 2010 Mar 31, 2010 Jun 30, 2010 Cash 80.3 $ 56.9 $ 52.3 $ Revolver - $ - $ - $ DIP Loan - - - First Out Term Loan - - - New Senior Secured Credit Facility 309.0 309.0 310.5 Funded Letters of Credit - - - Last Out Term Loan - - - Total Secured Debt 309.0 $ 309.0 $ 310.5 $ New Convertible Notes 1 284.7 336.2 319.5 8.5% Senior Sub Notes - - - Total Debt 593.7 $ 645.2 $ 630.0 $ Net Debt 513.4 $ 588.3 $ 577.7 $ 14 |
|
|
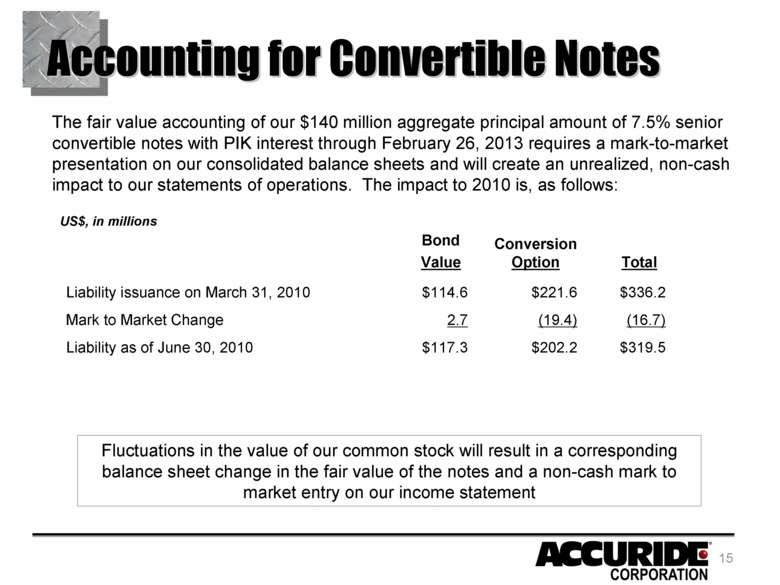
Accounting for Convertible Notes The fair value accounting of our $140 million aggregate principal amount of 7.5% senior convertible notes with PIK interest through February 26, 2013 requires a mark-to-market presentation on our consolidated balance sheets and will create an unrealized, non-cash impact to our statements of operations. The impact to 2010 is, as follows: $319.5 $202.2 $117.3 Liability as of June 30, 2010 (16.7) (19.4) 2.7 Mark to Market Change $336.2 $221.6 $114.6 Liability issuance on March 31, 2010 Total Conversion Option Bond Value Fluctuations in the value of our common stock will result in a corresponding balance sheet change in the fair value of the notes and a non-cash mark to market entry on our income statement US$, in millions 15 |
|
|
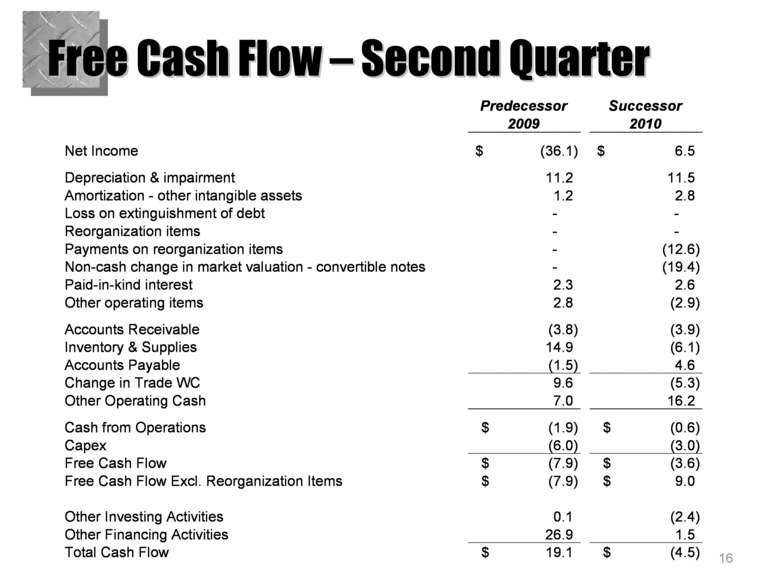
Free Cash Flow – Second Quarter Predecessor Successor 2009 2010 Net Income (36.1) $ 6.5 $ Depreciation & impairment 11.2 11.5 Amortization - other intangible assets 1.2 2.8 Loss on extinguishment of debt - - Reorganization items - - Payments on reorganization items - (12.6) Non-cash change in market valuation - convertible notes - (19.4) Paid-in-kind interest 2.3 2.6 Other operating items 2.8 (2.9) Accounts Receivable (3.8) (3.9) Inventory & Supplies 14.9 (6.1) Accounts Payable (1.5) 4.6 Change in Trade WC 9.6 (5.3) Other Operating Cash 7.0 16.2 Cash from Operations (1.9) $ (0.6) $ Capex (6.0) (3.0) Free Cash Flow (7.9) $ (3.6) $ Free Cash Flow Excl. Reorganization Items (7.9) $ 9.0 $ Other Investing Activities 0.1 (2.4) Other Financing Activities 26.9 1.5 Total Cash Flow 19.1 $ (4.5) $ 16 |
|
|
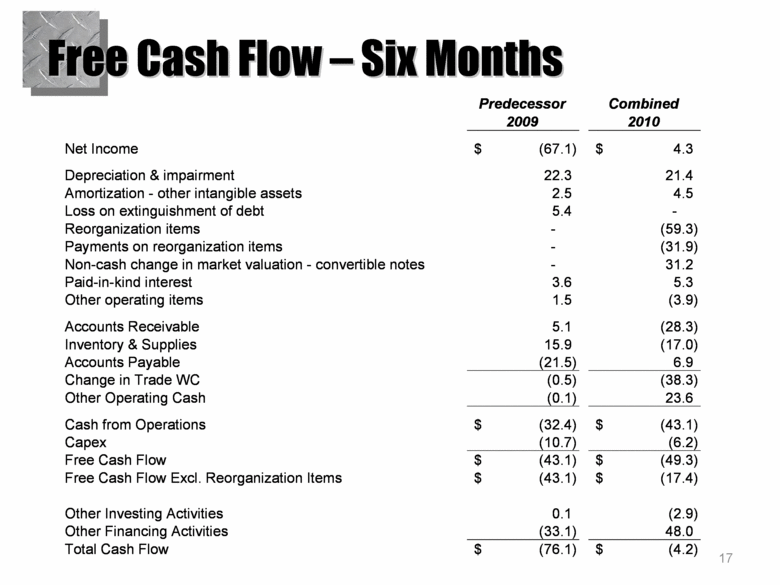
Free Cash Flow – Six Months Predecessor Combined 2009 2010 Net Income (67.1) $ 4.3 $ Depreciation & impairment 22.3 21.4 Amortization - other intangible assets 2.5 4.5 Loss on extinguishment of debt 5.4 - Reorganization items - (59.3) Payments on reorganization items - (31.9) Non-cash change in market valuation - convertible notes - 31.2 Paid-in-kind interest 3.6 5.3 Other operating items 1.5 (3.9) Accounts Receivable 5.1 (28.3) Inventory & Supplies 15.9 (17.0) Accounts Payable (21.5) 6.9 Change in Trade WC (0.5) (38.3) Other Operating Cash (0.1) 23.6 Cash from Operations (32.4) $ (43.1) $ Capex (10.7) (6.2) Free Cash Flow (43.1) $ (49.3) $ Free Cash Flow Excl. Reorganization Items (43.1) $ (17.4) $ Other Investing Activities 0.1 (2.9) Other Financing Activities (33.1) 48.0 Total Cash Flow (76.1) $ (4.2) $ 17 |
|
|
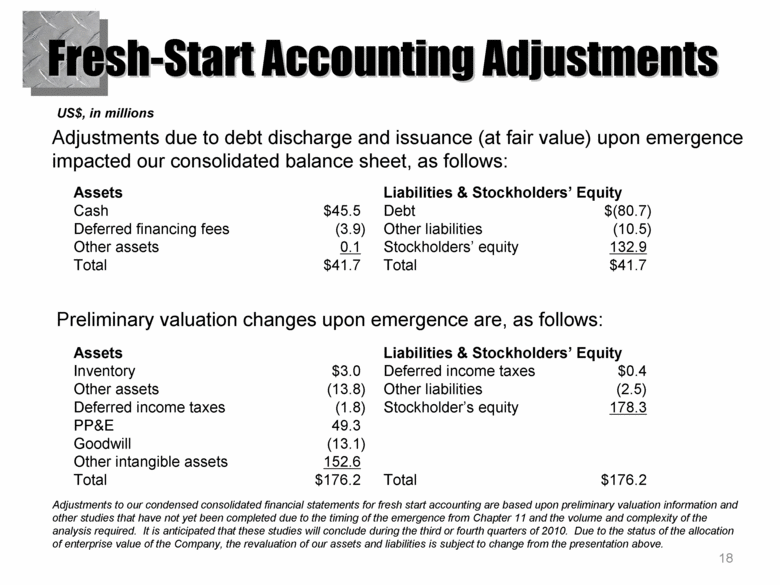
Fresh-Start Accounting Adjustments Adjustments to our condensed consolidated financial statements for fresh start accounting are based upon preliminary valuation information and other studies that have not yet been completed due to the timing of the emergence from Chapter 11 and the volume and complexity of the analysis required. It is anticipated that these studies will conclude during the third or fourth quarters of 2010. Due to the status of the allocation of enterprise value of the Company, the revaluation of our assets and liabilities is subject to change from the presentation above. Adjustments due to debt discharge and issuance (at fair value) upon emergence impacted our consolidated balance sheet, as follows: Preliminary valuation changes upon emergence are, as follows: $41.7 Total $41.7 Total 132.9 Stockholders’ equity 0.1 Other assets ) (10.5 Other liabilities ) (3.9 Deferred financing fees ) $(80.7 Debt $45.5 Cash Liabilities & Stockholders’ Equity Assets 49.3 PP&E 178.3 Stockholder’s equity ) (1.8 Deferred income taxes ) (13.1 Goodwill $176.2 Total $176.2 Total 152.6 Other intangible assets (2.5) Other liabilities ) (13.8 Other assets $0.4 Deferred income taxes $3.0 Inventory Liabilities & Stockholders’ Equity Assets US$, in millions 18 |
|
|
Senior Secured Note Placement Accuride Corporation (“Accuride” or the “Company”) issued $310mm senior secured notes at 9.5% Concurrent with the bond offering, the Company put in place up to $75mm ABL revolving credit facility Proceeds from the financing were used to retire the existing term loan and to add incremental liquidity via the revolving credit facility Financing provides a capstone to the Company’s restructuring efforts Results in a stable, long-term capital structure with extended maturity profile On a proforma basis with second quarter results, improves liquidity from $52 to approximately $98 million. Increases financial flexibility by eliminating financial maintenance covenants 19 |
|
|
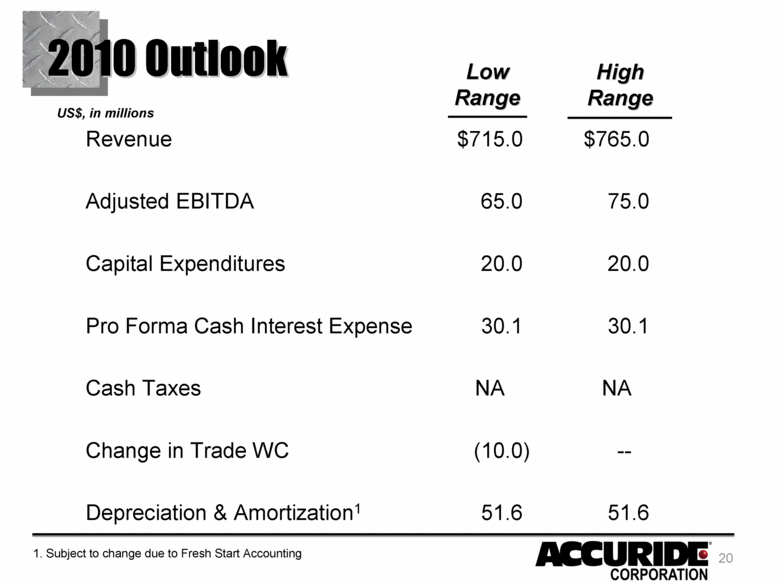
2010 Outlook Revenue $715.0 $765.0 Adjusted EBITDA 65.0 75.0 Capital Expenditures 20.0 20.0 Pro Forma Cash Interest Expense 30.1 30.1 Cash Taxes NA NA Change in Trade WC (10.0) -- Depreciation & Amortization1 51.6 51.6 Low Range High Range US$, in millions 1. Subject to change due to Fresh Start Accounting 20 |
|
|
Questions? 21 |

