Attached files
| file | filename |
|---|---|
| EX-21 - NEVADA GOLD & CASINOS INC | v191661_ex21.htm |
| EX-31.2 - NEVADA GOLD & CASINOS INC | v191661_ex31-2.htm |
| EX-31.1 - NEVADA GOLD & CASINOS INC | v191661_ex31-1.htm |
| EX-32.2 - NEVADA GOLD & CASINOS INC | v191661_ex32-2.htm |
| EX-32.1 - NEVADA GOLD & CASINOS INC | v191661_ex32-1.htm |
| EX-23.1 - NEVADA GOLD & CASINOS INC | v191661_ex23-1.htm |
UNITED
STATES
SECURITIES
AND EXCHANGE COMMISSION
Washington,
D.C. 20549
FORM
10-K
|
x
|
Annual
Report Pursuant to Section 13 or 15(d) of the Securities
Exchange Act of 1934
|
for
fiscal year ended April 30, 2010
or
|
o
|
Transition
Report Pursuant to Section 13 or 15(d) of the Securities
Exchange Act of 1934
|
for the
transition period from
to
Commission
File No. 001-15517
Nevada
Gold & Casinos, Inc.
(Exact
Name of Registrant as Specified in Its Charter)
|
Nevada
|
88-0142032
|
|
|
(State
or other jurisdiction of Incorporation or organization)
|
(IRS
Employer Identification No.)
|
|
|
50
Briar Hollow Lane, Suite 500W, Houston, Texas
|
77027
|
|
|
(Address
of principal executive offices)
|
|
(Zip
Code)
|
Registrant’s
telephone number, including area code: (713) 621-2245
Securities
registered pursuant to Section 12(b) of the Act:
|
Title of each class
|
Name of each exchange on which
registered
|
|
|
Common
stock, $0.12 par value
|
|
New
York Stock Exchange AMEX
|
Securities
registered pursuant to Section 12(g) of the Act: None.
Indicate
by check mark if the registrant is a well-known seasoned issuer, as defined in
Rule 405 of the Securities Act.
o Yes x No
Indicate
by check mark if the registrant is not required to file reports pursuant to
Section 13 or Section 15(d) of the Act.
o Yes x No
Indicate
by check mark whether the registrant: (1) has filed all reports required to be
filed by Section 13 or 15(d) of the Securities Exchange Act of 1934 during the
preceding 12 months (or for such shorter period that the registrant was required
to file such reports), and (2) has been subject to such filing requirements for
the past 90 days.
x Yes o No
Indicate
by check mark whether the registrant has submitted electronically and posted on
its corporate web site, if any, every Interactive Data File required to be
submitted and posted pursuant to Rule 405 of Regulation S-T during the preceding
twelve months (or for such shorter period that the registrant was required to
submit and post such files).
x Yes o No
Indicate
by check mark if disclosure of delinquent filers pursuant to Item 405 of
Regulation S-K is not contained herein, and will not be contained, to the best
of registrant’s knowledge, in definitive proxy or information statements
incorporated by reference in Part III of this Form 10-K or any amendment to this
Form 10-K. o
Indicate
by check mark whether the registrant is a large accelerated filer, an
accelerated filer, a non-accelerated filer, or a smaller reporting company. See
definition of “accelerated filer and large accelerated filer” in Rule 12b-2 of
the Exchange Act. (Check one):
Large
accelerated filer o Accelerated
filer o Non-accelerated
filer o Smaller
Reporting Company x
Indicate
by check mark whether the registrant is a shell company (as defined in Rule
12b-2 of the Exchange Act.
o Yes x No
As of
June 30, 2010 the aggregate market value of the voting stock held by
non-affiliates of the registrant based on the closing price per share of $0.88,
as reported on the New York Stock Exchange, was $11,025,751.
As of
July 27, 2010, the registrant had 12,764,130 shares of common stock
outstanding.
DOCUMENTS
INCORPORATED BY REFERENCE
Portions
of the definitive Proxy Statement for the registrant’s 2010 Annual Meeting of
Stockholders to be filed pursuant to Regulation 14A within 120 days after the
registrant’s fiscal year end of April 30, 2010 are incorporated by reference
into Part III of this report.
NEVADA
GOLD & CASINOS, INC.
TABLE
OF CONTENTS
|
Page
|
||||
|
PART
I
|
||||
|
ITEM
1.
|
BUSINESS
|
1
|
||
|
ITEM
1A.
|
RISK
FACTORS
|
6
|
||
|
ITEM
1B.
|
UNRESOLVED
STAFF COMMENTS
|
8
|
||
|
ITEM
2.
|
PROPERTIES
|
8
|
||
|
ITEM
3.
|
LEGAL
PROCEEDINGS
|
8
|
||
|
ITEM
4.
|
REMOVED
AND RESERVED
|
8
|
||
|
PART
II
|
||||
|
ITEM
5.
|
MARKET
FOR REGISTRANT’S COMMON EQUITY, RELATED STOCKHOLDER MATTERS AND ISSUER
PURCHASES OF EQUITY SECURITIES
|
8
|
||
|
ITEM
6.
|
SELECTED
FINANCIAL DATA
|
10
|
||
|
ITEM
7.
|
MANAGEMENT’S
DISCUSSION AND ANALYSIS OF FINANCIAL CONDITION AND RESULTS OF
OPERATIONS
|
10
|
||
|
ITEM
7A.
|
QUANTITATIVE
AND QUALITATIVE DISCLOSURES ABOUT MARKET RISK
|
18
|
||
|
ITEM
8.
|
FINANCIAL
STATEMENTS AND SUPPLEMENTARY DATA
|
18
|
||
|
ITEM
9.
|
CHANGES
IN AND DISAGREEMENTS WITH ACCOUNTANTS ON ACCOUNTING AND FINANCIAL
DISCLOSURE
|
18
|
||
|
ITEM
9A.
|
CONTROLS
AND PROCEDURES
|
19
|
||
|
ITEM
9B.
|
OTHER
INFORMATION
|
20
|
||
|
PART
III
|
||||
|
ITEM
10.
|
DIRECTORS,
EXECUTIVE OFFICERS AND CORPORATE GOVERNANCE
|
20
|
||
|
ITEM
11.
|
EXECUTIVE
COMPENSATION
|
20
|
||
|
ITEM
12.
|
SECURITY
OWNERSHIP OF CERTAIN BENEFICIAL OWNERS AND MANAGEMENT AND RELATED
STOCKHOLDER MATTERS
|
20
|
||
|
ITEM
13.
|
CERTAIN
RELATIONSHIPS AND RELATED TRANSACTIONS AND DIRECTOR
INDEPENDENCE
|
20
|
||
|
ITEM
14.
|
PRINCIPAL
ACCOUNTANT FEES AND SERVICES
|
20
|
||
|
PART
IV
|
||||
|
ITEM
15.
|
|
EXHIBITS
AND FINANCIAL STATEMENT SCHEDULES
|
|
20
|
i
FORWARD-LOOKING
STATEMENTS
Factors
that May Affect Future Results
(Cautionary
Statements Under the Private Securities Litigation Reform Act of
1995)
Certain
information included in this Form 10-K and other materials filed or to be filed
by the Company with the Securities and Exchange Commission (as well as
information included in oral statements or other written statements made or to
be made by the Company or its representatives) contains or may contain
forward-looking statements within the meaning of Section 27A of the Securities
Act of 1933, as amended, and Section 21E of the Securities Exchange Act of 1934,
as amended. These statements can be identified by the fact that they do not
relate strictly to historical or current facts. Statements that include the
words “may,” “could,” “should,” “would,” “believe,” “expect,” “anticipate,”
“estimate,” “intend,” “plan,” or other words or expressions of similar meaning,
may identify forward-looking statements. We have based these forward-looking
statements on our current expectations about future events. Forward-looking
statements include statements that reflect management’s beliefs, plans,
objectives, goals, expectations, anticipations, intentions with respect to the
financial condition, results of operations, future performance and the business
of the Company, including statements relating to our business strategy and our
current and future development plans.
Although
we believe that the assumptions underlying these forward-looking statements are
reasonable, any or all of the forward-looking statements in this report and in
any other public statements that are made may prove to be incorrect. This may
occur as a result of inaccurate assumptions or as a consequence of known or
unknown risks and uncertainties. Many factors discussed in this report, such as
the competitive environment and government regulation, will be important in
determining the Company’s future performance. Consequently, actual results may
differ materially from those that might be anticipated from forward-looking
statements. In light of these and other uncertainties, you should not regard the
inclusion of a forward-looking statement in this report or other public
communications that we might make as a representation by us that our plans and
objectives will be achieved, and you should not place undue reliance on such
forward-looking statements.
We
undertake no obligation to publicly update or revise any forward-looking
statements, whether as a result of new information, future events or otherwise.
Any further disclosures made on related subjects in the Company’s subsequent
reports filed with the Securities and Exchange Commission should be
consulted.
ii
Part
I
|
Item
1.
|
Business
|
Overview
Nevada
Gold & Casinos, Inc., a Nevada corporation, was formed in 1977 and, since
1994 has been primarily a gaming company involved in financing, developing,
owning and operating gaming projects.
Commercial Gaming
Projects.
We own
and operate the Colorado Grande Casino in Cripple Creek, Colorado. On
May 12, 2009, we purchased three mini-casinos in Washington State, the Crazy
Moose-Pasco, Crazy Moose-Mountlake Terrace, and Coyote
Bob’s-Kennewick.
In March
2010, we signed management and technical services contracts for the development
and management of a hotel and casino adjacent to the Las Vegas Motor Speedway in
North Las Vegas. The project will be owned by various limited liability
companies of which Nevada Gold will hold a minority interest and option rights
to acquire additional equity.
In April
2010, we reached an agreement to acquire up to an additional seven mini-casinos
in the state of Washington for $11.1 million, which closed on July 23, 2010. The
casinos were owned by subsidiaries of Evergreen Gaming Corporation
("Evergreen"), a British Columbia corporation, which is under bankruptcy court
protection. The transaction was financed by cash on hand as well as a $5.1
million note issued to Evergreen's current senior lender. See Note 18
of our Consolidated Financial Statements for a pro-forma analysis of the
transaction.
Native American Gaming
Project.
As of May
2007, we owned a 40% interest in Buena Vista Development Company,
LLC (“Buena Vista Development”) which is developing a casino for a Native
American tribe in Amador County, California. Effective November 25,
2008, through our wholly owned subsidiary, Nevada Gold BVR, L.L.C., we sold our
40% interest in Buena Vista Development, L.L.C (BVD) to B.V. Oro, L.L.C. (BVO),
which is owned by our former partner and related parties, for $16 million cash
and a $4 million receivable from BVD which is due no later than two years after
the opening of a gaming/entertainment facility to be built by BVD for the Buena
Vista Rancheria of Me-Wuk Indians. This receivable bears interest at
the rate of prime plus 1% and is guaranteed by our former partner and related
parties. In addition we are entitled to a 5% carried interest in the
Class B membership interest. Should the facility not be developed, the
collectibility of this receivable cannot be assured.
Management
Agreements.
Effective
November 10, 2008, we signed a management contract with Oceans Casino Cruises,
Inc., owner of SunCruz Casinos. The contract was to extend to
December 31, 2010. On December 16, 2009, Ocean Casino Cruises, Inc.
(d/b/a “SunCruz”) discontinued operations. We were paid for our management
fee through that date. On December 28, 2009, SunCruz filed Chapter 7
bankruptcy. On February 10, 2010, we submitted a claim in the United
States Bankruptcy Court for the Southern District of Florida for the $500,000
termination fee due to us per the Management Agreement. At this time, we
do not believe it is likely to collect the termination fee, or any part thereof.
Our
management agreement has been terminated as a result of the bankruptcy
proceedings. The Company continues to pursue outside management
agreements.
We also
have real-estate interests in Colorado which are currently offered for
sale.
We report
our operations in two segments - gaming projects and non-core assets. For a
summary of financial information concerning these two segments, please refer to
the information provided in Note 12 to our Consolidated Financial
Statements.
Objective
and Strategies
Our
primary business objective is to increase long-term returns to shareholders
through appreciation in the value of our common shares. To achieve this
objective, we intend to grow our assets and our earnings by following three
business strategies:
|
|
-
|
enhancing
the return from, and the value of, the gaming properties in which we own
interests;
|
|
|
-
|
acquiring
or developing additional gaming
properties; and
|
1
|
|
-
|
assisting
in finding financing, developing and/or managing of, or providing
consulting services to gaming
projects.
|
Current
Commercial Casino Projects
The
Colorado Grande Casino-Cripple Creek
On April
25, 2005, we acquired the Colorado Grande Casino located in Cripple Creek,
Colorado, from Isle of Capri Black Hawk (IC-BH) for $6.5 million. The Colorado Grande
Casino is located at a primary intersection, near the center of the Cripple
Creek market. The property currently consists of a casino with approximately 191
slot machines, four table games, two restaurants with bars and 44 parking
spaces. The friendly atmosphere is enhanced as good customers are treated to
"comps" in the form of free drinks, free meals, or other benefits. In
November 2008, Colorado passed Amendment 50 which effective July 2, 2009,
increased bet limits from $5 to $100, permits craps, roulette, poker, blackjack,
and other table games, allows 24 hour gaming, and lowered gaming tax
rates. To take advantage of this and remain competitive in the
market, we invested an additional $600,000 in the property to provide blackjack,
roulette, house-banked poker, and a food outlet on the casino
floor.
Cripple
Creek is 40 miles west of Colorado Springs, Colorado, which is 65 miles south of
Denver, Colorado. We believe that the Cripple Creek market attracts customers
primarily from Colorado Springs, Pueblo, Fort Carson and smaller areas south of
Denver.
Nevada
Gold Washington – Washington State
On May
12, 2009, Nevada Gold completed its acquisition of three mini casinos in the
State of Washington, for $15.75 million. The casinos were owned by Gullwing III,
LLC (“sellers”) and the transaction was funded by existing cash as well as a
$4.0 million note issued by the sellers. See Note 7 of our
consolidated financial statements.
The three
casinos are the Crazy Moose Casino, located in Pasco, Coyote Bob's Roadhouse
Casino, located in Kennewick, and the Crazy Moose Casino, located in Mountlake
Terrace in close proximity to Seattle. Combined, the facilities have a total of
40 table games including blackjack, Pai Gow poker, Baccarat, Spanish 21,
Blackjack-Double Action, Ultimate Holdem, and Three and Four card poker. New
games are frequently introduced to keep the customers interested and active.
Additional banked table games are permitted along with poker and pull tabs. Each
casino includes a full service restaurant with bar. The friendly atmosphere is
enhanced as good customers are treated to "comps" in the form of free
non-alcoholic drinks, free meals, or other benefits. The three casinos operate
with approximately 400 employees and have a total of 306 parking
spaces.
As of
January 1, 2009, the maximum bet for each facility was increased from $200 to
$300 and the law was changed to allow casinos to be open 24 rather than 20 hours
per day.
Two of
the casinos are located within 250 miles in the Tri-cities area and one is
located in the Seattle area. We believe that the Crazy Moose Casino
in Mountlake attracts customers from the Seattle area, whereas the Crazy Moose
Pasco and Coyote Bob’s Roadhouse Casino located in the Southeast portion of
Washington state, attracts customers from Walla Walla, southeastern Washington
State, and northeastern Oregon.
Nevada Gold
Washington II – Washington State
On July 23, 2010, the Company acquired six additional casinos, and
their related operating center, in the state of Washington. See Note 18 of
our consolidated financial statements.
Native
American Casino Projects
Buena Vista Rancheria of
Me-Wuk Indians; Ione, Amador County, California
On May 4,
2005, we, through our wholly owned subsidiary, Nevada Gold BVR, L.L.C., acquired
a 20% interest in BVD in exchange for an approximately $14.8 million loan and an
equity investment of approximately $200,000. Our initial 20%
ownership interest in BVD increased by five percentage points at the end of
every six month period the loan remained outstanding, up to a maximum of an
additional 20%, for a total of 40%. At May, 2007, we owned a 40%
interest in BVD.
Effective
November 25, 2008, through our wholly owned subsidiary, Nevada Gold BVR, L.L.C.,
we sold our 40% interest in BVD to BVO, which is owned by our former partner and
related parties, for $16 million cash and a $4 million receivable from BVO which
is due no later than two years after the opening of a gaming/entertainment
facility to be built by BVO for the Buena Vista Rancheria of Me-Wuk
Indians. This receivable bears interest at the rate of prime plus 1%
and is guaranteed by our former partner and related parties. In
addition, we are entitled to a 5% carried interest in the Class B membership
interest.
We cannot
predict the future performance of the casino. We expect the casino’s primary
market to include Sacramento and Stockton, California. In this market, the
casino will most directly compete with the Jackson Rancheria Casino located in
Jackson, California, approximately 10 miles from the proposed Buena Vista
Casino, the Cache Creek Casino located approximately 45 miles northwest of
Sacramento, Thunder Valley Casino located a few miles northeast of Sacramento,
Red Hawk Casino located approximately 40 miles northeast of Sacramento, and the
Shingle Springs Casinos located just east of Sacramento on Highway
50.
2
Other
Casino Projects
Route 66 Casino;
Albuquerque, New Mexico
We owned
a 51% interest in Route 66 which we accounted for using the equity method. We
received no cash distributions from the Route 66 Casinos venture. Our portion of
the earnings of the Route 66 Casinos venture was estimated and recorded based on
available financial information. In April 2008, we signed a settlement agreement
with American Heritage, Inc. and Fred Gillman, the principal of American
Heritage, Inc. (“The Gillmann Group”). Per the agreement, The Gillmann Group
paid us $1 million on May 1, 2008, $1.3 million on June 2, 2008 and was
obligated to pay us $2.3 million by April 15, 2010. There was an
offsetting $0.7 million liability previously netted against the $2.3 million,
resulting in a net balance of $1.6 million. The $2.3 million was not
received as of April 30, 2010, as a result we elected to establish a valuation
allowance against the remaining $1.6 million receivable on the balance
sheet. We are pursuing legal action to collect the
receivable. See Note 16 to the accompanying Consolidated Financial
Statements for a discussion of our current legal position and accounting of the
settlement agreement and our former investment in this joint
venture.
Management
Contracts
Oceans Casino Cruises,
Inc.
On
November 10, 2008, we signed a contract to manage the SunCruz Casinos for Oceans
Casino Cruises, Inc. The contract was to extend to December 31,
2010. On December 16, 2009, SunCruz discontinued operations. We
were paid for our management fee through that date. On December 28, 2009,
SunCruz filed Chapter 7 bankruptcy. On February 10, 2010 we submitted a
claim in the United States Bankruptcy Court for the Southern District of Florida
for the $500,000 termination fee due to us per the Management Agreement.
At this time, we do not believe it is likely to collect the termination fee, or
any part thereof.
Our
management agreement has been terminated as a result of the bankruptcy
proceedings.
Regulation and Licensing
Colorado
The
ownership and operation of gaming facilities in Colorado are subject to
extensive state and local regulations. No gaming may be conducted in Colorado
unless licenses are obtained from the Colorado Limited Gaming Control Commission
(the “Gaming Commission”). In addition, the State of Colorado created the
Division of Gaming (the “CDG”) within its Department of Revenue to license,
implement, regulate, and supervise the conduct of limited stakes gaming. The
Director of the CDG (“CDG Director”), under the supervision of the Gaming
Commission, has been granted broad powers to ensure compliance with the laws and
regulations. The Gaming Commission, CDG and CDG Director that have
responsibility for regulation of gaming are collectively referred to as the
“Colorado Gaming Authorities.”
The laws,
regulations, and supervisory procedures of the Colorado Gaming Authorities seek
to maintain public confidence and trust that licensed limited gaming is
conducted honestly and competitively, that the rights of the creditors of
licensees are protected, and that gaming is free from criminal and corruptive
elements. The Colorado Gaming Authorities’ stated policy is that public
confidence and trust can be maintained only by strict regulation of all persons,
locations, practices, associations, and activities related to the operation of
the licensed gaming establishments and the manufacture and distribution of
gaming devices and equipment.
The
Gaming Commission is empowered to issue five types of gaming and related
licenses. To operate our Colorado casino we are required to maintain a retail
gaming license, which must be renewed each year, and the Colorado Commission has
broad discretion to revoke, suspend, condition, limit, or restrict the licensee
at any time. Under Colorado gaming regulations, no person or entity can have an
ownership interest in more than three retail licenses, and our business
opportunities will be limited accordingly. The Colorado Casinos’ licenses are
renewable annually, subject to continued compliance with gaming regulations. The
failure or inability of the Colorado Grande-Cripple Creek (the "Colorado
Casino"), or the failure or inability of others associated with the Colorado
Casino to maintain necessary gaming licenses or approvals would have a material
adverse effect on our operations.
The
Colorado Casino must meet specified architectural requirements, fire safety
standards and standards for access for disabled persons. It also must not exceed
specified gaming square footage limits as a total of each floor and the full
building. Casinos may operate 24 hours daily. Colorado casinos are permitted to
operate slot machines and various types of table games, such as blackjack,
poker, craps and roulette. Casino patrons must be 21 or older to
gamble in the casino. Effective July 2, 2009, the casino is permitted
to operate 24 hours per day and the maximum bet limit was increased $5 to $100.
No Colorado Casino may provide credit to its gaming patrons.
3
The
Colorado Constitution permits a gaming tax of up to 20% on adjusted gross gaming
proceeds, and authorizes the Gaming Commission to change the rate annually. As
of July 2, 2009, any increase in the gamming tax rate requires statewide voter
approval. The current gaming tax rate is 0.25% on adjusted gross
gaming proceeds of up to and including $2 million, 2% over $2 million up to and
including $5 million, 9% over $5 million up to and including $8 million, 11%
over $8 million up to and including $10 million, 16% over $10 million up to and
including $13 million and 20% on adjusted gross proceeds in excess of $13
million.
Colorado
law requires that every officer, director or stockholder holding either a 5% or
greater interest or controlling interest of a publicly traded corporation, or
owners of an applicant or licensee, shall be a person of good moral character
and submit to a full background investigation conducted by the Gaming
Commission. The Gaming Commission may require any person having an interest in a
license or a licensee to undergo a full background investigation and pay the
cost of investigation in the same manner as an applicant. Persons found
unsuitable by the Gaming Commission may be required to immediately
terminate any interest in, association or agreement with, or relationship to, a
licensee. A finding of unsuitability with respect to any officer, director,
employee, associate, lender or beneficial owner of a licensee or applicant may
also jeopardize the licensee’s license or applicant’s license application.
Licenses may be conditioned upon termination of any relationship with unsuitable
persons.
The rules
impose certain additional restrictions and reporting and filing requirements on
publicly traded entities holding gaming licenses in Colorado. A licensee or
affiliated company or any controlling person of a licensee or affiliated
company, which commences a public offering of voting securities, must notify the
Gaming Commission with regard to a public offering to be registered with the
Securities and Exchange Commission ("SEC"), no later than ten business days
after the initial filing of a registration statement with the SEC, or, with
regard to any other type of public offering, no later than ten business days
prior to the public use or distribution of any offering document, if: 1) the
licensee, affiliated company or a controlling person thereof, intending to issue
the voting securities is not a publicly traded corporation; or 2) if the
licensee, affiliated company or controlling person thereof, intending to issue
the voting securities is a publicly traded corporation, and if the proceeds of
the offering, in whole or in part, are intended to be used: a) to pay for
construction of gaming facilities in Colorado to be owned and operated by the
licensee; b) to acquire any direct or indirect interest in gaming facilities in
Colorado; c) to finance the operation by the licensee of gaming facilities in
Colorado; or d) to retire or extend obligations incurred for one or more of the
purposes set forth in subsections a, b, or c above.
We may
not issue any voting securities except in accordance with the provisions of the
Colorado Limited Gaming Act and the regulations promulgated thereunder. The
issuance of any voting securities in violation will be void and the voting
securities will be deemed not to be issued and outstanding. No voting securities
may be transferred, except in accordance with the provisions of the Colorado
Limited Gaming Act and the regulations promulgated thereunder. Any transfer in
violation of these provisions will be void. If the Colorado Limited Gaming
Control Commission at any time determines that a holder of our voting securities
is unsuitable to hold the securities, then we may, within sixty (60) days after
the finding of unsuitability, purchase the voting securities of the unsuitable
person at the lesser of (a) the cash equivalent of such person’s investment, or
(b) the current market price as of the date of the finding of unsuitability,
unless such voting securities are transferred to a suitable person within sixty
(60) days after the finding of unsuitability. Until our voting securities are
owned by persons found by the Commission to be suitable to own them, (a) we are
not permitted to pay any dividends or interest with regard to the voting
securities, (b) the holder of such voting securities will not be entitled to
vote and the voting securities will not for any purposes be included in the
voting securities entitled to vote, and (c) we may not pay any remuneration in
any form to the holder of the voting securities, except in exchange for the
voting securities.
Washington
The
gaming legislation in Washington State is codified in chapter 9.46 of the
Revised Code of Washington (“RCW”). The gaming legislation stipulates the
Washington State Gambling Commission (the “Commission”) to be the regulator of
gambling activities in this state. The Commission enforces its
authority through an extensive set of rules and regulations promulgated in Title
230 of the Washington Administrative Code. The state of Washington
allows certain gambling activities, such as amusement games, bingo, raffles,
punch boards, pull-tabs, card-rooms, and social card games. In order
to be considered legal, these activities must be operated by either non-profit
organizations or by commercial food and drink establishments. Some
activities may be operated solely by non-profit organizations, such as
raffles. Traditional casino games, such as craps, roulette and keno,
are prohibited. House-banked card-rooms have been authorized in
Washington State since 1997 and, under current law, each establishment is
allowed to have up to 15 tables offering games, such as Blackjack, Ultimate
Texas Hold’em, Three Card Poker, Four Card Poker, Spanish Poker, Texas Shootout,
Spanish 21, Pai Gow Poker, and others. The law allows both
player-sponsored and house-banked card-rooms. As of January 1, 2009,
the Commission increased the maximum bet for house-banked card-rooms’ table game
wager limit to $300 and allowed card-rooms to offer Mini-Baccarat. In addition,
these establishments are allowed to be open 24 hours per day, provided they
close for at least four continuous hours two times per week.
In order
to operate our three “mini casinos,” Crazy Moose Casino in Pasco, Crazy Moose
Casino in Mountlake Terrace and Coyote Bob’s Roadhouse Casino in Kennewick, each
of them is required to maintain a Public Card room license and Punch
Board/Pull-Tab Commercial Stimulant license. These licenses are
renewable annually, subject to continued compliance with applicable gaming
regulations. In addition, the Commission requires, prior to the
licenses being issued, each substantial interest holder in the licensees
(including our officers, directors and owners of five percent or more of any
class of our stock) submit to the Commission certain disclosure forms and be
subject to background investigations. The failure or inability of our
“mini-casinos” to maintain their respective licenses would have a material
adverse effect on our operations.
4
RCW
9.46.110 allows local governments (including cities, counties and towns) to
prohibit any or all gambling activities for which licenses are required as well
as tax such activities. The maximum tax limitations imposed by law
include 20% of gross receipt for card-rooms and either 5% of gross receipts or
10% of net receipt (as chosen by a local authority) for pull-tabs
activities. The current gaming tax rate in the cities of Pasco and
Mountlake Terrace is 10% of table games gross receipts and 5% of pull-tabs gross
receipts while in the city of Kennewick the current gaming tax rate is 10% of
table games gross receipts and 10% of pull-tabs net receipts. In
addition, Washington State charges a business and occupational tax in the amount
of 1.63% of all gaming activities’ net receipts in order to promote responsible
gaming.
Native
American Gaming
Although
it may seek new agreements, the Company does not currently operate gaming
facilities on behalf of any Native American tribe nor is it receiving
compensation pursuant to any consulting, financing or advisory
agreement. Reference is made to “Native American Casino Projects”
above.
General Gaming
Regulations in Other Jurisdictions
If we
become involved in gaming operations in any other jurisdictions, such gaming
operations will subject us and certain of our officers, directors, key
employees, stockholders and other affiliates to strict legal and regulatory
requirements, including mandatory licensing and approval requirements,
suitability requirements, and ongoing regulatory oversight with respect to such
gaming operations. There can be no assurance that we will obtain all of the
necessary licenses, approvals and findings of suitability or that our officers,
directors, key employees, other affiliates and certain other stockholders will
satisfy the suitability requirements in one or more jurisdictions, or that such
licenses, approvals and findings of suitability, if obtained, will not be
revoked, limited, suspended or not renewed in the future.
Failure
by the Company to obtain, or the loss or suspension of, any necessary licenses,
approval or findings of suitability would prevent us from conducting gaming
operations in such jurisdiction and possibly in other
jurisdictions.
Other
Assets
Gold Mountain Development. Through our
wholly-owned subsidiary, Gold Mountain Development, L.L.C., we own approximately
265 acres of real property in the vicinity of Black Hawk, Colorado. In November
2004, the Central City Business Improvement District completed the construction
of a new 8.4 mile four-lane road connecting Interstate 70 to Central City,
Colorado. The new road is adjacent to a portion of our 265 acres.
Nevada
Gold Speedway, LLC. Through our wholly owned subsidiary, NG
Speedway, LLC, we have signed management and technical services contracts for
the development and management of a hotel and casino adjacent to the Las Vegas
Motor Speedway in North Las Vegas. The project will be owned by various limited
liability companies of which Nevada Gold will hold a minority
interest. We will assist in the development and manage the
operation of the property. The development is expected to be completed in
three phases. The first phase, which will include 250 hotel rooms, restaurants,
meeting rooms and a casino with up to 500 gaming positions, is expected to be
completed during 2012. The development remains subject to numerous conditions,
including obtaining financing to repay the outstanding obligations related to
the land and securing financing for the development.
NG Washington II, LLC. Through our
wholly-owned subsidiary, NG Washington II, LLC, we signed an agreement in April
2010 to acquire up to seven mini-casinos in Washington State. We
escrowed $1.0 million as a deposit and as of April 30, 2010, spent $0.3 million
additional funds for licensing and legal matters pertaining to the
acquisition. Closing of the acquisition was subject to the bankruptcy
court process which was finalized May 28, 2010. In addition, the acquisition was
subject to other customary closing conditions, including licensing and necessary
lease transfers, among other conditions.
On July
23, 2010, the Company acquired six of the seven casinos, and their
related operating center. The casinos are the Silver Dollar Seatac, the Silver
Dollar Renton, the Silver Dollar Mill Creek, Club Hollywood, located in
Shoreline, the Royal Casino, located in Everett, and the Golden Nugget Casino,
located in Tukwila, collectively “Silver Dollar Casinos”. All of the casinos are
located in western Washington. The casinos were previously owned by
subsidiaries of Evergreen Gaming Corporation, a British Columbia Corporation,
which is under bankruptcy court protection. The Company purchased the
six casinos from Fortress Credit Opportunities I, LP and Fortress Credit Funding
II, LP, (the “Sellers”) for $11.07 million, $6.0 million which was paid in cash
and $5.07 million by a credit agreement, issued by the Company to the Sellers
that is due July 23, 2012, and bears an interest rate based on the 30 day LIBOR
at the end of each calendar month, plus 9%, with a floor of
11.0%. Interest is due monthly.
Employees
As of
April 30, 2010, we employed 481 people.
5
Available
Information
We make
available on our website (www.nevadagold.com) under “Investor Relations - SEC
Filings,” free of charge, our annual reports on Form 10-K, quarterly reports on
Form 10-Q, current reports on Form 8-K and amendments to those reports, as soon
as reasonably practicable after we electronically file such material with the
Securities and Exchange Commission.
|
Item
1A.
|
Risk
Factors
|
The
following is a description of what we consider our key challenges and
risks:
Financing
future acquisitions may be difficult.
The
principal challenge facing the Company is the necessity to obtain financing in
order to expand gaming operations, generate cash flow, and service debt
obligations. There can be no assurance that such financing will be
obtained.
If
our key personnel leave us, our business could be adversely
affected.
Our
success is largely dependent upon the efforts and skills of our key executive
officers. The loss of the services of any key executive officer could have a
material adverse effect on us. There can be no assurance that we would be able
to attract and hire suitable replacements in the event of any such loss of
services. We currently have employment agreements with our Chief Executive
Officer, Senior Vice President/General Counsel/Chief Compliance Officer, and our
Executive Vice President/Chief Financial Officer.
Indebtedness
could adversely affect our financial health.
As of
April 30, 2010, we had $10.0 million of indebtedness outstanding, consisting of
a $6.0
million interest only promissory note which matures on June 30, 2013 and a
$4.0 million debt for the Washington properties which matures on May 12,
2012. Although we have substantially reduced our debt, our
indebtedness could have important consequences and significant effects on our
business and future operations. For example, it could:
|
·
|
increase
our vulnerability to general adverse economic and industry conditions or a
downturn in our business;
|
|
·
|
limit
our ability to fund future working capital, capital expenditures and other
general operating requirements;
|
|
·
|
place
us at a competitive disadvantage compared to our competitors that have
less debt or greater resources; and
|
|
·
|
limit
our ability to borrow additional
funds.
|
The occurrence of any one of these
events or conditions could have a material adverse effect on our business,
financial condition, results of operations, prospects, ability to service or
otherwise satisfy our obligations.
We
will require cash to service our indebtedness and fund our gaming operations.
Our ability to generate cash depends on many factors beyond our
control.
Our ability to fund our gaming
operations will depend on our ability to generate cash flow from our gaming
operations and borrow or refinance $4.0 million by May 12, 2012 and $6.0 million
by June 30, 2013. Our ability to generate sufficient cash flow to satisfy our
debt obligations will depend on our future operating performance that is subject
to many economic, competitive, regulatory and business factors that are beyond
our control. If we are unable to generate sufficient cash flow to service our
debt obligations, we will need to refinance or restructure our debt, sell
assets, reduce or delay capital investments or seek to raise additional capital.
These measures may not be available to us or, if available, they may not be
sufficient to enable us to satisfy our obligations and may restrict our ability
to pay operating expenses. If our cash flow is insufficient and we are unable to
implement one or more of these alternatives, we may not be able to service our
debt obligations or fund our gaming operations.
We
face significant competition from other gaming operations that could have a
material adverse effect on our future operations.
There is
intense competition among companies in the gaming industry, many of which have
significantly greater resources than we do. We compete with numerous casinos of
varying quality and size in market areas where our properties are located. The
gaming business is characterized by competitors that vary considerably by their
size, quality of facilities, number of operations, brand identities, marketing
and growth strategies, financial strength and capabilities, level of amenities,
management talent and geographic diversity. In most markets, we compete directly
with other casino facilities in the immediate and surrounding market areas. If
our competitors operate more successfully, if competitors' properties are
enhanced or expanded, or if additional casinos are established in and around
locations in which we conduct business, we may lose market share. The expansion
of casino gaming in or near any geographic area from which we attract or expect
to attract a significant number of our customers could have a significant
adverse effect on our business, financial condition and results of
operations.
6
We
are subject to extensive governmental gaming regulation that could adversely
affect us. We could be prevented from pursuing future
development projects due to changes in the laws, regulations and ordinances
(including tribal or local laws) that apply to gaming facilities or the
inability of us or our key personnel, significant shareholders or joint venture
partners to obtain or retain gaming regulatory licenses.
The
gaming industry is highly regulated and we must maintain our licenses in order
to continue our operations. Each of our gaming operations is subject to
extensive regulation under the laws, rules and regulations of the jurisdiction
where located. These laws, rules and regulations generally concern the
responsibility, financial stability and character of the owners, managers, and
persons with financial interests in the gaming operations. Certain
jurisdictions empower their regulators to investigate participation by
licensees in gaming outside their jurisdiction and require access to and
periodic reports concerning the gaming activities. Violations of laws in one
jurisdiction could result in disciplinary action in other jurisdictions.
Regulatory authorities have broad powers with respect to the licensing of casino
operations and may revoke, suspend, condition or limit our gaming or other
licenses, impose substantial fines and take other actions, any one of which
could have a significant adverse effect on our business, financial condition and
results of operations.
The
rapidly changing political and regulatory environment governing the gaming
industry (including gaming operations which are conducted on Indian land) makes
it impossible for us to accurately predict the effects that an adoption of or
changes in the gaming laws, regulations and ordinances will have on
us. However, the failure of us, or any of our key personnel,
significant shareholders or joint venture partners, to obtain or retain required
gaming regulatory licenses could prevent us from expanding into new markets,
prohibit us from generating revenues in certain jurisdictions, and subject us to
sanctions and fines.
Our
business is subject to various federal, state and local laws and regulations in
addition to gaming regulations. These laws and regulations include, but are not
limited to, restrictions and conditions concerning alcoholic beverages,
environmental matters, employees, currency transactions, taxation, zoning and
building codes, and marketing and advertising. Such laws and regulations could
change or could be interpreted differently in the future, or new laws and
regulations could be enacted. Material changes, new laws or regulations, or
material differences in interpretations by courts or governmental authorities
could adversely affect our results of operations and financial
condition.
We cannot
ensure that we will be able to comply with or conduct business in accordance
with applicable regulations.
We
could fail to monetize recorded assets.
The
Company has receivables that are projected to be collected. If the Company is
not able to collect or monetize these assets timely then the lack of such
collection may have a negative impact on the Company’s projected cash flow. The occurrence of
monetizing our recorded assets could have a material adverse effect on our
business, financial condition, results of operations, prospects, ability to
service or otherwise satisfy our obligations.
There
are significant risks in the development and management of commercial and Native
American Casinos that could adversely affect our financial results.
The
development and management of casinos require the satisfaction of various
conditions, many of which are beyond our control. The failure to satisfy any of
such conditions may significantly delay the completion of a project or prevent a
project's completion altogether.
The
opening of any facility will be contingent upon, among other things, the receipt
of all regulatory licenses, permits, approvals and authorizations, the
completion of construction and the hiring and training of sufficient personnel.
The scope of the approvals to construct and open a casino is extensive, and the
failure to obtain such approvals could prevent or delay the completion of
construction or opening of all or part of such casino.
No
assurance can be given that development activities will begin or will be
completed, or that the budget for such a project will not be exceeded, or that
we will have the continuing support of the community.
In
addition, the regulatory approvals necessary for the construction and operation
of casinos are often challenged in litigation brought by government entities,
citizens groups and other organizations and individuals. Such litigation can
significantly delay the construction and opening of casinos.
7
Major
construction projects entail significant risks, including shortages of materials
or skilled labor, unforeseen engineering, environmental and/or geological
problems, work stoppages, weather interference, and unanticipated cost
increases. Delays or difficulties in obtaining any of the requisite licenses,
permits, allocations and authorizations from regulatory authorities could
increase the total cost, delay or prevent the construction or opening of any
casino development. In addition, once developed, no assurances can be given that
we will be able to manage the casino on a profitable basis or to attract a
sufficient number of guests, gaming customers and other visitors to make the
operation profitable.
With each
project, we are subject to the risk that our investment may be lost if the
project cannot obtain adequate financing to complete development and open the
casino successfully. In some cases, we may be forced to provide more financing
than originally planned in order to complete development, increasing the risk to
us.
|
Item
1B.
|
Unresolved
Staff Comments
|
None.
|
Item
2.
|
Properties
|
Colorado Grande Casino-Cripple
Creek. We lease (through our wholly-owned subsidiary, Colorado Grande
Enterprises, Inc.) a portion of a building in Cripple Creek, Colorado, and an
adjacent parking lot, for use in connection with the Colorado Grande Casino
facilities. We lease this property at an annual rent of the greater of $144,000
or 5% of Colorado Grande-Cripple Creek’s adjusted gross gaming revenues, as
defined, with an annual cap of $400,000. On July 7, 2005, we exercised the
option to extend the lease to January 2021. On April 1, 2008 we negotiated an
extension of the lease to January 2033 at a flat annual rent of $400,000 from
February 2021 through January 2033. In addition, we own an additional parcel of
land adjacent to the Colorado Grande, which is used for parking.
Gold Mountain Development.
Through our wholly-owned subsidiary, Gold Mountain Development, L.L.C., we own
approximately 265 acres of real property in the vicinity of Black Hawk,
Colorado. In November 2004, the Central City Business Improvement District
completed the construction of a new 8.4 mile four-lane road connecting
Interstate 70 to Central City, Colorado. The new road is adjacent to a portion
of our 265 acres. The acreage is for sale and will be listed with a
broker.
Washington Casinos. As a
result of acquiring facilities in Washington, the Crazy Moose II Mountlake
Terrace has a building lease which expires May, 2011, with an option to renew
for two additional five year terms. The annual rent is $192,000. The
administrative office has a lease which expires February, 2011 with an option to
renew for one additional term. The annual rent is
$28,800. In addition, the Crazy Moose I Pasco has a parking lot lease
which expires January, 2011 with an option to renew for one more two year
term. The annual rent is $6,300. We own the buildings
for the Crazy Moose Pasco and Coyote Bob’s in Kennewick as well as a parcel of
land at Pasco used as a parking lot.
Office Lease. We currently
lease approximately 6,110 square feet of office space in Houston, Texas. The
lease expires March 31, 2011. The total monthly rent for this office space is
currently $8,700.
|
Item
3.
|
Legal
Proceedings
|
None
|
Item
4.
|
Removed
and Reserved
|
Part
II
|
Item 5.
|
Market For Registrant’s Common
Equity, Related Stockholder
Matters and
Issuer Purchases of Equity
Securities
|
Market
Information
Our
common stock is traded on the New York Stock Exchange-AMEX under the symbol UWN.
The following table sets forth the high and low sales prices per share of the
common stock for the last two fiscal years.
8
|
Fiscal
Years Ended
|
||||||||||||||||
|
April
30, 2010
|
April
30, 2009
|
|||||||||||||||
|
High
|
Low
|
High
|
Low
|
|||||||||||||
|
First
Quarter
|
$ | 1.40 | $ | .80 | $ | 1.34 | $ | 1.02 | ||||||||
|
Second
Quarter
|
1.27 | .97 | 1.29 | .53 | ||||||||||||
|
Third
Quarter
|
1.08 | .83 | .89 | .38 | ||||||||||||
|
Fourth
Quarter
|
1.10 | .74 | .84 | .66 | ||||||||||||
Holders
of Common Stock
As
of June 30, 2010, we had approximately 4,670 shareholders of
record.
Dividends
We have
not paid any dividends during the last four fiscal years and our current policy
is to retain earnings to provide for the growth of the Company. Consequently, no
cash dividends are expected to be paid on our common stock in the foreseeable
future.
Equity
Compensation Plan
The
following table gives information about our shares of common stock that may be
issued upon the exercise of options, warrants, and rights under all of our
existing equity compensation plans as of April 30, 2010 including the 1999 Stock
Option Plan and the 2009 Equity Incentive Plan, as well as shares of our common
stock that may be issued under individual compensation arrangements that were
not approved by our stockholders (such grants, the “Non-Plan
Grants”).
|
Plan Category
|
Number of
Securities
To be Issued Upon
Exercise of
Outstanding
Options, Warrants
and Rights
(A)
|
Weighted Average
Exercise Price of
Outstanding
Options,
Warrants and
Rights
(B)
|
Number of Securities
Remaining Available
for Future Issuance
Under Equity
Compensation Plans
(Excluding Securities
Reflected in Column
(A) (C)
|
||||||||
|
Equity
Compensation Plans Approved by Security Holders
|
1,456,000 | $ | 1.77 | 1,320,000 | |||||||
|
Equity
Compensation Plans Not Approved by Security Holders
|
— | $ | — | — | |||||||
|
Total
|
1,456,000 | $ | 1.77 | 1,320,000 | |||||||
Recent
Sales of Unregistered Securities
Not
applicable.
Issuer
Purchases of Equity Securities
In
December, 2009, in a private transaction, we purchased 175,000 shares of our
common stock at the then prevailing market price of $0.87 per
share. During the years ended April 30, 2010 and April 30, 2009, we
repurchased a total of 175,000 and 0 shares, respectively.
Stock
Performance Graph
The
following graph sets forth the cumulative total stockholder return (assuming
reinvestment of dividends) to the Company’s stockholders during the two-year
period ended April 30, 2010, as well as an overall stock market index (NYSE Arca
Major Market Index) and the Company’s peer group index (Dow Jones US Gambling
Index):
9
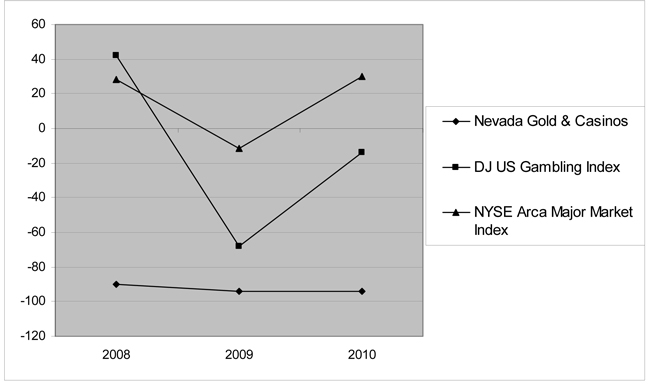
ASSUMES
$100 INVESTED ON MAR. 31, 2005
ASSUMES
DIVIDEND REINVESTMENT
FISCAL
YEAR ENDING APRIL 30, 2010
|
Item
6.
|
Selected
Financial Data
|
Not
required for smaller reporting companies.
|
Item 7.
|
Management’s Discussion and
Analysis of Financial Condition and Results of
Operations
|
The
following discussion and analysis (“MD&A”) should be read in conjunction
with our Consolidated Financial Statements and Notes thereto contained in Item 8
herein. Management is of the opinion that inflation and changing prices,
including foreign exchange fluctuations, will have little, if any, effect on our
consolidated financial position or results of our operations.
Critical
Accounting Policies and Estimates
Our
critical accounting policies and estimates involve the use of complicated
processes, assumptions, estimates and/or judgments in the preparation of our
consolidated financial statements. An accounting estimate is an approximation
made by management of a financial statement element, item or account in the
consolidated financial statements. Accounting estimates in our historical
consolidated financial statements measure the effects of past business
transactions or events, or the present status of an asset or liability. The
accounting estimates described below require us to make assumptions about
matters that are uncertain at the time the estimate is made. Additionally,
different estimates that we could have used or changes in an accounting estimate
that are reasonably likely to occur could have a material impact on the
presentation of our consolidated financial condition or results of operations.
We base our estimates on historical experience and on various other assumptions
that we believe are reasonable under the circumstances, the results of which
form the basis for making judgments. These estimates may change as new events
occur, as more experience is acquired, as additional information is obtained and
as our operating environment changes. Our significant accounting policies are
discussed in Note 2 to our Consolidated Financial Statements included in Item 8
of this report. We have discussed the development and selection of our critical
accounting policies and related disclosures with the Audit Committee of the
Board of Directors and have identified the following critical accounting
policies for the current fiscal year.
Principles
of Consolidation
We
consolidate entities when we have the ability to control the operating and
financial decisions and policies of that entity and record the portion we do not
own as minority interest. The determination of our ability to control or exert
significant influence over an entity involves the use of judgment. We apply the
equity method of accounting where we can exert significant influence over, but
do not control, the policies and decisions of an entity. We use the cost method
of accounting where we are unable to exert significant influence over the
entity.
10
Capitalized
Development Costs
We
capitalize certain third party legal, professional, and other miscellaneous fees
directly related to the procurement, evaluation and establishment of contracts
for development projects. Development costs are recorded on the cost basis and
are amortized over the estimated economic term of the contract. We review each
project on a quarterly basis to assess whether any changes to our estimates are
appropriate. If accumulated costs of a specific project exceed the net
realizable value of such project or the project is abandoned, the costs are
charged to earnings.
Goodwill,
Other Intangible, and Other Long Lived Assets
In
connection with our acquisition of the Colorado Grande casino on April 25, 2005,
and the acquisition of the Washington casinos on May 12, 2009, we have goodwill
and identifiable intangible assets of $15.3 million, net of
amortization. Goodwill represents a significant portion of our total
assets. We review goodwill for impairment annually and or more frequently if
certain impairment indicators arise under the provisions of authoritative
guidance. We review goodwill at the reporting level unit, which is one level
below an operating segment. We review the carrying value of the net assets of
each reporting unit to the estimated fair value of the reporting unit,
based upon a multiple of estimated earnings. If the carrying value exceeds the
estimated fair value of the reporting unit, an impairment indicator exists and
an estimate of the impairment loss is calculated. The fair value calculation
includes multiple assumptions and estimates, including the projected cash flows
and discount rates applied. Changes in these assumptions and estimates could
result in goodwill impairment that could materially adversely impact our
financial position or results of operations. All of our goodwill is attributable
to reporting units within our gaming segment.
We use
earnings before interest, taxes, depreciation, and amortization (“EBITDA”) as the measure for
future earnings in our impairment test. Management estimates future
EBITDA based primarily on its projections of future revenues. We utilized
comparable industry average multiples of EBITDA rates based on industry
standards ranging from 5.5 to 7.5 times EBITDA when we estimated fair values of
our casinos as of April 30, 2010.
During
the 2010 fiscal there were significant declines in the U.S. economies and in the
casino industry overall, which led to declines in our revenues, margins and cash
flows. Our sales and profitability declined throughout the
year. We considered the impact of these significant adverse changes
in the economic and business climate as we performed our annual impairment
assessment of goodwill as of April 30, 2010. The estimated fair
values of our reporting unit were negatively impacted by significant reductions
in estimated cash flows for the income approach.
Our
goodwill impairment analysis led us to conclude that there was a significant
impairment of goodwill for the Colorado Grande and, accordingly, we recorded a
non-cash charge of $2.8 million to our operating results for the year ended
April 30, 2010, for the impairment of our goodwill. This $2.8 million
expense is included in the “Impairment of Assets” expense on the Consolidated
Statements of Operations. This impairment charge did not
have an impact on our liquidity; however it was a reflection of the overall
downturn in our industry and decline in our projected cash flows.
Long-lived
assets, including property, plant and equipment and amortizable intangible
assets, also comprise a significant portion of our total assets. We evaluate the
carrying value of long-lived assets when impairment indicators are present or
when circumstances indicate that impairment may exist under authoritative
guidance. When management believes impairment indicators may exist, projections
of the undiscounted future cash flows associated with the use of and eventual
disposition of long-lived assets held for use are prepared. If the projections
indicate that the carrying values of the long-lived assets are not recoverable,
we reduce the carrying values to fair value. For long-lived assets held for
sale, we compare the carrying values to an estimate of fair value less selling
costs to determine potential impairment. We test for impairment of long-lived
assets at the lowest level for which cash flows are measurable. These impairment
tests are heavily influenced by assumptions and estimates that are subject to
change as additional information becomes available.
Asset
and Investment Impairments
We
evaluate an asset or investment for impairment when events or circumstances
indicate that its carrying value may not be recovered. These events include
market declines that are believed to be other than temporary, changes in the
manner in which we intend to use a long-lived asset, decisions to sell an asset
or investment and adverse changes in the legal or business environment such as
adverse actions by regulators. When an event occurs, we evaluate the
recoverability of our carrying value based on either (i) the long-lived
asset’s ability to generate future cash flows on an undiscounted basis or
(ii) the fair value of our investment in unconsolidated affiliates. If an
impairment is indicated or if we decide to exit or sell a long-lived asset or
group of assets, we adjust the carrying value of these assets downward, if
necessary, to their estimated fair value, less costs to sell. Our fair value
estimates are generally based on market data obtained through the sales process
or an analysis of expected discounted cash flows. The magnitude of any
impairments are impacted by a number of factors, including the nature of the
assets to be sold and our established time frame for completing the sales, among
other factors. We also reclassify the asset or assets as either held-for-sale or
as discontinued operations, depending on, among other criteria, whether we will
have any continuing involvement in the cash flows of those assets after they are
sold.
11
Allowance
for Doubtful Accounts
We
establish provisions for losses on accounts and notes receivable if we determine
that we will not collect all or part of the outstanding balance. We regularly
review collectibility and establish or adjust our allowance as necessary using
the specific identification method. We make advances to third parties under
executed promissory notes for project costs related to the development of gaming
and entertainment properties. Due diligence is conducted by our management with
the assistance of legal counsel prior to entering into arrangements with third
parties to provide financing in connection with their efforts to secure and
develop the properties. Repayment terms are largely dependent upon the operating
performance of each opportunity for which the funds have been loaned. Interest
income is not accrued until it is reasonably assured that the project will be
completed and that there will be sufficient profits from the facility to cover
the interest to be earned under the respective note. If projected cash flows are
not sufficient to recover amounts due, the note is evaluated to determine the
appropriate discount to be recorded on the note for it to be considered a
performing note. If the note is performing, interest is recorded using the
effective interest method based on the value of the discounted note balance. See
Note 5 to our Consolidated Financial Statements.
We review
on a quarterly basis each of our notes receivable to evaluate whether the
collection of such note receivable is still probable. In our analysis, we review
the economic feasibility and the current financial, legislative and development
status of the project. If our analysis indicates that the project is no longer
economically feasible then the note receivable would be written down to its
estimated fair value. Based on this policy, we established a $1.6
million valuation allowance as of April 30, 2010 in regards to the receivable
due from the Gillman Group.
Revenue
Recognition
We record
revenues from casino operations, management fees, and interest on notes
receivable on the accrual basis as earned. The dates on which payments are
collected may vary depending upon the term of the contracts or note receivable
agreements. Interest income related to notes receivable is recorded when earned
and its collectibility is reasonably certain.
The
retail value of food and beverage and other services furnished to guests without
charge is included in gross revenue and deducted as promotional allowances. Net
revenues do not include the retail amount of food, beverage and other items
provided gratuitously to customers. We record the redemption of coupons and
points for cash as a reduction of revenue. These amounts are included in
promotional allowances in the accompanying consolidated statements of
operations. The estimated cost of providing such complimentary services that is
included in casino expense in the accompanying consolidated statements of
operations was as follows:
|
Fiscal
Year Ended
|
||||||||
|
April
30, 2010
|
April
30, 2009
|
|||||||
|
Food
and beverage
|
$ | 1,120,638 | $ | 595,499 | ||||
|
Other
|
13,601 | 5,994 | ||||||
|
Total
cost of complimentary services
|
$ | 1,134,239 | $ | 601,493 | ||||
Accrued
Jackpot Liability
We accrue
jackpot liability as games are played under a matching concept of
coin-in. As of April 30, 2010, we also maintain approximately
$267,000 in Player Supported Jackpot accrued liability, which are progressive
games that customers fund and when a jackpot is hit it is paid from reserved
funds.
Income
Taxes
Income
taxes are accounted using an asset and liability approach for financial
accounting and reporting for income taxes. Under this approach, deferred tax
assets and liabilities are recognized based on anticipated future tax
consequences, using currently enacted tax laws, attributable to differences
between financial statement carrying amounts of assets and liabilities and their
respective tax basis. We record current income taxes based on our current
taxable income, and we provide for deferred income taxes to reflect estimated
future tax payments and receipts. We account for tax credits under the
flow-through method, which reduces the provision for income taxes in the year
the tax credits first become available. Deferred tax assets are reduced by a
valuation allowance when, based on our estimates, it is more likely than not
that a portion of those assets will not be realized in a future period. The
estimates utilized in recognition of deferred tax assets are subject to
revision, either up or down, in future periods based on new facts or
circumstances.
12
Accrued
Litigation Liability
We assess
our exposure to loss contingencies including legal matters. If the
potential loss is justified to be probable and estimable, we will provide for
the exposure. If the actual loss from a contingency differs from management’s
estimate, operating results could be impacted. As of April 30, 2010, we did not
record any accrued litigation liability.
Share-Based
Compensation
Under ASC
Topic 718, “Compensation - Stock
Compensation”,
the fair value and compensation expense of each option award is estimated as of
the date of grant using a Black-Scholes option pricing formula. Expected
volatility is based on historical volatility of our stock over a preceding
period commensurate with the expected term of the option. The expected
volatility considers factors such as the volatility of our share price. The
risk-free rate for the expected term of the option is based on the
U.S. Treasury yield curve in effect at the time of grant. Expected dividend
yield was not considered in the option pricing formula since we historically
have not paid dividends and have no current plans to do so in the
future.
The
compensation cost related to these share-based awards is recognized over the
requisite service period. The requisite service period is generally the period
during which an employee is required to provide service in exchange for the
award.
Executive
Overview
We were
formed in 1977 and since 1994, have primarily been a gaming company involved in
financing, developing, owning and operating gaming projects. Our gaming facility
operations are located in the United States of America (“U.S.”), specifically in
the states of Colorado and Washington. On April 25, 2005, we acquired the
Colorado Grande Casino from IC-BH. On May 12, 2009, we acquired three
mini-casinos in Washington State. Our business strategy will continue
to focus on gaming projects with a continued emphasis on owning and operating
gaming establishments. If we are successful, both our future revenues and costs
and our profitability can be expected to increase. Our net revenues were $22.0
million and $5.9 million for fiscal years 2010 and 2009,
respectively.
We hold
investments in various development projects that we consolidate. Our net
ownership interest and capitalized development costs in development projects are
as follows (see Note 4 to the Consolidated Financial Statements):
|
Net Ownership Interest
|
Capitalized Development Costs
|
|||||||||||||||
|
Development Projects:
|
April 30,
2010
|
April 30,
2009
|
April 30,
2010
|
April 30,
2009
|
||||||||||||
|
(Percent)
|
||||||||||||||||
|
NG
Washington, LLC (1)
|
100 | 100 | $ | - | $ | 617,071 | ||||||||||
|
Nevada
Gold Speedway, LLC (2)
|
100 | - | 90,652 | - | ||||||||||||
|
NG
Washington II, LLC (3)
|
100 | - | 1,273,731 | - | ||||||||||||
|
Other
(4)
|
54,406 | 128,953 | ||||||||||||||
|
Total
investments– development projects
|
$ | 1,418,789 | $ | 746,024 | ||||||||||||
|
(1)
|
Refundable
deposits and license costs incurred for three mini-casinos in Washington
State; acquisition closed May 12,
2009.
|
|
(2)
|
Deposit
and acquisition costs related to management and technical services
contract for development of Las Vegas Speedway casino and
hotel
|
|
(3)
|
Refundable
deposits and license costs incurred for seven additional mini-casinos in
Washington State
|
|
(4)
|
Development
costs incurred for other development
projects.
|
13
Consolidated
Results of Operations
The
following table sets forth our consolidated results of operations for the fiscal
years ended April 30, 2010, and April 30, 2009:
|
Fiscal
Years Ended
|
||||||||
|
April
30,
|
April
30,
|
|||||||
|
2010
|
2009
|
|||||||
|
Revenues:
|
||||||||
|
Casino
|
$ | 18,822,900 | $ | 5,356,885 | ||||
|
Food
and beverage
|
4,534,744 | 1,395,130 | ||||||
|
Other
|
865,264 | 49,366 | ||||||
|
Management
fees
|
620,968 | 493,382 | ||||||
|
Gross
revenues
|
24,843,876 | 7,294,763 | ||||||
|
Less
promotional allowances
|
(2,817,888 | ) | (1,426,511 | ) | ||||
|
Net
revenues
|
22,025,988 | 5,868,252 | ||||||
|
Operating
expenses:
|
||||||||
|
Casino
|
8,562,284 | 1,750,014 | ||||||
|
Food
and beverage
|
2,851,635 | 614,779 | ||||||
|
Marketing
and administrative
|
5,564,288 | 2,485,881 | ||||||
|
Facility
|
1,070,933 | 362,009 | ||||||
|
Corporate
expense
|
4,216,475 | 4,366,670 | ||||||
|
Legal
expenses
|
241,468 | 403,694 | ||||||
|
Depreciation
and amortization
|
1,344,323 | 627,618 | ||||||
|
Impairment
of assets
|
4,347,183 | - | ||||||
|
Write-off
of project development cost
|
50,486 | 1,215,383 | ||||||
|
Other
|
476,395 | 145,018 | ||||||
|
Total
operating expenses
|
28,725,470 | 11,971,066 | ||||||
|
Operating
loss
|
(6,699,482 | ) | (6,102,814 | ) | ||||
|
Non-operating
income (expenses):
|
||||||||
|
Loss
from unconsolidated affiliates
|
- | (7,863 | ) | |||||
|
Gain
on sale of equity investees and assets
|
16,511 | 403,388 | ||||||
|
Interest
income
|
192,708 | 975,490 | ||||||
|
Interest
expense
|
(866,034 | ) | (1,307,296 | ) | ||||
|
Amortization
of loan issue costs
|
(58,972 | ) | (128,266 | ) | ||||
|
Loss
on extinguishment of debt
|
(128,834 | ) | - | |||||
|
Loss
before income tax benefit
|
(7,544,103 | ) | (6,167,361 | ) | ||||
|
Income
tax (benefit) expense
|
||||||||
|
Current
|
(1,546,698 | ) | (2,265,155 | ) | ||||
|
Deferred
and change in valuation allowance
|
(1,248,623 | ) | 285,930 | |||||
|
Total
income tax benefit
|
(2,795,321 | ) | (1,979,225 | ) | ||||
|
Net
loss
|
$ | (4,748,782 | ) | $ | (4,188,136 | ) | ||
|
Per
share information:
|
||||||||
|
Net
loss per common share - basic
|
$ | (0.37 | ) | $ | (0.32 | ) | ||
|
Net
loss per common share - diluted
|
$ | (0.37 | ) | $ | (0.32 | ) | ||
|
Basic
weighted average number of shares outstanding
|
12,878,240 | 12,939,130 | ||||||
|
Diluted
weighted average number of shares outstanding
|
12,878,240 | 12,939,130 | ||||||
14
Comparison of Fiscal
Years Ended April 30, 2010 and April 30, 2009
Net revenues. Net revenues for
fiscal year 2010 increased 275.3%, or $16.2 million, to $22.0 million compared
to fiscal year 2009. Net Casino revenues increased $13.5 million due to the
addition of three mini-casinos in Washington State, the addition of table games
at the Colorado Grande as a result of the passage of a bet limit initiative
which allows $100 bet limits and twenty four hour gaming in Colorado as of July
2, 2009. Food and beverage revenues increased $3.1 million due to the
addition of three restaurants in Washington and an additional kiosk restaurant
in the Colorado Grande’s new table games area. Other revenues
increased $0.8 million mainly due to the addition of Pull Tab revenue in
Washington. This was offset by a $1.4 million increase in promotional
allowances due to the additional casino operations.
Total operating expenses.
Total operating expenses for fiscal year 2010 increased 140.0%, or $16.8
million, to $28.8 million compared to fiscal year 2009. Operating
expenses, excluding write-offs and impairments, increased $13.6 million due to
the addition of three casinos in Washington State. Operating expenses
specifically related to the casinos increased $6.8 million compared to
2009, food and beverage expenses increased $2.2 million, marketing
and administrative increased $3.1 million in tandem with the increase in
revenue, and facility operations expenses increased $0.7 million compared to
2009 as a result of the additional three casinos and central office in
Washington State. We also saw an increase in depreciation and
amortization expense of $0.7 million directly related to a $0.7 million
annualized amortization of intangible assets from the Washington
purchase. We experienced a $0.2 million decrease or 3% less
corporate expense primarily due to a decrease of audit
expenses. Legal expenses for fiscal year 2010 decreased 40%, or $0.2
million, to $0.2 million compared to fiscal year 2009. The decrease is primarily
due to an effort to prepare legal documents internally and a reduction in
litigation activity. The remaining $3.2 million increase in operating
expenses is due to the impairment of the Colorado Grande goodwill of $2.75
million, a valuation allowance of $1.6 million against the Route 66 settlement
receivable, and a $51,000 write off of our remaining unamortized investment in
SunCruz compared to a write off of $1.2 million of our investment in Vicksburg
Horizon Casino in 2009.
Earnings from unconsolidated
affiliates. Earnings from unconsolidated affiliates for fiscal year 2010
were $0 compared to a loss of $8,000 in 2009. As a result of the sale
of our interest in BVD in December 2008, we are no longer recording earnings
from unconsolidated affiliates.
Interest income, interest expense,
and amortization of loan issue costs. Interest expense, net consists of a
net balance of interest expense, loss on extinguishment of debt, and
amortization of loan issue cost, offset by interest income. Interest expense for
fiscal year 2010 decreased 33.8%, or $0.4 million, to $0.9 million compared to
fiscal year 2009. The decrease is primarily due to the repayment of
approximately $9.6 million of debt during fiscal 2009, despite having added $4.0
million of debt in fiscal 2010 which is at a more favorable interest rate.
Interest income for fiscal year 2010 decreased 80.2%, or $0.8 million, to $0.2
million compared to fiscal year 2009. The decrease is primarily due to the sale
of the BVR note of $14.8 million and due to the low interest rates of return on
the monies in the Project Fund. We recorded a loss on extinguishment of debt of
$129,000 related to the new note with our senior lender. Amortization
of loan issue cost was $59,000 and $128,000 for fiscal years 2010 and 2009,
respectively.
Other non-operating income and
expenses. During fiscal year 2009, we recorded a $0.4 million gain
related to the sale of our development and loan agreement with
BVR. We had no significant gains or losses in 2010.
Net (loss) income. Fiscal year
2010 reflects a net loss of $4.8 million compared to a net loss of $4.2 million
for fiscal year 2009. The increase of $0.6 million is primarily related to the
$16.8 million increase in operating expenses offset by increased net revenues of
$16.2 million, increased net interest expense of $0.3 million, the recording of
a $0.4 million gain on sale of equity investments in 2009, offset by recording a
$2.8 million tax benefit in 2010 compared to $2.0 million in
2009. The effective tax rate for fiscal years 2010 and 2009 was
(37.1%) and (32.1%), respectively.
Liquidity
and Capital Resources
Historical
Cash Flows
The
following table sets forth our consolidated net cash provided by (used in)
operating, investing and financing activities for fiscal years 2010 and
2009:
15
|
Fiscal
Years Ended
|
||||||||
|
April
30,
|
April
30,
|
|||||||
|
2010
|
2009
|
|||||||
|
Cash
provided by (used in):
|
||||||||
|
Operating
activities
|
$ | 985,493 | $ | (5,507,059 | ) | |||
|
Investing
activities
|
$ | (11,318,508 | ) | $ | 27,507,309 | |||
|
Financing
activities
|
$ | (345,793 | ) | $ | (9,562,019 | ) | ||
Operating activities. Net cash provided by
(used in) operating activities during fiscal year 2010 improved $6.5
million compared to fiscal year 2009 primarily due to operating income for
the Colorado Grande improved by $0.2 million, while addition of the Washington
casinos contributed operating income of $1.2 million. The Corporate
office, excluding non-cash stock option expense, improved by $0.7 million
compared to fiscal 2009. The net change of receivables and other
assets and accrued liabilities of $3.9 million, which includes a $1.7 million
income tax refund received in December 2009, compared to a $3.6 million income
tax payment in fiscal year 2009. These improvements were offset by
increased net loss of $0.5 million mainly attributable to non-cash adjustments
including a $4.3 million impairment of assets, an increase of stock option
expense of $0.4 million, and recording a $2.8 million tax benefit compared to a
$2.0 million tax benefit in fiscal year 2009.
Investing activities. Net cash
provided by (used in) investing activities during fiscal year
2010 increased to $11.3 million compared to $27.5 million provided during
fiscal year 2009. The $38.8 million change is primarily due to the $11.1 million
net cash purchase of the Washington casinos, $0.6 million investment in the
Colorado Grande expansion, a release of restricted cash of $0.7 million compared
to the release of restricted cash of $7.0 million in 2009, and collection of
notes receivable of $4.6 million and proceeds from the sale of our interest in
BVR of $16 million.
Financing activities. Net cash used in financing
activities was $0.3 million for fiscal year 2010 compared to $9.5 million net
cash used in financing activities for fiscal year 2009. During fiscal year 2009,
we repaid a net $9.6 million of our term loan compared to no significant debt
repayments in 2010. In addition, during fiscal year 2010 we acquired
treasury stock at a cost of $0.2 million, and paid $0.2 million in loan issuance
costs.
Future
Sources and Uses of Cash
We expect
that our future liquidity and capital requirements will be affected
by:
- capital
requirements related to future acquisitions;
- cash
flow from acquisitions;
-
management contracts;
- working
capital requirements;
-
obtaining funds via long-term debt instruments;
- debt
service requirements; and
-
disposition of non-gaming related assets.
At April
30, 2010, outstanding indebtedness was $10.0 million, of which $4.0 million is
due May 2012 and the remaining $6.0 million is due June 2013. In addition to
cash flow expected to be generated from the Colorado Grande Casino, we
anticipate the recently acquired mini-casinos in Washington State, existing
management contracts and the anticipated acquisition of additional mini-casinos
in Washington will generate sufficient cash flows.
On
December 15, 2008 the Company received $16 million in cash for our 40% ownership
of BVD. The cash and a $4 million receivable due no later than two
years after the gaming/entertainment facility opens, paid in full the $14.8
million note receivable and accrued interest.
We are in
the process of listing the 265 acres in Black Hawk, CO with a real estate
broker. If the acreage is sold we will use the proceeds to pay operating
expenses or debt or, reinvest the funds into acquisition
opportunities.
On April
30, 2010, excluding restricted cash of $5.3 million, we had cash and cash
equivalents of $3.2 million. The restricted cash consists of the $5.0 million
Project Fund referred to above and $0.3 million of player supported jackpots
(PSJ).
Our
Consolidated Financial Statements have been prepared assuming that we will have
adequate availability of cash resources to satisfy our liabilities in the normal
course of business. We have made, and are in the process of making, arrangements
to ensure that we have sufficient working capital to fund our obligations as
they come due. These potential funding transactions include divesting of
non-core assets and obtaining long-term financing. We believe that some or all
of these sources of funds will be funded in a timely manner and will provide
sufficient working capital for us to meet our obligations as they come due;
however, there can be no assurance that we will be successful in divesting of
the non-core assets or achieving the desired level of working capital at terms
that are favorable to us. Should cash resources not be sufficient to meet our
current obligations as they come due, repay or refinance our long-term debt and,
acquire operations that generate positive cash flow, we would be required to
curtail our activities and grow at a pace that cash resources could support
which may require a restructuring of our debt or selling core assets of the
Company.
16
Indebtedness
Effective
July 7, 2009, we entered into a $6.0 million promissory note with our senior
lender that replaced the $15.6 million loan agreement with the same lender. The
principal bears interest at 10.0% per annum through June 30, 2010 then increases
to 11% until the maturity date of June 30, 2013. The loan is secured by specific
assets of the Company. As of April 30, 2010, we had $6.0 million in outstanding
debt under the promissory note. In May 2009, with the
acquisition of the Washington mini-casinos, we added $4.0 million in
debt. The principal bears interest at 7% per annum, is paid
quarterly, and has a maturity date of May 12, 2012. The Company’s
total indebtedness at April 30, 2010 is $10 million.
Off-Balance
Sheet Arrangements
None.
Contractual
Obligations
The
following table sets forth estimates of our contractual obligations as of April
30, 2010 to make future payments in fiscal year 2011 through fiscal year 2015
and thereafter:
|
Fiscal
Year
|
||||||||||||||||||||||||||||
|
Estimated
Contractual Obligations:
|
Total
|
2011
|
2012
|
2013
|
2014
|
2015
|
Thereafter
|
|||||||||||||||||||||
|
Long-term
debt (1)
|
$ | 10,000,000 | $ | — | $ | — | $ | 4,000,000 | $ | 6,000,000 | $ | — | $ | — | ||||||||||||||
|
Estimated
interest payments (2)
|
2,648,280 | 930,000 | 940,000 | 668,280 | 110,000 | — | — | |||||||||||||||||||||
|
Operating
lease commitments (3)
|
9,431,986 | 715,986 | 416,000 | 400,000 | 400,000 | 400,000 | 7,100,000 | |||||||||||||||||||||
|
Total
|
$ | 22,080,266 | $ | 1,645,986 | $ | 1,356,000 | $ | 5,068,280 | $ | 6,510,000 | $ | 400,000 | $ | 7,100,000 | ||||||||||||||
|
(1)
|
See
Note 6 to our Consolidated Financial Statements in this Annual
Report.
|
|
(2)
|
Estimated
interest payments are based on the outstanding balance of our debt as of
April 30, 2010.
|
|
(3)
|
See
Note 15 to our Consolidated Financial Statement in this Annual
Report.
|
New
Accounting Pronouncements Issued
As of
April 30, 2010, there are several new accounting standards and interpretations
effective. Below is a discussion of significant standards that may impact
us.
The Hierarchy of General Accepted
Accounting Principles and The FASB Accounting Standard
Codification and the Hierarchy of Generally Accepted Accounting Principles
– replacement of FASB Statement No. 162
In the
current fiscal year,
Financial Accounting Standards Board (“FASB”) finalized the “FASB Accounting Standards
Codification” (“Codification” or “ASC”), which is effective for periods
ending on or after September 15, 2009. Accordingly, we have
implemented the ASC structure required by the FASB and any references to
guidance issued by the FASB in these footnotes are to the ASC, in addition to
other forms of standards. The ASC does not change how we account for
our transactions or the nature of the related disclosures made.
Noncontrolling
Interests in Consolidated Financial Statements
In
December 2007, FASB issued SFAS No. 160, “Noncontrolling Interests in
Consolidated Financial Statements – an amendment of ARB No. 51”, which is
now codified under ASC Topic 810 (“ASC 810”). ASC 810 establishes
accounting and reporting standards with respect to the disclosure of a
noncontrolling ownership interest in the statement of financial position within
equity, the presentation of the share of consolidated net income attributable to
the parent and noncontrolling interest on the consolidated statement of income,
the accounting treatment of changes in a parent’s ownership interest while the
parent retains a controlling interest and the accounting for the deconsolidation
of a subsidiary. ASC 810 is effective for fiscal years, and interim
periods within those fiscal years, beginning on or after December 15,
2008. The Company currently has no noncontrolling ownership interests
in consolidated subsidiaries and therefore is not impacted by ASC
810.
17
Disclosures
About Derivative Instruments and Hedging Activities
In March 2008, the FASB issued SFAS No.
161, "Disclosures About
Derivative Instruments and Hedging Activities - an amendment of FASB
Statement No. 133" ("SFAS
No. 161"), which is now codified under ASC Topic 815 (“ASC 815”) expands the
disclosure requirements regarding an entity's derivative instruments and hedging
activities, and is effective for the Company's fiscal year beginning May 1,
2009. ASC 815 relates specifically to disclosures, and does not have a material
impact on the Company's consolidated financial statements.
Principles
of Consolidation
We
consolidate entities when we have the ability to control the operating and
financial decisions and policies of that entity and record the portion we do not
own as minority interest. The determination of our ability to control or exert
significant influence over an entity involves the use of judgment. We apply the
equity method of accounting where we can exert significant influence over, but
do not control, the policies and decisions of an entity. We use the cost method
of accounting where we are unable to exert significant influence over the
entity.
Consolidations
In
December 2009, the FASB issued Accounting Standards Update (“ASU”) 2009-17, “Consolidations (Topic 810) —
Improvements to Financial Reporting by Enterprises Involved with Variable
Interest Entities,” which codified the previously issued Statement of
Financial Accounting Standards (“SFAS”) No. 167, “Amendments to FASB
Interpretation No. 46R.” ASU 2009-17 changes the consolidation analysis for
variable interest entities (“VIEs”) and requires a qualitative analysis to
determine the primary beneficiary of the VIE. The determination of
the primary beneficiary of a VIE is based on whether the entity has the power to
direct matters which most significantly impact the activities of the VIE and has
the obligation to absorb losses, or the right to receive benefits, of the VIE
which could potentially be significant to the VIE. The ASU requires
an ongoing reconsideration of the primary beneficiary and also amends the events
triggering a reassessment of whether an entity is a VIE. ASU 2009-17
requires additional disclosures for VIEs, including disclosures about a
reporting entity’s involvement with VIEs, how a reporting entity’s involvement
with a VIE affects the reporting entity’s financial statements, and significant
judgments and assumptions made by the reporting entity to determine whether it
must consolidate the VIE. ASU 2009-17 is effective for us beginning
May 1, 2010. Our adoption of ASU 2009-17 will not have a material effect on our
financial statements.
Subsequent
Events
In May
2009, the FASB issued SFAS No. 165, “Subsequent Events” which is
codified in FASB ASC 855, “Subsequent Events” (“ASC 855”). ASC 855
establishes general standards of accounting for and disclosure of events that
occur after the balance sheet date but before financial statements are issued or
are available to be issued. We adopted ASC 855 in the second quarter
of fiscal 2010 and evaluated all events or transactions through the date of this
filing.
Business
Combinations
In
December 2007, the FASB issued SFAS No. 141 (revised 2007), “Business Combinations”, which
is codified in ASC 805. ASC 805 establishes principles and
requirements to recognize the assets acquired and liabilities assumed in an
acquisition transaction and determines what information to disclose to investors
regarding the business combination. ASC 805 is effective for business
combinations for which the acquisition date is on or after the beginning of the
first annual period beginning after December 15, 2008.
|
Item 7A.
|
Quantitative and Qualitative
Disclosures About Market
Risk
|
Market
risk is the risk of loss arising from adverse changes in market rates and
prices, including interest rates, foreign currency exchange rates, credit risk,
commodity price and equity prices. Our primary exposure to market risk is credit
risk concentrations. We do not believe we are subject to material interest
risk.
All of
our borrowings are at fixed interest rates; thus an interest rate change
would not have a significant impact on our operations.
|
Item
8.
|
Financial
Statements and Supplementary Data
|
The
information required under Item 310(a) of Regulation S-K is included in this
report as set forth in the “Index to Consolidated Financial Statements.” See
Index to Consolidated Financial Statements.
|
Item 9.
|
Changes in and Disagreements
with Accountants on Accounting and Financial
Disclosure
|
None.
18
|
Item 9A.
|
Controls and
Procedures
|
(a)
Disclosure Controls and
Procedures.
We
maintain disclosure controls and procedures that are designed to provide
reasonable assurance that information required to be disclosed by us in the
reports that we file or submit to the Securities and Exchange Commission (“SEC”)
under the Securities Exchange Act of 1934, as amended (the “Exchange Act”), is
recorded, processed, summarized and reported within the time periods specified
by the SEC’s rules and forms, and that information is accumulated and
communicated to our management, including our Chief Executive Officer
(“CEO”) and Chief Financial Officer (“CFO”), as
appropriate to allow timely decisions regarding required
disclosure.
In
accordance with Exchange Act Rules 13a-15 and 15d-15, we carried out an
evaluation, under the supervision and with the participation of management,
including our CEO and CFO, of the effectiveness of our disclosure controls and
procedures as of the end of the period covered by this report. As
described below under Management’s Annual Report on Internal Control over
Financial Reporting, our CEO and CFO have concluded that, as of the end of the
period covered by this Annual Report on Form 10-K, the Company’s disclosure
controls and procedures were effective to provide reasonable assurance that
information required to be disclosed in our reports filed or submitted under the
Exchange Act is recorded, processed, summarized and reported within the time
periods specified in the SEC’s rules and forms.
(b) Management’s
Annual Report on Internal Control over Financial Reporting.
Management
of the Company is responsible for establishing and maintaining adequate internal
control over financial reporting as defined in Rules 13a-15(f) and
15d-15(f) under the Exchange Act, as amended. The Company’s internal control
over financial reporting is designed to provide reasonable assurance regarding
the reliability of financial reporting and the preparation of financial
statements for external purposes in accordance with generally accepted
accounting principles. The Company’s internal control over financial reporting
includes those policies and procedures that:
|
|
1.
|
Pertain
to the maintenance of records that, in reasonable detail, accurately and
fairly reflect the transactions and dispositions of the assets of the
Company;
|
|
|
2.
|
provide
reasonable assurance that transactions are recorded as necessary to permit
preparation of financial statements in accordance with generally accepted
accounting principles, and that receipts and expenditures of the Company
are being made only in accordance with authorizations of management and
directors of the Company; and
|
|
|
3.
|
provide
reasonable assurance regarding prevention or timely detection of
unauthorized acquisition, use, or disposition of the Company’s assets that
could have a material effect on the financial
statements.
|
Because
of the inherent limitations, internal control over financial reporting may not
prevent or detect misstatements. Also, projections of any evaluation of
effectiveness to future periods are subject to the risk that controls may become
inadequate because of changes in conditions, or that the degree of compliance
with the policies or procedures may deteriorate.
Management
assessed the effectiveness of the Company’s internal control over financial
reporting as of April 30, 2010. In making this assessment, management
used the criteria set forth by the Committee of Sponsoring Organizations of the
Treadway Commission in
Internal Control-Integrated Framework. Management has
concluded that the internal control over financial reporting was effective as of
April 30, 2010.
(c) Changes in Internal Control Over
Financial Reporting.
There
were no changes in our internal control over financial reporting during fiscal
2010 that have materially affected, or are reasonably likely to materially
affect, our internal control over financial reporting.
(d)
Report of
Independent Registered Public Accounting Firm.
This
annual report does not include an attestations report of the Company’s
independent registered public accounting firm regarding internal control over
financial reporting. Management’s report was not subject to
attestation by the Company’s registered public accounting firm pursuant to the
temporary rules of the SEC that permit the Company to provide only Management’s
report in this annual report.
19
|
Item
9B.
|
Other
Information
|
None.
Part
III
|
Item
10.
|
Directors,
Executive Officers and Corporate
Governance
|
We have
adopted a Code of Ethics that applies to directors, officers and employees,
including our principal executive officer, principal financial officer and
principal accounting officer. Our Code of Ethics is posted on our website at
http://www.nevadagold.com,
under Investor Relations - Investor Info. Changes to and waivers granted with
respect to this Code of Ethics related to our officers, other executive officers
and directors are required to be disclosed pursuant to applicable rules and
regulations of the SEC will also be posted on our website and a Current Report
on Form 8-K will be filed within 4 business days of the change or
waiver.
The other
information required by this item is incorporated by reference to our definitive
proxy statement for our 2010 Annual Meeting to be filed with the SEC pursuant to
Regulation 14A within 120 days after the end of the fiscal year covered by this
report.
|
Item
11.
|
Executive
Compensation
|
The
information required by this item is incorporated by reference to our definitive
proxy statement for our 2010 Annual Meeting to be filed with the SEC pursuant to
Regulation 14A within 120 days after the end of the fiscal year covered by this
report.
|
Item 12.
|
Security Ownership of Certain
Beneficial Owners and Management and Related Stockholder
Matters
|
The
information required by this item is incorporated by reference to our definitive
proxy statement for our 2010 Annual Meeting to be filed with the SEC pursuant to
Regulation 14A within 120 days after the end of the fiscal year covered by this
report.
|
Item
13.
|
Certain
Relationships and Related Party Transactions and Director
Independence
|
The
information required by this item is incorporated by reference to our definitive
proxy statement for our 2010 Annual Meeting to be filed with the SEC pursuant to
Regulation 14A within 120 days after the end of the fiscal year covered by this
report.
|
Item 14.
|
Principal Accountant Fees and
Services
|
The
information required by this item is incorporated by reference to our definitive
proxy statement for our 2010 Annual Meeting to be filed with the Securities and
Exchange Commission pursuant to Regulation 14A within 120 days after the end of
the fiscal year covered by this report.
Part
IV
|
Item 15.
|
Exhibits, Financial Statement
Schedules
|
(a) 1.
Financial Statements.
Included
in Part II of this Report:
Consolidated
Financial Statements of Nevada Gold & Casinos, Inc.
Report of
Independent Registered Public Accounting Firm
Consolidated
Balance Sheets as of April 30, 2010 and April 30, 2009
Consolidated
Statements of Operations for fiscal years ended April 30, 2010 and April 30,
2009
Consolidated
Statements of Stockholders’ Equity for fiscal years ended April 30, 2010 and
April 30, 2009
Consolidated
Statements of Cash Flows for fiscal years ended April 30, 2010 and April 30,
2009
Notes to
Consolidated Financial Statements
(a) 2.
Financial Statement Schedules.
We have
omitted all schedules because they are not required or are not applicable, or
the required information is shown in the consolidated financial statements or
notes to the consolidated financial statements.
20
|
(a)
|
3.
Exhibits
|
|
EXHIBIT
NUMBER
|
DESCRIPTION
|
|
|
3.1A
|
Amended
and Restated Articles of Incorporation of Nevada Gold & Casinos, Inc.
(filed previously as Exhibit A to the Company's definitive proxy statement
filed on Schedule 14A on July 30, 2001)
|
|
|
3.1B
|
Certificate
of Amendment to the Articles of Incorporation of Nevada Gold &
Casinos, Inc. (filed previously as Exhibit 4.2 to the Company’s Form S-8
filed October 11, 2002)
|
|
|
3.1C
|
Certificate
of Amendment to the Articles of Incorporation of Nevada Gold &
Casinos, Inc. (filed previously as Exhibit 3.3 to the Company’s Form 10-Q
filed November 9, 2004)
|
|
|
3.1D
|
Certificate
of Amendment to the Articles of Incorporation of Nevada Gold &
Casinos, Inc. (filed previously as Exhibit 3.1 to the Company’s Form 8-K
filed October 17, 2007)
|
|
|
3.2
|
Amended
and Restated Bylaws of Nevada Gold & Casinos, Inc. (filed previously
as Exhibit 3.2 to the Company’s From 10-QSB filed August 14,
2002)
|
|
|
3.3
|
Amended
and Restated Bylaws of Nevada Gold & Casinos, Inc., effective July 24,
2007 (filed previously as Exhibit 3.2 to the Company’s From 8-K filed July
27, 2007)
|
|
|
4.1
|
Common
Stock Certificate of Nevada Gold & Casinos, Inc. (filed previously as
Exhibit 4.1 to the Company’s Form S-8/A, file no.
333-79867)
|
|
|
4.2
|
Second
Amended and Restated Nevada Gold & Casinos, Inc. 1999 Stock Option
Plan (filed previously as Exhibit 4.6 to the Company’s Form S-8, file no.
333-126027)
|
|
|
4.3
|
Nevada
Gold & Casinos, Inc.’s 2009 Equity Incentive Plan (filed previously as
Exhibit 10.1 to the Company’s Form S-8, file no.
333-158576)
|
|
|
10.1
|
Stock
Purchase Agreement dated as of April 25, 2005 among Isle of Capri Black
Hawk, L.L.C., IC Holdings Colorado, Inc., Colorado Grande Enterprise,
Inc., and CGC Holdings, L.L.C. (filed previously as Exhibit 2.1 to the
Company’s Form 8-K filed April 29, 2005)
|
|
|
10.2
|
Purchase
Agreement dated November 25, 2009 between Nevada Gold BVR, LLC and B.V.
Oro, LLC (filed previously as Exhibit 10.1 to the Company’s Form 8-K filed
December 12, 2009)
|
|
|
10.3
|
Management
Agreement dated November 10, 2009 between Nevada Gold & Casinos, Inc.
and Oceans Casino Cruises, Inc. (filed previously as Exhibit 10.1 to the
Company’s Form 8-K filed November 12, 2009)
|
|
|
10.4
|
Settlement
Agreement and Release dated April 15, 2009 among Nevada Gold &
Casinos, Inc., American Heritage, Inc. and Frederick C. Gillmann (filed
previously as Exhibit 10.1 to the Company’s Form 8-K filed April 16,
2009)
|
|
|
10.5
|
Asset
Purchase Agreement dated March 12, 2010 among Crazy Moose Casino, Inc.,
Crazy Moose Casino II, Inc., Coyote Bob’s, Inc. and Gullwing III, LLC, as
sellers, and NG Washington, LLC, as purchaser (filed previously as Exhibit
10.1 to the Company’s Form 8-K filed March 13, 2010)
|
|
|
10.6
(**)
|
Amended
and Restated Credit Facility dated January 19, 2006 (portions of this
exhibit have been omitted and filed separately with the Securities and
Exchange Commission pursuant to a request for confidential treatment in
accordance with Rule 24b-2 under the Exchange Act) (filed previously as
Exhibit 10.15 to the Company's Form 8-K filed January 25,
2006)
|
|
|
10.7 (**)
|
Form
of Guarantee of Credit Facility among Nevada Gold and Casinos, Inc., each
of Black Hawk Gold, LTD, Gold River, LLC, Nevada Gold BVR, LLC, and Nevada
Gold NY, Inc., and the Lender signing as a party thereto (portions of this
exhibit have been omitted and filed separately with the Securities and
Exchange Commission pursuant to a request for confidential treatment in
accordance with Rule 24b-2 under the Exchange Act) (filed previously as
Exhibit 10.16 to the Company’s Form 10-Q filed March 3,
2006)
|
|
21
|
10.8 (**)
|
January
2006 Security Agreement dated January 19, 2006, by and between Nevada Gold
& Casinos, Inc., its wholly-owned subsidiary, Black Hawk Gold, Ltd.,
and the Lender listed as a party thereto (portions of this exhibit have
been omitted and filed separately with the Securities and Exchange
Commission pursuant to a request for confidential treatment in accordance
with Rule 24b-2 under the Exchange Act) (filed previously as Exhibit 10.17
to the Company’s Form 10-Q filed March 3, 2006)
|
|
|
Commercial
Pledge Agreement dated January 19, 2006, among Nevada Gold & Casinos,
Inc., Black Hawk Gold, LTD, and the Lender listed as a party thereto
(portions of this exhibit have been omitted and filed separately with the
Securities and Exchange Commission pursuant to a request for confidential
treatment in accordance with Rule 24b-2 under the Exchange Act) (filed
previously as Exhibit 10.18 to the Company’s Form 10-Q filed March 3,
2006)
|
||
|
10.10 (**)
|
Commercial
Pledge Agreement dated January 19, 2006, among Nevada Gold & Casinos,
Inc., Nevada Gold BVR, and the Lender listed as a party thereto (portions
of this exhibit have been omitted and filed separately with the Securities
and Exchange Commission pursuant to a request for confidential treatment
in accordance with Rule 24b-2 under the Exchange Act) (filed previously as
Exhibit 10.19 to the Company’s Form 10-Q filed March 3,
2006)
|
|
|
10.11 (**)
|
Commercial
Pledge Agreement dated January 19, 2006 among Nevada Gold & Casinos,
Inc., Gold River, LLC, and the Lender listed as a party thereto (portions
of this exhibit have been omitted and filed separately with the Securities
and Exchange Commission pursuant to a request for confidential treatment
in accordance with Rule 24b-2 under the Exchange Act) (filed previously as
Exhibit 10.20 to the Company’s Form 10-Q filed March 3, 2006)
|
|
|
10.12 (**)
|
Commercial
Pledge Agreement dated January 19, 2006, among Nevada Gold & Casinos,
Inc., Nevada Gold NY, Inc., and the Lender listed as a party thereto
(portions of this exhibit have been omitted and filed separately with the
Securities and Exchange Commission pursuant to a request for confidential
treatment in accordance with Rule 24b-2 under the Exchange Act) (filed
previously as Exhibit 10.21 to the Company’s Form 10-Q filed March 3,
2006)
|
|
|
10.13
|
Amendment
to the Amended and Restated Credit Facility dated January 19, 2006 among
Nevada Gold & Casinos, Inc., Black Hawk Gold, Ltd. and Louise H.
Rogers dated July 30, 2007 (filed previously as Exhibit 10.1 to the
Company’s Form 8-K filed July 30, 2007)
|
|
|
10.14
|
Amendment
to the Amended and Restated Credit Facility dated January 19, 2006 between
Nevada Gold & Casinos, Inc. and Louise H. Rogers dated October 12,
2007 (filed previously as Exhibit 10.1 to the Company’s Form 8-K filed
October 15, 2007)
|
|
|
10.15
|
Amendment
to the Amended and Restated Credit Facility dated January 19, 2006 between
Nevada Gold & Casinos, Inc. and Louise H. Rogers dated December 20,
2007 (filed previously as Exhibit 10.1 to the Company’s Form 8-K filed
December 21, 2007)
|
|
|
10.16
|
Agreement
Regarding Use of Proceeds of IC-BH Sale and Regarding Remaining Amount Due
Under the Amended and Restated Credit Facility among Nevada Gold &
Casinos, Inc., Black Hawk Gold, Ltd. and Louise H. Rogers dated November
13, 2007 (filed previously as Exhibit 10.1 to the Company’s Form 8-K filed
November 13, 2007)
|
|
|
10.17
|
Amendment
to the January 2006 Security Agreement among Nevada Gold & Casinos,
Inc., Black Hawk Gold, Ltd. and Louise H. Rogers dated November 13, 2007
(filed previously as Exhibit 10.2 to the Company’s Form 8-K filed November
13, 2007)
|
|
|
10.18
|
Agreement
Regarding Use of Proceeds from RCI/CCH Notes Receivable between Nevada
Gold & Casinos, Inc. and Louise H. Rogers dated November 13, 2007
(filed previously as Exhibit 10.3 to the Company’s Form 8-K filed November
13, 2007)
|
|
|
10.19
|
Promissory
Note issued by Nevada Gold & Casinos, Inc. to Louise H. Rogers dated
November 13, 2007 (filed previously as Exhibit 10.4 to the Company’s Form
8-K filed November 13, 2007)
|
|
|
10.20
|
Agreement
Regarding Loans effective March 1, 2009 between Nevada Gold & Casinos,
Inc. and Louise H. Rogers (filed previously as Exhibit 10.1 to the
Company’s Form 8-K filed June 17, 2009)
|
|
22
|
10.21
|
Amended
and Restated Security Agreement effective March 1, 2009 between Nevada
Gold & Casinos, Inc. and Louise H. Rogers (filed previously as Exhibit
10.2 to the Company’s Form 8-K filed June 17, 2009)
|
|
|
10.22
|
Schedule
of Collateral, Notes, Security Interests and Ownership Interests effective
March 1, 2009 between Nevada Gold & Casinos, Inc. and Louise H. Rogers
(filed previously as Exhibit 10.3 to the Company’s Form 8-K filed June 17,
2009)
|
|
|
10.23
|
Promissory
Note issued by Nevada Gold & Casinos, Inc. to Louise H. Rogers
effective March 1, 2009 (filed previously as Exhibit 10.4 to the Company’s
Form 8-K filed June 17, 2009)
|
|
|
July
2009 Amended and Restated Security Agreement among Nevada Gold &
Casinos, Inc., Gold Mountain Development, LLC, CGC Holdings, LLC, Colorado
Grande Enterprises, Inc., Nevada Gold BVR, LLC and Louise H. Rogers dated
July 7, 2009 (filed previously as Exhibit 10.1 to the Company’s Form 8-K
filed July 7, 2009)
|
||
|
10.25
|
Schedule
of Collateral, Notes, Security Interests and Ownership Interests dated
July 7, 2009 among Nevada Gold & Casinos, Inc., Gold Mountain
Development, LLC, CGC Holdings, LLC, Colorado Grande Enterprises, Inc.,
Nevada Gold BVR, LLC and Louise H. Rogers dated July 7, 2009 (filed
previously as Exhibit 10.2 to the Company’s Form 8-K filed July 7,
2009)
|
|
|
10.26
|
Collateral
Assignment of Notes, Contractual Rights, Security Interests, and Ownership
Interests dated July 7, 2009 among Nevada Gold & Casinos, Inc., Gold
Mountain Development, LLC, CGC Holdings, LLC, Colorado Grande Enterprises,
Inc., Nevada Gold BVR, LLC and Louise H. Rogers dated July 7, 2009 (filed
previously as Exhibit 10.3 to the Company’s Form 8-K filed July 7,
2009)
|
|
|
10.27
|
Promissory
Note issued by Nevada Gold & Casinos, Inc. to the senior lender dated
July 7, 2009 between Nevada Gold & Casinos, Inc. and Louise H. Rogers
dated July 7, 2009 (filed previously as Exhibit 10.4 to the Company’s Form
8-K filed July 7, 2009)
|
|
|
10.28
|
Loan
Guaranty Agreement dated July 7, 2009 among Nevada Gold & Casinos,
Inc., Gold Mountain Development, LLC, CGC Holdings, LLC, Colorado Grande
Enterprises, Inc., NG Washington, LLC, Nevada Gold BVR, LLC and Louise H.
Rogers dated July 7, 2009 (filed previously as Exhibit 10.5 to the
Company’s Form 8-K filed July 7, 2009)
|
|
|
10.29
(+)
|
Form
of Indemnification Agreement between Nevada Gold & Casinos, Inc. and
each officer and director (filed previously as Exhibit 10.5 to the
Company’s Form 10-QSB, filed February 14, 2002)
|
|
|
10.30A
(+)
|
Employment
Agreement dated November 27, 2006 by and between Robert B. Sturges and
Nevada Gold & Casinos, Inc. (filed previously as Exhibit 10.27 to the
Company’s Form 10-Q filed December 15, 2006)
|
|
|
10.30B (+)
|
Amendment
to the Employment Agreement dated August 30, 2007 by and between Robert B.
Sturges and Nevada Gold & Casinos, Inc. (filed previously as Exhibit
99.1 to the Company’s Form 8-K filed August 31, 2007)
|
|
|
10.30C (+)
|
Amendment
to the Employment Agreement dated October 30, 2007 by and between Robert
B. Sturges and Nevada Gold & Casinos, Inc. (filed previously as
Exhibit 99.1 to the Company’s Form 8-K filed October 30,
2007)
|
|
|
10.30D (+)
|
Second
Amendment to the Employment Agreement dated January 23, 2009 by and
between Robert B. Sturges and Nevada Gold & Casinos, Inc. (filed
previously as Exhibit 10.1 to the Company’s Form 8-K filed January 24,
2009)
|
|
|
10.31A (+)
|
Employment
Agreement dated October 24, 2006 by and between James J. Kohn and Nevada
Gold & Casinos, Inc. (filed previously as Exhibit 10.28 to the
Company’s Form 10-Q filed March 9, 2007)
|
|
|
10.31B(+)
|
First
Amendment to the Employment Agreement dated April 14, 2009 by and between
James J. Kohn and Nevada Gold & Casinos, Inc. (filed previously as
Exhibit 10.24B to the Company’s Form 10-Q filed September 9,
2009)
|
|
|
10.32A (+)
|
Employment
Agreement dated December 29, 2006 by and between Ernest E. East and Nevada
Gold & Casinos, Inc. (filed previously as Exhibit 10.28 to the
Company’s Form 10-Q filed March 9, 2007)
|
23
|
10.32B
(+)
|
First
Amendment to the Employment Agreement dated April 14, 2009 by and between
Ernest E. East and Nevada Gold & Casinos, Inc. (filed previously as
Exhibit 10.25B to the Company’s Form 10-Q filed September 9,
2009)
|
|
|
10.32C
(+)
|
Second
Amendment to Employment Agreement between Nevada Gold & Casinos, Inc.
and Ernest E. East dated June 8, 2010 (filed previously as Exhibit 10.1 to
the Company’s Form 8-K filed June 8, 2010)
|
|
|
10.33
|
Asset
Purchase Agreement dated April 14, 2010 between NG Washington II, LLC, as
buyer, and Grant Thornton, Ltd, as receiver for Big Nevada, Inc., Gameco,
Inc., Gaming Consultants, Inc., Gaming Management, Inc., Golden Nugget
Tukwila, Inc., Hollydrift Gaming, Inc., Little Nevada, Inc., Mill Creek
Gaming, Inc., Royal Casino Holdings, Inc., and Silver Dollar Mill Creek,
Inc. (filed previously as Exhibit 10.1 to the Company’s Form 8-K/A filed
April 23, 2010)
|
|
|
10.34
|
Amendment
to the Asset Purchase Agreement dated April 14, 2010 between NG Washington
II, LLC, as buyer, and Grant Thornton, Ltd, in its capacity as
court-appointed receiver for Big Nevada, Inc., Gameco, Inc., Gaming
Consultants, Inc., Gaming Management, Inc., Golden Nugget Tukwila, Inc.,
Hollydrift Gaming, Inc., Little Nevada, Inc., Mill Creek Gaming, Inc.,
Royal Casino Holdings, Inc. and Silver Dollar Mill Creek, Inc. (filed
previously as Exhibit 10.1 to the Company’s Form 8-K filed July 28,
2010)
|
|
|
10.35
|
Credit
Agreement dated July 23, 2010 between NG Washington II Holdings, LLC, as
Borrower, and Fortress Credit Corp., as agent for the lenders (filed
previously as Exhibit 10.1 to the Company’s Form 8-K filed July 28,
2010)
|
|
|
10.36
|
Membership
Interest Pledge Agreement dated July 23, 2010 between Nevada Gold &
Casinos, Inc., as grantor, and Fortress Credit Corp., as agent for the
lenders (filed previously as Exhibit 10.1 to the Company’s Form 8-K filed
July 28, 2010)
|
|
|
10.37
|
Pledge
and Security Agreement dated July 23, 2010 among NG Washington II
Holdings, LLC and NG Washington II, LLC, as grantors, and Fortress Credit
Corp., as agent for the lenders (filed previously as Exhibit 10.1 to the
Company’s Form 8-K filed July 28, 2010)
|
|
|
10.38
|
Promissory
Note dated July 23, 2010 issued by NG Washington II Holdings, LLC to
Fortress Credit Funding II LP (filed previously as Exhibit 10.1 to the
Company’s Form 8-K filed July 28, 2010)
|
|
|
10.39
|
Promissory
Note dated July 23, 2010 issued by NG Washington II Holdings, LLC to
Fortress Credit Opportunities I LP (filed previously as Exhibit 10.1 to
the Company’s Form 8-K filed July 28, 2010)
|
|
|
10.40
|
Guaranty
dated July 23, 2010 among NG Washington, LLC and NG Washington II, LLC, as
guarantors, and Fortress Credit Corp., as agent for the lenders (filed
previously as Exhibit 10.1 to the Company’s Form 8-K filed July 28,
2010)
|
|
|
23.1(*)
|
Consent
of Independent Registered Public Accounting Firm
|
|
|
31.1(*)
|
Chief
Executive Officer Certification Pursuant to Section 13a-14 of the
Securities Exchange Act.
|
|
|
31.2(*)
|
Chief
Financial Officer Certification Pursuant to Section 13a-14 of the
Securities Exchange Act.
|
|
|
32.1(*)
|
Certification
Pursuant to 18 U.S.C. Section 1350, as Adopted Pursuant to Section 906 of
the Sarbanes-Oxley Act of 2002.
|
|
|
32.2(*)
|
Certification
Pursuant to 18 U.S.C. Section 1350, as Adopted Pursuant to Section 906 of
the Sarbanes-Oxley Act of 2002.
|
|
+
|
Management
contract or compensatory plan, or arrangement.
|
|
*
|
Filed
herewith.
|
|
**
|
Portions
of these exhibits have been omitted pursuant to a request for confidential
treatment.
|
24
SIGNATURES
Pursuant
to Section 13 or 15(d) of the Exchange Act of 1934, the registrant has duly
caused this report to be signed on its behalf by the undersigned, thereunto duly
authorized.
|
Nevada
Gold & Casinos, Inc.
|
||
|
By:
|
/s/ James J. Kohn
|
|
|
James
J. Kohn
|
||
|
Chief
Financial Officer
|
||
|
Date:
July 27, 2010
|
||
25
Pursuant
to the requirements of the Securities Exchange Act of 1934, this report has been
signed below by the following persons on behalf of the registrant in the
capacities and on the dates indicated.
|
Signature
|
Title
|
Date
|
||
|
/s /WILLIAM J
SHERLOCK
|
||||
|
William
J. Sherlock
|
Chairman
of the Board of Directors
|
July
27, 2010
|
||
|
/s/ WILLIAM G. JAYROE
|
||||
|
William
G. Jayroe
|
Director
|
July
27, 2010
|
||
|
/s/ FRANK
CATANIA
|
||||
|
Frank
Catania
|
Director
|
July
27, 2010
|
||
|
/s/ FRANCIS M. RICCI
|
||||
|
Francis
M. Ricci
|
Director
|
July
27, 2010
|
||
|
/s/ WAYNE H. WHITE
|
||||
|
Wayne
H. White
|
Director
|
July
27, 2010
|
||
|
/s/ ROBERT B.
STURGES
|
Director
and Chief Executive Officer
|
|||
|
Robert
B. Sturges
|
(principal
executive officer)
|
July
27, 2010
|
||
|
/s/ JAMES J.
KOHN
|
EVP
and Chief Financial Officer (principal
|
July
27, 2010
|
||
|
James
J. Kohn
|
financial
officer and principal accounting officer)
|
26
Index to
Consolidated Financial Statements
Consolidated
Financial Statements of Nevada Gold & Casinos, Inc.
|
Page
|
||
|
Report
of Independent Registered Public Accounting Firm
|
28
|
|
|
Consolidated
Balance Sheets as of April 30, 2010 and April 30,
2009
|
29
|
|
|
Consolidated
Statements of Operations for fiscal years ended April 30, 2010 and April
30, 2009
|
30
|
|
|
Consolidated
Statements of Stockholders’ Equity for fiscal years ended April 30, 2010
and April 30, 2009
|
31
|
|
|
Consolidated
Statements of Cash Flows for fiscal years ended April 30, 2010
and April 30, 2009
|
32
|
|
|
Notes
to Consolidated Financial Statements
|
33
|
27
REPORT OF
INDEPENDENT REGISTERED PUBLIC ACCOUNTING FIRM
To the
Board of Directors and Stockholders of
Nevada
Gold & Casinos, Inc.
We have
audited the accompanying consolidated balance sheets of Nevada Gold &
Casinos, Inc. and Subsidiaries as of April 30, 2010 and 2009 and the related
consolidated statements of operations, stockholders’ equity and cash flows for
the years then ended. These financial statements are the responsibility of the
Company’s management. Our responsibility is to express an opinion on these
financial statements based on our audits.
We
conducted our audits in accordance with the standards of the Public Company
Accounting Oversight Board (United States). Those standards require that we plan
and perform the audits to obtain reasonable assurance about whether the
financial statements are free of material misstatement. The Company is not
required to have, nor were we engaged to perform, an audit of its internal
control over financial reporting. Our audit included consideration of
internal control over financial reporting as a basis for designing audit
procedures that are appropriate in the circumstances, but not for the purpose of
expressing an opinion of the effectiveness of the Company’s internal control
over financial reporting. Accordingly, we express no such opinion. An
audit includes examining, on a test basis, evidence supporting the amounts and
disclosures in the financial statements. An audit also includes assessing the
accounting principles used and significant estimates made by management, as well
as evaluating the overall financial statement presentation. We believe that our
audits provide a reasonable basis for our opinion.
In our
opinion, the consolidated financial statements referred to above present fairly,
in all material respects, the financial position of Nevada Gold & Casinos,
Inc. and Subsidiaries as of April 30, 2010 and 2009 and the results of their
operations and their cash flows for the years then ended in conformity with U.S.
generally accepted accounting principles.
|
/s/ Pannell Kerr Forster of Texas,
P.C.
|
|
|
Houston,
Texas
|
|
|
July
29, 2010
|
28
Nevada
Gold & Casinos, Inc.
Consolidated
Balance Sheets
|
April
30,
|
April
30,
|
|||||||
|
2010
|
2009
|
|||||||
|
ASSETS
|
||||||||
|
Current
assets:
|
||||||||
|
Cash
and cash equivalents
|
$ | 3,155,736 | $ | 13,834,544 | ||||
|
Restricted
cash
|
5,266,938 | 6,000,000 | ||||||
|
Accounts
receivable
|
66,822 | 12,342 | ||||||
|
Prepaid
expenses
|
475,262 | 235,847 | ||||||
|
Income
tax receivable
|
1,750,374 | 1,872,369 | ||||||
|
Notes
receivable, current portion
|
- | 1,100,000 | ||||||
|
Other
current assets
|
155,796 | 46,444 | ||||||
|
Total
current assets
|
10,870,928 | 23,101,546 | ||||||
|
Investments
in development projects
|
1,418,789 | 746,024 | ||||||
|
Investments
in development projects held for sale
|
3,437,932 | 3,437,932 | ||||||
|
Notes
receivable - development projects, net of allowances
|
1,700,000 | 1,700,000 | ||||||
|
Goodwill
|
10,243,362 | 5,462,918 | ||||||
|
Identifiable
intangible assets , net of accumulated amortization of $729,000 and $0 at
April 30, 2010 and April 30, 2009, respectively
|
5,101,800 | - | ||||||
|
Property
and equipment, net of accumulated depreciation of $2,978,679 and
$2,408,595 at April 30, 2010 and April 30, 2009,
respectively
|
3,473,051 | 1,091,549 | ||||||
|
Deferred
tax asset
|
1,848,419 | 599,797 | ||||||
|
BVO
receivable
|
4,000,000 | 4,000,000 | ||||||
|
Other
assets, net of allowances
|
376,938 | 1,915,220 | ||||||
|
Total
assets
|
$ | 42,471,219 | $ | 42,054,986 | ||||
|
LIABILITIES
AND STOCKHOLDERS’ EQUITY
|
||||||||
|
Current
liabilities:
|
||||||||
|
Accounts
payable and accrued liabilities
|
$ | 1,060,017 | $ | 846,062 | ||||
|
Accrued
interest payable
|
70,000 | — | ||||||
|
Other
accrued liabilities
|
687,819 | 197,833 | ||||||
|
Total
current liabilities
|
1,817,836 | 1,043,895 | ||||||
|
Long-term
debt, net of current portion
|
10,000,000 | 6,000,000 | ||||||
|
Other
liabilities
|
30,944 | 44,487 | ||||||
|
Total
liabilities
|
11,848,780 | 7,088,382 | ||||||
|
Commitments
and contingencies
|
— | — | ||||||
|
Stockholders'
equity:
|
||||||||
|
Common
stock, $0.12 par value per share; 50,000,000 shares authorized; 13,935,330
shares issued and 12,764,130 and 12,939,130 shares outstanding at April
30, 2010, and April 30, 2009, respectively
|
1,672,240 | 1,672,240 | ||||||
|
Additional
paid-in capital
|
19,859,966 | 19,297,560 | ||||||
|
Retained
earnings
|
19,464,972 | 24,213,754 | ||||||
|
Treasury
stock, 1,171,200 and 996,200 shares at April 30, 2010 and April
30, 2009, respectively, at cost
|
(10,369,200 | ) | (10,216,950 | ) | ||||
|
Accumulated
other comprehensive loss
|
(5,539 | ) | — | |||||
|
Total
stockholders' equity
|
30,622,439 | 34,966,604 | ||||||
|
Total
liabilities and stockholders' equity
|
$ | 42,471,219 | $ | 42,054,986 | ||||
The
accompanying notes are an integral part of these consolidated financial
statements.
29
Nevada
Gold & Casinos, Inc.
Consolidated
Statements of Operations
|
Fiscal Years Ended
|
||||||||
|
April 30,
|
April 30,
|
|||||||
|
2010
|
2009
|
|||||||
|
Revenues:
|
||||||||
|
Casino
|
$ | 18,822,900 | $ | 5,356,885 | ||||
|
Food
and beverage
|
4,534,744 | 1,395,130 | ||||||
|
Other
|
865,264 | 49,366 | ||||||
|
Management
fees
|
620,968 | 493,382 | ||||||
|
Gross
revenues
|
24,843,876 | 7,294,763 | ||||||
|
Less
promotional allowances
|
(2,817,888 | ) | (1,426,511 | ) | ||||
|
Net
revenues
|
22,025,988 | 5,868,252 | ||||||
|
Operating
expenses:
|
||||||||
|
Casino
|
8,562,284 | 1,750,014 | ||||||
|
Food
and beverage
|
2,851,635 | 614,779 | ||||||
|
Marketing
and administrative
|
5,564,288 | 2,485,881 | ||||||
|
Facility
|
1,070,933 | 362,009 | ||||||
|
Corporate
expense
|
4,216,475 | 4,366,670 | ||||||
|
Legal
expenses
|
241,468 | 403,694 | ||||||
|
Depreciation
and amortization
|
1,344,323 | 627,618 | ||||||
|
Impairment
of assets
|
4,347,183 | - | ||||||
|
Write-off
of project development cost
|
50,486 | 1,215,383 | ||||||
|
Other
|
476,395 | 145,018 | ||||||
|
Total
operating expenses
|
28,725,470 | 11,971,066 | ||||||
|
Operating
loss
|
(6,699,482 | ) | (6,102,814 | ) | ||||
|
Non-operating
income (expenses):
|
||||||||
|
Loss
from unconsolidated affiliates
|
- | (7,863 | ) | |||||
|
Gain
on sale of equity investees
|
16,511 | 403,388 | ||||||
|
Interest
income
|
192,708 | 975,490 | ||||||
|
Interest
expense
|
(866,034 | ) | (1,307,296 | ) | ||||
|
Amortization
of loan issue costs
|
(58,972 | ) | (128,266 | ) | ||||
|
Loss
on extinguishment of debt
|
(128,834 | ) | - | |||||
|
Loss
before income tax expense (benefit)
|
(7,544,103 | ) | (6,167,361 | ) | ||||
|
Income
tax benefit
|
||||||||
|
Current
|
(1,546,698 | ) | (2,265,155 | ) | ||||
|
Deferred
and change in valuation allowance
|
(1,248,623 | ) | 285,930 | |||||
|
Total
income tax benefit
|
(2,795,321 | ) | (1,979,225 | ) | ||||
|
Net
loss
|
$ | (4,748,782 | ) | $ | (4,188,136 | ) | ||
|
Per
share information:
|
||||||||
|
Net
loss per common share - basic
|
$ | (0.37 | ) | $ | (0.32 | ) | ||
|
Net
loss per common share - diluted
|
$ | (0.37 | ) | $ | (0.32 | ) | ||
|
Basic
weighted average number of shares outstanding
|
12,878,240 | 12,939,130 | ||||||
|
Diluted
weighted average number of shares outstanding
|
12,878,240 | 12,939,130 | ||||||
The
accompanying notes are an integral part of these consolidated financial
statements.
30
Nevada
Gold & Casinos, Inc.
Consolidated
Statements of Stockholders' Equity
|
Accumulated
|
||||||||||||||||||||||||||||
|
Additional
|
Other
|
Total
|
||||||||||||||||||||||||||
|
Common Stock
|
Paid-in
|
Retained
|
Treasury
|
Comprehensive
|
Stockholders'
|
|||||||||||||||||||||||
|
Shares
|
Amount
|
Capital
|
Earnings
|
Stock
|
Income
|
Equity
|
||||||||||||||||||||||
|
Balance
at April 27, 2008
|
13,935,330 | $ | 1,672,240 | $ | 19,092,706 | $ | 28,401,890 | $ | (10,216,950 | ) | $ | 9,460 | $ | 38,959,346 | ||||||||||||||
|
Comprehensive
income:
|
- | |||||||||||||||||||||||||||
|
Net
loss
|
— | — | — | (4,188,136 | ) | — | — | (4,188,136 | ) | |||||||||||||||||||
|
Unrealized
loss on securities available for sale, net of tax benefit
|
— | — | — | — | — | (9,460 | ) | (9,460 | ) | |||||||||||||||||||
|
Comprehensive
loss
|
(4,197,596 | ) | ||||||||||||||||||||||||||
|
Stock
based compensation
|
— | — | 204,854 | — | — | — | 204,854 | |||||||||||||||||||||
|
Balance
at April 30, 2009
|
13,935,330 | $ | 1,672,240 | $ | 19,297,560 | $ | 24,213,754 | $ | (10,216,950 | ) | $ | - | $ | 34,966,604 | ||||||||||||||
|
Net
loss
|
— | — | — | (4,748,782 | ) | — | — | (4,748,782 | ) | |||||||||||||||||||
|
Unrealized
loss on securities available for sale, net of tax benefit
|
— | — | — | — | — | (5,539 | ) | (5,539 | ) | |||||||||||||||||||
|
Comprehensive
loss
|
— | (4,754,321 | ) | |||||||||||||||||||||||||
|
Stock
repurchased at cost
|
— | — | (152,250 | ) | — | (152,250 | ) | |||||||||||||||||||||
|
Stock
based compensation
|
— | — | 562,406 | — | — | — | 562,406 | |||||||||||||||||||||
|
Balance
at April 30, 2010
|
13,935,330 | $ | 1,672,240 | $ | 19,859,966 | $ | 19,464,972 | $ | (10,369,200 | ) | $ | (5,539 | ) | $ | 30,622,439 | |||||||||||||
The
accompanying notes are an integral part of these consolidated financial
statements.
31
Nevada
Gold & Casinos, Inc.
Consolidated
Statements of Cash Flows
|
Fiscal Years Ended
|
||||||||
|
April 30,
|
April 30,
|
|||||||
|
2010
|
2009
|
|||||||
|
Cash
flows from operating activities:
|
||||||||
|
Net
loss
|
$ | (4,748,782 | ) | $ | (4,188,136 | ) | ||
|
Adjustments
to reconcile net loss to net cash provided by (used in) operating
activities:
|
||||||||
|
Depreciation
and amortization
|
1,344,323 | 627,618 | ||||||
|
Stock
based compensation
|
562,406 | 204,854 | ||||||
|
Write-off
of project development costs
|
50,486 | 1,215,383 | ||||||
|
Impairment
of assets
|
4,347,183 | — | ||||||
|
Amortization
of deferred loan issuance costs
|
58,972 | 128,266 | ||||||
|
Gain
on sale of equity investments, net
|
(16,511 | ) | (403,388 | ) | ||||
|
Distributions
from unconsolidated affiliates
|
- | 3,917 | ||||||
|
Loss
from unconsolidated affiliates
|
- | 7,863 | ||||||
|
Loss
on extinguishment of debt
|
128,834 | — | ||||||
|
Deferred
income tax expense (benefit)
|
(1,248,623 | ) | 285,930 | |||||
|
Changes
in operating assets and liabilities:
|
||||||||
|
Receivables
and other assets
|
(307,536 | ) | 1,043,587 | |||||
|
Accounts
payable and accrued liabilities
|
814,741 | (4,432,953 | ) | |||||
|
Net
cash provided by (used in) operating activities
|
985,493 | (5,507,059 | ) | |||||
|
Cash
flows from investing activities:
|
||||||||
|
Purchases
of real estate and assets held for development
|
(1,384,855 | ) | (803,499 | ) | ||||
|
Equity
investment in unconsolidated affiliates
|
- | (25,000 | ) | |||||
|
Purchase
of property and equipment
|
(11,766,715 | ) | (379,296 | ) | ||||
|
Net
proceeds from sale of equity investments, marketable securities and assets
securities and assets
|
- | 16,000,000 | ||||||
|
Collections
of notes receivable
|
- | 4,601,104 | ||||||
|
Collections
of notes receivable - affiliates
|
1,100,000 | 1,100,000 | ||||||
|
Release
of restricted cash
|
733,062 | 7,014,000 | ||||||
|
Net
cash provided by (used in) investing activities
|
(11,318,508 | ) | 27,507,309 | |||||
|
Cash
flows from financing activities:
|
||||||||
|
Repayment
on term loans
|
- | (9,550,000 | ) | |||||
|
Proceeds
from short term loans
|
150,000 | — | ||||||
|
Repayment
on short term loans
|
(150,000 | ) | — | |||||
|
Acquistion
of treasury stock at cost
|
(152,250 | ) | — | |||||
|
Deferred
loan issuance costs
|
(180,000 | ) | — | |||||
|
Payments
on capital lease
|
(13,543 | ) | (12,019 | ) | ||||
|
Net
cash used in financing activities
|
(345,793 | ) | (9,562,019 | ) | ||||
|
Net
increase (decrease) in cash and cash equivalents
|
(10,678,808 | ) | 12,438,231 | |||||
|
Cash
and cash equivalents at beginning of period
|
13,834,544 | 1,396,313 | ||||||
|
Cash
and cash equivalents at end of period
|
$ | 3,155,736 | $ | 13,834,544 | ||||
|
Supplemental
cash flow information:
|
||||||||
|
Cash
paid for interest
|
$ | 810,000 | $ | 1,416,164 | ||||
|
Income
tax payments
|
$ | - | $ | 3,638,421 | ||||
|
Non-cash
investing and financing activities:
|
||||||||
|
Equity
investment conversion to accounts receivable
|
$ | - | $ | 1,035,000 | ||||
|
Non-cash
purchase of property and equipment
|
$ | 4,000,000 | $ | — | ||||
|
Unrealized
loss on marketable securities
|
$ | (5,539 | ) | $ | (9,460 | ) | ||
The
accompanying notes are an integral part of these consolidated financial
statements.
32
Nevada
Gold & Casinos, Inc.
Notes
to Consolidated Financial Statements
Note
1. Background and Basis of Presentation
Background
Nevada
Gold & Casinos, Inc. (the “Company”), a Nevada corporation, was formed in
1977 and since 1994, has primarily been a gaming company involved in gaming
projects and gaming operations. Our gaming operations are located in the United
States of America (“U.S.”), specifically in the states of Colorado and
Washington. Our business strategy will continue to focus on gaming
projects.
Basis of
Presentation
Our
consolidated financial statements include the accounts of all majority-owned and
controlled subsidiaries after the elimination of all significant intercompany
accounts and transactions. Additionally, our financial statements for prior
periods include reclassifications that were made to conform to the current year
presentation. Those reclassifications did not impact working capital, total
assets, total liabilities, our reported net loss or stockholders’
equity.
Note 2. Summary of Significant Accounting
Policies
Principles
of Consolidation
We
consolidate entities when we have the ability to control the operating and
financial decisions and policies of that entity and record the portion we do not
own as non-controlling interest. The determination of our ability to control or
exert significant influence over an entity involves the use of judgment. We
apply the equity method of accounting where we can exert significant influence
over, but do not control, the policies and decisions of an entity. We use the
cost method of accounting where we are unable to exert significant influence
over the entity.
Use
of Estimates
The
preparation of financial statements in conformity with U.S. generally accepted
accounting principles requires that we make estimates and assumptions that
affect the reported amounts of assets and liabilities and disclosures of
contingent assets and liabilities at the date of the consolidated financial
statements and the amounts of revenues and expenses during the reporting period.
Actual results can, and often do, differ from those estimates.
FairValue
U.S.
generally accepted accounting principles defines fair value as the price that
would be received to sell an asset or paid to transfer a liability in an orderly
transaction between market participants at the measurement date and establishes
a three-level valuation hierarchy for disclosure of fair value measurements. The
valuation hierarchy categorizes assets and liabilities measured at fair value
into one of three different levels depending on the observability of the inputs
employed in the measurement. The three levels are defined as
follows:
Level 1 -
Observable inputs such as quoted prices in active markets at the measurement
date for identical, unrestricted assets or liabilities.
Level 2 -
Other inputs that are observable directly or indirectly such as quoted prices in
markets that are not active, or inputs which are observable, either directly or
indirectly, for substantially the full term of the asset or
liability.
Level 3 -
Unobservable inputs for which there is little or no market data and which the
Company makes its own assumptions about how market participants would price the
assets and liabilities.
Cash and Cash
Equivalents
We
consider short-term investments with an original maturity of less than three
months to be cash equivalents.
We
maintain cash accounts in major U.S. financial institutions. The terms of these
deposits are on demand to minimize risk. The balances of these accounts
occasionally exceed the federally insured limits, although no losses have been
incurred in connection with such cash balances.
Allowance for Doubtful
Accounts
We
establish provisions for losses on accounts and notes receivable if we determine
that we will not collect all or part of the outstanding balance. We regularly
review collectibility and establish or adjust our allowance as necessary using
the specific identification method. We make advances to third parties under
executed promissory notes for project costs related to the development of gaming
and entertainment properties. Due diligence is conducted by our management with
the assistance of legal counsel prior to entering into arrangements with third
parties to provide financing in connection with their efforts to secure and
develop the properties. Repayment terms are largely dependent upon the operating
performance of each opportunity for which the funds have been loaned. Interest
income is not accrued until it is reasonably assured that the project will be
completed and that there will be sufficient profits from the facility to cover
the interest to be earned under the respective note. If projected cash flows are
not sufficient to recover amounts due, the note is evaluated to determine the
appropriate discount to be recorded on the note for it to be considered a
performing loan. If the note is performing, interest is recorded using the
effective interest method based on the value of the discounted note balance. See
Note 5 to our Consolidated Financial Statements.
We review
on a quarterly basis each of our receivables to evaluate whether the collection
of such receivable is still probable. In our analysis, we review the economic
feasibility and the current financial, legislative and development status of the
project. If our analysis indicates that the project is no longer economically
feasible then the receivable would be written down to its estimated fair
value.
33
Concentrations
of Credit Risk
Financial
instruments that potentially subject the Company to concentrations of credit
risk are primarily notes receivable, cash and cash equivilants, accounts
receivable and payable, and long term debt. At April 30, 2010 and 2009, the
Company had one note receivable outstanding. This note was issued in connection
with a potential gaming project. Management performs periodic evaluations of the
collectibility of this note. The Company’s cash deposits are held with large,
well-known financial institutions, and, at times, such deposits may be in excess
of the federally insured limit. The recorded value of cash, accounts
receivable and payable, approximate fair value based on their short term nature;
the recorded value of long term debt approximates fair value as interest
rates approximate current market rates.
Capitalized
Development Cost
We
capitalize certain third party, professional, and other miscellaneous fees
directly related to the procurement, evaluation and establishment of contracts
for development projects. Development costs are recorded on the cost basis and
are amortized over the estimated economic term of the contract. We review each
project on a quarterly basis to assess whether any changes to our estimates are
appropriate. If accumulated costs of a specific project exceed the net
realizable value of such project or the project is abandoned, the costs are
charged to earnings.
Real
Estate Held for Sale
Investments
in development projects held for sale consists of undeveloped land located in
and around Black Hawk, Colorado and related development costs and capitalized
interest. Property held for sale is carried at the lower of cost or net
realizable value.
Property
and Equipment
Expenditures
for furniture, fixtures, and equipment are capitalized at cost. We depreciate
furniture, fixtures, and equipment over their respective estimated useful lives,
ranging from two to seven years, using the straight-line method. When items are
retired or otherwise disposed of, a gain or loss is recorded for the difference
between net book value and proceeds realized. Ordinary maintenance and repairs
are charged to earnings, and replacements and betterments are
capitalized.
Property
and equipment at April 30, 2010 and April 30, 2009 consist of the
following:
|
Estimated
|
||||||||||||
|
April 30,
|
April 30,
|
Service Life
|
||||||||||
|
2010
|
2009
|
in Years
|
||||||||||
|
Leasehold
improvements
|
$ | 872,754 | $ | 333,431 |
7-25
|
|||||||
|
Gaming
equipment
|
2,130,607 | 1,995,809 |
3-5
|
|||||||||
|
Furniture
and office equipment
|
1,704,469 | 916,646 |
3-7
|
|||||||||
|
Building
and improvements
|
1,612,250 | - |
15-30
|
|||||||||
|
Land
|
129,750 | 42,000 | ||||||||||
|
Construction
in Progress
|
1,900 | 212,258 | ||||||||||
| 6,451,730 | 3,500,144 | |||||||||||
|
Less
accumulated depreciation
|
(2,978,679 | ) | (2,408,595 | ) | ||||||||
|
Property
and equipment, net
|
$ | 3,473,051 | $ | 1,091,549 | ||||||||
Deferred
Loan Issuance Costs
Debt
issuance costs incurred in connection with the issuance of long-term debt are
capitalized and amortized over the expected terms of the related debt agreements
and are included in other assets on our consolidated balance
sheets.
Goodwill
and Other Intangible Assets
In
connection with our acquisition of the Colorado Grande casino on April 25, 2005,
and the acquisition of the Washington casinos on May 12, 2009, we have goodwill
and identifiable intangible assets with an indefinite useful life of $15.3
million, net of amortization.
The
change in the carrying amount of goodwill and other intangibles for 2010 is as
follows (in thousands):
34
|
Total
|
Goodwill
|
Other
Intangibles
|
||||||||||
|
Net
balance as of April 30, 2009
|
$ | 5,463 | $ | 5,463 | $ | 0 | ||||||
|
Acquired
during the year
|
13,361 | 7,530 | 5,831 | |||||||||
|
Impairment
|
(2,750 | ) | (2,750 | ) | 0 | |||||||
|
Accumulated
amortization
|
(729 | ) | - | (729 | ) | |||||||
|
Balance
as of April 30, 2010
|
$ | 15,345 | $ | 10,243 | $ |
5,102
|
||||||
The $7.5
million net increase in goodwill and the $5.1 million increase in other
intangibles from April 30, 2009 to April 30, 2010 results from recording the
estimated intangibles for the acquisitions of the Washington mini-casinos
acquired during fiscal 2010. Other intangible assets are generally
amortized on a straight line basis over the useful lives of the
assets. All goodwill and other intangible assets pertain to the
gaming segment.
A summary
of amortizable other intangible assets follows (in thousands):
|
As of April 30, 2010
|
||||||||
|
Gross
Carrying
Amount
|
Accumulated
Amortization
|
|||||||
|
Customer
relationships
|
$ | 2,951 | $ | (404 | ) | |||
|
Non-compete
agreements
|
1,018 | (325 | ) | |||||
|
Trade
names
|
1,862 | 0 | ||||||
|
Total
|
$ | 5,831 | $ | (729 | ) | |||
The
estimated future annual amortization of intangible assets for each of the next
five years follows (in thousands):
|
2011
|
$ | 761 | ||
|
2012
|
$ | 761 | ||
|
2013
|
$ | 421 | ||
|
2014
|
$ | 421 | ||
|
2015
|
$ | 421 | ||
|
Thereafter
|
$ | 455 |
The
weighted average useful lives of acquired intangibles related to customer
relationships and non-compete agreements are 7.0 years and 3.0 years,
respectively. The weighted average useful life of amortizable
intangible assets in total is 5.0 years.
Goodwill
and intangible assets with indefinite useful lives are tested for impairment
annually, or more frequently if an event occurs or circumstances change that may
reduce the fair value of our goodwill below its carrying value.
We review
goodwill at the reporting level unit, which is one level below an operating
segment. We review the carrying value of the net assets of each reporting
unit to the estimated fair value of the reporting unit, based upon a
multiple of estimated earnings. If the carrying value exceeds the estimated fair
value of the reporting unit, an impairment indicator exists and an estimate of
the impairment loss is calculated. The fair value calculation uses level 3
inputs and includes multiple assumptions and estimates, including the projected
cash flows and discount rates applied. Changes in these assumptions and
estimates could result in goodwill impairment that could materially adversely
impact our financial position or results of operations. All of our goodwill is
attributable to reporting units within our gaming
segment.
We use
earnings before interest, taxes, depreciation, and amortization (“EBITDA”) as
the measure for future earnings in our impairment test. Management
estimates future EBITDA based primarily on its projections of future revenues.
We utilized comparable industry average multiples of EBITDA rates based on
industry standards ranging from 5.5 to 7.5 times EBITDA when we estimated fair
values of our casinos as of April 30, 2010.
During
the 2010 fiscal year there were significant declines in the U.S. economies and
in the casino industry overall, which led to declines in our revenues, margins
and cash flows. Our sales and profitability declined throughout the
year. We considered the impact of these significant adverse changes
in the economic and business climate as we performed our annual impairment
assessment of goodwill as of April 30, 2010. The estimated fair
values of our reporting unit were negatively impacted by significant reductions
in estimated cash flows for the income approach.
35
Our
goodwill impairment analysis led us to conclude that there was a significant
impairment of goodwill for the Colorado Grande and, accordingly, we recorded a
non-cash charge of $2.8 million to our operating results for the year ended
April 30, 2010, for the impairment of our goodwill. This $2.8 million
expense is included in the “Impairment of Assets” expense on the Consolidated
Statements of Operations. This impairment charge did not
have an impact on our liquidity; however it was a reflection of the overall
downturn in our industry and decline in our projected cash flows. Continued
declines in the U.S. economy and the casino industry could lead to further
impairments of our goodwill.
Long-lived
assets, including property, plant and equipment and amortizable intangible
assets, also comprise a significant portion of our total assets. We evaluate the
carrying value of long-lived assets when impairment indicators are present or
when circumstances indicate that impairment may exist under authoritative
guidance. When management believes impairment indicators may exist, projections
of the undiscounted future cash flows associated with the use of and eventual
disposition of long-lived assets held for use are prepared. If the projections
indicate that the carrying values of the long-lived assets are not recoverable,
we reduce the carrying values to fair value. For long-lived assets held for
sale, we compare the carrying values to an estimate of fair value less selling
costs to determine potential impairment. We test for impairment of long-lived
assets at the lowest level for which cash flows are measurable. These impairment
tests are heavily influenced by assumptions and estimates that are subject to
change as additional information becomes available.
Slot
Club Awards
We reward
our slot customers for their loyalty based on the dollar amount of play on slot
machines. We accrue for these slot club awards based on an estimate of the value
of the outstanding awards utilizing the age and prior history of redemptions.
Future events such as a change in our marketing strategy or new competition
could result in a change in the value of the awards.
Advertising
Costs
The
Company expenses advertising costs as incurred. Advertising expense related
primarily to our casino operations and for the years ended April 30, 2010 and
April 30, 2009 was approximately $844,000 and $161,000,
respectively.
Marketable
Securities Available for Sale
Marketable
securities consist of shares of publicly traded securities held by us. The
marketable securities available for sale are primarily equity securities which
we buy with the intention of holding as a long-term investment. These securities
are carried at fair value using level 1 inputs with changes in fair
value recorded in other comprehensive income in the stockholders’ equity section
of our consolidated balance sheet. As of April 30, 2010 we had marketable equity
securities available for sale at fair market value of $2,000. Unrealized gain
(loss) of $(5,539) and $(9,460) was recorded in the stockholders’ equity section
for the years ended April 30, 2010 and April 30, 2009,
respectively. In addition, in fiscal years 2010 and 2009, we showed
no realized gain or loss on marketable securities.
Asset
and Investment Impairments
We
evaluate an asset or investment for impairment when events or circumstances
indicate that its carrying value may not be recovered. These events include
market declines that are believed to be other than temporary, changes in the
manner in which we intend to use a long-lived asset, decisions to sell an asset
or investment and adverse changes in the legal or business environment such as
adverse actions by regulators. When an event occurs, we evaluate the
recoverability of our carrying value based on either (i) the long-lived
asset’s ability to generate future cash flows on an undiscounted basis or
(ii) the fair value of our investment in unconsolidated affiliates. If an
impairment is indicated, or if we decide to exit or sell a long-lived asset or
group of assets, we adjust the carrying value of these assets downward, if
necessary, to their estimated fair value, less costs to sell. Our fair value
estimates are generally based on market data obtained through the sales process
or an analysis of expected discounted cash flows. The magnitude of any
impairments are impacted by a number of factors, including the nature of the
assets to be sold and our established time frame for completing the sales, among
other factors. We also reclassify the asset or assets as either held-for-sale or
as discontinued operations, depending on, among other criteria, whether we will
have any continuing involvement in the cash flows of those assets after they are
sold.
Revenue
Recognition
We record
revenues from casino operations, interest on notes receivable and management
fees on the accrual basis as earned. The dates on which payments are collected
may vary depending upon the term of the contracts or note receivable agreements.
Interest income related to notes receivable is recorded when earned and its
collectibility is reasonably certain.
The
retail value of food and beverage and other services furnished to guests without
charge is included in gross revenue and deducted as promotional allowances. Net
revenues do not include the retail amount of food, beverage and other items
provided gratuitously to customers. The Company records the redemption of
coupons and points for cash as a reduction of revenue as they are earned. These
amounts are included in promotional allowances in the accompanying consolidated
statements of operations. The estimated cost of providing such complimentary
services that is included in casino expense in the accompanying consolidated
statements of operations was as follows:
36
|
Fiscal Year
Ended
|
Fiscal Year
Ended
|
|||||||
|
April 30, 2010
|
April 30, 2009
|
|||||||
|
Food
and beverage
|
$ | 1,120,638 | $ | 595,499 | ||||
|
Other
|
13,601 | 5,994 | ||||||
|
Total
cost of complimentary services
|
$ | 1,134,239 | $ | 601,493 | ||||
Accrued
Jackpot Liability
We accrue
jackpot liability as games are played under a matching concept of
coin-in. We also maintain approximately $267,000 in accrued Player
Supported Jackpot liability, which are progressive games that customers fund and
when a jackpot is hit it is paid from reserved funds.
Income
Taxes
Income
taxes are accounted using an asset and liability approach for financial
accounting and reporting for income taxes. Under this approach, deferred tax
assets and liabilities are recognized based on anticipated future tax
consequences, using currently enacted tax laws, attributable to differences
between financial statement carrying amounts of assets and liabilities and their
respective tax basis. We record current income taxes based on our current
taxable income, and we provide for deferred income taxes to reflect estimated
future tax payments and receipts. We account for tax credits under the
flow-through method, which reduces the provision for income taxes in the year
the tax credits first become available. We reduce deferred tax assets by a
valuation allowance when, based on our estimates, it is more likely than not
that a portion of those assets will not be realized in a future
period.
We
maintain a tax accrual policy to record both regular and alternative minimum
taxes for companies included in our consolidated federal and state income tax
returns. The policy provides, among other things, that (i) each company in
a taxable income position will accrue a current expense equivalent to its
federal and state income taxes, and (ii) each company in a tax loss
position will accrue a benefit to the extent its deductions, including general
business credits, can be utilized in the consolidated returns. We pay all
consolidated U.S. federal and state income taxes directly to the appropriate
taxing jurisdictions and, under a separate tax billing agreement, we may bill or
refund our subsidiaries for their portion of these income tax
payments.
We
adopted the Financial Accounting Standards Board’s Interpretation
No. 48, “Accounting for
Uncertainty in Income Taxes, an Interpretation of FASB Statement
No. 109” (“FIN 48”) which is now codified under ASC Topic 740,
effective April, 30, 2007. FIN 48 clarifies the accounting for
uncertainty in income taxes recognized in financial statements and requires the
impact of a tax position to be recognized in the financial statements if that
position is more likely than not of being sustained by the taxing
authority. The adoption of FIN 48 did not have a material effect on
the Company’s consolidated financial position or results of operations. Should
interest and penalty be incurred as a result of a review of our income tax
returns, we will record the interest and penalty in accordance with FIN
48.
Stock-Based
Compensation
Under ASC
Topic 718, “Compensation - Stock
Compensation,” the fair value and compensation expense of each option
award is estimated as of the date of grant using a Black-Scholes option pricing
formula. Expected volatility is based on historical volatility of our stock over
a preceding period commensurate with the expected term of the option. The
expected volatility considers factors such as the volatility of our share price.
The risk-free rate for the expected term of the option is based on the
U.S. Treasury yield curve in effect at the time of grant. Expected dividend
yield was not considered in the option pricing formula since we historically
have not paid dividends and have no current plans to do so in the
future.
The
compensation cost related to these share-based awards is recognized over the
requisite service period. The requisite service period is generally the period
during which an employee is required to provide service in exchange for the
award. Total stock-based compensation for the years ended April 30, 2010 and
April 30, 2009 was $562,406 and $204,854, respectively.
Earnings
Per Share
Earnings
per share, both basic and diluted, are presented on the consolidated
statement of operations. Basic earnings per common share amounts are calculated
using the weighted average number of common shares outstanding during each
period. Diluted earnings per share assumes the exercise of all stock options
having exercise prices less than the average market price of the common stock
using the “treasury stock method” and for convertible debt securities using the
“if converted method” (See Note 9).
37
Accrued
Litigation Liability
We assess
our exposure to loss contingencies including legal matters. If the
potential loss is justified to be probable and estimable, we will provide for
the exposure. If the actual loss from a contingency differs from management’s
estimate, operating results could be impacted. As of April 30, 2010 and 2009, we
did not record any accrued litigation liability.
New
Accounting Pronouncements
As of
April 30, 2010, there are several new accounting standards and interpretations
effective. Below is a discussion of significant standards that may impact
us.
The
Hierarchy of General Accepted Accounting Principles and The FASB Accounting
Standard Codification and the Hierarchy of Generally Accepted Accounting
Principles – replacement of FASB Statement No. 162
In the
current fiscal year, the Financial Accounting Standards Board (“FASB”) finalized the “FASB Accounting Standards
Codification” (“Codification” or “ASC”), which is effective for periods
ending on or after September 15, 2009. Accordingly, we have
implemented the ASC structure required by the FASB and any references to
guidance issued by the FASB in these footnotes are to the ASC, in addition to
other forms of standards. The ASC does not change how we account for
our transactions or the nature of the related disclosures made.
Noncontrolling
Interests in Consolidated Financial Statements
In
December 2007, FASB issued SFAS No. 160, “Noncontrolling Interests in
Consolidated Financial Statements – an amendment of ARB No. 51”, which is now
codified under ASC Topic 810 (“ASC 810”). ASC 810 establishes
accounting and reporting standards with respect to the disclosure of a
noncontrolling ownership interest in the statement of financial position within
equity, the presentation of the share of consolidated net income attributable to
the parent and noncontrolling interest on the consolidated statement of income,
the accounting treatment of changes in a parent’s ownership interest while the
parent retains a controlling interest and the accounting for the deconsolidation
of a subsidiary. ASC 810 is effective for fiscal years, and interim
periods within those fiscal years, beginning on or after December 15,
2008. The Company currently has no noncontrolling ownership interests
in consolidated subsidiaries and therefore is not impacted by ASC
810.
Disclosures
About Derivative Instruments and Hedging Activities
In March
2008, the FASB issued SFAS No. 161, "Disclosures About Derivative
Instruments and Hedging Activities - an amendment of FASB Statement No.
133" ("SFAS No. 161"), which is now codified under ASC Topic 815 (“ASC
815”) expands the disclosure requirements regarding an entity's derivative
instruments and hedging activities, and is effective for the Company's fiscal
year beginning May 1, 2009. ASC 815 relates specifically to disclosures, and
does not have a material impact on the Company's consolidated financial
statements.
Consolidations
In
December 2009, the FASB issued Accounting Standards Update
(“ASU”) 2009-17,
“Consolidations (Topic 810) — Improvements to Financial Reporting by Enterprises
Involved with Variable Interest Entities,” which codified the previously
issued Statement of Financial Accounting Standards (“SFAS”) No. 167, “Amendments
to FASB Interpretation No. 46R.” ASU 2009-17 changes the consolidation analysis
for variable interest entities (“VIEs”) and requires a qualitative analysis to
determine the primary beneficiary of the VIE. The determination of
the primary beneficiary of a VIE is based on whether the entity has the power to
direct matters which most significantly impact the activities of the VIE and has
the obligation to absorb losses, or the right to receive benefits, of the VIE
which could potentially be significant to the VIE. The ASU requires
an ongoing reconsideration of the primary beneficiary and also amends the events
triggering a reassessment of whether an entity is a VIE. ASU 2009-17
requires additional disclosures for VIEs, including disclosures about a
reporting entity’s involvement with VIEs, how a reporting entity’s involvement
with a VIE affects the reporting entity’s financial statements, and significant
judgments and assumptions made by the reporting entity to determine whether it
must consolidate the VIE. ASU 2009-17 is effective for us beginning
May 1, 2010. Our adoption of ASU 2009-17 will not have a material effect on our
financial statements.
Subsequent
Events
In May
2009, the FASB issued SFAS No. 165, “Subsequent Events” which is
codified in FASB ASC 855, “Subsequent Events” (“ASC 855”). ASC 855
establishes general standards of accounting for and disclosure of events that
occur after the balance sheet date but before financial statements are issued or
are available to be issued. We adopted ASC 855 in the second quarter
of fiscal 2010 and evaluated all events or transactions through the date of this
filing.
38
Business
Combinations
In
December 2007, the FASB issued SFAS No. 141 (revised 2007), “Business Combinations”, which
is codified in ASC 805. ASC 805 establishes principles and
requirements to recognize the assets acquired and liabilities assumed in an
acquisition transaction and determines what information to disclose to investors
regarding the business combination. ASC 805 is effective for business
combinations for which the acquisition date is on or after the beginning of the
first annual period beginning after December 15, 2008.
Note
3. Restricted Cash
As of
April 30, 2010, we maintained a $5,000,000 Project Fund which use is restricted
to be used for future acquisitions. We also maintain approximately
$267,000 in Player Supported Jackpot funds which are progressive games that
customers fund and when a jackpot is hit it is paid from these
funds.
Note
4. Investments in Development Projects
We also
hold investments in various development projects that we consolidate. Our net
ownership interest and capitalized development costs in development projects are
as follows:
|
Net Ownership Interest
|
Capitalized Development Costs
|
|||||||||||||||
|
Development Projects:
|
April 30,
2010
|
April 30,
2009
|
April 30,
2010
|
April 30,
2009
|
||||||||||||
|
(Percent)
|
||||||||||||||||
|
NG
Washington, LLC (1)
|
100 | 100 | $ | - | $ | 617,071 | ||||||||||
|
Nevada
Gold Speedway, LLC (2)
|
100 | - | 90,652 | - | ||||||||||||
|
NG
Washington II, LLC (3)
|
100 | - | 1,273,731 | - | ||||||||||||
|
Other
(4)
|
54,406 | 128,953 | ||||||||||||||
|
Total
investments– development projects
|
$ | 1,418,789 | $ | 746,024 | ||||||||||||
|
(1)
|
Refundable
deposits and license costs incurred for three mini casinos in Washington
State; acquisition closed May 12,
2009.
|
|
(2)
|
Deposit
and acquisition costs related to management and technical services
contract for development of Speedway casino and
hotel
|
|
(3)
|
Refundable
deposits and license costs incurred for the acquisition of seven
additional mini-casinos in Washington State (see Note
17).
|
|
(4)
|
Development
cost incurred for other development
projects.
|
Nevada
Gold Vicksburg, L.L.C
In
November 2007 we signed a Purchase and Sale Agreement to acquire the Horizon
Casino and Hotel in Vicksburg, Mississippi from Tropicana Entertainment. In
December 2007, we submitted our application for approval by the Mississippi
Gaming Commission to become a licensed gaming operator in Mississippi. In May
2008, Tropicana Entertainment filed a petition for bankruptcy reorganization and
we were informed by the staff at the Mississippi Gaming Commission that it would
not move on a recommendation on our application until the bankruptcy court
approved the proposed sale. Talks related to the acquisition ended September 17,
2008. Refundable deposits were collected in December, 2008, and
unrecoverable costs of $1.2 million were written off as of October 31,
2008.
Investments
in Unconsolidated Affiliates
Route
66 Casinos, L.L.C.
We were a
51% non-operating owner of Route 66. American Heritage, Inc., d/b/a The Gillmann
Group (“The Gillmann Group”) was the 49% operating owner. We used the equity
method of accounting to account for our investment in Route 66 Casinos. Our
investment was stated at cost, adjusted for our undistributed earnings or losses
of the project since inception. We did not record earnings from Route 66 Casinos
for all of fiscal years 2009 or 2008. During fiscal years 2009 and 2008, we did
not receive any cash distributions from Route 66 Casinos. On March 28,
2008, the Company was awarded a judgment against the Gillman Group for which we
were to receive $4.6 million. We signed a Settlement Agreement with the Gillmann
Group and related parties as of April 15, 2008 and ultimately sold our
investment in Route 66 back to the Gillmann Group (See Note 16). As a result,
our investment in Route 66 Casinos was $0 as of April 30, 2010 and April 30,
2009.
39
We
received $1 million in May, 2008, and $1.3 million in June,
2008. There was an offsetting $0.7 million liability previously
netted against the $2.3 million, resulting in a net balance of $1.6
million. The remaining $2.3 million was due April 15, 2010. We did
not receive payment as of April 30, 2010 and as a result, we have established a
$1.6 million valuation allowance for the total net receivable. We are
pursuing various legal steps to collect the receivable (See Note
16).
American
Racing and Entertainment, L.L.C.
On June
14, 2007, we sold our 15.67% membership interest in American Racing to our
partners, Southern Tier Acquisition II LLC and Oneida Entertainment LLC. The
Company received three payments totaling $4.3 million for its membership
interest: $2.1 million cash was received upon closing, $1.1 million was received
in June 2008 and $1.1 million was received in June 2009.
Investments
in Development Projects Held for Sale
Gold
Mountain Development, L.L.C.
Through
our wholly-owned subsidiary, Gold Mountain Development, L.L.C. (“Gold
Mountain”), we own approximately 265 acres of real property in the vicinity of
Black Hawk, Colorado which is located in an Environmental Protection Agency
National Priorities list area. In November 2004, the Central City Business
Improvement District completed the construction of a new 8.4 mile four-lane road
connecting Interstate 70 to Central City, Colorado. The new road is adjacent to
a portion of our acreage. The acreage is for sale and will be listed with a
broker. Our capitalized development costs were $3,437,932 as of April 30, 2010
and April 30, 2009. During fiscal year 2010 and 2009, we did not capitalize
any development costs. No interest was capitalized in fiscal year 2010
or 2009. This asset is held for sale and has been presented accordingly in our
balance sheets as of April 30, 2010 and April 30, 2009.
Note 5. Notes and BVO
Receivable
Notes
Receivable
Southern
Tier Acquisition II, LLC and Oneida Entertainment, LLC
On June
14, 2007, we sold our membership interest of American Racing to two of our
former partners, Southern Tier Acquisition II, LLC (“Southern Tier”) and Oneida
Entertainment , LLC (“Oneida”). At April 30, 2009, we had notes receivable of
$550,000 from both Southern Tier and Oneida. The notes receivable and accrued
interest were paid in full on June 15, 2009.
Notes
Receivable - Development Projects
Big City
Capital, LLC
From time
to time, we make advances to third parties related to the development of
gaming/entertainment projects. We make these advances after undertaking
extensive due diligence. On a quarterly basis, we review each of our notes
receivable to evaluate whether the collection of our note receivable is still
probable. In our analysis, we review the economic feasibility and the current
financial, legislative and development status of the project. If our analysis
indicates that the project is no longer economically feasible, the note
receivable will be written down to its estimated fair value. During fiscal 2008,
we determined that our ability to collect $859,000 of accrued interest and $1.5
million of the original $3.2 million notes receivable from Big City Capital, LLC
(“Big City Capital”) had been impaired. As a result we wrote down the notes
receivable to $1.7 million, by establishing a $1.5 million allowance, and we
wrote off the accrued interest. At April 30, 2010, we had notes receivable of
$1.7 million related to the development of gaming/entertainment projects, net of
a $1.5 million allowance, is represented by notes receivable from Big City
Capital.
The
repayment of these loans will be largely dependent upon the ability to obtain
financing for the development project and/or the performance of the development
project.
Clay
County Holdings, Inc. and Service Interactive, Inc.
40
On May
12, 2008, the Company entered into a settlement agreement with Clay County
Holdings, Inc. (“CCH”), Service Interactive, Inc. (“SI”) and Restaurant
Connections, International (“RCI”). The settlement agreement
terminated CCH and SI’s respective debts to the Company, which combined totaled
approximately $4.6 million, and dismissed our collection lawsuits against CCH
and SI in the District Courts of Harris County, Texas. In exchange, RCI issued a
promissory note in the amount equal to the combined principal and interest owed
to the Company by CCH and SI, CCH cancelled the promissory note from RCI in the
amount of $4 million and RCI issued a new note to CCH in amount of $57,000. In
addition, the Company increased its ownership in RCI from 34% to 56% and
appointed a majority of the Board of Directors. On July 31, 2008, RCI sold its
principal asset, International Restaurant of Brazil, for $5.5
million. On August 12, 2008, the Company received $4.7 million from
RCI as payment in full of the outstanding note and accrued
interest. RCI was dissolved in February, 2009.
BVO Receivable
As of May
2007, we owned a 40% interest in Buena Vista Development Company, LLC (“Buena
Vista Development”) which is developing a casino for a Native American tribe in
Amador County, California. Effective November 25, 2008, through our wholly owned
subsidiary, Nevada Gold BVR, L.L.C., we sold our 40% interest in Buena Vista
Development, L.L.C (BVD) to B.V. Oro, L.L.C. (BVO), which is owned by our former
partner and related parties, for $16 million cash and a $4 million receivable
from BVD which is due no later than two years after the opening of a
gaming/entertainment facility to be built by BVD for the Buena Vista Rancheria
of Me-Wuk Indians. This receivable bears interest at the rate of prime plus 1%
and is guaranteed by our former partner and related parties. In addition we are
entitled to a 5% carried interest in the Class B membership
interest.
Should the facility not be
developed, the collectibility of this receivable cannot be
assured.
Note 6. Long-Term
Debt
Long-Term
Financing Obligations
Our
long-term financing obligations for the fiscal years ended April 30, 2010 and
April 30, 2009 are as follows:
|
April 30,
|
April 30,
|
|||||||
|
2010
|
2009
|
|||||||
|
$6.0
million Promissory Note, 10%, through June 30, 2010 and 11% until maturity
at June 30, 2013
|
$ | 6,000,000 | $ | 6,000,000 | ||||
|
$4.0
million Promissory Note, 7%, maturing May 12, 2012
|
4,000,000 | |||||||
|
Total
|
10,000,000 | 6,000,000 | ||||||
|
Less:
current maturities
|
- | - | ||||||
|
Long-term
debt, less current maturities
|
$ | 10,000,000 | $ | 6,000,000 | ||||
On July
7, 2009, the Company entered into an Amended and Restated Security
Agreement (the “ARSA”), and supporting documents, with its principal lender
which replaces its previous loan agreement with such lender. Pursuant
to the ARSA, the Company extended its long term debt in the principal amount of
$6.0 million and granted a security interest in, and pledged certain
collateral. Interest payments on the amount owed will be made monthly
at an annual rate of 10% through June 2010 and 11% thereafter, with the
principal amount payable on June 30, 2013. Under the terms of the
ARSA, the $6.0 million may only be utilized for future acquisitions by the
Company and may be repaid at any time without penalty. The Company
recorded a loss on extinguishment of debt of $128,834 as a result of the revised
loan agreement, representing the remaining unamortized deferred loan issue
costs. Loan issue costs recorded with the ARSA were $180,000, of
which $37,500 was amortized as of April 30, 2010.
On May
12, 2009, the company entered into a $4.0 million promissory note with Gullwing
III, LLC, the sellers of the three mini-casinos in Washington acquired by the
Company, and the Company granted a security interest in, and pledged certain
collateral. Interest payments on the amount will be made quarterly at
an annual rate of 7%, with the principal amount payable on or before May 12,
2012, without any penalty.
In
addition, the Washington properties have a $150,000 line of credit, of which
$150,000 was unused at April 30, 2010. It has a one year cycle, and
during fiscal 2010 interest of $1,271 was paid on the principal drawn in
2010.
The
aggregate principal payments due on total long-term debt over the next five
fiscal years and thereafter are as follows:
|
Fiscal Year Ending
|
||||
|
2011
|
$ | - | ||
|
2012
|
- | |||
|
2013
|
4,000,000 | |||
|
2014
|
6,000,000 | |||
|
2015
|
- | |||
| $ | 10,000,000 | |||
Note 7. Acquisition
On May
12, 2009, the Company acquired certain assets of Crazy Moose Casino, Inc., Crazy
Moose II, Inc., Coyote Bob’s, Inc., and Gullwing III, LLC for a purchase price
of $15,962,200, including $212,200 of costs directly associated with the
acquisition that were expensed at the end of fiscal year 2009. The acquisition
was financed with cash and a note to the sellers for $4 million. The acquisition
was accounted for as a purchase business combination in accordance with ASC 805.
The purchase price was allocated to the assets acquired based on management’s
estimate of their fair value on the date of acquisition. A summary of
the purchase price allocation as finalized is as follows:
41
|
(000’s)
|
||||
|
Current
assets and payroll liabilities
|
$ | (11 | ) | |
|
Property
and equipment
|
2,400 | |||
|
Customer
Relationships
|
2,951 | |||
|
Trade
names
|
1,862 | |||
|
Noncompete
|
1,018 | |||
|
Goodwill
|
7,530 | |||
|
Purchase
price
|
$ | 15,750 |
Net
revenues of $5,726,000 and results of operations of $1,640,000 have been
included in the consolidated statements of operations since the date of the
acquisition. At April 30, 2010 goodwill acquired was $7,530,000, all of which is
expected to be deductible for tax purposes. Combined net
revenues and results of operations through April 30, 2010 were $22,026,000 and
($6,699,000). As of April 30, 2009, we estimated in proforma statements combined
net revenues of $22,540,000 and combined results of operations of
($4,022,000).
Note 8. Income
Taxes
Deferred
tax assets and liabilities are determined based on the difference between the
financial statement and tax basis of all assets and liabilities, measured by
using the enacted statutory tax rates. Deferred tax assets for net operating
loss carryforwards (“NOLs”) are recorded. As of April 30, 2010, we have
state NOLs of $1,591,984, which expire in 2025.
As of
April 30, 2010 and April 30, 2009 we had deferred tax assets as a result of the
future tax benefit attributable to timing differences, determined by applying
the enacted statutory rate of 34.0%. We recorded a deferred tax asset in
connection with tax credit carryforwards and for compensation expense in
connection with the issuance of stock options, and we recorded a deferred tax
liability for the excess of tax deductible amortization of intangibles over the
recorded amortization for book purposes.
Deferred
tax assets and liabilities at April 30, 2010 and April 30, 2009 are
comprised of the following:
|
April 30, 2010
|
April 30, 2009
|
|||||||
|
Deferred
tax assets:
|
||||||||
|
Net
operating loss carryforwards
|
$ | 47,705 | $ | 39,746 | ||||
|
Fixed
assets
|
432,235 | 583,401 | ||||||
|
Stock
options
|
482,477 | 304,927 | ||||||
|
Impairment
of note receivable and goodwill
|
1,140,633 | 552,917 | ||||||
|
Other
|
52,545 | - | ||||||
|
Total
deferred tax assets
|
2,155,595 | 1,480,991 | ||||||
|
Deferred
tax liabilities:
|
||||||||
|
Amortization
of intangibles
|
(307,176 | ) | (164,709 | ) | ||||
|
Revenue
not recognized for tax reporting and other
|
- | (716,485 | ) | |||||
|
Total
deferred tax liabilities
|
(307,176 | ) | (881,194 | ) | ||||
|
Net
deferred tax assets before valuation allowance
|
1,848,419 | 599,797 | ||||||
|
Valuation
allowance
|
- | - | ||||||
|
Net
deferred tax assets
|
$ | 1,848,419 | $ | 599,797 | ||||
Reconciliations
between the statutory federal income tax expense rate of 34.0% in 2010 and 2009
and our effective income tax rate as a percentage of income before income tax
benefit is as follows:
42
|
Years Ended
|
||||||||||||||||
|
April 30, 2010
|
April 30, 2009
|
|||||||||||||||
|
Percent
|
Dollars
|
Percent
|
Dollars
|
|||||||||||||
|
Income
tax benefit at statutory federal rate
|
(34.0 | ) | $ | (2,564,995 | ) | (34.0 | ) | $ | (2,096,903 | ) | ||||||
|
State
taxes
|
(0.1 | ) | (7,959 | ) | (0.8 | ) | (49,038 | ) | ||||||||
|
Permanent
differences:
|
||||||||||||||||
|
Filed
return to financial statement provision (permanent true-up of book balance
to return)
|
(3.0 | ) | (222,367 | ) | — | — | ||||||||||
|
Change
in valuation allowance and other
|
- | - | 2.7 | 166,716 | ||||||||||||
|
Effective
income tax rate
|
(37.1 | ) | $ | (2,795,321 | ) | (32.1 | ) | $ | (1,979,225 | ) | ||||||
In
addition to our federal income tax return, we file income tax returns in various
state jurisdictions. We are no longer subject to tax examinations by
federal tax authorities prior to 2007 and state authorities for years prior to
2007. The examination of our federal income tax returns for 2007 and
2008 was completed in April, 2010. The results of the audit did not
have a material effect on our financial position or results of
operations. The Company has years 2009 and 2010 remaining subject to
examination by the federal jurisdiction.
Note 9. Equity Transactions, Stock Option
Plan and Warrants
Information
about our share-based plans
Our 1999
Stock Option Plan, as amended (the “Stock Option Plan”), provided for the
granting of awards to our directors, officers, employees and independent
contractors. The Stock Option Plan expired in January, 2009 and was
replaced with a new plan described below. The number of shares of
common stock reserved for issuance under the Stock Option Plan was 3,250,000
shares. The plan was administered by the Compensation Committee (the
“Committee”) of the Board of Directors. The Committee had discretion under the
plan regarding the vesting and service requirements, exercise price and other
conditions
On April
14, 2009, the shareholders of the Company approved the Company’s 2009 Equity
Incentive Plan (the “2009 Plan”). The number of shares with respect
to which awards may be granted under the 2009 Plan is 1,750,000
shares. The 2009 Plan is similar to the 1999 Stock Option Plan in
most respects and continues to provide for awards which may be made subject to
time based or performance based vesting. Under the 2009 Plan the
Committee is authorized to grant the following types of awards:
|
|
·
|
Stock
Options including Incentive Stock Options
(“ISO”)
|
|
|
·
|
Options
not intended to qualify as ISO’s
|
|
|
·
|
Stock
Appreciation Rights
|
|
|
·
|
Restricted
Stock Grants.
|
To date,
the Committee has only awarded stock options and restricted stock under both
plans. Our practice has been to issue new shares upon the exercise of stock
options. Stock option rights granted prior to fiscal year 2006 under the Stock
Option Plan generally have 5-year terms and are fully vested and exercisable
immediately. Subsequent option rights granted generally have 3, 5 or 10 year
terms and vest in three or five equal annual installments, with some
options grants providing for immediate vesting for a portion of the
grant.
A summary
of activity under the Company’s share-based payment plans for the years ended
April 30, 2010 and April 30, 2009 is presented below:
43
|
Average
|
Remaining
|
Aggregate
|
||||||||||||||
|
Exercise
|
Contractual
|
Intrinsic
|
||||||||||||||
|
Shares
|
Price
|
Term (Year)
|
Value
|
|||||||||||||
|
Outstanding
at April 27, 2008
|
1,334,000 | $ | 3.93 | |||||||||||||
|
Granted
|
30,000 | 0.78 | ||||||||||||||
|
Exercised
|
- | |||||||||||||||
|
Forfeited
or expired
|
(228,000) | 10.45 | ||||||||||||||
|
Outstanding
at April 30, 2009
|
1,136,000 | $ | 2.54 | 3.86 | $ | - | ||||||||||
|
Exercisable
at April 30, 2009
|
765,992 | $ | 2.96 | 4.15 | $ | - | ||||||||||
|
Outstanding
at April 30, 2009
|
1,136,000 | $ | 2.54 | |||||||||||||
|
Granted
|
430,000 | 1.25 | ||||||||||||||
|
Exercised
|
- | |||||||||||||||
|
Forfeited
or expired
|
(110,000) | 7.70 | ||||||||||||||
|
Outstanding
at April 30, 2010
|
1,456,000 | $ | 1.77 | 4.93 | $ | - | ||||||||||
|
Exercisable
at April 30, 2010
|
1,326,000 | $ | 1.76 | 5.04 | $ | - | ||||||||||
The
weighted-average grant-date fair value of options granted during the years ended
April 30, 2010, and April 30, 2009 was $1.07 and $0.53, respectively. There were
no stock options or warrants exercised during the years ended April 30, 2010,
and April 30, 2009. As of April 30, 2010, there was a total of
$24,829 of unamortized compensation cost related to stock options, which cost is
expected to be recognized over a weighted-average of approximately
1.0 year.
Compensation
cost for stock options was based on the fair value of each award, measured by
applying the Black-Scholes model on the date of grant, using the following
weighted-average assumptions:
|
Year Ended
|
Year Ended
|
|||||||
|
April 30, 2010
|
April 30, 2009
|
|||||||
|
Expected
volatility
|
143.5 | % | 127.8 | % | ||||
|
Expected
term (years)
|
4.00 | 2.50 | ||||||
|
Expected
dividend yield
|
- | - | ||||||
|
Risk-free
interest rate
|
1.63 | % | 1.40 | % | ||||
Expected
volatility is based on historical volatility of our stock over a preceding
period commensurate with the expected term of the option. The expected
volatility considers factors such as the volatility of our share price. The
risk-free rate for the expected term of the option is based on the U.S. Treasury
yield curve in effect at the time of grant. Expected dividend yield was not
considered in the option pricing formula since we historically have not paid
dividends and have no current plans to do so in the future.
44
Treasury
Stock
During
the fiscal year ended April 30, 2010, we repurchased 175,000 shares of our stock
in a private transaction at the prevailing market price of $0.87 per
share. We did not repurchase any shares during fiscal year
2009.
Note
10. Earnings Per Share
The
following is presented as a reconciliation of the numerators and denominators of
basic and diluted earnings per share computations, in accordance with SFAS No.
128:
|
Fiscal Year Ended
|
||||||||
|
April 30,
2010
|
April 30,
2009
|
|||||||
|
Numerator:
|
||||||||
|
Basic:
|
||||||||
|
Net
loss available to common stockholders
|
$ | (4,748,782 | ) | $ | (4,188,136 | ) | ||
|
Diluted:
|
||||||||
|
Net
loss available to common stockholders
|
$ | (4,748,782 | ) | $ | (4,188,136 | ) | ||
|
Denominator:
|
||||||||
|
Basic
weighted average number of common shares
|
||||||||
|
outstanding
|
12,878,240 | 12,939,130 | ||||||
|
Diluted
weighted average number of common shares
|
||||||||
|
outstanding
|
12,878,240 | 12,939,130 | ||||||
|
Loss
per share:
|
||||||||
|
Net
loss per common share – basic
|
$ | (.37 | ) | $ | (.32 | ) | ||
|
Net
loss per common share - diluted
|
$ | (.37 | ) | $ | (.32 | ) | ||
For
fiscal years 2010 and 2009, potential dilutive common shares issuable under
options of 1,456,000 and 1,136,000 were not included in the calculation of
diluted earnings per share as they were anti-dilutive.
Note 11. Other
Assets
Other
assets consisted of the following at April 30, 2010 and April 30,
2009:
|
April 30,
2010
|
April 30,
2009
|
|||||||
|
Accrued
interest receivable
|
$ | 234,438 | $ | 167,731 | ||||
|
American
Heritage Receivable, net of allowance
|
- | 1,597,183 | ||||||
|
Deferred
loan issue cost, net
|
142,500 | 150,306 | ||||||
|
Other
assets
|
$ | 376,938 | $ | 1,915,220 | ||||
The
American Heritage settlement agreement pertains to reclassing a portion of our
equity investment in Route 66 after considering a $2.3 million intial reclass to
accounts receivable for amounts allocated from our investment in Route
66. This amount represents the remaining equity investment in Route
66 that is now considered a receivable. Per the settlement agreement executed in
April 2008, the Gillmann Group was scheduled to pay us $2.3 million on or before
April 15, 2010. Due to the uncertainty of the collectability of the settlement,
Management elected to set up a valuation allowance equal to the remaining equity
investment.
45
Note 12. Segment
Reporting
We
operate in two major business segments (i) gaming and (ii) non-core. The gaming
segment as of and for the fiscal year ended April 30, 2010, consists of
the Colorado Grande Casino and our three mini-casinos in Washington.
The gaming segment as of and for the fiscal year ended April 30, 2009 consists
of the Colorado Grande and Buena Vista Development.
Summarized
financial information for our reportable segments is shown in the following
table. The “Non-Core” column includes corporate-related items, results of
insignificant operations, and segment profit (loss) and income and expenses not
allocated to reportable segments.
|
As of and for the Fiscal Year Ended
April 30, 2010
|
||||||||||||
|
Gaming
|
Non-Core
|
Totals
|
||||||||||
|
Gross
revenues
|
$ | 24,843,876 | $ | — | $ | 24,843,876 | ||||||
|
Segment
loss (pre tax)
|
(7,534,145 | ) | (9,958 | ) | (7,544,103 | ) | ||||||
|
Segment
assets
|
26,867,321 | 3,582,431 | 30,449,752 | |||||||||
|
Depreciation
and amortization
|
1,340,114 | 4,209 | 1,344,323 | |||||||||
|
Additions
to property and equipment
|
15,766,715 | — | 15,766,715 | |||||||||
|
Interest
expense
|
866,034 | — | 866,034 | |||||||||
|
Interest
income
|
192,708 | — | 192,708 | |||||||||
|
Income
tax benefit
|
(2,791,631 | ) | (3,690 | ) | (2,795,321 | ) | ||||||
|
As of and for the Fiscal Year Ended
April 30, 2009
|
||||||||||||
|
Gaming
|
Non-Core
|
Totals
|
||||||||||
|
Gross
revenues
|
$ | 7,294,763 | $ | — | $ | 7,294,763 | ||||||
|
Segment
loss
|
(6,150,243 | ) | (17,118 | ) | (6,167,361 | ) | ||||||
|
Segment
assets
|
16,153,018 | 3,595,258 | 19,748,276 | |||||||||
|
Depreciation
and amortization
|
622,290 | 5,328 | 627,618 | |||||||||
|
Additions
to property and equipment
|
379,296 | — | 379,296 | |||||||||
|
Interest
expense
|
1,307,296 | — | 1,307,296 | |||||||||
|
Interest
income
|
975,490 | — | 975,490 | |||||||||
|
Income
tax benefit
|
(1,973,731 | ) | (5,494 | ) | (1,979,225 | ) | ||||||
|
Loss
from Buena Vista Development, L.L.C.
|
(7,863 | ) | — | (7,863 | ) | |||||||
|
Reconciliation
of reportable segment assets to our consolidated totals is as
follows:
|
||||||||
|
April
30,
|
April
30,
|
|||||||
|
2010
|
2009
|
|||||||
|
Total
assets for reportable segments
|
$ | 30,449,752 | $ | 19,748,276 | ||||
|
Cash
not allocated to segments
|
8,422,674 | 19,834,544 | ||||||
|
Other
assets not allocated to segments
|
3,598,793 | 2,472,166 | ||||||
|
Total
assets
|
$ | 42,471,219 | $ | 42,054,986 | ||||
Note
13. 401(k) Plan
We have a
401(k) plan under which employees 21 years of age or older qualify for
participation. Participants are permitted to make contributions to the plan on a
pre-tax salary reduction basis in accordance with the provisions of Section
401(k) of the Internal Revenue Code. All such contributions are immediately
vested and nonforfeitable. Under the provisions of the plan, we may make
discretionary matching contributions of 100% of employee contributions up to 3%
of employees' compensation and 50% of up to the next 2% of employees'
compensation. Employees vest in Company contributions immediately. Our
discretionary contributions for fiscal years 2010 and 2009, were $54,756 and
$70,086, respectively.
Note 14. Related Party
Transactions
None.
46
Note 15. Commitments and
Contingencies
We rent
office space in Houston, Texas, under a non-cancelable operating lease which
expires on March 31, 2011. Also, we lease (through our wholly-owned subsidiary,
Colorado Grande Enterprises, Inc.) a portion of a building in Cripple Creek,
Colorado, and an adjacent parking lot, for use in connection with the Colorado
Grande Casino facilities. We lease this property at an annual rent of the
greater of $144,000 or 5% of Colorado Grande-Cripple Creek’s adjusted gross
gaming revenues, as defined, with an annual cap of $400,000. This lease is for
an initial term of sixteen years with an option to renew for fifteen years with
the final option period concluding January 31, 2021. On July 7, 2005, we
exercised the option to extend the lease to January 2021. On April 1, 2008 we
extended the lease to January 2033 at a flat annual rent of $400,000 from
February 2021 through January 2033.
As a
result of acquiring facilities in Washington, the Crazy Moose II Mountlake
Terrace has a building lease which expires May, 2011 with an annual rent of
$192,000, with an option to renew for one five year term. The
administrative office has a lease which expires February, 2011 with an option to
renew for two additional terms. The annual rent is
$28,800. In addition, the Crazy Moose I Pasco has a parking lot lease
which expires January, 2011 with an annual rent of $6,300.
The
expected remaining future annual minimum lease payments as of April 30, 2010 are
as follows:
|
Fiscal Years
|
Corporate Office
Lease Payment
|
Washington Casino
Lease Payment
|
Colorado Grande
Building Lease
Payment
|
Total
Lease Payment
|
||||||||||||
|
|
|
|
||||||||||||||
|
2011
|
$ | 95,261 | $ | 220,725 | $ | 400,000 | $ | 715,986 | ||||||||
|
2012
|
-- | 16,000 | 400,000 | 416,000 | ||||||||||||
|
2013
|
-- | -- | 400,000 | 400,000 | ||||||||||||
|
2014
|
-- | -- | 400,000 | 400,000 | ||||||||||||
|
2015
|
-- | -- | 400,000 | 400,000 | ||||||||||||
|
Thereafter
|
-- | -- | 7,100,000 | 7,100,000 | ||||||||||||
| $ | 95,261 | $ | 236,725 | $ | 9,100,000 | $ | 9,431,986 | |||||||||
Rent
expense for our corporate office for fiscal years 2010 and 2009 was $123,153 and
$106,021, respectively. Rent expense for Colorado Grande’s casino building was
$309,192 and $252,013 for fiscal years 2010 and 2009, respectively.
We
continue to pursue additional development opportunities that may require,
individually and in the aggregate, significant commitments of capital,
extensions of credit, up-front payments to third parties and guarantees by the
Company of third-party debt.
We
indemnified our officers and directors for certain events or occurrences while
the director or officer is or was serving at our request in such capacity. The
maximum potential amount of future payments we could be required to make under
these indemnification obligations is unlimited; however, we have a Directors and
Officers Liability Insurance policy that limits our exposure and enables us to
recover a portion of any future amounts paid, provided that such insurance
policy provides coverage.
Note 16. Legal
Proceedings
Route
66 Casinos
On April
15, 2008, the Company entered into a Settlement Agreement and Release
(“Settlement Agreement”) with American Heritage, Inc. (“AHI”) and Frederick C.
Gillmann (“Gillmann”). AHI and Gillmann are referred to collectively as the “AHI
Parties”. The Settlement Agreement constitutes a full and final settlement of
the Route 66 Casinos litigation subject to the performance of the AHI
Parties.
Pursuant
to the terms of the Settlement Agreement:
| 1. | The AHI Parties agreed to pay $1.0 million to the Company on May 1, 2008; | |
|
|
2.
|
The
AHI Parties agreed to pay $1.3 million to the Company on May 31,
2008;
|
|
|
3.
|
The
AHI Parties agreed to pay $2.3 million to the Company no later than April
15, 2010.
|
Contemporaneously
with the execution of the Settlement Agreement, the AHI Parties assigned certain
collateral as security for the payment obligations described above.
Also,
contemporaneously with the execution of the Settlement Agreement, the AHI
Parties executed an agreed final and non-appealable judgment in favor of the
Company and against AHI and Gillmann, jointly and severally in the amount of
$9,425,602 (the “Agreed Judgment”). The Company agreed not to enforce the Agreed
Judgment unless and until the AHI Parties failed to perform any of their
obligations under the Settlement Agreement.
47
As of
April 30, 2010, the payment of $1.0 million due on May 1, 2008 and the payment
of $1.3 million due on May 31, 2008 have been received. No payment
was received in April, 2010 and the Company elected to set a valuation allowance
against the remaining net $1.6 million on the books. Subsequent to
April 30, 2010, the company has exercised its options to enforce the Agreed
Judgment against the Gillman Group.
Note 17. Quarterly Financial Information
(Unaudited)
The
following table sets forth certain quarterly financial information for each of
the fiscal quarters during the years ended April 30, 2010 and April 30,
2009.
|
Net
loss
|
Diluted
|
|||||||||||||||||||
|
Loss
from
|
applicable
to
|
loss
per
|
||||||||||||||||||
|
unconsolidated
|
Loss
before
|
to
common
|
per
common
|
|||||||||||||||||
|
Net
revenues
|
affiliates
|
tax
benefit
|
stockholders
|
share
(b)
|
||||||||||||||||
|
Consolidated
Statements of Operations:
|
(in thousands, except per share amounts) | |||||||||||||||||||
|
Fiscal
Year ended April 30, 2010
|
||||||||||||||||||||
|
Quarter
ended July 31, 2009
|
$ | 5,057 | $ | - | $ | (1,040 | ) | $ | (701 | ) | $ | (0.05 | ) | |||||||
|
Quarter
ended October 31, 2009
|
5,740 | - | (708 | ) | (444 | ) | (0.03 | ) | ||||||||||||
|
Quarter
ended January 31, 2010
|
5,206 | - | (877 | ) | (546 | ) | (0.04 | ) | ||||||||||||
|
Quarter
ended April 30, 2010
|
6,023 | - | (4,919 | )(a) | (3,058 | ) | (0.24 | ) | ||||||||||||
|
Fiscal
Year ended April 30, 2009
|
||||||||||||||||||||
|
Quarter
ended July 31, 2008
|
$ | 1,620 | $ | (4 | ) | $ | (1,331 | ) | $ | (826 | ) | $ | (0.06 | ) | ||||||
|
Quarter
ended October 31, 2008
|
1,498 | (4 | ) | (2,377 | )(c) | (1,621 | ) | (0.13 | ) | |||||||||||
|
Quarter
ended January 31, 2009
|
1,370 | - | (707 | ) | (467 | ) | (0.04 | ) | ||||||||||||
|
Quarter
ended April 30, 2009
|
1,380 | - | (1,752 | ) | (1,274 | ) | (0.09 | ) | ||||||||||||
(a)
In the fourth quarter 2010, we wrote down Colorado Grande’s goodwill by $2.75
million and set a valuation allowance against the American Heritage/Route 66
receivable in the amount of $1.6 million.
(b)
Because income per share amounts are calculated using the weighted average
number of common and dilutive common equivalent shares outstanding during each
quarter, the sum of the per share amounts for the four quarters may not equal
the total income per share amounts for the year.
(c) During
the second quarter of fiscal 2009, we wrote off a $1.2 million investment in
Horizon Casino in Vicksburg, Mississippi.
Note 18. Subsequent Event
Acquisition
On July
23, 2010, the Company acquired six additional casinos, and their related
operating center, in the state of Washington. The casinos are the Silver Dollar
Seatac, the Silver Dollar Renton, the Silver Dollar Mill Creek, Club Hollywood,
located in Shoreline, the Royal Casino, located in Everett, and the Golden
Nugget Casino, located in Tukwila, collectively “Silver Dollar Casinos”. All of
the casinos are located in western Washington. The Company acquired
the six casinos through bankruptcy proceedings. The casinos were
previously owned by subsidiaries of Evergreen Gaming Corporation, a British
Columbia Corporation, which is under bankruptcy court protection. The
Company purchased the six casinos from Grant-Thornton, Ltd., (the “Receivers”),
in its capacity as a court-appointed receiver for Big Nevada, Inc., Gameco,
Inc., Gaming Consultants, Inc., Gaming Management, Inc., Golden Nugget Tukwila,
Hollydrift Gaming, Inc., Little Nevada, Inc., Mill Creek Gaming, Inc., Royal
Casino Holdings, Inc., and Silver Dollar Mill Creek, Inc., for $11.07
million, $6.0 million which was paid in cash to the Receiver and $5.07 million
financed pursuant to a credit agreement between NG Washington II Holdings, LLC.,
the Company’s wholly owned subsidiary, and Fortress Credit Corp., as an agent
for the lenders. Two promissory notes, issued pursuant to the credit
agreement, are due July 23, 2012, and bear an interest rate based on the 30 day
LIBOR at the end of each calendar month, plus 9%, with a 30 day LIBOR floor of
2.0%. Interest is due monthly. The terms of the
credit agreement contain, among others, customary events of default, including
nonpayment when due of principal or any interest or fees or other amounts owing
within specified grace periods, and failure to comply with certain affirmative
or negative covenants, including certain financial covenants.
48
The
following pro-forma combined balance sheet and statement of operations of the
Company and Silver Dollar Casinos are presented to give effect to the
acquisition, excluding Silver Dollar Casinos assets and operating results that
were not acquired, as if it occurred April 30, 2010 with respect to the balance
sheet and May 1, 2009, with respect to the statement of
operations. Although we believe that the unaudited financial
information provided to the Company by the Sellers are reasonably accurate, any
and all of the pro-forma statements in this report and any other public
statements that are made may prove to be incorrect. This may occur as
a result of inaccurate information provided by the Sellers or a consequence of
known or unknown risks and uncertainties. Consequently, actual
numbers may differ materially from those presented in the pro-forma
statements. In light of these and other uncertainties, you should not
regard the inclusion of the pro-forma statements in this report or other public
communications that the Company might make as a representation of audited
financial information, and you should not place undue reliance on such pro-forma
statements.
49
Nevada
Gold & Casinos, Inc.
Pro-forma Balance Sheet as
of the Fiscal Year Ended April 30, 2010
|
Nevada Gold
As reported in
Form 10-K
|
Acquired
Silver
Dollar
Casinos
at
April
30, 2010
(Unaudited)
|
Pro-forma
Adjustments
|
Pro-forma
Balance Sheet
|
|||||||||||||
|
ASSETS
|
||||||||||||||||
|
Current
assets:
|
||||||||||||||||
|
Cash
and cash equivalents
|
$ | 3,155,736 | $ | 1,954,204 | $ | 5,109,940 | ||||||||||
|
Restricted
cash
|
5,266,938 | - | (5,000,000 | ) | 266,938 | |||||||||||
|
Accounts
receivable
|
66,822 | - | 66,822 | |||||||||||||
|
Prepaid
expenses
|
475,262 | (1,480 | ) | 473,782 | ||||||||||||
|
Income
tax receivable
|
1,750,374 | - | 1,750,374 | |||||||||||||
|
Other
current assets
|
155,796 | 161,568 | 70,000 | 387,364 | ||||||||||||
|
Total
current assets
|
10,870,928 | 2,114,292 | (4,930,000 | ) | 8,055,220 | |||||||||||
|
Investments
in development projects
|
1,418,789 | (1,273,649 | ) | 145,140 | ||||||||||||
|
Investments
in development projects held for sale
|
3,437,932 | 3,437,932 | ||||||||||||||
|
Notes
receivable - development projects, net of current portion
|
1,700,000 | 1,700,000 | ||||||||||||||
|
Goodwill
|
10,243,362 | - | 3,993,643 | 14,237,005 | ||||||||||||
|
Identifiable
intangible assets, net of accumulated amortization of $729,000 at April
30, 2010
|
5,101,800 | 3,382,851 | 8,484,651 | |||||||||||||
|
Property
and equipment, net of accumulated depreciation of $2,978,679 at April 30,
2010
|
3,473,051 | 1,888,863 | 5,361,914 | |||||||||||||
|
Deferred
tax asset
|
1,848,419 | - | - | 1,848,419 | ||||||||||||
|
BVO
receivable
|
4,000,000 | - | - | 4,000,000 | ||||||||||||
|
Other
assets, net of allowances
|
376,938 | - | - | 376,938 | ||||||||||||
|
Total
assets
|
$ | 42,471,219 | $ | 4,003,155 | 1,172,845 | $ | 47,647,219 | |||||||||
|
LIABILITIES
AND STOCKHOLDERS’ EQUITY
|
||||||||||||||||
|
Current
liabilities:
|
||||||||||||||||
|
Accounts
payable and accrued liabilities
|
$ | 1,060,017 | $ | 106,000 | $ | - | $ | 1,166,017 | ||||||||
|
Accrued
interest payable
|
70,000 | - | - | 70,000 | ||||||||||||
|
Other
accrued liabilities
|
687,819 | - | - | 687,819 | ||||||||||||
|
Total
current liabilities
|
1,817,836 | 106,000 | - | 1,923,836 | ||||||||||||
|
Long-term
debt, net of current portion and discount
|
10,000,000 | - | 5,070,000 | 15,070,000 | ||||||||||||
|
Other
liabilities
|
30,944 | - | - | 30,944 | ||||||||||||
|
Total
liabilities
|
11,848,780 | 106,000 | 5,070,000 | 17,024,780 | ||||||||||||
|
Commitments
and contingencies
|
-- | -- | ||||||||||||||
|
Stockholders'
equity:
|
||||||||||||||||
|
Common
stock, $0.12 par value per share; 50,000,000 shares authorized; 13,935,330
shares issued and 12,764,130 shares outstanding at April 30,
2010
|
1,672,240 | - | - | 1,672,240 | ||||||||||||
|
Additional
paid-in capital
|
19,859,966 | - | - | 19,859,966 | ||||||||||||
|
Retained
earnings
|
19,464,972 | 3,897,155 | (3,897,155 | ) | 19,464,972 | |||||||||||
|
Treasury
stock, 1,171,200 shares at April 30, 2010, at cost
|
(10,369,200 | ) | (10,369,200 | ) | ||||||||||||
|
Accumulated
other comprehensive loss
|
(5,539 | ) | - | (5,539 | ) | |||||||||||
|
Total
stockholders' equity
|
30,622,439 | 3,897,155 | (3,897,155 | ) | 30,622,439 | |||||||||||
|
Total
liabilities and stockholders' equity
|
$ | 42,471,219 | $ | 4,003,155 | $ | 1,172,845 | $ | 47,647,219 | ||||||||
50
Pro-forma Statement of
Operations for the Fiscal Year Ended April 30, 2010
|
Nevada Gold
As reported in
Form 10-K
|
Operating
results of
the acquired
Silver Dollar
Casinos
for the twelve
months ended
April 30, 2010
(unaudited)
|
Pro-forma
Adjustments
|
Pro-forma Stmt
of Operations
|
|||||||||||||
|
Revenues:
|
||||||||||||||||
|
Casino
|
$ | 18,822,900 | $ | 26,396,282 | $ | - | $ | 45,219,182 | ||||||||
|
Food
and beverage
|
4,534,744 | 7,163,821 | - | 11,698,565 | ||||||||||||
|
Other
|
865,264 | 1,378,624 | - | 2,243,888 | ||||||||||||
|
Management
fees
|
620,968 | - | - | 620,968 | ||||||||||||
|
Gross
revenues
|
24,843,876 | 34,938,727 | - | 59,782,603 | ||||||||||||
|
Less
promotional allowances
|
(2,817,888 | ) | (3,905,435 | ) | - | (6,723,323 | ) | |||||||||
|
Net
revenues
|
22,025,988 | 31,033,292 | - | 53,059,280 | ||||||||||||
|
Operating
expenses:
|
||||||||||||||||
|
Casino
|
8,562,284 | 16,566,625 | - | 25,128,909 | ||||||||||||
|
Food
and beverage
|
2,851,635 | 5,713,201 | - | 8,564,836 | ||||||||||||
|
Marketing
and administrative
|
5,564,288 | 601,663 | - | 6,165,951 | ||||||||||||
|
Facility
|
1,070,933 | 3,088,285 | - | 4,159,218 | ||||||||||||
|
Corporate
expense
|
4,216,475 | 2,323,592 | - | 6,540,067 | ||||||||||||
|
Legal
expenses
|
241,468 | 1,850 | - | 243,318 | ||||||||||||
|
Depreciation
and amortization
|
1,344,323 | 640,816 | 296,304 | 2,281,443 | ||||||||||||
|
Impairment
of assets
|
4,347,183 | - | - | 4,347,183 | ||||||||||||
|
Write-off
of project development cost
|
50,486 | - | - | 50,486 | ||||||||||||
|
Other
|
476,395 | 503,030 | - | 979,425 | ||||||||||||
|
Total
operating expenses
|
28,725,470 | 29,439,062 | 296,304 | 58,460,836 | ||||||||||||
|
Operating
income (loss)
|
(6,699,482 | ) | 1,594,230 | (296,304 | ) | (5,401,556 | ) | |||||||||
|
Non-operating
income (expenses):
|
||||||||||||||||
|
Gain
(loss) on sale of equity investees and assets
|
16,511 | (5,173 | ) | - | 11,338 | |||||||||||
|
Interest
income
|
192,708 | - | (10,721 | ) | 181,987 | |||||||||||
|
Interest
expense
|
(866,034 | ) | - | (557,700 | ) | (1,423,734 | ) | |||||||||
|
Amortization
of loan issue costs
|
(58,972 | ) | - | - | (58,972 | ) | ||||||||||
|
Loss
on extinguishment of debt
|
(128,834 | ) | - | - | (128,834 | ) | ||||||||||
|
Income
(loss) before income tax expense (benefit)
|
(7,544,103 | ) | 1,589,057 | (864,725 | ) | (6,819,771 | ) | |||||||||
|
Income
tax expense (benefit)
|
||||||||||||||||
|
Current
|
(1,546,698 | ) | 37,400 | 246,273 | (1,263,025 | ) | ||||||||||
|
Deferred
and change in valuation allowance
|
(1,248,623 | ) | - | - | (1,248,623 | ) | ||||||||||
|
Total
income tax expense (benefit)
|
(2,795,321 | ) | 37,400 | 246,273 | (2,511,648 | ) | ||||||||||
|
Net
income (loss)
|
$ | (4,748,782 | ) | $ | 1,551,657 | $ | (1,110,998 | ) | $ | (4,308,123 | ) | |||||
|
Per
share information:
|
||||||||||||||||
|
Net
income (loss) per common share - basic
|
$ | (0.37 | ) | $ | 0.12 | $ | (0.09 | ) | $ | (0.33 | ) | |||||
|
Net
income (loss) per common share - diluted
|
$ | (0.37 | ) | $ | 0.12 | $ | (0.09 | ) | $ | (0.33 | ) | |||||
|
Basic
weighted average number of shares outstanding
|
12,878,240 | 12,878,240 | 12,878,240 | 12,878,240 | ||||||||||||
|
Diluted
weighted average number of shares outstanding
|
12,878,240 | 12,878,240 | 12,878,240 | 12,878,240 | ||||||||||||
51
Nevada
Gold & Casinos, Inc.
Pro-forma Balance Sheet as
of the Fiscal Year Ended April 30, 2010
Pro-forma adjustments to
give effect to the acquisition as if it occurred April 30, 2010 (the last day of
fiscal 2010)
To give effect to the
acquisition as if it occurred April 30, 2010 (last day of fiscal
2010)
|
Restricted
cash
|
5,000,000 |
Remaining
cash to be paid for acquisition
|
|||||||
|
Long-term
debt, net of current portion
|
5,070,000 |
New
credit agreement
|
|||||||
|
Investments
in development projects
|
1,273,649 |
Reclass
|
|||||||
|
Memorabilia
inventory
|
70,000 |
Hollywood
Casino memorabilia
|
|||||||
|
Customer
relationships
|
2,074,131 |
Used
same % as NGWA acquisition
|
|||||||
|
Trade
names
|
1,308,720 |
Used
same % as NGWA acquisition
|
|||||||
|
Retained
earnings
|
3,897,155 |
Eliminate
remaining Retained Earnings of
|
|||||||
|
Goodwill
|
3,993,643 |
Silver
Dollar Casinos
|
|||||||
52
Pro-forma adjustments to
give effect to the acquisition as if it occurred as of May 1, 2009 (the first
day of fiscal 2010)
|
Debit
|
Credit
|
|||||||
|
Reduce interest income for the use of cash to
purchase casinos for one year at 0.18%
|
||||||||
|
Interest
income
|
10,800 | |||||||
|
Cash
|
10,800 | |||||||
|
To account for interest expense on $5,070,000
long-term debt at 11.0%
|
||||||||
|
Interest
expense
|
557,700 | |||||||
|
Cash
|
557,700 | |||||||
|
To amortize Customer Relationship intangible asset
over 7 years
|
||||||||
|
Amortization
of intangible assets expense
|
296,304 | |||||||
|
Accumulated
amortization of intangible assets
|
296,304 | |||||||
|
To account for interest on $1 million deposit made
to acquire casinos for 16 days at 0.18%
|
||||||||
|
Cash
|
79 | |||||||
|
Interest
income
|
79 | |||||||
|
To account for Federal income tax at 34% of
pro-forma pre-tax operating adjustments
|
||||||||
|
Income
tax receivable
|
294,007 | |||||||
|
Income
tax expense-current
|
294,007 | |||||||
|
To account for Federal income tax at 34% of
pre-tax operating results of acquired casinos
|
||||||||
|
Income
tax expense-current
|
540,279 | |||||||
|
Income
tax receivable
|
540,279 | |||||||
53