Attached files
| file | filename |
|---|---|
| 8-K - FORM 8-K - SOUTHWEST BANCORP INC | y85794e8vk.htm |
EXHIBIT 99

| Keefe, Bruyette & Woods 2010 Community Bank Conference July 27-28, 2010 (NASDAQ-OKSB) |

| Corporate Profile 1 A regional community banking company with $3.0 billion in assets, $2.5 billion in total loans, $2.4 billion in deposits, and $338 million in common equity at June 30, 2010 Bank holding company for Stillwater National Bank and Trust Company (established in 1894) and Bank of Kansas (purchased in 2007) IPO in 1993 Healthcare and commercial lending niche provider with proven business models Banking offices: Oklahoma, 11 Texas, 6 Kansas, 8 |
| Forward Looking Statements 2 Forward Looking Statements This presentation includes forward-looking statements such as: statements of Southwest's goals, intentions, and expectations; estimates of risks and of future costs and benefits; expectations regarding future financial performance of Southwest and its operating segments; assessments of loan quality, probable loan losses, and the amount and timing of loan payoffs; liquidity, contractual obligations, off-balance sheet risk, and market or interest rate risk; estimates of value of acquired assets, deposits, and other liabilities; and statements of Southwest's ability to achieve financial and other goals. These forward-looking statements are subject to significant uncertainties because they are based upon: the amount and timing of future changes in interest rates, market behavior, and other economic conditions; future laws, regulations, and accounting principles; and a variety of other matters. Because of these uncertainties, the actual future results may be materially different from the results indicated by these forward-looking statements. In addition, Southwest's past growth and performance do not necessarily indicate its future results. |

| 3 Total Loans As of year-end except 2010 which is as of June 30 Dollars in Billions Non-scheduled payments began slowing in the first quarter of 2008. The volume of new originations was reduced. Loans originated prior to 2008 continued to advance. Outstanding loans are now decreasing. |

| Recap of Nonperforming Assets & Potential Problem Loans 12/31/08 3/31/09 6/30/09 9/30/09 12/31/09 3/31/10 6/30/10 Other Real Estate 6.1 5.4 6 6.4 18.4 18.8 27.6 Nonperforming Loans 64 83.9 82.6 105.3 106.2 103.5 117.7 Potential Problem Loans 131.5 133.8 178.1 255.1 258.4 275.9 242.2 Dollars in Millions 4 Excludes covered loans and properties Nonperforming loans include non-accruals, 90 days past due loans, and trouble debt restructure. $201.6 $223.1 $266.7 $366.8 $398.2 $387.5 $383.0 |
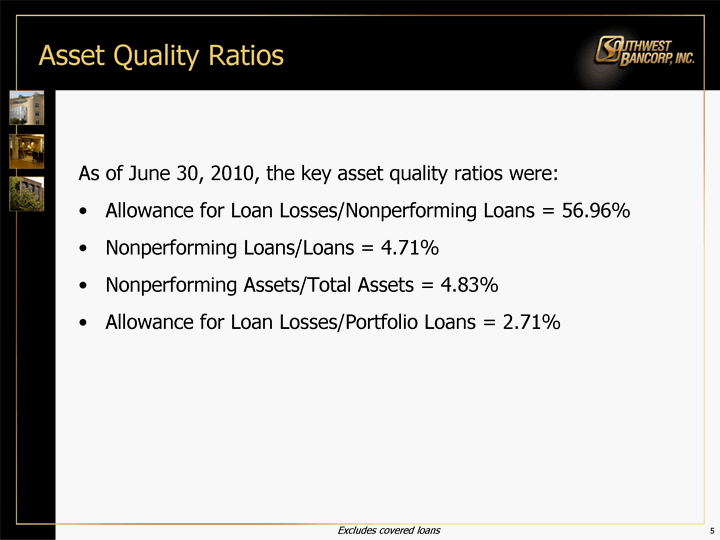
| Asset Quality Ratios As of June 30, 2010, the key asset quality ratios were: Allowance for Loan Losses/Nonperforming Loans = 56.96% Nonperforming Loans/Loans = 4.71% Nonperforming Assets/Total Assets = 4.83% Allowance for Loan Losses/Portfolio Loans = 2.71% Excludes covered loans 5 |

| Nonperforming Loans Consumer Commercial Real Estate Residential Real Estate Construction & Development Student Loans Commercial & Industrial 0.26 25.414 8.842 75.079 0 8.139 NPL by Type NPL by Location $117.7 Million Total Nonperforming Loans (6/30/10) Dollars in Millions 6 Nonperforming loans include non-accruals, 90 days past due loans, and trouble debt restructure. Excludes covered loans |

| Potential Problem Loans 12/31/2008 3/31/2009 6/30/2009 9/30/2009 12/31/2009 3/31/2010 6/30/2010 East 131.5 133.8 178.1 255.1 258.4 275.9 242.2 Dollars in Millions 7 All potential problem loans are currently performing but have higher risk elements. Excludes covered loans |
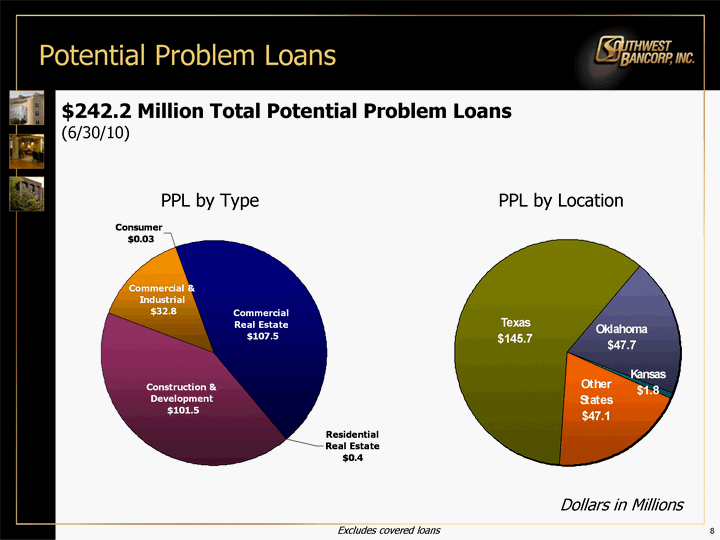
| 8 Potential Problem Loans $242.2 Million Total Potential Problem Loans (6/30/10) Consumer Commercial Real Estate Residential Real Estate Construction & Development Student Loans Commercial & Industrial 0.027 107.54 0.354 101.455 0 32.843 PPL by Type PPL by Location Dollars in Millions Excludes covered loans |

| 9 Proven Ability to Resolve Credits Majority of loans secured Loans generally are guaranteed by borrowing entity owners (corporately and individually) Cashflows from entities are assigned Net loss occurs only after orderly liquidation/bankruptcy High % of debt collected |

| 10 Risk Trends Allowance for Loan Losses to Portfolio Loans Net Charge-offs/Portfolio Loans Excludes covered loans 1st Half *Annualized * |

| Allowance for Loan Losses & Nonperforming Loans 12/31/08 3/31/09 6/30/09 9/30/09 12/31/09 3/31/10 6/30/10 Allowance for Loan Losses 39.773 46.262 51.753 57.777 62.413 65.2 67.1 Nonperforming Loans 63.983 83.935 82.614 105.294 106.197 103.5 117.7 Dollars in Millions 11 Excludes covered loans Nonperforming loans include non-accruals and 90 days past due loans. |
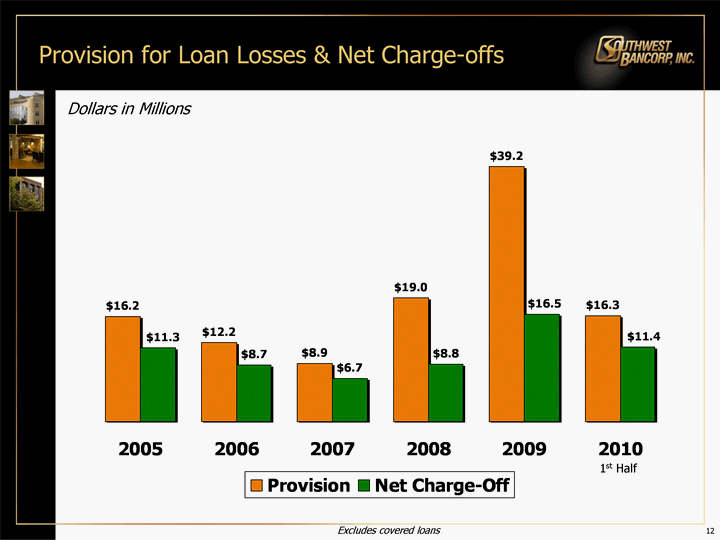
| Provision for Loan Losses & Net Charge-offs 2005 2006 2007 2008 2009 2010 Provision 16.155 12.187 8.947 18.979 39.176 16.3 Net Charge-Off 11.334 8.706 6.656 8.79 16.536 11.4 Dollars in Millions 12 Excludes covered loans 1st Half |

| 13 Loan Segmentation $2.5 Billion Total Loans (6/30/2010) Consumer Commercial Real Estate Residential Real Estate Construction & Development Student Loans Commercial & Industrial 39 1252 107 625 7 471 Loans by Type Loans by Location Dollars in Millions Excludes covered loans *Other includes secondary market mortgages and health care lending available-for-sale loans. |

| Deposits 14 $2.4 Billion Total Deposits (6/30/2010) Other Time Deposits Non-Interest Bearing Demand Interest-Bearing Demand Money Market Account Savings Accounts Time Deposits of $100,000 or More 619 327 102 511 25 861 Deposits by Type Deposits by Location *Includes Treasury division Dollars in Millions |

| Pre-Provision/Pre-Tax Income Dollars in Millions 15 *Annualized |
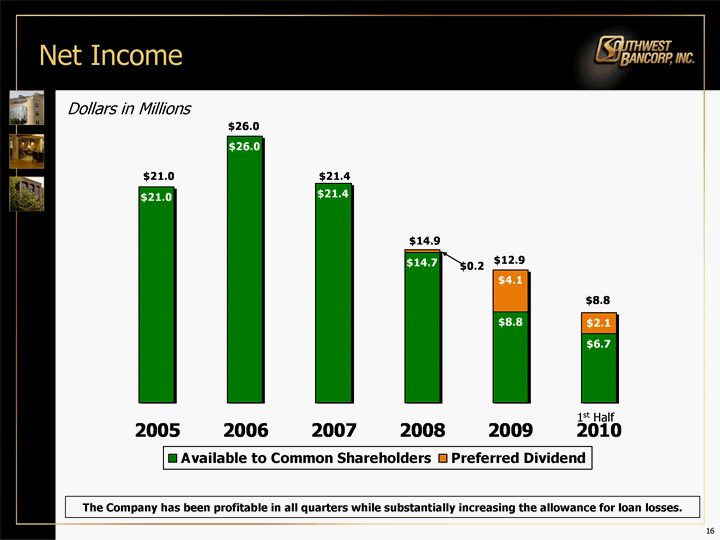
| Net Income 2005 2006 2007 2008 2009 2010 Available to Common Shareholders 21.014 25.997 21.378 14.658 8.837 6.7 Preferred Dividend 0 0 0 0.243 4.145 2.1 Dollars in Millions 16 The Company has been profitable in all quarters while substantially increasing the allowance for loan losses. 1st Half |

| 2005 2006 2007 2008 2009 2010 "Well-Capitalized" Minimum 169 197 260 284 280 266 Above "Well-Capitalized" Minimum 71 69 25 121 133 207 2005 2006 2007 2008 2009 2010 Total Capital Ratios 0.1421 0.135 0.1097 0.1426 0.1455 0.1778 Southwest's Regulatory Capital Total Risk-Based Capital As of year-end except 2010 which is as of June 30 17 $240 $266 $285 $405 $413 Dollars in Millions "Well-capitalized" minimum is 10% for all periods. $473 |

| 18 Book Value Per Share As of year-end except 2010 which is as of June 30 2005 2006 2007 2008 2009 2010 Tangible Book Value 12.14 13.78 14.66 15.69 15.99 15.53 Book Value 12.16 13.87 15.16 16.18 16.46 15.88 Intangible assets defined as goodwill for purposes of this calculation. |
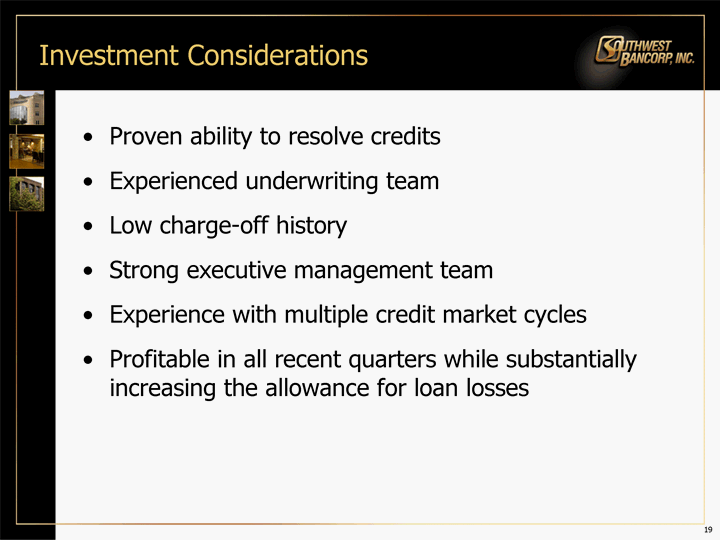
| Investment Considerations Proven ability to resolve credits Experienced underwriting team Low charge-off history Strong executive management team Experience with multiple credit market cycles Profitable in all recent quarters while substantially increasing the allowance for loan losses 19 |

| Today's Presenters Rick Green, President & CEO Telephone: 405.742.1802 E-mail: RickGreen@banksnb.com Kerby Crowell, Executive Vice President & CFO Telephone: 405.742.1808 E-mail: KerbyCrowell@banksnb.com 20 www.oksb.com |
