Attached files
| file | filename |
|---|---|
| 8-K - FORM 8-K - DOVER Corp | y85740e8vk.htm |
| EX-99.2 - EX-99.2 - DOVER Corp | y85740exv99w2.htm |
| EX-99.1 - EX-99.1 - DOVER Corp | y85740exv99w1.htm |
Exhibit 99.3

| Dover Corporation Second Quarter 2010 Conference Call July 23, 2010 9:00 am |
| 2 Forward Looking Statements We want to remind everyone that our comments may contain forward-looking statements that are inherently subject to uncertainties. We caution everyone to be guided in their analysis of Dover Corporation by referring to our Form 10-K for a list of factors that could cause our results to differ from those anticipated in any such forward looking statements. We would also direct your attention to our internet site, www.dovercorporation.com, where considerably more information can be found. |
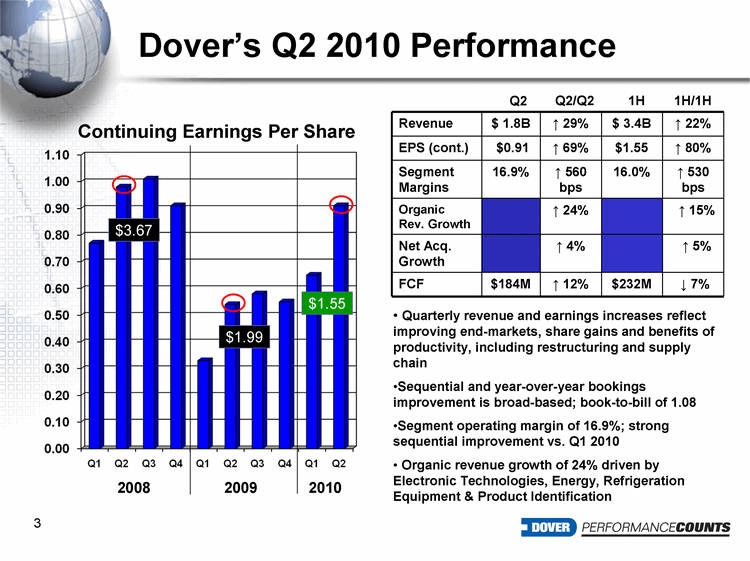
| 3 Dover’s Q2 2010 Performance Continuing Earnings Per Share 2008 $3.67 Revenue $ 1.8B 29% $ 3.4B 22% EPS (cont.) $0.91 69% $1.55 80% Segment Margins 16.9% 560 bps 16.0% 530 bps Organic Rev. Growth 24% 15% Net Acq. Growth 4% 5% FCF $184M 12% $232M 7% Quarterly revenue and earnings increases reflect improving end-markets, share gains and benefits of productivity, including restructuring and supply chain Sequential and year-over-year bookings improvement is broad-based; book-to-bill of 1.08 Segment operating margin of 16.9%; strong sequential improvement vs. Q1 2010 Organic revenue growth of 24% driven by Electronic Technologies, Energy, Refrigeration Equipment & Product Identification Q2 Q2/Q2 2009 $1.99 $1.55 2010 1H 1H/1H |
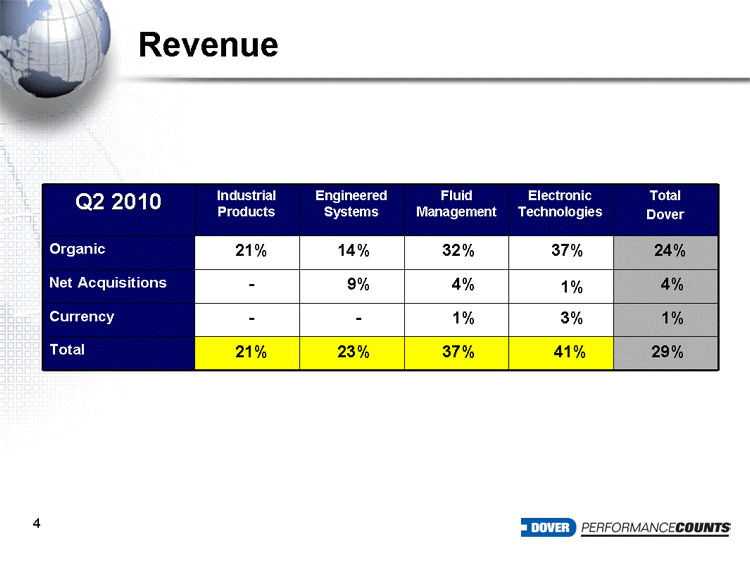
| 4 Revenue Q2 2010 Industrial Products Engineered Systems Fluid Management Electronic Technologies Total Dover Organic 21% 14% 32% 37% 24% Net Acquisitions - 9% 4% 1% 4% Currency - - 1% 3% 1% Total 21% 23% 37% 41% 29% |
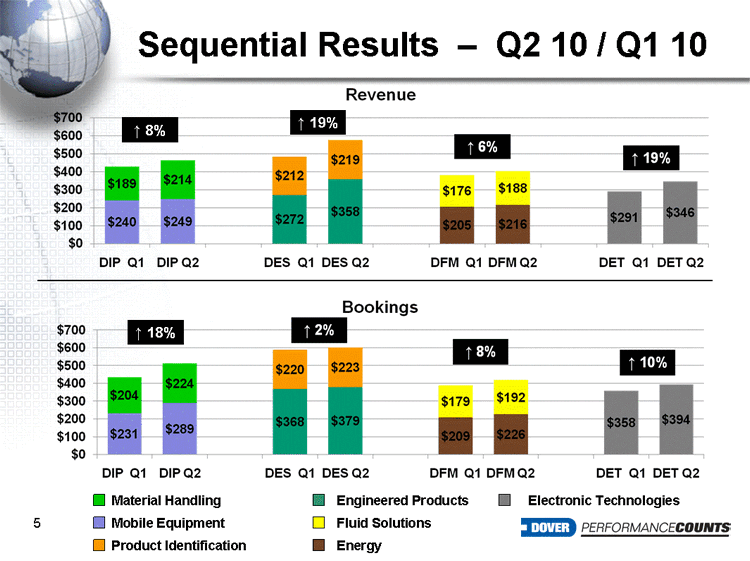
| 5 Sequential Results - Q2 10 / Q1 10 Material Handling Fluid Solutions Mobile Equipment Energy Product Identification Engineered Products 8% 19% 18% Electronic Technologies |
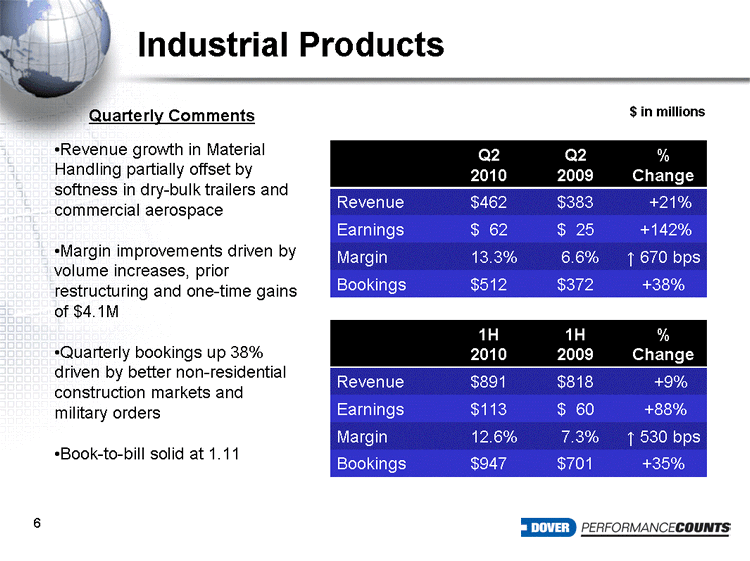
| 6 Industrial Products Revenue growth in Material Handling partially offset by softness in dry-bulk trailers and commercial aerospace Margin improvements driven by volume increases, prior restructuring and one-time gains of $4.1M Quarterly bookings up 38% driven by better non-residential construction markets and military orders Book-to-bill solid at 1.11 $ in millions Q2 2010 Q2 2009 % Change Revenue $462 $383 +21% Earnings $ 62 $ 25 +142% Margin 13.3% 6.6% 670 bps Bookings $512 $372 +38% Quarterly Comments 1H 2010 1H 2009 % Change Revenue $891 $818 +9% Earnings $113 $ 60 +88% Margin 12.6% 7.3% 530 bps Bookings $947 $701 +35% |
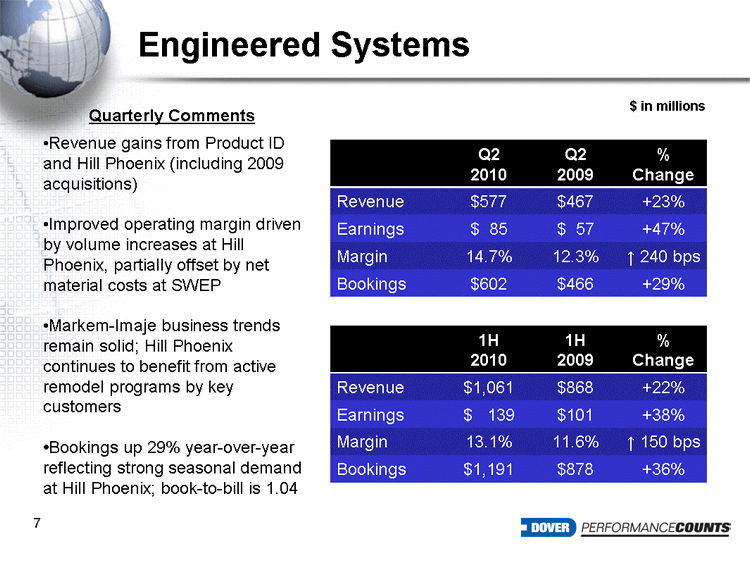
| 7 Engineered Systems Revenue gains from Product ID and Hill Phoenix (including 2009 acquisitions) Improved operating margin driven by volume increases at Hill Phoenix, partially offset by net material costs at SWEP Markem-Imaje business trends remain solid; Hill Phoenix continues to benefit from active remodel programs by key customers •Bookings up 29% year-over-year reflecting strong seasonal demand at Hill Phoenix; book-to-bill is 1.04 $ in millions Quarterly Comments Q2 2010 Q2 2009 % Change Revenue $577 $467 +23% Earnings $ 85 $ 57 +47% Margin 14.7% 12.3% 240 bps Bookings $602 $466 +29% 1H 2010 1H 2009 % Change Revenue $1,061 $868 +22% Earnings $ 139 $101 +38% Margin 13.1% 11.6% 150 bps Bookings $1,191 $878 +36% |
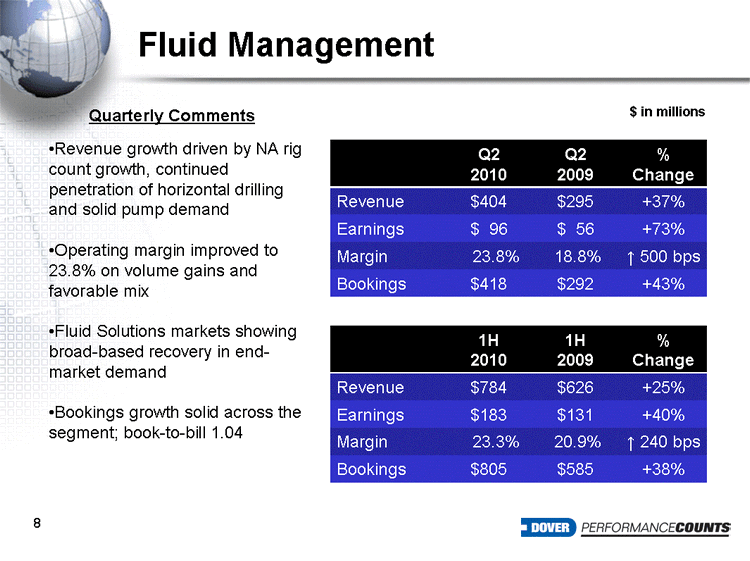
| 8 Fluid Management Revenue growth driven by NA rig count growth, continued penetration of horizontal drilling and solid pump demand Operating margin improved to 23.8% on volume gains and favorable mix Fluid Solutions markets showing broad-based recovery in end- market demand Bookings growth solid across the segment; book-to-bill 1.04 $ in millions Quarterly Comments Q2 2010 Q2 2009 % Change Revenue $404 $295 +37% Earnings $ 96 $ 56 +73% Margin 23.8% 18.8% 500 bps Bookings $418 $292 +43% 1H 2010 1H 2009 % Change Revenue $784 $626 +25% Earnings $183 $131 +40% Margin 23.3% 20.9% 240 bps Bookings $805 $585 +38% |
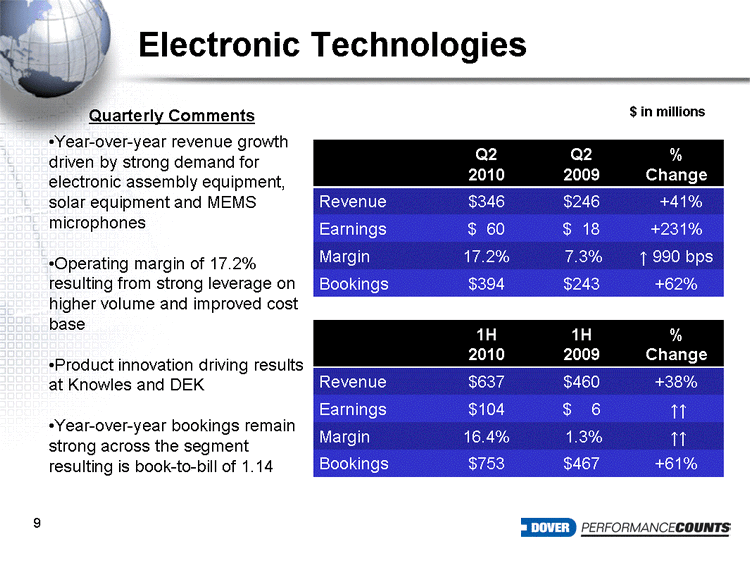
| 9 Electronic Technologies Year-over-year revenue growth driven by strong demand for electronic assembly equipment, solar equipment and MEMS microphones Operating margin of 17.2% resulting from strong leverage on higher volume and improved cost base Product innovation driving results at Knowles and DEK Year-over-year bookings remain strong across the segment resulting is book-to-bill of 1.14 $ in millions Quarterly Comments Q2 2010 Q2 2009 % Change Revenue $346 $246 +41% Earnings $ 60 $ 18 +231% Margin 17.2% 7.3% 990 bps Bookings $394 $243 +62% 1H 2010 1H 2009 % Change Revenue $637 $460 +38% Earnings $104 $ 6 Margin 16.4% 1.3% Bookings $753 $467 +61% |
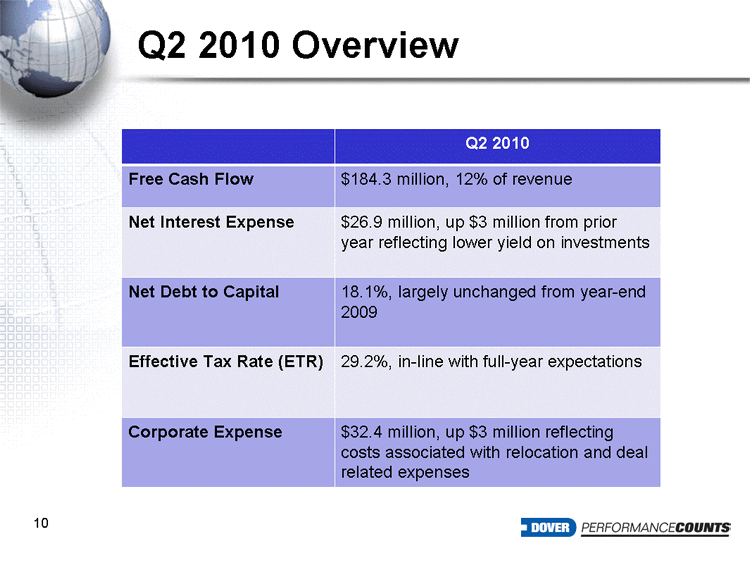
| Q2 2010 Overview Q2 2010 Free Cash Flow $184.3 million, 12% of revenue Net Interest Expense $26.9 million, up $3 million from prior year reflecting lower yield on investments Net Debt to Capital 18.1%, largely unchanged from year-end 2009 Effective Tax Rate (ETR) 29.2%, in-line with full-year expectations Corporate Expense $32.4 million, up $3 million reflecting costs associated with relocation and deal related expenses 10 |
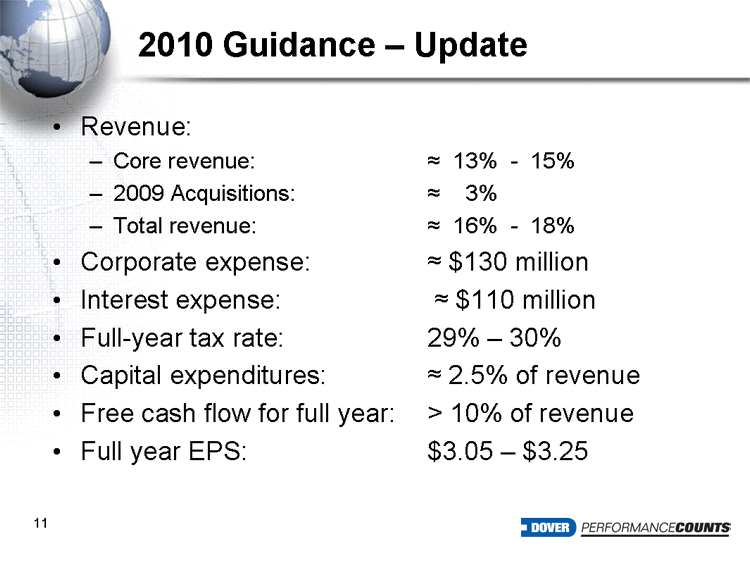
| 11 2010 Guidance - Update Revenue: Core revenue: 13% - 15% 2009 Acquisitions: 3% Total revenue: 16% - 18% Corporate expense: $130 million Interest expense: $110 million Full-year tax rate: 29% - 30% Capital expenditures: 2.5% of revenue Free cash flow for full year: > 10% of revenue Full year EPS: $3.05 - $3.25 |
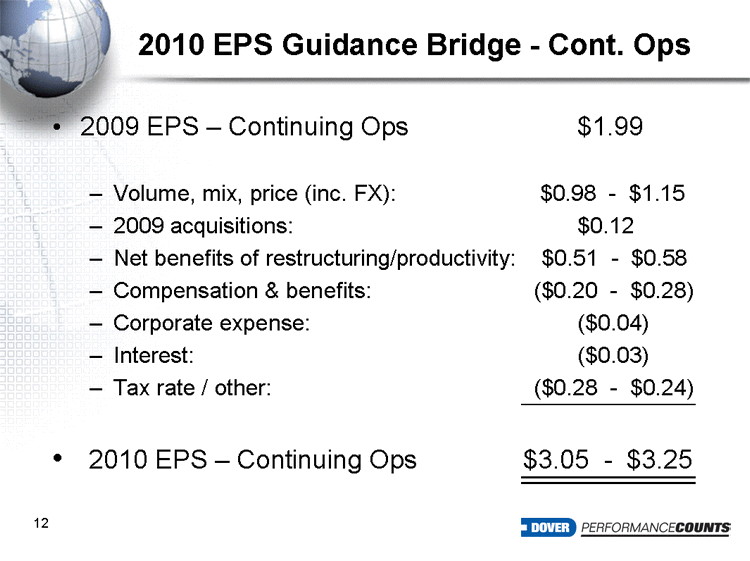
| 12 2010 EPS Guidance Bridge - Cont. Ops 2009 EPS - Continuing Ops $1.99 Volume, mix, price (inc. FX): $0.98 - $1.15 2009 acquisitions: $0.12 Net benefits of restructuring/productivity: $0.51 - $0.58 Compensation & benefits: ($0.20 - $0.28) Corporate expense: ($0.04) Interest: ($0.03) Tax rate / other: ($0.28 - $0.24) 2010 EPS - Continuing Ops $3.05 - $3.25 |
