Attached files
| file | filename |
|---|---|
| 8-K - FORM 8-K - Cheniere Energy, Inc. | form_8-k.htm |

CHENIERE ENERGY
Cheniere Energy, Inc.
Corporate Presentation
June 2010
Corporate Presentation
June 2010

Forward Looking Statements
1
This presentation contains certain statements that are, or may be deemed to be, “forward-looking statements” within the meaning of Section 27A of
the Securities Act and Section 21E of the Securities Exchange Act of 1933, as amended. All statements, other than statements of historical facts,
included herein are “forward-looking statements.” Included among “forward-looking statements” are, among other things:
the Securities Act and Section 21E of the Securities Exchange Act of 1933, as amended. All statements, other than statements of historical facts,
included herein are “forward-looking statements.” Included among “forward-looking statements” are, among other things:
§ statements that we expect to commence or complete construction of a liquefaction facility by certain dates, or at all;
§ statements that we expect to receive authorization from the Federal Energy Regulatory Commission, or FERC, or the Department of Energy, or
DOE to construct and operate a proposed liquefaction facility by a certain date, or at all;
DOE to construct and operate a proposed liquefaction facility by a certain date, or at all;
§ statements regarding future levels of domestic or foreign natural gas production and consumption, or the future level of LNG imports into North
America or exports from the U.S., or regarding projected future capacity of liquefaction or regasification facilities worldwide;
America or exports from the U.S., or regarding projected future capacity of liquefaction or regasification facilities worldwide;
§ statements regarding any financing transactions or arrangements, whether on the part of Cheniere or at the project level;
§ statements regarding any commercial arrangements marketed or potential arrangements to be performed in the future, including any cash
distributions and revenues anticipated to be received;
distributions and revenues anticipated to be received;
§ statements regarding the commercial terms and potential revenues from activities described in this presentation;
§ statements that our proposed liquefaction facility, when completed, will have certain characteristics, including a number of trains;
§ statements regarding our business strategy, our business plan or any other plans, forecasts, examples, models, forecasts or objectives: any or all of
which are subject to change;
which are subject to change;
§ statements regarding estimated corporate overhead expenses; and
§ any other statements that relate to non-historical information.
These forward-looking statements are often identified by the use of terms and phrases such as “achieve,” “anticipate,” “believe,” “estimate,” “example,”
“expect,” “forecast,” “opportunities,” “plan,” “potential,” “project,” “propose,” “subject to,” and similar terms and phrases. Although we believe that the
expectations reflected in these forward-looking statements are reasonable, they do involve assumptions, risks and uncertainties, and these
expectations may prove to be incorrect. You should not place undue reliance on these forward-looking statements, which speak only as of the date of
this presentation. Our actual results could differ materially from those anticipated in these forward-looking statements as a result of a variety of
factors, including those discussed in “Risk Factors” in the Cheniere Energy, Inc. and Cheniere Energy Partners, L.P. Annual Reports on Form 10-K for
the year ended December 31, 2009, which are incorporated by reference into this presentation. All forward-looking statements attributable to us or
persons acting on our behalf are expressly qualified in their entirety by these ”Risk Factors”. These forward-looking statements are made as of the
date of this presentation, and we undertake no obligation to publicly update or revise any forward-looking statements.
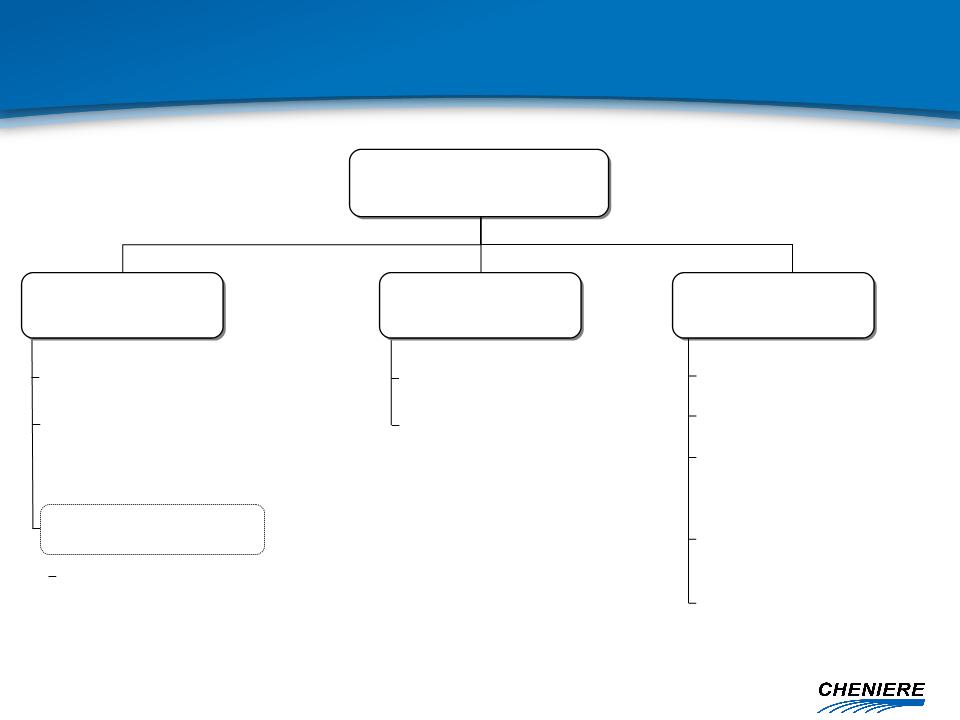
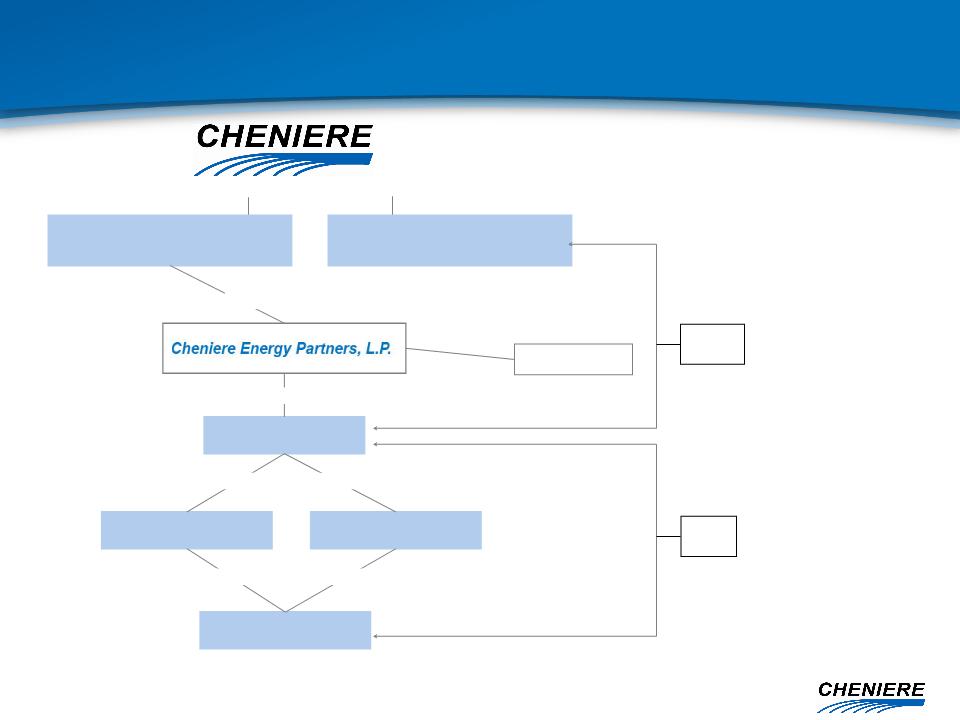
Cheniere Energy, Inc.
(“Cheniere”)
Marketing (“CMI”)
Sabine Pass LNG (SPLNG) (90.6%)*
Approved Permits:
Creole Trail LNG
Corpus Christi LNG
Creole Trail P/L (100%)
Approved Permits:
Creole Trail P/L Phase II
Corpus Christi P/L
2 Bcf/d Capacity at SPLNG**
MSPAs with major
LNG suppliers,
merchants, utilities
LNG suppliers,
merchants, utilities
Isle of Grain Put
Option 12 Cargoes/yr
Over 100 domestic
NAESBs and ISDAs
NAESBs and ISDAs
Pipelines
Terminals
JPMorgan Arrangement
Expand services at Sabine Pass LNG:
1 Bcf/d Liquefaction Capability
Development Project
* Sabine Pass LNG owned by Cheniere Energy Partners, L.P. (“CQP”)
**Variable Capacity Rights Agreement (“VCRA”) with CQP
Cheniere Business Segments
|
TUA
|
Capacity
|
2010 Full-Year
Payments ($ in MM) |
|
Total LNG USA
Chevron USA
Cheniere Energy Investments
|
1.0 Bcf/d
1.0 Bcf/d
2.0 Bcf/d
|
$123
$128
$252
|
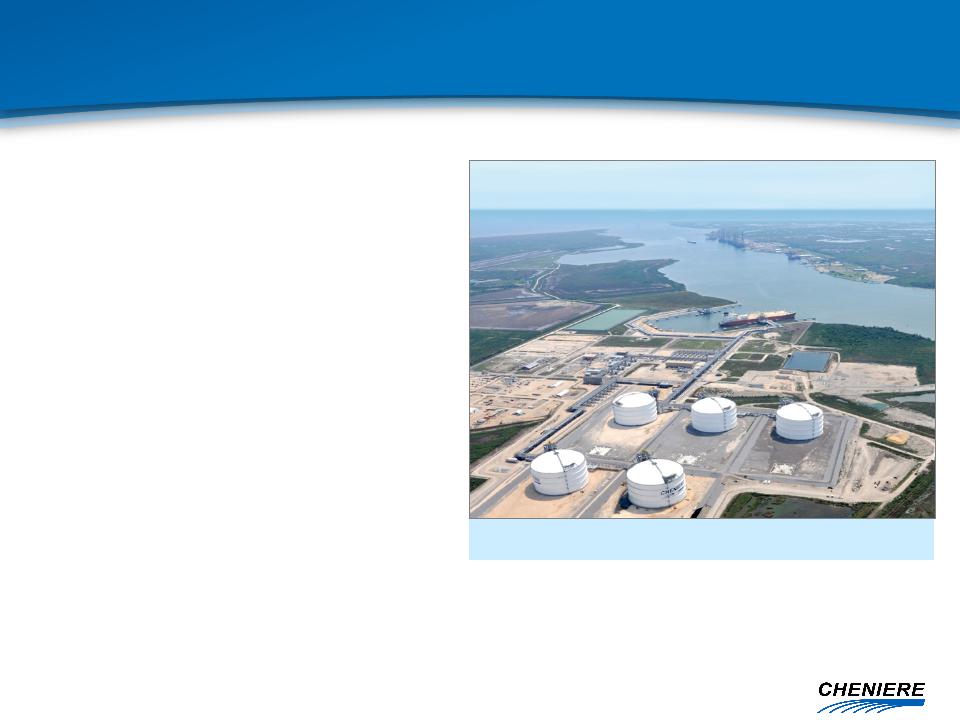
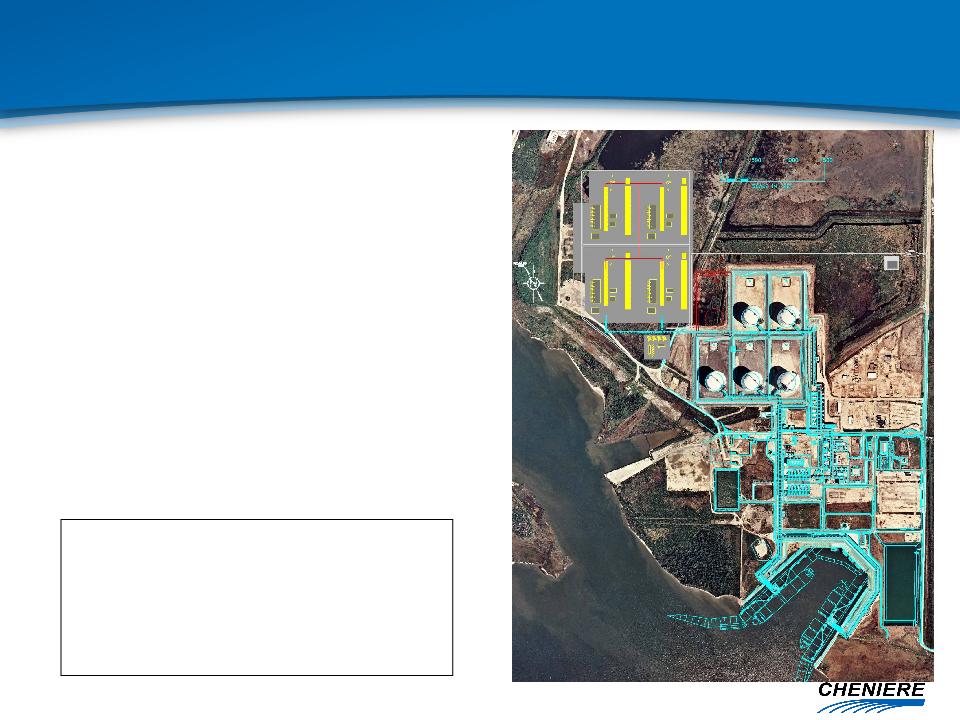
Aerial view of Sabine Pass LNG
3
Sabine Pass LNG
Cheniere Energy, Inc. 90.6%
Cheniere Energy, Inc. 90.6%
§ Vaporization
– ~4.3 Bcf/d peak send-out
§ Storage
– 5 tanks x 160,000 cm (16.9 Bcfe)
§ Berthing / Unloading
– Two docks
– LNG carriers up to 266,000 cm
– Four dedicated tugs
§ Land
– 853 acres in Cameron Parish, LA
§ Accessibility - Deep Water Ship Channel
– Sabine River Channel dredged to 40
feet
feet
§ Proximity
– 3.7 nautical miles from coast
– 22.8 nautical miles from outer buoy
§ LNG Re-Exporting Capability
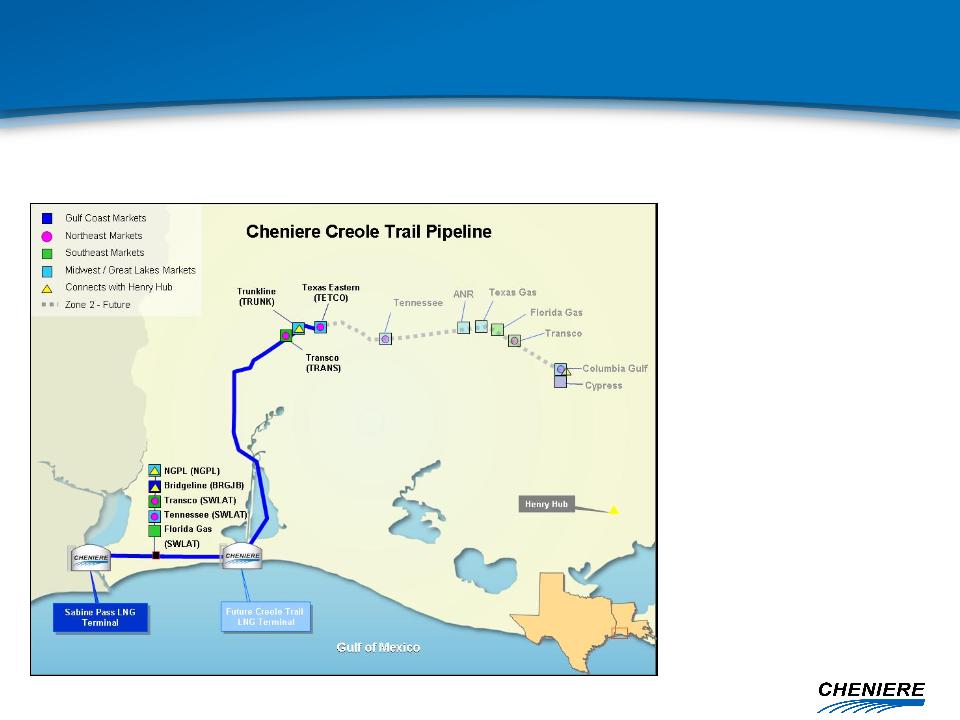
§ Size:
– 2.0 Bcf/d
§ Diameter:
– 42-inch diameter
§ Cost:
– ~$560 million first 94 miles
§ Initial interconnects:
– 4.1 Bcf/d of interconnect
capacity
capacity
§ Provides optimal market access for LNG from the Sabine Pass terminal
§ First 94 miles complete and in-service, additional 58 miles permitted
Creole Trail Pipeline
Cheniere Energy, Inc. 100%
Cheniere Energy, Inc. 100%

Sabine Pass to become bi-directional import/export facility
* Commencement of construction is subject to regulatory approvals and a final investment decision contingent upon Cheniere obtaining
satisfactory construction contracts and long-term customer contracts sufficient to underpin financing of the project.
satisfactory construction contracts and long-term customer contracts sufficient to underpin financing of the project.
Expanding Operations - Liquefaction Project*
Compelling Proposition
Compelling Proposition
§ Market fundamentals create opportunity to expand into exports
§ Export services provide customers with an attractively priced
option to access U.S. natural gas supply
option to access U.S. natural gas supply
§ Sabine Pass facility location is strategically situated
– Many existing assets in place needed for an export terminal
reduces capital required, cost estimates comparable to liquefaction
expansion economics
reduces capital required, cost estimates comparable to liquefaction
expansion economics
– Abundance of supply and existing infrastructure in surrounding
regions, proximity to Henry Hub
regions, proximity to Henry Hub
§ Powerful tool for industry players to manage their portfolios
– Early indications of interest from both buyers and sellers of natural
gas and LNG
gas and LNG

Market Fundamentals Drive Liquefaction Project
§ The U.S. has become the largest producer of natural gas in the
world and production costs rank among the lowest
world and production costs rank among the lowest
– Productive capacity at $6.50/MMBtu could reach 95 Bcf/d by 2020
§ U.S. natural gas demand not likely to keep pace with incremental
supply as demand continues to lag market forecasts, threatening to
lead to price volatility
supply as demand continues to lag market forecasts, threatening to
lead to price volatility
§ Globally, a natural gas supply gap is projected to develop in 2014-15
– Key driver is decline of UK Continental Shelf production
– Exacerbates dependency of European consumers on imported gas
– Asian consumers highly dependent on imported LNG for gas supply
§ Simultaneously, global LNG and pipeline gas suppliers continue to
enforce oil-price indexation in new contracts
enforce oil-price indexation in new contracts
– Key markets in Asia and Europe import over 70 Bcf/d of natural gas
– Imports forecast to increase by 26 Bcf/d over the next ten years
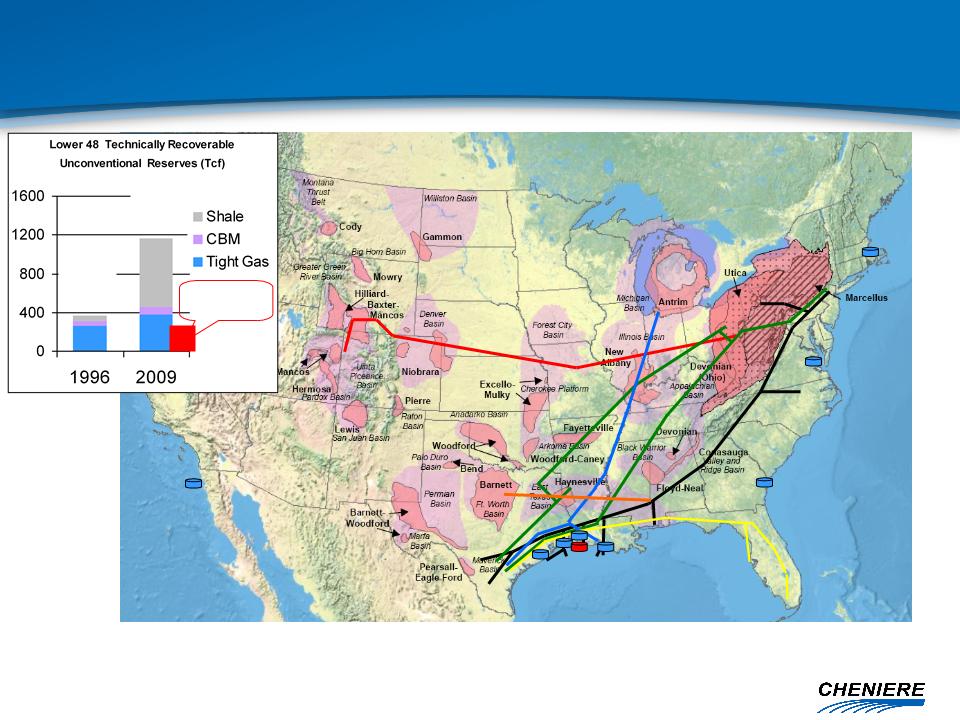
Sources: EIA (US map graphic, pipelines and LNG terminals placed by Cheniere)
Advanced Resources Intl (Lower 48 Unconventional Recoverable Reserves), ARI shale estimates updated April 2010
Depicted Pipelines: Rockies Express, Texas Eastern, Trunkline, Transco, FGT, C/P/SESH/Gulf Crossing (as a single route)
Depicted LNG terminals: Freeport, Golden Pass, Sabine Pass, Cameron, Trunkline, Elba Island, Cove Point, Everett
366
Tcf
Tcf
1,167
Tcf
Tcf
US Proved
Reserves
Reserves
U.S. Unconventional Reserves
Basins Proximate to Premium Markets and Major Pipelines
Basins Proximate to Premium Markets and Major Pipelines
3
Project Estimates:
§ Initial Phase: 1 Bcf/d (two modular trains)
§ Second Phase: Additional 1 Bcf/d
§ Estimated capex similar to liquefaction
expansion economics
expansion economics
§ Commercial start date: 2015e
Sabine Pass LNG
Proposed Liquefaction Project - Overview
Proposed Liquefaction Project - Overview
§ Leveraging existing assets
– Large acreage position (853 acres)
• Can readily accommodate 4 liquefaction trains
(up to 2 Bcf/d capacity)
(up to 2 Bcf/d capacity)
– Existing infrastructure
• 2 docks, 4 dedicated tugs
• LNG storage tanks (5 x 160,000 cm)
• Power generation
• Pipeline connections (Creole Trail)
§ Gas sourced from pipeline grid - Henry
Hub indexed pricing
Hub indexed pricing
§ “Demand Pull” model
– Global supply gap
– Diversity of supply
– Flexible processing
– Henry Hub indexation
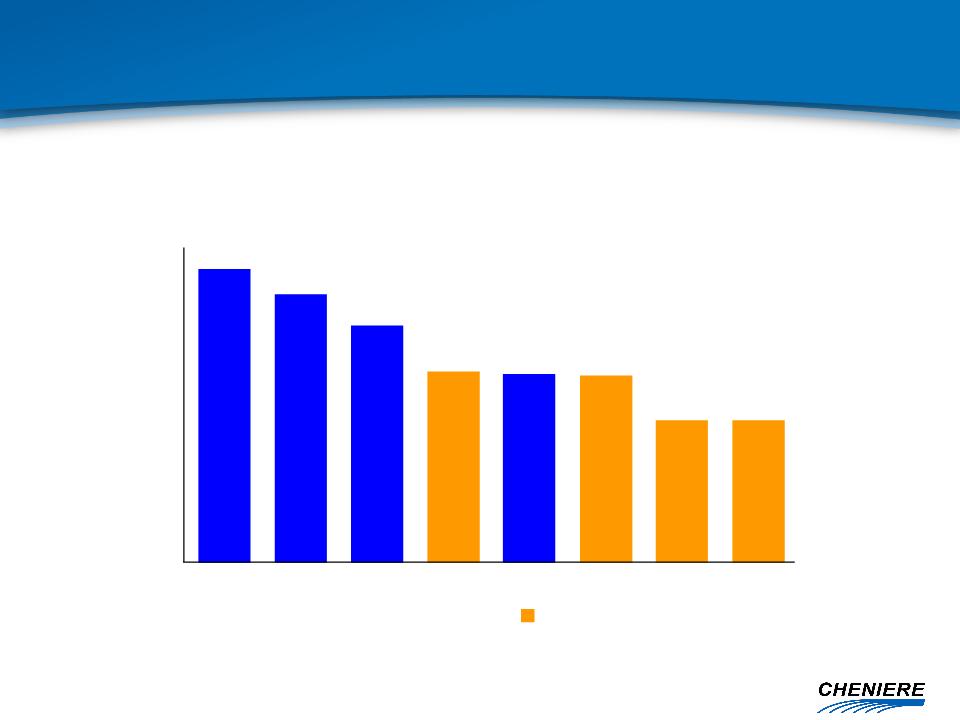
450
400
350
300
250
200
150
100
50
0
Cost
Qatargas Nigeria RasGas ELNGT1 Oman ALNGT1 ALNGT1-3 ELNGT1-2
ConocoPhillips-Bechtel - Global Liquefaction Collaboration
Source: ConocoPhillips-Bechtel
ConocoPhillips-Bechtel trains
$/Ton per Annum
Low Cost Liquefaction Facilities
Proven Technology
Proven Technology
Capacity fee includes regasification and liquefaction services -
provides customer option to import or export
Estimated cost to purchase U.S. supply:
Commercial Structure
Estimated Terms for LNG Sales Agreements
Estimated Terms for LNG Sales Agreements
Ê Capacity Fee: $1.40/MMBtu to $1.75/MMBtu
§ “Take or Pay”, permits lifting or unloading cargoes
§ Includes all facilities and Creole Trail Pipeline
Ê LNG Export Commodity Charge: $HH./MMBtu
§ Delivery Terms: FOB
§ Prevailing price for eastbound flow in local pipelines
§ Paid on a per-MMBtu basis, per cargo loaded
Ê Fuel Surcharge: 8%-12%
§ Projected based on forecast export activity
§ Trued up from period to period
2010 Financial Developments
Cheniere Energy, Inc.
Cheniere Energy, Inc.
§ Entered into marketing arrangement with JPMorgan
– Reduced working capital requirements for cargo purchases/sales
§ Sold 30% equity in Freeport to pay down debt
– Paid down $102 million of 9.75% term loan
§ Assigned CMI TUA to CQP subsidiary and entered into new variable
capacity rights agreement
capacity rights agreement
– Released TUA reserve account, funds used to pay down $64 million of
convertible senior secured notes
convertible senior secured notes
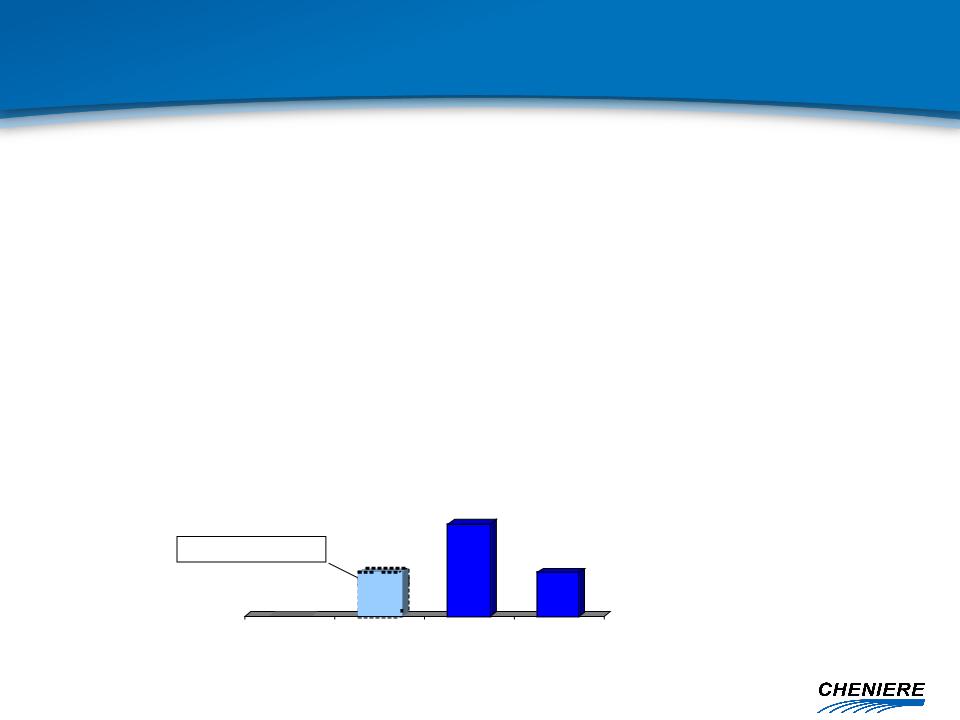
§ Continuing to address upcoming debt maturities at Cheniere
– Considering best options to maintain shareholder value
$247
$247
$502
Put option Aug-2011
2010
2011
2012
2018
Note: Balances as of June 30, 2010, reflect paydown of $64MM on convertible senior secured loans. Amounts do not include notes at CQP

JPMorgan Arrangement
§ Cheniere and JPMorgan joined LNG marketing efforts
§ CMI provides all services related to:
– sourcing deals and negotiating contracts, purchasing, transporting,
receiving, storing, regasifying and selling cargoes of LNG and regasified
LNG on an exclusive basis
receiving, storing, regasifying and selling cargoes of LNG and regasified
LNG on an exclusive basis
§ JPM provides credit support
§ JPM pays a fixed fee and additional fees dependent upon
gross margins achieved
gross margins achieved
§ JPM acquired CMI’s commercial inventory as of April 1, 2010
§ JPM has option to sign 0.5 Bcf/d TUA at $0.32/MMBtu

§ CQP: Subordination period extended - distributions to sub units dependent
on new business generated, including future CMI fees under the VCRA
on new business generated, including future CMI fees under the VCRA
§ LNG: Eliminates need for $64mm TUA reserve, funds from reserve used to
pay down $64mm on senior secured convertible loans
pay down $64mm on senior secured convertible loans
§ CMI assigned its 2.0 Bcf/d TUA with Sabine Pass LNG to direct subsidiary of
CQP, Cheniere Energy Investments, LLC (“Investments”)
CQP, Cheniere Energy Investments, LLC (“Investments”)
§ Investments will make TUA payments to Sabine Pass LNG effective 7/1/2010
§ CMI / Investments entered into a Variable Capacity Rights Agreement (“VCRA”)
that gives CMI rights provided in the TUA
that gives CMI rights provided in the TUA
§ CMI will continue marketing TUA capacity on CQP’s behalf
§ CMI will pay Investments 80% of positive gross margin for each cargo delivered
at Sabine
at Sabine
Transaction Summary
Results
* No impact to arrangement between CMI and JPMorgan or any existing agreements with other counterparties.
Cheniere and CQP Restructure Marketing
Arrangement*
Arrangement*
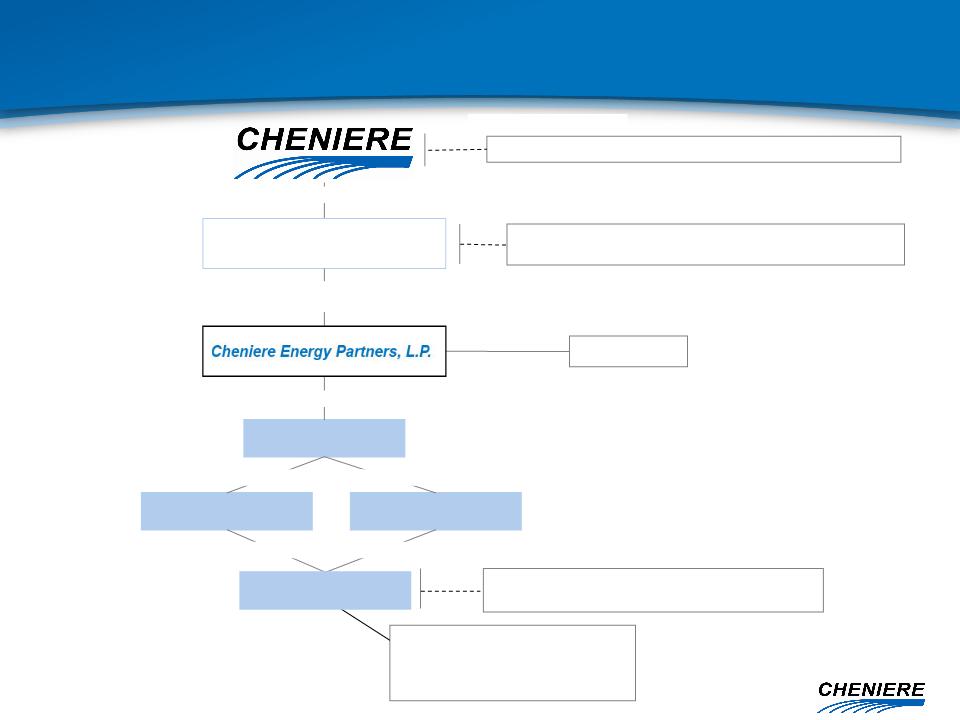
Public Unit holders
9.4% LP Interest
Cheniere Energy
Investments, LLC
Sabine Pass LNG-GP, Inc.
Sabine Pass LNG, L.P.
Sabine Pass LNG-LP, LLC
100% Ownership Interest
100% Ownership Interest
100% Ownership Interest
100% LP Interest
Non-Economic GP Interest
100% Ownership Interest
Cheniere LNG Holdings, LLC
88.6% LP Interest
100% of 2% GP Interest
100% of 2% GP Interest
NYSE Amex US: LNG
NYSE Amex US: CQP
3
Cheniere Marketing, LLC
VCRA
TUA
Organizational Structure
TUA Assignment and new VCRA
TUA Assignment and new VCRA

Disbursements
§ G&A, net Marketing 25-35
§ Pipeline & tug services 10
§ Other, incl adv tax payments 3-5
§ Debt service 34
Annualized*
($ in MM)
$45 - 55
*Estimates represent a summary of internal forecasts, are based on current assumptions and are subject to change. Actual performance may differ materially from,
and there is no plan to update the forecast. See “Forward Looking Statements” cautions. Estimates exclude earnings forecasts from operating activities.
and there is no plan to update the forecast. See “Forward Looking Statements” cautions. Estimates exclude earnings forecasts from operating activities.
**Approximately $11 million is fees for management services provided by Cheniere to CQP payable on a quarterly basis, equal to the lesser of 1) $2.5 million (subject
to inflation) or 2) such amount of CQP’s unrestricted cash and cash equivalents as remains after CQP has distributed in respect of each quarter for each common
unit then outstanding an amount equal to the IQD and the related GP distribution and adjusting for any cash needed to provide for the proper conduct of the
business of CQP, other than Sabine Pass operating cash flows reserved for distributions in respect of the next four quarters.
Net cash outflow
§ Baseline case, excludes estimates for cargo activity, Marketing margins and project development costs
Estimated Future Cash Flows
Cheniere Energy, Inc.
Cheniere Energy, Inc.
Receipts
§ Distributions from CQP (Common/GP) $ 20
§ Management fees from CQP 8-19**

Disbursements
§ Operating Expenses $34
§ Management Fees 8
§ Debt Service 165
Annualized*
($ in MM)
$51
*Estimates represent a summary of internal forecasts, are based on current assumptions and are subject to change. Actual
performance may differ materially from, and there is no plan to update the forecast. See “Forward Looking Statements” cautions.
performance may differ materially from, and there is no plan to update the forecast. See “Forward Looking Statements” cautions.
Distributable Cash Available
Distributions to GP and LP Unitholders
$46
Note: Not included in disbursements above is an estimate of up to approximately $11 million of fees payable to Cheniere for
services provided under a management services agreement. Such fees are payable on a quarterly basis equal to the lesser
of 1) $2.5 million (subject to inflation) or 2) such amount of CQP’s unrestricted cash and cash equivalents as remains after
CQP has distributed in respect of each quarter for each common unit then outstanding an amount equal to the IQD and the
related GP distribution and adjusting for any cash needed to provide for the proper conduct of the business of CQP, other
than Sabine Pass operating cash flows reserved for distributions in respect of the next four quarters.
Estimated Future Cash Flows
Cheniere Energy Partners
Cheniere Energy Partners
Receipts
§ TUA Customers $251
§ Fuel Retainage, Tugs, Other 7
Public Unit holders
9.4% LP Interest
Cheniere Energy
Investments, LLC
Sabine Pass LNG-GP, Inc.
Sabine Pass LNG-LP, LLC
100% Ownership Interest
100% Ownership Interest
100% Ownership Interest
100% LP Interest
Non-Economic GP Interest
100% Ownership Interest
Cheniere LNG Holdings, LLC
$205 mm 2.25% Convertible Senior Unsecured Notes due 2012
$550 mm 7.25% Senior Secured Notes due 2013
$1,666 mm 7.50% Senior Secured Notes due 2016
88.6% LP Interest
100% of 2% GP Interest
100% of 2% GP Interest
NYSE Amex US: LNG
NYSE Amex US: CQP
3
$298 mm 9.75% Term Loan due 2012
$247 mm 12.0% Convertible Senior Secured Loans due 2018
Note: Balances as of June 30, 2010; convertible
senior secured loans balance is proforma the
$64MM pay down from TUA reserve release.
senior secured loans balance is proforma the
$64MM pay down from TUA reserve release.
Customer Annual TUA Pmt
Total $123MM
Chevron $128MM
Investments $252MM
Sabine Pass LNG, L.P.
Organizational Structure

Appendix
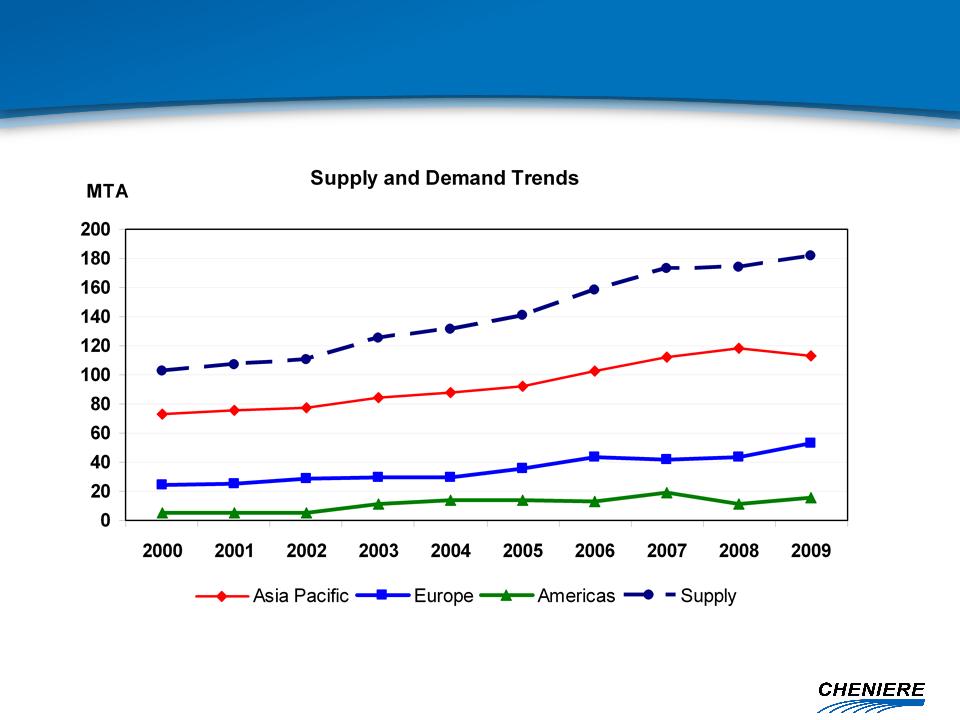
Source: Poten
24.2
15
7
2
Bcf/d(e)
LNG Supply and Demand Trends
Source: GIIGNL, Cheniere Research, 2009e
Skikda
Explosion
Explosion
Schedule slippage,
underperformance
underperformance
FMs, Maintenance
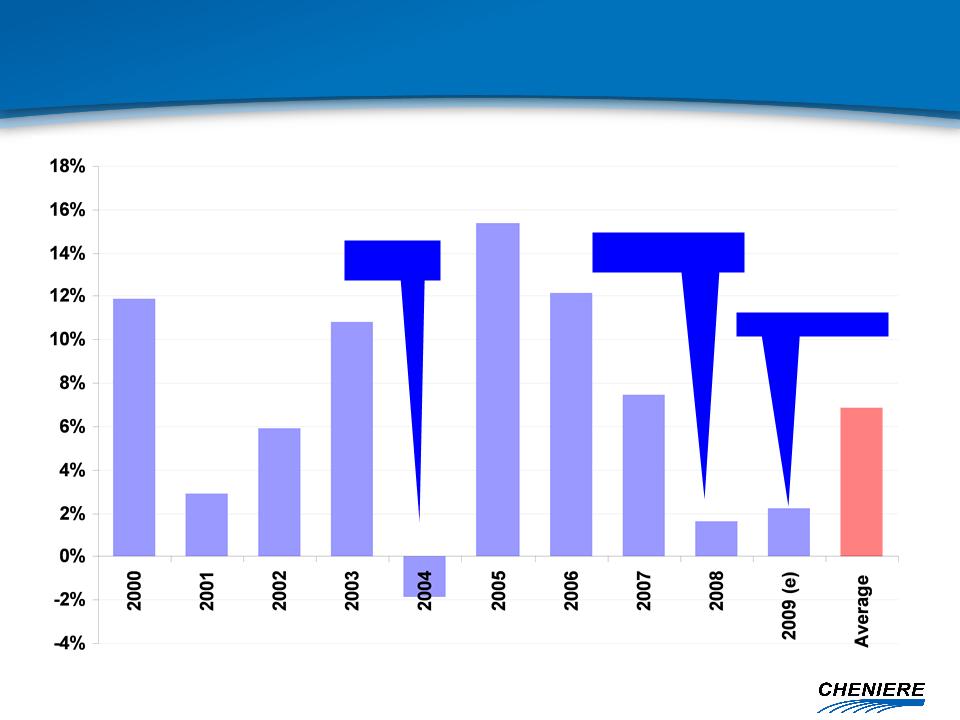
YoY Change in LNG Supply Trends
Well-below Average for Second Year
Well-below Average for Second Year
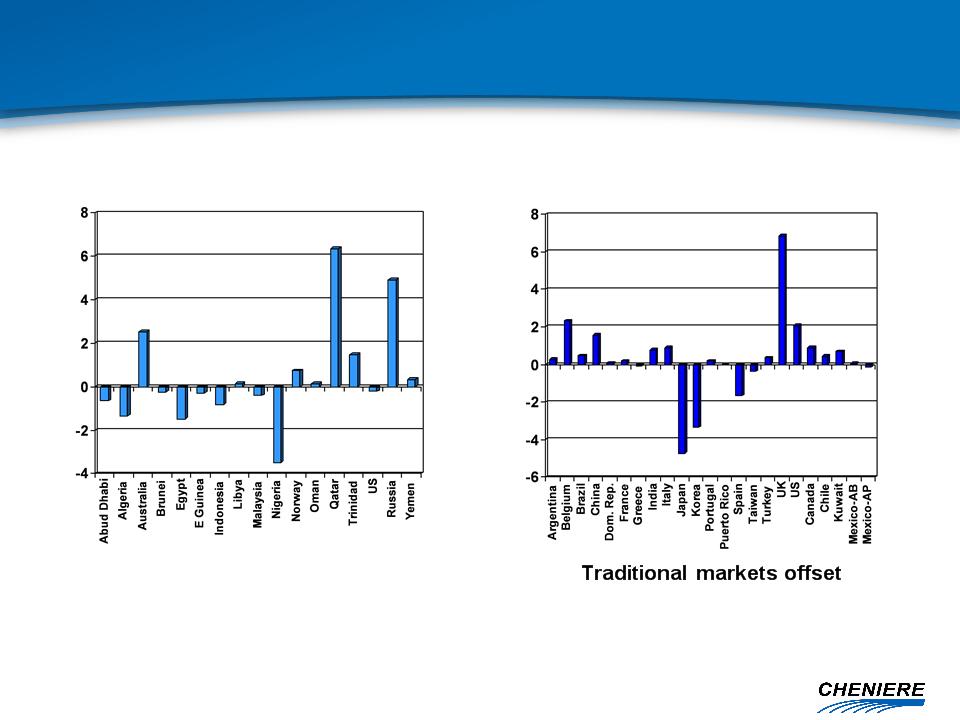
Source: Poten
Supply growth masked
by production losses
by traded markets
Export Variance 09 v 08
Import Variance 09 v 08
MTPA
MTPA
YoY Changes in LNG Supply and Demand
2009 ‘Anomaly’
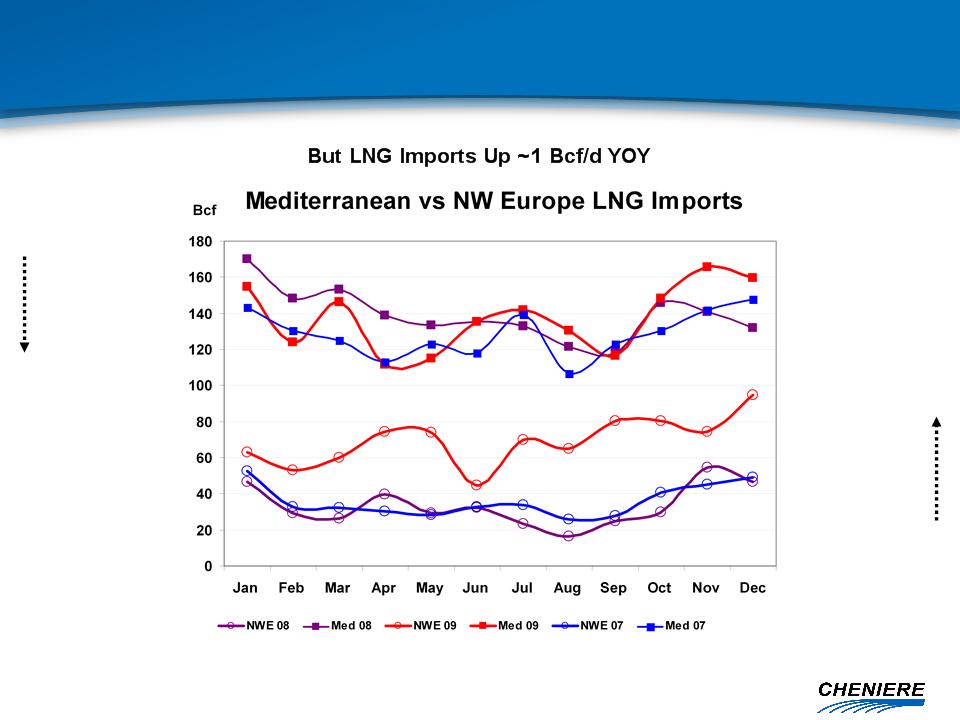
Europe Oversupplied but LNG Imports Up
Europe Oversupplied but LNG Imports Up
Recession induced demand reduction ~4 Bcf/d
Med
NWE
+ 109 %
(+145 cargoes)
Note: NWE = UK, BE, + Montoir
- 1.5%
(-7 cargoes, despite
addition of Rovigo in
Italy)
addition of Rovigo in
Italy)
Source: Waterborne
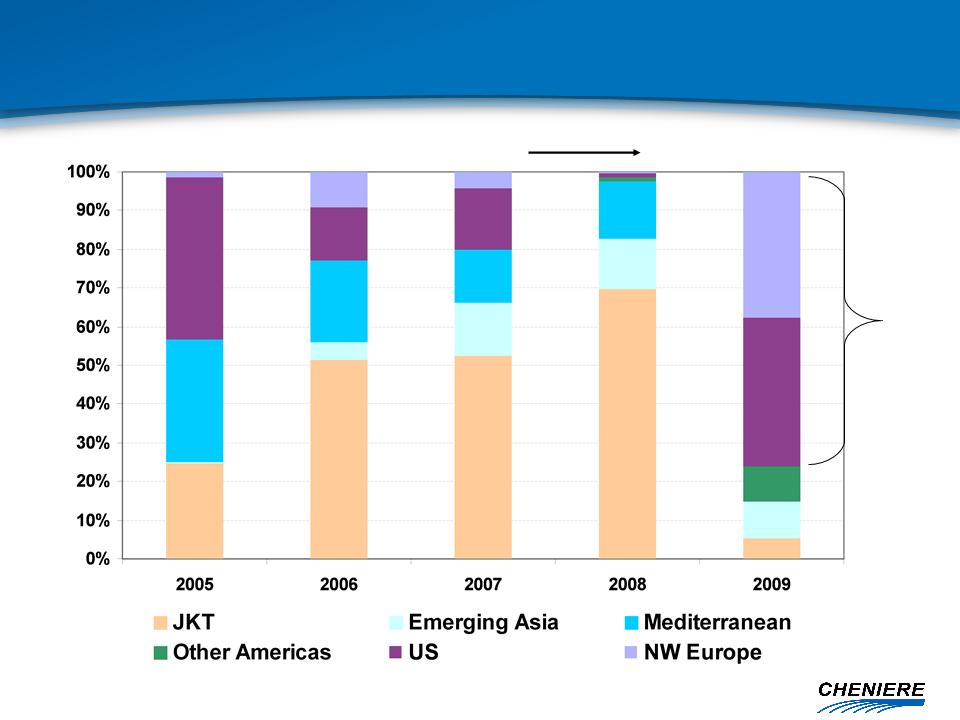
Traded
Liquid
Markets
Loose
Gradual Tightening
Loose
Source: GIIGNL, Cheniere Research , 2009e
Spot LNG By Destination Region
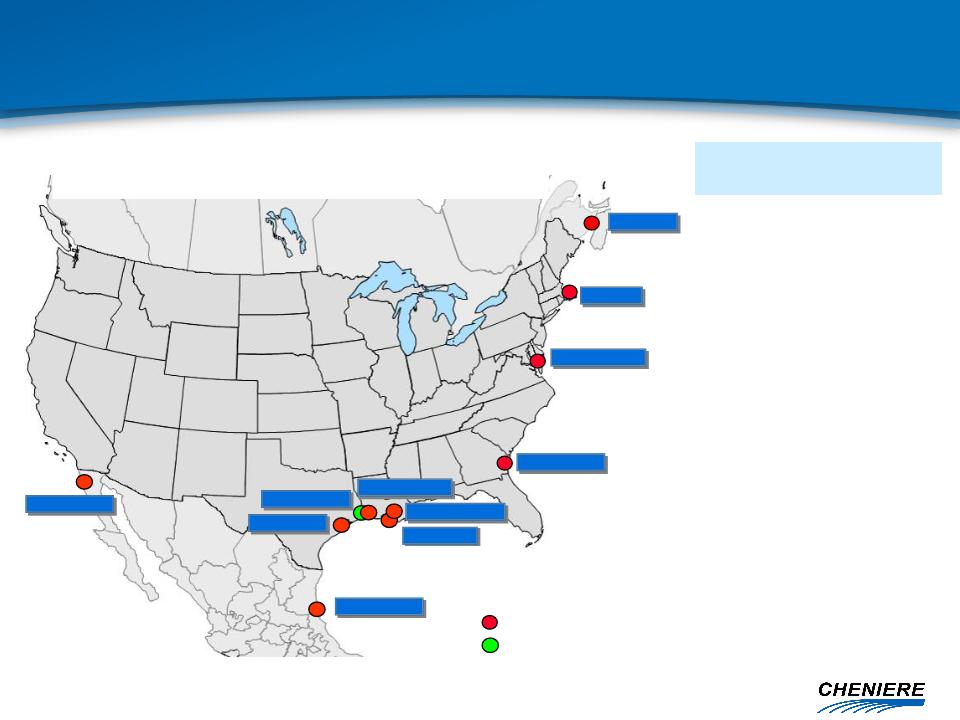
Everett
Cove Point
Elba Island
Lake Charles
Sabine Pass
Freeport
Golden Pass
Cameron
Costa Azúl
Canaport
Existing
Under Construction
Altamira
Source: Websites of Terminal Owners
|
Terminal
Capacity Holder
|
Baseload
Sendout
(MMcf/d) |
|
Canaport 1,000
Irving, Repsol
|
|
|
Everett - Suez 700
|
|
|
Cove Point 1,800
BP, Statoil, Shell
|
|
|
Elba Island 800
BG, Marathon, Shell
|
|
|
Lake Charles - BG 1,800
|
|
|
Freeport 1,500
ConocoPhillips, Dow
|
|
|
Sabine Pass 4,000
Total, Chevron, Cheniere
|
|
|
Cameron 1,500
Sempra, ENI
|
|
|
Golden Pass 2,000
ExxonMobil, ConocoPhillips, QP
|
|
|
Altamira 700
Shell, Total
|
|
|
Costa Azul 1,000
Shell, Sempra
|
|
|
Total 16,800
|
|
15.8 Bcf/d North American Atlantic Basin
capacity @ 65% utilization = 10.3 Bcf/d
capacity @ 65% utilization = 10.3 Bcf/d
North America Onshore
Regasification Capacity By 2010
Regasification Capacity By 2010
CHENIERE ENERGY
Cheniere Energy
Investor Relations
Katie Pipkin, Vice President
(713) 375-5110 - katie.pipkin@cheniere.com
Christina Cavarretta, Manager
(713) 375-5104 - christina.cavarretta@cheniere.com