Attached files
| file | filename |
|---|---|
| 8-K - ANR 8-K 06-28-2010 - Alpha Natural Resources, Inc. | anr8k06282010.htm |
| EX-99.1 - EXHIBIT 99.1 ALPHA NATURAL RESOURCES, INC. INVESTOR PRESENTATION - Alpha Natural Resources, Inc. | exhibit991.htm |
1
Outlook for the Powder River Basin
June 28, 2010
Rocky Mountain Coal Mining Institute Conference

Powder River Basin - Outline
• Basin overview
• Production and stripping ratios
• Safety statistics
• Delivered coal prices and transportation
• Market threats and opportunities
• Alpha PRB operations
2

Forward looking statements
3
Statements in this presentation which are not statements of historical fact
are “forward-looking statements” within the “safe harbor” provision of
the Private Securities Litigation Reform Act of 1995. These forward-
looking statements are based on the information available to, and the
expectations and assumptions deemed reasonable by, Alpha Natural
Resources at the time this presentation was made. Although Alpha
Natural Resources believes that the assumptions underlying such
statements are reasonable, it can give no assurance that they will be
attained. Factors that could cause actual results to differ materially from
expectations include the risks detailed under the section “Risk Factors” in
the company’s Form 10-K filed with the Securities and Exchange
Commission.
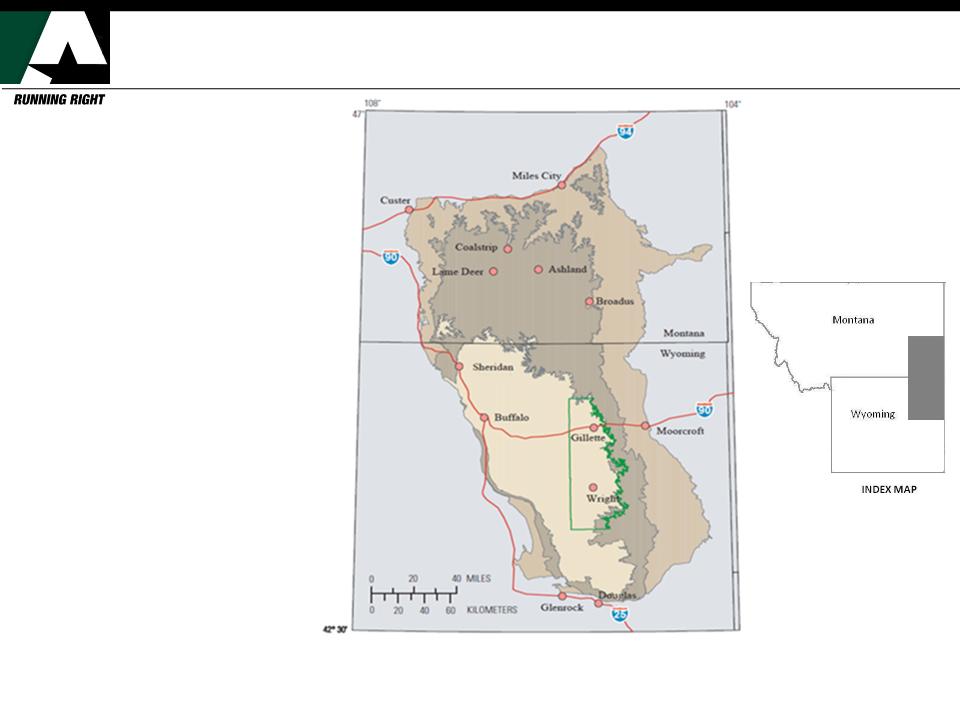
Powder River Basin Overview
4
Source: U.S. Geological Survey Open-File Report 2008-1202
Bureau of Land Management
•There are 20 mines
located in the PRB, 13 of
which are located in the
Wyoming portion.
located in the PRB, 13 of
which are located in the
Wyoming portion.
•One out of every five US
homes and businesses is
powered by coal mined
in Wyoming.
homes and businesses is
powered by coal mined
in Wyoming.
•The largest mines in the
PRB are capable of
producing 100 mt/year.
PRB are capable of
producing 100 mt/year.
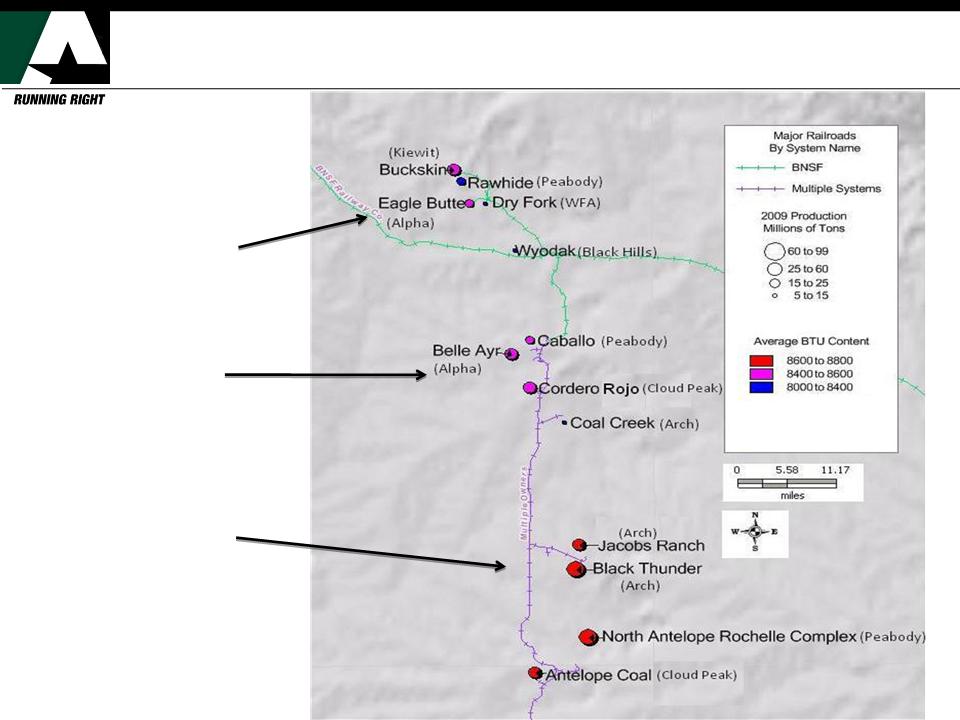
Gillette PRB Coal Field
Northern Mines
-74 million tons
-8,000-8,400 Btu/lb
Central Mines
-101 million tons
-8,400-8,600 Btu/lb
Southern Mines
-242 million tons
-8,600-8,800 Btu/lb
Total 2009 Gillette Coal
Field Production: 417 million
tons
Field Production: 417 million
tons
Source: MSHA 7000-2, Velocity Suite
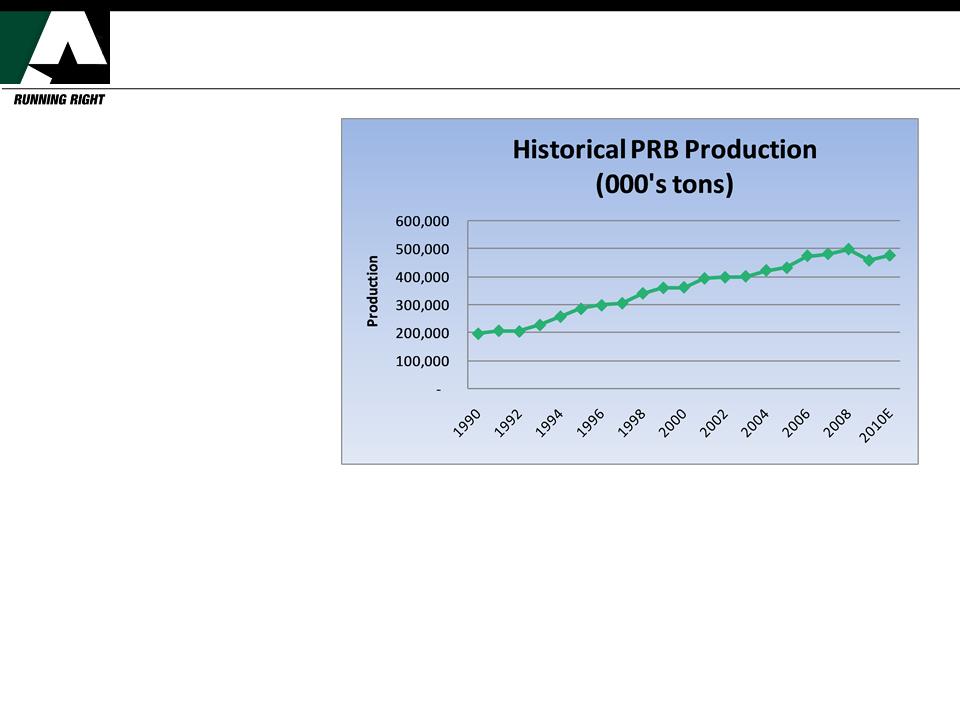
Historical PRB Production
6
•PRB production has steadily
increased over the last twenty
years with the exception of a
dip in 2009.
increased over the last twenty
years with the exception of a
dip in 2009.
•The EIA estimates that PRB
production will reach 474
million tons in 2010.
production will reach 474
million tons in 2010.
•Other basins have fluctuating
production levels whereas PRB
has demonstrated a consistent
upward trend.
production levels whereas PRB
has demonstrated a consistent
upward trend.
Source: MSHA 7000-2, Velocity Suite, EIA
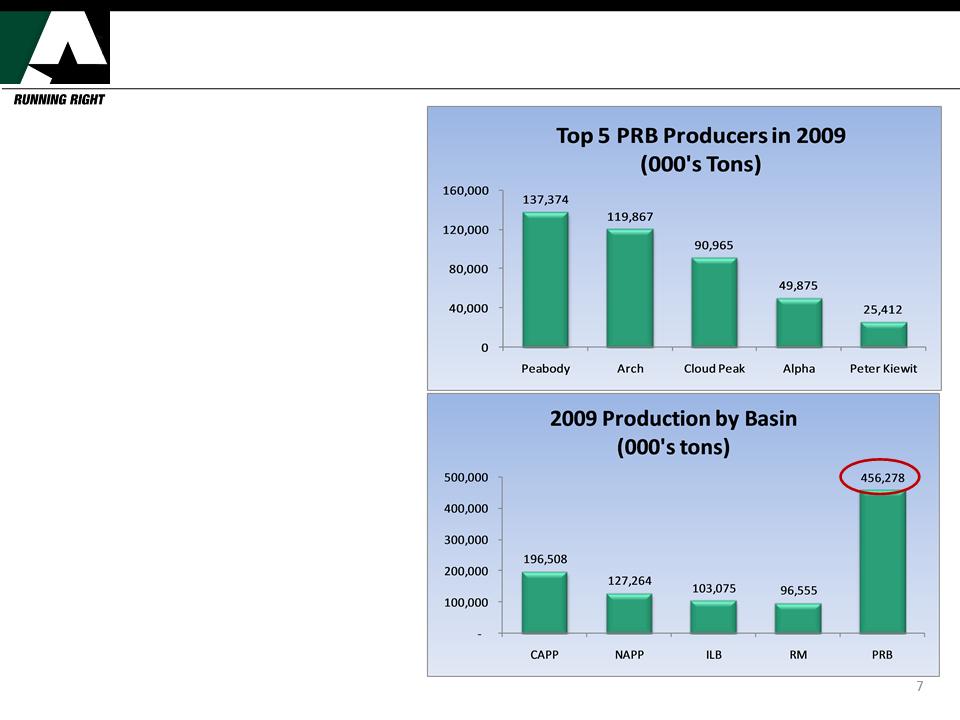
2009 Top Producers and Production
•Peabody, Arch, Cloud Peak, Alpha
and Peter Kiewit are the top 5
producers in the PRB.
and Peter Kiewit are the top 5
producers in the PRB.
•The top 5 producers account for
93% of basin production.
93% of basin production.
•PRB accounts for approximately
41% of US coal production.
41% of US coal production.
•Low price, low sulfur, and desirable
combustion characteristics have
contributed to market dominance.
combustion characteristics have
contributed to market dominance.
Source: MSHA 7000-2, Velocity Suite
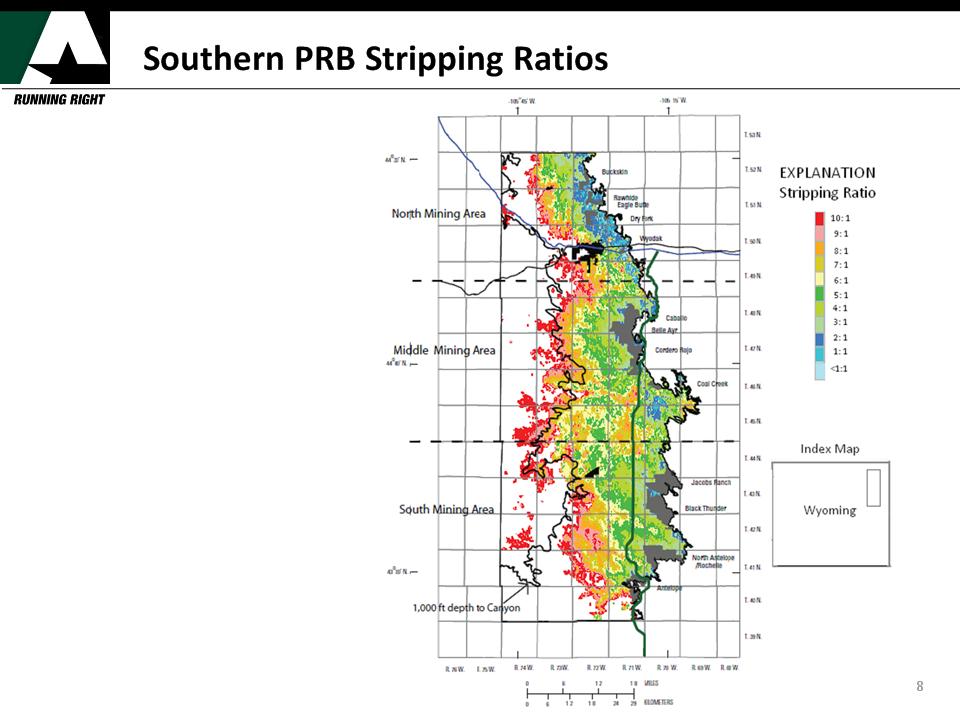
•As mines expand westward,
stripping ratios (and costs)
increase due to greater
overburden and thinning
seams.
stripping ratios (and costs)
increase due to greater
overburden and thinning
seams.
•Mines in the Southern part of
the region will need to cross
over to the other side of the
Joint Line.
the region will need to cross
over to the other side of the
Joint Line.
•The USGS estimates that
over 1 B tons of coal may
be left un-mined
beneath the Joint Line
over 1 B tons of coal may
be left un-mined
beneath the Joint Line
•Northern and mid portions of
the SPRB will not be affected
by the Joint Line.
the SPRB will not be affected
by the Joint Line.
Source: U.S. Geological Survey Open-File Report 2008-1202
Bureau of Land Management
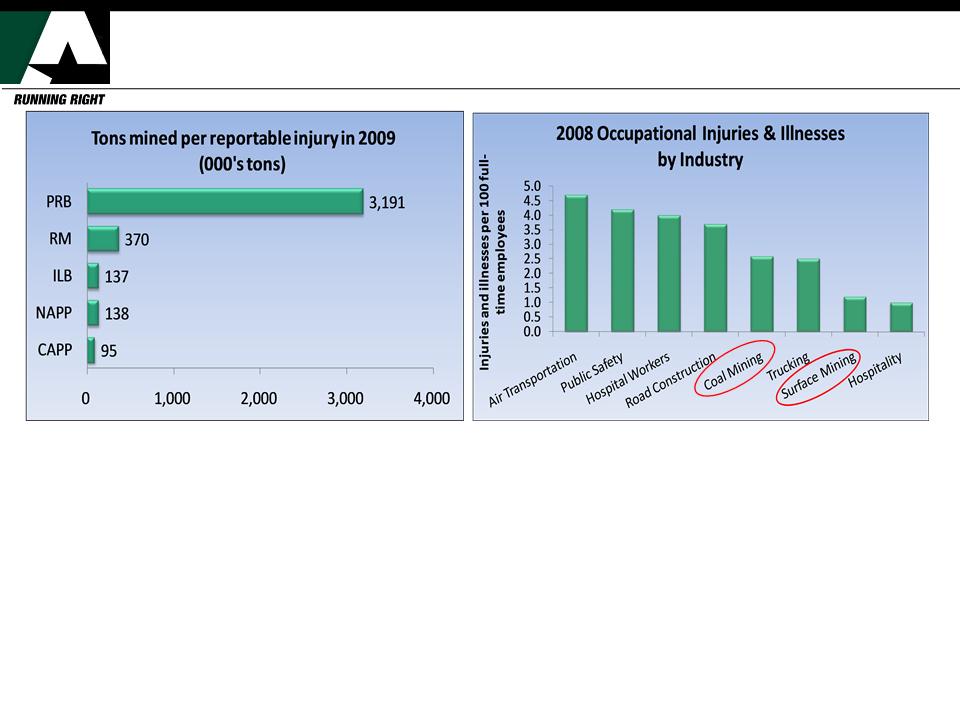
Reportable Injury Rates by Basin
9
•PRB had only 1 injury for every 3.2 million tons of coal mined on annual basis.
•Two-thirds of US coal mines operate each year without a single lost time work injury.
•Between 1990 and 2008, there was a 70% decrease in total US coal mining injuries.
Source: MSHA 7000-1 , Velocity Suite, Bureau of Labor Statistics
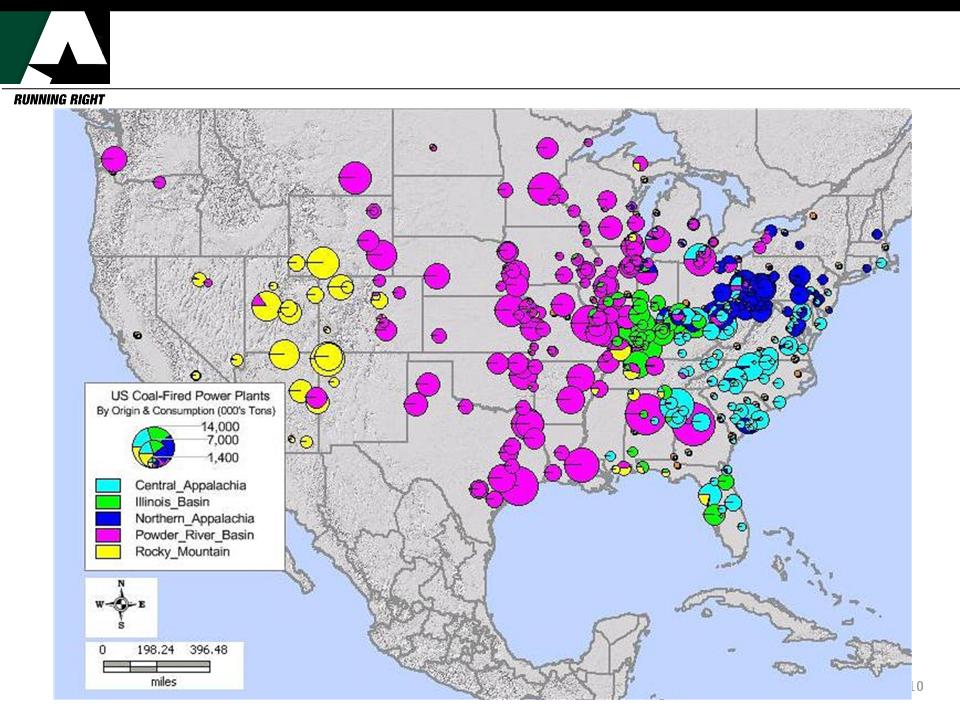
U.S. Coal-Fired Power Plants by Coal Origin
Source: Velocity Suite
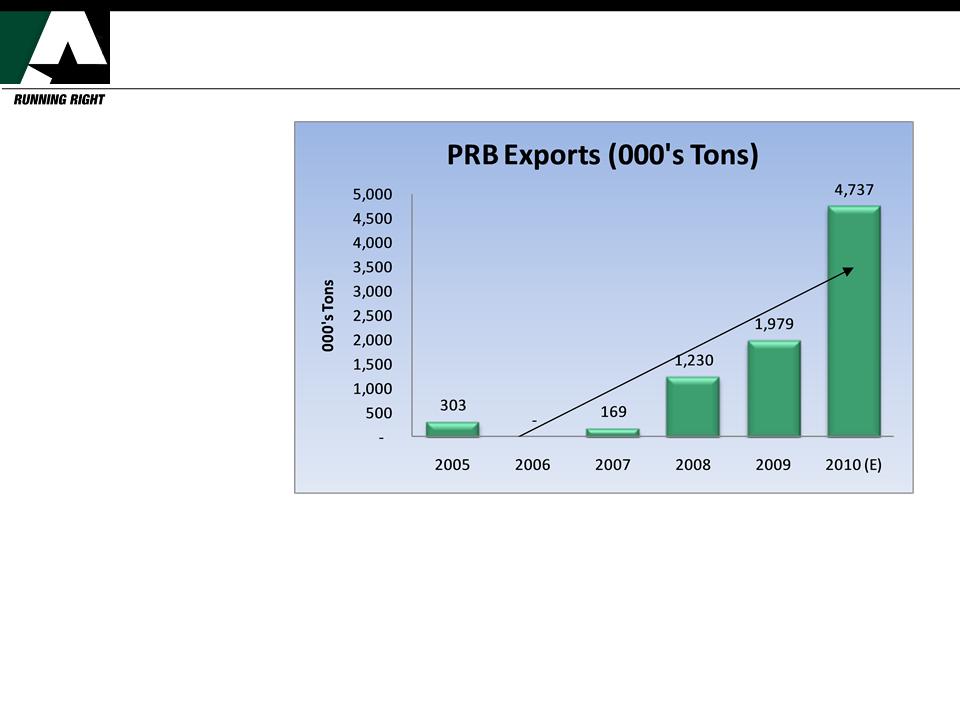
Significant Increase in PRB Exports
11
Source: Genscape
•PRB exports have
steadily increased over
time.
steadily increased over
time.
•Thriving Asian coal
demand has led to a
significant increase of
PRB exports.
demand has led to a
significant increase of
PRB exports.
•PRB coal compares
favorably to Indonesia
coal.
favorably to Indonesia
coal.
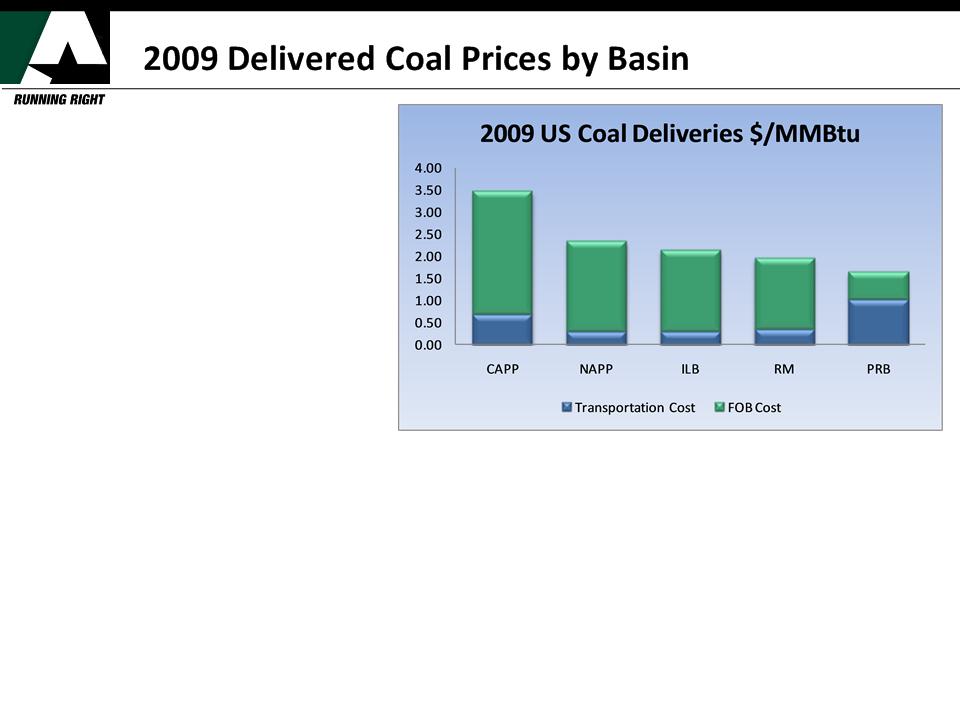
12
•Unlike the other basins,
transportation costs dwarf FOB costs
in the PRB.
transportation costs dwarf FOB costs
in the PRB.
•PRB is a very competitive basin
provided that rail rates remain
reasonable.
provided that rail rates remain
reasonable.
•Average transportation cost in PRB
is $1/MMBtu. For other basins, the
average transportation cost is
$0.47/MMBtu.
is $1/MMBtu. For other basins, the
average transportation cost is
$0.47/MMBtu.
•Average coal price in PRB is
$0.65/MMBtu compared to
$2.19/MMBtu in other basins.
$0.65/MMBtu compared to
$2.19/MMBtu in other basins.
Source: EIA 923, Velocity Suite

PRB Challenges -- Regulatory Issues
• Section 404 Water Permit
– Section 404 of the Clean Water Act regulates the discharge of dredged, excavated,
or fill material in wetlands, streams, rivers, and other U.S. waters.
or fill material in wetlands, streams, rivers, and other U.S. waters.
– Like the East, the 404 issue will affect the PRB.
– The Nationwide Permit 21 will likely expire requiring individual permits for wetlands
that are jurisdictional.
that are jurisdictional.
• Stream Buffer Zone
– Stream avoidance could significantly impact PRB.
– OSM has stated that this rule will affect future amendments and leases.
• Sage Grouse
– The Sage Grouse has been listed under the Endangered Species Act as “warranted
but precluded” meaning that this will be revisited next June.
but precluded” meaning that this will be revisited next June.
– This listing could significantly impact mining and other development.
– Industry is responding by working on Candidate Conservation Agreements with
Assurances (CCAA). This will provide conservation measures for protection of the
bird and its habitat allowing mining operations to continue .
Assurances (CCAA). This will provide conservation measures for protection of the
bird and its habitat allowing mining operations to continue .
• Air Quality
13
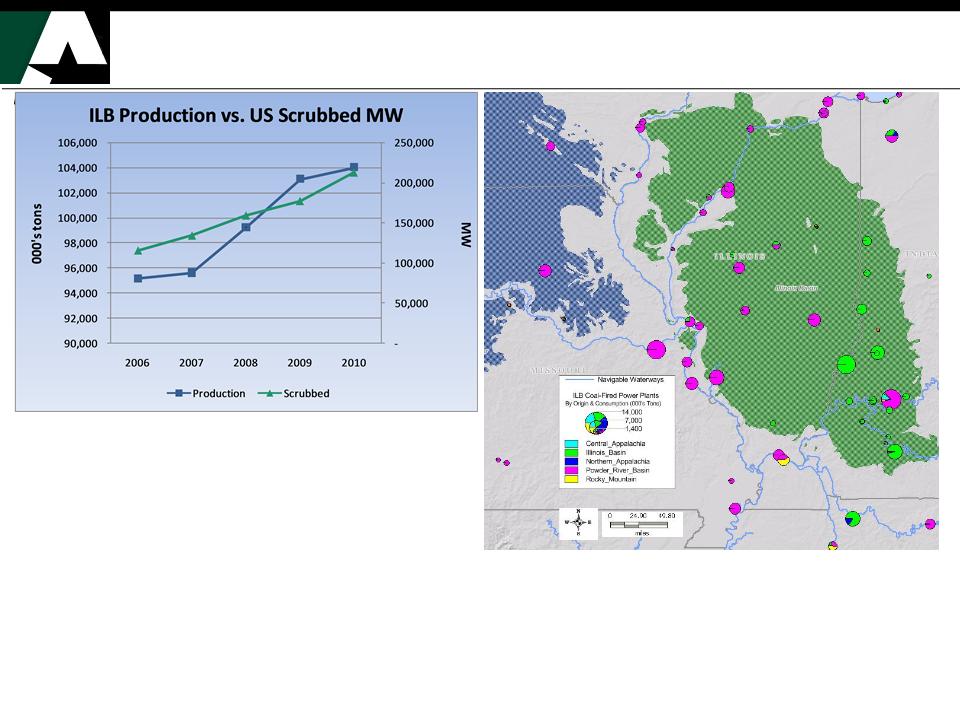
Illinois Basin Challenge
14
•Increased scrubbers, lower SO2 allowance prices, low
mining costs and advantageous transportation options
may allow ILB coal to displace PRB coal at some units.
mining costs and advantageous transportation options
may allow ILB coal to displace PRB coal at some units.
•PRB is losing its low sulfur advantage due to more
scrubbers coming online and low allowance prices.
scrubbers coming online and low allowance prices.
•Average SO2 allowance price in 2010 is $57/ton down
from an average price of $810/ton in 2005.
from an average price of $810/ton in 2005.
Source: MSHA 7000-2, Ventyx, U.S. EPA CEMS, U.S. EPA Clean
Air Markets unit characteristics database
Air Markets unit characteristics database
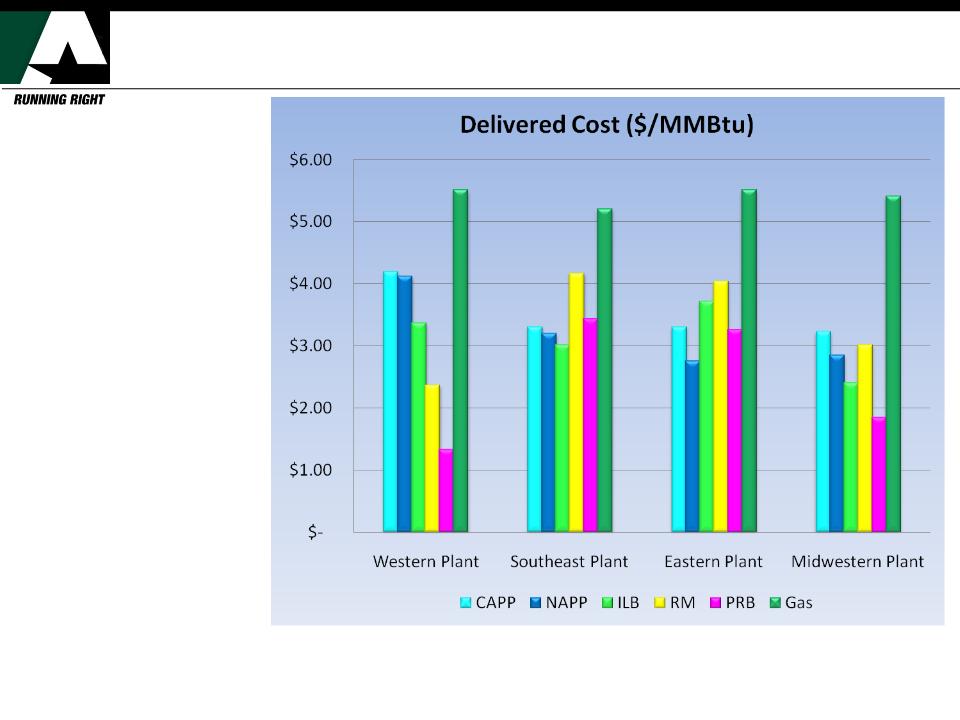
Natural Gas Challenge -- Delivered Basin Cost
15
Source: EIA 923, Velocity Suite, ANR
•PRB costs are more
competitive when
delivered to Western and
Midwestern plants.
competitive when
delivered to Western and
Midwestern plants.
•PRB delivered costs:
•Western $1.34
•Midwestern $1.85
•Eastern $3.27
•Southeastern $3.44
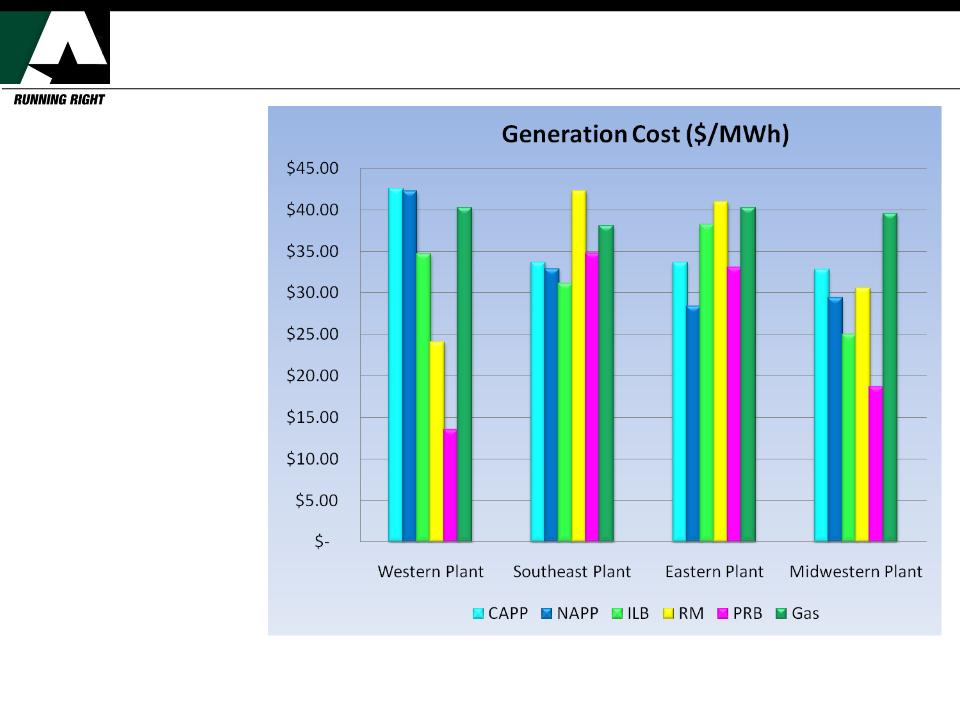
Natural Gas Challenge - Generation Costs
16
•Gas is much more
competitive in the
Southeast and Eastern
regions.
competitive in the
Southeast and Eastern
regions.
•Gas generation costs
don’t pose much threat
to the PRB at today’s
prices.
don’t pose much threat
to the PRB at today’s
prices.
•If delivered coal prices
climb high enough or
gas prices fall low
enough, all basins could
be at risk.
climb high enough or
gas prices fall low
enough, all basins could
be at risk.
Heat rate assumptions: Coal - 10,100 btu, Gas - 7,300 btu; SO2 allowance costs - $25/ton
Source: EIA 923, Velocity Suite, ICAP, Internal

Market Opportunities
• A decline in CAPP production due to MTR regulations and 404
permits could present more opportunities for PRB coal.
permits could present more opportunities for PRB coal.
• There are 13 plants currently under construction that will
primarily burn PRB coal. These plants total approximately 7,000
MW which equates to around 24 million tons annually.
primarily burn PRB coal. These plants total approximately 7,000
MW which equates to around 24 million tons annually.
• Return to $5+/MMBtu gas may allow coal to displace some gas
generation
generation
• Economic recovery and decreasing utility stockpiles will push
demand for more thermal coal
demand for more thermal coal
• Other opportunities for thermal coal:
• Plug-in hybrid vehicles
• China, India and developing world will increase demand
17
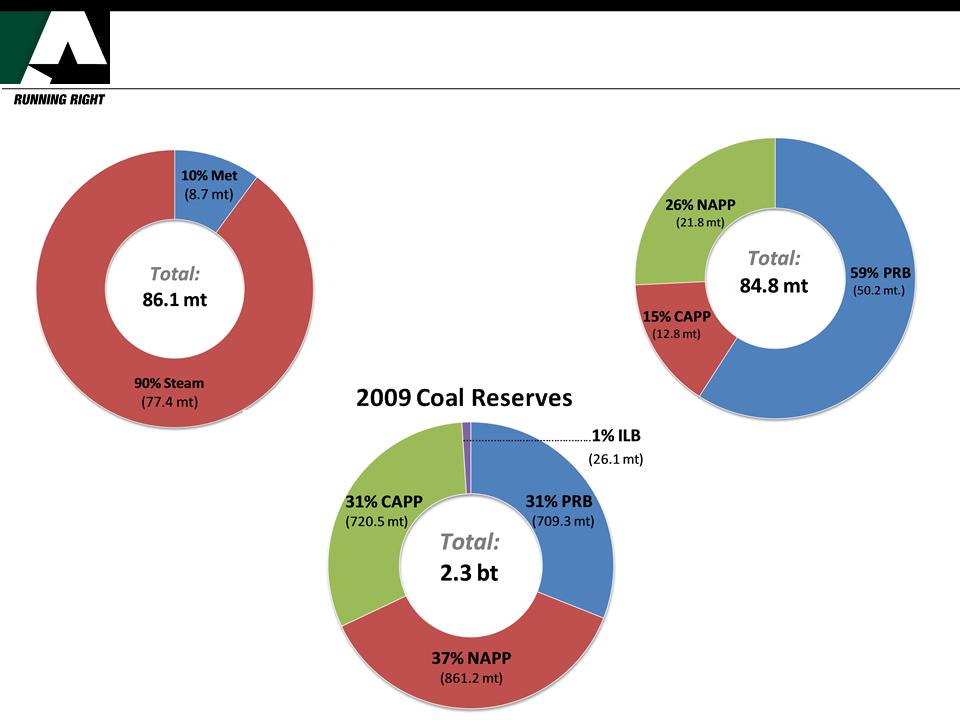
Alpha 2009 Sales & Production Overview
18
2009 Coal Sales*
2009 Production
*Coal sales include broker coal
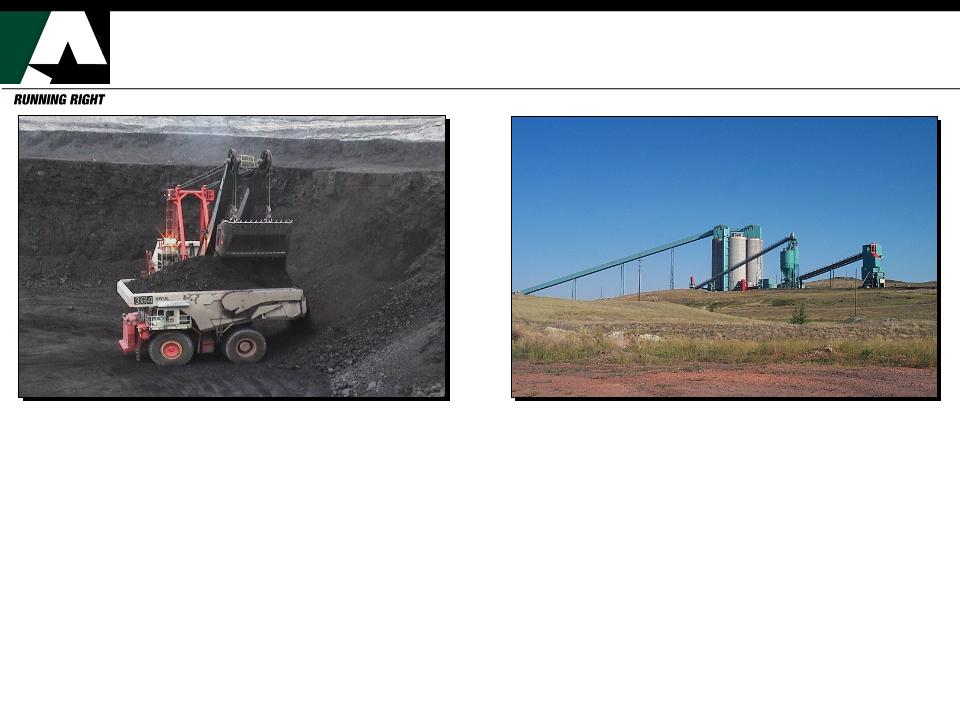
Alpha Coal West - 2009
19
Belle Ayr
Eagle Butte
• BNSF/UP rail access
• 28.4 million tons
• 8,550 Btu, 0.63 Lb. SO2/MMBtu
• 255 MM tons reserves
• BNSF rail access
• 21.9 million tons
• 8,420 Btu, 0.88 Lb. SO2/MMBtu
• 505 MM tons reserves
§ Truck/shovel mining method
§ 630 employees

Summary
• All coal basins have challenges, but the PRB’s
challenges are more manageable.
challenges are more manageable.
• PRB should be able to continue to provide a
significant portion of US coal for many years to come
and new international markets may emerge.
significant portion of US coal for many years to come
and new international markets may emerge.
• Alpha is well-positioned as one of the top 5 PRB
producers.
producers.
20