Attached files
| file | filename |
|---|---|
| 8-K - 8-K - UNIVERSAL AMERICAN CORP. | a10-12184_18k.htm |
Exhibit 99.1
|
|
Goldman Sachs Healthcare Conference June 17, 2010 |
|
|
Forward-Looking Statements Certain matters discussed in this presentation and oral statements made from time to time by representatives of the Company (including, but not limited to, statements regarding the identification of acquisition candidates, and the completion and/or integration or accretion of any such transactions; statements regarding our expectations of Universal American’s operating plans and strategies generally; statements regarding our expectations of the performance of our Medicare Supplement and Medicare Advantage businesses and other lines of business, including the prediction of loss ratios and lapsation; the adequacy of reserves; our ability to institute future rate increases; expectations regarding our Part D program, including our estimates of membership, costs and revenues; and future operating results) may constitute forward-looking statements within the meaning of the Private Securities Litigation Reform Act of 1995. Although Universal American believes that the expectations reflected in such forward-looking statements are based upon reasonable assumptions, it can give no assurance that its expectations will be achieved. Forward-looking information is subject to certain risks, trends and uncertainties that could cause actual results to differ materially from those projected. Many of these factors are beyond Universal American's ability to control or predict. Important factors that may cause actual results to differ materially and that could impact Universal American and the statements contained in this presentation can be found in Universal American's filings with the Securities and Exchange Commission including quarterly reports on Form 10-Q, current reports on Form 8-K and annual reports on Form 10-K. For forward-looking statements in this presentation, Universal American claims the protection of the safe harbor for forward-looking statements contained in the Private Securities Litigation Reform Act of 1995. Universal American assumes no obligation to update or supplement any forward-looking statements whether as a result of new information, future events or otherwise. The discussion in this presentation of Universal American’s financial performance includes financial measures that are not derived from generally accepted accounting principles, or GAAP. Information regarding these non-GAAP financial measures is available in our quarterly earnings press releases in the Investor Relations section of Universal American’s website at www.universalamerican.com. |
|
|
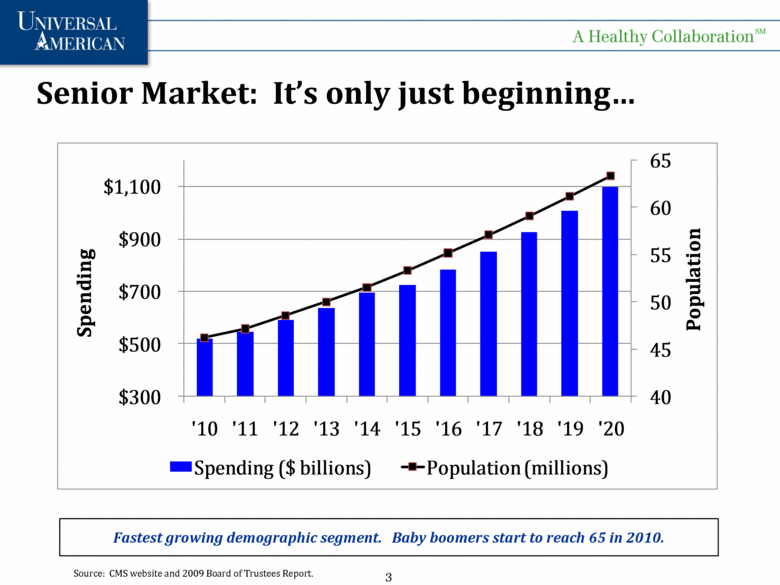
Senior Market: It’s only just beginning... Fastest growing demographic segment. Baby boomers start to reach 65 in 2010. Source: CMS website and 2009 Board of Trustees Report. 40 45 50 55 60 65 $300 $500 $700 $900 $1,100 '10 '11 '12 '13 '14 '15 '16 '17 '18 '19 '20 Population Spending Spending ($ billions) Population (millions) |
|
|
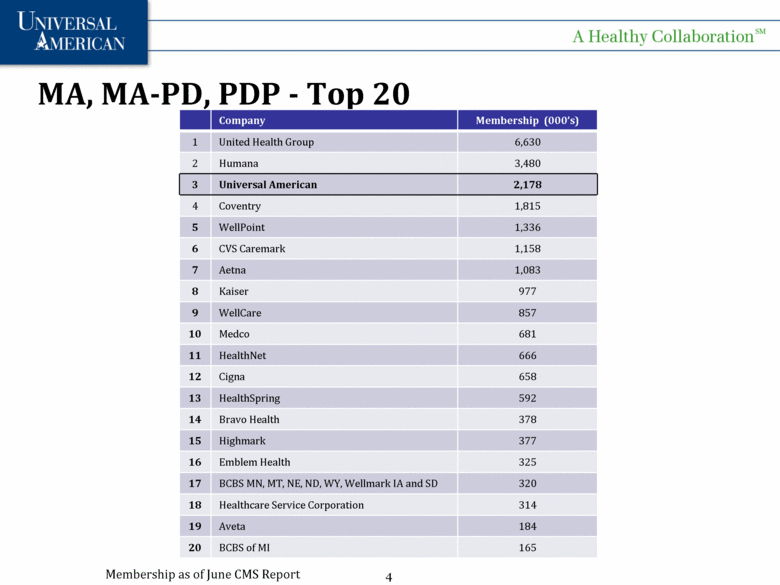
MA, MA-PD, PDP - Top 20 Company Membership (000’s) 1 United Health Group 6,630 2 Humana 3,480 3 Universal American 2,178 4 Coventry 1,815 5 WellPoint 1,336 6 CVS Caremark 1,158 7 Aetna 1,083 8 Kaiser 977 9 WellCare 857 10 Medco 681 11 HealthNet 666 12 Cigna 658 13 HealthSpring 592 14 Bravo Health 378 15 Highmark 377 16 Emblem Health 325 17 BCBS MN, MT, NE, ND, WY, Wellmark IA and SD 320 18 Healthcare Service Corporation 314 19 Aveta 184 20 BCBS of MI 165 Membership as of June CMS Report |
|
|
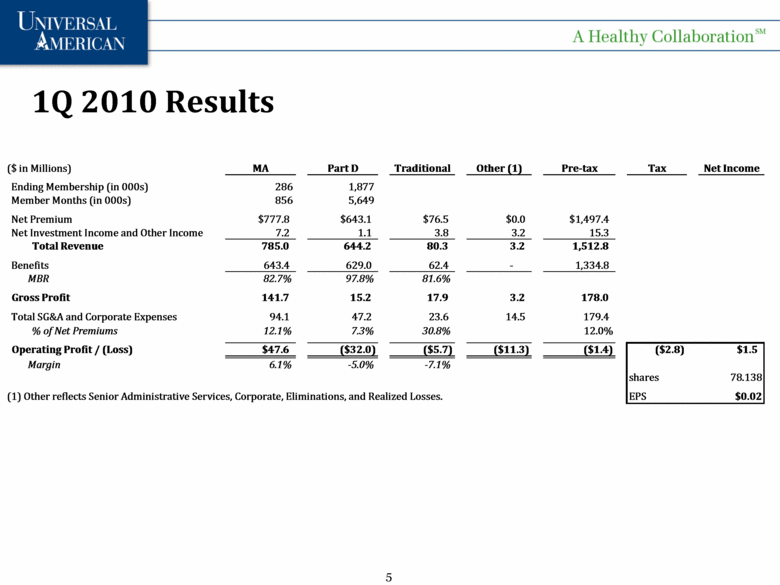
1Q 2010 Results ($ in Millions) MA Part D Traditional Other (1) Pre-tax Tax Net Income Ending Membership (in 000s) 286 1,877 Member Months (in 000s) 856 5,649 Net Premium $777.8 $643.1 $76.5 $0.0 $1,497.4 Net Investment Income and Other Income 7.2 1.1 3.8 3.2 15.3 Total Revenue 785.0 644.2 80.3 3.2 1,512.8 Benefits 643.4 629.0 62.4 - 1,334.8 MBR 82.7% 97.8% 81.6% Gross Profit 141.7 15.2 17.9 3.2 178.0 Total SG&A and Corporate Expenses 94.1 47.2 23.6 14.5 179.4 % of Net Premiums 12.1% 7.3% 30.8% 12.0% Operating Profit / (Loss) $47.6 ($32.0) ($5.7) ($11.3) ($1.4) ($2.8) $1.5 Margin 6.1% -5.0% -7.1% shares 78.138 (1) Other reflects Senior Administrative Services, Corporate, Eliminations, and Realized Losses. EPS $0.02 |
|
|
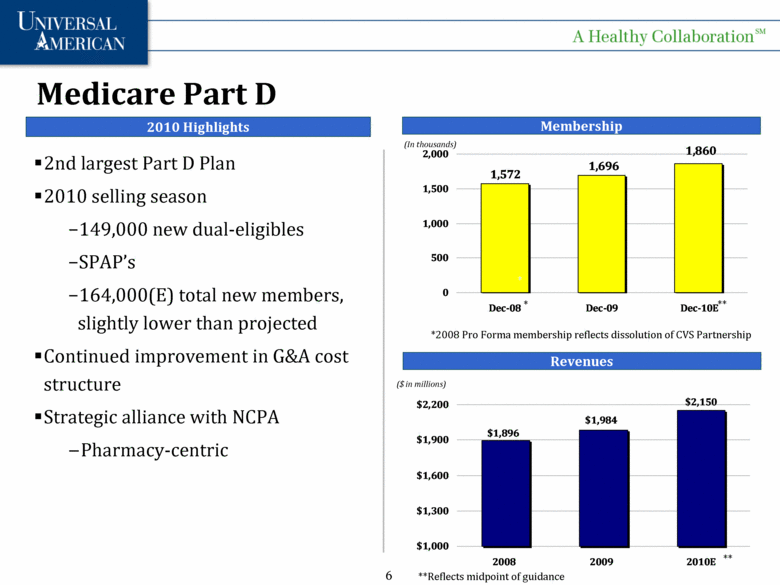
Medicare Part D 2010 Highlights Revenues Membership ($ in millions) (In thousands) *2008 Pro Forma membership reflects dissolution of CVS Partnership ** **Reflects midpoint of guidance ** * 2nd largest Part D Plan 2010 selling season 149,000 new dual-eligibles SPAP’s 164,000(E) total new members, slightly lower than projected Continued improvement in G&A cost structure Strategic alliance with NCPA Pharmacy-centric $1,896 $1,984 $2,150 $1,000 $1,300 $1,600 $1,900 $2,200 2008 2009 2010E 1,860 1,696 1,572 0 500 1,000 1,500 2,000 Dec-08 Dec-09 Dec-10E |
|
|
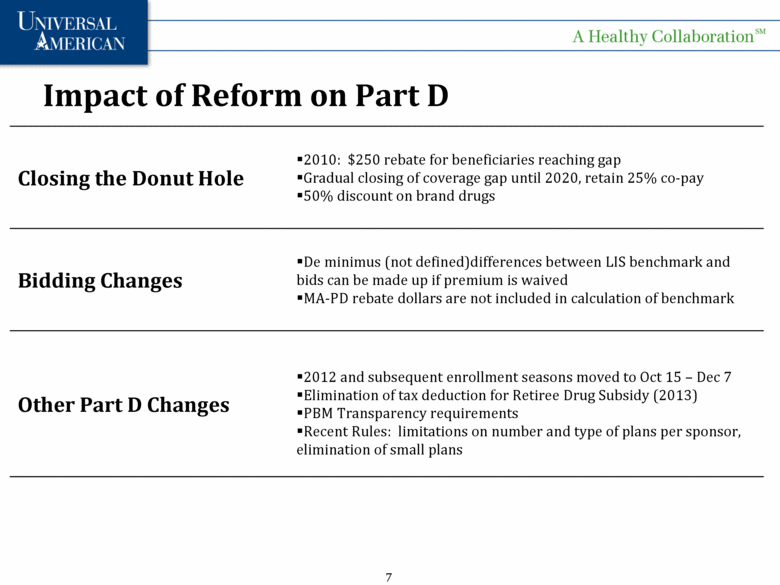
Closing the Donut Hole 2010: $250 rebate for beneficiaries reaching gap Gradual closing of coverage gap until 2020, retain 25% co-pay 50% discount on brand drugs Bidding Changes De minimus (not defined) differences between LIS benchmark and bids can be made up if premium is waived MA-PD rebate dollars are not included in calculation of benchmark Other Part D Changes 2012 and subsequent enrollment seasons moved to Oct 15 – Dec 7 Elimination of tax deduction for Retiree Drug Subsidy (2013) PBM Transparency requirements Recent Rules: limitations on number and type of plans per sponsor, elimination of small plans Impact of Reform on Part D |
|
|
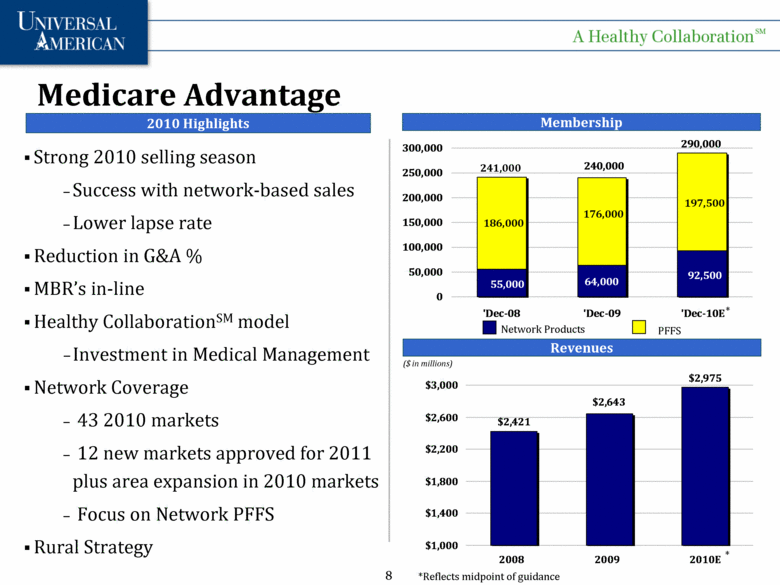
Medicare Advantage 2010 Highlights Revenues Membership ($ in millions) 241,000 Network Products PFFS *Reflects midpoint of guidance * * Strong 2010 selling season Success with network-based sales Lower lapse rate Reduction in G&A % MBR’s in-line Healthy CollaborationSM model Investment in Medical Management Network Coverage 43 2010 markets 12 new markets approved for 2011 plus area expansion in 2010 markets Focus on Network PFFS Rural Strategy $2,975 $2,421 $2,643 $1,000 $1,400 $1,800 $2,200 $2,600 $3,000 2008 2009 2010E 55,000 64,000 92,500 197,500 176,000 186,000 240,000 290,000 0 50,000 100,000 150,000 200,000 250,000 300,000 'Dec-08 'Dec-09 'Dec-10E |
|
|
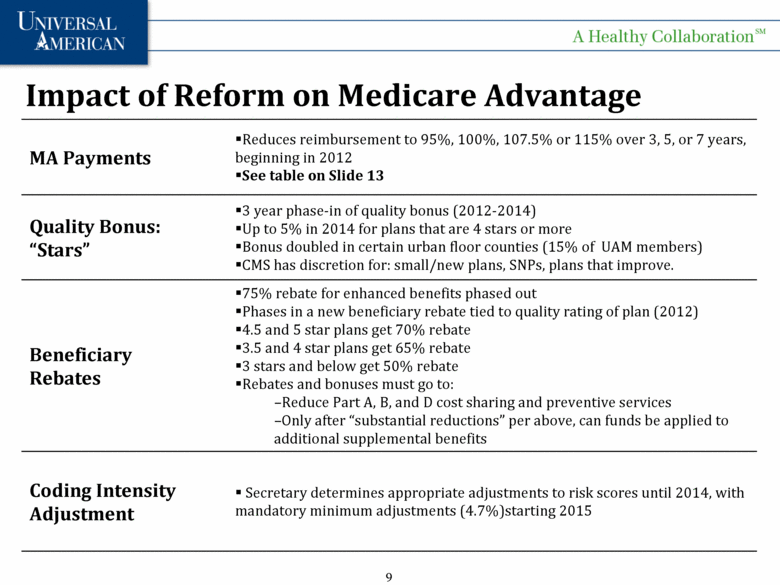
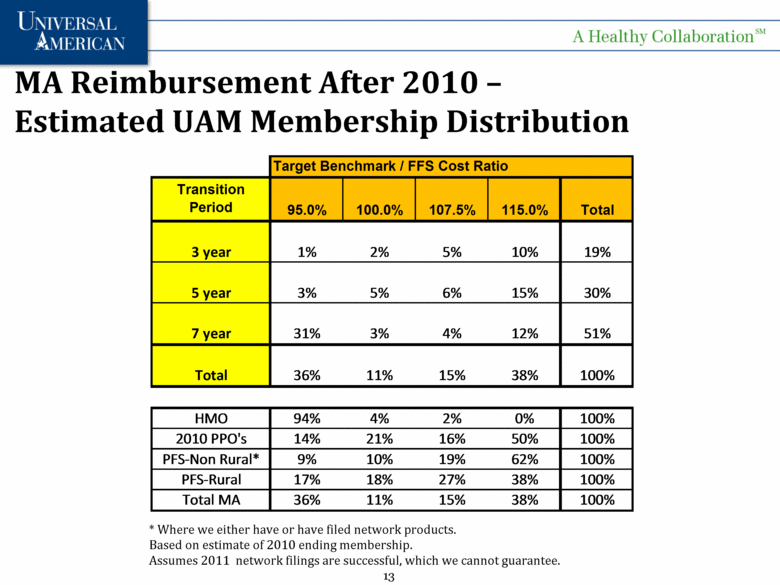
MA Payments Reduces reimbursement to 95%, 100%, 107.5% or 115% over 3, 5, or 7 years, beginning in 2012 See table on Slide 13 Quality Bonus: “Stars” 3 year phase-in of quality bonus (2012-2014) Up to 5% in 2014 for plans that are 4 stars or more Bonus doubled in certain urban floor counties (15% of UAM members) CMS has discretion for: small/new plans, SNPs, plans that improve. Beneficiary Rebates 75% rebate for enhanced benefits phased out Phases in a new beneficiary rebate tied to quality rating of plan (2012) 4.5 and 5 star plans get 70% rebate 3.5 and 4 star plans get 65% rebate 3 stars and below get 50% rebate Rebates and bonuses must go to: Reduce Part A, B, and D cost sharing and preventive services Only after “substantial reductions” per above, can funds be applied to additional supplemental benefits Coding Intensity Adjustment Secretary determines appropriate adjustments to risk scores until 2014, with mandatory minimum adjustments (4.7%)starting 2015 Impact of Reform on Medicare Advantage |
|
|
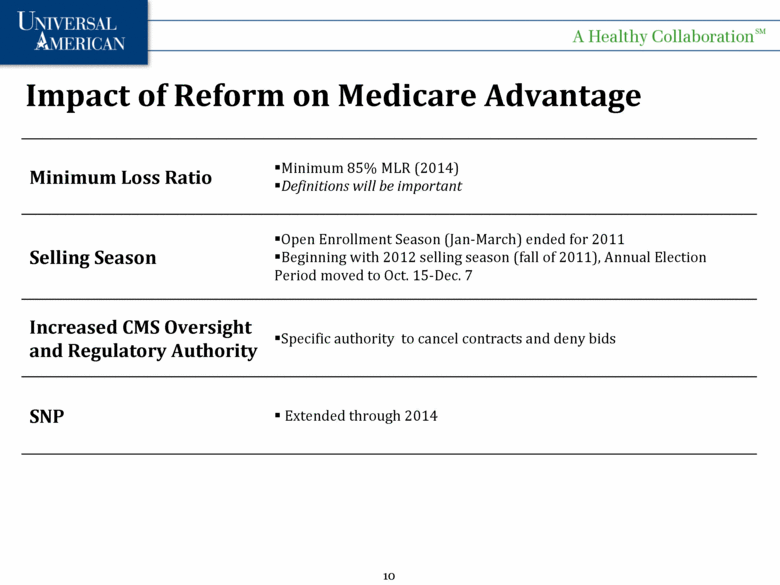
Minimum Loss Ratio Minimum 85% MLR (2014) Definitions will be important Selling Season Open Enrollment Season (Jan-March) ended for 2011 Beginning with 2012 selling season (fall of 2011), Annual Election Period moved to Oct. 15-Dec. 7 Increased CMS Oversight and Regulatory Authority Specific authority to cancel contracts and deny bids SNP Extended through 2014 Impact of Reform on Medicare Advantage |
|
|
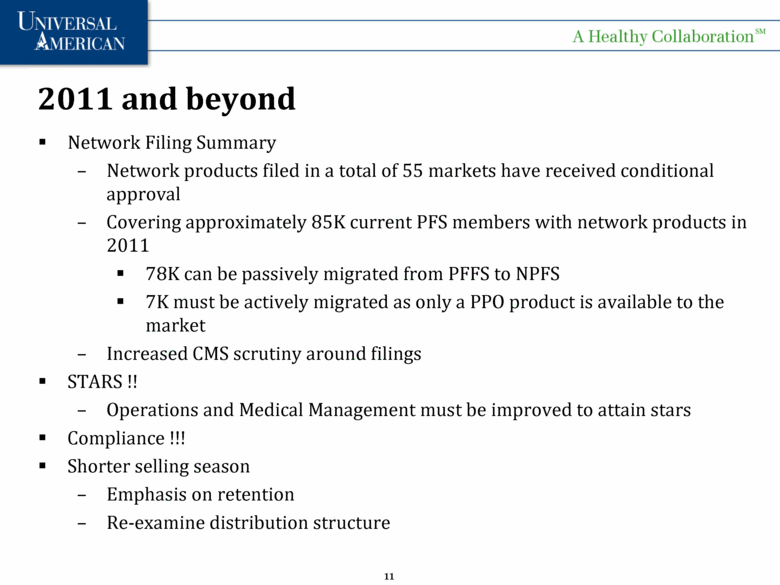
2011 and beyond Network Filing Summary Network products filed in a total of 55 markets have received conditional approval Covering approximately 85K current PFS members with network products in 2011 78K can be passively migrated from PFFS to NPFS 7K must be actively migrated as only a PPO product is available to the market Increased CMS scrutiny around filings STARS !! Operations and Medical Management must be improved to attain stars Compliance !!! Shorter selling season Emphasis on retention Re-examine distribution structure |
|
|
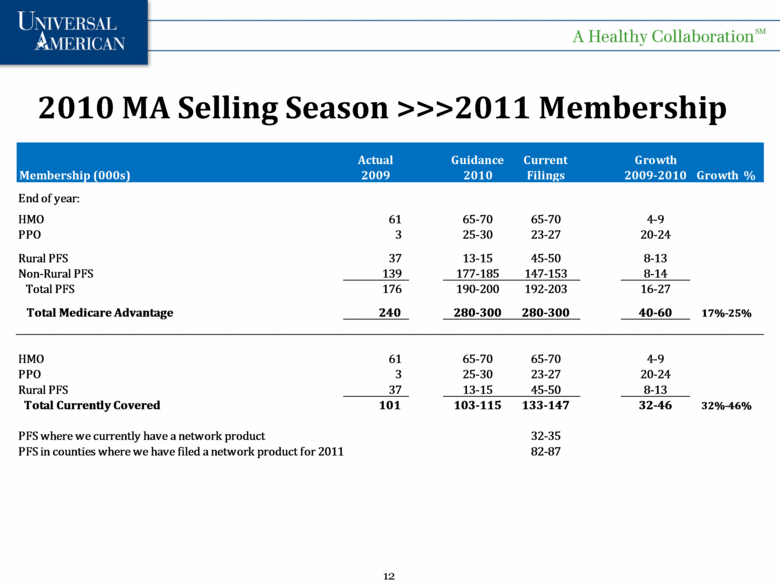
2010 MA Selling Season >>>2011 Membership Membership (000s) Actual 2009 Guidance 2010 Current Filings Growth 2009-2010 Growth % End of year: HMO 61 65-70 65-70 4-9 PPO 3 25-30 23-27 20-24 Rural PFS 37 13-15 45-50 8-13 Non-Rural PFS 139 177-185 147-153 8-14 Total PFS 176 190-200 192-203 16-27 Total Medicare Advantage 240 280-300 280-300 40-60 17%-25% HMO 61 65-70 65-70 4-9 PPO 3 25-30 23-27 20-24 Rural PFS 37 13-15 45-50 8-13 Total Currently Covered 101 103-115 133-147 32-46 32%-46% PFS where we currently have a network product 32-35 PFS in counties where we have filed a network product for 2011 82-87 |
|
|
MA Reimbursement After 2010 – Estimated UAM Membership Distribution * Where we either have or have filed network products. Based on estimate of 2010 ending membership. Assumes 2011 network filings are successful, which we cannot guarantee. Target Benchmark / FFS Cost Ratio Transition Period 95.0% 100.0% 107.5% 115.0% Total 3 year 1% 2% 5% 10% 19% 5 year 3% 5% 6% 15% 30% 7 year 31% 3% 4% 12% 51% Total 36% 11% 15% 38% 100% HMO 94% 4% 2% 0% 100% 2010 PPO's 14% 21% 16% 50% 100% PFS-Non Rural* 9% 10% 19% 62% 100% PFS-Rural 17% 18% 27% 38% 100% Total MA 36% 11% 15% 38% 100% |
|
|
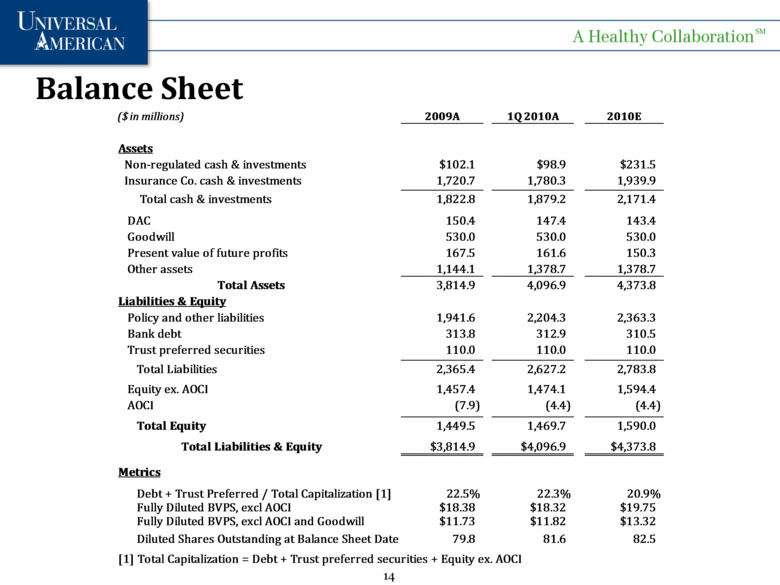
Balance Sheet ($ in millions) 2009A 1Q 2010A 2010E Assets Non-regulated cash & investments $102.1 $98.9 $231.5 Insurance Co. cash & investments 1,720.7 1,780.3 1,939.9 Total cash & investments 1,822.8 1,879.2 2,171.4 DAC 150.4 147.4 143.4 Goodwill 530.0 530.0 530.0 Present value of future profits 167.5 161.6 150.3 Other assets 1,144.1 1,378.7 1,378.7 Total Assets 3,814.9 4,096.9 4,373.8 Liabilities & Equity Policy and other liabilities 1,941.6 2,204.3 2,363.3 Bank debt 313.8 312.9 310.5 Trust preferred securities 110.0 110.0 110.0 Total Liabilities 2,365.4 2,627.2 2,783.8 Equity ex. AOCI 1,457.4 1,474.1 1,594.4 AOCI (7.9) (4.4) (4.4) Total Equity 1,449.5 1,469.7 1,590.0 Total Liabilities & Equity $3,814.9 $4,096.9 $4,373.8 Metrics Debt + Trust Preferred / Total Capitalization [1] 22.5% 22.3% 20.9% Fully Diluted BVPS, excl AOCI $18.38 $18.32 $19.75 Fully Diluted BVPS, excl AOCI and Goodwill $11.73 $11.82 $13.32 Diluted Shares Outstanding at Balance Sheet Date 79.8 81.6 82.5 [1] Total Capitalization = Debt + Trust preferred securities + Equity ex. AOCI |
|
|
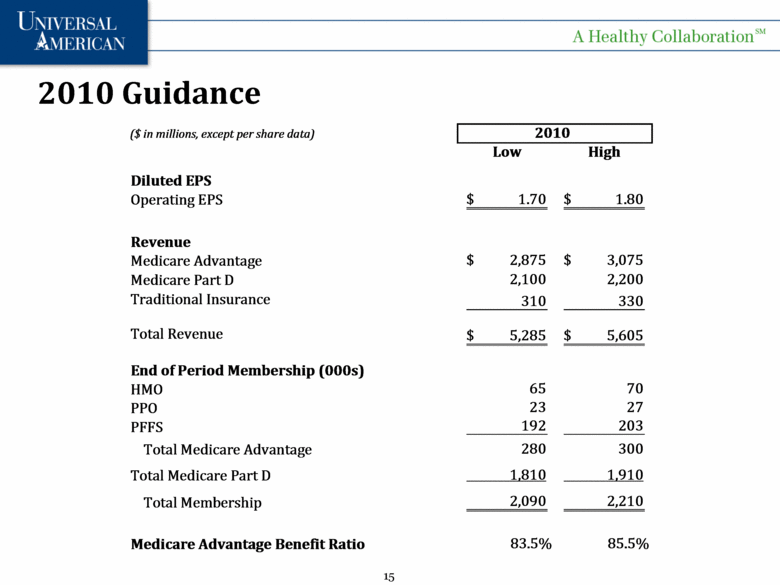
2010 Guidance ($ in millions, except per share data) Low High Diluted EPS Operating EPS 1.70 $ 1.80 $ Revenue Medicare Advantage 2,875 $ 3,075 $ Medicare Part D 2,100 2,200 Traditional Insurance 310 330 Total Revenue 5,285 $ 5,605 $ End of Period Membership (000s) HMO 65 70 PPO 23 27 PFFS 192 203 Total Medicare Advantage 280 300 Total Medicare Part D 1,810 1,910 Total Membership 2,090 2,210 Medicare Advantage Benefit Ratio 83.5% 85.5% 2010 |
|
|
[LOGO] |

