Attached files
| file | filename |
|---|---|
| EX-23.1 - EX-23.1 - UNIVERSAL AMERICAN CORP. | a2202322zex-23_1.htm |
| EX-31.2 - EX-31.2 - UNIVERSAL AMERICAN CORP. | a2202322zex-31_2.htm |
| EX-21.1 - EX-21.1 - UNIVERSAL AMERICAN CORP. | a2202322zex-21_1.htm |
| EX-32.1 - EX-32.1 - UNIVERSAL AMERICAN CORP. | a2202322zex-32_1.htm |
| EX-12.1 - EX-12.1 - UNIVERSAL AMERICAN CORP. | a2202322zex-12_1.htm |
| EX-31.1 - EX-31.1 - UNIVERSAL AMERICAN CORP. | a2202322zex-31_1.htm |
| EX-10.11.1 - EX-10.11.1 - UNIVERSAL AMERICAN CORP. | a2202322zex-10_111.htm |
Use these links to rapidly review the document
TABLE OF CONTENTS
UNIVERSAL AMERICAN CORP. AND SUBSIDIARIES INDEX TO CONSOLIDATED FINANCIAL STATEMENTS
UNITED STATES
SECURITIES AND EXCHANGE COMMISSION
Washington, D.C. 20549
FORM 10-K
| (Mark One) | ||
ý |
ANNUAL REPORT PURSUANT TO SECTION 13 OR 15(d) OF THE SECURITIES EXCHANGE ACT OF 1934 |
|
For the fiscal year ended December 31, 2010 |
||
OR |
||
o |
TRANSITION REPORT PURSUANT TO SECTION 13 OR 15(d) OF THE SECURITIES EXCHANGE ACT OF 1934 |
|
For the transition period from to |
||
Commission file Number: 0-11321
UNIVERSAL AMERICAN CORP.
(Exact name of registrant as specified in its charter)
| New York (State or other jurisdiction of incorporation or organization) |
11-2580136 (I.R.S. Employer Identification No.) |
Six International Drive, Suite 190, Rye Brook, New York 10573
(Address of principal executive offices and zip code)
(914) 934-5200
(Registrant's telephone number, including area code)
Securities registered pursuant to Section 12(b) of the Act:
| Title of Each Class | Name of Each Exchange On Which Registered | |
|---|---|---|
| Common Stock, par value $.01 per share | New York Stock Exchange, Inc. |
Securities registered pursuant to Section 12(g) of the Act:
None
Indicate by check mark if the registrant is a well known seasoned issuer, as defined in Rule 405 of the Securities Act. Yes o No ý
Indicate by check mark if the registrant is not required to file reports pursuant to Section 13 or 15(d) of the Act. Yes o No ý
Indicate by check mark whether the registrant (1) has filed all reports required to be filed by Section 13 or 15 (d) of the Securities Exchange Act of 1934 during the preceding 12 months (or for such shorter period that the registrant was required to file such reports), and (2) has been subject to such filing requirements for the past 90 days. Yes ý No o
Indicate by check mark whether the registrant has submitted electronically and posted on its corporate Web site, if any, every Interactive Data File required to be submitted and posted pursuant to Rule 405 of Regulation S-T during the preceding 12 months (or for such shorter period that the registrant was required to submit and post such files). Yes o No o
Indicate by check mark if disclosure of delinquent filers pursuant to Item 405 of Regulation S-K is not contained herein, and will not be contained, to the best of registrant's knowledge, in definitive proxy or information statements incorporated by reference in Part III of this Form 10-K or any amendment to this Form 10-K. o
Indicate by check mark whether the registrant is a large accelerated filer, an accelerated filer, a non-accelerated filer, or a smaller reporting company. See definitions of "large accelerated filer," "accelerated filer," and "smaller reporting company" in Rule 12b-2 of the Exchange Act. (Check one):
| Large accelerated filer o | Accelerated filer ý | Non-accelerated filer o (Do not check if a smaller reporting company) |
Smaller reporting company o |
Indicate by check mark whether the registrant is a shell company (as defined in Rule 12b-2 of the Exchange Act). Yes o No ý
The aggregate market value of the registrant's voting and non-voting common stock held by non-affiliates of the registrant on June 30, 2010, the last business day of the registrant's most recently completed second fiscal quarter, was approximately $450 million (based on the closing sales price of the registrant's common stock on that date). As of February 24, 2011, 75,639,323 shares of the registrant's common stock were issued and outstanding.
DOCUMENTS INCORPORATED BY REFERENCE
The information contained in Part III, Items 10-14 of this Annual Report on Form 10-K will either be included in the Company's Proxy Statement to be filed with the U.S. Securities and Exchange Commission, or will be provided in an amendment to this Form 10-K to be filed no later than April 30, 2011.
1
As used in this Annual Report on Form 10-K, "Universal American," "we," "our," and "us" refer to Universal American Corp. and its subsidiaries, except where the context otherwise requires or as otherwise indicated.
DISCLOSURE REGARDING FORWARD LOOKING STATEMENTS
This report, including, without limitation, the information set forth or incorporated by reference in Item 1 "Business," Item 1A "Risk Factors" and Item 7 "Management's Discussion and Analysis of Financial Condition and Results of Operations," and other risks and uncertainties set forth in this report and oral statements made from time to time by our executive officers contains "forward-looking" statements within the meaning of Section 21E of the Securities Exchange Act of 1934, as amended, and the Private Securities Litigation Reform Act of 1995, known as the PSLRA. Statements in this report that are not historical facts are hereby identified as forward-looking statements and are intended to be covered by the safe harbor provisions of the PSLRA. They can be identified by the use of the words "believe," "expect," "predict," "project," "potential," "estimate," "anticipate," "project," "should," "intend," "may," "will," and similar expressions or variations of such words, or by discussion of future financial results and events, strategy or risks and uncertainties, trends and conditions in the Company's business and competitive strengths, all of which involve risks and uncertainties.
Where, in any forward-looking statement, we or our management expresses an expectation or belief as to future results or actions, there can be no assurance that the statement of expectation or belief will result or be achieved or accomplished. Our actual results may differ materially from our expectations, plans or projections. We warn you that forward-looking statements are only predictions and estimates, which are inherently subject to risks, trends and uncertainties, many of which are beyond our ability to control or predict with accuracy and some of which we might not even anticipate. We give no assurance that we will achieve our expectations and we do not assume responsibility for the accuracy and completeness of the forward-looking statements. Future events and actual results, financial and otherwise, may differ materially from the results discussed in the forward-looking statements as a result of many factors, including the risk factors described in Part II, Item 1A of this report. We caution readers not to place undue reliance on these forward-looking statements that speak only as of the date made.
We undertake no obligation, other than as may be required under the federal securities laws, to publicly update or revise any forward-looking statements, whether as a result of new information, future events or otherwise. Although we believe that the expectations reflected in these forward-looking statements are reasonable at the time made, any or all of the forward-looking statements contained in this report and in any other public statements that are made may prove to be incorrect. This may occur as a result of inaccurate assumptions as a consequence of known or unknown risks and uncertainties. All of the forward-looking statements are qualified in their entirety by reference to the factors discussed under the caption "Risk Factors" under Part II, Item 1A of this report. We caution that these risk factors may not be exhaustive. We operate in a continually changing business environment that is highly complicated, regulated and competitive and new risk factors emerge from time to time. We cannot predict these new risk factors, nor can we assess the impact, if any, of the new risk factors on our business or the extent to which any factor or combination of factors may cause actual results to differ materially from those expressed or implied by any forward-looking statement. In light of these risks, uncertainties and assumptions, the forward-looking statements discussed in this report might not occur. You should carefully read this report and the documents that we incorporate by reference in this report in its entirety. It contains information that you should consider in making any investment decision in any of our securities.
2
Additional Information
In connection with the proposed transaction with CVS Caremark described in this report, Newco will file with the SEC a Registration Statement on Form S-4 that will include a proxy statement of Universal American that also constitutes a prospectus of Newco. We will mail the proxy statement/prospectus to our shareholders. BEFORE MAKING ANY VOTING DECISION, SHAREHOLDERS OF UNIVERSAL AMERICAN ARE URGED TO READ THE PROXY STATEMENT/PROSPECTUS CAREFULLY BECAUSE THE PROXY STATEMENT/PROSPECTUS WILL CONTAIN IMPORTANT INFORMATION ABOUT THE PROPOSED TRANSACTION. You may obtain copies of all documents filed with the SEC regarding the proposed transaction, free of charge, at the SEC's website (sec.gov). You will also be able to obtain these documents, free of charge, when filed, from our website, www.UniversalAmerican.com, under the tab "Investors" and then under the tab "SEC Filings."
Universal American and our directors, executive officers and certain other members of management and employees may be soliciting proxies from Universal American shareholders in favor of the proposed transaction. Information regarding the persons who may, under the rules of the SEC, be deemed participants in the solicitation of Universal American shareholders in connection with the proposed transaction will be set forth in the proxy statement/prospectus when it is filed with the SEC. You can find information about our executive officers and directors in its definitive proxy statement filed with the SEC on April 30, 2010.
3
Through our family of companies, we offer a broad array of health insurance and managed care products and services, primarily to the growing Medicare population. Our principal health insurance products for the senior market are Medicare Advantage, insured stand-alone prescription drug benefit plans pursuant to Medicare Part D and Medicare supplement. We also provide prescription benefit management, or PBM, services to affiliated companies and fifteen state pharmacy assistance programs, or SPAPs, and offer PBM services through a number of group contracts.
Collectively, our insurance subsidiaries are licensed or otherwise authorized to sell health insurance, life insurance and annuities in all 50 states, the District of Columbia and Puerto Rico, as well as some U.S. territories. Our managed care subsidiaries operate Medicare Advantage coordinated care plans in Texas, Wisconsin and Oklahoma.
We were incorporated under the laws of the State of New York on August 31, 1981. On December 3, 2007, our common shares began trading on the New York Stock Exchange or the NYSE under the ticker symbol UAM. Previously our common shares were traded on the NASDAQ Stock Market under the ticker symbol UHCO. Our corporate headquarters are located at Six International Drive, Rye Brook, New York 10573 and our telephone number is (914) 934-5200. We make available free of charge on our Internet website at http://www.universalamerican.com our annual reports on Form 10-K, quarterly reports on Form 10-Q, current reports on Form 8-K, and amendments to these reports filed or furnished pursuant to Section 13(a) or 15(d) of the Securities Exchange Act of 1934 as soon as reasonably practicable after we electronically file this material with, or furnish it to, the Securities and Exchange Commission. The reference to our website is not intended to incorporate the information on our website into this filing. You can read or copy materials we file with the SEC at the SEC's Public Reference Room at 100 F Street, NE, Washington, DC 20549. You can obtain information on the operation of the Public Reference Room by calling the SEC at 1-800-SEC-0330. The SEC also maintains an Internet site that contains reports, proxy and information statements, and other information regarding issuers that file electronically with the SEC. Copies of any materials we have filed electronically with the SEC may be accessed at the SEC's website: http://www.sec.gov.
Significant Matters During 2010
Sale of Medicare Part D Business to CVS Caremark
On December 30, 2010, we entered into (i) an Agreement and Plan of Merger (the "CVS Agreement") with CVS Caremark Corporation ("CVS Caremark") and Ulysses Merger Sub, L.L.C., an indirect wholly-owned subsidiary of CVS Caremark, to provide for the purchase of our Medicare Part D Business by CVS Caremark and (ii) a Separation Agreement with Universal American Spin Corp., a newly-formed wholly-owned subsidiary of the Company ("Newco"), to provide for the separation of our Medicare Part D Business from our remaining businesses, which include our Medicare Advantage and Traditional Insurance businesses (collectively, the "Newco Businesses.") We refer to the sale of our Medicare Part D Business to CVS Caremark and related transactions as the "Part D Sale Transaction" or the "Transactions."
Pursuant to the CVS Agreement, CVS Caremark will pay Universal American shareholders $1.25 billion plus the excess capital in the entities that operate our Medicare Part D Business as of December 31, 2010, less the amount of our outstanding debt and trust preferred securities and certain other amounts. At the effective time of the merger, we expect that each share of common stock and preferred stock of the Company will be cancelled and converted into the right to receive one share of common stock of Newco which will own the Newco Businesses and approximately $13.00 to $13.20 per share in cash. The transaction is expected to close by the end of the second quarter of 2011 and is
4
subject to customary closing conditions, including approval of our shareholders and necessary regulatory approvals. On February 28, 2011 the Federal Trade Commission granted early termination of the waiting period under the Hart-Scott-Rodino Antitrust Improvements Act of 1976 with respect to the Part D Sale Transaction. We expect to file a Registration Statement on Form S-4/Proxy Statement Prospectus with the SEC by the middle of March that will contain additional information regarding the Part D Sale Transaction.
HealthCare Reform
In March 2010, President Obama signed into law The Patient Protection and Affordable Care Act and The Health Care and Education Reconciliation Act of 2010 (which we collectively refer to as the "Affordable Care Act") which enacts significant changes to various aspects of the U.S. health insurance industry. There are many important provisions of the legislation that will require additional guidance and clarification in form of regulations and interpretations in order to fully understand the impact of the legislation on our overall business, which we expect to occur over the next several years. Certain aspects of the Affordable Care Act are currently being challenged in the judicial system. In addition, Congress may withhold the funding necessary to implement the new reforms or attempt to replace the legislation with amended provisions or repeal it altogether.
Certain significant provisions of the Affordable Care Act that will impact our business include, among others, reduced Medicare Advantage reimbursement rates, gradual closing of the coverage gap, or "donut hole" on Medicare Part D, implementation of quality bonus for Star Ratings, stipulated minimum medical loss ratios, shortened annual enrollment period, non-deductible federal premium taxes assessed to health insurers, coding intensity adjustments with mandatory minimums and a limitation on the federal tax deductibility of compensation earned by individuals. The Health Care Reform Legislation is discussed more fully under "Regulation" and Item 1A. Risk Factors.
CMS Sanction
On November 19, 2010, the Centers for Medicare and Medicaid Services ("CMS") notified us that we were suspended from marketing to and enrolling new members in our Medicare Advantage plans, effective December 5, 2010. According to CMS, the suspension relates primarily to agent oversight and market conduct issues and will remain in effect until CMS is satisfied that we have corrected the issues and they are not likely to recur. The suspension does not affect current members in our Medicare Advantage plans, nor does it affect the marketing, enrollment or membership in our stand-alone Medicare Prescription Drug plans. We are working diligently to resolve these issues with CMS as quickly as possible.
Special Dividend
On August 19, 2010, we paid a special cash dividend of $2.00 per share to each holder of our outstanding common stock and Series A Preferred Stock. In connection with the special dividend, we made an additional principal payment of $78.0 million on our term loan, as required by our credit facility amendment.
Sale of CHCS Services, Inc.
In the second quarter of 2010, we sold CHCS, our administrative services company, to Patni Americas, Inc ("Patni"), a wholly-owned subsidiary of Patni Computer Systems Limited (NYSE: PTI). In connection with the sale, we entered into a five year multi-services contract with Patni to provide administrative services for our Traditional Insurance business.
5
Senior Market Opportunity
We believe that attractive growth opportunities exist in providing products, particularly health insurance, to the growing senior market. At present, approximately 45 million Americans are eligible for Medicare, the Federal program that offers basic hospital and medical insurance to people over 65 years old and some disabled people under the age of 65. According to the U.S. Census Bureau, more than 2 million Americans turn 65 in the United States each year, and this number is expected to grow as the so-called baby boomers continue to turn 65. In addition, many large employers that traditionally provided medical and prescription drug coverage to their retirees have begun to curtail these benefits. Finally, the passage of the Medicare Prescription Drug, Improvement and Modernization Act of 2003, known as the MMA, increased the healthcare options available to Medicare beneficiaries through the expansion of Medicare managed care plans through the Medicare Advantage program, and the authorization of a subsidized prescription drug insurance benefit pursuant to Part D. Even after the passage of the Affordable Care Act and the sale of our Medicare Part D business, we believe that there are significant business opportunities in the provision of health insurance and other services to the senior population.
Our Strategy
The principal components of our business strategy are to:
- •
- Build our senior health insurance and managed care business by offering the following products:
- •
- Medicare Advantage plans, including:
- •
- Coordinated care plans ("HMO")
- •
- Preferred provider organization plans ("PPO")
- •
- Network and rural private fee-for-service plans (collectively, "PFFS")
- •
- Medicare Part D drug benefit plans marketed as Community CCRxSM; and
- •
- Medicare supplement;
- •
- Build distribution with an emphasis on expanding our Healthy Collaboration® brand and our career distribution;
- •
- Sell complementary senior market and specialty health products through our distribution networks; and
- •
- Continue to complement our internal growth through opportunistic acquisitions and appropriate divestitures.
Healthy Collaboration® Strategy
Our Healthy Collaboration® strategy sets out a model of improving the quality of care to our members on a cost-efficient basis through an active partnership with our providers. We believe we can improve medical outcomes through a series of collaborative initiatives with our physician groups including clinically sound benefit design, medical management, and integrated care management systems. Our goal is to create mutually beneficial and interdependent collaborative arrangements with our providers. We believe provider compensation arrangements should not only help providers to be paid for complex care coordination, but also help align their interests with our objective of improving clinical outcomes and controlling unnecessary cost.
Our health plans provide medical management services, information and analysis, and other support services to enable the network and individual physicians to serve their enrolled members. We
6
rely heavily on the strong physician leadership of each network to help us achieve the clinical goals that support the mission of the organization.
Our Operating Segments
We manage and report our business as follows:
- •
- Senior Managed Care—Medicare Advantage segment reflects our Medicare Advantage HMO, PFFS and PPO businesses.
- •
- Medicare Part D segment includes our Community CCRxSM product.
- •
- Traditional Insurance segment reflects our insurance products not offered through government programs, which includes
Medicare supplement, other senior health insurance, specialty health insurance and life insurance.
- •
- Corporate & Other segment reflects the activities of our holding company, along with the operations formerly reported in our Senior Administrative Services segment. We sold our administrative services company, CHCS during the second quarter of 2010. The sale eliminated substantially all of the business operations of our former Senior Administrative Services segment. As a result, beginning June 30, 2010, we began to report current and historical results of our former Senior Administrative Services and Corporate segments in one segment called Corporate & Other.
Please see "Note 26—Business Segment Information" in our consolidated financial statements included in this Annual Report on Form 10-K for information regarding each segment's revenue and income or loss before taxes for each of the last three fiscal years and total assets as of the end of each of the last two fiscal years.
Senior Managed Care—Medicare Advantage
During 2010, we operated Medicare coordinated care Plans including PPOs and HMOs as well as our PFFS business, which provides coverage to Medicare beneficiaries in 45 states. Our HMOs offer coverage to Medicare beneficiaries primarily in Southeastern Texas and the area surrounding Dallas/Ft. Worth, 15 counties in Oklahoma and 4 counties in Wisconsin. In January 2010, we expanded our PPO products to 114 counties in 17 states. As a result of the passage of the Medicare Improvements for Patients and Providers Act of 2008, known as MIPPA, the PFFS product is no longer available as of January 1, 2011, except in areas that meet approved CMS network access requirements or in certain designated rural areas. We have developed products meeting CMS network access requirements in selected core markets to enable the retention of our PFFS membership in these areas. These businesses provide managed care for persons with Medicare under contracts with CMS.
On November 19, 2010, CMS notified us that we were suspended from marketing to and enrolling new members in our Medicare Advantage plans, effective December 5, 2010. The suspension does not affect current members in our Medicare Advantage plans.
As a result of the network requirements of MIPPA, we were required to terminate approximately 60,000 members as of January 1, 2011. Further, due to lapsation and the limited ability to add new members during the 2011 Annual Election Period as a result of the CMS sanctions, membership declined by an additional 48,000, resulting in membership of approximately 178,000 as of January 1, 2011.
7
Membership and Annualized Premium in Force. The following table shows the total membership and annualized premium in force for our Medicare Advantage products:
| |
Membership | Annualized Premiums | ||||||||||||||||||
|---|---|---|---|---|---|---|---|---|---|---|---|---|---|---|---|---|---|---|---|---|
| |
December 31, | December 31, | ||||||||||||||||||
Senior Managed Care
|
2010 | 2009 | 2008 | 2010 | 2009 | 2008 | ||||||||||||||
| |
|
|
|
(in thousands) |
|
|
||||||||||||||
PFFS plans |
193.1 | 176.2 | 186.2 | $ | 1,903,400 | $ | 1,680,200 | $ | 1,698,800 | |||||||||||
HMO plans |
66.6 | 61.5 | 54.3 | 871,000 | 700,200 | 652,200 | ||||||||||||||
PPO plans |
26.1 | 2.8 | — | 264,900 | 33,000 | — | ||||||||||||||
Total |
285.8 | 240.5 | 240.5 | $ | 3,039,300 | $ | 2,413,400 | $ | 2,351,000 | |||||||||||
Medicare Advantage—HMO plans: Our HMO plans are offered under contracts with CMS and provide all basic Medicare covered benefits with reduced member cost-sharing as well as additional supplemental benefits, including a defined prescription drug benefit. We built this coordinated care product around contracted networks of providers who, in cooperation with the health plan, coordinate an active medical management program. In addition to a monthly payment per member from CMS, the plan may collect a monthly premium from its members for specified products.
We operate plans offering the product TexanPlus® in 12 counties in Houston and southeastern Texas through SelectCare of Texas, which had approximately 48,900 members enrolled at December 31, 2010, representing approximately $601 million of annualized premium in force. We also have Medicare Advantage HMO operations in locations outside of Southeastern Texas including five counties in North Texas offering TexasFirst Health Plans® through SelectCare Health Plans; nine counties in Oklahoma City and six counties in Tulsa offering Generations Healthcare through GlobalHealth; and, four counties in the Milwaukee, Wisconsin area offering Today's Health®.
Medicare Advantage—PPO plans: Our PPO plans are provided under the name "Today's Options®PPO." They are offered under contracts with CMS and provide all basic Medicare covered benefits with reduced member cost-sharing as well as additional supplemental benefits, including a defined prescription drug benefit. This coordinated care product is built around contracted networks of providers who, in cooperation with the health plan, coordinate an active medical management program. In addition to a monthly payment per member from CMS, the plan may collect a monthly premium from its members for specified products. In 2009, we began offering PPO plans in 15 markets in 9 states. In January 2010, we expanded our PPO products to 114 counties in 17 states.
Medicare Advantage—PFFS Plans: Our PFFS plans are provided under the name "Today's Options®." They are offered under contracts with CMS and provide enhanced health care benefits compared to traditional Medicare, subject to cost sharing and other limitations. These plans have limited provider network restrictions, which allow the members to have more flexibility in the delivery of their health care services than other Medicare Advantage plans with limited provider network restrictions. Some of these products include a defined prescription drug benefit. In addition to a fixed monthly payment per member from CMS, individuals in these plans may be required to pay a monthly premium in selected counties or for selected enhanced products. As of December 31, 2010, we provided PFFS plans in a total of 45 states. As a result of the passage of MIPPA, as of January 1, 2011, we will continue to offer PFFS products only in areas that have either met approved CMS network access requirements or are in certain designated rural areas. This resulted in the loss of approximately 60,000 members as of January 1, 2011. We have developed network-based products in selected core markets to enable the migration of our remaining PFFS membership to these products.
8
Medicare Part D
Since the inception of the Medicare Part D program in January 2006, we have contracted with CMS to serve as a plan sponsor offering insurance for prescription drug coverage to Medicare eligible beneficiaries. We offer our Community CCRxSM stand alone prescription drug benefit plans throughout the United States and the U.S. territories. We also operate as a PBM servicing the members in our stand alone prescription drug benefit plans and in our Medicare Advantage plans offering a Part D benefit. In December 2010, we entered into a definitive agreement to sell our Medicare Part D business to CVS Caremark. The transaction is expected to close by the end of the second quarter of 2011 and is subject to customary closing conditions, including approval of our shareholders and necessary regulatory approvals.
Membership and Annualized Premium In Force. The following table shows the net retained membership and annualized premium in force for our Medicare Part D products:
| |
Membership | Annualized Premiums | |||||||||||||||||
|---|---|---|---|---|---|---|---|---|---|---|---|---|---|---|---|---|---|---|---|
| |
December 31, | December 31, | |||||||||||||||||
| |
2010 | 2009 | 2008 | 2010 | 2009 | 2008 | |||||||||||||
| |
(in thousands) |
|
|
|
|||||||||||||||
Medicare Part D |
1,897.2 | 1,697.0 | 1,572.0 | $ | 2,210,000 | $ | 2,006,700 | $ | 1,708,050 | ||||||||||
Medicare Part D. Effective January 1, 2006, private insurers under contract with CMS were permitted to sponsor insured stand-alone prescription drug benefit plans ("PDPs") pursuant to Part D, which was established in 2003 by the MMA. A portion of the premium for this insurance is paid by the Federal government, and the balance is due from the enrolled beneficiaries. The Federal government supports Part D through a combination of premium and claim subsidies as follows:
CMS Direct Premium Subsidy—Represents monthly premiums from CMS based on the Plan year bid submitted by plan sponsors to CMS. The monthly payment is a risk-adjusted amount per member and is based upon the member's health status as determined by CMS. Refer to the "Medicare Risk Adjustment" section of "Critical Accounting Policies", for a more detailed description of risk-adjusted subsidies.
Low-Income Premium Subsidy—For qualifying low-income status, or LIS, members, CMS pays for some or all of the LIS member's monthly premium. The CMS payment is dependent upon a member's income level which is determined by the Social Security Administration.
Low-Income Cost Sharing Subsidy (LICS)—For qualifying LIS members, CMS reimburses plans for all or a portion of the LIS member's deductible, coinsurance and co-payment amounts above the out of pocket threshold for low income beneficiaries. Low-income cost sharing subsidies are paid by CMS prospectively as a fixed amount per member per month, and are determined based upon the Plan year bid submitted by plan sponsors to CMS. Following the Plan year, CMS performs an annual reconciliation of the LICS received by the plan sponsor to the actual amount paid by the plan sponsor.
Catastrophic Reinsurance Subsidy—CMS reimburses Plans for 80% of the drug costs after a member reaches his or her out of pocket catastrophic threshold through a catastrophic reinsurance subsidy. Catastrophic reinsurance subsidies are paid by CMS prospectively as a fixed amount per member per month, and are determined based upon the Plan year bid submitted by plan sponsors to CMS. Following the Plan year, CMS performs an annual reconciliation of the catastrophic reinsurance subsidy received by the plan sponsor to the actual amount paid by the plan sponsor.
CMS Risk Corridor—Premiums from CMS are subject to risk sharing through the Medicare Part D risk corridor provisions. The CMS risk corridor calculation compares the target amount of prescription
9
drug costs (limited to costs under the standard coverage as defined by CMS) less rebates in the Plan year bid, to actual experience. Variances of more than 5% above the target amount will result in CMS making additional payments to plan sponsors, and variances of more than 5% below the target amount will require plan sponsors to refund to CMS a portion of the premiums received.
Our PDP contracts with CMS are renewable for successive one-year terms unless CMS notifies the plan sponsor of its decision not to renew by May 1 of the current contract year, or the plan sponsor notifies CMS of its decision not to renew by the first Monday in June of the contract year.
Medicare beneficiaries who also qualify for Medicaid are known as dual eligible beneficiaries, or dual eligibles. Dual eligible beneficiaries, and certain beneficiaries who qualify for LIS but do not enroll themselves in a PDP, are automatically assigned to a plan by CMS. These assignments are made amongst those PDPs which submitted bids below the applicable regional benchmarks for standard plans.
For the 2010 plan year, we offered through our insurance subsidiaries, one or both of our Community CCRxSM and PrescribaRxSM prescription drug plans in all 34 regions designated by CMS, and one or both of our plans bid under the benchmark in 30 of the 34 regions. For the 2011 Plan year, based upon a requirement of CMS, we consolidated our PrescribaRxSM prescription drug plan into the Community CCRxSM plan. Our Community CCRx plan bid under the benchmark, or used de minimis rules to retain membership, in 29 of the 34 regions.
Community CCRxSM Plans. These plans offer basic coverage with benefits mandated by the MMA, as well as plans providing enhanced coverage with varying degrees of out-of-pocket costs for premiums, deductibles and co-insurance. As of December 31, 2010, we had approximately 1.4 million members enrolled in our Community CCRxSM PDPs. We have a multi-year strategic alliance with the National Community Pharmacists Association ("NCPA") which provides broad exclusive outreach and communications for our Community CCRxSM PDPs to NCPA's independent pharmacy membership. Our alliance with NCPA, and its more than 23,000 independent pharmacy members, provides us with direct access to the largest community pharmacy network in the U.S.
Prescriba RxSM Plans. In March 2005, we entered into a strategic alliance with PharmaCare Re, a subsidiary of CVS Caremark, known as CVS, to offer the Prescription PathwaySM prescription drug benefit plan. PharmaCare Re reinsured half of the risk assumed by our PDPs and the parties created Part D Management Services, L.L.C., known as PDMS, to perform marketing risk management services on behalf of the Prescription PathwaySM PDPs. PDMS was owned 50% by us and 50% by PharmaCare Re. The strategic alliance with CVS was mutually terminated effective December 31, 2008, and PDMS was dissolved in December 2009. Upon termination of the strategic alliance, CVS and Universal American each assumed responsibility for the drug benefit of specified Prescription PathwaySM plan members to achieve an approximately equal distribution of the value of business that had been generated by the strategic alliance. For 2009, we created Prescriba RxSM plans as our successor to the Prescription PathwaySM plans for the members distributed to us upon termination of the strategic alliance with CVS, as well as new members. As of December 31, 2010, we had approximately 0.5 million members enrolled in our PrescribaRx plans that were converted to one of our Community CCRxSM plans, based upon the CMS requirement that Medicare Part D plans consolidate plans for the 2011 plan year.
Traditional Insurance
Our Traditional Insurance segment reflects the results of our Medicare supplement, other senior health insurance, specialty health insurance, and life insurance. We designed the products in this segment primarily for the senior market and market them through our career agency force and our network of independent general agencies.
10
Medicare supplement has historically been our primary Traditional Insurance segment product. Other fixed benefit health insurance products and fixed benefit accident and sickness disability insurance sold to the self-employed market, primarily by our career agents, are also part of this segment. We designed the life insurance products that we currently sell primarily for the senior market including "final expense" life insurance. This segment also includes some products that we no longer sell, such as long-term care and major medical insurance as well as previously produced or acquired term, universal life, and whole life insurance products and single and flexible premium fixed annuities.
We reinsured substantially all of the net in force life and annuity business as of April 1, 2009 with Commonwealth Annuity and Life Insurance Company, known as Commonwealth, a subsidiary of Goldman Sachs Group, Inc. (NYSE: GS). This transaction closed on April 24, 2009. In 2010, the annuity portion of this reinsurance transaction was commuted with Commonwealth and reinsured with Athene Life Re LTD (Athene), a Bermuda reinsurer.
Annualized Premium In Force. Total traditional health insurance product annualized premium in force on a gross basis before reinsurance and the net amount we retained after reinsurance, is as follows:
| |
Gross | Net | |||||||||||||||||
|---|---|---|---|---|---|---|---|---|---|---|---|---|---|---|---|---|---|---|---|
| |
December 31, | December 31, | |||||||||||||||||
| |
2010 | 2009 | 2008 | 2010 | 2009 | 2008 | |||||||||||||
| |
(in thousands) |
||||||||||||||||||
Medicare supplement and Other Senior Health |
$ | 281,600 | $ | 322,500 | $ | 368,000 | $ | 213,100 | $ | 242,800 | $ | 271,000 | |||||||
Accident & Sickness and Other Health |
38,600 | 41,700 | 45,300 | 37,500 | 40,500 | 44,000 | |||||||||||||
Long-Term Care |
27,300 | 29,600 | 32,600 | 18,600 | 19,700 | 21,800 | |||||||||||||
Total |
$ | 347,500 | $ | 393,800 | $ | 445,900 | $ | 269,200 | $ | 303,000 | $ | 336,800 | |||||||
Percentage retained |
77% | 77% | 76% | ||||||||||||||||
Medicare Supplement. Medicare supplement insurance reimburses the policyholder for specified expenses, such as deductibles and co-pays, which are not covered by standard Medicare coverage. This coverage is designed for people who want the freedom to choose providers who participate in the standard Medicare program, as opposed to the more restrictive networks that exist in many Medicare Advantage products. During 2010, our Medicare Supplement products were refiled to conform with the provisions of MIPPA that went into effect June 1, 2010. As part of these filings new rates were filed and approved in 40 states. We believe that the market for Medicare supplement products will continue to be attractive, especially because many seniors may lose similar coverage that had previously been offered to them as a retiree benefit by their former employers and as a result of reforms to the Medicare Advantage program.
These products are guaranteed renewable for the lifetime of the policyholder, which means that we cannot cancel the policy but we can seek to increase premium rates on existing and future policies issued based upon our actual claims experience. We monitor the claims experience and, when necessary, apply for rate increases in the states in which we sell the products. These rate increases are subject to state regulatory approval and loss-ratio requirements.
Fixed Benefit. Fixed benefit products provide the following types of benefits:
- •
- Disability—fixed periodic payments to an insured who becomes disabled and unable to work due to an accident or sickness,
11
- •
- Specified Disease—fixed periodic payments to an insured who is diagnosed with a covered condition,
- •
- Hospital—fixed periodic payments to an insured who becomes hospitalized,
- •
- Surgical—fixed single payments that vary in amount for specified surgical or diagnostic procedures,
and
- •
- Dental/Other—fixed single payments that vary in amount for specified procedures.
Because the benefits we provide are fixed in amount at the time of policy issuance and are not intended to provide full reimbursement for medical and hospital expenses, payment amounts are not generally affected by inflation or the rising cost of health care services.
Long-Term Care. As of the end of 2004, we ceased selling new long-term care products. Previously, we had offered several long term care plans consisting of fully integrated plans and nursing home and home health care plans, which remain in force. These products typically are guaranteed renewable for the lifetime of the policyholder, which means that we cannot cancel the policy but can seek to increase premium rates on existing policies based upon our actual claims experience, subject to state regulatory approval and loss-ratio requirements. There are circumstances when regulatory authorities do not grant approval for adequate rate relief.
Life Insurance. We offer a line of low-face amount, simplified issue whole life products that we sell through our senior market independent agency and our career agency systems. These products also offer acceleration of death benefit features that cover specified long-term care expenses. As discussed above, substantially all of our net in force life and annuity business is reinsured, however we continue to sell some senior life products which are retained by us.
New Business Production. The following table shows the total new sales, consisting of issued annualized premiums of our Traditional Insurance products produced by our independent and career agency systems on a gross basis before reinsurance:
| |
Year ended December 31, | ||||||||||
|---|---|---|---|---|---|---|---|---|---|---|---|
| |
2010 | 2009 | 2008 | ||||||||
| |
(in thousands) |
||||||||||
Medicare Supplement and Other Senior Health |
$ | 15,127 | $ | 17,692 | $ | 13,619 | |||||
Accident & Sickness and Other Health |
3,855 | 4,564 | 3,773 | ||||||||
Life Insurance |
10,088 | 10,691 | 10,911 | ||||||||
Total |
$ | 29,070 | $ | 32,947 | $ | 28,303 | |||||
Corporate & Other
Our corporate & other segment reflects debt service, a portion of senior executive compensation and compliance with regulatory requirements resulting from our status as a public company, along with the operations formerly reported in our Senior Administrative Services segment, which included the provision of third party administration services for our affiliated companies and certain unaffiliated companies.
Competition
The health insurance industry is highly competitive. We compete with numerous other health insurance companies on a national, regional and local market basis. We consider our main competitors to include United Healthcare, Humana, and Healthspring, as well as other health maintenance organizations, preferred provider organizations, prescription drug providers, and other health
12
care-related companies. Many of our competitors have larger memberships and/or greater financial resources than we do.
In addition, we compete with other managed care organizations for government healthcare program contracts, renewals of those government contracts, members and providers. In the Medicare managed care market, our primary competitors for contracts, members and providers are either national and regional managed care organizations that serve Medicare recipients or provider-sponsored organizations.
Our ability to sell our products and to retain customers may be influenced by such factors as those described in the section entitled "Risk Factors" in this report.
Marketing and Distribution
We distribute our Medicare Advantage and Part D products through our career agency systems, independent agents, direct sales and telemarketing. Our Traditional Insurance products are distributed through our career agency systems and independent agents.
Career Agency Systems
Our career agency system currently consists of 3,000 agents in 188 offices. Our career agents are required to sell only the products that we offer or contract for them.
In addition to selling our Medicare Advantage and Medicare Part D products, our career agency sales force distributes traditional insurance products offered by our companies such as Medicare supplement, life insurance, disability, dental, cancer, and hospital indemnity. They also sell life insurance, annuities, Medicare supplement, Medicare Advantage and long-term care insurance offered by unaffiliated carriers with whom we have contracted on their behalf.
Senior Market Independent Agents
These marketing organizations and general agencies typically recruit and train their own agents, bearing all of the costs incurred in connection with developing their organizations. We now sell our products through approximately 33,000 independent licensed agents in 47 states.
13
Telemarketing
Working with our telemarketing partners, this channel has grown from 13% of our MA enrollments in the 2008 selling season to more than 20% of our enrollments for the 2009 plan year and 19% in the 2010 plan year.
Part D
We receive enrollment applications from a variety of sources, including the Medicare.gov and Community CCRxSM websites, SPAPs, mailed-in applications and telephone enrollments. In addition, we distribute our Community CCRxSM products through our career and independent agents.
Geographical Distribution of Premium
Through our insurance subsidiaries, we are licensed to market our products in all 50 states, the District of Columbia, and Puerto Rico and the U.S. Virgin Islands through a CMS waiver. Our managed care subsidiaries operated Medicare Advantage HMO plans in Texas, Oklahoma and Wisconsin and PFFS plans in 45 states and PPO plans in 17 states during 2010. As a result of MIPPA, the number of states in which we offer PFFS plans fell to 37 states in 2011. We offer our Medicare Part D plans in all 50 states. The following table shows the geographical distribution of the direct cash premium collected in thousands, as reported on a statutory basis to the regulatory authorities for the years ended December 31, 2010 and 2009:
State/Region
|
2010 | % of Premium |
2009 | % of Premium |
||||||||||
|---|---|---|---|---|---|---|---|---|---|---|---|---|---|---|
Texas |
$ | 1,090,938 | 19.0 | % | $ | 958,908 | 18.8 | % | ||||||
New York |
547,717 | 9.5 | % | 492,244 | 9.7 | % | ||||||||
North Carolina |
312,296 | 5.4 | % | 221,151 | 4.3 | % | ||||||||
Indiana |
291,251 | 5.1 | % | 236,180 | 4.6 | % | ||||||||
Pennsylvania |
273,607 | 4.8 | % | 230,175 | 4.5 | % | ||||||||
Oklahoma |
259,709 | 4.5 | % | 214,717 | 4.2 | % | ||||||||
Florida |
243,592 | 4.2 | % | 233,575 | 4.6 | % | ||||||||
Georgia |
216,498 | 3.8 | % | 217,119 | 4.3 | % | ||||||||
Ohio |
205,199 | 3.6 | % | 182,688 | 3.6 | % | ||||||||
Virginia |
202,259 | 3.5 | % | 178,605 | 3.5 | % | ||||||||
Subtotal |
3,643,066 | 63.4 | % | 3,165,362 | 62.1 | % | ||||||||
All other |
2,110,306 | 36.6 | % | 1,925,132 | 37.9 | % | ||||||||
Total |
$ | 5,753,372 | 100.0 | % | $ | 5,090,494 | 100.0 | % | ||||||
14
Total Business in Force
The following table sets forth our direct, acquired and assumed annualized premium in force, including only the portion of premiums on interest-sensitive products that is applied to the cost of insurance and related membership counts:
| |
Gross Annualized Premium In Force | |||||||||||||||||||
|---|---|---|---|---|---|---|---|---|---|---|---|---|---|---|---|---|---|---|---|---|
| |
December 31, 2010 | December 31, 2009 | ||||||||||||||||||
| |
$ | % | Members | $ | % | Members | ||||||||||||||
| |
(Dollars in millions, Members in thousands) |
|||||||||||||||||||
Senior Managed Care—Medicare Advantage |
||||||||||||||||||||
Private Fee-for-Service(1) |
$ | 1,903.4 | 33.5 | % | 193.1 | $ | 1,680.2 | 34.4 | % | 176.2 | ||||||||||
HMO Plans(1) |
871.0 | 15.3 | % | 66.6 | 700.2 | 14.3 | % | 61.5 | ||||||||||||
PPO Plans(1) |
264.9 | 4.7 | % | 26.1 | 33.0 | 0.6 | % | 2.8 | ||||||||||||
Sub total |
3,039.3 | 53.5 | % | 285.8 | 2,413.4 | 49.3 | % | 240.5 | ||||||||||||
Medicare Part D(1) |
2,210.0 | 39.1 | % | 1,897.2 | 2,006.7 | 41.1 | % | 1,697.0 | ||||||||||||
Traditional Insurance |
||||||||||||||||||||
Medicare Supplement and Other Senior Health |
281.6 | 5.0 | % | 110.9 | 322.5 | 6.6 | % | 130.7 | ||||||||||||
Accident & Sickness and Other |
38.6 | 0.7 | % | 119.8 | 41.7 | 0.9 | % | 128.2 | ||||||||||||
Long Term Care |
27.3 | 0.5 | % | 15.7 | 29.6 | 0.6 | % | 16.9 | ||||||||||||
Sub total |
347.5 | 6.2 | % | 246.4 | 393.8 | 8.1 | % | 275.8 | ||||||||||||
Life Insurance and Annuity |
67.7 | 1.2 | % | 150.2 | 72.5 | 1.5 | % | 160.2 | ||||||||||||
Total |
$ | 5,664.5 | 100.0 | % | 2,579.6 | $ | 4,886.4 | 100.0 | % | 2,373.5 | ||||||||||
- (1)
- These plans are pursuant to contracts with CMS.
Provider Arrangements
Our network providers deliver health care services to members enrolled in our Medicare Advantage coordinated care plans through a network of contracted providers, including physicians, and other clinical providers, hospitals, a variety of outpatient facilities and the full range of ancillary provider services. The major ancillary services and facilities include:
- •
- ambulance services,
- •
- medical equipment services,
- •
- home health agencies,
- •
- home infusion providers,
- •
- mental health and substance abuse providers,
- •
- rehabilitation facilities,
- •
- skilled nursing facilities,
- •
- optical services, and
- •
- pharmacies.
15
We use a wide range of systems and processes to organize and deliver needed health care services to our members. The key steps in this process are:
- •
- the careful selection of primary care physicians to provide overall care management and care coordination of members,
- •
- development of a comprehensive panel of specialists usually selected by the primary care physicians,
- •
- contracting for the balance of needed services based on the preference and experience of the local physicians, and
- •
- arranging for the full range of medical management systems required to support the primary care and specialist physicians.
We employ health evaluation and assessment tools, quality improvement, care management and credentialing programs to ensure that we meet target goals relating to the provision of quality patient care. The major medical management systems are:
- •
- an inpatient hospitalist program at contracted hospitals, as described below,
- •
- selected authorization of target services,
- •
- referral management,
- •
- case management,
- •
- transition of care management,
- •
- in-home interventions,
- •
- focused chronic illness management,
- •
- transplant coordinator services, and
- •
- outpatient prescription drug management.
Our hospitalist programs use either the patient's primary care physician or a specially-trained physician to manage or arrange the member's medical care during hospital admissions and to coordinate the member's discharge and post-discharge care. In addition, we utilize on-site case managers at high-volume hospitals. Upon initial enrollment, a majority of our members complete a health risk assessment, which along with other available clinical and risk information permits the stratification of membership into categories of health risk. Members in higher risk categories receive enhanced clinical attention. We have integrated these various medical management systems through a care coordination information system to provide clinical and administrative information to support the medical management process. Our chronic illness management programs target specific high risk medical conditions such as congestive heart failure, chronic obstructive pulmonary disorder, coronary artery disease, diabetes, and other conditions and focus on addressing major gaps in care. Our special needs plans for institutionalized beneficiaries focus on the unique needs of this population. In our southeast Texas market, we have implemented a quality compensation program that measures quality process indicators of care related to prevention and disease specific metrics. We plan to implement this program in new markets in the future.
Our health plans usually contract with hospitals based on Medicare's Severity Diagnosis-Related Group or MS-DRG methodology, which is an all-inclusive rate per admission. We generally contract with outpatient facilities on Medicare's Ambulatory Payment Classification (APC) or Ambulatory Surgery Center (ASC) methodology as appropriate, or a percentage of billed charges which approximates APC or ASC reimbursement. We generally contract with physicians, and contract with some other providers, on a capitation or fee-for-service basis, utilizing Medicare's Resource Based
16
Relative Value Scale or RBRVS methodology. Under a capitation arrangement, a physician receives a monthly fixed fee for each member, regardless of the medical services the physician provides to the member. Our provider contracts with network primary care physicians, specialists and ancillaries generally have terms of one year, with automatic renewal for successive one-year terms. We may terminate these contracts for cause, based on provider conduct or other appropriate reasons, subject to laws giving providers due process rights. Either party generally may cancel the contracts without cause upon 60 or 90 days prior written notice. Our contracts with hospitals generally have terms of one to two years, with automatic renewal for successive one-year terms. We may terminate these contracts for cause, based on provider misconduct or other appropriate reasons. Either party generally may cancel our hospital contracts without cause upon 90 days prior written notice.
Investments
Our investment policy is to attempt to balance our portfolio duration to achieve investment returns consistent with the preservation of capital and maintenance of liquidity adequate to meet payment obligations of policy benefits and claims. We invest in assets permitted under the insurance laws of the various states in which we operate. These laws generally prescribe the nature, quality of and limitations on various types of investments that we may make. In addition, we establish our own internal policies, guidelines, and constraints to provide additional granularity and conservatism to our investment process. Such guidelines are reviewed at least annually by our Chief Investment Officer and approved by the Investment Committee of the Board of Directors. We do not currently have investments in partnerships, non-securitized real estate, commodity contracts or other derivative securities.
During 2009, we reevaluated our investment philosophy in light of the April 2009 life and annuity reinsurance transaction and our continued shift to the health and managed care sector. As a result, we elected to reduce the risk and exposure of our investment portfolio to be more conservative in nature and more appropriately aligned with our health insurance focused businesses.
Reinsurance
In the normal course of business, we reinsure portions of policies that we underwrite. We enter into reinsurance arrangements with unaffiliated reinsurance companies to limit our exposure on individual claims and to limit or eliminate risk on our non-core or under-performing blocks of business. Accordingly, we are party to various reinsurance agreements on our life and accident and health insurance risks. Our traditional accident and health insurance products are generally reinsured under quota share coinsurance treaties with unaffiliated reinsurers, while our life insurance risks are generally reinsured under either quota share coinsurance or yearly-renewable term treaties with unaffiliated reinsurers. Under quota share coinsurance treaties, we pay the reinsurer an agreed-upon percentage of all premiums and the reinsurer reimburses us that same percentage of any losses. In addition, the reinsurer pays us allowances to cover commissions, cost of administering the policies and premium taxes. Under yearly-renewable term treaties, the reinsurer receives premiums at an agreed upon rate for its share of the risk on a yearly-renewable term basis. We also use excess of loss reinsurance agreements for some policies to limit our loss in excess of specified thresholds. Our quota share coinsurance agreements are generally subject to cancellation on 90 days notice as to future business, but policies reinsured prior to any cancellation remain reinsured as long as they remain in force. There is no assurance that if any of our reinsurance agreements were canceled we would be able to obtain other reinsurance arrangements on satisfactory terms.
We evaluate the financial condition of our reinsurers and monitor concentrations of credit risk to minimize our exposure to significant losses from reinsurer insolvencies. We must pay claims in the event that a reinsurer to which we have ceded an insured claim fails to meet its obligations under the reinsurance agreement. As of December 31, 2010, all of our primary reinsurers were rated "A—" (Excellent) or better by A.M. Best with the exception of one reinsurer. For that reinsurer, which is not
17
rated, a trust containing assets at 106% of policy reserve levels is maintained for our benefit. We are not aware of any instances where any of our reinsurers have been unable to pay any policy claims on any reinsured business.
The table below details our gross annualized premium in force, the portion that we ceded to reinsurers and the net amount that we retained:
| |
December 31, 2010 | December 31, 2009 | ||||||||||||||||||||||||
|---|---|---|---|---|---|---|---|---|---|---|---|---|---|---|---|---|---|---|---|---|---|---|---|---|---|---|
| |
Gross | Ceded | Net | Retained | Gross | Ceded | Net | Retained | ||||||||||||||||||
| |
(in millions) |
|||||||||||||||||||||||||
Senior Managed Care—Medicare Advantage |
||||||||||||||||||||||||||
Private Fee-for-Service |
$ | 1,903.4 | $ | 2.4 | $ | 1,901.0 | 99 | % | $ | 1,680.2 | $ | 2.4 | $ | 1,677.8 | 99 | % | ||||||||||
HMO Plans |
871.0 | 33.4 | 837.6 | 96 | % | 700.2 | 31.5 | 668.7 | 95 | % | ||||||||||||||||
PPO Plans |
264.9 | 1.9 | 263.0 | 99 | % | 33.0 | — | 33.0 | 100 | % | ||||||||||||||||
Sub total |
3,039.3 | 37.7 | 3,001.6 | 99 | % | 2,413.4 | 33.9 | 2,379.5 | 99 | % | ||||||||||||||||
Medicare Part D |
2,210.0 | — | 2,210.0 | 100 | % | 2,006.7 | — | 2,006.7 | 100 | % | ||||||||||||||||
Traditional Insurance |
||||||||||||||||||||||||||
Medicare Supplement and Other Senior Health |
281.6 | 68.5 | 213.1 | 76 | % | 322.5 | 79.7 | 242.8 | 75 | % | ||||||||||||||||
Accident & Sickness and Other |
38.6 | 1.1 | 37.5 | 97 | % | 41.7 | 1.2 | 40.5 | 97 | % | ||||||||||||||||
Long-Term Care |
27.3 | 8.7 | 18.6 | 68 | % | 29.6 | 9.9 | 19.7 | 66 | % | ||||||||||||||||
Sub total |
347.5 | 78.3 | 269.2 | 77 | % | 393.8 | 90.8 | 303.0 | 77 | % | ||||||||||||||||
Life Insurance and Annuity |
67.7 | 52.4 | 15.3 | 23 | % | 72.5 | 67.0 | 5.5 | 8 | % | ||||||||||||||||
Total |
$ | 5,664.5 | $ | 168.4 | $ | 5,496.1 | 97 | % | $ | 4,886.4 | $ | 191.7 | $ | 4,694.7 | 96 | % | ||||||||||
Administration of Reinsured Blocks of Business
We are generally responsible for the administration of reinsured blocks of business including underwriting, issue, policy maintenance, rate management and claims adjudication and payment. In addition to reimbursement for commissions and premium taxes on the reinsured business, we also receive allowances from the reinsurers as compensation for our expense for such administration. With the sale of CHCS to Patni, we have subcontracted the administration of our accident and health blocks of business to CHCS.
Commonwealth performs the administration for the policies included in that reinsurance transaction, as well as the annuity block reinsured with Athene. We perform the administration for all other reinsured life insurance policies. The administration consists principally of policy maintenance and claims adjudication and payment. We receive reimbursement for commissions and premium taxes on the reinsured business.
Reinsurance of Senior Managed Care—Medicare Advantage
We reinsure our Medicare Advantage HMO, PPO and PFFS products on an excess of loss basis, which limits our per member risk. Our retention in 2010 is $250,000 of benefits and 10% in excess of the $250,000.
Reinsurance of Medicare Part D
We currently retain 100% of the risk on our Part D business.
18
Reinsurance of Traditional Insurance
We have retained all new Medicare supplement business written after January 1, 2004. Under the existing coinsurance agreements for business written prior to 2004, which remain in effect for the life of each policy reinsured, we reinsure a portion of the premiums, claims and commissions on a pro rata basis and receive additional expense allowances for policy issue and administration and premium taxes. The amounts reinsured under these agreements range from 25% to 100%. As older, reinsured business lapses and we write new business that we do not reinsure, the overall percentage of business we retain will increase. As of December 31, 2010, the percentage of Medicare supplement business in force retained by us was 76% as compared to 75% at the end of 2009.
We retain 100% of the fixed benefit accident & sickness disability and hospital business issued in our insurance specialty health segment. We reinsure our long-term care business on a 50% quota share basis, except for the acquired long-term care business written in Pennsylvania Life Insurance Company, and Union Bankers Insurance Company which is 100% retained. We have excess of loss reinsurance agreements to reduce our liability on individual risks for home health care policies to $125,000. For other long-term care policies issued in the U.S. we have reinsurance agreements which cover 90% of the benefits on claims after two years and 100% of the benefits on claims after the third or fourth years depending upon the plan. We also have excess of loss reinsurance agreements with unaffiliated reinsurance companies on most of our major medical insurance policies to reduce the liability on individual risks to $325,000 per year.
Effective April 1, 2009, we reinsured substantially all of the net in force life and annuity business with Commonwealth under a 100% coinsurance treaty. In 2010 the annuity portion of this reinsurance transaction was commuted with Commonwealth and reinsured with Athene. There were certain blocks of life business in force at April 1, 2009 that are subject to separate coinsurance arrangements with other companies ranging from 75% to 90% that were not included in the transaction with Commonwealth. We retain 100% of senior life insurance products issued after March 31, 2009.
Underwriting Procedures
For our Medicare advantage plans (HMO, PFFS, and PPO) and Medicare Part D plans, pursuant to applicable regulations, we are not permitted to underwrite new enrollees. However, premiums received for these members are risk adjusted based on CMS adjustment policies reflecting the health status for each member.
For our Traditional Insurance business, we base the premium we charge, in part, on assumptions about expected mortality and morbidity experience. We have adopted and follow detailed uniform underwriting procedures designed to assess and quantify various insurance risks before issuing individual life insurance policies and health insurance policies to individuals. We generally base these procedures on industry practices, reinsurer underwriting manuals and our prior underwriting experience. To implement these procedures, our insurance company subsidiaries employ an experienced professional underwriting staff.
We review applications for insurance on the basis of the answers that the customer provides to the application questions. Where appropriate to the type and amount of insurance applied for and the applicant's age and medical history, we require additional information such as medical examinations, statements from doctors who have treated the applicant in the past and, where indicated, special medical tests. If necessary, we use investigative services to supplement and substantiate information. For some coverages, we may verify information with the applicant by telephone. After reviewing the information collected, we either issue the policy as applied for on a standard basis, issue the policy with an extra premium charge due to unfavorable factors, issue the policy excluding benefits for specified conditions, either permanently or for a period of time, or reject the application. For some of our coverages, we have adopted simplified policy issue procedures in which the applicant submits an application for coverage typically containing only a few health-related questions instead of a complete
19
medical history. Under regulations promulgated by the NAIC and adopted as a result of the Omnibus Budget Reconciliation Act of 1990, we are prohibited from using medical underwriting criteria for our Medicare supplement policies for specified first-time purchasers and for specified disenrollees from Medicare Advantage plans. If a person applies for insurance within six months after becoming eligible by reason of age, or disability in some circumstances, we may not reject the application due to medical conditions. For other prospective Medicare supplement policyholders, such as senior citizens who are purchasing our products, the underwriting procedures are limited based upon standard industry practices and state insurance regulations.
In New York and some other states, some of our products, such as Medicare supplement, are subject to guaranteed issue "community rating" laws that severely limit or prevent underwriting of individual applications. See the "Regulation" section of this document.
Reserves
In accordance with applicable insurance regulations, we establish, and carry as liabilities in our GAAP and statutory financial statements, actuarially determined reserves. (For further discussion, see Critical Accounting Policies in our Management's Discussion and Analysis of Financial Condition and Results of Operations elsewhere in this Annual Report on Form 10-K.)
We calculate reserves together with premiums to be received on outstanding policies and contracts and interest at assumed rates on these amounts, which we believe to be sufficient to satisfy policy and contract obligations. Reserves for life insurance policies are determined using actuarial factors based on mortality tables and interest rates prescribed by statute. Reserves for accident and health insurance policies (excluding Medicare Advantage and Part D) use prescribed morbidity tables based on our historical experience. For Medicare Advantage and Part D policies, claims reserves are estimated using standard actuarial development methodologies. Under such methods, we take into consideration the historical lag between incurred date of claim and payment date of claim, membership changes, expected medical cost trend, changes in pending claims, amount of claims receipts, claims seasonality, changes in average risk profile, and benefit plan changes. We also maintain reserves for unearned premiums, for premium deposits, for claims that have been reported and are in the process of being paid or contested and for our estimate of claims that have been incurred but have not yet been reported.
We calculate the reserves reflected in our consolidated financial statements in accordance with generally accepted accounting principles, known as GAAP. We determine these reserves based on our best estimates of mortality and morbidity, persistency, expenses and investment income. We use the net level premium method for all non-interest-sensitive products and the retrospective deposit method for interest-sensitive products. GAAP reserves differ from statutory reserves due to the use of different assumptions regarding mortality and morbidity, interest rates and the introduction of lapse assumptions into the GAAP reserve calculation.
When we acquire blocks of insurance policies or insurers owning blocks of policies, our assessment of the adequacy of the transferred policy liabilities is subject to risks and uncertainties. With acquired and existing businesses, we may from time to time need to increase our claims reserves significantly in excess of those previously estimated. An inadequate estimate of reserves could have a material adverse impact on our results of operations or financial condition.
Regulation
General
Our insurance company subsidiaries and health plan affiliates are subject to the state and local laws, regulations and supervision of the jurisdictions in which they are domiciled and licensed, as well as to Federal laws and supervision. Those laws and regulations provide safeguards for policyholders and members, and do not exist to protect the interest of shareholders. Government agencies that oversee insurance and health care products and services generally have broad authority to issue regulations to
20
interpret and enforce laws and rules. Changes in applicable laws and regulations are continually being considered, and the interpretation of existing laws and rules also change periodically, which could make it increasingly difficult to control medical costs, among other things. Therefore, future regulatory revisions could affect our operations and financial results.
We are subject to various governmental reviews, audits and investigations to verify our compliance with our contracts and applicable laws and regulations. State departments of insurance audit our health plans and insurance companies for financial and contractual compliance. State departments of health audit our health plans for compliance with health services. State attorneys general, CMS, the Office of the Inspector General of Health and Human Services, the Office of Personnel Management, the Department of Justice, the Department of Labor, the Government Accountability Office, state departments of insurance and departments of health and Congressional committees also conduct audits and investigations of us.
Medicare
Medicare is a Federal program that provides eligible persons age 65 and over and certain eligible persons with disabilities a variety of hospital and medical insurance benefits. Medicare beneficiaries have the option to enroll in a Medicare Advantage health plan in counties where these plans are offered. Under Medicare Advantage, insurance companies and managed care organizations contract with CMS to provide benefits at least equivalent to the traditional fee-for-service Medicare program in exchange for a fixed monthly payment per member that varies based on the county in which a member resides as well as a member's demographics and health status.
Medicare supplemental insurance, sometimes called Medigap is jointly regulated by the Federal government and by State Departments of Insurance. In all but a few States, there are standard Medicare supplement plans. Two new plans, M and N, that include member cost sharing for many services, were available in 2010. This changes the "first dollar" character of traditional Medigap benefits in these two plans. In addition, minor benefit changes will be made to the remaining plans to reflect Medicare benefit changes enacted by the Affordable Care Act of 2010.
The Medicare Part D drug benefit offers Medicare beneficiaries the option to obtain covered outpatient prescription drug benefits offered through a private drug plan. The Part D drug benefit is generally subject to cost sharing. Under the standard drug coverage, the cost sharing includes an annual deductible, 25% coinsurance for annual drug costs reimbursed by Medicare up to a maximum until the member's cost fall into the "coverage gap". After that, a small number of beneficiaries with especially high drug costs reach catastrophic stop loss coverage, but even this level of coverage is subject to further cost-sharing. Part D plans are not required to mirror these limits; instead, Part D drug plans are required to provide coverage that is at least actuarially equivalent to the standard drug coverage delineated in the MMA. As a result of the Affordable Care Act, starting in 2011, the Part D coverage gap is gradually closed by 2020, although beneficiaries retain a 25% co-pay. In addition, there is a 50% discount on brand-name drugs in the coverage gap. The Part D benefit also provides subsidies and the reduction or elimination of cost sharing for specified low-income beneficiaries, including "dual-eligible" individuals who receive benefits under both Medicare and Medicaid. Under the Affordable Care Act, high income beneficiaries begin paying higher premiums for their Part D coverage in 2011. In general, these changes increase the attractiveness of the Part D drug benefit, but also have the potential to alter member behavior and utilization, and Part D plans may need to alter business assumptions in the coming years as a result.
The Affordable Care Act made several changes to Medicare Advantage. Beginning in 2012, Medicare Advantage "benchmark" rates transition to target Medicare fee-for-service cost benchmarks of 95%; 100%, 107.5% or 115% of the calculated Medicare fee-for-service costs. The transition period will be 2, 4 or 6 years depending upon the applicable county. The counties are divided into quartiles based on each county's fee-for-service Medicare costs. We estimate that approximately 38% of our
21
current membership resides in counties where the Medicare Advantage benchmark rate will equal 95% of the calculated Medicare fee-for-service costs, with approximately 89% of these members having a 6-year transition period. Under the new law, the premiums for such members will be transitioned beginning in 2012. To address these rate reductions, we may have to reduce benefits, charge or increase member premiums, reduce profit margin expectations, or implement some combination of these actions. Such actions could adversely impact our membership growth, revenue expectations, and our operating margins.
Under the Affordable Care Act, the coding intensity adjustment on Medicare Advantage payment as instituted in 2010 became permanent, resulting in mandated minimum reductions in risk scores of 4.71% in 2014 increasing to 5.7% for 2019 and beyond. Further, the lack of a long term Medicare Physician Sustainable Growth Rate (SGR) adversely impacts the Medicare Advantage payment because Medicare Advantage is based on projected costs in original Medicare. Without a long term SGR "fix", Congress has passed a series of short term extensions of the SGR to prevent the payment cut to physicians from going into effect, and CMS does not assume even the short term "fix" in calculating Medicare Advantage payment rates. These payment adjustments may adversely affect the level of payments from CMS to our Medicare Advantage plans.
Beginning in 2012, Medicare Advantage plans with an overall "Star Rating" of three or more stars (out of five) will be eligible for a "quality bonus" in their basic premium rates. The Affordable Care Act limited these quality bonuses to the few plans that achieved 4 or more stars as their overall rating, but CMS is using demonstration authority to expand the quality bonus to 3 star plans for a three year period through 2014. In addition, also beginning in 2012, Medicare Advantage star ratings will affect the rebate percentage available for plans to provide additional member benefits (plans with quality ratings of 3.5 stars or above will have their rebate percentage increased from a base rate of 50% to 65% or 70%). In all cases, this rebate percentage is lower than the pre-Affordable Care Act rebate percentage of 75%. Our Medicare Advantage plans are currently rated 3 out of 5 stars, on average. Notwithstanding efforts to improve our star ratings and other quality measures prior to 2012, there can be no assurances that we will be successful in doing so. Accordingly, our plans may not be eligible for full level quality bonuses or increased rebates, which could adversely affect the benefits such plans can offer, reduce membership, and reduce profit margins.
MIPPA revised requirements for Medicare Advantage private fee-for-service (PFFS) plans, ending these plans as non-network products in 2011 in all but a small number of rural counties. We established provider networks to build Network-PFFS plans and preferred provider organization, or PPO, in strategic locations. This permitted us to passively enroll ("crosswalk") PFFS membership into network products on January 1, 2011, in service areas where CMS approved Universal American's proposed provider networks. Nonetheless, we were not able to develop provider networks in all areas with PFFS membership, and were required to non-renew approximately 60,000 of our PFFS members.
Most Medicare beneficiaries have a limited annual enrollment period during which they can choose to participate in a Medicare Advantage plan rather than receive benefits under the traditional fee-for-service Medicare program. After the annual enrollment period, most Medicare beneficiaries are not permitted to change their Medicare benefits. The Affordable Care Act shortens the time in which we can sell our Medicare Advantage and Part D products. Also, beginning in 2011, the Affordable Care Act mandates that persons enrolled in Medicare Advantage may withdraw their enrollment during the first 45 days of the year to return to original Medicare only. Prior law allowed a member to withdraw enrollment during this period to enroll in another Medicare Advantage plan. These changes have the potential to constrain our member growth, limit the viability of our sales force, or otherwise adversely affect our ability to market to or enroll new members in our established service areas.
Beginning in 2014, the Affordable Care Act stipulates a minimum medical loss ratio, or MLR, of 85% for Medicare Advantage plans. Financial penalties in the form of remitting funds to CMS will result from failing to achieve the minimum MLR ratio (with additional penalties for repeated inability
22
to reach 85%). In general, our Medicare Advantage plans are at or near this important threshold but we have considerable work to do to reach these targets. The methodology for defining medical costs and aggregating geographic units and plans for calculating MLRs has not yet been defined for Medicare Advantage plans, so there remains some uncertainty in regarding our readiness for the MLR threshold. Complying with such minimum ratio by increasing our medical expenditures or refunding any shortfalls to the federal government could have a material adverse affect on our operating margins, results of operations, and our statutory required capital.
Fraud and abuse laws
Enforcement of health care fraud and abuse laws has become a top priority for the nation's law enforcement entities. The funding of these law enforcement efforts has increased dramatically in the past few years and is expected to continue. The focus of these efforts has been directed at participants in Federal government health care programs such as Medicare. We participate in these programs and have continued our stringent regulatory compliance efforts.
Privacy regulations
The use of individually identifiable data by our business is regulated at Federal and state levels. These laws and rules are subject to administrative interpretation. Various state laws address the use and maintenance of individually identifiable health data. Many are derived from the privacy provisions in the Federal Gramm-Leach-Bliley Act and the Health Insurance Portability and Accountability Act of 1996, known as HIPAA.
Among other things, HIPAA mandates
- •
- guaranteed availability and renewability of health insurance for specified employees and individuals;
- •
- limits on termination options and on the use of preexisting condition exclusions;
- •
- prohibitions against discriminating on the basis of health status; and
- •
- requirements which make it easier to continue coverage in cases where an employee is terminated or changes employers.
HIPAA also calls for the adoption of standards for the exchange of electronic health information and privacy requirements that govern the handling, use and disclosure of protected customer health information. We believe that we met the HIPAA Security Rule changes that became effective on April 21, 2005; however, HIPAA is far-reaching and complex and proper interpretation and practice under the law continue to evolve. Consequently, our efforts to measure, monitor and adjust our business practices to comply with HIPAA are ongoing.
Insurance companies also are required to comply with Federal "Do Not Call" regulations. Insurance companies are required to develop their own "Do Not Call" lists and reference state and Federal Do Not Call Registries, before making calls to market insurance products. Estimates suggest that approximately two thirds of the country's residential telephone numbers are on the Federal registry, which could limit the marketing calls made and potentially could negatively impact sales.
USA PATRIOT Act
A portion of the USA PATRIOT Act applying to insurance companies became effective in mid 2004. Insurance companies have to impose processes and procedures to thoroughly verify their agents, applicants, insureds, claimants and premium payers in an effort to prevent money laundering. Our insurance companies have implemented measures to comply with the Office of Federal Asset Control requirements, whereby the names of customers and potential customers must be reviewed against a listing of known terrorists and money launderers. The identification verification requirement of the USA PATRIOT Act became final in late 2005. In May 2006, insurance companies were required to
23
verify the identity of their applicants, insureds, and beneficiaries. We continually upgrade our internal procedures, securing software and training of home office staff and producers to maintain compliance.
State and local regulation
Each of our insurance company subsidiaries and our health maintenance organization ("HMO") subsidiaries is also subject to the regulations of and supervision by the insurance department of each of the jurisdictions in which they are admitted and authorized to transact business. These regulations cover, among other things,
- •
- the declaration and payment of dividends by our insurance company and HMO subsidiaries,
- •
- the setting of rates to be charged for some types of insurance,
- •
- the granting and revocation of licenses to transact business,
- •
- the licensing of agents,
- •
- the regulation and monitoring of market conduct and claims practices,
- •
- the approval of forms,
- •
- the establishment of reserve requirements,
- •
- investment restrictions,
- •
- the regulation of maximum allowable commission rates,
- •
- the mandating of some insurance benefits,
- •
- minimum capital and surplus levels, and
- •
- the form and accounting practices used to prepare statutory financial statements.
A failure to comply with legal or regulatory restrictions may subject the insurance company subsidiary or HMO subsidiary to a loss of a right to engage in some or all business in a state or states or an obligation to pay fines, penalties, or make restitution, which may affect our profitability.
American Pioneer is a Florida domiciled insurance company. American Progressive is a New York domiciled insurance company. Pyramid Life is a Kansas domiciled insurance company. Pennsylvania Life is a Pennsylvania domiciled insurance company. Constitution, Marquette and Union Bankers are Texas domiciled insurance companies. SelectCare of Texas, LLC is licensed as an HMO in Texas and SelectCare Health Plans, Inc is licensed as an HMO in Texas and Indiana. SelectCare of Oklahoma, Inc. and GlobalHealth, Inc. are licensed HMO's in Oklahoma. SelectCare of Maine, Inc. is a licensed HMO in Maine. Collectively, our insurance subsidiaries and HMOs are licensed to sell health insurance, life insurance and annuities in all 50 states, the District of Columbia, Puerto Rico and the U.S. Virgin Islands. In addition, some of these subsidiaries have CMS-approved plans to enroll members in our PDPs in 50 states plus the U.S. Virgin Islands and in our Medicare Advantage PFFS, PPO, and HMO plans in 45 states, for 2010.
Most jurisdictions mandate minimum benefit standards and loss ratios for accident and health insurance policies. We are generally required to maintain, with respect to our individual long-term care policies, minimum anticipated loss ratios over the entire period of coverage. With respect to our Medicare supplement policies, we are generally required to attain and maintain an actual loss ratio, after three years, of not less than 65 percent of earned premium. We provide to the insurance departments of all states in which we conduct business annual calculations that demonstrate compliance with required loss ratio standards for Medicare supplement insurance. We prepare these calculations utilizing appropriate statutory assumptions. In the event we fail to maintain minimum mandated loss ratios, our insurance company subsidiaries could be required to provide retrospective premium refunds or prospective premium rate reductions. We believe that our insurance company subsidiaries currently comply with all applicable mandated minimum loss ratios. In addition, we actively review the loss ratio
24
experience of our products and request approval for rate increases from the respective insurance departments when we determine they are needed. We cannot guarantee that we will receive the rate increases we request.
Every insurance company and HMO that is a member of an "insurance holding company system" generally is required to register with the insurance regulatory authority in its domicile state and file periodic reports concerning its relationships with its insurance holding company and with its affiliates. Material transactions between registered insurance companies or HMO's and members of the holding company system are required to be "fair and reasonable" and in some cases are subject to administrative approval. The books, accounts and records of each party are required to be maintained so as to clearly and accurately disclose the precise nature and details of any intercompany transactions.
Each of our insurance company and HMO subsidiaries is required to file detailed reports with the insurance department of each jurisdiction in which it is licensed to conduct business and its books and records are subject to examination by each licensing insurance department. In accordance with the insurance codes of their domiciliary states and the rules and practices of the NAIC, our insurance company and HMO subsidiaries are examined periodically by examiners of each company's domiciliary state with elective participation by representatives of the other states in which they are licensed to do business.
Many states require deposits of assets by insurance companies and HMOs for the protection either of policyholders in those states or for all policyholders. These deposited assets remain part of the total assets of the company. As of December 31, 2010 and 2009, we had securities totaling $42.0 million and $43.4 million, respectively, on deposit with various state treasurers or custodians. These deposits must consist of securities that comply with the standards established by the particular state.
MemberHealth is subject to regulations as a PBM and/or third party administrator in states requiring PBMs to be licensed.
Dividend Restrictions
Many of our subsidiaries operate in states that regulate the payment of dividends, loans, or other cash transfers to our parent company, Universal American Corp., and require minimum levels of equity as well as limit investments to approved securities. The amount of dividends that may be paid to us by these subsidiaries, without prior approval by state regulatory authorities, is limited based on the entity's level of statutory income and statutory capital and surplus.
Although minimum required levels of equity are largely based on premium volume, product mix, and the quality of assets held, minimum requirements vary significantly from state to state. As of December 31, 2010, our state regulated subsidiaries had aggregate statutory capital and surplus of approximately $889 million, which compares to $802 million at December 31, 2009. Based on current estimates, we expect the aggregate amount of dividends that may be paid to our parent company in 2011 without prior approval by state regulatory authorities is approximately $163 million.
Risk-Based Capital and Minimum Capital Requirements
Risk-based capital requirements promulgated in each state take into account asset risks, interest rate risks, mortality and morbidity risks and other relevant risks with respect to the insurer's business and specify varying degrees of regulatory action to occur to the extent that an insurer does not meet the specified risk-based capital thresholds, with increasing degrees of regulatory scrutiny or intervention provided for companies in categories of lesser risk-based capital compliance. As of December 31, 2010, all of our U.S. insurance company subsidiaries and managed care affiliates maintained ratios of total adjusted capital to risk-based capital in excess of the authorized control level. However, should our insurance company subsidiaries' and managed care affiliates' risk-based capital positions decline in the future, their ability to pay dividends, the need for capital contributions or the degree of regulatory supervision or control to which they are subjected might be affected.
25
Effective December 31, 2009, the National Association of Insurance Commissioners, known as NAIC, had adopted SSAP 10R Income Taxes. SSAP 10R is a temporary replacement of SSAP 10 that effectively expands the amount of Deferred Tax Assets, or DTA's, that qualify as admitted assets, with a sunset provision after December 31, 2010. During 2010 the NAIC extended the sunset provision deadline to December 31, 2011. The adoption of SSAP 10R effective December 31, 2009 allowed the companies to admit additional DTA's (and increase Capital & Surplus) of $14.3 million and $19.0 million, respectively, for 2010 and 2009.
Guaranty Association Assessments
Solvency or guaranty laws of most jurisdictions in which our insurance company subsidiaries do business may require them to pay assessments to fund policyholder losses or liabilities of unaffiliated insurance companies that become insolvent. These assessments may be deferred or forgiven under most solvency or guaranty laws if they would threaten an insurer's financial strength and, in most instances, may be offset against future premium taxes. Our insurance company subsidiaries provide for known and expected insolvency assessments based on information provided by the National Organization of Life & Health Guaranty Associations. Our insurance company subsidiaries have not incurred any significant costs of this nature. The likelihood and amount of any future assessments is unknown and is beyond our control.
Producer Compensation Disclosure
State regulators and attorneys general have initiated investigations into producer compensation and product pricing. While the initial investigations have focused on commercial lines insurers and brokers, it remains to be seen whether the investigations will broaden and potentially change how we sell our products. We have responded to inquiries regarding our sales practices, and we do not anticipate that our responses will require any change in our compensation practices or any other adverse result. Under the NAIC's Producer Licensing Model Act, known as the PLMA, when a producer receives compensation from both a customer and an insurance company, the producer must receive the customer's documented acknowledgement that it will receive compensation from the insurance company and must disclose the amount of this compensation to the customer. These disclosures, however, will not be necessary if the producer does not receive a fee from the customer for the placement of insurance and discloses to the customer that it is acting on behalf of the insurance company and may provide services to the customer on behalf of the insurance company.
Several states have enacted producer compensation disclosure legislation or regulations and it is possible that some states will adopt laws that are broader than the NAIC model acts.
Outsourcing Arrangements
We outsource certain processing and administration functions to third parties, subject to outsourcing agreements. The outsourced functions include membership administration, call center operations, business process outsourcing, revenue management, marketing and pharmacy benefit management. In the future, it is possible that we may outsource additional functions. A summary of our more significant arrangements is presented below.
Business Process Outsourcing. On April 26, 2010, we entered into an agreement to sell the outstanding common stock of CHCS, our administrative services company, to Patni. The transaction closed on June 9, 2010, with an effective date of April 1, 2010. Subsequent to this transaction, Patni is providing the same administrative services previously provided by our former CHCS affiliate, as well as certain information technology services, to our insurance subsidiaries. These services include, policy administration, underwriting, claims processing and other related processes primarily related to our Traditional lines of business.
26
In addition, we continue to use Patni as a business outsource vendor to provide data entry, member application intake and processing, data validation, mailroom imaging and scanning, paper-based and electronic claims adjudication and processing, and overflow labor support services for our operations. Patni also provides some information technology support and programming. Patni bills us monthly on an as-used basis. We signed an amended master services agreement with Patni in connection with the CHCS sale, for a five-year term. We have executed additional statements of work to cover specific limited assignments. The master services agreement renews automatically for annual periods unless written notice of nonrenewal has been provided in advance. The contract provides for guarantee payments if total fees are below $25 million per year or $142.5 million for services over the five year initial term of the master service agreement, which ends May 2015. Through December 31, 2010, we have utilized services in excess of the contractual minimums.
Risk Score Review. We have contracted with Outcomes Health Information Solutions, L.L.C. to review claims and other data to use its clinical algorithms to identify Medicare Advantage HMO, PPO and PFFS members who may have CMS assigned risk scores that are not indicative of the members' actual clinical acuity. Outcomes organizes the review of medical charts for these members and collects data to be submitted to CMS, after review and validation by the Company, which will result in a more accurate risk score assignment by CMS. We have executed additional statements of work to cover specific limited assignments. There are no explicit minimum payments required under this arrangement.
MarketingAlliance. Under our agreement with the National Community Pharmacists Association (NCPA), we license the "Community CCRxSM and "CCRxSM brand names in exchange for a fixed quarterly fee, and NCPA provides marketing, public relations and other communication services to the independent pharmacies in our network. Our agreement with NCPA is effective through December 31, 2015, but may be terminated early under certain circumstances, including (but not limited to) a material breach by either party, insolvency of either party, or in the event CMS terminates our Part D contract. The contract contains certain non-competition and exclusivity provisions for eighteen months after the contract is terminated. We also contract with Mirixa Corporation, an affiliate of NCPA, to provide certain services to our Part D business,including Medication Therapy Management and related services. The loss of our relationship with NCPA could have an adverse effect on our business and results of operations.
Pharmacy Benefit Management. In 2009, we entered into an agreement with Medco Health Solutions, Inc. for the period January 1, 2009 through December 31, 2013, subject to earlier termination, to provide pharmacy network management, claims adjudication and administrative services and other prescription drug benefit services. In connection with our pending sale of the Part D business to CVS Caremark, (i) on December 30, 2010, we provided notice to Medco of the termination of the agreement effective December 31, 2011 and (ii) at the closing of the transaction, we expect to enter into a five-year pharmacy benefits management agreement, pursuant to which CVS Caremark will provide customary PBM services to our Medicare Advantage plans.
Employees
As of February 24, 2011, we employed approximately 1,800 employees, none of whom is represented by a labor union in such employment. We consider our relations with our employees to be good.
27
Investors in our securities should carefully consider the risks described below and other information included in this report. This report contains both historical and forward-looking statements. We are making the forward-looking statements within the meaning of Section 27A of the Securities Act of 1933, as amended, and Section 21E of the Securities Exchange Act of 1934, as amended. We intend the forward-looking statements in this report or made by us elsewhere to be covered by the safe harbor provisions for forward-looking statements contained in the Private Securities Litigation Reform Act of 1995, and we are including this statement for purposes of complying with and relying upon these safe harbor provisions. We have based these forward-looking statements on our current expectations and projections about future events, trends and uncertainties. These forward-looking statements are not guarantees of future performance and are subject to risks, uncertainties and assumptions, including, among other things, the information discussed below. The risks and uncertainties described below are not the only ones that we face. Additional risks and uncertainties not presently known to us or that we currently believe to be immaterial also may adversely affect our business. In making these statements, we are not undertaking to address or update each factor in future filings or communications regarding our business or results. Our business is highly complicated, regulated and competitive with many different factors affecting results. If any of the following risks or uncertainties develops into actual events, this could significantly and adversely affect our business, prospects, financial condition and operating results. In that case, the trading price of our common stock could decline materially and investors in our securities could lose all or part of their investment.
Risks Relating to the CVS Transaction
Failure to complete the Part D Sale Transaction could adversely affect the market price of Universal American common stock as well as Universal American's business, financial condition and results of operations.
The Part D Sale Transaction is subject to the satisfaction or, to the extent permissible, waiver, of certain conditions, including, but not limited to, receipt of the requisite Universal American Corp. shareholder approval and receipt of the necessary regulatory consents and approvals. Although we expect, as of the date of this Form 10-K, to complete the Part D Sale Transaction, it is possible that the Part D Sale Transaction may not be completed. If the Part D Sale Transaction is not completed for any reason, the price of our common stock may decline to the extent that the market price of our common stock reflects positive market assumptions that the Part D Sale Transaction will be completed or based on the market's perception as to why the Part D Sale Transaction was not completed. For example, the closing price of our common stock was $14.61 on December 30, 2010, the last day of trading before announcement of the Transactions, and $20.45 on December 31, 2010, the day immediately following the announcement of the Part D Sale Transaction. In addition, if the Part D Sale Transaction is not consummated, there can be no assurance that a comparable transaction will occur. Further, pursuant to the terms of the CVS Agreement, on December 30, 2010, we provided notice to Medco Health Solutions, Inc. of the termination of our prescription benefits management agreement with Medco effective December 31, 2011. If the Part D Sale Transaction is not completed, there can be no assurance that Medco will continue to provide us with prescription benefits management services after December 31, 2011, which could have substantial negative effects on us, including significant transition costs and operational difficulties.
We may also be subject to additional risks if the Part D Sale Transaction is not completed, including:
- •
- the requirement in the CVS Agreement that, under certain circumstances, we pay CVS Caremark a termination fee of $36 million and reimburse CVS Caremark for its out-of-pocket transaction-related expenses up to $5 million;
28
- •
- substantial costs related to the Part D Sale Transaction, such as legal, accounting, filing, financial advisory and
financial printing fees, many of which must be paid regardless of whether the merger is completed; and
- •
- potential disruption to our business and distraction of our workforce and management team.
Whether or not the Part D Sale Transaction is completed, the announcement and pendency of the transaction creates uncertainty and could impact or cause disruption in our business and could adversely affect our results of operations.
The attention of our management may be directed towards the completion of the Part D Sale Transaction and may be diverted from the day to day business operations of the Company. In addition, uncertainty about the effect of the Part D Sale Transaction on employees and members may have an adverse effect on us. Although we are taking steps to reduce any adverse effects, these uncertainties may impair their ability to attract, retain and motivate key personnel until the transaction is completed and for a period of time thereafter, and could cause members, suppliers, pharmaceutical manufacturers, retail pharmacies and others that do business with us to seek to change existing business relationships. In addition, we face the risk that the Part D Sale Transaction will be negatively perceived by other stakeholders.
The CVS Agreement also restricts us from taking certain actions (including, among others, making certain acquisitions, amending organizational documents, making, declaring or paying certain dividends, paying certain additional cash compensation benefits, entering into certain material contracts and incurring certain indebtedness) without CVS Caremark's consent until the transaction is completed or the CVS Agreement is terminated. These restrictions may prevent us from pursuing otherwise attractive business opportunities and making other changes to its business in response to events or circumstances that may arise before the transaction is completed or the CVS Agreement is terminated. Newco is subject to similar risks which, if they materialize, may materially adversely affect the business or results of operations of Newco following completion of the Transactions.
The Part D Sale Transaction is subject to the receipt of certain required clearances or approvals from governmental entities that could prevent or delay the completion of the transaction or impose conditions that could have a material adverse effect on us or Newco.
Completion of the Part D Sale Transaction is conditioned upon the receipt of certain governmental clearances or approvals, including, but not limited to, the expiration or termination of the applicable waiting period under the HSR Act with respect to the Part D Sale Transaction. On February 28, 2011 the Federal Trade Commission granted early termination of the waiting period under the Hart-Scott-Rodino Antitrust Improvements Act of 1976, with respect to the Part D Sale Transaction. There can be no assurance that the other required clearances and approvals will be obtained, and, additionally, government authorities from which these clearances and approvals are required may impose conditions on the completion of the Part D Sale Transaction or require changes to its terms. There is currently no way to predict how long it will take to obtain all of the required regulatory approvals and there may be a substantial period of time between the approval by our shareholders and the completion of the Part D Sale Transaction. There is no assurance that governmental authorities will not seek to impose conditions unacceptable to one of the parties, in which case the Part D Sale Transaction could be significantly delayed or prevented, which could have a material adverse effect on us. If, in order to obtain any clearances or approvals required to complete the Part D Sale Transaction, we are required to divest material assets, or contribute additional capital to one or more of our insurance subsidiaries, or Newco becomes subject to any material conditions after completion of the Part D Sale Transaction, Newco's business and results of operations after completion of the transaction may be adversely affected. While we expect to obtain all required regulatory approvals, it cannot be assured that these regulatory approvals will be obtained or that the granting of these regulatory approvals will not involve
29
the imposition of conditions on the completion of the Transactions. Such conditions or changes could result in the conditions to the Part D Sale Transaction not being satisfied.
The CVS Agreement contains provisions that may discourage other companies from trying to acquire us.
The CVS Agreement contains provisions that may discourage a third party from submitting a business combination proposal to us prior to the closing of the Part D Sale Transaction that might result in greater value to our shareholders than the Part D Sale Transaction. For example, concurrently with the execution of the CVS Agreement, certain of our shareholders, Capital Z Partners, Lee-Universal Holdings, LLC, Perry Corp., Welsh, Carson, Anderson & Stowe X, L.P., Richard A. Barasch, our Chairman and Chief Executive Officer, and certain of their respective affiliates (collectively, referred to as the "Significant Shareholders") entered into Voting Agreements with CVS Caremark, pursuant to which, among other things, the Significant Shareholders agreed to vote their shares of our common stock (which represent, in the aggregate, approximately 55% of our outstanding common stock) in favor of the Part D Sale Transaction. In addition, subject to certain exceptions, we have agreed that neither we nor any of our subsidiaries shall, nor shall we permit any of our representatives or any of our subsidiaries, to directly or indirectly, (1) solicit, initiate or knowingly facilitate or encourage any inquiries regarding, or the making of any proposal or offer with respect to a Takeover Proposal (as defined in the CVS Agreement), (2) have any discussions or participate in any negotiations regarding a Takeover Proposal or (3) execute or enter into any contract or agreement relating to a Takeover Proposal. Additionally, we must give CVS Caremark the ability to match the terms of any Takeover Proposal submitted to us. CVS Caremark has the right to terminate the CVS Agreement if our Board withdraws, modifies or amends its recommendation to our shareholders to vote for approval of the proposal to adopt the CVS Agreement in a manner adverse to CVS Caremark (or takes any action or makes any statement that is inconsistent with such recommendation) or approves, endorses or recommends a Superior Proposal (as defined in the CVS Agreement). However, we do not have the right to terminate the CVS Agreement in connection with such a change of recommendation by our Board and, unless CVS Caremark terminates the CVS Agreement, we would remain obligated to call a special meeting of its shareholders for the purpose of voting on a proposal to adopt the CVS Agreement. If the CVS Agreement is terminated by us under certain circumstances, we may be obligated to pay CVS Caremark a termination fee of $36 million and reimburse CVS Caremark for its out-of-pocket transaction-related expenses up to $5 million, which would represent an additional cost for a potential third party seeking a business combination with us.
Risks Relating to Newco's Business
Following consummation of the Transactions, Newco will be subject to the following risks:
Newco's stock price may be volatile and could drop precipitously and unexpectedly.
Newco expects its stock to be approved for listing on the NYSE. The prices of publicly traded stocks often fluctuate. The price of Newco common stock may rise or fall dramatically without any change in Newco's business performance.
Newco-specific issues and developments generally in the health care and insurance industries, the regulatory environment, the capital markets and the general economy may cause this volatility. The principal events and factors that may cause Newco's stock price and trading volume to fluctuate are:
- •
- the size of the public float of Newco common stock and the volume of trading and the general liquidity in the market for
Newco common stock;
- •
- variations in Newco's operating results;
- •
- changes in the market's expectations about Newco's future operating results;
30
- •
- changes in financial estimates and recommendations by securities analysts concerning Newco or the health care or insurance
industries generally;
- •
- operating and stock price performance of other companies that investors may deem comparable;
- •
- news reports relating to trends in Newco's markets;
- •
- changes in the laws and regulations affecting the Newco Business;
- •
- acquisitions and financings by Newco or others in its industry; and
- •
- sales of substantial amounts of Newco common stock by its directors and executive officers or principal shareholders, or the perception that these sales could occur.
Future sales of our common stock may depress the market price of Newco's common stock.
Upon consummation of the Part D Sale Transaction, it is expected that the Significant Shareholders will collectively own approximately 55% of Newco's common stock. In connection with the Part D Sale Transaction, the Significant Shareholders will obtain freely tradable shares of Newco common stock, which shares will not be subject to any lockup agreement or other restrictions on transfer. If any of the Significant Shareholders sells or distributes substantial amounts of Newco common stock, or if it is perceived that such sales or distributions could occur, the market price of Newco common stock could decline.
Newco's reduced scale and focus on the Newco Business may limit investor interest in Newco's common stock and substantial sales of Newco common stock may occur following the consummation of the Part D Sale Transaction.
The shares of Newco common stock that our shareholders will receive in connection with the Part D Sale Transaction generally may be sold immediately in the public market. Some shareholders, including institutional investors, who receive Newco's common stock in the Part D Sale Transaction may decide that they do not want to maintain an investment in Newco because of Newco's smaller size or because Newco will not own or operate the Medicare Part D business. If these shareholders decide to sell all or some of their shares, or the market perceives that those sales could occur, the market price of Newco common stock may decline. Because Newco will be a smaller company that is more narrowly focused than Universal American and will have a lower market capitalization than Universal American, Newco's stock may not be followed as closely by market analysts or the investment community as Universal American stock had been in the past. In addition, institutional investors may be less likely to invest in Newco in the future as a result of these factors. If there is only a limited following by market analysts or the investment community, or limited demand for Newco common stock by institutional investors, the amount of market activity in Newco's common stock may be reduced, making it more difficult to sell Newco common stock.
Following completion of the Part D Sale Transaction, Newco may be subject to assumed liabilities or indemnification obligations that are greater than anticipated.
Under the terms of the Separation Agreement, Newco has agreed to indemnify CVS Caremark for certain liabilities. The liabilities to be assumed by Newco under the Split-Off Agreements and its indemnification obligations related thereto may be greater than anticipated and may be greater than the amount of cash available to Newco, If such liabilities or indemnification obligations are larger than anticipated, Newco's financial condition could be materially and adversely affected.
31
The Separation Agreement contains a covenant limiting Newco's ability to incur debt, which may limit Newco's ability to operate its business going forward.
The Separation Agreement contains certain covenants, including a covenant restricting Newco's ability to incur debt. Under the terms of the Separation Agreement, until two years following the consummation of the Part D Sale Transaction, Newco will not be permitted to incur debt that would cause, on a pro forma basis, the ratio of Newco's consolidated funded indebtedness to consolidated adjusted EBITDA (as defined in our existing credit agreement) to exceed 3 to 1. While we have historically operated at leverage ratios below 3 to 1, Newco will operate as a new company and may require more capital to meet its business needs. Accordingly, this restriction could affect Newco's ability to operate its business and may limit its ability to react to market conditions or take advantage of potential business opportunities as they arise. For example, this restriction could adversely affect Newco's ability to finance its operations, make strategic acquisitions, finance investments or alliances, restructure its organization or finance its capital needs. The restriction could also limit the ability of a third party to acquire Newco.
The CMS sanction that suspended us from marketing to and enrolling new members in our Medicare Advantage plans has had and may continue to have a material adverse effect on our business, financial condition and results of operations.
On November 19, 2010, CMS notified us that we were suspended from marketing to and enrolling new members in our Medicare Advantage plans, effective December 5, 2010. According to CMS, the suspension relates primarily to agent oversight and market conduct issues and will remain in effect until CMS is satisfied that we have corrected the issues and they are not likely to recur. As a result of the suspension, we were unable to enroll new members in our Medicare Advantage plans during a significant portion of the annual enrollment period for the 2011 plan year and, as a result, our Medicare Advantage membership decreased significantly during that time period which will have a negative impact on our financial results for 2011 and beyond. At this time, we cannot predict the duration of the suspension and we cannot provide any assurances that we will be able to take appropriate corrective action to lift the suspension. If we are unable to take appropriate action to lift the suspension in advance of the 2012 annual enrollment period, it could have a material adverse effect on our business, financial condition and results of operations. In addition, as a government contractor, we earn substantially all of our revenue from our Medicare businesses in which CMS is not only our largest customer but also our regulator. If we are unable to maintain a constructive working relationship with CMS, our business could suffer materially. Further, there can be no assurance that despite any corrective measures taken on our part, that we will not incur additional penalties, fines or other operating restrictions, which could include termination of our right to participate in the Medicare program, which could have a further material adverse effect on our business, financial condition and results of operations.
Recently enacted health care legislation and subsequent rules promulgated by CMS could have a material adverse effect on our opportunities for growth and our financial results.
In March 2010, President Obama signed the Affordable Care Act legislating broad-based changes to the U.S. health care system. Provisions of the health reform legislation become effective at various dates over the next several years. The Department of Health and Human Services, the National Association of Insurance Commissioners, the Department of Labor and the Treasury Department have yet to issue necessary enabling regulations and guidance with respect to the health reform legislation. Due to the complexity of the health reform legislation, including yet to be promulgated implementing regulations, lack of interpretive guidance, gradual implementation and the fact that the Affordable Care Act has been succesfully challenged in the judicial system, the impact of the health reform legislation is difficult to predict and not yet fully known. However, we will need to dedicate significant resources and expense to complying with these new rules and there is a possibility that this new
32
legislation could have a material adverse effect on our business, financial position and results of operations.
The provisions of these new laws include the following key points, which are discussed further below:
- •
- Gradual closing of the coverage gap, or "donut hole" on Medicare Part D, through 2020;
- •
- Reduced Medicare Advantage reimbursement rates, beginning in 2012;
- •
- Implementation of a quality bonus for Star Ratings beginning in 2012;
- •
- Stipulated minimum medical loss ratios, beginning in 2014;
- •
- Shortened annual enrollment period, beginning with the 2011 selling season;
- •
- Non-deductible federal premium taxes assessed to health insurers, beginning in 2014;
- •
- Coding intensity adjustments, with mandatory minimums beginning in 2015;
- •
- Limitation on the federal tax deductibility of compensation earned by individuals, beginning in 2013; and
- •
- Established a de minimis allowance for Medicare Part D Benchmark bid cut-offs, beginning with the bid for the 2011 plan year, submitted in 2010.
Gradual closing of the Part D donut hole—In 2010, a rebate of $250 was provided by CMS for beneficiaries reaching the "coverage gap" (i.e., the dollar threshold at which an individual has to pay full price for his or her medications). Thereafter, on a gradual basis, the coverage gap will be closed by 2020, with beneficiaries retaining a 25% co-pay. In addition, there is a 50% discount on brand-name drugs. While this change ultimately results in increased insurance coverage, such improved benefits could result in changes in member behavior with respect to drug utilization. Such actions could also impact the cost structure of our Part D programs.
Reduced Medicare Advantage reimbursement rates—Beginning in 2012, the Medicare Advantage "benchmark" rates transition to target Medicare fee-for-service cost benchmarks of 95%; 100%, 107.5% or 115% of the calculated Medicare fee-for-service costs. The transition period will be 2, 4 or 6 years depending upon the applicable county in which services are provided. The counties are divided into quartiles based on each county's fee-for-service Medicare costs. We estimate that approximately 38% of our current membership resides in counties where the Medicare Advantage benchmark rate will equal 95% of the calculated Medicare fee-for-service costs, with approximately 89% of these members having a 6-year transition period. Under the new law, the premiums for such members will be transitioned to 95% of Medicare fee-for-service costs beginning in 2012. This follows the freezing of Medicare Advantage reimbursement rates in 2011 based on our 2010 levels. To address these rate freezes/reductions, we may have to reduce benefits, charge or increase member premiums, reduce profit margin expectations, or implement some combination of these actions. Such actions could adversely impact our membership growth, revenue expectations, and our operating margins.
Implementation of quality bonus for Star Ratings—Beginning in 2012, Medicare Advantage plans with an overall "Star Rating" of three or more stars (out of five) will be eligible for a "quality bonus" in their basic premium rates. The Affordable Care Act limited these quality bonuses to the few plans that achieved 4 or more stars as their overall rating, but CMS is using demonstration authority to expand the quality bonus to 3 star plans for a three year period through 2014. In addition, also beginning in 2012, Medicare Advantage star ratings will affect the rebate percentage available for plans to provide additional member benefits (plans with quality ratings of 3.5 stars or above will have their rebate percentage increased from a base rate of 50% to 65% or 70%). In all cases, this rebate percentage is lower than the pre-Affordable Care Act rebate percentage of 75%. Our Medicare Advantage plans are
33
currently rated 3 out of 5 stars, on average. Notwithstanding efforts to improve our star ratings and other quality measures prior to 2012, there can be no assurances that we will be successful in doing so. Accordingly, our plans may not be eligible for full level quality bonuses or increased rebates, which could adversely affect the benefits such plans can offer, reduce membership, and reduce profit margins.
Stipulated Minimum MLRs—Beginning in 2014, the new healthcare reform legislation will stipulate a minimum medical loss ratio, or MLR, of 85%. Financial and other penalties may result from failing to achieve the minimum MLR ratio. For the year ended December 31, 2010, our reported Medicare Advantage MLR was 83.6%. The methodology for defining medical costs and for calculating MLRs has not yet been defined. Complying with such minimum ratio by increasing our medical expenditures or refunding any shortfalls to the federal government could have a material adverse affect on our operating margins, results of operations, and our statutory required capital.
Shortened annual enrollment period—Medicare beneficiaries generally have a limited annual enrollment period during which they can choose to participate in a Medicare Advantage plan rather than receive benefits under the traditional fee-for-service Medicare program. After the annual enrollment period, most Medicare beneficiaries are not permitted to change their Medicare benefits.
Beginning with the 2011 enrollment season, the new laws shorten the time in which we can sell our Medicare Advantage and Part D products. Also, beginning in 2011, the new laws mandate that persons enrolled in Medicare Advantage may withdraw their enrollment at any time during the first 45 days of the year only to enroll in traditional Medicare fee-for-service, not another Medicare Advantage plan. Prior law allowed a member to withdraw enrollment during this period to enroll in another Medicare Advantage plan. There can be no assurance that these changes will not restrict our member growth, limit our ability to enter new service areas, limit the viability of our sales force, or otherwise adversely affect our ability to market to or enroll new members in our established service areas.
Non-deductible federal premium taxes—Beginning in 2014, the new healthcare reform legislation will impose an annual aggregate non-deductible tax of $8.0 billion (increasing incrementally to $14.3 billion by 2018) on health insurance premiums, including Medicare Advantage premiums. Our share of the new tax will be based on our pro rata percentage of premiums compared to the industry as a whole, calculated annually. Although there is time to take into account this new tax in adjusting our business model and in designing future years' plan bids, there can be no assurance that such tax will not result in reduced member benefits, reduced profits, or both which could have a material adverse effect on our results of operations.
Coding intensity adjustments—Under the new healthcare reform legislation, the coding intensity adjustment instituted in 2010 became permanent, resulting in mandated minimum reductions in risk scores of 4.71% in 2014 increasing to 5.7% for 2019 and beyond. These coding adjustments may adversely affect the level of payments from CMS to our Medicare Advantage and PDP plans.
Limitation on the federal tax deductibility of compensation earned by individuals—Beginning in 2013, with respect to services performed after 2009, the federal tax deductibility of compensation under Section 162(m)(6) of the Internal Revenue Code for health insurance companies is limited to $500,000 per individual. This limitation increased our effective tax rate, beginning in the second quarter of 2010.
Established a de minimis allowance for Medicare Part D Benchmark bid cut-offs —Beginning with the bids for the 2011 plan year, submitted in 2010, Medicare Part D plans can continue to participate in the auto assignment of dual eligibles when the plan's bid is over the Low Income Subsidy benchmark by a de minimis amount, as defined by CMS, as long as the difference between the bid premium and the benchmark premium is waived. This could impact the number of plans participating in the auto assignment of dual-eligibles and impact the number of dual-eligibles that potentially could be assigned to our plans.
34
Most of the provisions of the Affordable Care Act are not scheduled to go into effect immediately and may be delayed for several years, including as a result of judicial action challenging the legality of the Affordable Care Act. Financing for the reforms contained in the Affordable Care Act will come, in part, from additional taxes and fees on our business as well as reductions in payments to us, which could negatively impact our business and results of operations. In addition, during this time, the new healthcare reform legislation may be subject to further adjustments. Because of the unsettled nature of these reforms and numerous steps required to implement and monitor them, we cannot predict what additional health insurance reforms will be implemented at the federal or state level, the effect that any future legislation or regulation will have on our business or how CMS will review our future bid submissions and ultimately, the overall impact of the new healthcare reform legislation on our business.
If we fail to effectively design and price our products properly and competitively, if the premiums we charge are insufficient to cover the cost of health care services delivered to our members, or if our estimates of benefit expenses are inadequate, our profitability may be materially adversely affected.
We use a substantial portion of our revenues to pay the costs of health care services delivered to our members. These costs include claims payments, capitation payments to providers, and various other costs incurred to provide health insurance coverage to our members. These costs also include estimates of future payments to hospitals and others for medical care provided to our members. Our premiums for our Medicare business are fixed for one-year periods. Accordingly, costs we incur in excess of our benefit cost projections generally are not recovered in the contract year through higher premiums. We estimate the costs of our future benefit claims and other expenses using actuarial methods and assumptions based upon claim payment patterns, medical inflation, historical developments, including claim inventory levels and claim receipt patterns, and other relevant factors. We continually review estimates of future payments relating to benefit claims costs for services incurred in the current and prior periods and make necessary adjustments to our reserves. However, these estimates involve extensive judgment, and have considerable inherent variability that is sensitive to payment patterns and medical cost trends. The profitability of our risk-based products depends in large part on our ability to predict, price for and effectively manage medical costs. Failure to adequately price our products or estimate medical costs may result in a material adverse effect on our business, cash flows and results of operations.
Reductions in funding for Medicare programs could materially reduce our profitability.
We generate a significant majority of our total revenue from the operation of our Medicare Advantage HMO, PFFS, and PPO plans and Medicare Part D PDPs. As a result, our revenue and profitability are dependent, in part, on government funding levels for these programs. The rates paid to Medicare Advantage health plans like ours are established by contract, although the rates differ depending on a combination of factors, such as upper payment limits established by CMS, a member's health profile and status, age, gender, county or region, benefit mix, member eligibility categories and the plan's risk scores. Future Medicare rate levels may be affected by continuing government efforts to contain prescription drug costs and other medical expenses, and other federal budgetary constraints. The government is currently examining Medicare Advantage health plans like ours in comparison to Medicare fee-for-service payments, and this examination could result in a reduction in payments to Medicare Advantage health plans like ours. Changes in the Medicare program or Medicare funding may affect our ability to operate under the Medicare program or lead to reductions in the amount of reimbursement, elimination of coverage for some benefits or reductions in the number of persons enrolled in or eligible for Medicare or increases in member premium.
35
Failure to reduce our operating costs could have a material adverse effect on our financial position, results of operations and cash flows.
The level of our operating costs affects our profitability. As a result of MIPPA and the CMS sanction, our Medicare Advantage membership decreased significantly as of January 1, 2011. In addition, upon consummation of the Part D Sale Transaction, we will be a much smaller company. If we are unable to reduce our operating expenses to better match the smaller size of the Company, it could have a material adverse effect on our financial condition, results of operations and cash flows.
Competition in the insurance, healthcare, PBM and pharmacy industries is intense, and if we do not design and price our products properly and competitively, our membership and profitability could decline.
We operate in a highly competitive industry. Some of our competitors are more established in the insurance, health care and PBM industries, with larger market share, more established reputations and brands and greater financial resources than we have in some markets. In addition, other companies may enter our markets in the future. Medicare Advantange and PDP plans are generally bid upon or renewed annually. We compete for members in our Medicare Advantage and PDP plans and PBM on the basis of the following and other factors:
- •
- price,
- •
- the size, location, quality and depth of provider networks,
- •
- benefits provided,
- •
- quality and extent of services, and
- •
- reputation.
In addition to the challenge of controlling PBM and health care costs, we face intense competitive pressure to contain premium prices. Factors such as business consolidations, strategic alliances, legislative reform and marketing practices create pressure to contain premium rate increases, despite being faced with increasing medical costs. Premium increases, introduction of new product designs, our relationship with our providers in various markets, and our possible exit from or entrance into additional markets, among other issues, could also affect our membership levels.
We compete based on innovation and service, as well as on price and benefit offering. We may not be able to develop innovative products and services which are attractive to clients. Moreover, although we need to continue to expend significant resources to develop or acquire new products and services in the future, we may not be able to do so. We cannot be sure that we will continue to remain competitive, nor can we be sure that we will be able to market our products and services to clients successfully at current levels of profitability.
Consolidation within the industries in which we operate, as well as the acquisition of any of our competitors by larger companies, may lead to increased competition. Strategic combinations involving our competitors could have an adverse effect on our business or results of operations.
If we do not compete effectively in our markets, if we set rates too high in highly competitive markets to maintain or increase our market share, if we set rates too low to maintain or increase our profitability, if membership does not increase as we expect, if membership declines, if we fail are unable to innovate and deliver products and services that demonstrate value to our customers or if we lose members with favorable medical cost experience while retaining or increasing members with unfavorable medical cost experience, our business and results of operations could be materially adversely affected.
36
Our results of operations will be adversely affected if our insurance premium rates are not adequate.
Our results of operations depend on our ability to charge and collect premiums sufficient to cover our health care costs, expenses of distribution and operations and provide a reasonable margin. Although we attempt to base the premiums we charge on our estimate of future health care costs, we may not be able to control the premiums we charge as a result of competition, government regulations and other factors. Our results of operations could be adversely affected if we are unable to set premium rates at appropriate levels or adjust premium rates in the event our health care costs increase.
We set the premium rates on our insurance policies based on facts and circumstances known at the time we issue the policies and on assumptions about numerous variables, such as
- •
- the actuarial probability of a policyholder incurring a claim;
- •
- the severity and duration of the claim;
- •
- the utilization of benefits in our PDP's;
- •
- the mortality rate of our policyholder base;
- •
- the persistency or renewal rate of our policies in force;
- •
- our commission and policy administration expenses; and
- •
- the interest rate earned on our investment of premiums.
In setting premium rates, we consider historical claims information, industry statistics and other factors. We cannot be assured that the data and assumptions used at the time of establishing premium rates will prove to be correct and that premiums will be sufficient to cover benefits and expenses plus a reasonable margin.
For certain of our traditional products, we can periodically file for rate increases, if our actual claims experience proves to be less favorable than we assumed. If we are unable to raise our premium rates, our net income may decrease. We generally cannot raise our premiums in any state unless we first obtain the approval of the insurance regulator in that state. We review the adequacy of our accident and health premium rates regularly and file rate increases on our products when we believe permitted premium rates are too low. When determining whether to approve or disapprove our rate increase filings, the various state insurance departments take into consideration
- •
- our actual claims experience compared to expected claims experience;
- •
- policy persistency, which means the percentage of policies that are in-force at specified intervals from the
issue date compared to the total amount originally issued;
- •
- investment income; and
- •
- medical cost inflation.
If the regulators do not believe these factors warrant a rate increase, it is possible that we will not be able to obtain approval for premium rate increases from currently pending requests or requests filed in the future. If we are unable to raise our premium rates because we fail to obtain approval for rate increases in one or more states, our net income may decrease. If we are successful in obtaining regulatory approval to raise premium rates, the increased premium rates may reduce the volume of our new sales and cause existing policyholders to let their policies lapse. This would reduce our premium income in future periods. Increased lapse rates also could require us to expense all or a portion of the deferred policy costs relating to lapsed policies in the period in which those policies lapse, reducing our net income in that period.
37
The competitive bidding process for our Medicare Advantage plans may adversely affect our profitability.
Payments for the local Medicare Advantage health plans and regional Medicare Advantage PPO programs are based on a competitive bidding process that may decrease the amount of premiums paid to us or cause us to increase the benefits we offer to our members. As in the Part D program, we are required to submit Medicare Advantage bids annually, approximately six months in advance of the corresponding benefit year. We endeavor to use the best available member eligibility, claims and risk score data at the time of developing the bids. Furthermore, we make actuarial assumptions about the utilization of benefits in our plans. However, these assumptions are subject to significant judgment and we cannot be assured that the data and assumptions used at the time of bid development will prove to be correct and that premiums will be sufficient to cover member benefits plus a reasonable margin. If our bid assumptions are too low and member claims are higher than anticipated, we could be required to expend significant unanticipated amounts which could have a material adverse effect on our business, profitability and results of operations.
Our Part D business is subject to an annual competitive bidding process and if we are unable to bid below the benchmark, we could lose auto-assigned dual eligible and other LIS members which would adversely affect results of operations.
We are required to submit PDP bids annually, approximately six months in advance of the corresponding benefit year. The premiums we establish based on these bids are fixed for the entire plan year. We endeavor to use the best available member eligibility, claims and risk score data at the time of developing the bids. We cannot be certain that our products will be competitive with the products offered by other PDPs. We cannot be certain that our future bids will be competitive with the bids submitted by other PDPs. We cannot be certain that our future bids will be under the benchmark bids calculated by CMS. As of January 1, 2011, approximately, 77% of our PDP members were comprised of LIS members. If we fail to bid below the benchmark, we could lose these members.
Because our Medicare Advantage premiums, which generate most of our Medicare Advantage revenues, are fixed by contract, we are unable to increase our Medicare Advantage premiums during the contract term if our corresponding medical benefits expense exceeds our estimates which can adversely affect our results of operations.
Most of our Medicare Advantage revenues are generated by premiums consisting of fixed monthly payments per member. We use a significant portion of our revenues to pay the costs of health care services delivered to our members. The principal costs consist of claims payments, capitation payments and other costs incurred to provide health insurance coverage to our members. Generally, premiums in the health care business are fixed on an annual basis by contract, and we are obligated during the contract period to provide or arrange of the provision of healthcare services as established by the Federal government.
We are unable to increase the premiums we receive under these contracts during the then-current term. If our medical expenses exceed our estimates, except in very limited circumstances or as a result of risk score adjustments for member acuity, we generally cannot recover costs we incur in excess of our medical cost projections in the contract year through higher premiums. As a result, our profitability depends, to a significant degree, on our ability to adequately predict and effectively manage our medical expenses related to the provision of healthcare services. Accordingly, the failure to adequately predict and control medical expenses and to make reasonable estimates and maintain adequate accruals for incurred but not reported claims, known as IBNR, may have a material adverse effect on our financial condition, results of operations, or cash flows. If our estimates of reserves are inaccurate, our ability to take timely corrective actions or to otherwise establish appropriate premium pricing could be adversely affected. Failure to adequately price our products or to estimate sufficient medical claim reserves may result in a material adverse effect on our financial position, results of operations and cash
38
flows. In addition, to the extent that CMS or Congress takes action to reduce the levels of payments to Medicare Advantage providers, our revenues would be adversely affected.
We estimate the costs of our future medical claims and other expenses using actuarial methods and assumptions based upon claim payment patterns, cost trends, product mix, seasonality, medical inflation, historical developments, such as claim inventory levels and claim receipt patterns, and other relevant factors. We continually review estimates of future payments relating to medical claims costs for services incurred in the current and prior periods and make necessary adjustments to our reserves. However, historically, our medical expenses as a percentage of premium revenue have fluctuated. The principal factors that may cause medical expenses to exceed our estimates are:
- •
- increased utilization of medical facilities and services and prescription drugs;
- •
- increased cost of services;
- •
- our membership mix;
- •
- variances in actual versus estimated levels of cost associated with new products, benefits or lines of business;
- •
- product changes or benefit level changes;
- •
- periodic renegotiation of hospital, physician and other provider contracts, or the consolidation of these entities;
- •
- membership in markets lacking adequate provider networks;
- •
- changes in the demographics of our members and medical trends affecting them;
- •
- termination of capitation arrangements resulting in the transfer of membership to fee-for-service
arrangements or loss of membership;
- •
- possible changes in the pharmacy rebates available to us from drug manufacturers;
- •
- the occurrence of acts of terrorism, public health epidemics, severe weather events or other catastrophes;
- •
- the introduction of new or costly treatments and technologies;
- •
- medical cost inflation;
- •
- government mandated benefits or other regulatory changes; and
- •
- contractual disputes with hospitals, physicians and other providers.
Because of the relatively high average age of the Medicare population, medical expenses for our Medicare Advantage plans may be particularly difficult to control. We may not be able to continue to manage these expenses effectively in the future. If our medical expenses increase, our profits could be reduced or we may not remain profitable.
We hold reserves for expected claims, which are estimated, and these estimates involve an extensive degree of judgment; if actual claims exceed reserve estimates, our results could be materially adversely affected.
Our benefits incurred expense reflects estimates of IBNR. We, together with our internal and external consulting actuaries, estimate our claim liabilities using actuarial methods based on historical data adjusted for payment patterns, cost trends, product mix, seasonality, utilization of healthcare services and other relevant factors. Actual conditions, however, could differ from those assumed in the estimation process, and those differences could be material. Due to the uncertainties associated with the factors used in these assumptions, the actual amount of benefit expense that we incur may be materially more or less than the amount of IBNR originally estimated, and materially different amounts
39
could be reported in our financial statements for a particular period under different conditions or using different assumptions. We make adjustments, if necessary, to benefits incurred expense when the criteria used to determine IBNR change and when we ultimately determine actual claim costs. If our estimates of IBNR are inadequate in the future, our reported results of operations will be adversely affected. Further, our inability to estimate IBNR accurately may also affect our ability to take timely corrective actions or otherwise establish appropriate premium pricing, further exacerbating the extent of any adverse effect on our results.
Our reserves for future insurance policy benefits and claims on our traditional business may prove to be inadequate, requiring us to increase liabilities and resulting in reduced net income and stockholders' equity.
We calculate and maintain reserves for the estimated future payment of claims to our insurance policyholders using the same actuarial assumptions that we use to set our premiums. For our traditional accident and health insurance business, we establish active life reserves for expected future policy benefits, plus a liability for due and unpaid claims, claims in the course of settlement, and incurred but not reported claims. Many factors can affect these reserves and liabilities, such as economic and social conditions, inflation, hospital and medical costs, changes in doctrines of legal liability and extra-contractual damage awards. Therefore, we necessarily base our reserves and liabilities on extensive estimates, assumptions and prior years' statistics. When we acquire other insurance companies or blocks of insurance, our assessment of the adequacy of acquired policy liabilities is subject to similar estimates and assumptions. Establishing reserves involves inherent uncertainties, and it is possible that actual claims could materially exceed our reserves and have a material adverse effect on our results of operations and financial condition. Our net income depends significantly upon the extent to which our actual claims experience is consistent with the assumptions we used in setting our reserves and pricing our policies. If our assumptions with respect to future claims are incorrect, and our reserves are insufficient to cover our actual losses and expenses, we would be required to increase our liabilities resulting in reduced net income, statutory surplus and stockholders' equity.
We may experience higher than expected loss ratios which could materially adversely affect our results of operations.
We may experience higher than expected loss ratios if health care costs exceed our estimates. Factors that may cause health care costs to exceed our estimates include:
- •
- an increase in the cost of health care services and supplies, including pharmaceuticals;
- •
- higher than expected utilization of health care services;
- •
- periodic renegotiations of hospital, physician and other provider contracts;
- •
- the occurrence of catastrophic events, including epidemics and natural disasters;
- •
- general inflation or economic downturns;
- •
- new mandated benefits or other regulatory changes that increase our costs; and
- •
- other unforeseen occurrences.
We seek to take appropriate actions in an effort to reverse any upward trend in our loss ratios; however, we can make no assurances that these actions will be sufficient. We also cannot give assurance that our loss ratios will not continue to increase beyond what we currently anticipate, and any increases could materially adversely affect our results of operations.
In addition, medical liabilities in our financial statements include our estimated reserves for incurred but not reported and reported but not paid claims. The estimates for medical liabilities are made on an accrual basis. We believe that our reserves for medical liabilities are adequate, but we
40
cannot assure you of this. Any adjustments to our medical liabilities could adversely affect our results of operations.
We are subject to extensive government regulation; compliance with laws and regulations is complex and expensive, and any violation of the laws and regulations applicable to us could reduce our revenues and profitability and otherwise adversely affect our operating results and/or impact our ability to sell Medicare products.
There is substantial Federal and state governmental regulation of our business. Several laws and regulations adopted by the Federal government, such as the Affordable Care Act, the Sarbanes-Oxley Act of 2002, the Gramm-Leach-Bliley Act, the Health Insurance Portability and Accountability Act, known as HIPAA, the MMA, the USA PATRIOT Act, the False Claims Act, anti-kickback laws, MIPPA and "Do Not Call" regulations, have created administrative and compliance requirements for us. The requirements of these laws and regulations are continually evolving, and the cost of compliance may have an adverse effect on our profitability. As laws and regulations evolve, the costs of compliance, which are already significant, will tend to increase. If we fail to comply with existing or future applicable laws and regulations, as was the case in 2010 in connection with our 2010 CMS audit, we could suffer civil, criminal or administrative penalties. Different interpretations and enforcement policies of these laws and regulations could subject our current practices to allegations of impropriety or illegality, or could require us to make significant changes to our operations. In addition, we cannot predict the impact of future legislation and regulatory changes on our business or assure you that we will be able to obtain or maintain the regulatory approvals required to operate our business. In addition, we are subject to potential changes in the political environment that can affect public policy and can adversely affect the markets for our products.
Laws and regulations governing Medicare and other state and federal healthcare and insurance programs are complex and subject to significant interpretation. As part of the Affordable Care Act, CMS has been exercising increased oversight and regulatory authority over our Medicare businesses. Compliance with such laws and regulations is subject to CMS audit, other governmental review and investigation and significant interpretation. There can be no assurance that we will be found to be in compliance with all such laws and regulations in connection with these audits, reviews and investigations. For example, in September 2010, CMS informed us that our Medicare Part D plans would not receive the one-time auto-assignment of new dual-eligible members on January 1, 2011. In addition, on November 19, 2010, CMS notified us that we were suspended from marketing to and enrolling new members in our Medicare Advantage plans, effective December 5, 2010. Further, on February 25, 2011, we received the final performance audit and inspection report from CMS with respect to its audit of our Medicare Advantage and Medicare Part D contracts conducted during 2010. The audit report noted deficiencies with respect to both our Medicare Advantage and Medicare Part D contracts, including prescription drug formulary administration, coverage determinations and appeals, grievances, enrollment and disenrollment, premium billing and compliance plan deficiencies, that were in addition to the deficiencies noted in the November 19, 2010 suspension notice. According to CMS, we have 60 days to develop and implement a corrective action plan to correct the additional deficiencies noted in the audit report. Failure to correct the deficiencies noted in the February 25, 2011 audit report or to otherwise be in compliance with applicable laws and regulations could result in CMS imposing additional sanctions on us including penalties, fines or other operating restrictions, including termination of our right to participate in the Medicare program, which could have a material adverse effect on our business, financial condition and results of operations.
Laws in each of the states in which we operate our health plans, insurance companies and other businesses also regulate our sales practices, operations, the scope of benefits, rate formulas, delivery systems, utilization review procedures, quality assurance, complaint systems, enrollment requirements, claim payments, marketing, and advertising. These state regulations generally require, among other
41
things, prior approval or notice of new products, premium rates, benefit changes and specified material transactions, such as dividend payments, purchases or sales of assets, inter-company agreements, and the filing of various financial and operational reports.
We are also subject to various governmental reviews, audits and investigations to verify our compliance with our contracts and applicable laws and regulations. State departments of insurance audit our health plans and insurance companies for financial and contractual compliance. State departments of health audit our health plans for compliance with health services. State attorneys general, CMS, the Office of the Inspector General of Health and Human Services, the Office of Personnel Management, the Department of Justice, the Department of Labor, the Government Accountability Office, state departments of insurance and departments of health and Congressional committees also conduct audits and investigations of us. We have historically incurred, and expect to continue to incur, significant costs to respond to governmental reviews, audits and investigations, and we expect these costs to increase over time as regulation increases and becomes more complex and as regulatory agencies and Congressional committees become more sophisticated and thorough.
Any adverse review, audit or investigation, or changes in regulations resulting from the conclusion of reviews, audits or investigations, could result in:
- •
- repayment of amounts we have been paid pursuant to our government contracts;
- •
- imposition of civil or criminal penalties, fines or other sanctions on us;
- •
- loss of licensure or the right to participate in Medicare and other government-sponsored programs;
- •
- suspension of marketing and enrollment privileges;
- •
- damage to our reputation in various markets;
- •
- legislative or regulatory changes that affect our business and operations;
- •
- increased difficulty in marketing our products and services; and
- •
- prohibiting the expansion to new markets or the addition of new products in existing markets.
Any of these events could make it more difficult for us to sell our products and services, reduce our revenues and profitability and otherwise adversely affect our operating results. For more information on governmental regulation of our business, see the section captioned "Regulation" in Part I, Item 1 of this annual report on Form 10-K.
CMS from time to time releases proposed or amended regulations that, if adopted, would, among other things, place tighter restrictions on marketing processes relative to the Medicare Advantage program and Medicare prescription drug benefit program. Depending upon the final content of these regulations, if CMS proposes and adopts them, compliance with and enforcement of the regulations could have a material adverse effect on our results of operations.
We are also subject to a federal law commonly referred to as the "Anti-Kickback Statute. The Federal Anti-Kickback Statute prohibits the payment or receipt of any "Remuneration" that is intended to induce referrals or the purchasing, leasing or ordering of any item or service that may be reimbursed, in whole or in part, under a Federal Health Care Program, such as Medicare. It also prohibits the payment or receipt of any Remuneration that is intended to induce the recommendation of the purchasing, leasing or ordering of any such item or service. In July 2009 and March 2010, we received subpoenas from the Department of Health and Human Services, Office of Inspector General, known as HHS-OIG, requesting documents related to marketing, sales and enrollment practices for our Today's Health Medicare HMO Plans which are offered in the State of Wisconsin. The investigation
42
includes matters relating to the Anti-Kickback Statute. Violations of the Anti-Kickback Statute could result in substantial monetary penalties and could also include exclusion from the Medicare program.
Changes in governmental regulation or legislative reform could increase our costs of doing business and adversely affect our profitability.
The Federal government and the states in which we operate extensively regulate our health plans, insurance companies and other business. The laws and regulations governing our operations are generally intended to benefit and protect policyholders, health plan members and providers rather than shareholders. From time to time, Congress has considered various forms of "Patients' Bill of Rights" legislation, which, if adopted, could alter the treatment of coverage decisions under applicable federal employee benefits laws. There have also been legislative attempts at the state level to limit the preemptive effect of Federal employee benefits laws on state laws. If adopted, these types of limitations could increase our liability exposure and could permit greater state regulation of our operations. The government agencies administering these laws and regulations have broad latitude to enforce them. These laws and regulations, along with the terms of our government contracts, regulate how we do business, what services we offer, and how we interact with our policyholders, members, providers and the public. Healthcare laws and regulations are subject to frequent change and differing interpretations. Changes in the political climate or in existing laws or regulations, or their interpretations, or the enactment of new laws or the issuance of new regulations could adversely affect our business by, among other things:
- •
- imposing additional license, registration, or capital reserve requirements;
- •
- increasing our administrative and other costs;
- •
- forcing us to undergo a corporate restructuring;
- •
- increasing mandated benefits without corresponding premium increases;
- •
- limiting our ability to engage in inter-company transactions with our affiliates and subsidiaries;
- •
- adversely affecting our ability to operate under the Medicare program and to continue to serve our members and attract new
members;
- •
- changing the manners or the basis upon which CMS reinsures us or pays premium to us, or upon which our members pay
premiums;
- •
- forcing us to alter or restructure our relationships with providers and agents;
- •
- restricting our ability to market our products;
- •
- increasing governmental regulation or provision of healthcare and PBM services, such as potential regulation of the PBM
industry by the U.S. Food and Drug Administration, or direct regulation of pharmacies by regulatory and quasi- regulatory bodies;
- •
- requiring that health plan members have greater access to non-formulary drugs;
- •
- expanding the ability of health plan members to sue their plans;
- •
- requiring us to implement additional or different programs and systems;
- •
- prohibiting us from participating in existing or future programs and systems;
- •
- increasing antitrust lawsuits challenging PBM pricing practices;
- •
- instituting state legislation regulating PBMs or imposing fiduciary status on PBMs; and
- •
- instituting drug pricing "most favored nation" pricing and "unitary pricing" legislation or other drug pricing legislation.
43
While it is not possible to predict when and whether fundamental policy changes would occur, policy changes on the local, state and federal level could fundamentally change the dynamics of our industry, such as policy changes mandating a much larger role of the government in the health care arena. Changes in public policy could materially affect our profitability, our ability to retain or grow business, or our financial condition. State and federal governmental authorities are continually considering changes to laws and regulations applicable to us and are currently considering regulations relating to:
- •
- health insurance access and affordability;
- •
- disclosure of provider quality information;
- •
- electronic access to pharmacy and medical records;
- •
- formation of regional or national association health plans for small employers;
- •
- universal health coverage; and
- •
- disclosure of provider fee schedules and other data about payments to providers, sometimes called transparency.
All of these proposals could apply to us and could result in new regulations that increase the cost of our operations. Healthcare organizations also may reduce or delay the purchase of PBM services, and manufacturers may reduce administrative fees and rebates or reduce supplies of some products. Any of the foregoing legislative or regulatory changes could adversely affect our or our service providers' ability to negotiate rebate and administrative fee arrangements with manufacturers and have a material adverse effect on our business and results of operations.
Compliance with and enforcement of the existing and any proposed regulations could have a material adverse effect on our results of operations.
We are required to comply with laws governing the transmission, security and privacy of health information that require significant compliance costs, and any failure to comply with these laws could result in material criminal and civil penalties.
Regulations under HIPAA require us to comply with standards regarding the exchange of health information within our company and with third parties, such as healthcare providers, business associates and our members. These regulations impose standards for common healthcare transactions, such as
- •
- claims information, plan eligibility, and payment information;
- •
- unique identifiers for providers and employers;
- •
- security;
- •
- privacy; and
- •
- enforcement.
HIPAA also provides that to the extent that state laws impose stricter privacy standards than HIPAA privacy regulations, HIPAA does not preempt the state standards and laws.
Given the complexity of the HIPAA regulations, the possibility that the regulations may change, and the fact that the regulations are subject to changing and potentially conflicting interpretation, our ability to maintain compliance with the HIPAA requirements is uncertain and the costs of compliance are significant. Furthermore, a state's ability to promulgate stricter laws, and uncertainty regarding many aspects of state requirements, make compliance more difficult. To the extent that we submit electronic healthcare claims and payment transactions that do not comply with the electronic data transmission standards established under HIPAA, payments to us may be delayed or denied.
44
Additionally, the costs of complying with any changes to the HIPAA regulations may have a negative impact on our operations. We could be subject to criminal penalties and civil sanctions for failing to comply with the HIPAA health information provisions, which could result in the incurrence of significant monetary penalties. In addition, our failure to comply with state health information laws that may be more restrictive than the regulations issued under HIPAA could result in additional penalties.
Compliance with HIPAA regulations requires significant systems enhancements, training and administrative effort. HIPAA could also expose us to additional liability for violations by our business associates. A business associate is a person or entity, other than a member of the work force, who on behalf of an entity subject to HIPAA performs or assists in the performance of a function or activity involving the use or disclosure of individually identifiable health information, or provides legal, accounting, consulting, data aggregation, management, administrative, accreditation or financial services.
Legal and regulatory investigations and actions are increasingly common in the insurance and managed care business and may result in financial losses and harm our reputation.
We face a significant risk of class action lawsuits and other litigation and regulatory investigations and actions in the ordinary course of operating our businesses. Due to the nature of our businesses, we are subject to a variety of legal and regulatory actions relating to our business operations, such as the design, management and offering of products and services. The following are examples of the types of potential litigation and regulatory investigations we face:
- •
- claims relating to sales or underwriting practices;
- •
- claims relating to the methodologies for calculating premiums;
- •
- claims relating to the denial or delay of health care benefit payments;
- •
- claims relating to claims payments and procedures;
- •
- additional premium charges for premiums paid on a periodic basis;
- •
- claims relating to the denial, delay or rescission of insurance coverage;
- •
- challenges to the use of software products used in administering claims;
- •
- claims relating to our administration of our Medicare Part D and other healthcare and insurance offerings and PBM;
- •
- claims relating to provider marketing;
- •
- anti-kickback claims;
- •
- claims under the False Claims Act;
- •
- claims by government agencies relating to compliance with laws and regulations;
- •
- medical malpractice or negligence actions based on our medical necessity decisions or brought against us on the theory
that we are liable for our providers' alleged malpractice or negligence;
- •
- claims relating to product design;
- •
- allegations of anti-competitive and unfair business activities;
- •
- provider disputes over compensation and termination of provider contracts;
- •
- allegations of discrimination;
- •
- claims related to the failure to disclose business practices;
45
- •
- allegations of breaches of duties to customers;
- •
- claims relating to inadequate or incorrect disclosure or accounting in our public filings;
- •
- allegations of agent misconduct;
- •
- claims related to deceptive trade practices;
- •
- claims relating to suitability of annuity products; and
- •
- claims relating to customer audits and contract performance.
Plaintiffs in class action and other lawsuits against us may seek very large or indeterminate amounts, and punitive and treble damages, which may remain unknown for substantial periods of time. We are also subject to various regulatory inquiries, such as information requests, formal and informal inquiries, subpoenas and books and record examinations, from state and Federal regulators and other authorities. A substantial legal liability or a significant regulatory action against us could have an adverse effect on our business, financial condition and results of operations.
We cannot predict the outcome of actions we face with certainty, and we have incurred and are incurring expenses in the defense of our past and current matters. We also may be subject to additional litigation in the future. Litigation could materially adversely affect our business or results of operations because of the costs of defending these cases, the costs of settlement or judgments against us, or the changes in our operations that could result from litigation. The defense of any these actions may be time-consuming and costly, and may distract our management's attention. In addition, we could suffer significant harm to our reputation, which could have an adverse effect on our business, financial condition and results of operations. As a result, we may incur significant expenses and may be unable to effectively operate our business.
Potential liabilities may not be covered by insurance or indemnity, insurers or indemnifying parties may dispute coverage or may be unable to meet their obligations or the amount of our insurance or indemnification coverage may be inadequate. In some cases, treble damages may be sought. In addition, some types of damages, such as punitive damages or damage for willful acts, may not be covered by insurance. The cost of business insurance coverage has increased, and may in the future increase, significantly. Insurance coverage for all or some forms of liability may become unavailable or prohibitively expensive in the future. We cannot assure you that we will be able to obtain insurance coverage in the future, or that insurance will continue to be available on a cost-effective basis, if at all.
The health care industry continues to receive significant negative publicity regarding the public's perception of it. This publicity and public perception have been accompanied by increased litigation, in some cases resulting in
- •
- large jury awards,
- •
- legislative activity,
- •
- regulation, and
- •
- governmental review of industry practices.
These factors, as well as any negative publicity about us in particular, could adversely affect our ability to market our products or services and to attract and retain members, may require us to change our products or services, may increase the regulatory burdens under which we operate and may require us to pay large judgments or fines. Any combination of these factors could further increase our cost of doing business and adversely affect our financial position, results of operations and cash flows.
46
CMS's risk adjustment payment system and budget neutrality factors make our revenue and profitability difficult to predict and could result in material retroactive adjustments to our results of operations.
All of the Medicare Advantage programs we offer are subject to Congressional appropriation. As a result, our profitability is dependent, in large part, on continued funding for government healthcare programs at or above current levels. The reimbursement rates paid to health plans like ours by the Federal government are established by contract, although the rates differ depending on a combination of factors such as a member's health status, age, gender, county or region, benefit mix, member eligibility categories, and the plans' risk scores.
CMS has implemented a risk adjustment model that apportions premiums paid to Medicare health plans according to health severity. The risk adjustment model pays more for enrollees with predictably higher costs. Under this model, rates paid to Medicare Advantage plans are based on actuarially determined bids, which include a process whereby our prospective payments are based on a comparison of our beneficiaries' risk scores, derived from medical diagnoses, to those enrolled in the government's original Medicare program.
Under the risk adjustment methodology, all Medicare health plans must capture, collect and submit the necessary diagnosis code information from inpatient and ambulatory treatment settings to CMS within prescribed deadlines. The CMS risk adjustment model uses this diagnosis data to calculate the risk adjusted premium payment to Medicare health plans. We generally rely on providers to code their claim submissions with appropriate diagnoses, which we send to CMS as the basis for our payment received from CMS under the actuarial risk-adjustment model. We also rely on providers to appropriately document all medical data, including the diagnosis data submitted with claims. As a result of this process, it is difficult to predict with certainty our future revenue or profitability. CMS may also change the manner in which it calculates risk adjusted premium payments in ways that are adverse to us. In addition, our own risk scores for any period may result in favorable or unfavorable adjustments to the payments we receive from CMS and our Medicare premium revenue. Because diagnosis coding is a manual process, there is the potential for human error in the recording of codings, and there can be no assurance that our contracting physicians and hospitals will be successful in improving the accuracy of recording diagnosis code information and therefore our risk scores.
During 2008, CMS announced its intention to engage in a pilot program to more extensively audit a select group of Medicare Advantage health plans in the area of hierarchical condition category, or HCC, coding for the determination of risk score revenue. These audits were labeled "Risk Adjustment Data Validation" audits, or RADV. RADV audits review medical record documentation in an attempt to validate provider coding practices and the presence of risk adjustment conditions which influence the calculation of premium payments to Medicare Advantage plans. Following the completion of the RADV pilot, CMS has extended its audit program to randomly selected Plans for the stated purpose of generating statistically valid payment error estimates. While CMS has not yet fully disclosed its final intent with respect to RADV findings it should be noted that this audit, like any other audit pursued by CMS, may result in an adverse impact to revenue on a prospective or retrospective basis. We have been selected to participate in the extended audit program and have recently completed our initial data submission to CMS. These audits may result in retrospective adjustments to payments made to health plans. In December 2010, CMS published for public comment a new proposed RADV audit and payment adjustment methodology. The proposed methodology contains provisions allowing retroactive contract level payment adjustments for the year audited using an extrapolation of the "error rate" identified in audit samples. Depending on the methodology utilized, potential payment adjustments could have a material adverse effect on our results of operations, financial position and cash flows.
Coincident with phase-in of the risk-adjustment methodology, CMS also adjusted payments to Medicare Advantage plans by a "budget neutrality" factor. CMS implemented the budget neutrality factor to prevent overall health plan payments from being reduced during the transition to the
47
risk-adjustment payment model. CMS first developed the payment adjustments for budget neutrality in 2002 and began to use them with the 2003 payments. CMS began phasing out the budget neutrality adjustment in 2007 and will fully eliminate it by 2011. The risk adjustment methodology and phase-out of the budget neutrality factor will reduce our plans' premiums unless our risk scores increase. We do not know if our risk scores will increase in the future or, if they do, that the increases will be large enough to offset the elimination of this adjustment. As a result of the CMS payment methodology described previously, the amount and timing of our CMS monthly premium payments per member may change materially, either favorably or unfavorably. In addition, the possibility exists that CMS may reduce revenues in the future for plans whose risk scores have increased significantly greater than the general Medicare average increase in risk scores. If our risk scores increase significantly greater than the general Medicare average increase, and CMS introduces this approach, it could adversely affect our results of operations.
We rely on the accuracy of information provided by CMS regarding the eligibility of an individual to participate in our Medicare Advantage and Medicare Part D plans, and any inaccuracies in those lists could cause CMS to recoup premium payments from us with respect to members who turn out not to be ours, or could cause us to pay benefits in respect of members who turn out not to be ours, which could reduce our revenue and profitability.
Premium payments that we receive from CMS are based upon eligibility lists produced by Federal and local governments. From time to time, CMS requires us to reimburse it for premiums that we received from CMS based on eligibility and dual-eligibility lists that CMS later discovers contained individuals who were not in fact residing in our service areas or eligible for any government-sponsored program or were eligible for a different premium category or a different program. We may have already provided services to these individuals and reimbursement of amounts paid on behalf of services provided to them may be unrecoverable. In addition to recoupment of premiums previously paid, we also face the risk that CMS could fail to pay us for members for whom we are entitled to payment. Our profitability would be reduced as a result of this failure to receive payment from CMS if we had made related payments to providers and were unable to recoup these payments from them.
If we are unable to develop and maintain satisfactory relationships with the providers of care to our members, our profitability could be adversely affected and we may be precluded from operating in some markets.
We contract with physicians, hospitals and other providers to deliver health care to our members. Our Medicare Advantage products encourage or require our customers to use these contracted providers. In some circumstances, these providers may share medical cost risk with us or have financial incentives to deliver quality medical services in a cost-effective manner. Our operations and profitability are significantly dependent upon our ability to enter into appropriate cost-effective contracts with hospitals, physicians and other healthcare providers that have convenient locations for our members in our geographic markets.
In the long term, our ability to contract successfully with a sufficiently large number of providers in a particular geographic market will affect the relative attractiveness of our Medicare Advantage and managed care products in that market. Any difficulty in contracting with providers in a market could preclude us from renewing or from entering our Medicare contracts in that market. We will be required to establish acceptable provider networks prior to entering new markets. We may be unable to maintain our relationships with our network providers or enter into agreements with providers in new markets on a timely basis or under favorable terms. In any particular market, providers could refuse to contract with us, demand to contract with us, demand higher payments, or take other actions that could result in higher health care costs for us, less desirable products for members, disruption of benefits to our members, or difficulty meeting regulatory or accreditation requirements. In some markets, some providers, particularly hospitals, physician specialty groups, physician/hospital organizations or multi-
48
specialty physician groups, may have significant market positions and negotiating power. In addition, physician or practice management companies, which aggregate physician practices for administrative efficiency and marketing leverage, may compete directly with us. In our southeastern Texas HMO market, one of our significant provider groups has formed a health plan. If, at some point, this provider group refuses to contract with us, uses its market position to negotiate favorable contracts or otherwise places us at a competitive disadvantage, our ability to market products or to be profitable in that market could be adversely affected.
In some situations, we have contracts with individual or groups of primary care physicians for a fixed, per-member-per-month fee under which physicians are paid an amount to provide all required medical services to our members. This type of contract is referred to as a "capitation" contract. The inability of providers to properly manage costs under these capitation arrangements can result in the financial instability of these providers and the termination of their relationship with us. In addition, payment or other disputes between a primary care provider and specialists with whom the primary care provider contracts can result in a disruption in the provision of services to our members or a reduction in the services available to our members. The financial instability or failure of a primary care provider to pay other providers for services rendered could lead those other providers to demand payment from us even though we have made our regular fixed payments to the primary provider. There can be no assurance that providers with whom we contract will properly manage the costs of services, maintain financial solvency or avoid disputes with other providers. Any of these events could have an adverse effect on the provision of services to our members and our operations, resulting in loss of membership or higher healthcare costs or other adverse effects.
Substantially all our revenues are tied to our Medicare businesses and regulated by CMS and if our government contracts are not renewed or are terminated, our business could be substantially impaired.
We earn substantially all of our revenue from our Medicare businesses in which CMS is not only our largest customer but also our regulator. If we are unable to maintain a constructive relationship with CMS, our business could suffer materially. As a government contractor, we provide our Medicare benefits and other services through a limited number of contracts with Federal government agencies. These contracts generally have terms of one or two years and are subject to non-renewal by the applicable agency. All of our government contracts are terminable for cause if we breach a material provision of the contract or violate relevant laws or regulations. In addition, a government agency may suspend our right to add new members if it finds deficiencies in our provider network or operations, as was the case for a significant portion of the 2011 selling season as a result of CMS sanctions. If we are unable to renew, or to successfully re-bid or compete for any of our government contracts, or if any of our contracts are terminated, our business could be substantially impaired. If any of those circumstances were to occur, we would likely pursue one or more alternatives, such as
- •
- seeking to enter into contracts in other geographic markets,
- •
- seeking to enter into contracts for other services in our existing markets, or
- •
- seeking to acquire other businesses with existing government contracts.
If we were unable to do so, we could be forced to cease conducting business. In this event, our revenues and profits would decrease materially.
A reduction in the number of members in our health plans could adversely affect our results of operations.
A reduction in the number of members in our health plans could adversely affect our results of operations. The principal factors that could contribute to the loss of membership are:
- •
- regulatory changes such as MIPPA which resulted in the loss of approximately 60,000 members.
49
- •
- regulatory actions, such as the CMS sanctions imposed in November 2010, which prevented us from marketing and enrolling
new Medicare Advantage members for a significant portion of the 2011 selling season.
- •
- competition in premium or plan benefits from other health care benefit companies;
- •
- competition from physicians or other provider groups who may elect to form their own health plans;
- •
- inability to develop and maintain satisfactory relationships with the providers of care to our members;
- •
- our increases in premiums or benefit changes;
- •
- our exit from a market or the termination of a health plan;
- •
- negative publicity and news coverage relating to our company or the managed health care industry generally;
- •
- general economic conditions that induce beneficiaries to cancel their coverage; and
- •
- catastrophic events, such as epidemics, natural disasters and man-made catastrophes, and other unforeseen occurrences.
The design and regulations surrounding the Medicare Part D and Medicare Advantage programs could lead to variability of our results.
The design and regulatory guidance regarding the Medicare Part D and Medicare Advantage business and the proper method of accounting and reporting of their results is complex and is subject to the recognition of retroactive activity. The timing of our recognition of revenue and expense, particularly with respect to the calculation of the risk corridor for Part D, as a result of the design of the Medicare Part D and Medicare Advantage products and challenges in reconciling CMS Medicare Part D and Medicare Advantage membership data with our records, may lead to variability in our reporting of quarter-to-quarter and year-to-year earnings. In addition, our results for our Medicare Part D segment are subject to anticipated seasonality during a given calendar year due to the nature of the standard benefit design. This variability could result in uncertainty among investors and research analysts following us as to the impacts of our Medicare PDPs on our full year results.
We derive a substantial portion of our Medicare Advantage HMO revenues and profits from Medicare Advantage HMO operations in Texas, and legislative actions, economic conditions or other factors that adversely affect those operations could materially reduce our revenues and profits.
We derive a substantial portion of our Medicare Advantage HMO revenues and profits from Medicare Advantage HMO operations in Texas. If we are unable to continue to operate in Texas, or if we must significantly curtail our current operations in any portion of Texas, our revenues will decrease materially. Our reliance on our operations in Texas could cause our revenues and profitability to change suddenly and unexpectedly, depending on legislative actions, economic conditions and similar factors.
If the PBM and service providers that support our business do not continue to earn and retain purchase discounts and rebates from manufacturers at current levels, our gross margins may decline.
We have direct contractual relationships with pharmaceutical manufacturers that provide us with purchase discounts on drugs dispensed to our members. Manufacturer rebates often depend on our ability to meet contractual market share or other requirements. Pharmaceutical manufacturers have
50
also increasingly made rebate payments dependent upon our agreement to include a broad array of their products in our formularies.
Changes in existing Federal or state laws or regulations or in their interpretation by courts and agencies or the adoption of new laws or regulations relating to patent term extensions, purchase discount, administrative fee and rebate arrangements with pharmaceutical manufacturers could also reduce the discounts or rebates we receive and adversely impact our business, financial condition, liquidity and operating results.
Changes in industry pricing benchmarks could adversely affect our financial performance.
Contracts in the prescription drug industry generally use published benchmarks to establish pricing for prescription drugs. The principal benchmarks are average wholesale price, known as AWP, average selling price, known as ASP, wholesale acquisition cost, known as WAC, and average manufacturer price, known as AMP.
Recent events have raised uncertainties as to whether payors, pharmacy providers, PBMs and others in the prescription drug industry will continue to utilize AWP as it has previously been calculated, or whether they will adopt other pricing benchmarks for establishing prices within the industry. We cannot predict what changes, if any, will be made to these benchmarks but any changes could adversely affect our financial performance.
Our relationship with NCPA is important and the loss of such relationship could have an adverse effect on our Part D business and results of operations.
Our strategic alliance with the National Community Pharmacists Association, known as the NCPA, provides outreach and communications for our CCRx Part D plans to NCPA's independent pharmacy membership. NCPA member pharmacies make up over one-third of MemberHealth's pharmacy network and, in 2010, accounted for a significant percentage of the prescriptions filled under our CCRx Part D plans. The loss of our NCPA relationship could have an adverse effect on our Part D business and results of operations. Further, to the extent that CMS or other regulatory authorities determine that any provisions of our agreements with NCPA conflicts with any applicable law, regulation or policy, we may not be able to realize fully the benefits we anticipate from the arrangement with NCPA, and we could potentially incur regulatory liability.
There are significant risks associated with our participation in the Medicare Part D program, the occurrence of which could have a material adverse effect on our results of operations.
Our actual results may differ from our assumptions regarding the Medicare Part D program. Our participation in the Medicare Part D program involves the following risks, the occurrence of any or all of which could have a material adverse effect on our financial condition, results of operations and cash flows:
- •
- CMS continues to release regulations on Medicare Part D, including important requirements related to the
implementation and marketing of the Medicare Part D prescription drug benefit plan. This may create challenges for planning, implementing and operating the Medicare Part D program, and
we can provide no assurance that Congress or CMS will not alter the program in a manner that will be detrimental to us.
- •
- CMS has in the past released, and could in the future release, call letters on Medicare Part D that impact the
revenue that can be earned by our Part D.
- •
- We cannot be certain that other regulatory changes, such as a restructuring of the Medicare Part D program, will not affect our ability to operate under the Part D program or increase our costs or reduce our reimbursements.
51
- •
- We cannot be certain that our products will be competitive with the products offered by other PDPs. We cannot be certain
that our future bids will be competitive with the bids submitted by other PDPs. We cannot be certain that our future bids will be under the benchmark bids calculated by CMS.
- •
- We may experience higher benefit expenses as a result of an increase in the cost of pharmaceuticals, possible changes in
our pharmacy rebate program with drug manufacturers, higher than expected utilization and new mandated benefits or other regulatory changes that increase our costs.
- •
- CMS automatically assigns members who are eligible for both Medicare and Medicaid, known as "dual eligibles," to our PDPs
in regions where our premiums for our standard plans were under the CMS established regional benchmarks. We cannot guarantee that all of these dual eligibles assigned to us will continue to
participate in our PDPs in the future because dual eligible beneficiaries can change their PDP each month. Moreover, we also cannot guarantee whether dual eligibles will be auto-assigned
to us in the future for a region since we are required to bid anew each year and there exists the possibility that our bid for the region could be above the applicable benchmark; if our bid is below
the benchmark, we cannot predict the number of dual eligibles that will be assigned to us.
- •
- If our current pharmacies and other providers terminate their contracts, we will have to contract with other providers to
take their place.
- •
- CMS and other service providers may not be able to deliver or process information completely, timely and accurately
relating to our PDPs, which could negatively impact our operations.
- •
- There is uncertainty as to whether marketing practices will be restricted, which could negatively impact our ability to
market and sell our product.
- •
- There may be other unforeseen occurrences that could negatively impact our PDP operations.
The pharmacy benefit management component of our business is subject to significant additional regulation.
Our PBM operations are subject to a variety of Federal and state laws. Medicare Part D regulations, such as anti-kickback rules and compliance requirements under Federal employee benefits laws, also govern the treatment of related entities. CMS has indicated that it will apply greater scrutiny to arrangements between PDPs and related parties, especially to rebate retention arrangements. Federal and state legislative proposals regarding PBMs are frequently introduced, and these proposals, if adopted, could affect a variety of industry practices, such as the receipt of rebates and administrative fees from pharmaceutical manufacturers.
In addition, changes in existing Federal or state laws or regulations or in their interpretation by courts and agencies, or the adoption of new laws or regulations relating to patent term extensions, purchase discount, administrative fee and rebate arrangements with pharmaceutical manufacturers, as well as proposed legislation requiring direct rebate negotiation and contracting between CMS and pharmaceutical manufacturers, could reduce the discounts, rebates or other fees received by PBMs and could adversely impact our business, financial condition, liquidity and operating results.
Corporate practice of medicine and fee-splitting laws may govern our business operations, and violation of these laws could result in penalties and adversely affect our arrangements with contractors and our profitability.
We are not licensed to practice medicine. Several states have laws commonly known as "corporate practice of medicine" laws that prohibit a business corporation from practicing medicine, employing physicians to practice medicine, or exercising control over medical treatment decisions by physicians. In
52
these states, typically only medical professionals or a professional corporation in which the shares are held by licensed physicians or other medical professionals may provide medical care to patients. Many states also have some form of fee-splitting law prohibiting business arrangements that involve the splitting or sharing of medical professional fees earned by a physician or another medical professional for the delivery of healthcare services.
We perform only non-medical administrative and business services for physicians and physician groups. We do not represent that we offer medical services, and we do not exercise control over the practice of medical care by providers with whom we contract. We do, however, monitor medical services to ensure they are provided and reimbursed within the appropriate scope of licensure. In addition, we have developed close relationships with our network providers under which we review and monitor the coding of medical services provided by those providers, among other services we provide.
Regulatory authorities may assert that we are engaged in the corporate practice of medicine or that our contractual arrangements with providers constitute unlawful fee-splitting. Moreover, we cannot predict whether changes will be made to existing laws or if new ones will be enacted, which could cause us to be out of compliance with these requirements. If our arrangements are found to violate corporate practice of medicine or fee-splitting laws, our provider or independent physician association management contracts could be found to be legally invalid and unenforceable, which could adversely affect our operations and profitability, and we could be subject to civil or, in some cases, criminal, penalties.
We may experience future lapsation in our Medicare supplement business, requiring faster amortization of the deferred acquisition costs.
We have in the past experienced higher than expected lapsation in our Medicare supplement business. We believe competitive pressure from other Medicare supplement companies and Medicare Advantage products, as well as the departure of some of our sales managers, and other factors, contributed to the level of lapsation. This excess lapsation required us to accelerate the amortization of the deferred acquisition cost and present value of future profits assets associated with the business that lapsed. We cannot give assurances that lapsation of our Medicare supplement business will not again increase, requiring faster amortization of the deferred costs.
We no longer sell long-term care insurance and the premiums that we charge for the long-term care policies that remain in force may not be adequate to cover the claims expenses that we incur.
We stopped selling new long-term care business at the end of 2004. As of December 31, 2010, approximately, $27 million of annualized premium remains in force, of which we retain approximately $19 million.
We estimate costs associated with long-duration insurance policies, such as long-term care policies sold to individuals, for which some of the premium received in the earlier years is intended to pay anticipated benefits to be incurred in future years. These future policy benefit reserves are recognized on a net level premium method based on interest rates, mortality, morbidity, withdrawal and maintenance expense assumptions from published actuarial tables, as modified based upon actual experience.
The assumptions used to determine the liability for future policy benefits are established and locked in at the time each contract is acquired and would only change if our expected future experience deteriorated to the point that the level of the liability, together with the present value of future gross premiums, are not adequate to provide for future expected policy benefits. Long-term care policies provide for long-duration coverage and, therefore, our actual claims experience will emerge many years after assumptions have been established. The risk of a deviation of the actual morbidity and mortality rates from those assumed in our reserves are particularly significant to our closed block of
53
long-term care policies. We monitor the loss experience of these long-term care policies, and, when necessary, apply for premium rate increases through a regulatory filing and approval process in the jurisdictions in which such products were sold. However, to the extent actual premium rate increases or loss experience vary from our acquisition date assumptions, adjustments to increase reserves could be required.
Our block of long-term care business continues to generate losses; a portion of the losses we have incurred relates to a specific block of Florida home health care business that we stopped selling in 1999.
There can be no assurance that our expected future premiums will be adequate to cover future claims expense. Additionally there can be no assurance that rate increases we may seek will be approved by the applicable state regulators or, if approved, will be adequate to fully mitigate adverse loss experience. We may be required to post additional reserves to cover premium deficiencies that may develop in the future, which could be material.
Our business and its growth are subject to risks related to difficulties in the financial markets and general economic conditions.
Over the past several years, financial markets around the world experienced extreme disruption, including, among other things, extreme volatility in security prices, severely diminished liquidity and credit availability, rating downgrades and declining or indeterminate valuations of many investments and declines in real estate values. Governments took unprecedented actions intended to address these market conditions. While currently these conditions have not impaired our ability to access credit markets and finance our operations, largely because our financing has generally come from internal cash generation since September 2007, there can be no assurance that there will not be a further deterioration in financial markets and confidence in major economies or that any deterioration in markets or confidence will not impair our ability to access credit markets and finance our operations.
These economic developments affect businesses such as ours in a number of ways, many of which we cannot predict. Among the potential effects could be further writedowns in the value of investments we hold, an inability or refusal by lenders under our credit agreement to fund a draw by us, and an inability to access credit markets should we require external financing in excess of or in addition to the current revolving commitment under our credit agreement. In addition, it is possible that economic conditions, and resulting budgetary concerns, could prompt the federal government to make changes in the Medicare program, which could adversely affect our results of operations. We are unable to predict the likely duration and severity of the current disruptions in financial markets and adverse economic conditions, or the effects these disruptions and conditions could have on us.
We may suffer losses due to fraudulent activity, which could adversely affect our financial condition and results of operation.
Traditional Medicare and the newer Medicare Advantage and Medicare Part D plans have in the past been subject to fraudulent activity perpetrated by actual and purported beneficiaries and providers, as well as others. In 2009 we incurred losses as a result of a fraudulent scheme or a group of similar fraudulent schemes. While we have undertaken efforts to prevent these schemes, there can be no assurance that we will not again become the target of fraud, or that we will detect fraud prior to incurring losses. The need to expend effort and construct infrastructure to combat fraud requires significant expenditures. These expenditures, and losses arising from any fraud that we suffer, could have a material adverse effect on our financial condition and results of operations.
54
The occurrence of natural or man-made disasters could adversely affect our financial condition and results of operation.
We are exposed to various risks arising out of natural disasters, such as
- •
- earthquakes;
- •
- hurricanes;
- •
- floods, tornadoes;
- •
- pandemic health events such as avian influenza; and
- •
- man-made disasters, such as acts of terrorism, political instability and military actions.
For example, a natural or man-made disaster could lead to unexpected changes in persistency rates as policyholders and members who are affected by the disaster may be unable to meet their contractual obligations, such as payment of premiums on our insurance policies. The continued threat of terrorism and ongoing military actions may cause significant volatility in global financial markets, and a natural or man-made disaster could trigger an economic downturn in the areas directly or indirectly affected by the disaster. These consequences could, among other things, result in a decline in business and increased claims from those areas. Disasters also could disrupt communications and financial services and other aspects of public and private infrastructure, which could disrupt our normal business operations.
A natural or man-made disaster also could disrupt the operations of our counterparties or result in increased prices for the products and services they provide to us. In addition, a disaster could adversely affect the value of the assets in our investment portfolio if it affects companies' ability to pay principal or interest on their securities.
If we are unsuccessful in our acquisitions it may have an adverse effect on our business, growth plans, financial condition and results of operations
The rapid growth in the size and complexity of our operations has placed, and will continue to place, significant demands on our management, operations systems, accounting systems, internal control systems and financial resources. As part of our strategy, we have experienced, and may continue to experience, growth through acquisitions, including following the consummation of the Part D Sale Transaction.
Acquisitions involve numerous risks, some of which we have experienced in the past, such as:
- •
- difficulties in the integration of operations, technologies, products, systems and personnel of the acquired company;
- •
- diversion of financial and management resources from existing operations;
- •
- potential increases in policy lapses;
- •
- potential losses from unanticipated litigation, undiscovered or undisclosed liabilities or unanticipated levels of claims;
- •
- inability to generate sufficient revenue to offset acquisition costs;
- •
- loss of key customer accounts;
- •
- loss of key provider contracts or renegotiation of existing contracts on less favorable terms; and
- •
- other systems and operational integration risks.
55
In addition, we generally are required to obtain regulatory approval from one or more governmental agencies when making acquisitions, which may require a public hearing, regardless of whether we already operate a plan in the state in which the business to be acquired is located. We may be unable to comply with these regulatory requirements for an acquisition in a timely manner, or at all. Moreover, some sellers may insist on selling assets that we may not want, such as commercial lines of business, or transferring their liabilities to us as part of the sale of their companies or assets. Even if we identify suitable acquisition targets, we may be unable to complete acquisitions or obtain the necessary financing for acquisitions on terms favorable to us, or at all.
To the extent we complete an acquisition, we may be unable to realize the anticipated benefits from it because of operational factors or difficulties in integrating the following or other aspects of acquisitions with our existing businesses:
- •
- additional employees who are not familiar with our operations;
- •
- new provider networks, which may operate on terms different from our existing networks;
- •
- additional members, who may decide to transfer to other healthcare providers or health plans;
- •
- disparate information technology, claims processing and record keeping systems; and
- •
- accounting policies, some of which require a high degree of judgment or complex estimation processes, such as estimates of reserves, IBNR claims, valuation and accounting for goodwill and intangible assets, stock-based compensation and income tax matters.
For all of the above reasons, we may not be able to implement our acquisition strategy successfully, which could materially adversely affect our growth plans and on our business, financial condition and results of operations.
Furthermore, in the event of an acquisition or investment, you should be aware that we may issue stock that would dilute stock ownership, incur debt that would restrict our cash flow, assume liabilities, incur large and immediate write-offs, incur unanticipated costs, divert management's attention from our existing business, experience risks associated with entering markets in which we have no or limited prior experience, or lose key employees from the acquired entities or our historical business.
Any failure by us to manage our growing operations or to successfully complete or integrate acquisitions, dispositions and other significant transactions could harm our financial results, business and prospects.
As part of our business strategy, we frequently engage in discussions with third parties regarding possible investments, acquisitions, dispositions, strategic alliances, joint ventures and outsourcing transactions and often enter into agreements relating to these transactions that are designed to enhance our business objectives. In order to pursue this strategy successfully, we must identify suitable candidates for, and successfully complete, transactions as well as effectively integrate any acquired companies into our operations and efficiently separate any businesses we sell, such as the Part D Sale Transaction. If we fail to identify and successfully complete transactions that further our strategic objectives, we may be required to expend resources to develop products and technology internally, we may be unable to sustain our historical growth rates, we may be put at a competitive disadvantage or we may be adversely affected by negative market perceptions, any of which may have a material adverse effect on our results of operations, financial position or cash flows.
Failure to manage our internal growth and expansion could have a material adverse effect on our business, financial condition and results of operations
Additionally, we are likely to incur additional costs if we develop new product offerings or enter new service areas or states where we do not currently operate, which may limit our ability to expand to,
56
or further expand in, those areas. Our rate of expansion into new geographic areas may also be limited by:
- •
- our inability to raise sufficient capital;
- •
- the time and costs associated with designing and filing new product forms and recruiting related sales forces to offer
products in the new area;
- •
- the time and costs associated with obtaining regulatory approval to operate in the new area or expanding our licensed
service area, as the case may be;
- •
- our inability to develop a network of physicians, hospitals, and other healthcare providers that meets our requirements
and those of the applicable regulators;
- •
- competition, which could increase the costs of recruiting members, reduce the pool of available members, or increase the
cost of attracting and maintaining our providers;
- •
- the cost of providing healthcare services in those areas;
- •
- the cost of implementation and on-going administration of newly developed programs and services;
- •
- our inability to achieve sufficient scale of operations to cover the administration and marketing costs associated with
entering new markets; and
- •
- demographics and population density.
Our ability to manage our growth and compete effectively will depend, in part, on our success in addressing these demands and risks. Any failure by us to effectively manage our growth could have a material adverse effect on our business, financial condition or results of operations.
We have incurred and may in the future incur significant expenses in connection with the implementation and expansion of our new Medicare Advantage plans, which could adversely affect our operating results.
Over the years, we have significantly expanded our Medicare Advantage operations. As a result of the passage of MIPPA, as of January 1, 2011, we will continue to offer PFFS products only in areas that have either met approved CMS network access requirements or are in certain designated rural areas. We developed network-based products in selected core markets to enable the migration of our PFFS membership to these products. We expect to continue to expand our network and product offerings.
In connection with this expansion, we have incurred expenses to upgrade and improve our infrastructure, technology, and systems to manage these products, and will in the future incur additional expenses. In particular, we incurred the following expenses in connection with the implementation and expansion of our Medicare Advantage program:
- •
- hiring and training of personnel to establish and manage systems, operations, regulatory relationships, and materials;
- •
- systems development and upgrade costs, such as hardware, software and development resources;
- •
- marketing and sales;
- •
- enrolling new members;
- •
- developing and distributing member materials such as ID cards and member handbooks; and
- •
- handling sales inquiry and customer service calls.
57
There can be no assurance that we will recoup these expenditures or that they will result in profitable operations, currently, or in the future.
Our business may be materially adversely impacted by CMS's adoption of the new coding set for diagnoses.
CMS has adopted a new coding set for diagnoses, commonly known as ICD-10, which significantly expands the number of codes utilized. The new coding set is currently required to be implemented by October 1, 2013. We may be required to incur significant expenses in implementing the new coding set. If we do not adequately implement the new coding set, our business, and results of operations may be materially adversely affected.
If we fail to properly maintain the integrity of our data and information systems, our business could be materially adversely affected.
Our business depends significantly on efficient, effective and secure information systems and the integrity and timeliness of the data we use to run our business. We have various information systems which support our operating segments. The information gathered and processed by our management information systems assists us in, among other things, marketing and sales tracking, underwriting, billing, claims processing, medical management, medical care cost and utilization trending, financial and management accounting, reporting, planning and analysis and e-commerce. These systems also support on-line customer service functions, provider and member administrative functions and support tracking and extensive analyses of medical expenses and outcome data.
Our information systems and applications require an ongoing commitment of significant resources to maintain, protect and enhance existing systems and develop new systems to keep pace with continuing changes in information processing technology, evolving industry and regulatory standards and changing customer preferences. If the information we rely upon to run our businesses were to be found to be inaccurate or unreliable, if we fail to properly maintain our information systems and data integrity, or if we fail to successfully update or expand processing capability or develop new capabilities to meet our business needs in a timely manner, we could have operational disruptions, have problems in determining medical cost estimates and establishing appropriate pricing, have customer and physician and other health care provider disputes, lose our ability to produce timely and accurate reports, have regulatory or other legal problems, have increases in operating and administrative expenses, lose existing customers, have difficulty in attracting new customers or in implementing our growth strategies, sustain losses due to fraud or suffer other adverse consequences.
To the extent we fail to maintain effective information systems, we may need to contract for these services with third-party management companies, which may be on less favorable terms to us and significantly disrupt our operations and information flow. In addition, we have outsourced the operation of our data centers to independent third parties and may from time to time obtain additional services or facilities from other independent third parties. Dependence on third parties for these services and facilities may make our operations vulnerable to their failure to perform as agreed.
Furthermore, our business requires the secure transmission of confidential information over public networks. Because of the confidential health information we store and transmit, security breaches could expose us to a risk of regulatory action, litigation, possible liability and loss. Our security measures may be inadequate to prevent security breaches, and our business operations and profitability would be adversely affected by cancellation of contracts, loss of members and potential criminal and civil sanctions if they are not prevented.
58
There can be no assurance that our process of improving existing systems, developing new systems to support our expanding operations, integrating new systems, protecting our proprietary information, and improving service levels will not be delayed or that additional systems issues will not arise in the future. Failure to adequately protect and maintain the integrity of our information systems and data may result in a material adverse effect on our financial positions, results of operations and cash flows.
If our reinsurers fail to meet their financial obligations, it could require us to fund significant liabilities.
Like many insurance companies, we transfer exposure to certain risks to others through reinsurance arrangements. Under these arrangements, the reinsurers assume a portion of the premium on the reinsured business and are responsible for a portion of the losses and expenses on that business. At December 31, 2010, we had $718 million recoverable from reinsurers, including $706 million recoverable on future policy benefits and unpaid claims, $4 million in funds held and $8 million for amounts due on paid claims and commissions and expense allowances, net of premiums reinsured. When we obtain reinsurance, we are still liable for those transferred risks if the reinsurer cannot meet its obligations. Therefore, the inability of our reinsurers to meet their financial obligations may require us to increase liabilities, thereby reducing our net income and overall profitability.
Our reliance upon third party administrators and other outsourcing arrangements may disrupt or adversely affect our operations.
We depend, and may in the future increase our dependence, on independent third parties for significant portions of our data center operations, data network, voice communication services and pharmacy data processing and payment and other systems-related support, equipment, facilities and data. This dependence makes our operations vulnerable to the third parties' failure to perform adequately under the contract, due to internal or external factors. In the future, this dependence may increase as we may outsource additional areas of our business operations to additional vendors. If our relationships with our outsourcing partners are significantly disrupted for any reason, we may not be able to find an alternative partner in a timely manner or on acceptable financial terms. As a result, we may not be able to meet the demands of our customers and, in turn, our business, cash flows, financial condition and results of operations may be harmed.
We have outsourced portions of the operation of our data center, call centers and new business processing services to independent third parties and may from time to time obtain additional services or facilities from other independent third parties. Dependence on third parties for these services and facilities may make our operations vulnerable to their failure to perform as agreed. We also rely upon third parties for information relating to Medicare Part D membership and claims administration. Incorrect information from these entities could generate inaccurate or incomplete membership and payment reports concerning our Medicare eligibility and enrollment, and claims information used by CMS to determine plan benefit subsidies and risk corridor payments. This could cause us to incur additional expense to utilize additional resources to validate, reconcile and correct the information. We have not been able to independently test and verify some of these third party systems and data. There can be no assurance that future third party data will not disrupt or adversely affect our plans' relationships with our members or our results of operations. A change in service providers or a move of services from a third party to internal operations could result in a decline in service quality and effectiveness, increased cost or less favorable contract terms which could adversely affect our operating results. Some of our outsourced services are being performed offshore. CMS requires attestations from plans that utilize the services of offshore vendors as to the vendors' ability to perform delegated functions. Prevailing economic conditions and other circumstances could prevent our offshore vendors' ability to adequately perform as agreed, which would impair our ability to provide the requisite attestations to CMS and could have a material adverse effect on our results of operations and financial condition.
59
Our business may suffer if we are not able to hire and retain sufficient qualified personnel or if we lose our key personnel.
Our future success depends partly on the continued contribution of our senior management and other key employees. While we currently have employment agreements with key executives, these do not guarantee that the services of these executives will continue to be available to us. The loss of the services of any of our senior management, or other key employees, including as a result of the part D Sale Transaction, could harm our business. In addition, recruiting and retaining the personnel we require to effectively compete in our markets may be difficult. If we fail to hire and retain qualified employees, we may not be able to maintain and expand our business.
The limited annual enrollment period may make it difficult to retain an adequate sales force.
As a result of the limited annual enrollment period and the subsequent "lock-in" provisions of the MMA, our internal and external sales force may be limited in its ability to market some of our products year-round. Our agents rely substantially on sales commissions for their income. Given the limited annual sales window, it may become more difficult to find agents to market and promote our products.
We may be responsible for the actions of our independent and career agents, and restrictions on our ability to market would adversely affect our revenue.
In regulatory proceedings and reviews and other litigation regulators and our members sometimes claim that agents failed to comply with applicable laws, regulations and rules, or acted improperly in other ways, and that we are responsible for the alleged failure. We could be liable for contractual and extra-contractual damages on these claims and other penalties, such as a suspension from marketing and enrolling new members. We cannot assure you that any future claim will not result in material liability in the future. Federal and state regulators increasingly scrutinize the marketing practices of insurers, such as Medicare Advantage and private fee-for-service plans, MA-PDs and PDPs and their marketing agents, and there is no guarantee that regulators will not continue to scrutinize the practices of our Medicare Advantage plans, PDPs and our marketing agents, and that such practices will not expose us to liability.
We rely on our marketing and sales efforts for a significant portion of our premium revenue growth. The Federal government and state governments in the states in which we currently operate permit marketing but impose strict requirements and limitations as to the types of marketing activities that we may conduct. If our marketing efforts were to be prohibited or curtailed, our ability to increase or sustain membership would be significantly harmed, which would adversely affect our revenue and results of operations.
Similarly, Federal and state governments and regulatory agencies have recently placed an increased focus on the sales and marketing of private fee-for-service plans. Concerns over the growing number of market conduct complaints regarding improprieties in agents' sales activities of private fee-for-service plans have spawned stricter marketing standards by CMS relating to these plans and their agents. This heightened focus on market conduct and stricter standards in the marketing and sales of private fee-for-service plans has required us to modify our systems, increase our costs and change our agent training requirements, which could result in a material adverse effect on our results of operations and financial condition.
We may not be able to compete successfully if we cannot recruit and retain insurance agents, which could materially adversely affect our business and ability to compete.
We distribute our products principally through career agents and independent agents who we recruit and train to market and sell our products. We also engage managing general agents from time
60
to time to recruit agents and develop networks of agents in various states. Strong competition exists for sales agents. We compete with other insurance companies for productive agents, primarily on the basis of our financial position, support services, compensation and product features. It can be difficult to successfully compete for productive agents with larger insurance companies that have higher financial strength ratings than we do. In addition, our ability to attract, motivate and retain agents may be negatively impacted by the CMS sanction which prevented our agents from marketing to and enrolling new Medicare Advantage members during a significant portion of the 2011 selling season. Our business and ability to compete will suffer if we are unable to recruit and retain insurance agents or if we lose the services provided by our managing general agents.
We make cash advances to our agents to assist in the development of agency offices and recruitment of agents.
We historically invested in our career distribution agencies to provide monetary assistance in the development of offices and recruitment of agents to build a controlled distribution force for our various products. In late 2006, we began recruiting career managers to develop offices for distribution of our products. We have opened a significant number of new "expansion" offices since then. The Company has advanced much of the cost of the development of these new offices; however, these costs are the responsibility of the manager of the individual office, to be repaid from future profits of the office. Collectability of these advances generally comes from the commissions earned from the production of these offices or personal guarantees of the office managers. We incurred charges of $13.6 million and $15.0 million with respect to these matters during 2009 and 2010, respectively and there can be no assurance that production levels or personal assets of the managers will be sufficient to repay the obligation and that we will not be required to incur additional charges.
A significant portion of our assets are invested in fixed income securities and other securities that are subject to market fluctuations, which have recently been intensified by general economic conditions.
A significant portion of our investment portfolio consists of fixed income securities and other investment securities. Our portfolio can be viewed on our web site, www.universalamerican.com, in the "Investors" section. Our reference to the web site in this annual report on Form 10-K is not intended to, and does not, incorporate the information contained in the web site into this report.
The fair value of these assets and the investment income from these assets generally fluctuate depending on general economic and market conditions, and these variations have been exacerbated by the ongoing adverse economic conditions. The fair value of our investments in fixed income securities generally increases or decreases in an inverse relationship with fluctuations in interest rates, while net investment income realized by us from future investments in fixed income securities will generally increase or decrease in a direct relationship with fluctuations in interest rates; in addition, these values and prospective income have been adversely affected by general economic conditions. Moreover, actual net investment income or cash flows from investments that carry prepayment risk, such as mortgage-backed and other asset- backed securities, may differ from those anticipated at the time of investment or at various financial statement dates as a result of interest rate fluctuations, general economic conditions and other factors.
Because our investment securities are classified as available for sale, we reflect changes in the fair value of these securities in our consolidated balance sheets. Therefore, interest rate fluctuations and changes in the values of securities we hold could adversely affect our results of operations and financial condition.
61
Further deterioration in the mortgage-backed securities market or significant deterioration in the mortgage-backed securities we hold could adversely affect our results of operations or financial condition.
We have recognized other-than-temporary impairment in the value of some of our securities with exposure to subprime mortgages, securities issued by financial institutions and some of our other securities. As to the economy in general, as well as the market for mortgage-backed securities with exposure to subprime mortgages and securities issued by financial institutions have deteriorated, these securities have become increasingly illiquid. If the mortgage-backed securities with exposure to subprime mortgages in our portfolio experience significantly greater rates of collateral loan defaults than currently expected, or financial institutions again come under increasing financial stress, we might need to continue to impair the value of our securities, which could adversely affect our results of operations or financial condition.
Additionally, mortgage-backed securities are subject to prepayment risks that vary with interest rates, among other things. During periods of declining interest rates, mortgage-backed securities generally prepay faster as the underlying mortgages are prepaid or refinanced by borrowers in order to take advantage of lower rates. Mortgage-backed securities that have an amortized cost greater than par because we purchased them at a premium may incur a reduction in yield or a loss as a result of these prepayments.
In addition, in connection with the other-than-temporary impairments that we have recognized for financial statement purposes, we believe we have available opportunities to recover the tax assets generated by the other-than-temporary impairments. Circumstances may arise in the future that cause us to re-determine the recoverability of those tax benefits, which could result in the loss of the tax benefits we expect to take.
We may not have adequate intellectual property rights in our brand names for our health plans, and we may be unable to adequately enforce these rights.
Our success depends, in part, upon our ability to market our health plans under the brand names that we own or license. We may not have taken enforcement action to prevent infringement of our marks and may not have secured registrations of the other brand names that we use in our business. Unauthorized parties may attempt to copy or otherwise obtain and use our products or technology. Policing unauthorized use of our intellectual property is difficult, and we cannot be certain that the steps we have taken will prevent misappropriation of our intellectual property rights. Other businesses may have prior rights in our brand names or in similar names, which could cause market confusion or limit or prevent our ability to use these marks or prevent others from using similar marks. If we are unable to prevent others from using our brand names, or if others prohibit us from using them, our revenues could be adversely affected. Even if we are able to protect our intellectual property rights in our brands, we could incur significant costs in doing so.
Our results of operations and stockholders' equity could be materially adversely affected if we have an impairment of our intangible assets.
Due to our past acquisitions, goodwill and other intangible assets represent a significant portion of our total assets. Goodwill and other intangible assets were approximately $670 million, or 18% of our total assets as of December 31, 2010. In accordance with applicable accounting standards, we perform periodic assessments of our goodwill and other intangible assets to determine whether all or a portion of their carrying values may no longer be recoverable, in which case a charge to earnings may be necessary. This impairment testing requires us to make assumptions and judgments regarding the estimated fair value of our reporting units. Fair value is calculated using a blend of a projected income and market value approach. Estimated fair values developed based on our assumptions and judgments might be significantly different if other assumptions and estimates were to be used. Any future
62
evaluations requiring an asset impairment of our goodwill and other intangible assets could materially affect our results of operations and stockholders' equity in the period in which the impairment occurs.
We have debt outstanding that contains restrictive covenants, and we may be unable to access other sources of financing should we require additional external financing or obtain waivers of relevant covenants or, if they arise, defaults under the debt agreements.
We have available $150 million of borrowing capacity under the revolving portion of our credit facility. Our credit agreement significantly restricts our ability to borrow from other sources. Therefore, if we are required to fund the growth of our business, or to fund capital or other requirements at our insurance company and health plan subsidiaries, in excess of the aggregate of our cash, revolver borrowing capacity and other borrowing capacity permitted under the credit facility, we could be restricted in our ability to generate new premium or other revenue, to construct additional health maintenance organizations and preferred provider organizations, or to otherwise fund or expand our business. Moreover, if we determine to enter into a transaction or affect another corporate event that requires a waiver or consent under a debt agreement, or if we experience an event of default under a debt agreement, lenders could refuse to grant a required waiver or consent, could charge a material amount for it or could otherwise demand costly concessions. As a consequence, we could be unable to complete the desired transaction or other corporate event, or the required waiver or consent could cost more than it otherwise would, or we could experience a default under the relevant debt instrument, or our results of operations and financial condition could be adversely affected.
We have debt outstanding that contains restrictive covenants, and we may be unable to service and repay our debt obligations if our subsidiaries cannot pay sufficient dividends or make other cash payments to us.
As of December 31, 2010, we had $233 million of debt outstanding under the term portion of our credit agreement and available borrowing capacity under the revolving portion of our credit facility of $150 million. As of December 31, 2010, we had $110 million of trust preferred securities outstanding. Although all this debt is expected to be repaid and/or assumed by CVS Caremark as part of the Part D Sale Transaction, the credit facility matures in September 2012, and there can be no assurance that we will be able to refinance and/or repay such debt upon maturity if necessary. Our credit agreement provides that upon the occurrence of specified events all of the capital stock of the guarantor subsidiaries under the credit agreement will be pledged to our bank lenders; those events have occurred and we have pledged this stock. Because our principal outstanding indebtedness has been incurred by our parent company, our ability to make interest and principal payments on our outstanding debt is dependent upon the ability of our subsidiaries to pay cash dividends or make other cash payments to our parent company. Our subsidiaries will be able to pay dividends to our parent company only if they earn sufficient profits and, in the case of our insurance company and health plan subsidiaries, they satisfy the requirements of the state insurance laws relating to dividend payments and the maintenance of required surplus.
Our debt service obligations will require us to use a portion of our operating cash flow to pay interest and principal on indebtedness before use for other corporate purposes, such as funding future expansion of our business and ongoing capital expenditures. If our operating cash flow and capital resources are insufficient to service our debt obligations, we may be forced to sell assets, seek additional equity or debt capital or restructure our debt. However, these measures might be unsuccessful or inadequate in permitting us to meet scheduled debt service obligations. We may also incur additional indebtedness in the future. Our indebtedness could have additional adverse consequences, such as:
- •
- increasing our vulnerability to adverse economic, regulatory and industry conditions, and placing us at a disadvantage compared to our competitors that have less leverage;
63
- •
- limiting our ability to compete and our flexibility in planning for, or reacting to, changes in our business and the
industry in which we operate;
- •
- limiting our ability to borrow additional funds for working capital, capital expenditures, acquisitions and general
corporate or other purposes; and
- •
- exposing us to greater interest rate risk since the interest rate on borrowings under our senior credit facilities is variable.
If we are required to maintain higher statutory capital levels for our existing operations or if we are subject to additional capital reserve requirements as we pursue new business opportunities, our ability to obtain funds from our subsidiaries may be restricted and our cash flows and liquidity may be adversely affected.
Because Universal American operates as a holding company, it is dependent upon dividends and administrative expense reimbursements from its subsidiaries to fund its obligations, such as payment of principal and interest on its debt obligations. These subsidiaries generally are regulated by state departments of insurance. Our health plan and insurance company subsidiaries are subject to laws and regulations that limit the amount of dividends and distributions they can pay for purposes other than to pay income taxes related to their earnings. These laws and regulations also limit the amount of management fees our subsidiaries may pay to our management subsidiaries and their other affiliates without prior notification to, or in some cases approval of, state regulators.
We are also required by law to maintain specific prescribed minimum amounts of capital in these subsidiaries. The levels of capitalization required depend primarily upon the volume of premium generated. A significant increase in premium volume will require additional capitalization from our parent company. In most states, we are required to seek prior approval by these state regulatory authorities before we transfer money or pay dividends that exceed specified amounts from these subsidiaries, or, in some states, any amount. The pre-approval and notice requirements vary from state to state, and the discretion of the state regulators, if any, in approving or disapproving a dividend is not always clearly defined. Subsidiaries that declare non-extraordinary dividends must usually provide notice to the regulators in advance of the intended distribution date. If the regulators were to deny or significantly restrict our subsidiaries' requests to pay dividends to us or to pay management and other fees to affiliates, the funds available to us would be limited, which could impair our ability to implement our business and growth strategy and satisfy our debt obligations, or we could be required to incur additional indebtedness to fund these strategies.
In addition, one or more of these states could increase the statutory capital level from time to time. States have also adopted risk-based capital requirements based on guidelines adopted by the National Association of Insurance Commissioners, which tend to be, although are not necessarily, higher than existing statutory capital requirements. Regardless of whether the states in which we operate maintain or adopt risk-based capital requirements, the state departments of insurance can require our subsidiaries to maintain minimum levels of statutory capital in excess of amounts required under the applicable state laws if they determine that maintaining additional statutory capital is in the best interests of our insureds. Any increases in these requirements could materially increase our reserve requirements. In addition, as we continue to expand our plan offerings in new states or pursue new business opportunities, such as our recent offerings of PDPs and expansion of private fee-for-service products and health plans in new markets, we may be required to maintain additional statutory capital reserves. In either case, our available funds could be materially reduced, which could harm our ability to implement our business strategy.
In the event that we are unable to provide sufficient capital to fund the debt obligations of Universal American, our operations or financial position may be adversely affected.
64
Downgrades in our debt ratings or insurance company financial strength ratings, should they occur, may adversely affect our business, financial condition and results of operations.
Increased public and regulatory concerns regarding the financial stability of insurance companies and health plans have resulted in consumers placing greater emphasis upon financial strength ratings. Claims paying ability, financial strength, and debt ratings by recognized rating organizations are increasingly important factors in establishing the competitive position of insurance companies and health plans. Ratings information is broadly disseminated and generally used throughout the industry. Our ability to expand and to attract new business is affected by the financial strength ratings assigned to our subsidiaries by independent industry rating agencies, such as A.M. Best Company, Inc. Some distributors such as financial institutions, unions, associations and affinity groups may not sell our products to these groups unless the rating of our subsidiary writing the business improves to at least an "A-." The lack of higher A.M. Best ratings for our subsidiaries could adversely affect sales of our products.
Our debt ratings affect both the cost and availability of future borrowings. Each of the rating agencies reviews its ratings periodically and there can be no assurance that current ratings will be maintained in the future. Our ratings reflect each rating agency's opinion of our financial strength, operating performance, and ability to meet our debt obligations or obligations to policyholders, but are not evaluations directed toward the protection of investors in our common stock and should not be relied upon as such. There is no assurance that the rating agencies will maintain our current ratings in the future. Any future downgrade in our ratings may cause our policyholders and members to lapse, and may cause some of our agents to sell less of our products or to cease selling our products altogether. A downgrade in our ratings may also limit our access to capital markets, increase the cost of debt, impair our ability to refinance debt and limit our capacity to support growth at our insurance subsidiaries. Increased lapse rates would reduce our premium revenue and net income. Thus, downgrades in our ratings, should they occur, may adversely affect our business, financial condition and results of operations.
State insurance laws and anti-takeover provisions in our organizational documents could make an acquisition of us more difficult and may prevent attempts by our shareholders to replace or remove our current management.
Provisions of state insurance laws, the business corporation law of the State of New York, where we are incorporated, and our certificate of incorporation and bylaws, as well as the percentage of our common stock owned by our management, directors and equity investors may delay or prevent an acquisition of us or a change in our management or similar change in control transaction, such as transactions in which shareholders might otherwise receive a premium for their shares over then current prices or that shareholders may otherwise deem to be in their best interests. In addition, these provisions may frustrate or prevent any attempts by our shareholders to replace or remove our current management by making it more difficult for shareholders to replace members of our board of directors. Because our board of directors is responsible for appointing the members of our management team, these provisions could in turn affect any attempt by our shareholders to replace current members of our management team.
Our stock price and trading volume may be volatile, which could result in a decrease in the price of our common stock.
From time to time, the price and trading volume of our common stock may experience periods of significant volatility. Company-specific issues and developments generally in the health care and insurance industries, the regulatory environment, the capital markets and the general economy may
65
cause this volatility. The principal events and factors that we have identified that may cause our stock price and trading volume to fluctuate are:
- •
- variations in our operating results;
- •
- changes in the market's expectations about our future operating results;
- •
- changes in financial estimates and recommendations by securities analysts concerning our company or the health care or
insurance industries generally;
- •
- operating and stock price performance of other companies that investors may deem comparable;
- •
- news reports relating to trends in our markets;
- •
- changes in the laws and regulations affecting our business;
- •
- acquisitions and financings by us or others in our industry; and
- •
- sales of substantial amounts of our common stock by our directors and executive officers or principal shareholders, or the perception that these sales could occur.
Some of our directors and executive officers may have interests that are different from, or in addition to, the interests of our shareholders generally.
Some of our directors and executive officers may have significant equity ownership in us, employment, indemnification and severance benefit arrangements, potential rights to other benefits on a change in control and rights to ongoing indemnification and insurance that result in their having interests that may differ from the interests of our shareholders generally. The receipt of compensation or other benefits by our directors or executive officers in connection with any acquisition or disposition may make it more difficult to retain their services after the acquisition or disposition, or require the combined company to expend additional sums to continue to retain their services.
If we are unable to maintain effective internal controls over financial reporting, investors could lose confidence in the reliability of our financial statements, which could result in a decrease in the price of our common stock.
Because of our status as a public company, we are required to test our financial, internal, and management control systems to meet obligations imposed by the Sarbanes-Oxley Act of 2002. These control systems relate to our corporate governance, corporate control, internal audit, disclosure controls and procedures, and financial reporting and accounting systems. Our disclosure controls and procedures and our internal control over financial reporting may not prevent or detect all errors and all fraud. A control system, no matter how well designed and operated, can provide only reasonable, not absolute, assurance that the objectives of the control system are met. The design of a control system must reflect the fact that there are resource constraints, and the benefits of controls must be considered relative to their costs. Further, because of the inherent limitations in all control systems, no evaluation of controls can provide absolute assurance that misstatements due to error or fraud will not occur or that all control issues and instances of fraud, if any, within the Company have been detected. Among these inherent limitations are the realities that judgments in decision-making can be faulty and that breakdowns can occur because of simple error or mistake. The individual acts of some persons or the collusion of two or more people can circumvent controls. The design of any system of controls is based in part on assumptions about the likelihood of future events, and there can be no assurance that any design will succeed in achieving its stated goals under all potential future conditions. Projections of any evaluation of controls effectiveness to future periods are subject to risks. Over time, controls may become inadequate because of changes in conditions or deterioration in the degree of compliance with policies or procedures.
66
If we conclude that we do not have effective internal controls over financial reporting or if our independent auditors are unable to conclude that our internal controls over financial reporting are effective, investors could lose confidence in the reliability of our financial statements, which could result in a decrease in the value of our common stock. Our assessment of our internal controls over financial reporting may also uncover material weaknesses, significant deficiencies or other issues with these controls that could also result in adverse investor reaction. These results may also subject us to adverse regulatory consequences.
ITEM 1B—UNRESOLVED STAFF COMMENTS
There are no unresolved comments from the Staff of the Securities and Exchange Commission regarding the registrant's periodic or current reports under the Act.
Our executive offices are located in Rye Brook, New York. Marketing and professional staff for our U.S. insurance subsidiaries occupy space in Rye Brook, New York, Lake Mary, Florida and Solon, Ohio. Our Medicare Advantage operations occupy office space in Houston, Beaumont and Dallas, Texas, as well as Oklahoma City, Oklahoma and Milwaukee, Wisconsin. Our Part D operations occupy space in Solon, Ohio and Pensacola, Florida. We lease over 376,000 square feet of office space. Management considers its office facilities suitable and adequate for the current level of operations. In addition to the above, Pennsylvania Life is the named lessee on over 20 properties occupied by career agents for use as field offices. Rent for these field offices is reimbursed by the agents. Additional information regarding our lease obligations is included in Note 25—Commitments and Contingencies in our consolidated financial statements included in this Annual Report on Form 10-K.
For information relating to litigation affecting us, please see Note 25—Commitments and Contingencies in the Notes to Consolidated Financial Statements of this report, which is incorporated into this Part I—Item 3—Legal Proceedings by reference.
67
ITEM 5—MARKET FOR REGISTRANT'S COMMON EQUITY, RELATED STOCKHOLDER MATTERS AND ISSUER PURCHASES OF EQUITY SECURITIES
Market Information
On December 3, 2007, our common shares began trading on the New York Stock Exchange, or the NYSE, under the ticker symbol "UAM." Prior to December 3, 2007, our common stock traded in the over-the-counter market and was quoted on the NASDAQ Global Select tier of The NASDAQ Stock Market, or the NASDAQ, under the symbol "UHCO". The following table sets forth the high and low closing sales prices for our common stock on the NYSE National Market, as reported by the NYSE for the periods indicated.
| |
Common Stock | |
|||||||||
|---|---|---|---|---|---|---|---|---|---|---|---|
| |
Cash Dividends Declared |
||||||||||
| |
High | Low | |||||||||
2011 |
|||||||||||
First Quarter (through February 24, 2011) |
$ | 20.64 | $ | 19.88 | $ | — | |||||
2010 |
|||||||||||
First Quarter |
$ | 15.99 | $ | 12.00 | $ | — | |||||
Second Quarter |
$ | 16.40 | $ | 13.52 | $ | — | |||||
Third Quarter |
$ | 16.76 | $ | 13.40 | $ | 2.00 | |||||
Fourth Quarter |
$ | 20.45 | $ | 14.61 | $ | — | |||||
2009 |
|||||||||||
First Quarter |
$ | 10.66 | $ | 5.41 | $ | — | |||||
Second Quarter |
$ | 10.62 | $ | 7.98 | $ | — | |||||
Third Quarter |
$ | 10.26 | $ | 7.83 | $ | — | |||||
Fourth Quarter |
$ | 12.00 | $ | 8.69 | $ | — | |||||
The closing sale price of our common stock on February 24, 2011, as reported by NYSE, was $20.46 per share.
Shareholders
As of the close of business on February 24, 2011, there were approximately 960 holders of record of our common stock. There are no outstanding shares of our nonvoting common stock. We estimate that there are approximately 3,200 beneficial owners of our common stock. In addition, there were 2 record and beneficial holders of our Series A preferred stock. Each outstanding share of our preferred stock is convertible, directly or indirectly, into 100 shares of our common stock.
Dividends
On July 28, 2010, the Board of Directors of the Company approved the payment of a special cash dividend of $2.00 per share to each holder of the Company's outstanding common stock and Series A Preferred Stock. This special cash dividend was paid on August 19, 2010 to the shareholders of record as of the close of business on August 5, 2010. On the payment date, as required under the terms of the 2007 Credit Facility, we made an additional principal payment on our term loan equal to 50% of the dividend payment. The cumulative dividend payment was $156.0 million and the principal payment was $78.0 million. In addition, pursuant to the terms of our 1998 Incentive Compensation Plan, we were required to reduce the exercise price on unexercised options by the amount of the dividend, $2.00 per share. We also established a liability for the dividends related to unvested restricted stock and
68
performance shares. These dividends will be paid out as the restricted stock and performance shares vest. This dividend payable liability was $3.3 million at December 31, 2010. As these dividends are paid out, we will also make additional principal payments on our term loan at the rate of 50% of dividends paid.
Issuer Purchases of Equity Securities
We have approved share repurchase plans that have authorized us to repurchase up to $175 million of shares of our common stock. Through December 31, 2009, we had repurchased 13.4 million shares of our common stock for an aggregate amount of $132.7 million, under these programs. There have been no share repurchases since December 31, 2009 under these programs. As of December 31, 2010, we have $42.3 million that remains available to repurchase additional shares under these plans. However, share repurchases are also limited by the remaining available restricted payments under our 2007 Credit Facility, which, giving effect to the July 27, 2010 Amendment, limits share repurchases, dividends and other restricted payments to an aggregate of $300 million (see "Loan Payable" in Note 13 of the Notes to Consolidated Financial Statements). Currently, we have $11.3 million remaining available under this restricted payment limit. We are not obligated to repurchase any specific number of shares under the programs or to make repurchases at any specific time or price.
Stock Performance Graph
The following graph compares the cumulative total shareholder return on our common stock for the five years ending December 31, 2010 with the cumulative total return of the New York Stock Exchange Composite Index and the Morgan Stanley Health Care Payer Index, our peer group. The graph assumes an investment of $100 in each of our common stock, the NYSE Composite group, and the peer group on December 31, 2005. The shareholder return shown on the following graph is not indicative of future performance.
The graph assumes that the value of the investment in our common stock and in the above-referenced indices was $100 at December 31, 2005 and that all dividends were reinvested. The price of our common stock on December 31, 2005, on which the graph is based, was $15.08. The shareholder return shown on the following graph is not necessarily indicative of future performance.
69
Comparison of Cumulative Total Return Among
Universal American Corp's. Common Stock,
New York Stock Exchange Composite Index and
Morgan Stanley Health Care Payer Index
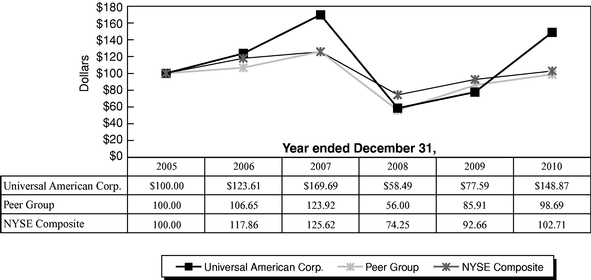
Note: 2010 return for Universal American reflects $2.00 dividend paid in August 2010. The stock price performance included in this graph is not necessarily indicative of future stock price performance.
Recent Sales of Unregistered Securities
None.
Securities Authorized for Issuance Under Equity Compensation Plans
The information regarding securities authorized for issuance under our equity compensation plans is disclosed in Item 12 "Security Ownership of Certain Beneficial Owners and Management and Related Stockholder Matters."
ITEM 6—SELECTED FINANCIAL DATA
The table below provides selected financial data and other operating information as of and for the five fiscal years ended December 31, 2010. We derived the selected financial data presented below for the five fiscal years ended December 31, 2010 from our audited financial statements. We have prepared the following data, other than statutory data, in conformity with U.S. generally accepted accounting principles. You should read this selected financial data together with our Consolidated Financial
70
Statements and in the Notes to Consolidated Financial Statements as well as the discussion under the caption "Management's Discussion and Analysis of Financial Condition and Results of Operations."
| |
For the Year Ended December 31, | |||||||||||||||||
|---|---|---|---|---|---|---|---|---|---|---|---|---|---|---|---|---|---|---|
| |
2010 | 2009 | 2008 | 2007(1) | 2006 | |||||||||||||
| |
(in thousands, except per share data) |
|||||||||||||||||
Income Statement Data: |
||||||||||||||||||
Net premium and policyholder fees earned |
$ | 5,629,700 | $ | 4,918,898 | $ | 4,600,454 | $ | 2,941,419 | $ | 1,197,142 | ||||||||
Net investment income |
42,857 | 49,814 | 81,270 | 106,970 | 75,459 | |||||||||||||
Fee and other income |
9,673 | 19,776 | 37,130 | 26,412 | 27,645 | |||||||||||||
Net realized gain (loss) on investments |
4,995 | (24,988 | ) | (59,681 | ) | (40,178 | ) | 4,818 | ||||||||||
Total revenues |
5,687,225 | 4,963,500 | 4,659,173 | 3,034,623 | 1,305,064 | |||||||||||||
Total benefits, claims and expenses |
5,412,912 | 4,749,148 | 4,580,682 | 2,958,661 | 1,257,495 | |||||||||||||
Income from continuing operations before equity in earnings of unconsolidated subsidiary |
274,313 | 214,352 | 78,491 | 75,962 | 47,569 | |||||||||||||
Equity in earnings of unconsolidated subsidiary |
— | 280 | 72,813 | 56,664 | 46,187 | |||||||||||||
Income from continuing operations before income taxes |
274,313 | 214,632 | 151,304 | 132,626 | 93,756 | |||||||||||||
Provision for income taxes |
86,634 | 74,328 | 56,212 | 48,554 | 32,610 | |||||||||||||
Income from continuing operations |
187,679 | 140,304 | 95,092 | 84,072 | 61,146 | |||||||||||||
Discontinued Operations: |
||||||||||||||||||
Income from discontinued operations, net of taxes |
— | — | — | — | 9,788 | |||||||||||||
Gain on Sale of discontinued operations, net of taxes |
— | — | — | — | 48,372 | |||||||||||||
Income from discontinued operations |
— | — | — | — | 58,160 | |||||||||||||
Net income |
$ | 187,679 | $ | 140,304 | $ | 95,092 | $ | 84,072 | $ | 119,306 | ||||||||
Earnings per common share: |
||||||||||||||||||
Basic: |
||||||||||||||||||
Continuing operations |
$ | 2.40 | $ | 1.73 | $ | 1.09 | $ | 1.20 | $ | 1.04 | ||||||||
Discontinued operations |
— | — | — | — | 0.99 | |||||||||||||
Net income |
$ | 2.40 | $ | 1.73 | $ | 1.09 | $ | 1.20 | $ | 2.03 | ||||||||
Diluted: |
||||||||||||||||||
Continuing operations |
$ | 2.38 | $ | 1.73 | $ | 1.08 | $ | 1.18 | $ | 1.02 | ||||||||
Discontinued operations |
— | — | — | — | 0.97 | |||||||||||||
Net income |
$ | 2.38 | $ | 1.73 | $ | 1.08 | $ | 1.18 | $ | 1.99 | ||||||||
Cash dividends per common share |
$ | 2.00 | $ | — | $ | — | $ | — | $ | — | ||||||||
- (1)
- Includes the results of MemberHealth after its acquisition on September 21, 2007.
71
| |
As of December 31, | |||||||||||||||
|---|---|---|---|---|---|---|---|---|---|---|---|---|---|---|---|---|
| |
2010 | 2009 | 2008 | 2007(1) | 2006 | |||||||||||
| |
(in thousands, except per share data) |
|||||||||||||||
Balance Sheet Data: |
||||||||||||||||
Total cash and investments |
$ | 1,465,351 | $ | 1,822,787 | $ | 1,567,348 | $ | 1,815,620 | $ | 1,677,973 | ||||||
Total assets |
3,656,010 | 3,814,856 | 3,862,163 | 4,089,256 | 2,585,042 | |||||||||||
Policyholder related liabilities |
1,364,099 | 1,388,586 | 1,532,422 | 1,585,750 | 1,253,113 | |||||||||||
Outstanding bank debt |
232,872 | 313,758 | 320,625 | 349,125 | 90,563 | |||||||||||
Trust preferred securities |
110,000 | 110,000 | 110,000 | 110,000 | 75,000 | |||||||||||
Stockholders' equity |
1,502,694 | 1,449,464 | 1,316,084 | 1,351,066 | 623,909 | |||||||||||
Book value per share: |
||||||||||||||||
Basic |
$ | 18.81 | $ | 18.44 | $ | 15.58 | $ | 14.66 | $ | 10.54 | ||||||
Data Reported to Regulators: |
||||||||||||||||
Statutory capital and surplus |
$ | 751,233 | $ | 800,580 | $ | 611,497 | $ | 545,201 | $ | 282,453 | ||||||
Asset valuation reserve |
744 | 247 | 590 | 5,220 | 4,445 | |||||||||||
Adjusted capital and surplus |
$ | 751,977 | $ | 800,827 | $ | 612,087 | $ | 550,421 | $ | 286,898 | ||||||
- (1)
- Reflects the inclusion of MemberHealth since its acquisition on September 21, 2007.
72
ITEM 7—MANAGEMENT'S DISCUSSION AND ANALYSIS OF FINANCIAL CONDITION AND RESULTS OF OPERATIONS
Introduction
You should read the following analysis of our consolidated results of operations and financial condition in conjunction with the consolidated financial statements and related consolidated footnotes included in this Annual Report on Form 10-K.
The following discussion and analysis presents a review of the Company as of December 31, 2010 and its results of operations for the fiscal years ended December 31, 2010, 2009 and 2008.
2010 Highlights:
- •
- Revenue increased 15% to $5.7 billion, compared 2009.
- •
- Pre-tax earnings increased $59.7 million to $274.3 million from 2009.
- •
- 2010 diluted earnings per share of $2.38, compared with $1.73 in 2009.
- •
- Declared and paid a special cash dividend of $2.00 per common share.
- •
- On December 30, 2010, entered into a definitive agreement to sell our Medicare Part D business to CVS
Caremark for $1.25 billion in cash, subject to adjustment.
- •
- Membership in our Medicare Advantage Plans increased 19% year-over-year, including 45% growth in
our Network-based (HMO and PPO) Plans.
- •
- Medicare Part D membership increased 200,000 from December 31, 2009.
- •
- Our 2011 Part D Plan bid under the benchmark in 29 of the 34 regions. We also maintained all of our currently
eligible auto-assigned regions, with the exception of Nevada, which represented approximately 6,700 members.
- •
- Reduced our aggregate outstanding indebtedness by $81 million to $233 million at December 31, 2010 as
compared to $314 million at December 31, 2009.
- •
- Other-than-temporary impairment of investment securities declined to $0.8 million, compared
to $17.4 million of OTTI recorded in 2009.
- •
- Sold CHCS, our administrative services company
- •
- Recorded charge of $12.6 million, after tax, or $0.16 per share related to the realignment of our distribution
channels and costs incurred in connection with the Part D transaction.
- •
- Recorded $14.4 million tax benefit related to non-recurring items.
Membership
The following table presents our membership in Medicare Advantage and Part D products as of December 31, 2010 and 2009.
Membership by Segment
|
2010 | 2009 | |||||||
|---|---|---|---|---|---|---|---|---|---|
| |
(in thousands) |
||||||||
Medicare Advantage |
|||||||||
PFFS |
193 | 177 | |||||||
Network-based (HMO and PPO) |
93 | 64 | |||||||
Total Medicare Advantage |
286 | 241 | |||||||
Medicare Part D |
1,897 | 1,697 | |||||||
Total Membership |
2,183 | 1,938 | |||||||
73
Healthcare Reform
In March 2010, President Obama signed into law The Patient Protection and Affordable Care Act and The Health Care and Education Reconciliation Act of 2010 (which we collectively refer to as the "Affordable Care Act") which enacts significant changes to various aspects of the U.S. health insurance industry. There are many important provisions of the legislation that will require additional guidance and clarification in form of regulations and interpretations in order to fully understand the impact of the legislation on our overall business, which we expect to occur over the next several years. In Certain aspects of the Affordable Care Act are currently being challenged in the judicial system. In addition, Congress may withhold the funding necessary to implement the new reforms or attempt to replace the legislation with amended provisions or repeal it altogether.
Certain significant provisions of the Affordable Care Act that will impact our business include, among others, reduced Medicare Advantage reimbursement rates, gradual closing of the coverage gap, or "donut hole" on Medicare Part D, implementation of quality bonus for Star Ratings, stipulated minimum medical loss ratios, shortened annual enrollment period, non-deductible federal premium taxes assessed to health insurers, coding intensity adjustments with mandatory minimums and a limitation on the federal tax deductibility of compensation earned by individuals. The Health Care Reform Legislation is discussed more fully under "Regulation" and Item 1A. Risk Factors.
Significant Transactions and Initiatives
Medicare Advantage
As a result of the passage of the Medicare Improvements for Patients and Providers Act of 2008, known as MIPPA, the PFFS product is no longer available as of January 1, 2011, except in areas that meet approved CMS network access requirements or in certain designated rural areas. We have developed products meeting CMS network access requirements in selected core markets to enable the retention of our PFFS membership in these areas. These businesses provide managed care for persons with Medicare under contracts with CMS.
On November 19, 2010, the Centers for Medicare and Medicaid Services ("CMS") notified us that we were suspended from marketing to and enrolling new members in our Medicare Advantage plans, effective December 5, 2010. According to CMS, the suspension relates primarily to agent oversight and market conduct issues and will remain in effect until CMS is satisfied that we have corrected the issues and they are not likely to recur. The suspension does not affect current members in our Medicare Advantage plans, nor does it affect the marketing, enrollment or membership in our stand-alone Medicare Prescription Drug plans. We are working diligently to resolve these issues with CMS as quickly as possible.
As a result of the network requirements of MIPPA, we were required to terminate approximately 60,000 members as of January 1, 2011. Further, due to lapsation and the limited ability to add new members during the 2011 Annual Election Period as a result of the CMS sanctions, membership declined by an additional 48,000, resulting in membership of approximately 178,000 as of January 1, 2011.
Medicare Part D
For the 2010 plan year, we offered through our insurance subsidiaries, one or both of our Community CCRxSM and PrescribaRxSM prescription drug plans in all 34 regions designated by CMS, and one or both of our plans bid under the benchmark in 30 of the 34 regions. For the 2011 Plan year, based upon a requirement of CMS, we consolidated our PrescribaRxSM prescription drug plan into the Community CCRxSM plan. Our Community CCRx plan bid under the benchmark, or used de minimis rules to retain membership, in 29 of the 34 regions.
74
Sale of Medicare Part D Business to CVS Caremark
On December 30, 2010, we entered into (i) an Agreement and Plan of Merger (the "CVS Agreement") with CVS Caremark Corporation ("CVS Caremark") and Ulysses Merger Sub, L.L.C., an indirect wholly-owned subsidiary of CVS Caremark, to provide for the purchase of our Medicare Part D Business by CVS Caremark and (ii) a Separation Agreement with Universal American Spin Corp., a newly-formed wholly-owned subsidiary of the Company ("Newco"), to provide for the separation of our Medicare Part D Business from our remaining businesses, which include our Medicare Advantage and Traditional Insurance businesses (collectively, the "Newco Businesses.") We refer to the sale of our Medicare Part D Business to CVS Caremark and related transactions as the "Part D Sale Transaction" or the "Transactions."
Pursuant to the CVS Agreement, CVS Caremark will pay Universal American shareholders $1.25 billion plus the excess capital in the entities that operate our Medicare Part D Business as of December 31, 2010, less the amount of our outstanding debt and trust preferred securities and certain other amounts. At the effective time of the merger, we expect that each share of common stock and preferred stock of the Company will be cancelled and converted into the right to receive one share of common stock of Newco which will own the Newco Businesses and approximately $13.00 to $13.20 per share in cash. The transaction is expected to close by the end of the second quarter of 2011 and is subject to customary closing conditions, including approval of our shareholders and necessary regulatory approvals. On February 28, 2011 the Federal Trade Commission granted early termination of the waiting period under the Hart-Scott-Rodino Antitrust Improvements Act of 1976 with respect to the Part D Sale Transaction. We expect to file a Registration Statement on Form S-4/Proxy Statement Prospectus with the SEC by the middle of March that will contain additional information regarding the Part D Sale Transaction.
Sale of CHCS
On April 26, 2010, we entered into an agreement to sell the outstanding common stock of CHCS, our administrative services company, to Patni Americas, Inc, a wholly-owned subsidiary of Patni Computer Systems Limited (NYSE: PTI), for $6.0 million in cash, subject to an adjustment for any net working capital remaining at CHCS on the closing date. The transaction closed on June 9, 2010, with an effective date of April 1, 2010. The operations of CHCS are included in consolidated results up to the effective date of the sale. The total consideration was approximately $7.5 million. Our carrying value of the assets disposed of in connection with the sale of CHCS was approximately $7.1 million, including $4.4 million of goodwill. After consideration of transaction costs of approximately $0.3 million, we recognized an immaterial gain on the disposition.
Special Dividend
On July 28, 2010, the Board of Directors of the Company approved the payment of a special cash dividend of $2.00 per share to each holder of the Company's outstanding common stock and Series A Preferred Stock. This special cash dividend was paid on August 19, 2010 to the shareholders of record as of the close of business on August 5, 2010. On the payment date, as required under the terms of the 2007 Credit Facility, we made an additional principal payment on our term loan equal to 50% of the dividend payment. The cumulative dividend payment was $156.0 million and the principal payment was $78.0 million. In addition, pursuant to the terms of our 1998 Incentive Compensation Plan, we were required to reduce the exercise price on unexercised options by the amount of the dividend, $2.00 per share. We also established a liability for the dividends related to unvested restricted stock and performance shares. These dividends will be paid out as the restricted stock and performance shares vest. This dividend payable liability was $3.3 million at December 31, 2010. As these dividends are paid out, we will also make additional principal payments on our term loan at the rate of 50% of dividends paid.
75
Segment Overview
Our business segments are based on product offerings and consist of
- •
- Senior Managed Care—Medicare Advantage,
- •
- Medicare Part D, and
- •
- Traditional Insurance.
We also report the activities of our holding company in a separate segment. See Note 26—Business Segment Information in the Notes to Consolidated Financial Statements included in this annual report on Form 10-K for a description of our segments.
We report inter-segment revenues and expenses on a gross basis in each of the operating segments but eliminate them in the consolidated results. These inter- segment revenues and expenses affect the amounts reported on the individual financial statement line items, but we eliminate them in consolidation and they do not change income before taxes. The significant items eliminated are
- •
- inter-segment revenue and expense relating to services performed by the former Senior Administrative Services segment (now
reported as part of Corporate & Other since the sale of CHCS in April 2010) for our other segments,
- •
- inter-segment revenue and expense relating to PBM services performed by the Part D segment for other segments, and
- •
- interest on notes payable or receivable between the Corporate segment and the other operating segments.
Results of Operations—Consolidated Overview
The following table reflects income from each of our segments and contains a reconciliation to reported net income:
| |
For the year ended December 31, | ||||||||||
|---|---|---|---|---|---|---|---|---|---|---|---|
| |
2010 | 2009 | 2008 | ||||||||
| |
(in thousands) |
||||||||||
Senior Managed Care—Medicare Advantage(1) |
$ | 149,071 | $ | 134,810 | $ | 94,625 | |||||
Medicare Part D(1) |
184,776 | 178,344 | 127,444 | ||||||||
Traditional Insurance(1) |
1,168 | (20,518 | ) | 4,845 | |||||||
Corporate & Other(1) |
(65,697 | ) | (53,016 | ) | (15,929 | ) | |||||
Net realized gains (losses) on investments(1) |
4,995 | (24,988 | ) | (59,681 | ) | ||||||
Income before provision for income taxes(1) |
274,313 | 214,632 | 151,304 | ||||||||
Provision for income taxes |
86,634 | 74,328 | 56,212 | ||||||||
Net income |
$ | 187,679 | $ | 140,304 | $ | 95,092 | |||||
Earnings per common share (diluted) |
$ | 2.38 | $ | 1.73 | $ | 1.08 | |||||
- (1)
- We evaluate the results of operations of our segments based on income before realized gains and losses and income taxes. We believe that realized gains and losses are not indicative of overall operating trends. This differs from U.S. generally accepted accounting principles, which reflects the effect of realized gains and losses in the determination of net income. The schedule above reconciles our segment income to net income in accordance with U.S. generally accepted accounting principles.
76
Years ended December 31, 2010 and 2009
Net income for the year ended December 31, 2010 was $187.7 million, or $2.38 per diluted share, compared to net income of $140.3 million, or $1.73 per diluted share for the year ended December 31, 2009. The net income for the year ended December 31, 2010 includes realized investment gains, net of taxes, of $3.2 million, or $0.04 per diluted share. Net income for the year ended December 31, 2009 includes realized investment losses, net of taxes, of $16.2 million, or $0.20 per diluted share, relating primarily to the recognition of other-than-temporary impairments on investments. For the year ended December 31, 2010, our effective tax rate was 31.6%, compared with 34.6% for the same period of 2009. The decline in the effective rate for the year ended December 31, 2010 is due to the recording of $14.4 million of non-recurring tax benefits during the year, compared with $5.5 million in 2009. The 2010 benefit resulted primarily from the impact of tax law changes on our insurance companies and benefits that were recognized upon the completion of examinations by the Internal Revenue Service primarily attributable to the pre-acquisition tax returns of MemberHealth, Inc. The 2009 benefit resulted from the settlement of the Internal Revenue Service examination of 2005 primarily related to the treatment of a controlled foreign corporation sold in 2006. Absent these non-recurring benefits, the effective rate would have been 36.8% and 37.2% for the years ended December 31, 2010 and 2009, respectively.
Our Senior Managed Care—Medicare Advantage segment generated income before income taxes of $149.1 million for the year ended December 31, 2010, an increase of $14.3 million compared to the year ended December 31, 2009. The increase in earnings was driven by membership growth in all products that resulted in a 23% increase in member months for the year. These improvements were partially offset by a higher medical expense ratio of 120 basis points and higher expenses due to the growth in membership. The increase in the medical expense ratio is due primarily due to a lower premium per member primarily in PFFS as a result of change in pricing in 2010 offset partially by the increase in favorable prior year development in 2010 compared to 2009. For the year ended December 31, 2010, there was $36.7 million of net favorable prior year development compared to $21.1 million for the year ended December 31, 2009. 2009 also included a $3.5 million restructuring charge related to the in-sourcing of billing and enrollment for our HMO business.
Our Medicare Part D segment generated income before income taxes of $184.8 million for the year ended December 31, 2010 compared to income before taxes of $178.3 million, for the year ended December 31, 2009. The $6.4 million, or 3.6%, increase in segment income was attributable to a $14.9 million of expense savings due to improvement in operating efficiencies and increased scale and a $9.0 million increase in positive prior year development. These increases were offset by a $17.5 million decline in segment income attributable to our 2010 bidding strategy described below (in the segment results discussion on Medicare Part D) and higher drug costs, partially offset by growth in membership.
Results for our Traditional Insurance segment improved by $21.7 million compared to the year ended December 31, 2009. The improvement primarily results from an overall decrease in the combined medical loss and administrative expense ratios of 577 basis points from 110.5% in 2009 to 104.7% in 2010. The transaction with Commonwealth in April 2009 to reinsure substantially all of the net retained life and annuity business impacted the comparison of year over year results as we recognized $9.0 million of charges related to the transaction in 2009, including a loss and other related costs on the transaction and a restructuring charge as a result of our re-alignment of operations for the lower level of net retained business. This was offset by a decline in net investment income of $8.2 million caused by a lower invested asset base due to the transfer of assets in conjunction with the reinsurance transaction with Commonwealth.
The loss before income taxes from our Corporate & Other segment increased by $12.7 million, or 24%, for the year ended December 31, 2010 compared to 2009. This was primarily due to the $7.8 million decline in net income—Senior Administrative Services as a result of the sale of CHCS
77
effective April 1, 2010. In addition, we recorded $4.0 million of expenses related to the Part D transaction. During 2010 and 2009 we recorded charges related to the realignment of our distribution channels amounting to $15.0 million and $13.6 million, respectively.
Years ended December 31, 2009 and 2008
Net income for the year ended December 31, 2009 was $140.3 million, or $1.73 per diluted share, compared to net income of $95.1 million, or $1.08 per diluted share for the year ended December 31, 2008. The net income for the year ended December 31, 2009 includes realized investment losses, net of taxes, of $16.2 million, or $0.20 per diluted share, relating primarily to the recognition of other-than-temporary impairments on investments. Net income for the year ended December 31, 2008 includes realized investment losses, net of taxes, of $38.8 million, or $0.44 per diluted share, also related primarily to the recognition of other-than-temporary impairments on investments. For the year ended December 31, 2009, our effective tax rate was 34.6%, compared with 37.2% for the same period of 2008. The decline in the effective rate for the year ended December 31, 2009 is due to the recording of $5.5 million of non-recurring tax benefits during the third quarter of 2009. This benefit resulted from the settlement of the Internal Revenue Service examination of 2005 primarily related to the treatment of a controlled foreign corporation sold in 2006. Absent this non-recurring benefit, the effective rate would have been 37.2% for the year ended December 31, 2009.
Our Senior Managed Care—Medicare Advantage segment generated income before income taxes of $134.8 million for the year ended December 31, 2009, an increase of $40.2 million compared to the year ended December 31, 2008. These results reflect $21.1 million of favorable CMS reconciliations and reserve development in 2009 as compared to $42.1 million in 2008. The increase in earnings was driven by higher medical operating income generated by higher premium, an improvement in the medical benefit ratio of 80 basis points and higher net investment income, partially offset by the $3.5 million restructuring costs incurred during the second quarter and continued investment in the development of provider networks for our expansion PPO markets. The improvement in the medical benefit ratio is due primarily to higher premium per member related to changes in members' risk scoring process in 2009 and the $18.9 million in false claims submitted by fictitious providers, in our PFFS business during the fourth quarter of 2008.
Our Medicare Part D segment income before income taxes for the year ended December 31, 2009 increased by $50.9 million versus the comparable period in 2008. These results reflect favorable CMS reconciliations and reserve development of $0.5 million in 2009 as compared to net negative prior period development of $0.6 million in 2008. In addition, premium growth and improved benefit and expense ratios exceeded the elimination of income generated from our interest in PDMS and the amortization of the below market contract liability by approximately $50 million.
Results for our Traditional Insurance segment decreased by $25.4 million compared to the year ended December 31, 2008. The reinsurance transaction with Commonwealth to reinsure substantially all of the net retained life and annuity business resulted in a loss and other related costs of approximately $7.6 million. Additionally, a $1.4 million restructuring charge was recorded as a result of re-alignment of operations with the lower level of net retained business. Excluding these impacts, the decrease to net income was primarily caused by a $37.1 million decrease in net investment income caused by a lower invested asset base due to the transfer of assets in conjunction with the reinsurance transaction noted above and by lower average yields on retained business, which was offset by a reduction in commissions and general expenses of $19.5 million.
The loss before income taxes from our Corporate & Other segment increased by $37.1 million for the year ended December 31, 2009 compared to 2008. This was due primarily to a $13.6 million charge related to the proposed closing and restructuring of certain career sales offices in 2009, $13.5 million lower profitability of the former Senior Administrative Services segment, a significant non-recurring
78
release of a bonus accrual in the first quarter of 2008, higher stock-based compensation costs for equity awards to employees and directors, higher levels of expense and lower net investment income, partially offset by lower borrowing costs.
Segment Results—Senior Managed Care—Medicare Advantage
| |
For the year ended December 31, | ||||||||||
|---|---|---|---|---|---|---|---|---|---|---|---|
| |
2010 | 2009 | 2008 | ||||||||
| |
(in thousands) |
||||||||||
Net premiums |
$ | 3,155,805 | $ | 2,616,596 | $ | 2,404,067 | |||||
Net investment and other income |
26,630 | 26,394 | 16,626 | ||||||||
Total revenue |
3,182,435 | 2,642,990 | 2,420,693 | ||||||||
Medical expenses |
2,638,586 | 2,156,603 | 2,001,163 | ||||||||
Amortization of intangible assets |
4,294 | 4,584 | 4,056 | ||||||||
Restructuring costs |
— | 3,500 | — | ||||||||
Commissions and general expenses |
390,484 | 343,493 | 320,849 | ||||||||
Total benefits, claims and expenses |
3,033,364 | 2,508,180 | 2,326,068 | ||||||||
Segment income before income taxes |
$ | 149,071 | $ | 134,810 | $ | 94,625 | |||||
Our Senior Managed Care—Medicare Advantage segment includes the operations of our Medicare coordinated care Plans including PPOs and HMOs as well as our PFFS business, which provides coverage to Medicare beneficiaries in 45 states. Our HMOs offer coverage to Medicare beneficiaries primarily in Southeastern Texas and the area surrounding Dallas/Ft. Worth, 15 counties in Oklahoma and 4 counties in Wisconsin. In January 2010, we expanded our PPO products to 114 counties in 17 states.
Years ended December 31, 2010 and 2009
Our Senior Managed Care—Medicare Advantage segment generated income before income taxes of $149.1 million for the year ended December 31, 2010, an increase of $14.3 million compared to the year ended December 31, 2009. The increase in earnings was driven by membership growth in all products that resulted in a 23% increase in member months for the year. These improvements were partially offset by a higher medical expense ratio of 120 basis points and higher expenses due to the growth in membership. The increase in the medical expense ratio is due primarily due to a lower premium per member primarily in PFFS as a result of change in pricing in 2010 offset partially by the increase in favorable prior year development in 2010 compared to 2009. For the year ended December 31, 2010, there was $36.7 million of net favorable prior year development compared to $21.1 million for the year ended December 31, 2009. 2009 also included a $3.5 million restructuring charge related to the in-sourcing of billing and enrollment for our HMO business.
Revenues. Net premiums for the Senior Managed Care—Medicare Advantage segment increased by $539.2 million compared to the year ended December 31, 2009, primarily due to an increase in premium resulting from the growth in membership in all products partially offset by lower premium per member primarily in PFFS. Total member months in our Medicare Advantage Plans for the year ended December 31, 2010 increased by approximately 23% from prior year with gains in all products.
Medical expenses. Medical expenses increased by $482.0 million compared to the year ended December 31, 2010, as a result of the higher level of net premiums and an increase in member months over 2010. The medical expense ratio increased to 83.6% for the year ended December 31, 2010 from 82.4% for the year ended December 31, 2009 as a result of the items discussed above.
79
Commissions and general expenses. Commissions and general expenses for the year ended December 31, 2010 increased $47.0 million compared to the year ended December 31, 2009, primarily as the result of the increased level of membership and higher expenses to support the continued investment in the development of provider networks for our expansion in PPO and network based PFFS markets. However, the ratio of commissions and general expenses to net premiums decreased to 12.4% for the year ended December 31, 2010 from 13.1% in 2009 primarily due to increased efficiencies and scale.
Years ended December 31, 2009 and 2008
Our Senior Managed Care—Medicare Advantage segment generated income before income taxes of $134.8 million for the year ended December 31, 2009, an increase of $40.2 million compared to the year ended December 31, 2008. These results reflect $21.1 million of favorable CMS reconciliations and reserve development in 2009 as compared to $42.1 million in 2008. The increase in earnings was driven by higher medical operating income generated by higher premium, an improvement in the medical expense ratio of 80 basis points and higher net investment income, partially offset by the $3.5 million restructuring costs incurred during the second quarter and continued investment in the development of provider networks for our expansion PPO markets. The improvement in the medical expense ratio is due primarily to higher premium per member related to changes in members' risk scoring process in 2009 and the $18.9 million in false claims submitted by fictitious providers, in our PFFS business during the fourth quarter of 2008.
Revenues. Net premiums for the Senior Managed Care—Medicare Advantage segment increased by $212.5 million compared to the year ended December 31, 2008, primarily due to premium growth resulting from an increase in overall premium rates per member, growth in HMO membership and net premium generated by our new PPO markets. Total member months in our Medicare Advantage Plans for the year ended December 31, 2009 were down slightly from prior year with gains in membership in our HMO Plans being offset by lapses in our PFFS Plans. In addition, net investment income increased due to higher investment levels, partially offset by lower yields.
Medical expenses. Medical expenses increased by $155.4 million compared to the year ended December 31, 2008, consistent with the higher level of earned premium. The Medicare Advantage medical expense ratio decreased to 82.4% for the year ended December 31, 2009 from 83.2% for the same period in 2008, primarily as a result of the items discussed above.
Commissions and general expenses. In the second quarter of 2009 we recorded a $3.5 million restructuring charge related to the in-sourcing of billing and enrollment for our health plan business. Commissions and general expenses increased by $22.6 million compared to the year ended December 31, 2008 primarily as the result of an increase in expenses to support the continued investment in the development of provider networks for our expansion PPO markets. However, the ratio of commissions and general expenses to premiums decreased to 13.1% for the year ended December 31, 2009 from 13.3% in 2008 primarily due to increased efficiencies.
80
Segment Results—Medicare Part D
| |
For the year ended December 31, | ||||||||||
|---|---|---|---|---|---|---|---|---|---|---|---|
| |
2010 | 2009 | 2008 | ||||||||
| |
(in thousands) |
||||||||||
Net premium, excluding risk corridor |
$ | 2,208,530 | $ | 2,013,565 | $ | 1,790,924 | |||||
Risk corridor adjustment/government reinsurance |
(24,579 | ) | (32,657 | ) | 11,203 | ||||||
Net premiums |
2,183,951 | 1,980,908 | 1,802,127 | ||||||||
Other Part D income—PDMS |
— | 280 | 72,813 | ||||||||
Total Part D revenue |
2,183,951 | 1,981,188 | 1,874,940 | ||||||||
Net investment and other income |
3,070 | 3,203 | 21,130 | ||||||||
Total revenue |
2,187,021 | 1,984,391 | 1,896,070 | ||||||||
Pharmacy benefits |
1,798,217 | 1,587,075 | 1,533,090 | ||||||||
Amortization of intangibles |
16,046 | 16,046 | 16,022 | ||||||||
Commissions and general expenses |
187,982 | 202,926 | 219,514 | ||||||||
Total benefits, claims and expenses |
2,002,245 | 1,806,047 | 1,768,626 | ||||||||
Segment income before income taxes |
$ | 184,776 | $ | 178,344 | $ | 127,444 | |||||
Reported results for our Medicare Part D segment are subject to anticipated seasonality during a given calendar year. This is due to the nature of the standard benefit design under Medicare Part D. Consequently, this business generally incurs higher claims experience in the first two quarters of the year while beneficiaries are in the deductible and initial coverage phases of the benefit design. As the beneficiary reaches the coverage gap and catastrophic phases of the benefit design, the Plan experiences lower claims liability which is generally in the last two quarters of the year. As a result, we generally anticipate a pattern of net losses from our Medicare Part D segment during the early part of the year, with a break-even point during the third quarter and most of the segment's net income earned during the fourth quarter resulting in a pattern of increasing reported net income.
As a result of changes made by the federal government to the standard benefit design in 2010 and due to the more conservative way in which we bid our business for the 2010 plan year, which resulted in a lower planned target margin, we experienced a greater degree of seasonality in our Medicare Part D segment throughout 2010 as compared to 2009, with higher losses in the first half of the year and higher profitability for the second half of the year, namely in the fourth quarter. For a discussion of the accounting for our Medicare Part D segment—see Note 3- Summary of Significant Accounting Policies in the Notes to Consolidated Financial Statements.
Other Part D income—PDMS represents our equity in the earnings of PDMS—see "Unconsolidated Subs" in Note 24—Other Operational Disclosures in the Notes to Consolidated Financial Statements. We report this as revenue for segment reporting purposes because the amount is incorporated in the calculation of the risk corridor adjustment. For consolidated reporting, we reflect this amount as a separate line following income from operations. See the reconciliation of segment revenues in Note 26 of the Notes to Consolidated Financial Statements in this Annual Report on Form 10-K. Our strategic alliance with CVS Caremark was terminated effective December 31, 2008. Upon termination of this strategic alliance, CVS Caremark and Universal American were each assigned responsibility for the drug benefit of specific Prescription PathwaySM Plan members in a manner to achieve an approximately equal distribution of the value of business that had been generated by the strategic alliance. Universal American has continued to operate PDPs derived from this business under the name PrescribaRx. Effective January 1, 2009, PDMS no longer managed the strategic alliance and
81
did not earn revenue or incur expenses related to the 2009 Medicare PDP year. PDMS was dissolved in December 2009.
In 2008, the Prescription PathwaySM business was reinsured on a 50% coinsurance basis with PharmaCare Re, a subsidiary of CVS Caremark, and we retained a 50% share in that business. There was no reinsurance for the PrescribaRx business in 2009 or 2010, and therefore we retained 100%.
Years ended December 31, 2010 and 2009
Our Medicare Part D segment generated income before income taxes of $184.8 million for the year ended December 31, 2010 compared to income before taxes of $178.3 million, for the year ended December 31, 2009. The $6.4 million, or 3.6%, increase in segment income was attributable to $14.9 million of expense savings due to improvement in operating efficiencies and increased scale and a $9.0 million increase in positive prior year development. These increases were offset by a $17.5 million decline in segment income attributable to our 2010 bidding strategy described above and higher drug costs, partially offset by growth in membership.
Positive prior year development for the year ended December 31, 2010 was $9.5 million, compared with $0.5 million of positive prior year development for the year ended December 31, 2009. Prior year development for the year ended December 31, 2010 was primarily attributable to the 2006 and 2007 plan years, and the majority of this development was recorded in the fourth quarter of 2010. In December 2010, CMS announced that the 2006 and 2007 plan years will be re-opened and settled based upon PDE submitted to CMS through January 30, 2011. Part D segment income for the year ended December 31, 2010 reflects amounts that Part D expects to collect when the 2006 and 2007 plan years are re-opened and settled.
Membership. At December 31, 2010, total membership for Medicare Part D, based on enrollment information provided by CMS, was approximately 1,897,000 members, an increase of 200,000 members, or 11.8%, compared to net retained membership of 1,697,000 members at December 31, 2009.
Net Premiums. Net premiums, excluding risk corridor for the year ended December 31, 2010, increased by $195.0 million, or 9.7%, versus the year ended December 31, 2009. The increase in net premiums, excluding risk corridor was primarily attributable to growth in net retained membership by 200,000 members, and was partially offset by decreases in member premium rates and risk-adjusted direct subsidy rates paid by CMS. The decrease in member premium rates was attributable to the 2010 plan year bidding strategy which contributed to the growth in membership. In addition, a larger portion of our 2010 membership enrolled in standard plans which have lower member premium rates than enhanced plans. Risk-adjusted direct subsidy rates decreased as a result of an improvement in our members' health status in 2010, as determined by CMS. Risk-adjusted rates are determined by CMS based upon the member's health status and are described in further detail in Note 3 in the Notes to Consolidated Financial Statements. In addition, net premiums, excluding risk corridor for the year ended December 31, 2010 included risk adjustment revenue totaling $13.9 million for our 2009 membership and for the year ended December 31, 2009 included risk adjustment revenue totaling $12.3 million for our 2008 membership.
The risk corridor adjustment calculation compares the target amount of prescription drug costs (limited to costs under the standard coverage as defined by CMS) less rebates in our annual Plan bid to actual experience. The $8.1 million decrease in risk corridor payable adjustment for the year ended December 31, 2010 versus the comparable period in 2009 consisted of $13.7 million which was expected primarily due to the 2010 plan year bidding strategy, offset by $5.6 million in prior year development. The risk corridor adjustment for the year ended December 31, 2010 included unfavorable prior year development of $3.2 million, compared with favorable development of $2.4 million for the year ended December 31, 2009. See further discussion of the risk corridor adjustment under "Critical Accounting Policies."
82
Pharmacy Benefits. Pharmacy benefits for the year ended December 31, 2010, increased by $211.1 million, or 13.3%, compared to the year ended December 31, 2009, and the ratio of pharmacy benefits to net premium, after risk corridor adjustment, was 82.3% and 80.1% for the years ended December 31, 2010 and 2009, respectively. Pharmacy benefits increased as a percentage of net premiums due to the combination of lower member premium and direct subsidy rates (previously described), and higher drug costs. Higher drug costs were attributable to price increases imposed by pharmaceutical manufacturers which are customary and were consistent with historical experience. These increases were partially offset by a lower utilization of drugs by our members, which is consistent with the aforementioned improvement in our members' health status, and lower net negative prior year development. Pharmacy benefits for the year ended December 31, 2010 included $0.4 million of net negative prior year development compared with $14.2 million of net negative prior year development during the year ended December 31, 2009. Negative prior year development for the year ended December 31, 2009 is further described under "Years ended December 31, 2009 and 2008", below.
Commissions and general expenses. Commissions and general expenses for the year ended December 31, 2010 decreased by $14.9 million, or 7.4%, versus the year ended December 31, 2009. This decrease was attributable to our continuing efforts to reduce general expenses, as well as the restructuring of the Part D call center and other member services which were completed during 2009. The ratio of commissions and general expenses to net premium, excluding risk corridor improved to 8.5% for the year ended December 31, 2010 from 10.1% for the year ended December 31, 2009. This improvement was attributable to continued operating efficiencies and increased scale.
Years ended December 31, 2009 and 2008
Our Medicare Part D segment income before income taxes for the year ended December 31, 2009 increased by $50.9 million versus the comparable period in 2008. These results reflect favorable CMS reconciliations and reserve development of $0.5 million in 2009 as compared to net negative prior period development of $0.6 million in 2008. In addition, premium growth and improved benefit and expense ratios exceeded the elimination of income generated from our interest in PDMS and the amortization of the below market contract liability by approximately $50 million.
Membership. At December 31, 2009, total membership for Medicare Part D, based on enrollment information provided by CMS, was approximately 1,697,000 members, an increase of 125,000 members, or 8.0%, compared to net retained membership of 1,572,000 members at December 31, 2008. Net retained membership at December 31, 2008 excludes members that were reinsured to CVS Caremark. The increase in membership was principally attributable to growth from open enrollment and dual eligible members automatically assigned to our Plans in 2009.
Net premiums. Net premiums for the year ended December 31, 2009 increased by $178.8 million, or 10%, versus the comparable period in 2008. The increase in net premiums was primarily attributable to an increase in net retained membership of 125,000 members, offset by a decrease in the government risk corridor receivable. Net premiums for the year ended December 31, 2009 included items related to prior plan years, which increased total revenue by approximately $14.7 million (net of the impact of government risk corridor). These items were comprised of $9.2 million in risk adjustment revenue (net of the impact of government risk corridor) related to our 2008 membership and $5.5 million related to the final CMS prescription drug event, known as PDE, reconciliations for prior plan years. Net premiums for the year ended December 31, 2008 included items which reduced total revenue by approximately $3.9 million (net of the impact of the government risk corridor) related to final CMS PDE reconciliation for the 2007 plan year. In addition, net premiums for the year ended December 31, 2008 included $39.2 million in amortization of a below market contract liability.
Other Part D income—PDMS for the year ended December 31, 2009, decreased by $72.5 million versus the comparable period in 2008, as a result of the termination of our strategic alliance with CVS
83
Caremark. Net investment and other income decreased by $17.9 million principally as a result of a decrease in revenue earned by MemberHealth for third party services performed in 2008 that were discontinued in 2009.
Pharmacy Benefits. Pharmacy benefits for the year ended December 31, 2009, increased by $54.0 million, or 3.5%, compared to the year ended December 31, 2008. The ratio of incurred prescription drug benefits to net premium, after risk corridor adjustment, was 80.1% and 85.1% for the years ended December 31, 2009 and 2008, respectively. The improvement in the ratio of incurred prescription drug benefits to net premium is attributable to more competitive network rates available through our claims processor, combined with higher rebates that resulted from the consolidation of our Medicare Part D contracts with pharmaceutical manufacturers. In addition, pharmacy benefits for the year ended December 31, 2009 include $14.2 million in items related to prior plan years. These items increased benefits and are primarily attributable to co-pay refunds that will be issued to members for the 2008 plan year, partially offset by rebates earned in prior periods. Pharmacy benefits for the year ended December 31, 2008 included a $2.0 million reduction related to the final 2007 CMS PDE and plan to plan membership reconciliations.
Commissions and general expenses. Commissions and general expenses for the year ended December 31, 2009 decreased by $16.6 million versus the comparable period in 2008 with the decrease largely attributable to our restructuring of the Medicare Part D call center, other member services and PBM services which began during 2008 and was completed in 2009.
Segment Results—Traditional Insurance
| |
For the year ended December 31, | ||||||||||
|---|---|---|---|---|---|---|---|---|---|---|---|
| |
2010 | 2009 | 2008 | ||||||||
| |
(in thousands) |
||||||||||
Net premiums |
$ | 289,853 | $ | 321,423 | $ | 394,275 | |||||
Net investment income |
14,891 | 23,062 | 60,189 | ||||||||
Other income |
2,707 | 1,959 | 1,120 | ||||||||
Total revenue |
307,451 | 346,444 | 455,584 | ||||||||
Policyholder benefits |
222,075 | 254,991 | 317,344 | ||||||||
Change in deferred acquisition costs |
5,648 | 7,786 | 14,273 | ||||||||
Amortization of intangible assets |
2,729 | 2,721 | 3,319 | ||||||||
Goodwill impairment |
— | — | 3,893 | ||||||||
Loss on reinsuance and other related costs |
— | 7,624 | — | ||||||||
Restructuring costs |
— | 1,404 | — | ||||||||
Commissions and general expenses, net of allowances |
75,831 | 92,436 | 111,910 | ||||||||
Total benefits, claims and expenses |
306,283 | 366,962 | 450,739 | ||||||||
Segment income (loss) before income taxes |
$ | 1,168 | $ | (20,518 | ) | $ | 4,845 | ||||
Our Traditional Insurance segment consists of three major lines of business. Senior Market includes Medicare supplement, senior dental and hospital indemnity products. Specialty Health includes disability, specified disease, hospital, surgical and long-term care products. Life Insurance and Annuities includes whole life, universal life and annuity products.
Years ended December 31, 2010 and 2009
Results for our Traditional Insurance segment improved by $21.7 million compared to the year ended December 31, 2009. The improvement primarily results from an overall decrease in the
84
combined medical loss and administrative expense ratios of 577 basis points from 110.5% in 2009 to 104.7% in 2010. The transaction with Commonwealth in April 2009 to reinsure substantially all of the net retained life and annuity business impacted the comparison of year over year results as we recognized $9.0 million of charges related to the transaction in 2009, including a loss and other related costs on the transaction and a restructuring charge as a result of our re-alignment of operations for the lower level of net retained business. This was offset by a decline in net investment income of $8.2 million caused by a lower invested asset base due to the transfer of assets in conjunction with the reinsurance transaction with Commonwealth.
The following tables detail premium for the segment by major lines of business:
Premium
| |
Year ended December 31, | |||||||||||||||||||
|---|---|---|---|---|---|---|---|---|---|---|---|---|---|---|---|---|---|---|---|---|
| |
2010 | 2009 | ||||||||||||||||||
| |
Gross | Ceded | Net | Gross | Ceded | Net | ||||||||||||||
| |
(in thousands) |
|||||||||||||||||||
Senior market |
$ | 290,691 | $ | (70,515 | ) | $ | 220,176 | $ | 324,347 | $ | (82,861 | ) | $ | 241,486 | ||||||
Specialty health |
66,176 | (10,067 | ) | 56,109 | 72,447 | (11,169 | ) | 61,278 | ||||||||||||
Life insurance and annuity |
70,856 | (57,288 | ) | 13,568 | 74,182 | (55,523 | ) | 18,659 | ||||||||||||
Total premium |
$ | 427,723 | $ | (137,870 | ) | $ | 289,853 | $ | 470,976 | $ | (149,553 | ) | $ | 321,423 | ||||||
Revenues. Net premium declined by $31.6 million, or 9.8%. The continued effect of lapsation on our senior market health and specialty health in-force business resulted in a decrease of $26.5 million. Additionally, as a result of the reinsurance transaction with Commonwealth, net life insurance and annuity premium decreased $5.1 million over the year ended December 31, 2009.
Policyholder Benefits. Policyholder benefits incurred declined by $32.9 million, or 12.9%, compared to the year ended December 31, 2009. This decline was principally due to the overall decline of insurance in-force in the senior market and specialty health lines of business, as well as a decrease in the policyholder benefit ratios for the year ended December 31, 2010 from the same period last year. The policyholder benefit ratio for senior market health was 72.4%, compared with 72.8% for the same period last year, and for specialty health, the policyholder benefit ratio was 98.9%, compared with 100.5% for the same period last year. Additionally, the reinsurance transaction with Commonwealth in April 2009 resulted in a decrease in life insurance and annuity policyholder benefits retained during year ended December 31, 2010 compared to the prior year.
The net amortization of deferred acquisition costs decreased $2.1 million, or 27.5%. This was primarily caused by the elimination of the deferred acquisition costs and the related amortization on the life insurance and annuity business reinsured to Commonwealth.
The following table details the components of commission and general expenses, net of allowances:
| |
Year ended December 31, | ||||||
|---|---|---|---|---|---|---|---|
| |
2010 | 2009 | |||||
| |
(in thousands) |
||||||
Commissions |
$ | 45,793 | $ | 53,321 | |||
Other operating costs |
49,967 | 69,787 | |||||
Reinsurance allowances |
(19,929 | ) | (30,672 | ) | |||
Commissions and general expenses, net of allowances |
$ | 75,831 | $ | 92,436 | |||
85
Commissions and general expenses, net of allowances, decreased by $16.6 million compared to the year ended December 31, 2009. The lower level of commissions is associated with the continued aging of our in-force renewal premium which pays lower commissions as the duration of the policies increase. Other operating costs decreased $19.8 million for the year ended December 31, 2010, compared to the prior year. This is primarily due to cost reductions implemented to align with the lower levels of business in-force as well as savings associated with the outsourcing of certain administrative services previously provided by our CHCS subsidiary that was sold during the second quarter of 2010. Allowances received from reinsurers decreased $10.7 million for the year ended December 31, 2010 from the same period in the prior year. This is primarily due to the fact that, as of the fourth quarter of 2009, Commonwealth began performing the administration for the majority of the life insurance and annuity business. We therefore no longer receive the related expense allowances from third party reinsurers and allowances paid by Commonwealth to reimburse costs incurred from the effective date of the transaction until the administration of the blocks was transferred to them.
Years ended December 31, 2009 and 2008
Results for our Traditional Insurance segment decreased by $25.4 million compared to the year ended December 31, 2008. The reinsurance transaction with Commonwealth to reinsure substantially all of the net retained life and annuity business resulted in a loss and other related costs of approximately $7.6 million. Additionally, a $1.4 million restructuring charge was recorded as a result of re-alignment of operations with the lower level of net retained business. Excluding these impacts, the decrease to net income was primarily caused by a $37.1 million decrease in net investment income caused by a lower invested asset base due to the transfer of assets in conjunction with the reinsurance transaction noted above and by lower average yields on retained business, which was offset by a reduction in commissions and general expenses of $19.5 million.
The following tables detail premium for the segment by major lines of business:
Premium
| |
Year ended December 31, | |||||||||||||||||||
|---|---|---|---|---|---|---|---|---|---|---|---|---|---|---|---|---|---|---|---|---|
| |
2009 | 2008 | ||||||||||||||||||
| |
Gross | Ceded | Net | Gross | Ceded | Net | ||||||||||||||
| |
(in thousands) |
|||||||||||||||||||
Senior market |
$ | 324,347 | $ | (82,861 | ) | $ | 241,486 | $ | 373,990 | $ | (99,539 | ) | $ | 274,451 | ||||||
Specialty health |
72,447 | (11,169 | ) | 61,278 | 251,217 | (184,209 | ) | 67,008 | ||||||||||||
Life insurance and annuity |
74,182 | (55,523 | ) | 18,659 | 76,556 | (23,740 | ) | 52,816 | ||||||||||||
Total premium |
$ | 470,976 | $ | (149,553 | ) | $ | 321,423 | $ | 701,763 | $ | (307,488 | ) | $ | 394,275 | ||||||
Revenues. Net premiums declined by $72.9 million, or 18.5% compared to the year ended December 31, 2008. As a result of the reinsurance transaction with Commonwealth, life and annuity premium ceded increased by $31.8 million. The remaining decrease is primarily a result of the continued effect of lapsation of our senior market and specialty health in-force business. Gross and ceded premium for specialty health both declined by $171.8 million as the result of the June 30, 2008 termination of the reinsurance arrangement with PharmaCare Re for the state of Connecticut employees. The decrease in net investment income is primarily due to the decrease in invested assets as a result of the Commonwealth reinsurance transaction as well as lower yield on retained assets.
86
Policyholder Benefits. Policyholder benefits incurred declined by $62.4 million, or 19.6%, compared to the year ended December 31, 2008. This decline was due to the reinsurance transaction with Commonwealth, which resulted in a decrease in net life and annuity benefits retained of $21.4 million, and a net reduction in senior market product benefits of $30.7 million. The reduction in senior market benefits is mainly a result of a decline in the business in-force. Individual loss ratios for the twelve months ended December 31, 2009 were 72.8% for senior market, compared with 75.2% for the same period last year, and 100.5% for specialty health, compared with 91.7% for the same period last year. The increase in the Specialty loss ratio was primarily caused by an increase in frequency of long-term care claims.
The net amortization of deferred acquisition cost decreased $6.5 million, or 45.4%. This was primarily caused by the elimination of the deferred acquisition costs and the related amortization on the life and annuity business reinsured to Commonwealth.
The following table details the components of commission and general expenses, net of allowances:
| |
Year ended December 31, |
||||||
|---|---|---|---|---|---|---|---|
| |
2009 | 2008 | |||||
| |
(in thousands) |
||||||
Commissions |
$ | 53,321 | $ | 63,752 | |||
Other operating costs |
69,787 | 80,200 | |||||
Reinsurance allowances |
(30,672 | ) | (32,042 | ) | |||
Commissions and general expenses, net of allowances |
$ | 92,436 | $ | 111,910 | |||
Commissions and general expenses, net of allowances, decreased by $19.5 million compared to the year ended December 31, 2008. The lower level of commissions is associated with the continued aging of our in-force renewal premium and less new business production that has higher commission rates. Other operating costs decreased $10.4 million for the year ended December 31, 2009, compared to the twelve months ended December 31, 2008. This is primarily due to the lower levels of business in-force. Allowances received from reinsurers decreased $1.4 million for the year ended December 31, 2009 from the year ended December 31, 2008, primarily due to the termination of the State of Connecticut employees reinsurance arrangement with PharmaCare Re effective June 30, 2008 partially offset by an increase in allowances received on life and annuity business reinsured to Commonwealth.
Segment Results—Corporate & Other
The following table presents the primary components comprising the loss from the segment:
| |
For the year ended December 31, | ||||||||||
|---|---|---|---|---|---|---|---|---|---|---|---|
| |
2010 | 2009 | 2008 | ||||||||
| |
(in thousands) |
||||||||||
Interest expense |
$ | 19,868 | $ | 19,937 | $ | 23,694 | |||||
Amortization of capitalized loan origination fees |
1,807 | 1,325 | 1,048 | ||||||||
Stock-based compensation expense |
12,368 | 11,815 | 9,518 | ||||||||
Other parent company expenses, net revenues |
32,368 | 28,425 | 3,689 | ||||||||
Net income—Senior Administrative Services |
(714 | ) | (8,486 | ) | (22,020 | ) | |||||
Segment loss before income taxes |
$ | 65,697 | $ | 53,016 | $ | 15,929 | |||||
The sale of CHCS during the second quarter of 2010 (for further discussion, see "Sale of CHCS" in Note 24 in the Notes to Consolidated Financial Statements), eliminated substantially all of the business operations of our former Senior Administrative Services segment. As a result, beginning with the June 30, 2010 quarterly report on Form 10-Q, we began to report current and historical results of
87
the former Senior Administrative Services and Corporate segments in one segment called Corporate & Other.
Years ended December 31, 2010 and 2009
The loss before income taxes from our Corporate & Other segment increased by $12.7 million, or 24%, for the year ended December 31, 2010 compared to 2009. This was primarily due to the $7.8 million decline in net income—Senior Administrative Services as a result of the sale of CHCS effective April 1, 2010. In addition, we recorded $4.0 million of expenses related to the Part D transaction. During 2010 and 2009 we recorded charges related to the realignment of our distribution channels amounting to $15.0 million and $13.6 million, respectively.
Amortization of capitalized loan origination fees was $0.5 million higher in 2010, compared with the same period in 2009 due to additional amortization related to the costs associated with the amendment of our credit facility in July 2010 and November 2009.
The increase in stock-based compensation expense of $0.6 million resulted primarily from new equity awards granted in the last quarter of 2009 and the first three quarters of 2010 to directors, officers and other employees approved by the compensation committee, partially offset by a $2.0 million true up of our forfeiture rate estimate related to options that terminate non-vested that was made during 2010.
Other parent company expenses, net of revenues, increased $3.9 million. This was driven by $4.0 million of legal and consulting costs incurred in 2010 in connection with the recently announced sale of the Part D business and a $15 million charge in 2010 related to realignment of our distribution channels in response to the impact of the CMS sanctions restricting our ability to sell Medicare Advantage business, compared with a $13.6 million charge in 2009 for under-performing field offices.
Net income—Senior Administrative Services declined by $7.8 million. $5.7 million was the result of the sale of CHCS which was effective April 1, 2010. The remaining $2.1 million variance was due to lower profitability of CHCS prior to its sale, due to anticipated reductions in service fee revenues, along with a corresponding decrease in general expenses.
Years ended December 31, 2009 and 2008
The loss before income taxes from our Corporate & Other segment increased by $37.1 million for the year ended December 31, 2009 compared to 2008. This was due primarily to a $13.6 million charge related to the proposed closing and restructuring of certain career sales offices in 2009, $13.5 million lower profitability of the former Senior Administrative Services segment, a significant non-recurring release of a bonus accrual in the first quarter of 2008, higher stock-based compensation costs for equity awards to employees and directors, higher levels of expense and lower net investment income, partially offset by lower borrowing costs.
The decrease in interest expense of $3.8 million is due primarily to a reduction in the interest rates charged on the debt, as compared to 2008. The weighted average interest rate on our loan payable was 4.0% for 2009 compared to 4.6% for 2008. The weighted average interest rate on our other long-term debt was 6.2% for 2009 compared to 7.4% for 2008. See "Liquidity and Capital Resources" for additional information regarding our loan payable and other long-term debt.
The increase in stock-based compensation expense of $2.3 million resulted primarily from new equity awards granted in the last quarter of 2008 and the first nine months of 2009, to directors, officers and other employees approved by the compensation committee.
Other parent company expenses, net of revenues, increased $24.7 million. In 2009, primarily in relation to a management decision to close or restructure under-performing field offices in connection
88
with a company-wide cost reduction effort, we recorded a $13.6 million charge to earnings. The remaining variance was primarily due to the release in the first quarter of 2008 of a 2007 bonus accrual that was $5.6 million in excess of the final amounts approved by the compensation committee and paid in 2008, compared with a $0.5 million release for similar reasons in the first quarter of 2009 as well as increased staffing and outside service costs. In addition, net investment income decreased $2.7 million as a result of lower invested assets at a lower rate.
Net income—Senior Administrative Services declined by $13.5 million, or 62%, to $8.5 million for the year ended December 31, 2009, as compared to 2008. This decrease is primarily the result of a reduction in service fee revenues, net of a corresponding decrease in general expenses, driven by the loss of fee income associated with the administration of our Part D business that is performed directly by the affiliated entities in 2009 as well as a reduction in fee levels and lower policies in-force for our affiliated Medicare supplement business, partially offset by growth in revenues on services performed for affiliated long-term care and life insurance business.
Contractual Obligations and Commercial Commitments
Our contractual obligations as of December 31, 2010, are shown below.
| |
Payments Due by Period | |||||||||||||||||
|---|---|---|---|---|---|---|---|---|---|---|---|---|---|---|---|---|---|---|
Contractual Obligations
|
Total | 2011 | 2012–2013 | 2014–2015 | Thereafter | |||||||||||||
| |
(in thousands) |
|||||||||||||||||
Long-Term Debt Obligations(1): |
||||||||||||||||||
Trust preferred securities(2) |
$ | 214,297 | $ | 6,446 | $ | 11,154 | $ | 8,257 | $ | 188,440 | ||||||||
Loan payable(3) |
254,102 | 14,927 | 239,175 | — | — | |||||||||||||
Operating Lease Obligations |
27,490 | 6,118 | 10,576 | 7,953 | 2,843 | |||||||||||||
Purchase Obligations(4) |
142,754 | 26,239 | 57,599 | 58,916 | — | |||||||||||||
Policy Related Liabilities(5): |
||||||||||||||||||
Reserves and other policy liabilities—life |
14,331 | 2,009 | 1,368 | 1,139 | 9,815 | |||||||||||||
Reserve for future policy benefits—health |
496,610 | 23,116 | 44,518 | 42,327 | 386,649 | |||||||||||||
Policy and contract claims—health |
360,745 | 324,183 | 36,562 | — | — | |||||||||||||
Total |
$ | 1,510,329 | $ | 403,038 | $ | 400,952 | $ | 118,592 | $ | 587,747 | ||||||||
- (1)
- These
obligations include contractual interest and the table reflects scheduled maturities for contractual obligations existing as of December 31,
2010.
- (2)
- Trust
preferred securities all have scheduled maturities of 30 years from the dates of issue; however they are all callable by us five years from the
date of issuance. For the purpose of this schedule, we have assumed that the securities will be redeemed at their scheduled maturities, not the call date. Accordingly, the obligation for repayment of
principal relating to these is included in the More than 5 Years column. The trust preferred securities generally have floating rate interest rates. However, the interest rate on $50 million of
the trust preferred securities is fixed through its no call period and then converts to a floating rate. We did not project future changes in the base interest rates. For the purpose of this schedule,
we applied the base rate in effect at December 31, 2010 to all future periods. Additionally, we assumed that, upon the expiration of the fixed rate, the rate for the respective trust preferred
security adjusted to a variable rate using the current base rate.
- (3)
- Reflects scheduled amortization through final maturity in 2012. The loan payable is floating rate debt, although we pay a fixed rate on $250 million through the use of swap agreements. We did not project future changes in the base interest rates. For the purpose of this schedule, we applied the rate in effect at December 31, 2010 to all future periods.
89
- (4)
- Reflects
minimum obligations on our outsourcing contracts, See "Outsourcing Arrangements" in Part 1, Item 1 of this annual report on
Form 10-K. The amount of service provided under the contracts and the levels of business processed affect our actual monthly payments. Currently, our actual payments exceed the
minimums stated in the contracts. Therefore our actual payments will exceed the amounts presented in the above schedule based upon anticipated future service levels.
- (5)
- Our obligations for policy related liabilities represent those payments we expect to make on death, disability and health insurance claims and policy surrenders, net of amounts recovered from reinsurers. These projected values contain assumptions for future policy persistency, mortality and morbidity comparable with our historical experience. The distribution of payments for policy and contract claims reflects assumptions as to the timing of policyholders reporting claims for prior periods and the amounts of those claims. Actual amounts and timing of both future policy benefits and policy and contract claims may differ significantly from the estimates above. We anticipate that our reserves for policy liabilities and policy and contract claims, along with future net premiums, investment income and recoveries from our reinsurers, will be sufficient to fund our policy related obligations. On our consolidated balance sheets in Part II, Item 8 of this annual report on Form 10-K, we report our policy related liabilities gross of amounts recoverable from reinsurers, which are reported as assets. We are obligated to pay claims in the event that a reinsurer fails to meet its obligations under the reinsurance agreements. However, as of December 31, 2010, all of our primary reinsurers were rated "A-" (Excellent) or better by A.M. Best with the exception of one reinsurer. For that reinsurer, which is not rated, a trust containing assets at 106% of policy reserve levels is maintained. We are not aware of any instances where any of our reinsurers have been unable to pay any policy claims on reinsured business. Therefore, we have presented our obligations in the table above net of amounts recoverable from reinsurers. Our obligations for policy related liabilities before amounts recovered from reinsurers amount to $1.8 billion.
Liquidity and Capital Resources
Sources and Uses of Liquidity to the Parent Company, Universal American Corp.
We require cash at our parent company to support the growth of our insurance and HMO subsidiaries, meet our obligations under our credit facility, fund potential growth through acquisitions of other companies or blocks of business, and pay the operating expenses necessary to function as a holding company, as applicable insurance department regulations require us to bear our own expenses.
The parent company's sources and uses of liquidity are derived primarily from the following:
- •
- dividends and surplus note payments from and capital contributions to our insurance and HMO subsidiaries;
- •
- dividends from the cash flows of our other subsidiaries, including our HMO third-party administrator and our PBM
subsidiary;
- •
- debt principal and interest payments and access to $150 million under the revolving portion of our Credit Facility;
- •
- payment of dividends to shareholders; and
- •
- share repurchases.
Insurance and HMO subsidiaries—Surplus Note, Dividends and Capital Contributions. We require cash at our insurance and HMO subsidiaries to meet our policy-related obligations and to pay operating expenses, including the cost of administration of the policies, and to maintain adequate capital levels. Excess capital can be used by the insurance and HMO subsidiaries to make dividend payments to their respective holding companies, subject to certain restrictions, and from there to our parent company.
90
Our insurance subsidiaries are required to maintain minimum amounts of statutory capital and surplus as required by regulatory authorities and each currently exceeds its respective minimum requirement at levels we believe are sufficient to support their current levels of operation. Our HMO subsidiaries are also required by regulatory authorities to maintain minimum amounts of capital and surplus and each currently exceeds this minimum requirement.
At December 31, 2010, we held cash and cash equivalents and fixed maturity securities that could readily be converted to cash totaling $1.4 billion at our insurance companies and HMO subsidiaries. We believe that this level of liquidity is sufficient to meet our policy obligations and pay expenses.
In 2007, our wholly-owned subsidiary, The Pyramid Life Insurance Company issued $60.0 million of surplus notes payable to our parent company, which bear interest at an average fixed rate of 7.5%. The Notes are repayable beginning March 29, 2009 provided that capital and surplus are sufficient to maintain risk-based capital levels of 450% or greater in the immediate prior year end. At December 31, 2010, Pyramid's risk-based capital ratio was below 450%, and therefore no payments of principal or interest have been made or accrued to date.
Capital contributions to and dividends from our insurance subsidiaries are made through our holding company, UAC Holding, Inc. ("UACH"). UACH did not make capital contributions to the insurance subsidiaries during 2010. In May 2010, two of our wholly-owned subsidiaries, Pennsylvania Life Insurance Company and American Progressive Life & Health Insurance Company of New York, declared and paid to UACH a dividend of $119 million and $12 million, respectively. We used these dividends and other cash to pay a special cash dividend to our shareholders, and pay down debt in August 2010. (see "Special Dividend" in Note 24—Other Operational Disclosures in the Notes to Consolidated Financial Statements).
Capital contributions to and dividends from our HMO subsidiaries are made through our managed care holding company, Heritage Health Systems, Inc.("HHSI"). During 2010, HHSI made capital contributions totaling of $75,000 to SelectCare of Oklahoma, Inc., $2.7 million to Global Health, Inc. and $6.0 million to SelectCare HealthPlans, Inc. No dividends were declared by or paid to HHSI from its HMO subsidiaries during 2010.
PBM and HMO third-party administrator cash flows. The primary sources of liquidity for these subsidiaries are fees collected from clients, including our insurance and HMO subsidiaries, for performing administrative, marketing and management services. The primary uses of liquidity are the payments for salaries and expenses associated with providing these services. We believe the sources of cash for these subsidiaries will exceed scheduled uses of cash and result in amounts available to dividend to our parent holding company. In December, 2010, our PBM and HMO third party administrators paid dividends to our parent holding company of $12.3 million and $20.0 million, respectively.
Debt principal and interest—Credit Facility, Swaps and Other Long-Term Debt. We currently have a credit facility consisting of a $350 million term loan and a $150 million revolver (the "2007 Credit Facility"). This credit facility has customary covenants and requirements including a leverage ratio test, minimum risk based capital requirements for our insurance companies and, under certain conditions, the ability to pose limitations on certain investments, dispositions and our ability to make restricted payments. We are in compliance with all covenants in the Credit Agreement.
In November 2009, we amended the 2007 Credit Facility (the "November 2009 Amendment") which provided us with the ability to make $75 million of restricted payments, in addition to the $125 million provided for in the original agreement for a total of $200 million, in exchange for prepayments of Term Loan principal and increases in borrowing spreads and fees. In July 2010, we further amended the 2007 Credit Facility (the "July 2010 Amendment") which provided us with the ability to make an additional $100 million of restricted payments, for a total of $300 million, in
91
exchange for prepayments of Term Loan principal and increases in borrowing spreads. In August 2010, we announced and paid a special cash dividend totaling $156 million and, per the terms of the July 2010 Amendment, made prepayments of term loan principal of $78.1 million. As of December 31, 2010, $232.9 million was outstanding under the term loan agreement and the weighted average interest rate on the term loan portion of the credit facility was 1.41%. All $232.9 million of the term loan outstanding has been swapped from a LIBOR-based floating rate to an average fixed rate of 4.14% (see Note 15—Derivative Instruments—Interest Rate Swaps in Notes to Consolidated Financial Statements and the ensuing paragraph), resulting in a total blended interest rate of 5.26% as of December 31, 2010. We pay a commitment fee on the unutilized revolving loan facility at an annualized rate of 25 basis points. We had not drawn on the revolving loan facility as of the date of this report. We made regularly scheduled principal payments totaling $2.8 million, and interest payments totaling $4.0 million during 2010.
On December 4, 2007, we entered into two separate interest rate swap agreements on a total notional amount of $250 million, where we pay an average locked-in fixed rate of 4.14% and receive a floating rate based on LIBOR. During 2010, we paid a net amount of $9.6 million in association with these swap agreements. Due primarily to the $78 million debt prepayment made in the third quarter of 2010 discussed above, the outstanding principal balance on the hedged Credit Facility was reduced to $232.9 million at December 31, 2010; $17.1 million lower than the $250 million notional amounts on the swaps. As a result, this portion of the swaps was deemed ineffective and the notional amount on one of the swaps was decreased by $17.1 million to $107.9 million, which resulted in a realized loss of $1.3 million. In addition, we evaluated the likelihood of additional debt paydowns prior to the scheduled maturity of the Credit Facility and the related interest rate swaps in September 2012, and identified an additional $4.5 million of the swaps that would be considered ineffective as hedges. As a result, we realized an additional loss of $0.3 million on this ineffective portion of the swap, resulting in total realized losses on the cash flow hedge of $1.6 million in 2010. No other terms of the swaps were changed.
In 2003 and 2007, we formed statutory business trusts, in order to issue a combined $125.0 million in thirty year trust preferred securities, with $110 million currently outstanding. $60 million of these securities have floating interest rates based on LIBOR and are currently at an average rate of 4.35%. The remaining $50 million is fixed at 7.68% until March 2012. We made interest payments on the trust preferred securities totaling $6.5 million during 2010.
Investments
We invest primarily in fixed maturity securities of the U.S. Government and its agencies, mortgage-backed and other high quality asset-backed securities, fixed maturity securities issued by state and local municipalities, and in corporate fixed maturity securities with investment grade ratings of BBB- or higher by S&P or Baa3 or higher by Moody's Investor Service. As of December 31, 2010, approximately 99% of our fixed maturity investments had investment grade ratings from S&P or Moody's.
In 2010, we began investing our cash in longer duration securities, including corporate bonds, asset-backed securities, municipal securities, and in non-Government short term investments. As a result, as of December 31, 2010, approximately 10% of our portfolio is in cash equivalents, of which approximately 6% is invested in U.S. government short term securities, as compared with 47% in cash equivalents at December 31, 2009. In the aggregate, approximately 26% of our cash and invested assets are in securities backed by the U.S. government or its agencies, as compared with 82% at December 31, 2009. The aggregate credit quality of our total investment portfolio was AA- at December 31, 2010 compared with AA at December 31, 2009.
The net yields on our cash and invested assets decreased to 2.6% for 2010, from 2.9% for 2009. The overall drop in yield for the year ended December 31, 2010, compared with the same period in
92
2009 is primarily due to a drop in the yield on our fixed maturity portfolio after our de-risking efforts that commenced in the second quarter of 2009 and ongoing prepayments on our higher yielding RMBS portfolio due to the low interest rate environment, coupled with a continued drop in yield on our short-term portfolio. However, as a result of the repositioning of our portfolio during the latter part of 2010 as discussed above, our overall portfolio yield increased to 3.26% at December 31, 2010 from 2.48% at December 31, 2009.
Critical Accounting Policies
Our consolidated financial statements have been prepared in accordance with U.S. Generally Accepted Accounting Principles, known as GAAP. The preparation of our financial statements in conformity with GAAP requires us to make estimates and assumptions that affect the amounts of reported by us in our consolidated financial statements and the accompanying notes. Critical accounting policies are ones that require significant subjective or complex judgments, often as a result of the need to make estimates about the effect of matters that are inherently uncertain. These estimates are based on information available at the time the estimates are made, as well as anticipated future events. Actual results could differ materially from these estimates. We periodically evaluate our estimates, and as additional information becomes available or actual amounts become determinable, we may revise the recorded estimates and reflect them in operating results. We believe that the following accounting policies are critical, as they involve the most significant judgments and estimates used in the preparation of our consolidated financial statements:
- •
- policy-related liabilities and benefit expense recognition,
- •
- deferred policy acquisition costs,
- •
- goodwill and other intangible assets,
- •
- investment valuation,
- •
- recognition of premium revenues and policy benefits—Medicare products and
- •
- income taxes.
Policy-related liabilities and benefit expense recognition
We calculate and maintain reserves for the estimated future payment of claims to our policyholders using actuarial assumptions that are consistent with actuarial assumptions we use in the pricing of our products. For our accident and health insurance business, we establish an active life reserve for expected future policy benefits, plus a liability for due and unpaid claims and incurred but not reported claims, known as IBNR. Benefit expenses are recognized in the period in which services are provided or claims are incurred and include an estimate of the cost of services and IBNR claims. Our net income depends upon the extent to which our actual claims experience is consistent with the assumptions we used in setting our reserves and pricing our policies. If our assumptions with respect to future claims are incorrect, and our reserves are insufficient to cover our actual losses and expenses, we would be required to increase our liabilities, resulting in reduced net income and stockholders' equity.
93
The following table presents a summary of our policy-related liabilities by category (dollars in thousands):
| |
Direct & Assumed | Net of Reserves Ceded to Reinsurers |
|||||||||||||||||
|---|---|---|---|---|---|---|---|---|---|---|---|---|---|---|---|---|---|---|---|
Liability Type
|
2010 | % of Total Policy Liabilities |
2009 | % of Total Policy Liabilities |
2010 | 2009 | |||||||||||||
Reserves and other policy liabilities—life |
$ | 582,248 | 43 | % | $ | 599,442 | 43 | % | $ | 9,739 | $ | 4,295 | |||||||
Reserves for future policy benefits—health |
407,312 | 30 | % | 408,625 | 30 | % | 298,271 | 301,579 | |||||||||||
Policy and contract claims—health |
374,539 | 27 | % | 380,519 | 27 | % | 360,202 | 362,596 | |||||||||||
Total policy liabilities |
$ | 1,364,099 | 100 | % | $ | 1,388,586 | 100 | % | $ | 668,212 | $ | 668,470 | |||||||
Reserves and other policy liabilities—life
Reserves and other policy liabilities—life represents the gross amount of liabilities on our life insurance business, including policyholder account balances on our investment and universal life-type policies, future policy benefit reserves on our traditional life insurance policies and policy and contract claims on our life policies. Beginning in April, 2009, we reinsured substantially all of our in force life insurance and annuity business under a 100% coinsurance treaty. A portion of our traditional business was not included in that reinsurance transaction, however much of that business is reinsured under separate treaties. We continue to sell traditional life products, primarily senior life.
Policyholder account balances represent the balance that accrues to the benefit of the policyholder, otherwise known as the account value, as of the financial statement date. Account values increase to reflect additional deposits received and interest credited based on the account value. Account values decline to reflect surrenders and other withdrawals, including withdrawals relating to the cost of insurance and expense charges. We review the interest crediting rates periodically and adjust them with minimum levels below which the crediting rate cannot fall as we deem necessary. The liability for future policy benefits represents the present value of estimated future benefits to be paid to or on behalf of policyholders, less the future value of net premiums. We calculate this amount based on actuarially recognized methods using morbidity and mortality tables, which we modify to reflect our actual experience when appropriate. The liability for unpaid claims, which also reflects IBNR, reflects estimates of amounts to fully settle known reported claims as well as claims related to insured events that we estimate have been incurred, but have not yet been reported to us.
Our net retained reserves for life insurance products were $9.7 million, or 2% of our direct and assumed reserves for life insurance product, as of December 31, 2010. Our net retained reserves for life insurance products were $4.3 million, or 1% of our direct and assumed reserves for life insurance products as of December 31, 2009.
Reserves for future policy benefits—health
Reserves for future policy benefits—health represents the present value of estimated future benefits to be paid to or on behalf of policyholders, less the future value of net premiums. We calculate this amount based on actuarially recognized methods using morbidity and mortality tables, which we modify to reflect our actual experience when appropriate.
For our fixed benefit accident and sickness and our long-term care products, we establish a reserve for future policy benefits at the time we issue each policy based on the present value of future benefit payments less the present value of future premiums. We have ceased issuing new long-term care policies, although our current policies are renewable annually at the discretion of the policyholder, as
94
evidenced by the policyholder continuing to make premium payments. In establishing these reserves, we must evaluate assumptions about mortality, morbidity, lapse rates and the rate at which new claims are submitted to us. We estimate the future policy benefits reserve for these products using the above assumptions and actuarial principles. For long-duration insurance contracts, we use these original assumptions throughout the life of the policy and generally do not subsequently modify them.
A portion of our reserves for long-term care products also reflect our estimates relating to members currently receiving benefits. We estimate these reserves primarily using recovery and mortality rates, as described above.
Policy and contract claims—health
The policy and contract claims liability for our health policies include a liability for unpaid claims, including claims in the course of settlement, as well as a liability for IBNR claims. Our liability for policy and contract claims—health by major product grouping is as follows:
| |
Carrying Value at December 31, | ||||||||||||||||||
|---|---|---|---|---|---|---|---|---|---|---|---|---|---|---|---|---|---|---|---|
| |
Direct and Assumed | Net of Reserves Ceded to Reinsurers | |||||||||||||||||
Policy and contract claims—health
|
2010 | % of Total Policy Liabilities |
2009 | % of Total Policy Liabilities |
2010 | 2009 | |||||||||||||
| |
($ in thousands) |
||||||||||||||||||
Medicare Part D |
$ | 68,149 | 5 | % | $ | 91,027 | 6 | % | $ | 67,488 | $ | 86,086 | |||||||
Medicare Advantage—PFFS & PPO |
186,611 | 14 | % | 174,227 | 13 | % | 186,528 | 174,197 | |||||||||||
Medicare Advantage—HMO |
76,230 | 6 | % | 64,693 | 5 | % | 70,419 | 61,663 | |||||||||||
Medicare supplement |
22,545 | 1 | % | 30,763 | 2 | % | 17,805 | 23,517 | |||||||||||
Other—specialty |
21,004 | 1 | % | 19,809 | 1 | % | 17,962 | 17,133 | |||||||||||
Total policy and contract claims—health |
$ | 374,539 | 27 | % | $ | 380,519 | 27 | % | $ | 360,202 | $ | 362,596 | |||||||
The following factors can affect these reserves and liabilities:
- •
- economic and social conditions,
- •
- inflation,
- •
- hospital and pharmaceutical costs,
- •
- changes in doctrines of legal liability,
- •
- premium rate increases,
- •
- extra-contractual damage awards, and
- •
- other factors affecting health care and insurance generally.
Therefore, we establish the reserves and liabilities based on extensive estimates, assumptions and prior years' statistics. When we acquire other insurance companies or blocks of insurance, our assessment of the adequacy of acquired policy liabilities is subject to similar estimates and assumptions. Establishing reserves involves inherent uncertainties, and it is possible that actual claims could materially exceed our reserves and have a material adverse effect on our results of operations and financial condition.
We develop our estimate for IBNR using actuarial methodologies and assumptions, primarily based upon historical claim payment and claim receipt patterns, as well as historical medical cost trends. Depending on the period for which we are estimating incurred claims, we apply a different method in determining our estimate. For periods prior to the most recent three months, the key assumption we
95
use in estimating our IBNR is that the completion factor pattern, adjusted for known changes in claim inventory levels and claim payment processes, remains consistent over a specified rolling period. This period, ranging from 3 to 12 months, is dependent on the type of business with respect to which we are estimating reserves or liabilities. Completion factors result from the calculation of the percentage of claims incurred during a given period that have historically been adjudicated as of the reporting period. For the most recent three months, we estimate the incurred claims primarily from a trend analysis based upon per member per month, known as PMPM, claims trends developed from our historical experience in the preceding months, adjusted for known changes in estimates of recent hospital and drug utilization data, provider contracting changes, changes in benefit levels, product mix, and seasonality.
We use the completion factor method for the months of incurred claims prior to the most recent three months because the historical percentage of claims processed for those months is at a level sufficient to produce a consistently reliable result. Conversely, for the most recent three months of incurred claims, the volume of claims processed historically is not at a level sufficient to produce a reliable result, which therefore requires that we examine historical trend patterns as the primary method of evaluation. Because cumulative claims payment development often fluctuates widely close to the incurral date of claims, estimates for the most recent three months of incurred claims are based largely on our pricing assumptions for the product. The amounts above reflect the estimated potential medical and other expenses payable based upon assumptions used in determining the loss ratio for the pricing of our PFFS products.
Medical cost trends potentially are more volatile than other segments of the economy. The principal intrinsic drivers of medical cost trends are:
- •
- changes in the utilization of hospital facilities, physician services, prescription drugs, and new medical technologies,
and
- •
- the inflationary effect on the cost per unit of each of these expense components.
Other external factors may impact medical cost trends, such as:
- •
- government-mandated benefits,
- •
- other regulatory changes,
- •
- an aging population,
- •
- natural disasters and other catastrophes, and
- •
- epidemics.
Factors internal to our company may also affect our ability to accurately predict estimates of historical completion factors or medical cost trends, such as:
- •
- claims processing cycle times,
- •
- changes in medical management practices, and
- •
- changes in provider contracts.
We consider all of these factors in estimating IBNR and in estimating the PMPM claims trend for purposes of determining the reserve for the most recent three months. Additionally, we continually prepare and review follow-up studies to assess the reasonableness of the estimates generated by our process and methods over time. We also consider the results of these studies in determining the reserve for the most recent three months. Each of these factors requires significant judgment by management.
96
The following table presents the components of the change in our liability for policy and contract claims—health:
| |
For The Years Ended December 31, | |||||||
|---|---|---|---|---|---|---|---|---|
| |
2010 | 2009 | ||||||
| |
(in thousands) |
|||||||
Balance at beginning of year |
$ | 380,519 | $ | 500,577 | ||||
Less reinsurance recoverable |
(17,923 | ) | (33,086 | ) | ||||
Net balance at beginning of year |
362,596 | 467,491 | ||||||
Incurred related to: |
||||||||
Current year |
4,656,183 | 3,979,830 | ||||||
Prior year development |
(1,069 | ) | 3,603 | |||||
Total incurred |
4,655,114 | 3,983,433 | ||||||
Paid related to: |
||||||||
Current year |
4,328,061 | 3,640,970 | ||||||
Prior year |
329,447 | 447,358 | ||||||
Total paid |
4,657,508 | 4,088,328 | ||||||
Net balance at end of period |
360,202 | 362,596 | ||||||
Plus reinsurance recoverable |
14,337 | 17,923 | ||||||
Balance at end of year |
$ | 374,539 | $ | 380,519 | ||||
The medical cost amount, noted as "prior year development" in the table above, represents (favorable) or unfavorable adjustments as a result of prior year claim estimates being settled for amounts that are different than originally anticipated. This prior year development occurs due to differences between the actual medical utilization and other components of medical cost trends, and actual claim processing and payment patterns compared to the assumptions for claims trend and completion factors used to estimate our claim liabilities.
The claim reserve balances at December 31, 2009 settled during 2010 for $1.1 million less than originally estimated, representing less than 0.1% of the incurred claims recorded in 2009.
The claim reserve balances at December 31, 2008 settled during 2009 for $3.6 million more than originally estimated, representing less than 0.1% of the incurred claims recorded in 2008.
Sensitivity Analysis
The following table illustrates the sensitivity of our health IBNR payable at December 31, 2010 to identified reasonably possible changes to the estimated weighted average completion factors and health care cost trend rates. However, it is possible that the actual completion factors and health care cost
97
trend rates will develop differently from our historical patterns and therefore could be outside of the ranges illustrated below.
| Completion Factor(1): | Claims Trend Factor(2): | |||||||||||
|---|---|---|---|---|---|---|---|---|---|---|---|---|
(Decrease) Increase in Factor |
Increase (Decrease) in Net Health IBNR |
(Decrease) Increase in Factor |
(Decrease) Increase in Net Health IBNR |
|||||||||
| ($ in thousands) |
||||||||||||
| (3 | )% | $ | 1,203 | (3 | )% | $ | (15,904 | ) | ||||
| (2 | )% | 802 | (2 | )% | (10,603 | ) | ||||||
| (1 | )% | 401 | (1 | )% | (5,301 | ) | ||||||
| 1 | % | (401 | ) | 1 | % | 5,301 | ||||||
| 2 | % | (801 | ) | 2 | % | 10,603 | ||||||
| 3 | % | (1,202 | ) | 3 | % | 15,904 | ||||||
- (1)
- Reflects
estimated potential changes in medical and other expenses payable, caused by changes in completion factors for incurred months prior to the most
recent three months.
- (2)
- Reflects estimated potential changes in medical and other expenses payable, caused by changes in annualized claims trend used for the estimation of per member per month incurred claims for the most recent three months.
Deferred Policy Acquisition Costs
We defer the following costs of acquiring new business:
- •
- non-level commissions,
- •
- agency production costs,
- •
- policy underwriting costs,
- •
- policy issue costs,
- •
- associated issuance costs, and
- •
- other costs that vary with, and are primarily related to, the production of new and renewal business.
We refer to these costs as deferred acquisition costs or DAC. For our net retained traditional life and health products, we amortize DAC in proportion to premium revenue using the same assumptions used in estimating the liabilities for future policy benefits in accordance with ASC 944. Under ASC 944, any unamortized DAC relating to lapsed policies must be amortized as of the date of the lapse.
We test for the recoverability of DAC at least annually. To the extent that we determine that the present value of future policy premiums and investment income or the net present value of expected gross profits would not be adequate to recover the unamortized costs, we would write off the excess deferred policy acquisition costs. Based on our review of DAC recoverability as of October 1, 2010, we determined that DAC was recoverable.
98
Goodwill and other intangible assets
Valuation of acquired intangible assets
Business combinations accounted for as a purchase result in the allocation of the purchase consideration to the fair values of the assets and liabilities acquired, including the present value of future profits, establishing these fair values as the new accounting basis. We base the present value of future profits on an estimate of the cash flows of the insurance policies acquired, discounted to reflect the present value of those cash flows. The discount rate we select depends upon the general market conditions at the time of the acquisition and the inherent risk in the transaction. We allocate purchase consideration in excess of the fair value of net assets acquired, including the present value of future profits and other identified intangibles, for a specific acquisition, to goodwill. We perform the allocation of purchase price in the period in which we consummate the purchase. Adjustments, if any, made within a twelve-month period of the business combination, generally relate to resolution of pre-acquisition contingencies, tax matters and refinements made to estimates of fair value in connection with the preliminary allocation.
Amortizing intangible assets
We must estimate and make assumptions regarding the useful life we assign to our amortizing intangible assets. Set forth below are our annual amortization policies for each of the main categories of amortizing intangible assets:
Description
|
Weighted Average Life At Acquisition |
Amortization Basis | |||
|---|---|---|---|---|---|
Insurance policies acquired |
9 | The pattern of projected future cash flows for the policies acquired over the estimated weighted average life of the policies acquired | |||
Distribution channel acquired |
3–30 | Straight line over the estimated life of the asset | |||
Membership base acquired |
7–10 | Straight line over the estimated weighed average life of the membership base | |||
Trademarks/tradenames |
9 | Straight line over the estimated weighted average life of the trademarks/tradenames | |||
Licenses |
15 | Straight line over the estimated weighed average life of the licenses | |||
Provider contracts |
10 | Straight line over the estimated weighted average life of the contracts | |||
Non-compete |
7 | Straight line over the length of the agreement | |||
In accordance with ASC 350, Intangibles and Other, we periodically review amortizing intangible assets whenever adverse events or changes in circumstances indicate the carrying value of the asset may not be recoverable. In assessing recoverability, we must make assumptions regarding estimated future cash flows and other factors to determine if an impairment loss may exist, and, if so, estimate fair value. If these estimates or their related assumptions change in the future, we may be required to record impairment losses for these assets. Based on our review of recoverability, we determined there were no impairments of our amortizing intangible assets during 2010, 2009 or 2008.
Goodwill
ASC 350, Goodwill and Other Intangible Assets, requires that goodwill balances be reviewed for impairment at the reporting unit level at least annually or more frequently if events occur or
99
circumstances change that would indicate that a triggering event, as defined in ASC 350, has occurred. A reporting unit is defined as an operating segment or one level below an operating segment. Our reporting units are equivalent to our operating segments. We had goodwill allocated to the following reporting units as follows (in thousands):
| |
December 31, | |||||||
|---|---|---|---|---|---|---|---|---|
| |
2010 | 2009 | ||||||
Senior Managed Care—Medicare Advantage |
$ | 77,459 | $ | 77,459 | ||||
Medicare Part D |
448,215 | 448,215 | ||||||
Corporate & Other |
— | 4,357 | ||||||
Total Goodwill |
$ | 525,674 | $ | 530,031 | ||||
Our annual goodwill impairment test follows a two step process as defined in ASC 350. In the first step, the fair value of a reporting unit is compared to its carrying value. If the carrying value of a reporting unit exceeds its fair value, the second step of the impairment test is performed for purposes of measuring the impairment. In the second step, the fair value of the reporting unit is allocated to all of the assets and liabilities of the reporting unit to determine an implied goodwill value. This allocation is similar to a purchase price allocation performed in purchase accounting. If the carrying amount of the reporting unit goodwill exceeds the implied goodwill value, an impairment loss shall be recognized in an amount equal to that excess.
Our strategy, long-range business plan, and annual planning process are used to support our valuation of our reporting units. Our valuations are based primarily on an analysis of discounted cash flows for each reporting unit. Outcomes from the discounted cash flow analysis are compared to other market approach valuation methodologies for reasonableness. Key assumptions, including changes in membership, premium yields, medical cost trends and selected government contract extensions, are consistent with those utilized in our long-range business plan and annual planning process. Other assumptions include levels of economic capital, future business growth, earnings projections and the weighted average cost of capital used for purposes of discounting. We use a range of discount rates that correspond to a market-based weighted-average cost of capital. Decreases in business growth, decreases in earnings projections, increases in the weighted average cost of capital and increases in the amount of required capital for a reporting unit will all cause the reporting unit's fair value to decrease. If these assumptions differ from actual, the estimates underlying our goodwill impairment tests could be adversely affected. These assumptions can be impacted by general factors, including: the U.S healthcare economy, health care reform and federal monetary policy.
We operate a diversified set of health care businesses focused on the senior market. Our business model has been designed to address a multitude of market sectors. Our businesses participate in the U.S. health care economy, which comprises a significant portion of the gross domestic product and which has grown consistently for many years. We expect overall spending on health care in the U.S. to continue to rise in the future, due to inflation, medical technology and pharmaceutical advancement, demographic trends in the U.S. population and national interest in health and well-being. The rate of market growth may be affected by a variety of factors, including macro-economic conditions and enacted health care reforms, which could also impact our results of operations.
In the first quarter of 2010, the Health Reform Legislation was signed into law. HHS, the DOL and the Treasury Department have issued regulations (or proposed regulations) on a number of aspects of Health Reform Legislation, but we await final rules and interim guidance on other key aspects of the legislation, all of which have a variety of effective dates. The Health Reform Legislation and the related federal and state regulations establishes minimum medical loss ratios for health plans with fully insured products, mandates consumer discounts on brand name and generic prescription drugs for seniors in the coverage gap, freezes or reduces Medicare payment rates, and establishes an annual
100
$8 billion assessment on the health insurance industry beginning in 2014. These changes will impact how we do business and could restrict growth in certain products and market segments, restrict premium rate increases for certain products and market segments, increase our medical and administrative costs or expose us to an increased risk of liability, any or all of which could have a material adverse effect on us. We also anticipate that the Health Reform Legislation will further increase attention on the need for health care cost containment and improvements in quality, as well as in prevention, wellness and disease management.
Our revenues are also impacted by U.S. monetary and fiscal policy as it effects interest rates, which impacts the interest income earned on our investments and therefore our operating profitability. In response to current economic conditions, the U.S. Federal Reserve has maintained the target federal funds rate to a range of zero to 25 basis points. If the current economic environment continues for a prolonged period, the funding for various health care government programs in which we participate may be decreased or we may be subject to new or higher taxes or assessments. Government funding pressure, coupled with recessionary economic conditions, will impact the financial positions of hospitals, physicians and other care providers and could therefore increase medical cost trends experienced by our businesses.
It is difficult to predict the outcome of the Health Reform Legislation, pending the final rules and interim guidance on key aspects of the legislation. For additional discussions regarding our risks related to health care reforms, economic conditions and related risk factors, see "Item 1A. Risk Factors" in Part I of this Annual Report on Form 10-K.
We performed our annual goodwill assessment for our individual reporting units as of October 1, 2010. Based on this "Step 1" assessment, we determined, that our estimated fair value of our Part D reporting unit was in excess of its carrying value by 42% and that our estimated fair value of our Senior Managed Care reporting unit was in excess of its carrying value by 10%. The fair value for our Traditional reporting unit was below its GAAP equity based on our analysis for the purpose of goodwill recoverability. We do not have any goodwill recorded in our Traditional reporting unit, however, this deficiency could indicate DAC recoverability or premium deficiency issues. These are both tested separately on an annual basis and for 2010, the tests of both demonstrated sufficiency. We had reduced the goodwill for that segment to zero at December 31, 2008 as a result of 2008 annual test of recoverability. During the 2008 test, we concluded that the decline in value of the traditional reporting unit was due to decreasing sales outlooks and the lapsation of Medicare supplement policies. As a result, we performed a "Step 2" analysis of the Traditional reporting unit to determine the amount of impairment. The allocation of the fair value of the Traditional reporting unit to its respective assets and liabilities as of October 1, 2008 indicated an implied level of goodwill of $0. Therefore, at December 31, 2008, we recorded an impairment charge of $3.9 million to eliminate all of the goodwill for the Traditional reporting unit.
During each quarter, we perform a review of certain key components of our valuation of our reporting units, including the operating performance of the reporting units compared to plan (which was the primary basis for the prospective financial information included in our goodwill impairment test as of October 1, 2010), our weighted average cost of capital and our stock price and market capitalization. Based on our review of these items through the reporting date, we believe that our estimate of fair value for each of our reporting units remains reasonable.
Investment Valuation
The fair value for fixed maturity securities is largely determined by third party pricing service market prices. The typical inputs that third party pricing services use are
- •
- reported trades,
101
- •
- benchmark yields,
- •
- issuer spreads,
- •
- bids,
- •
- offers,
- •
- and estimated cash flows and prepayment speeds.
Based on the typical trading volumes and the lack of quoted market prices for fixed maturities, third party pricing services will normally derive the security prices through recent reported trades for identical or similar securities making adjustments through the reporting date based upon available market observable information as outlined above. If there are no recent reported trades, the third party pricing services may use matrix or model processes to develop a security price where they develop future cash flow expectations based upon collateral performance and discount this at an estimated market rate. Included in the pricing for mortgage-backed and asset-backed securities are estimates of the rate of future prepayments of principal over the remaining life of the securities. Such estimates are derived based on the characteristics of the underlying structure and prepayment speeds previously experienced at the interest rate levels projected for the underlying collateral. Actual prepayment experience may vary from these estimates. See Part I, Item 3, Quantitative and Qualitative Disclosures About Market Risk, for a discussion regarding the interest rate sensitivity of our investment portfolio.
ASC 820, Fair Value Measurements and Disclosures, requires companies in the U.S. to classify their assets based on the certainty with which fair values can be calculated into three asset categories: Level 1, Level 2 and Level 3. Level 1 assets are the easiest to value accurately based on standard market-based prices and Level 3 are the most difficult. We have analyzed the third party pricing services valuation methodologies and related inputs, and have also evaluated the various types of securities in our investment portfolio to determine an appropriate fair value hierarchy level based upon trading activity and the observability of market inputs. Based on the results of this evaluation and investment class analysis, we classified most securities that had prices provided by third party pricing services into Level 2 because the inputs used in pricing the securities are market observable.
The following table presents the fair value of fixed maturity securities that are carried at fair value by ASC 820 hierarchy levels, as of December 31, 2010 (in thousands):
| |
Fair Value | % of Total Fair Value |
|||||
|---|---|---|---|---|---|---|---|
Level 1 |
$ | — | — | % | |||
Level 2 |
1,391,260 | 99.5 | % | ||||
Level 3 |
7,238 | 0.5 | % | ||||
|
$ | 1,398,498 | 100.0 | % | |||
The fair value of a financial instrument is the amount at which the instrument could be exchanged in a current transaction between knowledgeable, unrelated willing parties using inputs, including assumptions and estimates, a market participant would utilize. As such, the estimated fair value of a financial instrument may differ significantly from the amount that could be realized if the security was sold immediately.
Due to a general lack of transparency in the process that brokers use to develop prices, we classify most securities that have prices that are based on broker's prices as Level 3. We also classify internal model priced securities, primarily consisting of private placement asset-backed securities, as Level 3 because this model pricing reflects significant non-observable inputs. We classify private placement equity securities as Level 3 due to the lack of observable inputs.
102
The following table presents the fair value of the asset sectors within the ASC 820 Level 3 securities as of December 31, 2010:
| |
December 31, 2010 | ||||||
|---|---|---|---|---|---|---|---|
| |
Fair Value |
% of Total Fair Value |
|||||
| |
(in thousands) |
||||||
Mortgage and asset-backed securities |
$ | 5,923 | 81.8 | % | |||
Corporate debt securities |
1,315 | 18.2 | % | ||||
Total Level 3 securities |
$ | 7,238 | 100.0 | % | |||
Mortgage and asset-backed securities represents private-placement collateralized debt obligations that are thinly traded and priced using an internal model or by independent brokers.
We regularly evaluate the amortized cost of our investments compared to the fair value of those investments. We generally recognize impairments of securities when we consider a decline in fair value below the amortized cost basis to be other-than-temporary. The evaluation includes the intent and ability to hold the security to recovery, and we consider it on an individual security basis, not on a portfolio basis. We generally recognize impairment losses for mortgage-backed and asset-backed securities when an adverse change in the amount or timing of estimated cash flows occurs, unless the adverse change is solely a result of changes in estimated market interest rates. We also recognized impairment losses when we determine declines in fair values based on quoted prices to be other than temporary.
The evaluation of impairment is a quantitative and qualitative process, which is subject to risks and uncertainties and is intended to determine whether we should recognize declines in the fair value of investments in current period earnings. The principal risks and uncertainties are
- •
- changes in general economic conditions,
- •
- the issuer's financial condition or near term recovery prospects,
- •
- the effects of changes in interest rates or credit spreads, and
- •
- the recovery period.
Our accounting policy requires that we assess a decline in the value of a security below its cost or amortized cost basis to determine if the decline is other-than-temporary. During 2009, ASC 320-65-1 modified the criteria for recognition of other-than-temporary impairment (OTTI) of a debt security and we have adopted this new criterion into our accounting policy for investments.
- •
- If we intend to sell a debt security, or it is more likely than not that we will be required to sell the debt security
before recovery of its amortized cost basis, we recognize an OTTI in earnings equal to the entire difference between the debt security's amortized cost basis and its fair value.
- •
- If we do not intend to sell the debt security and it is not more likely than not that we will be required to sell the debt security before recovery of its amortized cost basis, but the present value of the cash flows expected to be collected is less than the amortized cost basis of the debt security (referred to as the credit loss), an OTTI is considered to have occurred. In this instance, we bifurcate the total OTTI into the amount related to the credit loss, which we recognize in earnings, with the remaining amount of the total OTTI attributed to other factors (referred to as the noncredit portion) recognized as a separate component in other comprehensive loss.
After the recognition of an OTTI, we account for the debt security as if it had been purchased on the measurement date of the OTTI, with an amortized cost basis equal to the previous amortized cost basis less the OTTI recognized in earnings.
103
We have a security monitoring process overseen by our Investment Committee, consisting of investment and accounting professionals who identify securities that, due to specified characteristics, as described below, we subject to an enhanced analysis on a quarterly basis. We review our fixed maturity securities at least quarterly to determine if an other-than-temporary impairment is present based on specified quantitative and qualitative factors. The primary factors that we consider in evaluating whether a decline in value is other-than-temporary are:
- •
- the length of time and the extent to which the fair value has been or is expected to be less than cost or amortized cost,
- •
- the financial condition, credit rating and near-term prospects of the issuer,
- •
- whether the debtor is current on contractually obligated interest and principal payments, and
- •
- our intent and ability to retain the investment for a period of time sufficient to allow for recovery.
Each quarter, during this analysis, we assert our intent and ability to retain until recovery those securities we judge to be temporarily impaired. Once identified, we restrict trading on these securities unless approved by members of the Investment Committee. The Investment Committee will only authorize the sale of these securities based on criteria that relate to events that could not have been foreseen. The principal criteria are the deterioration in the issuer's creditworthiness, a change in regulatory requirements or a major business combination or major disposition.
Subprime Residential Mortgage Loans
We hold securities with exposure to subprime residential mortgages, or mortgage loans to borrowers with weak credit profiles. The significant decline in U.S. housing prices and relaxed underwriting standards by some subprime loan originators have led to higher delinquency and loss rates, resulting in a significant reduction in the market valuation of these securities sector wide.
In the third quarter of 2010, we sold subprime holdings with par values of approximately $29.9 million, realizing net pre-tax losses totaling $10.2 million. As of December 31, 2010, we held subprime securities with par values of $22.1 million, an amortized cost of $21.6 million and a fair value of $15.8 million representing approximately 1.1% of our cash and invested assets, with collateral comprised substantially of first lien mortgages in senior or senior mezzanine level tranches, with an average Standard & Poor's, or equivalent, rating of A–.
The following table presents our exposure to subprime residential mortgages by vintage year.
Vintage Year
|
Amortized Cost |
Fair Value |
Gross Unrealized Losses & OTTI |
|||||||
|---|---|---|---|---|---|---|---|---|---|---|
| |
(in thousands) |
|||||||||
2003 |
$ | 185 | $ | 72 | $ | (113 | ) | |||
2004 |
210 | 142 | (68 | ) | ||||||
2005 |
14,173 | 11,989 | (2,184 | ) | ||||||
2006 |
7,000 | 3,605 | (3,395 | ) | ||||||
Totals |
$ | 21,568 | $ | 15,808 | $ | (5,760 | ) | |||
We continuously review our subprime holdings stressing multiple variables, such as cash flows, prepayment speeds, default rates and loss severity, and comparing current base case loss expectations to the loss required to incur a principal loss, or breakpoint. We expect delinquency and loss rates in the subprime mortgage sector to continue to increase in the near term but at a decreasing rate. Those
104
securities with a greater variance between the breakpoint and base case can withstand this further deterioration. Based on the analysis of the remaining subprime holdings at December 31, 2010, we do not believe these holdings are other-than-temporarily impaired.
The following table summarizes, on a pre-tax basis, our other-than-temporary impairments recorded in each of the three years ended December 31:
| |
Year Ended | |||||||||
|---|---|---|---|---|---|---|---|---|---|---|
| |
2010 | 2009 | 2008 | |||||||
| |
(in thousands) |
|||||||||
Subprime |
$ | 289 | $ | 10,497 | $ | 47,964 | ||||
Other structured |
526 | 6,398 | 4,645 | |||||||
Corporate |
— | — | 7,177 | |||||||
|
$ | 815 | $ | 16,895 | $ | 59,786 | ||||
During the year ended December 31, 2010 we recognized impairment on one subprime holding previously impaired in 2008, plus one additional subprime holding and two other structured securities which had not been previously impaired. During the year ended December 31, 2009, we recognized an additional other-than-temporary impairment on twelve subprime securities impaired in 2008, plus one additional subprime holding. Further, we recognized other-than-temporary impairments on twelve other structured securities, seven of which had not been previously impaired. During the year ended December 31, 2008, we recognized an other-than-temporary impairment on eighteen subprime, five other structured securities and three corporate securities, including $6.1 million on two Lehman Brothers securities.
We continue to review the estimated fair values indicated by pricing provided by the third party pricing services. However, we cannot give assurance that there will be no further impairments on these securities.
Recognition of Premium Revenues and Policy Benefits—Medicare Products
Medicare is a federal health insurance program that provides Americans age 65 and over, and some disabled persons under the age of 65, certain hospital, medical and prescription drug benefits. The Medicare program consists of four parts, labeled Parts A–D.
Part A—Hospitalization benefits are provided under Part A. These benefits are financed largely through Social Security taxes. Beneficiaries are not required to pay any premium for Part A benefits; however, they are still required to pay out-of- pocket deductibles and coinsurance.
Part B—Benefits for medically necessary services and supplies including outpatient care, doctor's services, physical or occupational therapists and additional home health care are provided under Part B. These benefits are financed through premiums paid to the federal government by those eligible beneficiaries who choose to enroll in the program. The beneficiaries are also required to pay out-of- pocket deductibles and coinsurance.
Part C—Under the Medicare Advantage program, private plans provide Medicare-covered health care benefits to enrollees and can include prescription drug coverage. Part C benefits are provided through private HMO, PPO and PFFS plans. An individual must have Medicare Part A and Part B in order to join a Medicare Advantage Plan.
105
Part D—Under Part D, prescription drug benefits may be provided by private Plans to individuals eligible for benefits under Part A and/or enrolled in Part B. These benefits are provided on both a stand-alone basis and also in connection with certain of our HMO, PPO and PFFS plans.
These programs are administered by Centers for Medicare and Medicaid Services, known as CMS, an agency of the United States Department of Health and Human Services. We contract with CMS under the Medicare program to provide a comprehensive array of health insurance and prescription drug benefits to Medicare eligible persons. These benefits are provided through HMO, PPO, PFFS and stand-alone Part D Plans in exchange for contractual risk-adjusted payments received from CMS.
Premiums received pursuant to Medicare contracts with CMS are recorded as revenue in the month in which members are entitled to receive benefits. Premiums collected in advance are deferred. Receivables from CMS and Plan members are recorded net of estimated uncollectible amounts and are reported as due and unpaid premiums in the consolidated balance sheets. We routinely monitor the collectability of specific accounts, the aging of member premium receivables, historical retroactivity trends and prevailing and anticipated economic conditions. Certain commissions are deferred and amortized in relation to the corresponding revenues which is no longer than a one-year period.
Policy and contract claims include actual claims reported but not paid and estimates of health care services and prescription drug claims incurred but not reported. The estimated claims incurred but not reported are based upon current enrollment, historical claim receipt and payment patterns, historical medical cost trends and health service utilization statistics. These estimates and assumptions are derived from and are continually evaluated using per member per month trend analysis, claims trends developed from our historical experience in the preceding month (adjusted for known changes in estimates of recent hospital and drug utilization data), provider contracting changes, changes in benefit levels, product mix and seasonality. These estimates are based on information available at the time the estimates are made, as well as anticipated future events. Actual results could differ materially from these estimates. We periodically evaluate our estimates, and as additional information becomes available or actual amounts become determinable, we may revise the recorded estimates and reflect them in operating results.
Membership
We analyze the membership for our Medicare HMO, PPO, PFFS and stand-alone Part D Plans in our administrative system and reconcile to the enrollment provided by CMS. There are timing differences between the addition of a member to our administrative system and the approval, or accretion, of the member by CMS. Additionally, the monthly payments from CMS include adjustments to reflect changes in the status of membership as a result of retroactive terminations, additions, whether CMS is secondary to other insurance coverage or other changes. Current period membership, net premium, CMS subsidies and claims expense are adjusted to reflect retroactive changes in membership.
106
Medicare Risk Adjustment Provisions
CMS uses risk-adjusted rates per member to determine the monthly payments to Medicare Plans. CMS has implemented a risk adjustment model which apportions premiums paid to all health Plans according to health diagnoses. The risk adjustment model uses health status indicators, or risk scores, to improve the accuracy of payment. The CMS risk adjustment model pays more for members with increasing health severity. Under this risk adjustment methodology, diagnosis data from inpatient and ambulatory treatment settings are used by CMS to calculate the risk adjusted premium payment to Medicare Plans. The monthly risk-adjusted premium per member is determined by CMS based on normalized risk scores of each member from the prior year. Annually, CMS provides the updated risk scores to the Plans and revises premium rates prospectively, beginning with the July remittance for current Plan year members. CMS will also calculate the retroactive adjustments to premium related to the revised risk scores for the current year for current Plan year members and for the prior year for prior Plan year members.
Medicare Advantage Health Benefit Plans
We receive monthly payments from CMS related to members in our HMO, PPO and PFFS Plans. The recognition of the premium and cost reimbursement components under these Plans is described below:
CMS Direct Premium Subsidy—We receive a monthly premium from CMS based on the Plan year bid we submitted to CMS. The monthly payment is a risk-adjusted amount per member and is based upon the member's health status, as determined by CMS. The CMS premium is recognized over the contract period and reported as premium revenue. In addition, under Medicare Secondary Payer, or MSP provisions, the premium will be reduced by CMS if CMS has determined that it is secondary to other insurance coverage.
Revenue Adjustments—The monthly CMS Direct Premium Subsidy is based upon the members' risk score status, which is determined by CMS, as more fully described above under "Medicare Risk Adjustment Provisions." All health benefit organizations must capture, collect, and submit the necessary diagnosis code information to CMS within prescribed deadlines. Accordingly, we collect, capture, and submit the necessary and available diagnosis data to CMS within prescribed deadlines for our HMO, PPO and PFFS plans. We estimate changes in CMS premium related to risk score adjustments based upon the diagnosis data submitted to CMS and ultimately accepted by CMS. Risk scores are updated annually by CMS and reconciled to our estimated amounts by us with any adjustments recorded in premium revenue. Although such adjustments have not been considered to be material in the past, future adjustments could be material.
Member Premium—We receive a monthly premium from members based on the Plan year bid we submitted to CMS. The member premium, which is fixed for the entire Plan year, is recognized over the contract period and reported as premium revenue. We establish a reserve for member premium that is past due that reflects our estimate of the collectability of the member premium.
Low-Income Premium Subsidy—For qualifying low-income status, or LIS, members of our Medicare Advantage Health Benefit Plans with Part D benefits, CMS pays us for some or all of the LIS member's monthly premium. The CMS payment is dependent upon a member's income level which is determined by the Social Security Administration. Low-income premium is recognized over the contract period and reported as premium revenue.
Low-Income Cost Sharing Subsidy—For qualifying LIS members of our Medicare Advantage Health Benefit Plans with Part D benefits, CMS will reimburse the Plans for all or a portion of the LIS member's deductible, coinsurance and co-payment amounts above the out of pocket threshold for low income beneficiaries. Low-income cost sharing subsidies are paid by CMS prospectively as a fixed
107
amount per member per month, and are determined based upon the Plan year bid we submitted to CMS. After the close of the annual Plan year, CMS reconciles actual experience to low-income cost sharing subsidies paid to the Plan and any differences are settled between CMS and the Plan. The low-income subsidy is accounted for as deposit accounting and therefore not recognized in operations.
Catastrophic Reinsurance—We receive payments from CMS for catastrophic reinsurance for members of our Medicare Advantage Health Benefit Plans with Part D benefits.
For the members of our HMO and PPO Plans with Part D benefits, CMS reimburses Plans for 80% of the drug costs after a member reaches his or her out of pocket catastrophic threshold through a catastrophic reinsurance subsidy. Catastrophic reinsurance subsidies are paid by CMS prospectively as a fixed amount per member per month, and are determined based upon the Plan year bid we submitted to CMS. After the close of the annual Plan year, CMS reconciles actual experience compared to catastrophic reinsurance subsidies paid to the Plan and any differences are settled between CMS and the Plan. The catastrophic reinsurance subsidy is accounted for as deposit accounting and therefore not recognized in operations.
For members of our PFFS Plans with Part D benefits, CMS makes prospective monthly catastrophic reinsurance payments to the Plans based on estimated average reinsurance payments to other Medicare Advantage—Prescription Drug (MA-PD) Plans that provide Part D benefits. Based upon the current guidelines from CMS, PFFS Plans are at risk for the variance between their actual expense and the CMS payments. As a result, we do not follow deposit accounting for these payments.
CMS Risk Corridor Provisions for the Part D benefits of our HMO and PPO Plans —Premiums from CMS for members of our HMO and PPO Plans with Part D benefits, are subject to risk sharing through the risk corridor provisions. The CMS risk corridor calculation compares the target amount of prescription drug costs (limited to costs under the standard coverage as defined by CMS) less rebates in our annual Plan bid (target amount) to actual experience. Variances of more than 5% above the target amount will result in CMS making additional payments to us, and variances of more than 5% below the target amount will require us to refund to CMS a portion of the premiums we received. Risk corridor payments due to or from CMS are estimated throughout the year and are recognized as adjustments to premium revenues and due and unpaid premiums. This estimate requires us to consider factors that may not be certain, including: membership, risk scores, prescription drug events, or PDEs, and rebates. After the close of the annual Plan year, CMS reconciles actual experience to the target amount and any differences are settled between CMS and the Plan.
Medicare Part D Plans
We receive monthly payments from CMS related to members in our stand-alone Part D Plans. The recognition of the premium and subsidy components under Part D is described below:
CMS Direct Premium Subsidy—We receive a monthly premium from CMS based on the Plan year bid we submitted to CMS. The monthly payment is a risk-adjusted amount per member and is based upon the member's health status, as determined by CMS. The CMS premium is recognized over the contract period and reported as premium revenue.
Revenue Adjustments—The monthly CMS Direct Premium Subsidy is based upon the members' health status, which is determined by CMS, as more fully described above under "Medicare Risk Adjustment Provisions." We do not have access to diagnosis data with respect to our stand-alone PDP members and therefore, we cannot anticipate changes in our members' risk scores. Changes in CMS premiums related to risk-score adjustments for our stand-alone PDP membership are recognized when the amounts become determinable and collectability is reasonably assured, which occurs when we are notified by CMS of such adjustments. Although such adjustments have not been considered to be material in the past, future adjustments could be material.
108
Member Premium—We receive a monthly premium from members based on the Plan year bid we submitted to CMS. The member premium, which is fixed for the entire Plan year, is recognized over the contract period and reported as premium revenue.
Low-Income Premium Subsidy—For qualifying low-income status, or LIS, members, CMS pays us for some or all of the LIS member's monthly premium. The CMS payment is dependent upon a member's income level which is determined by the Social Security Administration. Low-income premium is recognized over the contract period and reported as premium revenue.
Low-Income Cost Sharing Subsidy—For qualifying LIS members, CMS will reimburse Plans for all or a portion of the LIS member's deductible, coinsurance and co-payment amounts above the out of pocket threshold for low income beneficiaries. Low-income cost sharing subsidies are paid by CMS prospectively as a fixed amount per member per month, and are determined based upon the Plan year bid we submitted to CMS. After the close of the annual Plan year, CMS reconciles actual experience to low-income cost sharing subsidies paid to the Plan and any differences are settled between CMS and the Plan. See "Deposit Accounting" below for a description of the accounting for low-income cost sharing subsidies.
Catastrophic Reinsurance Subsidy—CMS reimburses Plans for 80% of the drug costs after a member reaches his or her out of pocket catastrophic threshold through a catastrophic reinsurance subsidy. Catastrophic reinsurance subsidies are paid by CMS prospectively as a fixed amount per member per month, and are determined based upon the Plan year bid we submitted to CMS. After the close of the annual Plan year, CMS reconciles actual experience compared to catastrophic reinsurance subsidies paid to the Plan and any differences are settled between CMS and the Plan. See "Deposit Accounting" below for a description of the accounting for catastrophic reinsurance subsidies.
CMS Risk Corridor—Premiums from CMS are subject to risk sharing through the Medicare Part D risk corridor provisions. The CMS risk corridor calculation compares the target amount of prescription drug costs (limited to costs under the standard coverage as defined by CMS) less rebates in our annual Plan bid to actual experience. Variances of more than 5% above the target amount will result in CMS making additional payments to us, and variances of more than 5% below the target amount will require us to refund to CMS a portion of the premiums we received. Risk corridor payments due to or from CMS are estimated throughout the year and are recognized as adjustments to premium revenues and due and unpaid premiums. This estimate requires us to consider factors that may not be certain, including: membership, risk scores, prescription drug events, or PDEs, and rebates. After the close of the annual Plan year, CMS reconciles actual experience to the target amount and any differences are settled between CMS and the Plan.
Deposit Accounting—Low-income cost sharing and catastrophic reinsurance subsidies represent funding from CMS for which we assume no risk and are reported as increases to CMS contract deposits in the consolidated balance sheets. Payments of the actual prescription drug costs related to the low-income cost sharing and catastrophic reinsurance are reported as decreases to CMS contract deposits in the consolidated balance sheets. We do not recognize premium revenues or claims expense for this activity. These receipts and payments are reported as financing activity in our consolidated statements of cash flows.
Income Taxes
Income Taxes: We use the liability method of accounting for income taxes. Under this method, we recognize deferred tax assets and liabilities for the future tax consequences attributable to differences between the financial statement carrying amounts of existing assets and liabilities and their respective tax bases. We measure deferred tax assets and liabilities using enacted tax rates that we expect to apply to taxable income in the years in which we expect those temporary differences to be recovered or
109
settled. We recognize the effect on deferred tax assets and liabilities of a change in tax rates in income in the period that includes the enactment date of a change in tax rates.
We establish valuation allowances on our deferred tax assets for amounts that we determine will not be recoverable based upon our analysis of projected taxable income and our ability to implement prudent and feasible tax planning strategies. We recognize increases in these valuation allowances as deferred tax expense. We reflect portions of the valuation allowances subsequently determined to be no longer necessary as deferred tax benefits.
We record tax benefits when it is more likely than not that the tax return position taken with respect to a particular transaction will be sustained. A liability, if recorded, is not considered resolved until the statute of limitations for the relevant taxing authority to examine and challenge the tax position has expired, or the tax position is ultimately settled through examination, negotiation, or litigation. We classify interest and penalties associated with uncertain tax positions in our provision for income taxes.
Federal Income Taxation of the Company
We file a consolidated life-nonlife return for Federal income tax purposes that includes all US subsidiaries. At December 31, 2010, the Company had a net capital loss carryforwards of approximately $7.7 million that expire in 2014.
We carried valuation allowances on deferred tax assets of $7.8 million at December 31, 2010 and $5.8 million at December 31, 2009 primarily related to the tax benefits associated with a New York state net operating loss carryforward. At December 31, 2010, we recorded our deferred tax assets based on the amount that was more likely than not to be realized under ASC 740, Income Taxes. Management believes it is more likely than not that the Company will realize the recorded value of its net deferred tax assets.
Some of our U.S. insurance company subsidiaries are taxed as life insurance companies as provided in the Internal Revenue Code. The Omnibus Budget Reconciliation Act of 1990 amended the Internal Revenue Code to require a portion of the expenses incurred in selling insurance products be capitalized and amortized over a period of years, as opposed to an immediate deduction in the year incurred. Instead of measuring actual selling expenses, the amount capitalized for tax purposes is based on a percentage of premiums. In general, the capitalized amounts are subject to amortization over a ten-year period. Since this change only affects the timing of the deductions, it does not, assuming stability of income tax rates, affect the provisions for taxes reflected in our financial statements prepared in accordance with GAAP. However, by deferring deductions, the change has the effect of increasing our current tax expense and reducing statutory surplus.
The Jobs Creation Tax Act of 2004, known as the Jobs Act, contains a provision that placed a two year moratorium on the imposition of tax on distributions from Policyholder Surplus Accounts ("PSAs"), the Phase III tax. Additionally, the ordering rules were changed to allow for the first dollar of any distribution to reduce the PSA. In accordance with the Jobs Act, distributions during 2005 and 2006 from an insurance company that had a PSA was treated as a distribution from its PSA account; however, the distribution was not subject to Federal income tax. We received the approval of the Insurance Departments of the respective companies for the transactions that could trigger the elimination of the potential tax and made such distributions during 2006. During 2010 we released the deferred tax liabilities previously established for the potential Phase III tax on the PSAs and reduced deferred tax expense.
At December 31, 2010, we had unrecognized tax benefits of $10.0 million, net of federal income tax, primarily related to refund claims filed in various state jurisdictions during 2010. We recognize
110
interest and penalties related to unrecognized tax benefits in federal and state tax expense. During the year ended December 31, 2010, we recognized no such interest expense and penalties.
Effects of Recently Issued and Pending Accounting Pronouncements
A summary of recent and pending accounting pronouncements is provided in Note 4 of the Consolidated Financial Statements in the Annual Report on Form 10-K under the caption "Recently Issued and Pending Accounting Pronouncements." We do not anticipate any material impact from the future adoption of the pending accounting pronouncements discussed in that note.
ITEM 7A—QUANTITATIVE AND QUALITATIVE DISCLOSURES ABOUT MARKET RISK
In general, market risk to which we are subject relates to changes in interest rates that affect the market prices of our fixed income securities as well as the cost of our variable rate debt.
Investment Interest Rate Sensitivity
Our profitability could be affected if we were required to liquidate fixed income securities during periods of rising and/or volatile interest rates. However, we attempt to mitigate our exposure to adverse interest rate movements through a combination of active portfolio management and by staggering the maturities of our fixed income investments to assure sufficient liquidity to meet our obligations and to address reinvestment risk considerations. Our investment policy is to attempt to balance our portfolio duration to achieve investment returns consistent with the preservation of capital and to meet payment obligations of policy benefits and claims.
Some classes of mortgage-backed securities are subject to significant prepayment risk due to the fact that in periods of declining interest rates, individuals may refinance higher rate mortgages to take advantage of the lower rates then available. We monitor and adjust our investment portfolio mix to mitigate this risk.
We regularly conduct various analyses to gauge the financial impact of changes in interest rate on our financial condition. The ranges selected in these analyses reflect our assessment as being reasonably possible over the succeeding twelve-month period. The magnitude of changes modeled in the accompanying analyses should not be construed as a prediction of future economic events, but rather, be treated as a simple illustration of the potential impact of such events on our financial results.
The sensitivity analysis of interest rate risk assumes an instantaneous shift in a parallel fashion across the yield curve, with scenarios of interest rates increasing and decreasing 100 and 200 basis points from their levels as of December 31, 2010, and with all other variables held constant. The following table summarizes the impact of the assumed changes in market interest rates.
| December 31, 2010 | Effect of Change in Market Interest Rates on Fair Value of Fixed Income Portfolio as of December 31, 2010 |
|||||||||||||
|---|---|---|---|---|---|---|---|---|---|---|---|---|---|---|
| Fair Value of Fixed Income Portfolio |
200 Basis Point Decrease |
100 Basis Point Decrease |
100 Basis Point Increase |
200 Basis Point Increase |
||||||||||
| |
|
(in millions) |
|
|
||||||||||
| $1,398.5 | $ | 91.6 | $ | 53.8 | $ | (58.0 | ) | $ | (116.6 | ) | ||||
Debt
We pay interest on our term loan and a portion of our trust preferred securities based on the London Inter Bank Offering Rate, known as LIBOR, over one, two, three or six month interest periods. Due to the variable interest rate, we would be subject to higher interest costs if short-term interest rates rise. We have attempted to mitigate our exposure to adverse interest rate movements by fixing the rate on a portion of our loan payable through the use of cash flow swaps and our trust
111
preferred securities through the contractual terms of the security at inception. At December 31, 2010, we have fixed the rate on a total of $283 million of our debt, including $233 million of our loan payable and $50 million of our trust preferred securities.
We regularly conduct various analyses to gauge the financial impact of changes in interest rate on our financial condition. The ranges selected in these analyses reflect our assessment as being reasonably possible over the succeeding twelve-month period. The magnitude of changes modeled in the accompanying analyses should not be construed as a prediction of future economic events, but rather, be treated as a simple illustration of the potential impact of such events on our financial results.
The sensitivity analysis of interest rate risk assumes scenarios involving increases or decreases in LIBOR of 100 and 200 basis points from their levels as of and for the year ended December 31, 2010, and with all other variables held constant.
| |
|
|
Effect of Change in LIBOR on Pre-tax Income for the year ended December 31, 2010 |
||||||||||||||||
|---|---|---|---|---|---|---|---|---|---|---|---|---|---|---|---|---|---|---|---|
| |
|
Weighted Average Balance Outstanding |
|||||||||||||||||
Description of Floating Rate Debt
|
Weighted Average Interest Rate |
200 Basis Point Decrease(1) |
100 Basis Point Decrease(1) |
100 Basis Point Increase |
200 Basis Point Increase |
||||||||||||||
| |
|
|
|
(in millions) |
|
|
|||||||||||||
Other long-term debt |
4.40 | % | $ | 60.0 | $ | 0.2 | $ | 0.2 | $ | (0.6 | ) | $ | (1.2 | ) | |||||
- (1)
- Due to LIBOR rates on our other long-term debt ranging from 25 to 49 basis points during 2010, for the purposes of this illustration, decreases in rates over this period have been limited to the year to date average of 34 basis points on our other long-term debt.
As noted above, we have fixed the interest rate on $283 million of our $343 million of total debt outstanding, leaving $60 million of the debt exposed to rising interest rates, as of December 31, 2010. We had approximately $65 million of cash and cash equivalents as of December 31, 2010. We anticipate that any increase or decrease in the interest cost of our debt as a result of an increase in interest rates will be mitigated by an increase or decrease in the net investment income from our cash and cash equivalents.
The magnitude of changes reflected in the above analysis regarding interest rates should not be construed as a prediction of future economic events, but rather as a simple illustration of the potential impact of such events on our financial results.
ITEM 8—FINANCIAL STATEMENTS AND SUPPLEMENTARY DATA
The financial statements and supplementary schedules are listed in the accompanying Index to Consolidated Financial Statements and Financial Statement Schedules in this Annual Report on Form 10-K on Page F-1.
ITEM 9—CHANGES IN AND DISAGREEMENTS WITH ACCOUNTANTS ON ACCOUNTING AND FINANCIAL DISCLOSURE
None.
112
ITEM 9A—CONTROLS AND PROCEDURES
Disclosure Controls and Procedures
The Company maintains disclosure controls and procedures that are designed to ensure that information required to be disclosed in the reports that we file or submit under the Exchange Act, is recorded, processed, summarized and reported within the time periods specified in the SEC's rules and forms, and that such information is accumulated and communicated to management, including the Company's Chief Executive Officer and Chief Financial Officer, as appropriate, to allow timely decisions regarding required disclosures.
Inherent Limitations on Effectiveness of Controls
Our disclosure controls and procedures and our internal controls over financial reporting may not prevent or detect all errors and all fraud. A control system, no matter how well designed and operated, can provide only reasonable, not absolute, assurance that the objectives of the control system are met. The design of a control system must reflect the fact that there are resource constraints, and the benefits of controls must be considered relative to their costs. Further, because of the inherent limitations in all control systems, no evaluation of controls can provide absolute assurance that misstatements due to error or fraud will not occur or that all control issues and instances of fraud, if any, within Universal American have been detected. These inherent limitations include the realities that judgments in decision-making can be faulty and that breakdowns can occur because of simple error or mistake. Controls can also be circumvented by the individual acts of some persons or by collusion of two or more people. The design of any system of controls is based in part on assumptions about the likelihood of future events, and there can be no assurance that any design will succeed in achieving its stated goals under all potential future conditions. Projections of any evaluation of controls effectiveness to future periods are subject to risks. Over time, controls may become inadequate because of changes in conditions or deterioration in the degree of compliance with policies or procedures.
Evaluation of Effectiveness of Controls
An evaluation was carried out under the supervision and with the participation of the Company's management, including our Chief Executive Officer and Chief Financial Officer, of the effectiveness of the design and operation of our disclosure controls and procedures as of December 31, 2010. Based on this evaluation, our Chief Executive Officer and Chief Financial Officer concluded that our disclosure controls and procedures were effective as of December 31, 2010, at a reasonable assurance level, to timely alert management to material information required to be included in our periodic filings with the Securities and Exchange Commission.
Management's Annual Report on Internal Control over Financial Reporting
Our management is responsible for establishing and maintaining adequate internal control over financial reporting (as defined in Rule 13a-15(f) under the Exchange Act). A company's internal control over financial reporting is a process designed to provide reasonable assurance regarding the reliability of financial reporting and the preparation of financial statements for external purposes in accordance with U.S. generally accepted accounting principles in the United States.
Because of its inherent limitations, internal control over financial reporting may not prevent or detect misstatements. Also, projections of any evaluation of effectiveness to future periods are subject to the risk that controls may become inadequate because of changes in conditions, or that the degree of compliance with the policies or procedures may deteriorate.
Management assessed our internal control over financial reporting as of December 31, 2010, the end of our fiscal year. Management based its assessment on criteria established in Internal Control—
113
Integrated Framework issued by the Committee of Sponsoring Organizations of the Treadway Commission. Based on our assessment, we determined that, as of December 31, 2010, the Company's internal control over financial reporting was effective based on those criteria.
The effectiveness of our internal control over financial reporting as of December 31, 2010 has been audited by Ernst & Young LLP, an independent registered public accounting firm, as stated in their report which is included on page F-3 of our consolidated financial statements included in this Annual Report on Form 10-K.
Changes in Internal Control Over Financial Reporting
There were no changes in our internal controls over financial reporting during the quarter ended December 31, 2010 that have materially affected, or are reasonably likely to materially affect, our internal controls over financial reporting.
None
114
ITEM 10—DIRECTORS, EXECUTIVE OFFICERS AND CORPORATE GOVERNANCE
The information required by Item 10 will either be incorporated into Part III of this Annual Report on Form 10-K by reference to our definitive Proxy Statement for the Annual Meeting of Shareholders or provided in an amendment to this Form 10-K to be filed no later April 30, 2011.
ITEM 11—EXECUTIVE COMPENSATION
The information required by Item 11 will either be incorporated into Part III of this Annual Report on Form 10-K by reference to our definitive Proxy Statement for the Annual Meeting of Shareholders or provided in an amendment to this Form 10-K to be filed no later April 30, 2011.
ITEM 12—SECURITY OWNERSHIP OF CERTAIN BENEFICIAL OWNERS AND MANAGEMENT AND RELATED STOCKHOLDER MATTERS
The information required by Item 12 will either be incorporated into Part III of this Annual Report on Form 10-K by reference to our definitive Proxy Statement for the Annual Meeting of Shareholders or provided in an amendment to this Form 10-K to be filed no later April 30, 2011.
ITEM 13—CERTAIN RELATIONSHIPS AND RELATED TRANSACTIONS, AND DIRECTOR INDEPENDENCE
The information required by Item 13 will either be incorporated into Part III of this Annual Report on Form 10-K by reference to our definitive Proxy Statement for the Annual Meeting of Shareholders or provided in an amendment to this Form 10-K to be filed no later April 30, 2011.
ITEM 14—PRINCIPAL ACCOUNTANT FEES AND SERVICES
The information required by Item 14 will either be incorporated into Part III of this Annual Report on Form 10-K by reference to our definitive Proxy Statement for the Annual Meeting of Shareholders or provided in an amendment to this Form 10-K to be filed no later April 30, 2011.
115
ITEM 15(a)—EXHIBITS AND FINANCIAL STATEMENT SCHEDULES
- 1
- Financial Statements
Consolidated Balance Sheets as of December 31, 2010 and 2009
Consolidated Statements of Operations for the Three Years Ended December 31, 2010
Consolidated Statements of Stockholders' Equity and Comprehensive Income for the Three Years Ended December 31, 2010
Consolidated Statements of Cash Flows for the Three Years Ended December 31, 2010
Notes to Consolidated Financial Statements
- 2
- Financial Statement Schedules
Schedule I—Summary of Investments Other Than Investments in Related Parties
Schedule II—Condensed Financial Information of Registrant
Schedule III—Supplemental Insurance Information
Schedule IV—Reinsurance (incorporated in Note 10 of Notes to the Consolidated Financial Statements)
Schedule V—Valuation and Qualifying Accounts
- 3
- Exhibits
| 2.1 | Agreement and Plan of Merger and Reorganization dated as of May 7, 2007 among Universal American Financial Corp., MH Acquisition I Corp., MH Acquisition II LLC, MHRx LLC, MemberHealth, Inc. and the stockholder representative named therein (filed as Exhibit 2.1 to the Registrant's Current Report on Form 8-K filed May 11, 2007, and incorporated by reference herein). | ||
2.1.1 |
Amendment to Agreement and Plan of Merger and Reorganization, dated as of December 31, 2008 (filed as Exhibit 10.17 to the Registrant's Annual Report on Form 10-K filed on March 10, 2009, and incorporated by reference herein). |
||
2.1.2 |
Settlement Agreement and Amendment to Merger Agreement, dated as of March 5, 2008 (filed as Exhibit 10.1 to the Registrant's Current Report on Form 8-K dated March 10, 2008, and incorporated by reference herein). |
||
2.2 |
Settlement Agreement and Amendment to Merger Agreement, dated as of March 5, 2008 (filed as Exhibit 10.1 to the Registrant's Current Report on Form 8-K dated March 10, 2008, and incorporated by reference herein). |
||
2.3 |
Agreement and Plan of Merger, dated as of December 30, 2010, by and among Universal American Corp., CVS Caremark Corporation and Ulysses Merger Sub, L.L.C. (filed as Exhibit 2.1 to the Registrant's Current Report on Form 8-K filed on January 6, 2011 and incorporated herein by reference). |
||
2.4 |
Separation Agreement, dated as of December 30, 2010, by and between Universal American Corp. and Universal American Spin Corp.(filed as Exhibit 2.2 to the Registrant's Current Report on Form 8-K filed on January 6, 2011 and incorporated herein by reference. |
116
| 3.1 | Restated Certificate of Incorporation of Universal American Financial Corp. (filed as Exhibit 3.1 to the Registrant's Amendment No. 2 to the Registration Statement on Form S-3 (File No. 333-62036) filed on July 11, 2001, and incorporated by herein reference herein). | ||
3.2 |
Certificate of Amendment of the Certificate of Incorporation of Universal American Financial Corp. (filed as Exhibit 3 to the Registrant's Quarterly Report on Form 10-Q (File No. 0-11321) for the quarter ended June 30, 2004, and incorporated by reference herein). |
||
3.3 |
Certificate of Amendment to Universal American's Certificate of Incorporation for the Series A Preferred Stock (filed as Exhibit 3.1 to the Registrant's Current Report on Form 8-K dated May 7, 2007, and incorporated by reference herein). |
||
3.4 |
Certificate of Amendment to Universal American's Certificate of Incorporation for the Series B Preferred Stock (filed as Exhibit 3.2 to the Registrant's Current Report on Form 8-K dated May 7, 2007, and incorporated by reference herein). |
||
3.5 |
Certificate of Amendment to Universal American's Certificate of Incorporation dated August 24, 2007 (filed as Exhibit 3(i).1 to the Registrant's Current Report on Form 8-K dated August 24, 2007, and incorporated by reference herein). |
||
3.6 |
Certificate of Amendment to Universal American's Certificate of Incorporation changing the name of the Company from Universal American Financial Corp. to Universal American Corp. dated November 30, 2007 (filed as Exhibit 99.1 to the Registrant's Current Report on Form 8-K dated December 3, 2007, and incorporated by reference herein). |
||
3.7 |
Amended and Restated By-Laws of Universal American Corp. (filed as Exhibit 3.7 to the Registrant's Annual Report on Form 10-K filed on March 10, 2009, and incorporated by reference herein). |
||
4.1 |
Form of Indenture dated as of December 2004 between Universal American Financial Corp. and U.S. Bank National Association, as Trustee (filed as Exhibit 4.01 to Amendment No. 1 to the Registrant's Registration Statement on Form S-3 (File No. 333-120190) filed with the Securities and Exchange Commission on December 10, 2004, and incorporated by reference herein). |
||
4.2 |
Form of Indenture dated as of December 2004 between Universal American Financial Corp. and U.S. Bank National Association, as Trustee (filed as Exhibit 4.02 to Amendment No. 1 to the Registrant's Registration Statement on Form S-3 (File No. 333-120190) filed with the Securities and Exchange Commission on December 10, 2004, and incorporated by reference herein). |
||
4.3 |
Registration Rights Agreement, dated July 30, 1999, among the Company, Capital Z Financial Services Fund II, L.P., Wand/Universal American Investments L.P.I., Wand/Universal American Investments L.P. II, Chase Equity Associates, L.P., Richard A. Barasch and others (filed as Exhibit A to the Registrant's Current Report on Form 8-K dated August 13, 1999, and incorporated by reference herein). |
||
4.4 |
Guarantee Agreement, dated as of March 22, 2007, by Universal American Financial Corp., as Guarantor, and Wilmington Trust Company, as Trustee (filed as Exhibit 4.3 to the Registrant's Current Report on Form 8-K dated March 22, 2007, and incorporated by reference herein). |
||
4.5 |
Indenture, dated as of March 22, 2007, between Universal American Financial Corp. and Wilmington Trust Company, as Trustee, relating to Fixed/Floating Rate Junior Subordinated Debentures Due 2037 (filed as Exhibit 4.1 to the Registrant's Current Report on Form 8-K dated March 22, 2007, and incorporated by reference herein). |
117
| 4.6 | Stockholders' Agreement, dated as of September 21, 2007, among Universal American Financial Corp. and the security holders listed on the signature pages thereto (filed as Exhibit 4.1 to the Registrant's Current Report on Form 8-K dated September 24, 2007, and incorporated by reference herein). | ||
10.1 |
Employment Agreement dated July 30, 1999, between Registrant and Richard A. Barasch (filed as Exhibit D to the Registrant's Current Report on Form 8-K/A dated March 14, 2001 and incorporated by reference herein). |
||
10.2 |
Employment Agreement dated July 30, 1999, between Registrant and Robert Waegelein (filed as Exhibit E to the Registrant's Current Report on Form 8-K/A dated March 14, 2001 and incorporated by reference herein). |
||
10.3 |
Employment Agreement dated March 9, 2004, by and among the Company, Heritage Health Systems, Inc. and Theodore M. Carpenter, Jr. (filed as Exhibit 10.18 to the Registrant's Current Report on Form 8-K dated January 18, 2007, and incorporated by reference herein). |
||
10.4 |
Employment Letter dated March 7, 2008, between Registrant and John Wardle (filed as Exhibit 10.5 to the Registrant's Annual Report on Form 10-K filed on March 10, 2009, and incorporated by reference herein). |
||
10.4.1 |
Letter Agreement, dated as of December 30, 2010, by and among CVS Caremark Corporation, Universal American Corp. and John Wardle (filed as Exhibit 10.1 to the Registrant's Current Report on Form 8-K filed on January 6, 2011 and incorporated herein by reference). |
||
10.5 |
1998 Incentive Compensation Plan (filed as Annex A to the Registrant's Definitive Proxy Statement filed on Form 14A dated April 29, 1998, and incorporated by reference herein). |
||
10.6 |
Amendment No. 1 to Universal American Financial Corp. 1998 Incentive Compensation Plan (filed as Amendment No. 1 to the Registrant's Registration Statement on Form S-4 (Registration No. 333-120190) filed on December 10, 2004, and incorporated by reference herein). |
||
10.7 |
Quota Share Reinsurance Agreement, dated June 30, 2005, among the Company and PharmaCare Captive Re, Ltd. (filed as Exhibit 10.1 to the Registrant's Quarterly Report on Form 10-Q for the quarter ended September 30, 2005, and incorporated by reference herein). |
||
10.8 |
Stage 1 securities purchase agreement dated May 7, 2007 among Lee-Universal Holdings, LLC, Welsh, Carson, Anderson & Stowe X, L.P., Union Square Universal Partners, L.P., Perry Partners, L.P., Perry Partners International, Inc., Perry Commitment Fund, L.P. and Perry Commitment Master Fund, L.P. (filed as Exhibit 10.1 to the Registrant's Current Report on Form 8-K dated May 7, 2007, and incorporated by reference herein). |
||
10.9 |
Stage 2 securities purchase agreement dated May 7, 2007 among Lee-Universal Holdings, LLC, Welsh, Carson, Anderson & Stowe X, L.P., Union Square Universal Partners, L.P., Perry Partners, L.P., Perry Partners International, Inc., Perry Commitment Fund, L.P. and Perry Commitment Master Fund, L.P. (filed as Exhibit 10.2 to the Registrant's Current Report on Form 8-K dated May 7, 2007, and incorporated by reference herein). |
||
10.10 |
Credit Agreement dated as of September 18, 2007, among Universal American Financial Corp., each lender from time to time party thereto, and Bank of America, N.A., as Administrative Agent, Swing Line Lender and L/C Issuer (filed as Exhibit 10.26 to the Registrant's Quarterly Report on Form 10-Q for the quarter ended September 30, 2007, and incorporated by reference herein). |
118
| 10.11 | First Amendment to Credit Agreement, dated as of November 9, 2009, by and among Universal American Corp., the Lenders party thereto and Bank of America, N.A. as administrative agent for the Lenders (filed as Exhibit 10.1 to the Registrant's Current Report on Form 8-K filed on November 12, 2009, and incorporated by reference herein). | ||
10.11.1* |
Second Amendment to Credit Agreement, dated as of July 27, 2010, by and among Universal American Corp., the Lenders party thereto and Bank of America, N.A. as administrative agent for the Lenders. |
||
10.12 |
Indemnity Reinsurance Agreement between American Exchange Life Insurance Company (Ceding Company) and Commonwealth Annuity and Life Insurance Company (Reinsurer) effective as of April 1, 2009 (filed as Exhibit 10.2 to the Registrant's Quarterly Report on Form 10-Q filed on October 30, 2009, and incorporated by reference herein). |
||
10.13 |
Indemnity Reinsurance Agreement between Marquette National Life Insurance Company (Ceding Company) and Commonwealth Annuity and Life Insurance Company (Reinsurer) effective as of April 1, 2009 (filed as Exhibit 10.3 to the Registrant's Quarterly Report on Form 10-Q filed on October 30, 2009, and incorporated by reference herein). |
||
10.14 |
Indemnity Reinsurance Agreement between Pennsylvania Life Insurance Company (Ceding Company) and Commonwealth Annuity and Life Insurance Company (Reinsurer) effective as of April 1, 2009 (filed as Exhibit 10.4 to the Registrant's Quarterly Report on Form 10-Q filed on October 30, 2009, and incorporated by reference herein). |
||
10.15 |
Indemnity Reinsurance Agreement between American Pioneer Life Insurance Company (Ceding Company) and Commonwealth Annuity and Life Insurance Company (Reinsurer) effective as of April 1, 2009 (filed as Exhibit 10.5 to the Registrant's Quarterly Report on Form 10-Q filed on October 30, 2009, and incorporated by reference herein). |
||
10.16 |
Indemnity Reinsurance Agreement between American Progressive Life and Health Insurance Company of New York (Ceding Company) and First Allmerica Financial Life Insurance Company (Reinsurer) effective as of April 1, 2009 (filed as Exhibit 10.6 to the Registrant's Quarterly Report on Form 10-Q filed on October 30, 2009, and incorporated by reference herein). |
||
10.17 |
Indemnity Reinsurance Agreement between The Pyramid Life Insurance Company (Ceding Company) and Commonwealth Annuity and Life Insurance Company (Reinsurer) effective as of April 1, 2009 (filed as Exhibit 10.7 to the Registrant's Quarterly Report on Form 10-Q filed on October 30, 2009, and incorporated by reference herein). |
||
10.18 |
Indemnity Reinsurance Agreement between Union Bankers Insurance Company (Ceding Company) and Commonwealth Annuity and Life Insurance Company (Reinsurer) effective as of April 1, 2009 (filed as Exhibit 10.8 to the Registrant's Quarterly Report on Form 10-Q filed on October 30, 2009, and incorporated by reference herein). |
||
10.19 |
Subcontract Agreement dated as of October 21, 2005 by and between MemberHealth, Inc. and Community Care Rx, L.L.C. (filed as Exhibit 10.9 to the Registrant's Quarterly Report on Form 10-Q/A filed on November 12, 2009 in redacted form pursuant to a request for confidential treatment for certain provisions thereof pursuant to Rule 24b-2 of the Securities Exchange Act of 1934, as amended). |
119
| 10.20 | Letter Agreement dated as of May 3, 2007 by and among Universal American Corp., the National Community Pharmacists Association, Community Pharmacy Ventures, Inc. and Community MTM Services, Inc. (filed as Exhibit 10.10 to the Registrant's Quarterly Report on Form 10-Q/A filed on November 12, 2009 in redacted form pursuant to a request for confidential treatment for certain provisions thereof pursuant to Rule 24b-2 of the Securities Exchange Act of 1934, as amended). | ||
12.1* |
Statement re Computation of Ratio of Earnings to Fixed Charges. |
||
21.1* |
List of Subsidiaries. |
||
23.1* |
Consent of Ernst & Young LLP. |
||
31.1* |
Certification of Chief Executive Officer, as required by Rule 13a-14(a) of the Securities Exchange Act of 1934. |
||
31.2* |
Certification of Chief Financial Officer, as required by Rule 13a-14(a) of the Securities Exchange Act of 1934. |
||
32.1* |
Certification of the Chief Executive Officer and Chief Financial Officer, as required by Rule 13a-14(b) of the Securities Exchange Act of 1934 and 18 U.S.C. Section 1350, as adopted pursuant to Section 906 of the Sarbanes-Oxley Act of 2002. |
- *
- Filed or furnished herewith.
120
Pursuant to the requirements of Section 13 or 15(d) of the Securities Exchange Act of 1934, the Registrant has duly caused this report to be signed on its behalf by the undersigned, thereunto duly authorized.
| UNIVERSAL AMERICAN CORP. | ||||||
March 1, 2011 |
/s/ RICHARD A. BARASCH Richard A. Barasch Chairman of the Board, President and Chief Executive Officer |
|||||
Pursuant to the requirements of the Securities Exchange Act of 1934, this report has been signed below by the following persons on behalf of the registrant and in the following capacities and on the dates indicated.
Signature and Title
|
Date
|
|
|---|---|---|
| /s/ RICHARD A. BARASCH Richard A. Barasch Chairman of the Board, President, Chief Executive Officer and Director (Principal Executive Officer) |
March 1, 2011 | |
/s/ ROBERT A. WAEGELEIN Robert A. Waegelein Executive Vice President and Chief Financial Officer (Principal Financial Officer and Principal Accounting Officer) |
March 1, 2011 |
|
/s/ BARRY W. AVERILL Barry W. Averill Director |
March 1, 2011 |
|
/s/ SALLY CRAWFORD Sally Crawford Director |
March 1, 2011 |
|
/s/ MATTHEW ETHERIDGE Matthew Etheridge Director |
March 1, 2011 |
121
Signature and Title
|
Date
|
|
|---|---|---|
| /s/ MARK GORMLEY Mark Gormley Director |
March 1, 2011 | |
/s/ MARK M. HARMELING Mark M. Harmeling Director |
March 1, 2011 |
|
/s/ LINDA LAMEL Linda Lamel Director |
March 1, 2011 |
|
/s/ PATRICK J. MCLAUGHLIN Patrick J. McLaughlin Director |
March 1, 2011 |
|
/s/ RICHARD PERRY Richard Perry Director |
March 1, 2011 |
|
/s/ THOMAS A. SCULLY Thomas A. Scully Director |
March 1, 2011 |
|
/s/ ROBERT A. SPASS Robert A. Spass Director |
March 1, 2011 |
122
Signature and Title
|
Date
|
|
|---|---|---|
| /s/ SEAN M. TRAYNOR Sean M. Traynor Director |
March 1, 2011 | |
/s/ CHRIS WOLFE Chris Wolfe Director |
March 1, 2011 |
|
/s/ ROBERT F. WRIGHT Robert F. Wright Director |
March 1, 2011 |
123
UNIVERSAL AMERICAN CORP. AND SUBSIDIARIES
INDEX TO CONSOLIDATED FINANCIAL STATEMENTS
| |
|
|
|---|---|---|
CONSOLIDATED FINANCIAL STATEMENTS AND FINANCIAL STATEMENT SCHEDULES OF THE REGISTRANT: |
||
Report of Independent Registered Public Accounting Firm |
F-2 | |
Report of Independent Registered Public Accounting Firm on Internal Control Over Financial Reporting |
F-3 | |
Consolidated Balance Sheets as of December 31, 2010 and 2009 |
F-4 | |
Consolidated Statements of Operations for the Three Years Ended December 31, 2010 |
F-5 | |
Consolidated Statements of Stockholders' Equity and Comprehensive Income for the Three Years Ended December 31, 2010 |
F-6 | |
Consolidated Statements of Cash Flows for the Three Years Ended December 31, 2010 |
F-7 | |
Notes to Consolidated Financial Statements |
F-8 | |
Schedule I—Summary of Investments Other Than Investments in Related Parties |
F-70 | |
Schedule II—Condensed Financial Information of Registrant |
F-71 | |
Schedule III—Supplementary Insurance Information |
F-77 | |
Schedule IV—Reinsurance (incorporated in Note 10 to the Consolidated Financial Statements) |
||
Schedule V—Valuation and Qualifying Accounts |
F-78 |
Other schedules were omitted because they were not applicable
Report of Independent Registered Public Accounting Firm
The
Board of Directors and Stockholders of
Universal American Corp.
We have audited the accompanying consolidated balance sheets of Universal American Corp. and subsidiaries as of December 31, 2010 and 2009, and the related consolidated statements of operations, stockholders' equity and comprehensive income, and cash flows for each of the three years in the period ended December 31, 2010. Our audits also included the financial statement schedules listed in the Index at Item 15(a). These financial statements and schedules are the responsibility of the Company's management. Our responsibility is to express an opinion on these financial statements and schedules based on our audits.
We conducted our audits in accordance with the standards of the Public Company Accounting Oversight Board (United States). Those standards require that we plan and perform the audit to obtain reasonable assurance about whether the financial statements are free of material misstatement. An audit includes examining, on a test basis, evidence supporting the amounts and disclosures in the financial statements. An audit also includes assessing the accounting principles used and significant estimates made by management, as well as evaluating the overall financial statement presentation. We believe that our audits provide a reasonable basis for our opinion.
In our opinion, the financial statements referred to above present fairly, in all material respects, the consolidated financial position of Universal American Corp. and subsidiaries at December 31, 2010 and 2009, and the consolidated results of their operations and their cash flows for each of the three years in the period ended December 31, 2010, in conformity with U.S. generally accepted accounting principles. Also, in our opinion, the related financial statement schedules, when considered in relation to the basic financial statements taken as a whole, present fairly in all material respects the information set forth therein.
We also have audited, in accordance with the standards of the Public Company Accounting Oversight Board (United States), Universal American Corp. and subsidiaries' internal control over financial reporting as of December 31, 2010, based on criteria established in Internal Control—Integrated Framework issued by the Committee of Sponsoring Organizations of the Treadway Commission and our report dated March 1, 2011 expressed an unqualified opinion thereon.
| /s/ ERNST & YOUNG LLP |
New
York, New York
March 1, 2011
F-2
Report of Independent Registered Public Accounting Firm
The
Board of Directors and Stockholders of
Universal American Corp.
We have audited Universal American Corp. and subsidiaries' internal control over financial reporting as of December 31, 2010, based on criteria established in Internal Control—Integrated Framework issued by the Committee of Sponsoring Organizations of the Treadway Commission (the COSO criteria). Universal American Corp. and subsidiaries' management is responsible for maintaining effective internal control over financial reporting, and for its assessment of the effectiveness of internal control over financial reporting included in the accompanying Management's Annual Report on Internal Control Over Financial Reporting. Our responsibility is to express an opinion on the company's internal control over financial reporting based on our audit.
We conducted our audit in accordance with the standards of the Public Company Accounting Oversight Board (United States). Those standards require that we plan and perform the audit to obtain reasonable assurance about whether effective internal control over financial reporting was maintained in all material respects. Our audit included obtaining an understanding of internal control over financial reporting, assessing the risk that a material weakness exists, testing and evaluating the design and operating effectiveness of internal control based on the assessed risk, and performing such other procedures as we considered necessary in the circumstances. We believe that our audit provides a reasonable basis for our opinion.
A company's internal control over financial reporting is a process designed to provide reasonable assurance regarding the reliability of financial reporting and the preparation of financial statements for external purposes in accordance with generally accepted accounting principles. A company's internal control over financial reporting includes those policies and procedures that (1) pertain to the maintenance of records that, in reasonable detail, accurately and fairly reflect the transactions and dispositions of the assets of the company; (2) provide reasonable assurance that transactions are recorded as necessary to permit preparation of financial statements in accordance with generally accepted accounting principles, and that receipts and expenditures of the company are being made only in accordance with authorizations of management and directors of the company; and (3) provide reasonable assurance regarding prevention or timely detection of unauthorized acquisition, use, or disposition of the company's assets that could have a material effect on the financial statements.
Because of its inherent limitations, internal control over financial reporting may not prevent or detect misstatements. Also, projections of any evaluation of effectiveness to future periods are subject to the risk that controls may become inadequate because of changes in conditions, or that the degree of compliance with the policies or procedures may deteriorate.
In our opinion, Universal American Corp. and subsidiaries maintained, in all material respects, effective internal control over financial reporting as of December 31, 2010, based on the COSO criteria.
We also have audited, in accordance with the standards of the Public Company Accounting Oversight Board (United States), the consolidated balance sheets of Universal American Corp. and subsidiaries as of December 31, 2010 and 2009, and the related consolidated statements of operations, stockholders' equity and comprehensive income, and cash flows for each of the three years in the period ended December 31, 2010, and our report dated March 1, 2011 expressed an unqualified opinion thereon.
| /s/ ERNST & YOUNG LLP |
New
York, New York
March 1, 2011
F-3
UNIVERSAL AMERICAN CORP. AND SUBSIDIARIES
CONSOLIDATED BALANCE SHEETS
December 31, 2010 and 2009
(in thousands, except share amounts)
| |
December 31, 2010 |
December 31, 2009 |
|||||||
|---|---|---|---|---|---|---|---|---|---|
ASSETS |
|||||||||
Investments: |
|||||||||
Fixed maturities available for sale, at fair value (amortized cost: 2010, $1,388,604; 2009, 961,265) |
$ | 1,398,498 | $ | 964,553 | |||||
Other invested assets |
1,409 | 1,276 | |||||||
Total investments |
1,399,907 | 965,829 | |||||||
Cash and cash equivalents |
65,444 | 856,958 | |||||||
Accrued investment income |
12,455 | 9,005 | |||||||
Deferred policy acquisition costs |
144,750 | 150,398 | |||||||
Reinsurance recoverables—life |
590,253 | 622,547 | |||||||
Reinsurance recoverables—health |
127,931 | 126,524 | |||||||
Due and unpaid premiums |
53,332 | 35,466 | |||||||
Present value of future profits and other amortizing intangible assets |
144,241 | 167,545 | |||||||
Goodwill and other indefinite lived intangible assets |
525,674 | 530,031 | |||||||
Income taxes receivable |
— | 3,441 | |||||||
CMS contract deposit receivables |
196,584 | — | |||||||
Other Part D receivables |
214,183 | 168,159 | |||||||
Advances to agents |
37,022 | 66,418 | |||||||
Other assets |
144,234 | 112,535 | |||||||
Total assets |
$ | 3,656,010 | $ | 3,814,856 | |||||
LIABILITIES AND STOCKHOLDERS' EQUITY |
|||||||||
LIABILITIES |
|||||||||
Reserves and other policy liabilities—life |
$ | 582,248 | $ | 599,442 | |||||
Reserves for future policy benefits—health |
407,312 | 408,625 | |||||||
Policy and contract claims—health |
374,539 | 380,519 | |||||||
Premiums received in advance |
16,410 | 12,535 | |||||||
Loan payable |
232,872 | 313,758 | |||||||
Other long-term debt |
110,000 | 110,000 | |||||||
Amounts due to reinsurers |
6,710 | 7,078 | |||||||
Income taxes payable |
48,983 | — | |||||||
Deferred income tax liability |
61,794 | 31,564 | |||||||
CMS contract deposit liabilities |
— | 169,169 | |||||||
Other Part D liabilities |
107,031 | 163,332 | |||||||
Other liabilities |
205,417 | 169,370 | |||||||
Total liabilities |
2,153,316 | 2,365,392 | |||||||
Commitments and contingencies (Note 25) |
|||||||||
STOCKHOLDERS' EQUITY |
|||||||||
Preferred stock (Authorized: 3 million shares): |
|||||||||
Series A Preferred stock (Authorized: 300,000 shares, issued and outstanding: 42,105 shares, liquidation value 2010, $86,105; 2009, $49,263) |
42 | 42 | |||||||
Series B Preferred stock (Authorized: 300,000 shares) |
— | — | |||||||
Common stock—voting (Authorized: 200 million shares, issued and outstanding: |
|||||||||
2010, 78.6 million shares; 2009, 87.9 million shares) |
786 | 879 | |||||||
Common stock—non-voting (Authorized 30 million shares) |
— | — | |||||||
Additional paid-in capital |
801,155 | 880,709 | |||||||
Accumulated other comprehensive loss |
(2,469 | ) | (7,915 | ) | |||||
Retained earnings |
734,598 | 709,695 | |||||||
Less: Treasury stock (2010, 2.9 million shares; 2009, 13.5 million shares) |
(31,418 | ) | (133,946 | ) | |||||
Total stockholders' equity |
1,502,694 | 1,449,464 | |||||||
Total liabilities and stockholders' equity |
$ | 3,656,010 | $ | 3,814,856 | |||||
See notes to consolidated financial statements.
F-4
UNIVERSAL AMERICAN CORP. AND SUBSIDIARIES
CONSOLIDATED STATEMENTS OF OPERATIONS
For the Three Years Ended December 31, 2010
(in thousands, except per share amounts)
| |
2010 | 2009 | 2008 | |||||||||
|---|---|---|---|---|---|---|---|---|---|---|---|---|
Net premium and policyholder fees earned |
$ | 5,629,700 | $ | 4,918,898 | $ | 4,600,454 | ||||||
Net investment income |
42,857 | 49,814 | 81,270 | |||||||||
Fee and other income |
9,673 | 19,776 | 37,130 | |||||||||
Realized gain (loss): |
||||||||||||
Total other-than-temporary impairment losses on securities |
(1,915 | ) | (24,206 | ) | (59,786 | ) | ||||||
Portion of loss recognized in other comprehensive income |
1,100 | 6,830 | — | |||||||||
Net other-than-temporary impairment losses on securities recognized in earnings |
(815 | ) | (17,376 | ) | (59,786 | ) | ||||||
Realized gain (loss), excluding other-than-temporary impairment losses on securities |
5,810 | (7,612 | ) | 105 | ||||||||
Net realized gain (loss) on investments |
4,995 | (24,988 | ) | (59,681 | ) | |||||||
Total revenues |
5,687,225 | 4,963,500 | 4,659,173 | |||||||||
Benefits, claims and expenses: |
||||||||||||
Claims and other benefits |
4,658,857 | 3,998,634 | 3,851,582 | |||||||||
Change in deferred acquisition costs |
5,648 | 7,786 | 14,273 | |||||||||
Amortization of present value of future profits and other amortizing intangible assets |
23,304 | 23,560 | 23,763 | |||||||||
Commissions |
126,461 | 118,278 | 147,125 | |||||||||
Reinsurance commissions and expense allowances |
(17,897 | ) | (26,577 | ) | (65,707 | ) | ||||||
Interest expense |
19,893 | 19,937 | 23,694 | |||||||||
Loss on reinsurance and other related costs |
— | 7,624 | — | |||||||||
Restructuring costs |
— | 4,904 | — | |||||||||
Goodwill impairment |
— | — | 3,893 | |||||||||
Other operating costs and expenses |
596,646 | 595,002 | 582,059 | |||||||||
Total benefits, claims and expenses |
5,412,912 | 4,749,148 | 4,580,682 | |||||||||
Income before equity in earnings of unconsolidated subsidiary |
274,313 | 214,352 | 78,491 | |||||||||
Equity in earnings of unconsolidated subsidiary |
— | 280 | 72,813 | |||||||||
Income before income taxes |
274,313 | 214,632 | 151,304 | |||||||||
Provision for income taxes |
86,634 | 74,328 | 56,212 | |||||||||
Net income |
$ | 187,679 | $ | 140,304 | $ | 95,092 | ||||||
Earnings per common share: |
||||||||||||
Basic |
$ | 2.40 | $ | 1.73 | $ | 1.09 | ||||||
Diluted |
$ | 2.38 | $ | 1.73 | $ | 1.08 | ||||||
Weighted average shares outstanding: |
||||||||||||
Weighted average common shares outstanding |
78,748 | 87,227 | 74,997 | |||||||||
Less weighted average treasury shares |
(4,871 | ) | (10,305 | ) | (3,635 | ) | ||||||
Basic weighted shares outstanding |
73,877 | 76,922 | 71,362 | |||||||||
Weighted average common equivalent of preferred shares outstanding |
4,211 | 4,211 | 16,157 | |||||||||
Effect of dilutive securities |
612 | 71 | 342 | |||||||||
Diluted weighted shares outstanding |
78,700 | 81,204 | 87,861 | |||||||||
Cash dividends per common share |
$ | 2.00 | $ | — | $ | — | ||||||
See notes to consolidated financial statements.
F-5
UNIVERSAL AMERICAN CORP. AND SUBSIDIARIES
CONSOLIDATED STATEMENTS OF STOCKHOLDERS' EQUITY AND COMPREHENSIVE INCOME
For the Three Years Ended December 31, 2010
(in thousands)
| |
Preferred Stock Series A |
Preferred Stock Series B |
Common Stock |
Additional Paid-In Capital |
Accumulated Other Comprehensive (Loss)Income |
Retained Earnings |
Treasury Stock |
Total | |||||||||||||||||
|---|---|---|---|---|---|---|---|---|---|---|---|---|---|---|---|---|---|---|---|---|---|---|---|---|---|
Balance at January 1, 2008 |
$ | 47 | $ | 128 | $ | 750 | $ | 890,882 | $ | (66 | ) | $ | 463,583 | $ | (4,258 | ) | $ | 1,351,066 | |||||||
Net income |
— |
— |
— |
— |
— |
95,092 |
— |
95,092 |
|||||||||||||||||
Other comprehensive loss |
— | — | — | — | (36,356 | ) | — | — | (36,356 | ) | |||||||||||||||
Comprehensive income |
58,736 | ||||||||||||||||||||||||
Preferred stock conversion |
(5 | ) | (128 | ) | 133 | — | — | — | — | — | |||||||||||||||
Issuance of common stock |
— | — | 11 | 4,843 | — | — | — | 4,854 | |||||||||||||||||
Purchase price adjustment for acquisition of MemberHealth |
— | — | (20 | ) | (34,521 | ) | — | — | — | (34,541 | ) | ||||||||||||||
Stock based compensation |
— | — | — | 9,469 | — | — | — | 9,469 | |||||||||||||||||
Treasury shares purchased, at cost |
— | — | — | — | — | — | (74,821 | ) | (74,821 | ) | |||||||||||||||
Treasury shares reissued |
— | — | — | (153 | ) | — | — | 1,474 | 1,321 | ||||||||||||||||
Balance at December 31, 2008 |
42 | — | 874 | 870,520 | (36,422 | ) | 558,675 | (77,605 | ) | 1,316,084 | |||||||||||||||
Net income |
— |
— |
— |
— |
— |
140,304 |
— |
140,304 |
|||||||||||||||||
Other comprehensive income |
— | — | — | — | 39,223 | — | — | 39,223 | |||||||||||||||||
Comprehensive income |
179,527 | ||||||||||||||||||||||||
ASC 320-10-65-1 implementation adjustment |
— | — | — | — | (10,716 | ) | 10,716 | — | — | ||||||||||||||||
Issuance of common stock |
— | — | 5 | 542 | — | — | — | 547 | |||||||||||||||||
Stock based compensation |
— | — | — | 9,775 | — | — | — | 9,775 | |||||||||||||||||
Treasury shares purchased, at cost |
— | — | — | — | — | — | (63,693 | ) | (63,693 | ) | |||||||||||||||
Treasury shares reissued |
— | — | — | (128 | ) | — | — | 7,352 | 7,224 | ||||||||||||||||
Balance at December 31, 2009 |
42 | — | 879 | 880,709 | (7,915 | ) | 709,695 | (133,946 | ) | 1,449,464 | |||||||||||||||
Net income |
— |
— |
— |
— |
— |
187,679 |
— |
187,679 |
|||||||||||||||||
Other comprehensive income |
— | — | — | — | 5,446 | — | — | 5,446 | |||||||||||||||||
Comprehensive income |
193,125 | ||||||||||||||||||||||||
Issuance of common stock |
— | — | 7 | 6,153 | — | — | — | 6,160 | |||||||||||||||||
Stock based compensation |
— | — | — | 5,146 | — | — | — | 5,146 | |||||||||||||||||
Treasury shares purchased, at cost |
— | — | — | — | — | — | (5,937 | ) | (5,937 | ) | |||||||||||||||
Treasury shares reissued |
— | — | — | 4,741 | — | — | 9,406 | 14,147 | |||||||||||||||||
Retire Treasury shares |
— | — | (100 | ) | (95,594 | ) | — | (3,365 | ) | 99,059 | — | ||||||||||||||
Dividends |
— | — | — | — | — | (159,411 | ) | — | (159,411 | ) | |||||||||||||||
Balance at December 31, 2010 |
$ | 42 | $ | — | $ | 786 | $ | 801,155 | $ | (2,469 | ) | $ | 734,598 | $ | (31,418 | ) | $ | 1,502,694 | |||||||
See notes to consolidated financial statements.
F-6
UNIVERSAL AMERICAN CORP. AND SUBSIDIARIES
CONSOLIDATED STATEMENTS OF CASH FLOWS
For the Three Years Ended December 31, 2010
(in thousands)
| |
2010 | 2009 | 2008 | |||||||||
|---|---|---|---|---|---|---|---|---|---|---|---|---|
Cash flows from operating activities: |
||||||||||||
Net income |
$ | 187,679 | $ | 140,304 | $ | 95,092 | ||||||
Adjustments to reconcile net income to cash provided by operating activities, net of balances sold: |
||||||||||||
Equity in earnings of unconsolidated subsidiary |
— | (280 | ) | (72,813 | ) | |||||||
Distribution from unconsolidated subsidiary |
— | 5,593 | 67,500 | |||||||||
Deferred income taxes |
28,062 | 9,337 | 7,050 | |||||||||
Realized (gains) losses on investments |
(4,995 | ) | 24,988 | 59,681 | ||||||||
Amortization of intangible assets |
23,304 | 23,560 | 23,763 | |||||||||
Impairment of goodwill |
— | — | 3,893 | |||||||||
Loss on reinsurance, net of tax |
— | 2,221 | — | |||||||||
Net amortization of bond premium |
6,961 | 2,346 | 2,171 | |||||||||
Depreciation expense |
15,615 | 16,758 | 14,951 | |||||||||
Changes in operating assets and liabilities: |
||||||||||||
Deferred policy acquisition costs |
5,648 | 7,786 | 14,273 | |||||||||
Reserves and other policy liabilities—life |
(17,194 | ) | 21,323 | 5,648 | ||||||||
Reserves for future policy benefits—health |
(1,313 | ) | (6,401 | ) | 834 | |||||||
Policy and contract claims—health |
(5,980 | ) | (120,058 | ) | (21,652 | ) | ||||||
Reinsurance balances |
27,078 | (16,610 | ) | 25,839 | ||||||||
Due and unpaid/advance premium, net |
(13,991 | ) | 67,206 | 3,246 | ||||||||
Income taxes payable/receivable |
52,424 | 34,591 | (7,076 | ) | ||||||||
Other Part D (payables)/receivables |
(102,325 | ) | (228,794 | ) | 35,480 | |||||||
Other, net |
31,664 | 30,818 | (75,131 | ) | ||||||||
Cash provided by operating activities |
232,637 | 14,688 | 182,749 | |||||||||
Cash flows from investing activities: |
||||||||||||
Proceeds from sale or redemption of fixed maturity investments |
1,243,440 | 670,157 | 221,142 | |||||||||
Cost of fixed maturity investments purchased |
(1,670,727 | ) | (566,969 | ) | (233,276 | ) | ||||||
Assets transferred on life reinsurance |
— | (454,487 | ) | — | ||||||||
Proceeds from sale of CHCS, net of cash sold |
6,492 | — | — | |||||||||
Purchase of business and return of purchase price, net of cash acquired |
— | — | 40,990 | |||||||||
Purchase of fixed assets |
(8,825 | ) | (18,156 | ) | (20,935 | ) | ||||||
Other investing activities |
7,949 | 2,742 | 735 | |||||||||
Cash (used in) provided by investing activities |
(421,671 | ) | (366,713 | ) | 8,656 | |||||||
Cash flows from financing activities: |
||||||||||||
Net proceeds from issuance of common and preferred stock, net of tax effect |
6,969 | 4,411 | 7,662 | |||||||||
Cost of treasury stock purchases |
(5,937 | ) | (63,693 | ) | (74,821 | ) | ||||||
Dividends paid to stockholders |
(156,095 | ) | — | — | ||||||||
Receipts from CMS contract deposits |
3,810,919 | 4,161,518 | 3,498,773 | |||||||||
Withdrawals from CMS contract deposits |
(4,176,672 | ) | (3,383,056 | ) | (3,713,841 | ) | ||||||
Deposits and interest credited to policyholder account balances |
— | 4,357 | 17,051 | |||||||||
Surrenders and other withdrawals from policyholder account balances |
— | (17,548 | ) | (54,382 | ) | |||||||
Principal repayment on loan payable and other long-term debt |
(80,886 | ) | (6,867 | ) | (28,500 | ) | ||||||
Payment of debt issue costs |
(778 | ) | (1,171 | ) | — | |||||||
Cash (used in) provided by financing activities |
(602,480 | ) | 697,951 | (348,058 | ) | |||||||
Net (decrease) increase in cash and cash equivalents |
(791,514 | ) | 345,926 | (156,653 | ) | |||||||
Cash and cash equivalents at beginning of year |
856,958 | 511,032 | 667,685 | |||||||||
Cash and cash equivalents at end of year |
$ | 65,444 | $ | 856,958 | $ | 511,032 | ||||||
See notes to consolidated financial statements.
F-7
UNIVERSAL AMERICAN CORP. AND SUBSIDIARIES
NOTES TO CONSOLIDATED FINANCIAL STATEMENTS
1. ORGANIZATION AND COMPANY BACKGROUND
Universal American Corp., which we refer to as "we," the "Company," or "Universal American," is a specialty health and life insurance holding company with an emphasis on providing a broad array of health insurance and managed care products and services to the growing senior population. Universal American was incorporated in the State of New York in 1981. Collectively, our insurance company subsidiaries are licensed to sell life, accident and health insurance and annuities in all fifty states, the District of Columbia, Puerto Rico and the U.S. Virgin Islands. We currently sell Medicare Part D prescription drug benefit Plans, known as PDPs, Medicare coordinated care Plans, which we call HMOs, Medicare coordinated care products built around contracted networks of providers, which we call PPOs, Medicare Advantage private fee-for-service Plans, known as PFFS Plans, Medicare supplement, fixed benefit accident and sickness insurance, and senior life insurance. We distribute these products through career and independent general agency systems and on a direct to consumer basis.
Under the Part D program, during 2010, we offered our Community CCRxSM and Prescriba RxSM stand alone PDPs throughout the United States and the U.S. territories. For the 2011 Plan year, based upon a requirement of CMS, we consolidated our PrescribaRxSM prescription drug plans into the Community CCRxSM plans.We also operate a pharmacy benefits manager, or PBM, servicing the PDPs as well as the members in our Medicare Advantage plans offering a Part D benefit.
We currently operate Medicare Advantage PFFS and PPO plans through American Progressive Life & Health Insurance Company of New York and The Pyramid Life Insurance Company and our Medicare Advantage HMOs in Houston and Beaumont, Texas through SelectCare of Texas, L.L.C., in North Texas through SelectCare Health Plans, Inc., and in Oklahoma through SelectCare of Oklahoma, Inc. and GlobalHealth, Inc. All of these companies are our subsidiaries. In addition, since 2007, through a reinsurance arrangement with an unaffiliated HMO, we offer an HMO plan in certain markets in Wisconsin.
On December 30, 2010, we entered into (i) an Agreement and Plan of Merger (the "CVS Agreement") with CVS Caremark Corporation ("CVS Caremark") and Ulysses Merger Sub, L.L.C., an indirect wholly-owned subsidiary of CVS Caremark, to provide for the purchase of our Medicare Part D Business by CVS Caremark and (ii) a Separation Agreement with Universal American Spin Corp., a newly-formed wholly-owned subsidiary of the Company ("Newco"), to provide for the separation of our Medicare Part D Business from our remaining businesses, which include our Medicare Advantage and Traditional Insurance businesses (collectively, the "Newco Businesses.") We refer to the sale of our Medicare Part D Business to CVS Caremark and related transactions as the "Part D Sale Transaction" or the "Transactions."
Pursuant to the CVS Agreement, CVS Caremark will pay Universal American shareholders $1.25 billion plus the excess capital in the entities that operate our Medicare Part D Business as of December 31, 2010, less the amount of our outstanding debt and trust preferred securities and certain other amounts. At the effective time of the merger, we expect that each share of common stock and preferred stock of the Company will be cancelled and converted into the right to receive one share of common stock of Newco which will own the Newco Businesses and approximately $13.00 to $13.20 per share in cash. The transaction is expected to close by the end of the second quarter of 2011 and is subject to customary closing conditions, including approval of our shareholders and necessary regulatory approvals. On February 28, 2011 the Federal Trade Commission granted early termination of the waiting period under the Hart-Scott-Rodino Antitrust Improvements Act of 1976 with respect to the Part D Sale Transaction. We expect to file a Registration Statement on Form S-4/Proxy Statement
F-8
UNIVERSAL AMERICAN CORP. AND SUBSIDIARIES
NOTES TO CONSOLIDATED FINANCIAL STATEMENTS (Continued)
1. ORGANIZATION AND COMPANY BACKGROUND (Continued)
Prospectus with the SEC by the middle of March that will contain additional information regarding the Part D Sale Transaction.
On June 9, 2010, we sold the outstanding common stock of CHCS Services, Inc., our administrative services company, to Patni Americas, Inc, a wholly-owned subsidiary of Patni Computer Systems Limited (NYSE: PTI), with an effective date of April 1, 2010. The operations of CHCS are included in consolidated results up to the effective date of the sale. This transaction is discussed in more detail under "Sale of CHCS" in Note 14 of the Notes to Consolidated Financial Statements.
On April 24, 2009, we completed the closing of the previously announced Life Insurance and Annuity Reinsurance transaction with the Commonwealth Annuity and Life Insurance Company, known as Commonwealth, and the First Allmerica Financial Life Insurance Company, Goldman Sachs Group, Inc. subsidiaries (NYSE:GS). Under this transaction, effective April 1, 2009, we reinsured substantially all of our in force life insurance and annuity business under a 100% coinsurance treaty. During 2010, the annuity portion of this transaction was commuted with Commonwealth and reinsured with Athene Life Re Ltd. (Athene), a Bermuda reinsurer. This transaction is discussed in more detail in Note 10 of the Notes to Consolidated Financial Statements.
2. BASIS OF PRESENTATION
We have prepared the accompanying Consolidated Financial Statements in conformity with U.S. generally accepted accounting principles, or U.S. GAAP, in accordance with Article 10 of the Securities and Exchange Commission's Regulation S-X, and consolidate the accounts of Universal American and its subsidiaries:
- •
- American Pioneer Life Insurance Company;
- •
- American Progressive;
- •
- Constitution Life Insurance Company;
- •
- Marquette National Life Insurance Company;
- •
- Pennsylvania Life Insurance Company;
- •
- Pyramid Life;
- •
- Union Bankers Insurance Company;
- •
- Heritage Health Systems, Inc.; and
- •
- MemberHealth, LLC.
During 2005, we entered into a strategic alliance with Caremark and created Part D Management Services, L.L.C., known as PDMS. PDMS was 50% owned by Universal American and 50% owned by Caremark. We did not control PDMS and therefore we did not consolidate PDMS in our financial statements. We accounted for our investment in PDMS on the equity basis and included it in other assets. PDMS was dissolved in December 2009. See Note 24—Other Operational Disclosures in the Notes to Consolidated Financial Statements, for additional information on PDMS and its dissolution,
For the insurance and health plan subsidiaries, U.S. GAAP differs from statutory accounting practices prescribed or permitted by regulatory authorities.
F-9
UNIVERSAL AMERICAN CORP. AND SUBSIDIARIES
NOTES TO CONSOLIDATED FINANCIAL STATEMENTS (Continued)
2. BASIS OF PRESENTATION (Continued)
We have eliminated all material intercompany transactions and balances.
Subsequent events were evaluated through the date these consolidated financial statements were issued.
Use of Estimates: The preparation of our financial statements in conformity with U.S. GAAP requires us to make estimates and assumptions that affect the amounts reported by us in our consolidated financial statements and the accompanying notes. Critical accounting policies require significant subjective or complex judgments, often as a result of the need to make estimates about the effect of matters that are inherently uncertain. These estimates are based on information available at the time the estimates are made, as well as anticipated future events. Actual results could differ materially from these estimates. We periodically evaluate our estimates, and as additional information becomes available or actual amounts become determinable, we may revise the recorded estimates and reflect the revisions in operating results. In our judgment, the accounts involving estimates and assumptions that are most critical to the preparation of our financial statements are policy-related liabilities and expense recognition, deferred policy acquisition costs, goodwill and other intangible assets, investment valuation, revenue recognition—Medicare Advantage products, and income taxes. There have been no changes in our critical accounting policies during the current year.
3. SUMMARY OF SIGNIFICANT ACCOUNTING POLICIES
Cash Equivalents: We consider all highly liquid investments that have maturities of three months or less at the date of purchase to be cash equivalents. Cash equivalents include such items as certificates of deposit, commercial paper, and money market funds.
Investments: The Company follows Accounting Standards Codification No. 320, Investments—Debt and Equity Securities, known as ASC 320. ASC 320 requires that debt and equity securities be classified into one of three categories and accounted for as follows:
- •
- Debt securities that we have the positive intent and the ability to hold to maturity are classified as "held to maturity"
and reported at amortized cost;
- •
- Debt and equity securities that are held for current resale are classified as "trading securities" and reported at fair
value, with unrealized gains and losses included in earnings; and
- •
- Debt and equity securities not classified as held to maturity or as trading securities are classified as "available for sale" and reported at fair value.
Unrealized gains and losses on available for sale securities are excluded from earnings and reported as accumulated other comprehensive income (loss), net of tax and deferred policy acquisition cost adjustments unless the losses are determined to be other-than-temporary.
As of December 31, 2010 and 2009, we classified all fixed maturity securities as available for sale and carried them at fair value, with the unrealized gain or loss, net of tax, included in accumulated other comprehensive income (loss). We stated policy loans at the unpaid principal balance. We carried short-term investments at cost, which approximates fair value. Other invested assets consist principally of equity securities, mortgage loans and collateral loans. We carried equity securities at current fair value. We carried mortgage loans at the unpaid principal balance. We carried collateral loans at the underlying value of their collateral that is the cash surrender value of life insurance.
F-10
UNIVERSAL AMERICAN CORP. AND SUBSIDIARIES
NOTES TO CONSOLIDATED FINANCIAL STATEMENTS (Continued)
3. SUMMARY OF SIGNIFICANT ACCOUNTING POLICIES (Continued)
The fair value for fixed maturity securities is largely determined by third party pricing service market prices. The typical inputs that third party pricing services use are
- •
- reported trades,
- •
- benchmark yields,
- •
- issuer spreads,
- •
- bids,
- •
- offers, and
- •
- estimated cash flows and prepayment speeds.
Based on the typical trading volumes and the lack of quoted market prices for fixed maturities, third party pricing services will normally derive the security prices through recent reported trades for identical or similar securities making adjustments through the reporting date based upon available market observable information as outlined above. If there are no recent reported trades, the third party pricing services may use matrix or model processes to develop a security price where they develop future cash flow expectations based upon collateral performance and discount this at an estimated market rate. Included in the pricing for mortgage-backed and asset-backed securities are estimates of the rate of future prepayments of principal over the remaining life of the securities. Such estimates are derived based on the characteristics of the underlying structure and prepayment speeds previously experienced at the interest rate levels projected for the underlying collateral. Actual prepayment experience may vary from these estimates.
We regularly evaluate the amortized cost of our investments compared to the fair value of those investments. We generally recognize impairments of securities when we consider a decline in fair value below the amortized cost basis to be other-than-temporary. The evaluation includes the intent and ability to hold the security to recovery, and it is considered on an individual security basis, not on a portfolio basis. We generally recognize impairment losses for mortgage-backed and asset-backed securities when an adverse change in the amount or timing of estimated cash flows occurs, unless the adverse change is solely a result of changes in estimated market interest rates. We also recognize impairment losses when we determine declines in fair values based on quoted prices to be other than temporary.
The evaluation of impairment is a quantitative and qualitative process which is subject to risks and uncertainties and is intended to determine whether we should recognize declines in the fair value of investments in current period earnings. The principal risks and uncertainties are:
- •
- changes in general economic conditions,
- •
- the issuer's financial condition or near term recovery prospects,
- •
- the effects of changes in interest rates or credit spreads, and
- •
- the recovery period.
Our accounting policy requires that we assess a decline in the value of a security below its cost or amortized cost basis to determine if the decline is other-than-temporary. During 2009, ASC 320-10-65-1
F-11
UNIVERSAL AMERICAN CORP. AND SUBSIDIARIES
NOTES TO CONSOLIDATED FINANCIAL STATEMENTS (Continued)
3. SUMMARY OF SIGNIFICANT ACCOUNTING POLICIES (Continued)
modified the criteria for recognition of other-than-temporary impairment (OTTI) of a debt security and we have adopted this new criterion into our accounting policy for investments.
- •
- If we intend to sell a debt security, or it is more likely than not that we will be required to sell the debt security
before recovery of its amortized cost basis, we recognize an OTTI in earnings equal to the entire difference between the debt security's amortized cost basis and its fair value.
- •
- If we do not intend to sell the debt security and it is not more likely than not that we will be required to sell the debt security before recovery of its amortized cost basis, but the present value of the cash flows expected to be collected is less than the amortized cost basis of the debt security (referred to as the credit loss), an OTTI is considered to have occurred. In this instance, we bifurcate the total OTTI into the amount related to the credit loss, which we recognize in earnings, with the remaining amount of the total OTTI attributed to other factors (referred to as the noncredit portion) recognized as a separate component in other comprehensive income (loss).
After the recognition of an OTTI, we account for the debt security as if it had been purchased on the measurement date of the OTTI, with an amortized cost basis equal to the previous amortized cost basis less the OTTI recognized in earnings.
We have a security monitoring process overseen by our Investment Committee, consisting of investment and accounting professionals who identify securities that, due to specified characteristics, as described below, we subject to an enhanced analysis on a quarterly basis. We review our fixed maturity securities at least quarterly to determine if an other-than-temporary impairment is present based on specified quantitative and qualitative factors. The primary factors that we consider in evaluating whether a decline in value is other-than-temporary are
- •
- the length of time and the extent to which the fair value has been or is expected to be less than cost or amortized cost,
- •
- the financial condition, credit rating and near-term prospects of the issuer,
- •
- whether the debtor is current on contractually obligated interest and principal payments, and
- •
- our intent and ability to retain the investment for a period of time sufficient to allow for recovery.
Each quarter, during this analysis, we assert our intent and ability to retain until recovery those securities we judge to be temporarily impaired. Once identified, we restrict trading on these securities unless approved by members of the Investment Committee. The Investment Committee will only authorize the sale of these securities based on criteria that relate to events that could not have been foreseen. The principal criteria are the deterioration in the issuer's creditworthiness, a change in regulatory requirements or a major business combination or major disposition.
Realized investment gains and losses on the sale of securities are based on the specific identification method.
We generally record investment income when earned. We amortize premiums and discounts arising from the purchase of mortgage-backed and asset-backed securities into investment income over the estimated remaining term of the securities, adjusted for anticipated prepayments. We use the prospective method to account for the impact on investment income of changes in the estimated future
F-12
UNIVERSAL AMERICAN CORP. AND SUBSIDIARIES
NOTES TO CONSOLIDATED FINANCIAL STATEMENTS (Continued)
3. SUMMARY OF SIGNIFICANT ACCOUNTING POLICIES (Continued)
cash flows for these securities. We amortize premiums and discounts on other fixed maturity securities using the interest method over the remaining term of the security.
Reverse Repurchase Agreements: Beginning in the second quarter of 2010, we began to enter into tri-party reverse repurchase agreements, as a means of enhancing investment yield. We carry these securities at fair value, with unrealized gains and losses reflected in accumulated other comprehensive income. Interest received on the reverse repurchase agreements is recorded in interest income at the contractually specified rate.
Our policy is to require all such agreements to be adequately collateralized, with daily mark-to-market funding requirements to protect us against counterparty credit exposure.
At December 31, 2010 we had no reverse repurchase agreements outstanding.
Deferred Policy Acquisition Costs: We defer the cost of acquiring new business, principally non-level commissions, agency production, policy underwriting, policy issuance, and associated costs, all of which vary with, and are primarily related to the production of new and renewal business.
For other life and health products, we amortize DAC in proportion to premium revenue using the same assumptions used in estimating the liabilities for future policy benefits in accordance with ASC 944. Under ASC 944, Financial Services—Insurance, any unamortized DAC relating to lapsed policies must be amortized as of the date of the lapse.
We test for the recoverability of DAC at least annually. To the extent that we determine that the present value of future policy premiums would not be adequate to recover the unamortized costs, we would write off the excess deferred policy acquisition costs. Based on our review of DAC recoverability in 2010, we determined the DAC was recoverable.
Goodwill and other intangible assets:
Valuation of acquired intangible assets: Business combinations accounted for as a purchase result in the allocation of the purchase consideration to the fair values of the assets and liabilities acquired, including the present value of future profits, establishing these fair values as the new accounting basis. We base the present value of future profits on an estimate of the cash flows of the insurance policies acquired, discounted to reflect the present value of those cash flows. The discount rate we select depends upon the general market conditions at the time of the acquisition and the inherent risk in the transaction. We allocate purchase consideration in excess of the fair value of net assets acquired, including the present value of future profits and other identified intangibles, for a specific acquisition, to goodwill. We perform the allocation of purchase price in the period in which we consummate the purchase. Adjustments, if any, made within a twelve-month period of the business combination, generally relate to resolution of pre-acquisition contingencies, tax matters and refinements made to estimates of fair value in connection with the preliminary allocation.
F-13
UNIVERSAL AMERICAN CORP. AND SUBSIDIARIES
NOTES TO CONSOLIDATED FINANCIAL STATEMENTS (Continued)
3. SUMMARY OF SIGNIFICANT ACCOUNTING POLICIES (Continued)
Amortizing intangible assets: We must estimate and make assumptions regarding the useful life we assign to our amortizing intangible assets. Set forth below are our annual amortization policies for each of the main categories of amortizing intangible assets:
Description
|
Weighted Average Life At Acquisition |
Amortization Basis | |||
|---|---|---|---|---|---|
Insurance policies acquired |
9 | The pattern of projected future cash flows for the policies acquired over the estimated weighted average life of the policies acquired | |||
Distribution channel acquired |
3–30 |
Straight line over the estimated life of the asset |
|||
Membership base acquired |
7–10 |
Straight line over the estimated weighed average life of the membership base |
|||
Trademarks/tradenames |
9 |
Straight line over the estimated weighted average life of the trademarks/tradenames |
|||
Licenses |
15 |
Straight line over the estimated weighed average life of the licenses |
|||
Provider contracts |
10 |
Straight line over the estimated weighted average life of the contracts |
|||
Non-compete |
7 |
Straight line over the length of the agreement |
|||
In accordance with ASC 350, Intangibles—Goodwill and Other, we periodically review amortizing intangible assets whenever adverse events or changes in circumstances indicate the carrying value of the asset may not be recoverable. In assessing recoverability, we must make assumptions regarding estimated future cash flows and other factors to determine if an impairment loss may exist, and, if so, estimate fair value. If these estimates or their related assumptions change in the future, we may be required to record impairment losses for these assets. Based on our review of recoverability, we determined there was no impairment of our amortizing intangible assets during 2010, 2009 or 2008.
Goodwill: ASC 350 requires that goodwill balances be reviewed for impairment at the reporting unit level at least annually, or more frequently if events occur or circumstances change that would indicate that a triggering event, as defined in ASC 350, has occurred. A reporting unit is defined as an operating segment or one level below an operating segment. Our reporting units are equivalent to our operating segments.
F-14
UNIVERSAL AMERICAN CORP. AND SUBSIDIARIES
NOTES TO CONSOLIDATED FINANCIAL STATEMENTS (Continued)
3. SUMMARY OF SIGNIFICANT ACCOUNTING POLICIES (Continued)
Our annual goodwill impairment test follows a two step process as defined in ASC 350. In the first step, the fair value of a reporting unit is compared to its carrying value. If the carrying value of a reporting unit exceeds its fair value, the second step of the impairment test is performed for purposes of measuring the impairment. In the second step, the fair value of the reporting unit is allocated to all of the assets and liabilities of the reporting unit to determine an implied goodwill value. This allocation is similar to a purchase price allocation performed in purchase accounting. If the carrying amount of the reporting unit goodwill exceeds the implied goodwill value, an impairment loss shall be recognized in an amount equal to that excess.
Our strategy, long-range business plan, and annual planning process are used to support our valuation of our reporting units. Our valuations are based primarily on an analysis of discounted cash flows for each reporting unit. Outcomes from the discounted cash flow analysis are compared to other market approach valuation methodologies for reasonableness. Key assumptions, including changes in membership, premium yields, medical cost trends and selected government contract extensions, are consistent with those utilized in our long-range business plan and annual planning process. Other assumptions include levels of economic capital, future business growth, earnings projections and the weighted average cost of capital used for purposes of discounting. We use a range of discount rates that correspond to a market-based, weighted-average cost of capital. Decreases in business growth, decreases in earnings projections, increases in the weighted average cost of capital and increases in the amount of required capital for a reporting unit will all cause the reporting unit's fair value to decrease. If these assumptions differ from actual, the estimates underlying our goodwill impairment tests could be adversely affected. These assumptions can be impacted by general factors, including: the U.S healthcare economy, health care reform and federal monetary policy.
We perform our annual goodwill assessment for the individual reporting units as of October 1. Based on this assessment we determined that the fair value of each reporting unit, for which goodwill had been allocated, was in excess of the respective reporting unit's carrying value (the first step of the goodwill impairment test) for 2010 and 2009. For 2008, we recorded an immaterial goodwill impairment, that eliminated the goodwill in our Traditional reporting unit.
During each quarter, we perform a review of certain key components of our valuation of our reporting units, including the operating performance of the reporting units compared to plan (which was the primary basis for the prospective financial information included in our last goodwill impairment test as of October 1, 2010), our weighted average cost of capital and our stock price and market capitalization. Based on our review of these items through the reporting date, we believe that our estimate of fair value for each of our reporting units remains reasonable.
Recognition of Premium Revenues and Policy Benefits—Medicare Plans: Medicare is a federal health insurance program that provides Americans age 65 and over, and some disabled persons under the age of 65, certain hospital, medical and prescription drug benefits. The Medicare program consists of four parts, labeled Parts A–D.
Part A—Hospitalization benefits are provided under Part A. These benefits are financed largely through Social Security taxes. Beneficiaries are not required to pay any premium for Part A benefits. However, they are still required to pay out-of-pocket deductibles and coinsurance.
Part B—Benefits for medically necessary services and supplies including outpatient care, doctor's services, physical or occupational therapists and additional home health care are provided under Part B.
F-15
UNIVERSAL AMERICAN CORP. AND SUBSIDIARIES
NOTES TO CONSOLIDATED FINANCIAL STATEMENTS (Continued)
3. SUMMARY OF SIGNIFICANT ACCOUNTING POLICIES (Continued)
These benefits are financed through premiums paid to the federal government by those eligible beneficiaries who choose to enroll in the program. The beneficiaries are also required to pay out-of- pocket deductibles and coinsurance.
Part C—Under the Medicare Advantage program, private plans provide Medicare-covered health care benefits to enrollees and can include prescription drug coverage. Part C benefits are provided through private HMO, PPO and PFFS plans. An individual must have Medicare Part A and Part B in order to join a Medicare Advantage Plan.
Part D—Under Part D, prescription drug benefits may be provided by private Plans to individuals eligible for benefits under Part A and/or enrolled in Part B. These benefits are provided on both a stand-alone basis and also in connection with certain of our HMO, PPO and PFFS plans.
These programs are administered by Centers for Medicare and Medicaid Services, known as CMS, an agency of the United States Department of Health and Human Services. We contract with CMS under the Medicare program to provide a comprehensive array of health insurance and prescription drug benefits to Medicare eligible persons. These benefits are provided through HMO, PPO, PFFS and stand-alone Part D Plans in exchange for contractual risk-adjusted payments received from CMS.
Premiums received pursuant to Medicare contracts with CMS are recorded as revenue in the month in which members are entitled to receive benefits. Premiums collected in advance are deferred. Receivables from CMS and Plan members are recorded net of estimated uncollectible amounts and are reported as due and unpaid premiums in the consolidated balance sheets. We routinely monitor the collectability of specific accounts, the aging of member premium receivables, historical retroactivity trends and prevailing and anticipated economic conditions. Certain commissions are deferred and amortized in relation to the corresponding revenues which is no longer than a one-year period.
Policy and contract claims include actual claims reported but not paid and estimates of health care services and prescription drug claims incurred but not reported. The estimated claims incurred but not reported are based upon current enrollment, historical claim receipt and payment patterns, historical medical cost trends and health service utilization statistics. These estimates and assumptions are derived from and are continually evaluated using per member per month trend analysis, claims trends developed from our historical experience in the preceding month (adjusted for known changes in estimates of recent hospital and drug utilization data), provider contracting changes, changes in benefit levels, product mix and seasonality. These estimates are based on information available at the time the estimates are made, as well as anticipated future events. Actual results could differ materially from these estimates. We periodically evaluate our estimates, and as additional information becomes available or actual amounts become determinable, we may revise the recorded estimates and reflect them in operating results.
Membership
We analyze the membership for our Medicare HMO, PPO, PFFS and stand-alone Part D Plans in our administrative system and reconcile to the enrollment provided by CMS. There are timing differences between the addition of a member to our administrative system and the approval, or accretion, of the member by CMS. Additionally, the monthly payments from CMS include adjustments to reflect changes in the status of membership as a result of retroactive terminations, additions, whether CMS is secondary to other insurance coverage or other changes. Current period membership,
F-16
UNIVERSAL AMERICAN CORP. AND SUBSIDIARIES
NOTES TO CONSOLIDATED FINANCIAL STATEMENTS (Continued)
3. SUMMARY OF SIGNIFICANT ACCOUNTING POLICIES (Continued)
net premium, CMS subsidies and claims expense are adjusted to reflect retroactive changes in membership.
Medicare Risk Adjustment Provisions
CMS uses risk-adjusted rates per member to determine the monthly payments to Medicare Plans. CMS has implemented a risk adjustment model which apportions premiums paid to all health Plans according to health diagnoses. The risk adjustment model uses health status indicators, or risk scores, to improve the accuracy of payment. The CMS risk adjustment model pays more for members with increasing health severity. Under this risk adjustment methodology, diagnosis data from inpatient and ambulatory treatment settings are used by CMS to calculate the risk adjusted premium payment to Medicare Plans. The monthly risk-adjusted premium per member is determined by CMS based on normalized risk scores of each member from the prior year. Annually, CMS provides the updated risk scores to the Plans and revises premium rates prospectively, beginning with the July remittance for current Plan year members. CMS will also calculate the retroactive adjustments to premium related to the revised risk scores for the current year for current Plan year members and for the prior year for prior Plan year members.
Medicare Advantage Health Benefit Plans
We receive monthly payments from CMS related to members in our HMO, PPO and PFFS Plans. The recognition of the premium and cost reimbursement components under these Plans is described below:
CMS Direct Premium Subsidy—We receive a monthly premium from CMS based on the Plan year bid we submitted to CMS. The monthly payment is a risk-adjusted amount per member and is based upon the member's risk score status, as determined by CMS. The CMS premium is recognized over the contract period and reported as premium revenue. In addition, under Medicare Secondary Payer, or MSP provisions, the premium will be reduced by CMS if CMS has determined that it is secondary to other insurance coverage.
Revenue Adjustments—The monthly CMS Direct Premium Subsidy is based upon the members' health status, which is determined by CMS, as more fully described above under "Medicare Risk Adjustment Provisions." All health benefit organizations that contract with CMS must capture, collect, and submit the necessary diagnosis code information to CMS within prescribed deadlines. Accordingly, we collect, capture, and submit the necessary and available diagnosis data to CMS within prescribed deadlines for our HMO, PPO and PFFS plans. We estimate changes in CMS premiums related to revenue adjustments based upon the diagnosis data submitted to CMS and ultimately accepted by CMS. Risk scores are updated annually by CMS and reconciled to our estimated amounts by us with any adjustments recorded in premium revenue. Although such adjustments have not been considered to be material in the past, future adjustments could be material.
F-17
UNIVERSAL AMERICAN CORP. AND SUBSIDIARIES
NOTES TO CONSOLIDATED FINANCIAL STATEMENTS (Continued)
3. SUMMARY OF SIGNIFICANT ACCOUNTING POLICIES (Continued)
Member Premium—We receive a monthly premium from members based on the Plan year bid we submitted to CMS. The member premium, which is fixed for the entire Plan year, is recognized over the contract period and reported as premium revenue. We establish a reserve for member premium that is past due that reflects our estimate of the collectability of the member premium.
Low-Income Premium Subsidy—For qualifying low-income status, or LIS, members of our Medicare Advantage Health Benefit Plans with Part D benefits, CMS pays us for some or all of the LIS member's monthly premium. The CMS payment is dependent upon a member's income level which is determined by the Social Security Administration. Low-income premium is recognized over the contract period and reported as premium revenue.
Low-Income Cost Sharing Subsidy—For qualifying LIS members of our Medicare Advantage Health Benefit Plans with Part D benefits, CMS will reimburse the Plans for all or a portion of the LIS member's deductible, coinsurance and co-payment amounts above the out of pocket threshold for low income beneficiaries. Low-income cost sharing subsidies are paid by CMS prospectively as a fixed amount per member per month, and are determined based upon the Plan year bid we submitted to CMS. After the close of the annual Plan year, CMS reconciles actual experience to low-income cost sharing subsidies paid to the Plan and any differences are settled between CMS and the Plan. The low-income subsidy is accounted for as deposit accounting and therefore not recognized in operations.
Catastrophic Reinsurance—We receive payments from CMS for catastrophic reinsurance for members of our Medicare Advantage Health Benefit Plans with Part D benefits.
For the members of our HMO and PPO Plans with Part D benefits, CMS reimburses Plans for 80% of the drug costs after a member reaches his or her out of pocket catastrophic threshold through a catastrophic reinsurance subsidy. Catastrophic reinsurance subsidies are paid by CMS prospectively as a fixed amount per member per month, and are determined based upon the Plan year bid we submitted to CMS. After the close of the annual Plan year, CMS reconciles actual experience compared to catastrophic reinsurance subsidies paid to the Plan and any differences are settled between CMS and the Plan. The catastrophic reinsurance subsidy is accounted for as deposit accounting and therefore not recognized in operations.
For members of our PFFS Plans with Part D benefits, CMS makes prospective monthly catastrophic reinsurance payments to the Plans based on estimated average reinsurance payments to other Medicare Advantage—Prescription Drug (MA-PD) Plans that provide Part D benefits. Based upon the current guidelines from CMS, PFFS Plans are at risk for the variance between their actual expense and the CMS payments. As a result, we do not follow deposit accounting for these payments.
CMS Risk Corridor Provisions for the Part D benefits of our HMO and PPO Plans —Premiums from CMS for members of our HMO and PPO Plans with Part D benefits, are subject to risk corridor provisions. The CMS risk corridor calculation compares the target amount of prescription drug costs (limited to costs under the standard coverage as defined by CMS) less rebates in our annual Plan bid (target amount) to actual experience. Variances of more than 5% above the target amount will result in CMS making additional payments to us, and variances of more than 5% below the target amount will require us to refund to CMS a portion of the premiums we received. Risk corridor payments due to or from CMS are estimated throughout the year and are recognized as adjustments to premium revenues and due and unpaid premiums. This estimate requires us to consider factors that may not be certain,
F-18
UNIVERSAL AMERICAN CORP. AND SUBSIDIARIES
NOTES TO CONSOLIDATED FINANCIAL STATEMENTS (Continued)
3. SUMMARY OF SIGNIFICANT ACCOUNTING POLICIES (Continued)
including: membership, risk scores, prescription drug events, or PDEs, and rebates. After the close of the annual Plan year, CMS reconciles actual experience to the target amount and any differences are settled between CMS and the Plan.
Medicare Part D Plans
We receive monthly payments from CMS related to members in our stand-alone Part D Plans. The recognition of the premium and subsidy components under Part D is described below:
CMS Direct Subsidy Premium—We receive a monthly premium from CMS based on the Plan year bid we submitted to CMS. The monthly payment is a risk-adjusted amount per member and is based upon the member's risk score status, as determined by CMS. The CMS premium is recognized over the contract period and reported as premium revenue.
Revenue Adjustments—The monthly CMS Direct Premium Subsidy is based upon the members' health status, which is determined by CMS, as more fully described above under "Medicare Risk Adjustment Provisions." We do not have access to diagnosis data with respect to our stand-alone PDP members and therefore, we cannot anticipate changes in our members' risk scores. Changes in CMS premiums related to risk-score adjustments for our stand-alone PDP membership are recognized when the amounts become determinable and collectability is reasonably assured, which occurs when we are notified by CMS of such adjustments. Although such adjustments have not been considered to be material in the past, future adjustments could be material.
Member Premium—We receive a monthly premium from members based on the Plan year bid we submitted to CMS. The member premium, which is fixed for the entire Plan year, is recognized over the contract period and reported as premium revenue.
Low-Income Premium Subsidy—For qualifying low-income status, or LIS, members, CMS pays us for some or all of the LIS member's monthly premium. The CMS payment is dependent upon a member's income level which is determined by the Social Security Administration. Low-income premium is recognized over the contract period and reported as premium revenue.
Low-Income Cost Sharing Subsidy—For qualifying LIS members, CMS will reimburse Plans for all or a portion of the LIS member's deductible, coinsurance and co-payment amounts above the out of pocket threshold for low income beneficiaries. Low-income cost sharing subsidies are paid by CMS prospectively as a fixed amount per member per month, and are determined based upon the Plan year bid we submitted to CMS. After the close of the annual Plan year, CMS reconciles actual experience to low-income cost sharing subsidies paid to the Plan and any differences are settled between CMS and the Plan. See "Deposit Accounting" below for a description of the accounting for low-income cost sharing subsidies.
Catastrophic Reinsurance Subsidy—CMS reimburses Plans for 80% of the drug costs after a member reaches his or her out of pocket catastrophic threshold through a catastrophic reinsurance subsidy. Catastrophic reinsurance subsidies are paid by CMS prospectively as a fixed amount per member per month, and are determined based upon the Plan year bid we submitted to CMS. After the close of the annual Plan year, CMS reconciles actual experience compared to catastrophic reinsurance subsidies paid to the Plan and any differences are settled between CMS and the Plan. See "Deposit Accounting" below for a description of the accounting for catastrophic reinsurance subsidies.
F-19
UNIVERSAL AMERICAN CORP. AND SUBSIDIARIES
NOTES TO CONSOLIDATED FINANCIAL STATEMENTS (Continued)
3. SUMMARY OF SIGNIFICANT ACCOUNTING POLICIES (Continued)
CMS Risk Corridor—Premiums from CMS are subject to risk sharing through the Medicare Part D risk corridor provisions. The CMS risk corridor calculation compares the target amount of prescription drug costs (limited to costs under the standard coverage as defined by CMS) less rebates in our annual Plan bid to actual experience. Variances of more than 5% above the target amount will result in CMS making additional payments to us, and variances of more than 5% below the target amount will require us to refund to CMS a portion of the premiums we received. Risk corridor payments due to or from CMS are estimated throughout the year and are recognized as adjustments to premium revenues and due and unpaid premiums. This estimate requires us to consider factors that may not be certain, including: membership, risk scores, prescription drug events, or PDEs, and rebates. After the close of the annual Plan year, CMS reconciles actual experience to the target amount and any differences are settled between CMS and the Plan.
Deposit Accounting—Low-income cost sharing and catastrophic reinsurance subsidies represent funding from CMS for which we assume no risk and are reported as increases to CMS contract deposits in the consolidated balance sheets. Payments of the actual prescription drug costs related to the low-income cost sharing and catastrophic reinsurance are reported as decreases to CMS contract deposits in the consolidated balance sheets. We do not recognize premium revenues or claims expense for this activity. These receipts and payments are reported as financing activities in our consolidated statements of cash flows.
Recognition of Premium Revenues and Policy Benefits for our Traditional Accident & Health Insurance Products: Our traditional accident and health products include Medicare supplement, fixed benefit accident and sickness and other health, and long-term care products. These products are considered to be long-duration contracts in accordance with ASC 944-40, Financial Services—Insurance—Claim Costs and Liabilities for Future Policy Benefits, because they are largely guaranteed renewable (renewable at the option of the insured). For these products, we record premiums as revenue over the premium-paying periods of the contracts when due from policyholders. We recognize benefits and expenses associated with these policies over the current and anticipated renewal periods of the policies so as to result in recognition of profits over the life of the policies. We accomplish this association by recording a provision for future policy benefits and amortizing deferred policy acquisition costs. The liability for future policy benefits for accident & health policies consists of active life reserves and the estimated present value of the remaining ultimate net cost of incurred claims. Active life reserves consist primarily of unearned premiums and additional contract reserves. We compute the additional contract reserves on the net level premium method using assumptions for future investment yield, mortality and morbidity. The assumptions are based on past experience. We establish claim reserves for future payments not yet due on incurred claims, primarily relating to individual disability and long-term care insurance and group long-term disability insurance products. We initially establish these reserves based on past experience, and they are continuously reviewed and updated with any related adjustments recorded to current operations. Claim liabilities represent policy benefits due for unpaid claims, consisting primarily of claims in the course of settlement and a liability for incurred but not yet reported claims, known as IBNR.
Our accounting for premium revenues and policy benefits, particularly a) the recognition of benefits and expenses associated with earned premiums as the related premiums are earned and b) the
F-20
UNIVERSAL AMERICAN CORP. AND SUBSIDIARIES
NOTES TO CONSOLIDATED FINANCIAL STATEMENTS (Continued)
3. SUMMARY OF SIGNIFICANT ACCOUNTING POLICIES (Continued)
recording a liability for future policy benefits consisting of active life reserves and the estimated present value of the remaining ultimate net cost of incurred claims is as follows:
- •
- Premiums are recognized as revenue, net of reinsurance, over the period to which they relate. While these products are
long-duration, they are typically one-year policies that are guaranteed renewable at the option of the insured, therefore the annual premium is recorded as revenue over the
policy period (one year), with any premium paid in advance recorded as a liability. Premiums due and unpaid are recorded as an asset. Changes in advance and due and unpaid premium, net of reinsurance,
are reported in the net premium and policyholder fees earned line in our consolidated statements of operations.
- •
- Claims liabilities are accrued when events occur, including (i) claims in the course of settlement and
(ii) incurred but not yet reported claims. The change in the claim liability, net of reinsurance, is reported in the claims and other benefits line in our consolidated statements of operations.
- •
- Active life reserves ("ALR") are established, consisting primarily of unearned premiums and additional contract reserves
computed on the net level premium method. Additionally, claim reserves are established for the present value of future payments not yet due on incurred claims ("PVANYD"). Changes in the ALR and the
PVANYD, net of reinsurance, are reported in reserves and other policy benefits—health line in our consolidated statements of operations.
- •
- Expenses eligible for capitalization as deferred policy acquisition costs, such as commissions in excess of the ultimate commission and underwriting costs, are capitalized and amortized over the anticipated life of the policy.
Recognition of Premium Revenues and Policy Benefits for Traditional Life Products: We generally recognize premiums from traditional life policies as revenue when due. We match benefits and expenses with this revenue so as to result in the recognition of profits over the life of the contracts. We accomplish this matching by recording a provision for future policy benefits and the deferral and subsequent amortization of policy acquisition costs. The liability for future policy benefits represents the present value of future benefits to be paid to or on behalf of policyholders, less the future value of net premiums and we calculate it based on actuarially recognized methods using morbidity and mortality tables, which we modify to reflect our actual experience when appropriate. The liability for unpaid claims, including IBNR, reflects estimates of amounts to fully settle known reported claims related to insured events that we estimate have occurred, but have not yet been reported to us. On April 24, 2009, we reinsured substantially all of our in-force traditional life insurance and annuity business to the Commonwealth Annuity and Life Insurance Company, known as Commonwealth, and the First Allmerica Financial Life Insurance Company, Goldman Sachs Group, Inc. subsidiaries (NYSE:GS). This transaction is discussed in more detail in Note 10 of the Notes to Consolidated Financial Statements.
Recognition of Revenues, Contract Benefits and Expenses for Investment and Universal Life-Type Policies: Revenues for universal life-type policies and investment products consist of mortality charges for the cost of insurance and surrender charges assessed against policyholder account balances during the period. We do not reflect amounts received for investment and universal life type products as premium revenue; rather we account for these amounts as deposits, with the related liability reflected in policyholder account balances. We expense benefit claims incurred in excess of policyholder account
F-21
UNIVERSAL AMERICAN CORP. AND SUBSIDIARIES
NOTES TO CONSOLIDATED FINANCIAL STATEMENTS (Continued)
3. SUMMARY OF SIGNIFICANT ACCOUNTING POLICIES (Continued)
balances. We determine the liability for policyholder account balances for universal life-type policies and investment products under ASC 944-20, Financial Services—Insurance—Insurance Activities, following a "retrospective deposit" method. The retrospective deposit method establishes a liability for policy benefits at an amount determined by the account or contract balance that accrues to the benefit of the policyholder, which consists principally of policy account values before any applicable surrender charges. As of September 30, 2006, we ceased selling annuity products. On April 24, 2009, we reinsured all of our interest sensitive life insurance and annuity business to the Commonwealth. This transaction is discussed in more detail in Note 10 of the Notes to Consolidated Financial Statements.
Recognition of Administrative Service Revenue: We generally recognize fees for administrative services over the period for which we are obligated to provide service.
Income Taxes: We use the liability method of accounting for income taxes. Under this method, we recognize deferred tax assets and liabilities for the future tax consequences attributable to differences between the financial statement carrying amounts of existing assets and liabilities and their respective tax bases. We measure deferred tax assets and liabilities using enacted tax rates that we expect to apply to taxable income in the years in which we expect those temporary differences to be recovered or settled. We recognize the effect on deferred tax assets and liabilities of a change in tax rates in income in the period that includes the enactment date of a change in tax rates.
We establish valuation allowances on our deferred tax assets for amounts that we determine will not be recoverable based upon our analysis of projected taxable income and our ability to implement prudent and feasible tax planning strategies. We recognize increases in these valuation allowances as deferred tax expense. We reflect portions of the valuation allowances subsequently determined to be no longer necessary as deferred tax benefits.
We record tax benefits when it is more likely than not that the tax return position taken with respect to a particular transaction will be sustained. A liability, if recorded, is not considered resolved until the statute of limitations for the relevant taxing authority to examine and challenge the tax position has expired, or the tax position is ultimately settled through examination, negotiation, or litigation. We classify interest and penalties associated with uncertain tax positions in our provision for income taxes.
Reinsurance: We report amounts recoverable under reinsurance contracts in total assets as reinsurance recoverables rather than netting those amounts against the related policy asset or liability. We account for the cost of reinsurance related to long-duration contracts over the life of the underlying reinsured policies using assumptions consistent with those used to account for the underlying policies.
Derivative Instruments—Interest Rate Swaps: We use interest rate swap agreements to manage risk arising from interest rate volatility. Interest rate swap agreements, which are cash flow hedges, are contracts to exchange interest payments on a specified principal or notional amount for a specified period. By using interest rate swaps to manage risk, we expose ourselves to credit risk and additional market risk. Credit risk is the exposure to loss if a counterparty fails to perform under the terms of the interest rate swaps contract. We minimize credit risk by entering into transactions with counterparties that maintain high credit ratings. Market risk is the exposure to changes in the market price of the underlying instrument and the related interest rate swap. These price changes result from movements in interest rates, and as a result, assets and liabilities will appreciate or depreciate in market value. We
F-22
UNIVERSAL AMERICAN CORP. AND SUBSIDIARIES
NOTES TO CONSOLIDATED FINANCIAL STATEMENTS (Continued)
3. SUMMARY OF SIGNIFICANT ACCOUNTING POLICIES (Continued)
recognize these interest rate swaps on the consolidated balance sheets at their fair value, based on external quotes provided by banks, in other assets or other liabilities.
On the date we enter into the interest rate swap contract, we may designate it as a hedge of a forecasted transaction or of the variability of cash flows to be received or paid related to a recognized asset or liability, or a cash flow hedge, if specified criteria are met. At the inception of the contract, we formally document all relationships between the hedging instrument and the hedged item, as well as its risk-management objective and strategy for undertaking each hedge transaction. We also formally assess, both at the hedge's inception and on an ongoing basis, whether the derivative used in hedging transactions are highly effective in offsetting changes in the cash flows of the hedged items.
For interest rate swaps designated as a cash flow hedge, we record the effective portion of changes in the fair value of the interest rate swaps in accumulated other comprehensive income (loss) and recognize it in the consolidated statements of operations when the hedged item affects results of operations. We will discontinue hedge accounting prospectively if we determine that:
- •
- the interest rate swap is not highly effective in offsetting changes in the cash flows of a hedged item,
- •
- the interest rate swap expires or is sold, terminated or exercised, or
- •
- the interest rate swap is undesignated as a hedge instrument because it unlikely that a forecasted transaction will occur.
If we discontinue hedge accounting, we will continue to carry the interest rate swaps at fair value, with any change in the fair value of the interest rate swaps recognized in the current period results of operations as a realized gain or loss. When we discontinue hedge accounting because it is probable that a forecasted transaction will not occur, we recognize the accumulated gains and losses included in other accumulated other comprehensive income (loss) immediately in results of operations as a realized gain or loss.
Stock-Based Compensation: We have various stock-based incentive plans for our employees, non-employee directors, agents and others. Detailed information for activity in our stock plans can be found in Note 21—Stock-Based Compensation. In accordance with ASC 718, Compensation—Stock Compensation, we recognize compensation costs for share-based payments to employees and non-employee directors based on the grant date fair value of the award and permits them to amortize this fair value over the grantees' service period.
We determine stock-based compensation for agents based on guidance contained in ASC 505-50, Equity—Equity-Based Payments to Non-Employees. We expense the fair value of the awards over the vesting period of each award.
4. RECENTLY ISSUED AND PENDING ACCOUNTING PRONOUNCEMENTS
Deferred Acquisition Costs: On September 29, 2010, ASU 2010-26, Accounting for Costs Associated with Acquiring or Renewing Insurance Contracts was ratified by the FASB. The ASU amends FASB ASC Topic 944, Financial Services—Insurance. This guidance changes the accounting for costs associated with acquiring or renewing insurance contracts in response to diversity in practice in the capitalization of those costs. Under the new guidance, deferrable costs will be limited to incremental direct costs of a
F-23
UNIVERSAL AMERICAN CORP. AND SUBSIDIARIES
NOTES TO CONSOLIDATED FINANCIAL STATEMENTS (Continued)
4. RECENTLY ISSUED AND PENDING ACCOUNTING PRONOUNCEMENTS (Continued)
successful contract acquisition incurred with independent third parties and the portion of the total employee compensation and payroll- related fringe benefits related to time spent performing specified acquisition activities (e.g., underwriting, policy issuance and processing) for successful acquisition efforts. Companies will have a choice between prospective and retrospective adoption; the election must be made at the reporting entity level. The new guidance will be effective for fiscal years beginning after December 15, 2011. Management has not yet determined the impact of adoption of this new guidance on our consolidated financial position or results of operations.
Subsequent Events Disclosure: On February 24, 2010, the FASB issued an update to address certain implementation issues related to Accounting Standards Codification, or ASC, 855-10-50, Subsequent Events—Disclosure, regarding an entity's requirement to perform and disclose subsequent events procedures. Effective upon its issuance, the update exempts Securities and Exchange Commission registrants from disclosing the date through which subsequent events have been evaluated. This update affected disclosure only and had no impact on our consolidated financial position or results of operations.
Fair Value Disclosures: In January 2010, the FASB issued ASC Update No. 2010-06, Fair Value Measurements and Disclosures, which updates ASC 820-10-20, Fair Value Measurements and Disclosures. The new literature requires disclosures about transfers into and out of Levels 1 and 2 fair value measurements and clarifies existing fair value disclosures about the level of disaggregation and about inputs and valuation techniques used to measure fair value. These new rules impact disclosures only and had no impact on our consolidated financial position or results of operations. The new rules also require additional disclosures regarding Level 3 fair value measurements which are effective for reporting periods beginning after December 15, 2010.
Variable Interest Entities: In December 2009, the FASB issued ASC Update No. 2009-17, Improvements to Financial Reporting by Enterprises Involved with Variable Interest Entities, which updates ASC 810-10, Consolidations. ASU 2009-17 clarifies the definition of a variable interest entity and updates the definition of the primary beneficiary of a variable interest entity. The Company adopted ASU 2009-17 as of January 1, 2010, and the adoption had no impact on our consolidated financial position or results of operations.
F-24
UNIVERSAL AMERICAN CORP. AND SUBSIDIARIES
NOTES TO CONSOLIDATED FINANCIAL STATEMENTS (Continued)
5. INVESTMENTS
The amortized cost and fair value of fixed maturity investments are as follows:
| |
December 31, 2010 | |||||||||||||||
|---|---|---|---|---|---|---|---|---|---|---|---|---|---|---|---|---|
Classification
|
Amortized Cost |
Gross Unrealized Gains |
Gross Unrealized Losses |
Gross Unrealized OTTI(1) |
Fair Value | |||||||||||
| |
(in thousands) |
|||||||||||||||
U.S. Treasury securities and U.S. Government obligations |
$ | 75,543 | $ | 247 | $ | (598 | ) | $ | — | $ | 75,192 | |||||
Government sponsored agencies |
81,097 | 1,954 | (88 | ) | — | 82,963 | ||||||||||
Other political subdivisions |
154,348 | 350 | (3,514 | ) | — | 151,184 | ||||||||||
Corporate debt securities |
585,629 | 13,883 | (4,252 | ) | — | 595,260 | ||||||||||
Foreign debt securities |
104,554 | 888 | (808 | ) | — | 104,634 | ||||||||||
Mortgage-backed and asset-backed securities |
387,433 | 11,584 | (6,362 | ) | (3,390 | ) | 389,265 | |||||||||
|
$ | 1,388,604 | $ | 28,906 | $ | (15,622 | ) | $ | (3,390 | ) | $ | 1,398,498 | ||||
| |
December 31, 2009 | |||||||||||||||
|---|---|---|---|---|---|---|---|---|---|---|---|---|---|---|---|---|
Classification
|
Amortized Cost |
Gross Unrealized Gains |
Gross Unrealized Losses |
Gross Unrealized OTTI(1) |
Fair Value | |||||||||||
| |
(in thousands) |
|||||||||||||||
U.S. Treasury securities and U.S. Government obligations |
$ | 35,572 | $ | 554 | $ | (4 | ) | $ | — | $ | 36,122 | |||||
Government sponsored agencies |
137,839 | 3,051 | (59 | ) | — | 140,831 | ||||||||||
Other political subdivisions |
10,020 | 223 | (229 | ) | — | 10,014 | ||||||||||
Corporate debt securities |
312,225 | 16,826 | (1,206 | ) | — | 327,845 | ||||||||||
Foreign debt securities |
19,465 | 1,259 | — | — | 20,724 | |||||||||||
Mortgage-backed and asset-backed securities |
446,144 | 14,588 | (13,598 | ) | (18,117 | ) | 429,017 | |||||||||
|
$ | 961,265 | $ | 36,501 | $ | (15,096 | ) | $ | (18,117 | ) | $ | 964,553 | ||||
- (1)
- Other-than-temporary impairments.
At December 31, 2010, gross unrealized losses on mortgage-backed and asset-backed securities totaled $9.8 million, consisting of unrealized losses of $5.8 million on subprime residential mortgage loans, $2.1 million related to obligations of commercial mortgage-backed securities, and $1.9 million of other structured holdings. The fair value of a majority of these securities is depressed due to the deterioration of value in their underlying collateral. Management and the Investment Committee have evaluated these holdings, with input from our investment manager, and do not believe further other-than-temporary impairment to be warranted.
The amortized cost and fair value of fixed maturity investments at December 31, 2010 by contractual maturity are shown below. Expected maturities will differ from contractual maturities
F-25
UNIVERSAL AMERICAN CORP. AND SUBSIDIARIES
NOTES TO CONSOLIDATED FINANCIAL STATEMENTS (Continued)
5. INVESTMENTS (Continued)
because borrowers may have the right to call or prepay obligations with or without call or prepayment penalties.
| |
Amortized Cost |
Fair Value |
|||||
|---|---|---|---|---|---|---|---|
| |
(in thousands) |
||||||
Due in 1 year or less |
$ | 53,406 | $ | 54,298 | |||
Due after 1 year through 5 years |
612,761 | 620,386 | |||||
Due after 5 years through 10 years |
266,611 | 266,464 | |||||
Due after 10 years |
68,393 | 68,085 | |||||
Mortgage and asset-backed securities |
387,433 | 389,265 | |||||
|
$ | 1,388,604 | $ | 1,398,498 | |||
The fair value and unrealized loss as of December 31, 2010 and December 31, 2009 for fixed maturities, aggregated by investment category and length of time that individual securities have been in a continuous unrealized loss position, are shown below:
| |
Less than 12 Months | 12 Months or Longer | Total | ||||||||||||||||
|---|---|---|---|---|---|---|---|---|---|---|---|---|---|---|---|---|---|---|---|
December 31, 2010
|
Fair Value |
Gross Unrealized Losses and OTTI |
Fair Value |
Gross Unrealized Losses and OTTI |
Fair Value |
Gross Unrealized Losses and OTTI |
|||||||||||||
| |
(in thousands) |
||||||||||||||||||
U.S. Treasury securities and U.S. Government obligations |
$ | 39,345 | $ | (598 | ) | $ | — | $ | — | $ | 39,345 | $ | (598 | ) | |||||
Government sponsored agencies |
48,057 | (88 | ) | — | — | 48,057 | (88 | ) | |||||||||||
Other political subdivisions |
139,968 | (3,514 | ) | — | — | 139,968 | (3,514 | ) | |||||||||||
Corporate debt securities |
260,968 | (4,162 | ) | 1,014 | (90 | ) | 261,982 | (4,252 | ) | ||||||||||
Foreign debt securities |
68,776 | (808 | ) | — | — | 68,776 | (808 | ) | |||||||||||
Mortgage-backed and asset-backed securities |
156,806 | (2,787 | ) | 18,187 | (6,965 | ) | 174,993 | (9,752 | ) | ||||||||||
Total fixed maturities |
$ | 713,920 | $ | (11,957 | ) | $ | 19,201 | $ | (7,055 | ) | $ | 733,121 | $ | (19,012 | ) | ||||
Total number of securities in an unrealized loss position |
236 | ||||||||||||||||||
F-26
UNIVERSAL AMERICAN CORP. AND SUBSIDIARIES
NOTES TO CONSOLIDATED FINANCIAL STATEMENTS (Continued)
5. INVESTMENTS (Continued)
| |
Less than 12 Months | 12 Months or Longer | Total | ||||||||||||||||
|---|---|---|---|---|---|---|---|---|---|---|---|---|---|---|---|---|---|---|---|
December 31, 2009
|
Fair Value |
Gross Unrealized Losses and OTTI |
Fair Value |
Gross Unrealized Losses and OTTI |
Fair Value |
Gross Unrealized Losses and OTTI |
|||||||||||||
| |
(in thousands) |
||||||||||||||||||
U.S. Treasury securities and U.S. Government obligations |
$ | — | $ | — | $ | 48 | $ | (4 | ) | $ | 48 | $ | (4 | ) | |||||
Government sponsored agencies |
52,666 | (59 | ) | — | — | 52,666 | (59 | ) | |||||||||||
Other political subdivisions |
25 | — | 1,771 | (229 | ) | 1,796 | (229 | ) | |||||||||||
Corporate debt securities |
7,409 | (366 | ) | 11,373 | (840 | ) | 18,782 | (1,206 | ) | ||||||||||
Foreign debt securities |
25 | — | — | — | 25 | — | |||||||||||||
Mortgage-backed and asset-backed securities |
100,339 | (5,668 | ) | 28,643 | (26,047 | ) | 128,982 | (31,715 | ) | ||||||||||
Total fixed maturities |
$ | 160,464 | $ | (6,093 | ) | $ | 41,835 | $ | (27,120 | ) | $ | 202,299 | $ | (33,213 | ) | ||||
Total number of securities in an unrealized loss position |
64 | ||||||||||||||||||
Subprime Residential Mortgage Loans
We hold securities with exposure to subprime residential mortgages, or mortgage loans to borrowers with weak credit profiles. The significant decline in U.S. housing prices and relaxed underwriting standards by some subprime loan originators have led to higher delinquency and loss rates, resulting in a significant reduction in the market valuation of these securities sector wide.
In the third quarter of 2010, we sold subprime holdings with par values of approximately $29.9 million, realizing net pre-tax losses totaling $10.2 million. As of December 31, 2010, we held subprime securities with par values of $22.1 million, an amortized cost of $21.6 million and a fair value of $15.8 million representing approximately 1.1% of our cash and invested assets, with collateral comprised substantially of first lien mortgages in senior or senior mezzanine level tranches, with an average Standard & Poor's, or equivalent, rating of A-.
F-27
UNIVERSAL AMERICAN CORP. AND SUBSIDIARIES
NOTES TO CONSOLIDATED FINANCIAL STATEMENTS (Continued)
5. INVESTMENTS (Continued)
The following table presents our exposure to subprime residential mortgages by vintage year.
Vintage Year
|
Amortized Cost |
Fair Value | Gross Unrealized Losses & OTTI |
|||||||
|---|---|---|---|---|---|---|---|---|---|---|
| |
(in thousands) |
|||||||||
2003 |
$ | 185 | $ | 72 | $ | (113 | ) | |||
2004 |
210 | 142 | (68 | ) | ||||||
2005 |
14,173 | 11,989 | (2,184 | ) | ||||||
2006 |
7,000 | 3,605 | (3,395 | ) | ||||||
Totals |
$ | 21,568 | $ | 15,808 | $ | (5,760 | ) | |||
We continuously review our subprime holdings stressing multiple variables, such as cash flows, prepayment speeds, default rates and loss severity, and comparing current base case loss expectations to the loss required to incur a principal loss, or breakpoint. We expect delinquency and loss rates in the subprime mortgage sector to continue to increase in the near term but at a decreasing rate. Those securities with a greater variance between the breakpoint and base case can withstand this further deterioration. Based on the analysis of the remaining subprime holdings at December 31, 2010, we do not believe these holdings are other-than-temporarily impaired.
The following table summarizes, on a pre-tax basis, our other-than-temporary impairments on fixed-maturities recorded in each of the three years ended December 31:
| |
Year Ended | |||||||||
|---|---|---|---|---|---|---|---|---|---|---|
| |
2010 | 2009 | 2008 | |||||||
| |
(in thousands) |
|||||||||
Subprime |
$ | 289 | $ | 10,497 | $ | 47,964 | ||||
Other structured |
526 | 6,398 | 4,645 | |||||||
Corporate |
— | — | 7,177 | |||||||
|
$ | 815 | $ | 16,895 | $ | 59,786 | ||||
During the year ended December 31, 2010 we recognized impairment on one subprime holding previously impaired in 2008, plus one additional subprime holding and two other structured securities which had not been previously impaired. During the year ended December 31, 2009, we recognized an additional other-than-temporary impairment on twelve subprime securities impaired in 2008, plus one additional subprime holding. Further, we recognized other-than-temporary impairments on twelve other structured securities, seven of which had not been previously impaired. During the year ended December 31, 2008, we recognized an other-than-temporary impairment on eighteen subprime securities, five other structured securities and three corporate securities, including $6.1 million on two Lehman Brothers securities.
F-28
UNIVERSAL AMERICAN CORP. AND SUBSIDIARIES
NOTES TO CONSOLIDATED FINANCIAL STATEMENTS (Continued)
5. INVESTMENTS (Continued)
The components of the change in unrealized gains and losses for fixed maturity securities included in the consolidated statements of stockholders' equity and comprehensive income are as follows:
| |
2010 | 2009 | 2008 | ||||||||
|---|---|---|---|---|---|---|---|---|---|---|---|
| |
(in thousands) |
||||||||||
Change in net unrealized gains and losses: |
|||||||||||
Fixed maturities |
$ | 6,606 | $ | 45,973 | $ | (42,152 | ) | ||||
Adjustment relating to deferred policy acquisition costs |
— | (6,616 | ) | 6,392 | |||||||
Change in net unrealized gains/losses before income tax |
6,606 | 39,357 | (35,760 | ) | |||||||
Income tax provision/benefit |
(2,313 | ) | (13,776 | ) | 12,516 | ||||||
Change in net unrealized gains/losses |
$ | 4,293 | $ | 25,581 | $ | (23,244 | ) | ||||
The details of net investment income are as follows:
| |
2010 | 2009 | 2008 | ||||||||
|---|---|---|---|---|---|---|---|---|---|---|---|
| |
(in thousands) |
||||||||||
Investment Income: |
|||||||||||
Fixed maturities |
$ | 42,732 | $ | 47,557 | $ | 59,170 | |||||
Cash and cash equivalents |
1,947 | 1,851 | 21,303 | ||||||||
Other |
856 | 1,723 | 2,603 | ||||||||
Gross investment income |
45,535 | 51,131 | 83,076 | ||||||||
Investment expenses |
(2,678 | ) | (1,317 | ) | (1,806 | ) | |||||
Net investment income |
$ | 42,857 | $ | 49,814 | $ | 81,270 | |||||
There were no non-income producing fixed maturity securities for the years ended December 31, 2010 and 2009. The two Lehman Brothers securities referred to above were the only non-income producing fixed maturity securities for the year ended December 31, 2008.
F-29
UNIVERSAL AMERICAN CORP. AND SUBSIDIARIES
NOTES TO CONSOLIDATED FINANCIAL STATEMENTS (Continued)
5. INVESTMENTS (Continued)
Gross realized gains and gross realized losses included in the consolidated statements of operations are as follows:
| |
2010 | 2009 | 2008 | ||||||||
|---|---|---|---|---|---|---|---|---|---|---|---|
| |
(in thousands) |
||||||||||
Realized gains: |
|||||||||||
Fixed maturities |
$ | 23,138 | $ | 7,300 | $ | 1,788 | |||||
Other |
109 | 337 | 12 | ||||||||
|
23,247 | 7,637 | 1,800 | ||||||||
Realized losses: |
|||||||||||
Fixed maturities, excluding OTTI |
(13,825 | ) | (15,158 | ) | (1,234 | ) | |||||
OTTI on fixed maturities |
(815 | ) | (16,895 | ) | (59,786 | ) | |||||
OTTI on equity securities |
— | (481 | ) | — | |||||||
Interest rate swap |
(1,580 | ) | — | — | |||||||
Other |
(2,032 | ) | (91 | ) | (461 | ) | |||||
|
(18,252 | ) | (32,625 | ) | (61,481 | ) | |||||
Net realized gains (losses) |
$ | 4,995 | $ | (24,988 | ) | $ | (59,681 | ) | |||
Subsequent to the Life and Annuity Reinsurance transaction in April 2009, we elected to reduce the risk and exposure of our investment portfolio to be more conservative in nature and more appropriately aligned with our health insurance focused businesses. In connection with this risk reducing effort, we incurred net realized losses totaling $10.8 million in 2009.
At December 31, 2010 and 2009, we held unrated or below-investment grade fixed maturity securities as follows:
| |
2010 | 2009 | |||||
|---|---|---|---|---|---|---|---|
| |
(in thousands) |
||||||
Carrying value (fair value) |
$ | 4,809 | $ | 4,461 | |||
Percentage of total assets |
0.1 | % | 0.2 | % | |||
The holdings of below-investment grade securities are diversified and the largest investment in any one such security was $3.6 million, or 0.1% of total assets at December 31, 2010 and $1.0 million, or 0.1% of total assets at December 31, 2009.
We have reflected investments held by various states as security for our policyholders within those states in fixed maturities. These investments had carrying values of $42.0 million at December 31, 2010 and $43.4 million at December 31, 2009.
F-30
UNIVERSAL AMERICAN CORP. AND SUBSIDIARIES
NOTES TO CONSOLIDATED FINANCIAL STATEMENTS (Continued)
5. INVESTMENTS (Continued)
Changes in the amount of other-than-temporary impairments recognized in earnings on securities for which a portion of the other-than-temporary impairments related to other factors was recognized in other comprehensive income:
| |
2010 | 2009 | ||||||
|---|---|---|---|---|---|---|---|---|
| |
(in thousands) |
|||||||
Balance beginning of period |
$ | 7,846 | $ | 390 | ||||
Credit related impairments recognized in current period earnings on securities: |
||||||||
With credit related impairments previously recognized |
— | 3,949 | ||||||
With credit related impairments not previously recognized |
397 | 3,507 | ||||||
Reduction for securities sold during the period |
(7,068 | ) | ||||||
Cumulative credit related impairments as of December 31, 2010 |
$ | 1,175 | $ | 7,846 | ||||
6. FAIR VALUE MEASUREMENTS
We carry fixed maturity investments and interest rate swaps at fair value in our consolidated balance sheets. These fair value disclosures consist of information regarding the valuation of these financial instruments, followed by the fair value measurement disclosure requirements of Fair Value Measurements and Disclosures Topic, ASC 820-10.
Effective April 1, 2009, we applied the provisions of ASC 820 prospectively to financial instruments that we record at fair value. Our adoption of ASC 820 did not have an impact on opening retained earnings.
Fair Value Disclosures
The following section applies the ASC 820-10 fair value hierarchy and disclosure requirements to our financial instruments that we carry at fair value. ASC 820-10 establishes a fair value hierarchy that prioritizes the inputs in the valuation techniques used to measure fair value into three broad Levels, numbered 1, 2, and 3.
Level 1 observable inputs reflect quoted prices for identical assets or liabilities in active markets that we have the ability to access at the measurement date. We currently have no Level 1 securities.
Level 2 observable inputs, other than quoted prices included in Level 1, reflect the asset or liability or prices for similar assets and liabilities. Most debt securities are model priced by vendors using observable inputs and we classify them within Level 2. Derivative instruments that are priced using models with observable market inputs, such as interest rate swap contracts, are also reflected as Level 2.
Level 3 valuations are derived from techniques in which one or more of the significant inputs, such as assumptions about risk, are unobservable. Generally, Level 3 securities are less liquid securities such as highly structured or lower quality asset-backed securities, known as ABS, and private placement equity securities. Because Level 3 fair values, by their nature, contain unobservable market inputs, as there is no observable market for these assets and liabilities, we must use considerable judgment to
F-31
UNIVERSAL AMERICAN CORP. AND SUBSIDIARIES
NOTES TO CONSOLIDATED FINANCIAL STATEMENTS (Continued)
6. FAIR VALUE MEASUREMENTS (Continued)
determine the Level 3 fair values. Level 3 fair values represent our best estimate of an amount that we could realize in a current market exchange absent actual market exchanges.
The following table presents our assets and liabilities that we carry at fair value by ASC 820 hierarchy levels, as of December 31, 2010 and 2009 (in thousands):
December 31, 2010
|
Total | Level 1 | Level 2 | Level 3 | |||||||||
|---|---|---|---|---|---|---|---|---|---|---|---|---|---|
Assets: |
|||||||||||||
Fixed maturties, available for sale |
$ | 1,398,498 | $ | — | $ | 1,391,260 | $ | 7,238 | |||||
Liabilities: |
|||||||||||||
Interest rate swaps |
$ | 13,968 | $ | — | $ | 13,968 | $ | — | |||||
December 31, 2009
|
|||||||||||||
Assets: |
|||||||||||||
Fixed maturties, available for sale |
$ | 964,553 | $ | — | $ | 962,990 | $ | 1,563 | |||||
Liabilities: |
|||||||||||||
Interest rate swaps |
$ | 15,465 | $ | — | $ | 15,465 | $ | — | |||||
In many situations, inputs used to measure the fair value of an asset or liability position may fall into different levels of the fair value hierarchy. In these situations, we will determine the level in which the fair value falls based upon the lowest level input that is significant to the determination of the fair value.
Determination of fair values
The valuation methodologies used to determine the fair values of assets and liabilities under the "exit price" notion of ASC 820 reflect market participant objectives and are based on the application of the fair value hierarchy that prioritizes observable market inputs over unobservable inputs. We determine the fair value of our financial assets and liabilities based upon quoted market prices where available. Fair values of our interest rate swap liabilities reflect adjustments for counterparty credit quality, our credit standing, liquidity and, where appropriate, risk margins on unobservable parameters. The following is a discussion of the methodologies used to determine fair values for the financial instruments listed in the above table.
Valuation of Fixed Maturities
We determine the fair value of the majority of our fixed maturities using third party pricing service market prices. The following are examples of typical inputs used by third party pricing services:
- •
- reported trades,
- •
- benchmark yields,
- •
- issuer spreads,
- •
- bids,
F-32
UNIVERSAL AMERICAN CORP. AND SUBSIDIARIES
NOTES TO CONSOLIDATED FINANCIAL STATEMENTS (Continued)
6. FAIR VALUE MEASUREMENTS (Continued)
- •
- offers, and
- •
- estimated cash flows and prepayment speeds.
Based on the typical trading volumes and the lack of quoted market prices for fixed maturities, third party pricing services will normally derive the security prices through recent reported trades for identical or similar securities making adjustments through the reporting date based upon available market observable information as outlined above. If there are no recent reported trades, the third party pricing services may use matrix or model processes to develop a security price where the pricing services develop future cash flow expectations based upon collateral performance, discounted at an estimated market rate. The pricing for mortgage-backed and asset-backed securities reflects estimates of the rate of future prepayments of principal over the remaining life of the securities. The pricing services derive these estimates based on the characteristics of the underlying structure and prepayment speeds previously experienced at the interest rate levels projected for the underlying collateral.
We have analyzed the third party pricing services' valuation methodologies and related inputs, and have also evaluated the various types of securities in our investment portfolio to determine an appropriate ASC 820 fair value hierarchy level based upon trading activity and the observability of market inputs. Based on the results of this evaluation and investment class analysis, we classified each price into Level 1, 2, or 3. We classified most prices provided by third party pricing services into Level 2 because the inputs used in pricing the securities are market observable.
Due to a general lack of transparency in the process that brokers use to develop prices, we have classified most valuations that are based on broker's prices as Level 3. We may classify some valuations as Level 2 if we can corroborate the price. We have also classified internal model priced securities, primarily consisting of private placement asset-backed securities, as Level 3 because this model pricing includes significant non-observable inputs.
The following table presents the fair value of the significant asset sectors within the ASC 820 Level 3 securities as of December 31, 2010:
| |
December 31, 2010 | ||||||
|---|---|---|---|---|---|---|---|
| |
Fair Value | % of Total Fair Value |
|||||
| |
(in thousands) |
||||||
Mortgage and asset-backed securities |
$ | 5,923 | 81.8 | % | |||
Corporate debt securities |
1,315 | 18.2 | % | ||||
Total Level 3 securities |
$ | 7,238 | 100.0 | % | |||
Mortgage and asset-backed securities represent private-placement securities that are thinly traded and priced using an internal model or modeled by independent brokers.
Interest rate swaps
We report interest rate swaps in other liabilities on our consolidated balance sheets at fair value. Their fair value is based on the present value of cash flows as determined by the LIBOR forward rate curve and credit spreads, including our own credit.
F-33
UNIVERSAL AMERICAN CORP. AND SUBSIDIARIES
NOTES TO CONSOLIDATED FINANCIAL STATEMENTS (Continued)
6. FAIR VALUE MEASUREMENTS (Continued)
We have classified interest rate swaps as Level 2. We have determined their valuations using pricing models with inputs that are observable in the market or can be derived principally from or corroborated by observable market data.
The following table provides a summary of changes in the fair value of our Level 3 financial assets. Transfers between levels are recognized as of the beginning of the reporting period:
| |
Fixed Maturities |
|||
|---|---|---|---|---|
| |
(in thousands) |
|||
Fair value as of January 1, 2010 |
$ | 1,563 | ||
Net purchases and sales |
(97 | ) | ||
Net transfers out |
(50 | ) | ||
Unrealized losses included in AOCI(1),(2) |
17 | |||
Fair value as of March 31, 2010 |
1,433 | |||
Net transfers in(3) |
2,143 | |||
Unrealized losses included in AOCI(1),(2) |
85 | |||
Fair value as of June 30, 2010 |
3,661 | |||
Net purchases and sales |
(12 | ) | ||
Net transfers in(4) |
1,779 | |||
Unrealized losses included in AOCI(1),(2) |
(2 | ) | ||
Fair value as of September 30, 2010 |
5,426 | |||
Net purchases and sales |
(12 | ) | ||
Net transfers in(5) |
1,851 | |||
Unrealized losses included in AOCI(1),(2) |
(27 | ) | ||
Fair value as of December 31, 2010 |
$ | 7,238 | ||
- (1)
- AOCI:
Accumulated other comprehensive income
- (2)
- Unrealized
gains/losses represent losses from changes in values of Level 3 financial instruments only for the periods in which the instruments are
classified as Level 3.
- (3)
- Transfer
of one security from Level 2 to Level 3 due to lack of observable inputs.
- (4)
- Two
private placement securities acquired during the third quarter, with lack of observable inputs, net of transfer of one security from Level 3 to
Level 2.
- (5)
- Four private placement securities acquired and two securities transferred from Level 2 to Level 3 during the fourth quarter, with lack of observable inputs net of transfer of three securities from Level 3 to Level 2.
F-34
UNIVERSAL AMERICAN CORP. AND SUBSIDIARIES
NOTES TO CONSOLIDATED FINANCIAL STATEMENTS (Continued)
7. INTANGIBLE ASSETS
The following table shows the Company's acquired intangible assets that continue to be subject to amortization and accumulated amortization expense.
| |
Weighted Average Life at Acquisition (Years) |
December 31, 2010 | December 31, 2009 | |||||||||||||||
|---|---|---|---|---|---|---|---|---|---|---|---|---|---|---|---|---|---|---|
| |
Value Assigned |
Accumulated Amortization |
Value Assigned |
Accumulated Amortization |
||||||||||||||
| |
|
(in thousands) |
||||||||||||||||
Traditional Insurance: |
||||||||||||||||||
Policies in force—Health |
9 | $ | 17,246 | $ | 14,182 | $ | 17,246 | $ | 12,996 | |||||||||
Distribution channel |
3 | 4,628 | 4,628 | 4,628 | 3,085 | |||||||||||||
Medicare Part D: |
||||||||||||||||||
Membership base |
10 | 135,426 | 44,353 | 135,426 | 30,809 | |||||||||||||
Trademarks/tradenames |
9 | 20,433 | 7,436 | 20,433 | 5,165 | |||||||||||||
Licenses |
15 | 3,500 | 764 | 3,500 | 531 | |||||||||||||
Senior Managed Care—Medicare Advantage: |
||||||||||||||||||
Membership base |
7 | 23,988 | 13,673 | 23,988 | 11,821 | |||||||||||||
Distribution channel |
30 | 22,055 | 5,697 | 22,055 | 4,962 | |||||||||||||
Provider contracts |
10 | 15,539 | 8,534 | 15,539 | 7,072 | |||||||||||||
Non-compete |
7 | 1,425 | 732 | 1,425 | 528 | |||||||||||||
Corporate & Other: |
||||||||||||||||||
Hospital network contracts |
10 | 1,797 | 1,797 | 1,797 | 1,523 | |||||||||||||
Total |
$ | 246,037 | $ | 101,796 | $ | 246,037 | $ | 78,492 | ||||||||||
The following table shows the changes in the amortizing intangible assets:
| |
2010 | 2009 | 2008 | ||||||||
|---|---|---|---|---|---|---|---|---|---|---|---|
| |
(in thousands) |
||||||||||
Balance, beginning of year |
$ | 167,545 | $ | 192,742 | $ | 213,518 | |||||
Additions and adjustments |
— | (1,637 | ) | 2,987 | |||||||
Amortization, net of interest |
(23,304 | ) | (23,560 | ) | (23,763 | ) | |||||
Balance, end of year |
$ | 144,241 | $ | 167,545 | $ | 192,742 | |||||
The adjustment in 2009 relates to the reduction related to the reinsurance of substantially all of our in force life insurance and annuity business under a 100% coinsurance treaty—refer to Note 10 of the Notes to Consolidated Financial Statements. We had approximately $1.6 million, net, of amortizing intangibles related to the policies in force—Life/Annuity as of the effective date of the transaction that were reduced to zero as a result of the recovery of such costs through the initial ceding commission received in connection with the reinsurance transaction.
F-35
UNIVERSAL AMERICAN CORP. AND SUBSIDIARIES
NOTES TO CONSOLIDATED FINANCIAL STATEMENTS (Continued)
7. INTANGIBLE ASSETS (Continued)
Estimated future net amortization expense (in thousands) is as follows:
2011 |
$ | 20,883 | ||
2012 |
20,744 | |||
2013 |
20,627 | |||
2014 |
20,055 | |||
2015 |
19,443 | |||
Thereafter |
42,489 | |||
|
$ | 144,241 | ||
Changes in the carrying amounts of goodwill and intangible assets with indefinite lives (primarily trademarks and licenses) are shown below:
| |
Total | Medicare Part D |
Senior Managed Care- Medicare Advantage |
Corporate & Other |
||||||||||
|---|---|---|---|---|---|---|---|---|---|---|---|---|---|---|
| |
(in thousands) |
|||||||||||||
Balance, January 1, 2009 |
$ | 530,031 | $ | 448,215 | $ | 77,459 | $ | 4,357 | ||||||
Acquisitions |
— | — | — | — | ||||||||||
Impairments |
— | — | — | — | ||||||||||
Adjustments |
— | — | — | — | ||||||||||
Balance, December 31, 2009 |
530,031 | 448,215 | 77,459 | 4,357 | ||||||||||
Acquisitions |
— | — | — | — | ||||||||||
Impairments |
— | — | — | — | ||||||||||
Adjustments |
(4,357 | ) | — | — | (4,357 | ) | ||||||||
Balance, December 31, 2010 |
$ | 525,674 | $ | 448,215 | $ | 77,459 | $ | — | ||||||
During the fourth quarter of 2010, we performed our annual goodwill assessment for the individual reporting units based on information as of October 1, 2010. We determined, based on our "Step 1" impairment test, that our estimated fair value of our Part D Reporting unit was in excess of its carrying value by 42% and that our estimated fair value of our Senior Managed Care reporting unit was in excess of its carrying value by 10%. We concluded that there was no impairment of goodwill for these reporting units.
Due to sale of CHCS in April 2010, we eliminated the remaining $4.4 million of goodwill related to our administrative service company in the second quarter of 2010. For a description of the transaction see Note 24—Other Operational Disclosures in the Notes to Consolidated Financial Statements.
F-36
UNIVERSAL AMERICAN CORP. AND SUBSIDIARIES
NOTES TO CONSOLIDATED FINANCIAL STATEMENTS (Continued)
8. DEFERRED POLICY ACQUISITION COSTS
Details with respect to deferred policy acquisition costs are as follows:
| |
2010 | 2009 | 2008 | |||||||||
|---|---|---|---|---|---|---|---|---|---|---|---|---|
| |
(in thousands) |
|||||||||||
Balance, beginning of year |
$ | 150,398 | $ | 237,630 | $ | 245,511 | ||||||
Capitalized costs, net of reinsurance commissions |
||||||||||||
and allowances |
32,968 | 37,766 | 43,659 | |||||||||
Adjustment relating to unrealized gains (losses) |
||||||||||||
on fixed maturities |
— | (6,617 | ) | 6,392 | ||||||||
Amortization |
(38,616 | ) | (45,552 | ) | (57,932 | ) | ||||||
Adjustment in connection with reinsurance transaction |
— | (72,829 | ) | — | ||||||||
Balance, end of year |
$ | 144,750 | $ | 150,398 | $ | 237,630 | ||||||
In the first quarter of 2009, we reinsured substantially all of our in force life insurance and annuity business under a 100% coinsurance treaty—refer to Note 10—Reinsurance in the Notes to Consolidated Financial Statements. We had approximately $72.8 million of deferred acquisition costs as of the effective date of the transaction that were reduced to zero as a result of the recovery of such costs through the initial ceding commission received in connection with the reinsurance transaction.
9. MEDICARE PART D
The following table provides balances due from (to) CMS by Plan year:
| |
December 31, 2010 | December 31, 2009 | |||||||||||||||||
|---|---|---|---|---|---|---|---|---|---|---|---|---|---|---|---|---|---|---|---|
Plan Year
|
Reinsurance/ Low-income Cost Subsidy(1) |
Risk Corridor(2) |
Total Due from (to) CMS |
Reinsurance/ Low-income Cost Subsidy(1) |
Risk Corridor(2) |
Total Due from (to) CMS |
|||||||||||||
| |
(in thousands) |
||||||||||||||||||
2010 |
$ | 164,583 | $ | (24,479 | ) | $ | 140,104 | $ | — | $ | — | $ | — | ||||||
2009(3) |
329 | (317 | ) | 12 | (194,062 | ) | (35,958 | ) | (230,020 | ) | |||||||||
2008 |
3,283 | (99 | ) | 3,184 | — | — | — | ||||||||||||
2007(4) |
21,627 | 12,138 | 33,765 | 21,433 | 12,809 | 34,242 | |||||||||||||
2006(4) |
6,762 | 3,274 | 10,036 | 3,460 | 2,232 | 5,692 | |||||||||||||
Total due (to) from CMS |
$ | 196,584 | $ | (9,483 | ) | $ | 187,101 | $ | (169,169 | ) | $ | (20,917 | ) | $ | (190,086 | ) | |||
- (1)
- Amounts
reported in CMS contract deposit receivables (liabilities) in the Consolidated Balance Sheets.
- (2)
- Amounts
reported in Due and unpaid premiums in the Consolidated Balance Sheets.
- (3)
- We
paid the amount due to CMS for the 2009 Plan year during the fourth quarter of 2010.
- (4)
- In December 2010, CMS announced that the 2006 and 2007 plan years will be re-opened and settled based upon PDEs submitted to CMS through January 30, 2011.
F-37
UNIVERSAL AMERICAN CORP. AND SUBSIDIARIES
NOTES TO CONSOLIDATED FINANCIAL STATEMENTS (Continued)
9. MEDICARE PART D (Continued)
Prior Plan Year Settlements and Adjustments Under Stand-alone Medicare Part D Plans and MA-PD: The amount due to or from CMS consists of low-income cost subsidy, catastrophic reinsurance and the risk corridor adjustment. These amounts are affected by: membership; risk scores; prescription drug events ("PDEs") and rebates. Approximately nine months after the close of the annual Plan year (December 31st) CMS completes its reconciliation of membership and PDEs and provides the information needed to finalize the accounting for these items to each Plan.
For our stand-alone Part D Plans, retroactive revenue adjustments and Plan year settlements for the 2009 Plan year were received in the third quarter of 2010. Net premiums for the year ended December 31, 2010 included retroactive adjustments related to prior Plan years, which increased total revenue by approximately $9.9 million (net of the impact of government risk corridor). These adjustments were comprised of $9.4 million in risk adjustment revenue related to our 2009 membership and $0.5 million related to the final CMS PDE reconciliations for prior Plan years. For the 2008 Plan year, we received retroactive revenue adjustments and Plan year settlements in the third quarter of 2009. Net premiums for the year ended December 31, 2009 included retroactive adjustments related to prior Plan years, which increased total revenue by approximately $14.7 million (net of the impact of government risk corridor). These adjustments were comprised of $9.2 million in risk adjustment revenue related to our 2008 membership and $5.5 million related to the final CMS PDE reconciliations for prior Plan years.
The reconciliation and settlement process with CMS for the Part D coverage within Medicare Advantage Plans is similar to Medicare Part D Plans with the two exceptions: 1) PFFS Plans are ineligible for aggregate risk corridor payments; and 2) prospective monthly catastrophic reinsurance payments to PFFS Plans are based on CMS estimated average reinsurance payments to other MA-PD Plans for their Part D coverage. In the third quarter of 2010, for MA-PD, we received a retroactive revenue adjustment for the 2009 Plan year that increased revenues by $0.3 million (net of risk corridor). In the third quarter of 2009, for MA-PD, we received a retroactive revenue adjustment for the 2008 Plan year that increased revenues by $1.3 million (net of risk corridor). In the third quarters of 2010 and 2009, we received notification from CMS of an adjustment to our catastrophic reinsurance payment for the Part D coverage within our PFFS Plans for the prior Plan year that increased the payment for 2009 in 2010 by $2.2 million and lowered the payment for 2008 in 2009 by $7.3 million, respectively.
10. REINSURANCE
In the normal course of business, we reinsure portions of certain policies that we underwrite. We enter into reinsurance arrangements with unaffiliated reinsurance companies to limit our exposure on individual claims and to limit or eliminate risk on our non-core or underperforming blocks of business. Accordingly, we are party to various reinsurance agreements on our life and accident and health insurance risks. Our traditional accident and health insurance products are generally reinsured under quota share coinsurance treaties with unaffiliated insurers, while the life insurance risks are reinsured under either quota share coinsurance or yearly-renewable term treaties with unaffiliated insurers. Under quota share coinsurance treaties, we pay the reinsurer an agreed upon percentage of all premiums and the reinsurer reimburses us that same percentage of any losses. In addition, the reinsurer pays us certain allowances to cover commissions, the cost of administering the policies and premium taxes. Under yearly-renewable term treaties, the reinsurer receives premiums at an agreed upon rate for its share of the risk on a yearly-renewable term basis. We also uses excess of loss
F-38
UNIVERSAL AMERICAN CORP. AND SUBSIDIARIES
NOTES TO CONSOLIDATED FINANCIAL STATEMENTS (Continued)
10. REINSURANCE (Continued)
reinsurance agreements for certain policies whereby we limit our loss in excess of specified thresholds. Our quota share coinsurance agreements are generally subject to cancellation on 90 days notice for future business, but policies reinsured prior to cancellation remain reinsured as long as they remain in force.
We evaluate the financial condition of our reinsurers and monitor concentrations of credit risk to minimize our exposure to significant losses from reinsurer insolvencies. We are obligated to pay claims in the event that a reinsurer to whom we have ceded an insured claim fails to meet its obligations under the reinsurance agreement. As of December 31, 2010, all of our primary reinsurers were rated "A–" (Excellent) or better by A.M. Best with the exception of one reinsurer. For that reinsurer, which is not rated, a trust containing assets at 106% of policy reserve levels is maintained for our benefit. We are not aware of any instances where any of our reinsurers have been unable to pay any policy claims on any reinsured business.
We have several quota share reinsurance agreements in place with General Re Life Corporation, Hannover Life Re of America and Swiss Re Life & Health America, Wilton Reassurance Company, Athene, and Commonwealth Annuity & Life Insurance Company (and affiliates). These agreements cover various insurance products, including Medicare supplement, long-term care, life and annuity products and contain ceding percentages ranging between 15% and 100%.
The agreement to reinsure the Prescription PathwaySM PDPs sponsored by our subsidiaries on a 50% coinsurance funds withheld basis to PharmaCare Re ended in connection with the termination of our strategic alliance with CVS Caremark on December 31, 2008. As result of the termination, ceded premiums for 2009 decreased by approximately $276.2 million compared to 2008. On July 1, 2008, the agreement to provide an insured drug benefit for the employees of the State of Connecticut and to reinsure the risk with PharmaCare Re under a 100% quota-share contract was not renewed. Direct and ceded premium under this agreement was $171.8 million for the year ended December 31, 2008.
Life Insurance and Annuity Reinsurance Transaction: Effective April 1, 2009, we reinsured substantially all of the net in force life and annuity business with Commonwealth under a 100% coinsurance treaty. In accordance with ASC 944, Financial Services—Insurance Topic, reinsurance recoverables are to be reported as separate assets rather than as reductions of the related liabilities. Accordingly, we increased the amounts due from reinsurers by approximately $544 million as of the effective date of the transaction, April 1, 2009, representing the carrying value of the liabilities reinsured. We transferred approximately $454 million of cash, net of the ceding commission of $77 million, and $22 million of policy loans, related to the reinsured policies, to the reinsurer. We had approximately $74 million of deferred acquisition costs and present value of future profits as of the effective date of the transaction that were reduced to zero as a result of the recovery of such costs through the initial ceding commission. On a GAAP basis, the transaction resulted in a loss and other related costs of approximately $7.6 million, including approximately $2.8 million related to the transition of the administration of the business to the reinsurer. During 2010, the annuity portion of this transaction was commuted with Commonwealth and reinsured with Athene.
Reinsurance Premium: During 2010, we ceded premiums of $43.3 million to General Re, $35.1 million to Commonwealth, $34.2 million to Hannover, and $33.4 million to Fresenius Medical Care Re, representing 0.8%, 0.6%, 0.6%, and 0.6%, respectively of our total direct and assumed premiums. During 2009, we ceded premiums of $50.4 million to General Re, $39.5 million to
F-39
UNIVERSAL AMERICAN CORP. AND SUBSIDIARIES
NOTES TO CONSOLIDATED FINANCIAL STATEMENTS (Continued)
10. REINSURANCE (Continued)
Commonwealth, $38.6 million to Hannover, and $30.9 million to Fresenius Medical Care Re, representing 1.0%, 0.8%, 0.8%, and 0.6%, respectively of our total direct and assumed premiums. During 2008, we ceded premiums of $449.8 million to PharmaCare Re, $58.4 million to General Re, $49.2 million to Hannover and $10.6 million to Swiss Re, representing 8.6%, 1.1%, 1.0% and 0.2% respectively of our total direct and assumed premiums.
Reinsurance Recoverables: Amounts recoverable from our reinsurers are as follows:
| |
2010 | 2009 | ||||||
|---|---|---|---|---|---|---|---|---|
| |
(in thousands) |
|||||||
Reinsurer |
||||||||
Commonwealth and affiliates |
$ | 340,862 | $ | 551,941 | ||||
Athene Life Re |
177,533 | — | ||||||
Hannover |
22,861 | 27,197 | ||||||
Swiss Re |
23,591 | 22,778 | ||||||
Other life |
25,406 | 20,631 | ||||||
Total life |
590,253 | 622,547 | ||||||
Gen Re |
78,222 | 78,310 | ||||||
Hannover |
23,634 | 23,517 | ||||||
Other health |
26,075 | 24,697 | ||||||
Total health |
127,931 | 126,524 | ||||||
Total |
$ | 718,184 | $ | 749,071 | ||||
At December 31, 2010, the total amount recoverable from reinsurers of $718.2 million included $705.6 million recoverable on future policy benefits and unpaid claims, $8.3 million in funds held and $4.3 million for amounts due from reinsurers on paid claims, commissions and expense allowances net of premiums reinsured. At December 31, 2009, the total amount recoverable from reinsurers of $749.1 million included $727.6 million recoverable on future policy benefits and unpaid claims, $11.7 million in funds held and $9.8 million for amounts due from reinsurers on paid claims, commissions and expense allowances net of premiums reinsured.
F-40
UNIVERSAL AMERICAN CORP. AND SUBSIDIARIES
NOTES TO CONSOLIDATED FINANCIAL STATEMENTS (Continued)
10. REINSURANCE (Continued)
Reinsurance Summary:
| |
Year Ended December 31, | |||||||||||
|---|---|---|---|---|---|---|---|---|---|---|---|---|
| |
2010 | 2009 | 2008 | |||||||||
| |
(in thousands) |
|||||||||||
Premiums |
||||||||||||
Life insurance |
$ | 64,820 | $ | 70,864 | $ | 73,387 | ||||||
Accident and health |
5,686,404 | 4,978,196 | 5,103,721 | |||||||||
Total gross premiums |
5,751,224 | 5,049,060 | 5,177,108 | |||||||||
Ceded to other companies |
||||||||||||
Life insurance |
(51,977 | ) | (55,509 | ) | (23,740 | ) | ||||||
Accident and health |
(117,566 | ) | (129,856 | ) | (600,732 | ) | ||||||
Total ceded premiums |
(169,543 | ) | (185,365 | ) | (624,472 | ) | ||||||
Assumed from other companies |
||||||||||||
Life insurance |
721 | 3,304 | 3,169 | |||||||||
Accident and health |
47,298 | 51,899 | 44,649 | |||||||||
Total assumed premium |
48,019 | 55,203 | 47,818 | |||||||||
Net amount |
||||||||||||
Life insurance |
13,564 | 18,659 | 52,816 | |||||||||
Accident and health |
5,616,136 | 4,900,239 | 4,547,638 | |||||||||
Total net premium |
$ | 5,629,700 | $ | 4,918,898 | $ | 4,600,454 | ||||||
Percentage of assumed to net premium |
||||||||||||
Life insurance |
5 | % | 18 | % | 6 | % | ||||||
Accident and health |
1 | % | 1 | % | 1 | % | ||||||
Total assumed to total net |
1 | % | 1 | % | 1 | % | ||||||
Benefits and claims recovered |
150,536 | 138,634 | 552,635 | |||||||||
| |
As of December 31, | ||||||||||
|---|---|---|---|---|---|---|---|---|---|---|---|
| |
2010 | 2009 | 2008 | ||||||||
| |
(in thousands) |
||||||||||
Life insurance in force |
|||||||||||
Gross amount |
$ | 2,416,667 | $ | 2,569,753 | $ | 2,915,595 | |||||
Ceded to other companies |
(2,269,345 | ) | (2,459,260 | ) | (887,677 | ) | |||||
Assumed from other companies |
55,067 | 58,388 | 72,620 | ||||||||
Net amount |
$ | 202,389 | $ | 168,881 | $ | 2,100,538 | |||||
Percentage of assumed to net in force |
27 | % | 35 | % | 3 | % | |||||
F-41
UNIVERSAL AMERICAN CORP. AND SUBSIDIARIES
NOTES TO CONSOLIDATED FINANCIAL STATEMENTS (Continued)
11. LIABILITIES FOR POLICY AND CONTRACT CLAIMS—HEALTH
Activity in the policy and contract claims—health liability is as follows:
| |
For The Years Ended December 31, | |||||||
|---|---|---|---|---|---|---|---|---|
| |
2010 | 2009 | ||||||
| |
(in thousands) |
|||||||
Balance at beginning of year |
$ | 380,519 | $ | 500,577 | ||||
Less reinsurance recoverable |
(17,923 | ) | (33,086 | ) | ||||
Net balance at beginning of year |
362,596 | 467,491 | ||||||
Incurred related to: |
||||||||
Current year |
4,656,183 | 3,979,830 | ||||||
Prior year development |
(1,069 | ) | 3,603 | |||||
Total incurred |
4,655,114 | 3,983,433 | ||||||
Paid related to: |
||||||||
Current year |
4,328,061 | 3,640,970 | ||||||
Prior year |
329,447 | 447,358 | ||||||
Total paid |
4,657,508 | 4,088,328 | ||||||
Net balance at end of period |
360,202 | 362,596 | ||||||
Plus reinsurance recoverable |
14,337 | 17,923 | ||||||
Balance at end of year |
$ | 374,539 | $ | 380,519 | ||||
The medical cost amount, noted as "prior year development" in the table above, represents (favorable) or unfavorable adjustments as a result of prior year claim estimates being settled for amounts that are different than originally anticipated. This prior year development occurs due to differences between the actual medical utilization and other components of medical cost trends, and actual claim processing and payment patterns compared to the assumptions for claims trend and completion factors used to estimate our claim liabilities.
The claim reserve balances at December 31, 2009 settled during 2010 for $1.1 million less than originally estimated. This prior year development represents less than 0.1% of the incurred claims recorded in 2009.
The claim reserve balances at December 31, 2008 settled during 2009 for $3.6 million more than originally estimated, which represents less than 0.1% of the incurred claims recorded in 2008.
12. INCOME TAXES
Our parent holding company files a consolidated return for federal income tax purposes that includes all of our life and non-life insurance company subsidiaries, including Heritage Health Systems.
F-42
UNIVERSAL AMERICAN CORP. AND SUBSIDIARIES
NOTES TO CONSOLIDATED FINANCIAL STATEMENTS (Continued)
12. INCOME TAXES (Continued)
Our federal and state income tax expense (benefit) is as follows:
| |
2010 | 2009 | 2008 | |||||||
|---|---|---|---|---|---|---|---|---|---|---|
| |
(in thousands) |
|||||||||
Current—United States |
$ | 59,904 | $ | 70,761 | $ | 49,162 | ||||
Deferred—United States |
26,730 | 3,567 | 7,050 | |||||||
Total tax expense |
$ | 86,634 | $ | 74,328 | $ | 56,212 | ||||
A reconciliation of "expected" tax expense at 35% with our actual tax expense applicable to operating income before taxes reported in the consolidated statements of operations is as follows:
| |
2010 | 2009 | 2008 | |||||||
|---|---|---|---|---|---|---|---|---|---|---|
| |
(in thousands) |
|||||||||
Expected tax expense |
$ | 96,010 | $ | 75,121 | $ | 52,956 | ||||
State taxes |
3,507 | 3,698 | (16 | ) | ||||||
Change in valuation allowance |
2,040 | 1,345 | 1,289 | |||||||
Examination and related adjustments |
(13,972 | ) | (4,752 | ) | — | |||||
Other, net |
(951 | ) | (1,084 | ) | 1,983 | |||||
Actual tax expense |
$ | 86,634 | $ | 74,328 | $ | 56,212 | ||||
In addition to federal and state income tax, our insurance company subsidiaries are subject to state premium taxes, which are included in other operating costs and expenses in the consolidated statements of operations.
In the fourth quarter of 2009, the Internal Revenue Service closed the examination of the pre-acquisition MemberHealth 2006 and 2007 federal tax returns resulting in a Federal tax refund of $23.0 million. Subsequent to the review and approval by the Joint Committee on Taxation during 2010, the refund was received. $19.1 of the refund was accrued during the MemberHealth purchase accounting process; the additional $3.9 was recognized in 2010, along with $3.1 million of interest refunded from amounts paid in 2008 because of the amended return, as well as interest on the refund.
For the year ended December 31, 2010, our effective tax rate was 31.6%, compared with 34.6% for the same period of 2009. The decline in the effective rate for the year ended December 31, 2010 is due to the recording of $14.4 million of non-recurring tax benefits in 2010. $6.9 million of the benefits resulted from the unrecorded benefit along with interest income related to the settlement of the Internal Revenue Service examination of Memberhealth's 2006 and 2007 tax returns, discussed above. $7.1 million of the benefit resulted from the release of the Phase III tax on the policyholder surplus account which resulted in a reduction of the deferred tax liability during the third quarter of 2010.
Deferred income taxes reflect the net tax effects of temporary differences between the carrying value of assets and liabilities for financial reporting purposes and the amount used for income tax
F-43
UNIVERSAL AMERICAN CORP. AND SUBSIDIARIES
NOTES TO CONSOLIDATED FINANCIAL STATEMENTS (Continued)
12. INCOME TAXES (Continued)
purposes. The tax effects of temporary differences that give rise to significant portions of the deferred tax assets and deferred tax liabilities are as follows:
| |
2010 | 2009 | ||||||
|---|---|---|---|---|---|---|---|---|
| |
(in thousands) |
|||||||
Deferred tax assets: |
||||||||
Deferred policy acquisition costs |
$ | — | $ | 5,388 | ||||
Net operating loss carryforwards |
7,605 | 6,108 | ||||||
Stock-based compensation |
13,168 | 10,570 | ||||||
Asset valuation differences |
1,510 | 7,631 | ||||||
Capital loss carryforwards |
2,710 | — | ||||||
Unrealized losses on investments |
1,330 | 4,262 | ||||||
Other |
2,533 | 3,104 | ||||||
Total gross deferred tax assets |
28,856 | 37,063 | ||||||
Less valuation allowance |
(7,818 | ) | (5,778 | ) | ||||
Net deferred tax assets |
21,038 | 31,285 | ||||||
Deferred tax liabilities: |
||||||||
Reserves for future policy benefits |
(7,015 | ) | (6,017 | ) | ||||
Deferred policy acquisition costs |
(27,002 | ) | — | |||||
Present value of future profits |
(48,815 | ) | (56,832 | ) | ||||
Total gross deferred tax liabilities |
(82,832 | ) | (62,849 | ) | ||||
Net deferred tax liability |
$ | (61,794 | ) | $ | (31,564 | ) | ||
At December 31, 2010, we had net capital loss carryforwards, subject to certain consolidating limitations, of approximately $7.7 million that expire in 2014.
We establish valuation allowances based upon an analysis of projected taxable income and our ability to implement prudent and feasible tax planning strategies. We carried valuation allowances on our deferred tax assets of $7.8 million at December 31, 2010 and $5.8 million at December 31, 2009, primarily related to state net operating loss carryforwards. During 2010, we established a deferred tax asset of $2.0 million for state net operating loss carryforwards; concurrently, a valuation allowance of $2.0 million also was established. These state net operating loss carryforwards expire starting in 2021 through 2030. At December 31, 2010, we assessed the amount of the deferred tax asset that was more likely than not to be realized under ASC 740, Income Taxes, and concluded that we can record tax benefits related to realized losses on our investments for financial statement purposes. We believe it is more likely than not that we will realize the recorded value of our net deferred tax assets.
A federal tax return, generally, is open for examination for three years from the date on which it is filed, or, if applicable, from the extended due date unless the statute is extended by mutual consent. We have not entered into any agreement to extend the statute of limitations of any state tax return for any jurisdiction. In connection with the examination of our 2006 federal tax return, the statute of limitations was extended to December 31, 2010. Consequently, federal tax returns for the years ending December 31, 2006 through 2010 are open. During 2010, the IRS began to examine the separate 2007 federal life consolidated return of American Exchange Life Insurance Company and subsidiaries, a wholly owned subsidiary. The statue of limitations has been extended to June 30, 2012. Certain earlier
F-44
UNIVERSAL AMERICAN CORP. AND SUBSIDIARIES
NOTES TO CONSOLIDATED FINANCIAL STATEMENTS (Continued)
12. INCOME TAXES (Continued)
returns remain open to the extent that net operating loss carry forwards were used or generated in those years. Also, various state tax returns remain open for examination under specific state statutes of limitation for an additional period of time.
Our unrecognized tax benefits at December 31, 2010 primarily relate to refund claims filed in various state jurisdictions during 2010. These unrecognized tax benefits are being reviewed by the various state income tax authorities. We anticipate a resolution within the next twelve months which could significantly change the balance in unrecognized tax benefits. A reconciliation of the beginning and ending amount of unrecognized tax benefits is as follows:
| |
2010 | |||
|---|---|---|---|---|
| |
(in thousands) |
|||
Balance of as January 1, 2010 |
$ | — | ||
Additions based on tax positions related to the current year |
15,431 | |||
Balance of as December 31, 2010 |
$ | 15,431 | ||
At December 31, 2010, these unrecognized tax benefits amount to $10.0 million, net of federal income tax. If recognized, they will affect the annual effective tax rate.
We recognize interest and penalties related to unrecognized tax benefits in federal and state tax expense. During the year ended December 31, 2010, we recognized no such interest expense and penalties.
13. LOAN PAYABLE
2007 Credit Facility
In connection with the MemberHealth transaction, we refinanced our Amended Credit Facility and Revolving Credit Facility with a new credit facility (the "2007 Credit Facility") consisting of a $350 million term loan and a $150 million revolver. A portion of the proceeds from the refinancing was used to repay in full the amounts outstanding on our previous credit facility and revolving credit facility. The 2007 Credit Facility contains certain covenants and requirements including a leverage ratio test, minimum risk based capital requirements for our insurance companies and, under certain conditions, the ability to pose limitations on certain investments, dispositions and our ability to make restricted payments. As of December 31, 2010, we were in compliance with all financial covenants. In connection with the Part D Sale Transaction, the 2007 Credit Facility will be terminated and paid off.
In November 2009, the 2007 Credit Facility was amended (the "November 2009 Amendment") which provided us with the ability to make an additional $75 million of restricted payments, up to a total of $200 million, in exchange for prepayments of Term Loan principal and increases in borrowing spreads and fees.
On July 27, 2010, we further amended our 2007 Credit Facility (the "July 2010 Amendment") to provide us with the ability to make an additional $100 million of restricted payments (which includes purchases of company stock and payment of dividends) up to a total of $300 million. As part of the July 2010 Amendment, we agreed to prepay term loan debt principal at a rate of 50% of all restricted payments above the $125 million restricted payment limit in the original credit agreement. In August 2010, we announced and paid dividends totaling $156 million and, per the terms of the amendment,
F-45
UNIVERSAL AMERICAN CORP. AND SUBSIDIARIES
NOTES TO CONSOLIDATED FINANCIAL STATEMENTS (Continued)
13. LOAN PAYABLE (Continued)
made prepayments of Term Loan principal of $78 million. Additionally, we agreed to an increase in the LIBOR based spread by up to 25 basis points depending on our consolidated leverage ratio, and based on our current consolidated leverage ratio, by 12.5 basis points from LIBOR plus 100 basis points to LIBOR plus 112.5 basis points.
In accordance with the credit agreement for the 2007 Credit Facility, the spread and fee are determined based on our consolidated leverage ratio. Effective December 31, 2010, the weighted average interest rate on the term loan portion of the 2007 Credit Facility was 1.41%. We had not drawn on the revolving loan facility as of the date of this report.
Our obligations under the 2007 Credit Facility are guaranteed by our subsidiaries, Heritage Health Systems, Inc., MemberHealth LLC and our insurance holding company, UAC Holding, Inc., if, and only if, a rating condition exists whereby we are either no longer rated by S&P or such rating falls below BBB-, this facility would be secured by substantially all of the assets of each of the guarantors. In March 2008, S&P placed a rating of BB+ on us that triggered this added security requirement.
In connection with the 2007 Credit Facility, we had incurred additional loan origination fees of approximately $4.7 million, which were capitalized and are being amortized on a straight-line basis, which does not differ significantly from the effective yield basis, over the life of the 2007 Credit Facility. In connection with the 2010 Amendment and the November 2009 Amendment, we incurred amendment fees of approximately $0.8 million and $1.2 million, respectively, which were capitalized and are being amortized over the remaining term of the Credit Facility on a straight-line basis.
On December 4, 2007, we entered into two separate interest rate swap agreements, one with Citibank, N.A. and one with Calyon Corporate and Investment Bank to hedge the variability of cash flows for interest payments on a total notional amount of $250 million of our 2007 Credit Facility. In entering the swap with Citibank, N.A., we agreed to swap our floating rate interest payment based on the floating LIBOR base rate on a notional amount of $125 million in exchange for a fixed interest rate payment based on a fixed 4.14% locked in base rate. In entering the swap with Calyon Corporate and Investment Bank, we agreed to swap our floating rate interest payment based on the floating LIBOR base rate on a notional amount of $125 million in exchange for a fixed interest rate payment based on a fixed 4.13% locked in based rate. Due primarily to the $78.1 million debt prepayment made in the third quarter of 2010, the outstanding principal balance on the hedged Credit Facility was reduced to $232.9 million at December 31, 2010, $17.1 million lower than the original $250 million notional amounts on the swaps. As a result, this portion of the swaps was deemed ineffective and the notional amount on the Citibank swaps was decreased by $17.1 million to $107.9 million, which resulted in a realized loss of $1.3 million (See Note 15—Derivative Instruments—Interest Rate Swaps in the Notes to Consolidated Financial Statements).
Under the original terms of the 2007 Credit Facility, we were required to make principal repayments quarterly at the rate of $3.5 million per year over a five-year period with a final payment of $308.4 million due upon maturity in September, 2012. As a result of the prepayments, we are required to ratably apply those prepayments through the remaining scheduled repayments. As a result of the $25 million prepayment in April 2008 and prepayments pursuant to the November 2009 and July 2010
F-46
UNIVERSAL AMERICAN CORP. AND SUBSIDIARIES
NOTES TO CONSOLIDATED FINANCIAL STATEMENTS (Continued)
13. LOAN PAYABLE (Continued)
Amendments, the following table reflects the schedule of principal payments remaining on the credit facility as of December 31, 2010:
| |
2007 Credit Facility |
|||
|---|---|---|---|---|
| |
(in thousands) |
|||
2011 |
$ | 2,737 | ||
2012 |
230,135 | |||
|
$ | 232,872 | ||
Principal and Interest Payments
We made regularly scheduled principal payments of $2.8 million and prepayments of $78.1 million, primarily as a result of the July 2010 Amendment, during the year ended December 31, 2010, $3.1 million and prepayments of $3.8 million, as a result of the November 2009 Amendment, during the year ended December 31, 2009, $3.5 million plus the $25.0 million prepayment discussed above during 2008, and $3.5 million during 2007 in connection with its credit facilities. The Company paid interest of $4.0 million during 2010, $7.2 million during 2009 and $13.0 million during 2008 in connection with its credit facilities.
The following table sets forth certain summary information with respect to borrowings of the Company under the 2007 Credit Facility (excluding the effect of the interest rate swap agreements):
| |
As of December 31, | Year Ended December 31, | ||||||||||||||
|---|---|---|---|---|---|---|---|---|---|---|---|---|---|---|---|---|
| |
Amount Outstanding |
Interest Rate |
Maximum Amount Outstanding |
Weighted Average Amount Outstanding(1) |
Weighted Average Interest Rate(2) |
|||||||||||
| |
(in thousands, except rates) |
|||||||||||||||
2010 |
$ | 232,872 | 1.41 | % | $ | 313,758 | $ | 283,941 | 1.38 | % | ||||||
2009 |
$ | 313,758 | 1.28 | % | $ | 320,625 | $ | 319,120 | 1.56 | % | ||||||
- (1)
- The
average amounts of borrowings outstanding were computed by determining the arithmetic average of the months' average outstanding borrowings.
- (2)
- The weighted-average interest rates were determined by dividing interest expense related to total borrowings by the average amounts outstanding of such borrowings.
14. OTHER LONG-TERM DEBT
The Company has formed separate statutory business trusts (the "Trusts"), which exist for the exclusive purpose of issuing trust preferred securities representing undivided beneficial interests in the assets of the trust, investing the gross proceeds of the trust preferred securities in junior subordinated deferrable interest debentures of the Company (the "Junior Subordinated Debt") and engaging in only those activities necessary or incidental thereto. In accordance with the adoption of ASC 810-10-05, Consolidation—Variable Interest Entities, the Company does not consolidate the trusts.
F-47
UNIVERSAL AMERICAN CORP. AND SUBSIDIARIES
NOTES TO CONSOLIDATED FINANCIAL STATEMENTS (Continued)
14. OTHER LONG-TERM DEBT (Continued)
As of December 31, 2010, the Trusts have an outstanding balance of a combined $110.0 million in thirty year trust preferred securities (the "Capital Securities") as detailed in the following table:
Maturity Date
|
Amount Issued |
Term | Spread Over LIBOR |
Rate as of December 31, 2010 |
||||||||
|---|---|---|---|---|---|---|---|---|---|---|---|---|
| |
(in thousands) |
|
(Basis points) |
|
||||||||
April 2033 |
$ | 10,000 | Floating | 400 | 4.3 | % | ||||||
May 2033 |
15,000 | Floating | 420 | 4.5 | % | |||||||
May 2033 |
15,000 | Fixed/Floating | 410 | (1) | 4.4 | % | ||||||
October 2033 |
20,000 | Fixed/Floating | 395 | (2) | 4.2 | % | ||||||
March 2037 |
50,000 | Fixed/Floating | 275 | (3) | 7.7 | % | ||||||
|
$ | 110,000 | ||||||||||
- (1)
- The
rate on this issue was fixed at 7.4% for the first five years. On May 15, 2008, it converted to a floating rate equal to LIBOR plus 410 basis
points.
- (2)
- Effective
April 29, 2004, the Company entered into a swap agreement whereby it will pay a fixed rate of 6.98% in exchange for a floating rate of
LIBOR plus 395 basis points. The swap contract expired in October 2008 and it reverted to a floating rate equal to LIBOR plus 395 basis points.
- (3)
- The rate on this issue is fixed at 7.7% for the first five years. On March 15, 2012, it will convert to a floating rate equal to LIBOR plus 275 basis points.
The Trusts have the right to call the Capital Securities at par after five years from the date of issuance (which ranged from December 2002 to March 2007). The proceeds from the sale of the Capital Securities, together with proceeds from the sale by the Trusts of their common securities to the Company, were invested in thirty-year floating rate Junior Subordinated Debt of the Company. From the proceeds of the trust preferred securities, $26.0 million was used to pay down debt during 2003. The balance of the proceeds has been used, in part to fund acquisitions, to provide capital to the Company's insurance subsidiaries to support growth and to be held for general corporate purposes. In connection with the Part D Sale Transaction, all of the $110 million of trust preferred securities will be paid off and/or assumed by CVS Caremark.
The Capital Securities represent an undivided beneficial interest in the Trusts' assets, which consist solely of the Junior Subordinated Debt. Holders of the Capital Securities have no voting rights. The Company owns all of the common securities of the Trusts. Holders of both the Capital Securities and the Junior Subordinated Debt are entitled to receive cumulative cash distributions accruing from the date of issuance, and payable quarterly in arrears at a floating rate equal to the three month LIBOR plus a spread. The floating rate resets quarterly and is limited to a maximum of 12.5% during the first sixty months. Due to the variable interest rate for these securities, the Company would be subject to higher interest costs if short-term interest rates rise. The Capital Securities are subject to mandatory redemption upon repayment of the Junior Subordinated Debt at maturity or upon earlier redemption. The Junior Subordinated Debt is unsecured and ranks junior and subordinate in right of payment to all present and future senior debt of the Company and is effectively subordinated to all existing and future obligations of the Company's subsidiaries. The Company has the right to redeem the Junior Subordinated Debt after five years from the date of issuance.
F-48
UNIVERSAL AMERICAN CORP. AND SUBSIDIARIES
NOTES TO CONSOLIDATED FINANCIAL STATEMENTS (Continued)
14. OTHER LONG-TERM DEBT (Continued)
The Company has the right at any time, and from time to time, to defer payments of interest on the Junior Subordinated Debt for a period not exceeding 20 consecutive quarters up to each debenture's maturity date. During any such period, interest will continue to accrue and the Company may not declare or pay any cash dividends or distributions on, or purchase, the Company's common stock nor make any principal, interest or premium payments on or repurchase any debt securities that rank equally with or junior to the Junior Subordinated Debt. The Company has the right at any time to dissolve the Trusts and cause the Junior Subordinated Debt to be distributed to the holders of the Capital Securities. The Company has guaranteed, on a subordinated basis, all of the Trusts' obligations under the Capital Securities including payment of the redemption price and any accumulated and unpaid distributions to the extent of available funds and upon dissolution, winding up or liquidation but only to the extent the Trusts have funds available to make such payments.
The Company paid $6.5 million in interest in connection with the Junior Subordinated Debt during the year ended December 31, 2010, $7.2 million during 2009 and $8.3 million during 2008.
15. DERIVATIVE INSTRUMENTS—INTEREST RATE SWAPS
On December 4, 2007, we entered into two separate interest rate swap agreements, one with Citibank, N.A. and one with Calyon Corporate and Investment Bank, on a total notional amount of $250 million, where we pay an average locked-in fixed rate of 4.14% and receive a floating rate based on LIBOR to hedge the variability of cash flows to be paid under our credit facility. At inception, we determined that the critical terms of the hedging instrument and the hedged forecasted transaction were the same and we designated these swaps as cash flow hedges, with changes in the fair value reflected in other comprehensive income and the unrealized loss on these hedges in accumulated other comprehensive income. We perform periodic assessments of hedge effectiveness by verifying and documenting whether the critical terms of the hedging instrument and the forecasted transaction have changed during the period, rather than by quantifying the relevant changes in cash flows.
Due primarily to the $78 million debt prepayment made in the third quarter of 2010 (see Note 13—Loan Payable in the Notes to Consolidated Financial Statements), the outstanding principal balance on the hedged Credit Facility was reduced to $232.9 million at December 31, 2010, $17.1 million lower than the $250 million notional amounts on the swaps. As a result, this portion of the swaps was deemed ineffective and the notional amount on one of the swaps was decreased by $17.1 million to $107.9 million, which resulted in a realized loss of $1.3 million. In addition, we evaluated the likelihood of additional debt paydowns prior to the scheduled maturity of the Credit Facility and the related interest rate swaps in September 2012, and identified an additional $4.5 million of the swaps that would be considered ineffective as hedges. As a result, we realized an additional loss of $0.3 million on this ineffective portion of the swap, resulting in total realized losses on the cash flow hedge of $1.6 million in 2010.
The unrealized loss on the effective portion of the swap totaling $13.7 million is reflected in accumulated other comprehensive income. The combined fair value of these swaps was a $14.0 million liability at December 31, 2010 and a $15.5 million liability at December 31, 2009. These amounts are reported in other liabilities in the consolidated balance sheets.
In connection with the swap transaction executed with Citibank, N.A., we are required to post collateral when we are in a net liability position. The collateral amount required is based on the fair value of the swap including net accrued interest less a $1 million threshold amount as determined by
F-49
UNIVERSAL AMERICAN CORP. AND SUBSIDIARIES
NOTES TO CONSOLIDATED FINANCIAL STATEMENTS (Continued)
15. DERIVATIVE INSTRUMENTS—INTEREST RATE SWAPS (Continued)
our credit rating of BB+. Should we be downgraded or cease to be rated by either S&P or Moody's, the threshold amount would be reduced to zero and we would need to post $1 million in additional collateral. This collateral is reflected in cash and cash equivalents and was $6.1 million as of December 31, 2010 and $8.1 million as of December 31, 2009.
16. DISCLOSURES ABOUT FAIR VALUES OF FINANCIAL INSTRUMENTS
We used the following methods and assumptions estimate the fair value of each class of financial instruments for which it is practicable to estimate that value:
Fixed maturity investments available for sale: The fair value for fixed maturity securities is largely determined by third party pricing service market prices. Typical inputs used by third party pricing services include, but are not limited to:
- •
- reported trades,
- •
- benchmark yields,
- •
- issuer spreads,
- •
- bids,
- •
- offers and
- •
- estimated cash flows and prepayment speeds.
Based on the typical trading volumes and the lack of quoted market prices for fixed maturities, third party pricing services will normally derive the security prices through recent reported trades for identical or similar securities making adjustments through the reporting date based upon available market observable information as outlined above. If there are no recent reported trades, the third party pricing services may use matrix or model processes to develop a security price where they develop future cash flow expectations based upon collateral performance and discount these at an estimated market rate. The pricing for mortgage-backed and asset-backed securities reflects estimates of the rate of future prepayments of principal over the remaining life of the securities. These estimates are derived based on the characteristics of the underlying structure and prepayment speeds previously experienced at the interest rate levels projected for the underlying collateral. Actual prepayment experience may vary from these estimates.
Other invested assets: Other invested assets consists of collateralized loans which are carried at the underlying collateral value, cash value of life insurance and mortgage loans which are carried at the aggregate unpaid balance. The determination of fair value for these invested assets is not practical because there is no active trading market for such invested assets and therefore, the carrying value is a reasonable estimate of fair value.
Cash and cash equivalents and policy loans: For cash and cash equivalents and policy loans, the carrying amount is a reasonable estimate of fair value.
Interest rate swaps: The interest rate swaps are carried at fair value, obtained from external quotes provided by banks.
F-50
UNIVERSAL AMERICAN CORP. AND SUBSIDIARIES
NOTES TO CONSOLIDATED FINANCIAL STATEMENTS (Continued)
16. DISCLOSURES ABOUT FAIR VALUES OF FINANCIAL INSTRUMENTS (Continued)
Investment contract liabilities: For annuity contracts, the carrying amount is the policyholder account value; estimated fair value equals the policyholder account value less surrender charges. Effective April 1, 2009, these balances were 100% ceded.
Loan payable and trust preferred securities: For the loan payable and trust preferred securities fair value represents the present value of contractual cash flows discounted at current spreads for equivalent credit quality.
The estimated fair values of the Company's financial instruments are as follows:
| |
2010 | 2009 | ||||||||||||
|---|---|---|---|---|---|---|---|---|---|---|---|---|---|---|
| |
Carrying Amount |
Fair Value | Carrying Amount |
Fair Value | ||||||||||
| |
(in thousands) |
|||||||||||||
Financial assets: |
||||||||||||||
Fixed maturities available for sale |
$ | 1,398,498 | $ | 1,398,498 | $ | 964,553 | $ | 964,553 | ||||||
Other invested assets |
1,409 | 1,409 | 1,276 | 1,276 | ||||||||||
Cash and cash equivalents |
65,444 | 65,444 | 856,958 | 856,958 | ||||||||||
Financial liabilities: |
||||||||||||||
Investment contract liabilities |
183,490 | 179,278 | 204,875 | 197,954 | ||||||||||
Loan payable |
232,872 | 230,544 | 313,758 | 288,657 | ||||||||||
Trust preferred securities |
110,000 | 99,000 | 110,000 | 84,300 | ||||||||||
Interest rate swaps |
13,968 | 13,968 | 15,465 | 15,465 | ||||||||||
17. EARNINGS PER COMMON SHARE COMPUTATION
We calculate earnings per common share using the two-class method. This method requires that we allocate net income between net income attributable to participating preferred stock and net income attributable to common stock, based on the dividend and earnings participation provisions of the preferred stock. Basic earnings per share excludes the dilutive effects of stock options outstanding during the periods and is equal to net income attributable to common stock divided by the weighted average number of common shares outstanding for the periods.
For the years ended December 31, 2010, 2009, and 2008 we allocated earnings between common and participating preferred stock as follows:
| |
2010 | 2009 | 2008 | |||||||
|---|---|---|---|---|---|---|---|---|---|---|
| |
(in thousands) |
|||||||||
Net income attributable to common stock |
$ | 177,559 | $ | 133,023 | $ | 77,537 | ||||
Undistributed income allocated to participating preferred stock |
10,120 | 7,281 | 17,555 | |||||||
Net income |
$ | 187,679 | $ | 140,304 | $ | 95,092 | ||||
Diluted EPS includes the dilutive effect of the participating preferred stock and stock options outstanding during the year. We excluded 496,127; 2,557,267 and 3,770,080 stock options from the computation of diluted EPS at December 31, 2010, 2009 and 2008, respectively, because they were antidilutive.
F-51
UNIVERSAL AMERICAN CORP. AND SUBSIDIARIES
NOTES TO CONSOLIDATED FINANCIAL STATEMENTS (Continued)
18. STOCKHOLDERS' EQUITY
Preferred Stock
We have 3.0 million authorized shares of preferred stock, of which we have designated 300,000 shares as Series A preferred stock and 300,000 shares as Series B preferred stock. The holders of both Series A preferred stock and Series B preferred stock possess specified rights whereby they may, in specified circumstances, convert the shares directly or indirectly into shares of common stock. In addition, we have the right to convert the shares of our Series B preferred stock to common stock, in the ratio of 100 shares of common stock for each share of Series B preferred stock, from and after the first anniversary of the issuance of the shares of Series B preferred stock. On November 24, 2008, we converted all of the then-outstanding 132,895 shares of Series B preferred stock into 13,289,500 shares of our common stock.
At December 31, 2010 and 2009, there were 42,105 shares of Series A preferred stock outstanding and no shares of Series B preferred stock outstanding.
Series A Participating Convertible Preferred Stock
Subject to the exceptions described below, each share of Series A preferred stock ranks equally in all respects and has the same rights, powers and preferences, and the same qualifications, and limitations, as our Series B preferred stock:
Rank. The Series A preferred stock ranks
- •
- senior and prior to our common stock and each other class or series of our equity securities, whether currently issued or
issued in the future, that by its terms ranks junior to the Series A preferred stock, whether with respect to payment of dividends, rights upon liquidation, dissolution or winding up of our
affairs, or otherwise,
- •
- on a parity with each other class or series of our equity securities, whether currently issued or issued in the future,
that do not by their terms expressly provide that they rank senior to or junior to the Series A preferred stock whether with respect to payment of dividends, rights upon liquidation,
dissolution or winding up of our affairs, or otherwise, and
- •
- junior to each other class or series of our equity securities, whether currently issued or issued in the future, that by their terms rank senior to the Series A preferred stock.
Dividends. Holders of shares of Series A preferred stock are entitled to participate equally and ratably with the holders of shares of common stock in all dividends and distributions paid on the shares of common stock as if, immediately prior to each record date for payment of a dividend or distribution on the common stock, the shares of Series A preferred stock then outstanding were converted into shares of common stock.
Liquidation Preference. In the event that we voluntarily or involuntarily liquidate, dissolve or wind up, the holders of shares of Series A preferred stock are, with respect to each such share of Series A preferred stock, entitled to receive the greater of
- •
- prior to the first anniversary of the original issuance in respect of a share of Series A preferred stock, $2,000 and on or after the first anniversary of the original issuance in respect of a share of Series A preferred stock, $1.00 in each case plus an amount equal to any dividends or distributions payable and remaining unpaid on the share, and
F-52
UNIVERSAL AMERICAN CORP. AND SUBSIDIARIES
NOTES TO CONSOLIDATED FINANCIAL STATEMENTS (Continued)
18. STOCKHOLDERS' EQUITY (Continued)
- •
- at any time, the payment the holders would have received had those holders, immediately prior to our liquidation, dissolution or winding up, converted the share of Series A preferred stock into shares of common stock, in each case before any payment or distribution is made on any shares of common stock. We estimate liquidation value on or after the first anniversary of the original issuance based on our closing share price on the balance sheet.
Neither a consolidation or merger nor a sale or transfer of all or any part of our assets for cash, securities or other property, is considered a liquidation, dissolution or winding up.
Voting Rights. Holders of shares of Series A preferred stock are not entitled to vote on any matter submitted to a vote of our shareholders, but are entitled to prior written notice of, and are entitled to attend and observe, all special and annual meetings of our shareholders. However, so long as any shares of Series A preferred stock are outstanding, we will not, without the written consent or affirmative vote by holders of at least a majority of the outstanding shares of Series A preferred stock, voting as a single and separate class:
- •
- amend, alter or repeal any provision of our certificate of incorporation, by any means, such as by merger, consolidation,
reclassification, or otherwise so as to, or in a manner that would, adversely affect the preferences, rights, privileges or powers of the Series A preferred stock; or
- •
- increase the authorized or issued number of shares of Series A preferred stock.
Merger or Consolidation. Unless approved by holders of the shares of Series A preferred stock, we will not merge or consolidate into, or sell, transfer or lease all or substantially all of our property to any other entity, unless the successor, transferee or lessee entity expressly assumes the due and punctual performance and observance of each and every covenant and condition described above to be performed and observed by us and expressly agrees to exchange, at the holder's option, shares of Series A preferred stock for shares of the surviving entity's capital stock on terms substantially similar to the terms described above.
Conversion upon Transfer. Any share of Series A preferred stock owned by any equity investor that was an original purchaser of the share or any affiliate of an equity investor is not convertible into common stock so long as such share of Series A preferred stock is owned by that equity investor or affiliate. At any time when a share of Series A preferred stock is not or ceases to be owned by an equity investor or an affiliate of an equity investor, the share of Series A preferred stock, without any further action or deed on our part or any other individual, entity or group, will automatically convert into the number of fully paid and non-assessable shares of common stock determined by dividing $2,000 by the conversion price in effect at the time of conversion. The initial conversion price is $20.
Exchange of Shares. Under the securities purchase agreements that governed the original issue of the Series A preferred stock, we have agreed that, at an equity investor's request, we will exchange all or any shares of Series A preferred stock held by the equity investor for a like number of shares of Series B preferred stock; provided that, prior to the consummation of any exchange, the equity investor shall have obtained a clearance, approval or waiver, under specified laws governing insurance companies or the Hart-Scott-Rodino Antitrust Improvements Act of 1976, as amended, or shall have represented to us that no clearance, approval or waiver is not required in connection with such an exchange.
F-53
UNIVERSAL AMERICAN CORP. AND SUBSIDIARIES
NOTES TO CONSOLIDATED FINANCIAL STATEMENTS (Continued)
18. STOCKHOLDERS' EQUITY (Continued)
Series B Participating Convertible Preferred Stock
Subject to the exceptions described below, each share of our Series B preferred stock ranks equally in all respects and has the same dividend and other rights, powers and liquidation and other preferences, and the same qualifications, limitations and restrictions as our Series A preferred stock.
Voting Rights. In addition to the voting rights described above, holders of our Series B preferred stock may vote with holders of our common stock together as one class on all matters submitted for a vote of holders of our common stock. Holders of our Series B preferred stock are entitled to a number of votes equal to the number of votes to which the shares of our common stock issuable upon conversion of their shares of Series B Preferred Stock would have been entitled if those shares of common stock had been outstanding at the time of the applicable record date.
Right to Convert. A holder of our Series B preferred stock has the right, at any time and from time to time, to convert any or all of the holder's shares of Series B into the number of fully paid and non-assessable shares of common stock determined by dividing $2,000 by the conversion price in effect at the time of conversion. The initial conversion price is $20.
We have the right to require the holder of each share of our Series B preferred stock, from and after the first anniversary of the date of original issuance of the share, from time to time, at our option, to convert the share of Series B preferred stock into fully paid and non-assessable shares of our common stock at the applicable conversion price. The number of shares of common stock into which one share of the Series B preferred stock is convertible is determined by dividing the preferred share price by the conversion price in effect at the time of conversion.
Common Stock—Voting
We currently have authorized for issuance 200 million shares of voting common stock, par value $0.01 per share. Changes in the number of shares of common stock issued were as follows:
Years ended December 31,
|
2010 | 2009 | 2008 | |||||||
|---|---|---|---|---|---|---|---|---|---|---|
Common stock issued, beginning of year |
87,942,663 | 87,447,100 | 74,952,177 | |||||||
Conversion of Preferred B into common stock |
— | — | 13,289,500 | |||||||
Return of stock issued and stock issued in connection with MemberHealth acquisition |
— | — | (2,027,071 | ) | ||||||
Exercise of stock options |
638,061 | 543,000 | 1,184,237 | |||||||
Retired shares |
(10,005,305 | ) | (50,537 | ) | — | |||||
Stock purchases pursuant to agents' stock purchase and deferred compensation plans |
49,793 | 3,100 | 48,257 | |||||||
Common stock issued, end of year |
78,625,212 | 87,942,663 | 87,447,100 | |||||||
Common Stock—Non Voting
We currently have authorized for issuance 30 million shares of non-voting common stock, par value $0.01 per share. None of this class of stock is, or has been, issued.
F-54
UNIVERSAL AMERICAN CORP. AND SUBSIDIARIES
NOTES TO CONSOLIDATED FINANCIAL STATEMENTS (Continued)
18. STOCKHOLDERS' EQUITY (Continued)
Treasury Stock
Changes in treasury stock were as follows (in thousands, except shares and per share amounts):
| |
For the years ended December 31, | ||||||||||||||||||
|---|---|---|---|---|---|---|---|---|---|---|---|---|---|---|---|---|---|---|---|
| |
2010 | 2009 | |||||||||||||||||
| |
Shares | Amount | Weighted Average Cost Per Share |
Shares | Amount | Weighted Average Cost Per Share |
|||||||||||||
Treasury stock, beginning of year |
13,538,081 | $ | 133,946 | $ | 9.90 | 7,194,387 | $ | 77,605 | $ | 10.79 | |||||||||
Retirement of treasury stock |
(10,000,000 | ) | (99,059 | ) | 9.91 | — | — | — | |||||||||||
Shares repurchased |
391,531 | 5,937 | 15.16 | 7,024,097 | 63,693 | 9.07 | |||||||||||||
Shares distributed in the form of employee bonuses |
(983,764 | ) | (9,406 | ) | 9.56 | (680,403 | ) | (7,352 | ) | 10.80 | |||||||||
Treasury stock, end of year |
2,945,848 | $ | 31,418 | $ | 10.67 | 13,538,081 | $ | 133,946 | $ | 9.90 | |||||||||
19. OTHER COMPREHENSIVE INCOME (LOSS)
The components of accumulated other comprehensive loss are as follows:
As of December 31,
|
2010 | 2009 | ||||||
|---|---|---|---|---|---|---|---|---|
| |
(in thousands) |
|||||||
Net unrealized gains on investments |
$ | 13,284 | $ | 21,405 | ||||
Gross unrealized OTTI |
(3,390 | ) | (18,117 | ) | ||||
Fair value of interest rate swap |
(13,693 | ) | (15,465 | ) | ||||
Deferred income tax benefit on the above |
1,330 | 4,262 | ||||||
Total accumulated other comprehensive loss |
$ | (2,469 | ) | $ | (7,915 | ) | ||
The components of other comprehensive income (loss), and the related tax effects for each component are as follows:
For the Year ended December 31, 2010
|
Before Tax Amount |
Tax Expense (Benefit) |
Net of Tax Amount |
||||||||
|---|---|---|---|---|---|---|---|---|---|---|---|
| |
(in thousands) |
||||||||||
Net unrealized gain arising during the period |
$ | 11,601 | $ | 4,060 | $ | 7,541 | |||||
Reclassification adjustment for gains included in income |
4,995 | 1,748 | 3,247 | ||||||||
Net unrealized gain arising during the period |
6,606 | 2,312 | 4,294 | ||||||||
Interest rate swap |
1,772 | 620 | 1,152 | ||||||||
Other comprehensive income |
$ | 8,378 | $ | 2,932 | $ | 5,446 | |||||
F-55
UNIVERSAL AMERICAN CORP. AND SUBSIDIARIES
NOTES TO CONSOLIDATED FINANCIAL STATEMENTS (Continued)
19. OTHER COMPREHENSIVE INCOME (LOSS) (Continued)
For the Year ended December 31, 2009
|
Before Tax Amount |
Tax Expense (Benefit) |
Net of Tax Amount |
||||||||
|---|---|---|---|---|---|---|---|---|---|---|---|
| |
(in thousands) |
||||||||||
Net unrealized gain arising during the period (net of deferred acquisition costs) |
$ | 14,369 | $ | 5,030 | $ | 9,339 | |||||
Reclassification adjustment for losses included in income |
(24,988 | ) | (8,746 | ) | (16,242 | ) | |||||
Net unrealized gain |
39,357 | 13,776 | 25,581 | ||||||||
ASC 320-10-65-1 implementation |
16,487 | 5,771 | 10,716 | ||||||||
Interest rate swap |
4,833 | 1,692 | 3,141 | ||||||||
Foreign currency translation adjustment |
(332 | ) | (117 | ) | (215 | ) | |||||
Other comprehensive income |
$ | 60,345 | $ | 21,122 | $ | 39,223 | |||||
For the Year ended December 31, 2008
|
Before Tax Amount |
Tax Expense (Benefit) |
Net of Tax Amount |
||||||||
|---|---|---|---|---|---|---|---|---|---|---|---|
| |
(in thousands) |
||||||||||
Net unrealized loss arising during the period (net of deferred acquisition costs) |
$ | (95,441 | ) | $ | (33,404 | ) | $ | (62,037 | ) | ||
Reclassification adjustment for losses included in income |
(59,681 | ) | (20,888 | ) | (38,793 | ) | |||||
Net unrealized loss |
(35,760 | ) | (12,516 | ) | (23,244 | ) | |||||
Interest rate swap |
(20,019 | ) | (7,006 | ) | (13,013 | ) | |||||
Foreign currency translation adjustment |
(153 | ) | (54 | ) | (99 | ) | |||||
Other comprehensive loss |
$ | (55,932 | ) | $ | (19,576 | ) | $ | (36,356 | ) | ||
20. SHARE REPURCHASE PLAN
We have approved share repurchase plans that have authorized us to repurchase up to $175 million of shares of our common stock. Through December 31, 2009, we had repurchased 13.4 million shares of our common stock for an aggregate amount of $132.7 million, under these programs. There have been no share repurchases since December 31, 2009 under these programs. As of December 31, 2010, we have $42.3 million that remains available to repurchase additional shares under these plans. However, share repurchases are also limited by the remaining available restricted payments under our 2007 Credit Facility, which, giving effect to the July 27, 2010 Amendment, limits share repurchases, dividends and other restricted payments to an aggregate of $300 million (see Note 13—Loan Payable in the Notes to Consolidated Financial Statements). Currently, we have $11.2 million remaining available under this restricted payment limit. We are not obligated to repurchase any specific number of shares under the programs or to make repurchases at any specific time or price.
As a result of our share repurchase program we had accumulated 13.5 million shares of common stock in treasury as of December 31, 2009. We retired 10 million shares on March 15, 2010, reducing treasury stock by $99.1 million and reducing additional paid-in-capital by $95.6 million and retained earnings by $3.4 million, with no impact on total consolidated stockholders' equity.
F-56
UNIVERSAL AMERICAN CORP. AND SUBSIDIARIES
NOTES TO CONSOLIDATED FINANCIAL STATEMENTS (Continued)
21. STOCK-BASED COMPENSATION
1998 Incentive Compensation Plan
On May 28, 1998, our shareholders approved the 1998 Incentive Compensation Plan, known as the 1998 ICP. The 1998 ICP superseded the Company's 1993 Incentive Stock Option Plan. Options previously granted under the Company's Incentive Stock Option Plan will remain outstanding in accordance with their terms and the terms of the respective plans. The 1998 ICP provides for grants of stock options, stock appreciation rights or SARs, restricted stock, deferred stock, other stock-related awards, and performance or annual incentive awards that may be settled in cash, stock, or other property.
The total number of shares of our common stock reserved and available for delivery to participants in connection with awards under the 1998 ICP, prior to amendment on August 23, 2007, was
- •
- 9.0 million, plus
- •
- the number of shares of common stock subject to awards under preexisting plans that become available, generally due to
cancellation or forfeiture, after the effective date of the 1998 ICP, plus
- •
- 13% of the number of shares of common stock issued or delivered by us during the term of the 1998 ICP, excluding any issuance or delivery in connection with awards, or any of our other compensation or benefit plans,
provided, however, that the total number of shares of common stock with respect to which incentive stock options, or ISOs, may be granted, may not exceed 1.5 million. On August 23, 2007, our shareholders approved an amendment to increase the number of shares of common stock authorized for issuance under the 1998 ICP by 5.0 million shares. As of December 31, 2010, a total of 19.3 million shares were eligible for grant under the plan, giving effect to the potential conversion of our Series A preferred stock. We have awarded a total of 16.8 million shares under the plan, of which 7.5 million shares were reserved for delivery under outstanding options awarded under the 1998 ICP. As of December 31, 2010, 2.5 million shares were available for future awards.
Executive officers, directors, and other officers and employees of our parent holding company or any subsidiary, as well as other persons who provide services to us, are eligible to receive awards under the 1998 ICP, which is administered by our Board of Directors or a committee established pursuant to the plan. Our Board has designated its Compensation Committee to administer the 1998 ICP.
The compensation expense that has been included in other operating costs and expenses for these plans and the related tax benefit were as follows for the years ended December 31,
| |
2010 | 2009 | 2008 | ||||||||
|---|---|---|---|---|---|---|---|---|---|---|---|
| |
(in thousands) |
||||||||||
Stock-based compensation expense by type: |
|||||||||||
Stock options(1) |
$ | 4,559 | $ | 7,127 | $ | 6,367 | |||||
Restricted stock awards |
8,031 | 4,688 | 3,151 | ||||||||
Total stock-based compensation expense |
12,590 | 11,815 | 9,518 | ||||||||
Tax benefit recognized |
3,884 | 4,135 | 3,331 | ||||||||
Stock-based compensation expense, net of tax |
$ | 8,706 | $ | 7,680 | $ | 6,187 | |||||
- (1)
- Stock-based compensation expense—stock options for the year ended December 31, 2010 reflects a $2.0 million expense reduction related to the true-up of our forfeiture rate estimate for options that had non-vested terminations. This adjustment was recorded in the second quarter of 2010.
F-57
UNIVERSAL AMERICAN CORP. AND SUBSIDIARIES
NOTES TO CONSOLIDATED FINANCIAL STATEMENTS (Continued)
21. STOCK-BASED COMPENSATION (Continued)
The tax benefit recognized in our consolidated financial statements is based on the amount of compensation expense recorded for financial statement purposes. The actual tax benefit realized in our tax return is based on the intrinsic value or the excess of the fair value over the exercise or purchase price, of stock options exercised and restricted stock awards vested during the period. The actual tax benefit realized for the deductions taken on our tax returns from option exercises and restricted stock vesting totaled $2.7 million in 2010, $1.6 million in 2009, and $3.3 million in 2008.
Stock Option Awards
We recognize compensation cost for share-based payments to employees and non-employee directors in accordance with the provisions of ASC 718-10, Compensation—Stock Compensation, based on the grant date fair value of the award, which we amortize over the grantees' service period.
We estimated the fair value for these options at the date of grant using a Black-Scholes option pricing model with the following range of assumptions:
| |
For options granted in: | |||||
|---|---|---|---|---|---|---|
| |
2010 | 2009 | 2008 | |||
Weighted-average grant date fair value |
$5.43 | $3.92 | $2.85 | |||
Risk free interest rates |
1.08%–2.26% | 1.28%–3.05% | 1.33%–3.15% | |||
Dividend yields |
0.0% | 0.0% | 0.0% | |||
Expected volatility |
48.96%–55.79% | 40.61%–55.63% | 35.60%–49.31% | |||
Expected lives of options (in years) |
3.3–3.8 | 3.5–3.8 | 3.5–5.0 | |||
We did not capitalize any cost of stock-based compensation for our employees or non-employee directors. Future expense may vary based upon factors such as the number of awards granted by us and the then-current fair value of such awards.
Activity for our stock option plans for the year ended December 31, 2010 is set forth below:
Options
|
Shares | Weighted Average Exercise Price(1) |
|||||
|---|---|---|---|---|---|---|---|
| |
(in thousands) |
|
|||||
Outstanding, January 1, 2010 |
5,351 | $ | 14.55 | ||||
Granted |
1,236 | 13.40 | |||||
Exercised |
(630 | ) | 7.68 | ||||
Forfeited or expired |
(393 | ) | 16.91 | ||||
Outstanding, December 31, 2010 |
5,564 | $ | 12.97 | ||||
Exercisable, December 31, 2010 |
3,649 | $ | 13.34 | ||||
- (1)
- The decline in the weighted average exercise price at December 31, 2010, compared with January 1, 2010 reflects a $2.00 reduction in the exercise price made in connection with the special dividend paid in August 2010 (see "Special Dividend" in Note 24—Other Operational Disclosures in the Notes to Consolidated Financial Statements).
F-58
UNIVERSAL AMERICAN CORP. AND SUBSIDIARIES
NOTES TO CONSOLIDATED FINANCIAL STATEMENTS (Continued)
21. STOCK-BASED COMPENSATION (Continued)
| |
Shares Under Options |
Weighted Average Exercise Price |
Weighted Average Remaining Contractual Term |
Aggregate Intrinsic Value Per Share(1) |
Aggregate Intrinsic Value(1) |
|||||||||||
|---|---|---|---|---|---|---|---|---|---|---|---|---|---|---|---|---|
| |
(in thousands) |
|
|
|
(in thousands) |
|||||||||||
Options exercisable at December 31, 2010 |
3,649 | $ | 13.34 | 2.3 | $ | 7.30 | $ | 26,628 | ||||||||
Options vested and expected to vest at December 31, 2010(2) |
5,564 | 12.97 | 2.7 | 7.81 | 43,477 | |||||||||||
- (1)
- Computed
based upon aggregate intrinsic value divided by shares under options.
- (2)
- The Company estimates forfeitures in accordance with ASC 718-10, Compensation—Stock Compensation.
The total intrinsic value of stock options exercised during 2010, 2009, and 2008 was $4.7 million, $3.2 million, and $7.7 million, respectively.
We received proceeds of $4.9 million, $1.8 million, and $4.2 million from the exercise of stock options during the years ended December 31, 2010, 2009, and 2008, respectively. ASC 718-10 also requires us to report the benefits of tax deductions in excess of recognized compensation cost as a financing cash flow, rather than as an operating cash flow as required under the prior statement. We recognized $0.8 million, $2.6 million, and $2.8 million of financing cash flows for these excess tax deductions for the years ended 2010, 2009, and 2008, respectively.
The compensation expense related to non-vested stock option awards not yet recognized was $8.1 million at December 31, 2010, which we expect to recognize over a weighted average period of 1.0 years.
Restricted Stock and Performance Share Awards
In accordance with our 1998 Incentive Compensation Plan, we may grant restricted stock to our officers and non-officer employees and directors. We have issued restricted stock grants which vest ratably over three and four-year periods, and some restricted stock grants have contained portions that vest immediately. We value restricted stock awards at an amount equal to the market price of our common stock on the date of grant and generally issue restricted stock out of treasury shares. We recognize compensation expense for restricted stock awards on a straight line basis over the vesting period.
During 2009, the Board of Directors approved a performance share award program for our officers. The performance shares are structured such that target shares with a three-year cliff vesting period are awarded. The actual number of shares earned at the conclusion of the vesting period can vary from 0% to 150% of the target award, based on our total shareholder return relative to a group of peer companies. Compensation expense is recognized on a straight line basis over the vesting period. Prior to vesting, previously recognized compensation expense may be reversed in the event a grantee resigns, however, once the vesting date is reached, previously recognized expense may not be changed, even if the actual award varies from the target. In connection with this program, we awarded 437,000 and 385,900 performance shares to officers during 2010 and 2009, respectively. Related compensation
F-59
UNIVERSAL AMERICAN CORP. AND SUBSIDIARIES
NOTES TO CONSOLIDATED FINANCIAL STATEMENTS (Continued)
21. STOCK-BASED COMPENSATION (Continued)
cost of $3.4 million and $1.2 million, respectively, for the years ended December 31, 2010 and 2009 has been recognized in other operating costs and expenses.
The weighted-average grant date fair value of our restricted stock awards was $13.41 and $13.32 for the years ended December 31, 2010 and 2009, respectively. Activity for our restricted stock awards was as follows for the year ended December 31, 2010:
Non-vested Restricted Stock
|
Shares | Weighted Average Grant-Date Fair Value |
|||||
|---|---|---|---|---|---|---|---|
| |
(in thousands) |
|
|||||
Non-vested at beginning of year |
609 | $ | 13.32 | ||||
Granted |
568 | 13.76 | |||||
Vested |
(215 | ) | 14.22 | ||||
Forfeited |
(65 | ) | 12.95 | ||||
Non-vested at end of year |
897 | $ | 13.41 | ||||
The fair value of shares of restricted stock vested during the years ended 2010, 2009 and 2008 was $3.3 million, $0.8 million, and 1.8 million, respectively. Total compensation expense not yet recognized related to nonvested restricted stock awards was $7.8 million at December 31, 2010. We expect to recognize this compensation expense over a weighted average period of 4.0 years.
22. UNIVERSAL AMERICAN CORP. 401(k) SAVINGS PLAN
Effective April 1, 1992, we adopted the Universal American Corp. 401(k) Savings Plan. The 401(k) plan is a voluntary contributory plan under which employees may elect to defer compensation for federal income tax purposes under Section 401(k) of the Internal Revenue Code of 1986. The employee is entitled to participate in the 401(k) plan by contributing through payroll deductions up to 100% of the employee's compensation. The participating employee is not taxed on these contributions until they are distributed. Amounts credited to employee's accounts under the 401(k) plan are invested by the employer-appointed investment committee. Currently, we match employee contributions with our common stock in amounts equal to 100% of the employee's first 1% of contributions and 50% of the employee's next 4% of contributions to a maximum matching contribution of 3% of the employee's eligible compensation. Our matching contributions vest at the rate of 25% per plan year, starting at the end of the second year. We made discretionary matching contributions under the 401(k) plan of $2.6 million in 2010 and $2.2 million in 2009 and 2008. Participants have the option to transfer / reallocate at will, outside of blackout periods, both vested and unvested employer contribution in our common stock to any of the other investments available under the 401(k) plan. The 401(k) plan held 831,194 shares of our common stock at December 31, 2010, which represented 36% of total plan assets and 798,523 shares at December 31, 2009, which represented 25% of total plan assets. Generally, a participating employee is entitled to distributions from the 401(k) plan upon termination of employment, retirement, death or disability. 401(k) plan participants who qualify for distributions may receive a single lump sum, have the assets transferred to another qualified plan or individual retirement account, or receive a series of specified installment payments.
F-60
UNIVERSAL AMERICAN CORP. AND SUBSIDIARIES
NOTES TO CONSOLIDATED FINANCIAL STATEMENTS (Continued)
23. STATUTORY FINANCIAL DATA
Our insurance subsidiaries are required to maintain minimum amounts of statutory capital and surplus as required by regulatory authorities. However, substantially more than such minimum amounts are needed to meet statutory and administrative requirements of adequate capital and surplus to support the current level of our insurance subsidiaries' operations. Each of the insurance subsidiaries' statutory capital and surplus exceeds its respective minimum statutory requirement and are at levels we believe are sufficient to support their currently anticipated levels of operation. Additionally, the National Association of Insurance Commissioners, known as NAIC, imposes regulatory risk-based capital, known as RBC, requirements on insurance enterprises. At December 31, 2010, all of our insurance subsidiaries maintained ratios of total adjusted capital to RBC in excess of the "authorized control level." The combined statutory capital and surplus, including asset valuation reserve, of the insurance subsidiaries totaled $752.0 million (unaudited) and $696.9 million at December 31, 2010 and 2009, respectively. For the years ended December 31, 2010, 2009 and 2008, the insurance subsidiaries generated statutory net income of $204.0 million (unaudited), $156.2 million and $67.8 million, respectively.
Our health plan affiliates are also required to maintain minimum amounts of capital and surplus, as required by regulatory authorities and are also subject to RBC requirements. At December 31, 2010, the statutory capital and surplus of each of our health plan affiliates exceeds its minimum requirement and its RBC is in excess of the "authorized control level." The statutory capital and surplus for our health plan affiliates was $136.5 million (unaudited) and $105.3 million at December 31, 2010 and 2009, respectively. Statutory net income for our health plan affiliates was $21.9 million (unaudited), $8.4 million and $29.1 million for the years ended December 31, 2010, 2009 and 2008, respectively.
24. OTHER OPERATIONAL DISCLOSURES
Special Dividend: On July 28, 2010, the Board of Directors of the Company approved the payment of a special cash dividend of $2.00 per share to each holder of the Company's outstanding common stock and Series A Preferred Stock. This special cash dividend was paid on August 19, 2010 to the shareholders of record as of the close of business on August 5, 2010. On the payment date, as required under the terms of the 2007 Credit Facility, we made an additional principal payment on our term loan equal to 50% of the dividend payment. The cumulative dividend payment was $156.0 million and the principal payment was $78.0 million. In addition, pursuant to the terms of our 1998 Incentive Compensation Plan, we were required to reduce the exercise price on unexercised options by the amount of the dividend, $2.00 per share. We also established a liability for the dividends related to unvested restricted stock and performance shares. These dividends will be paid out as the restricted stock and performance shares vest. This dividend payable liability was $3.3 million at December 31, 2010. As these dividends are paid, we will also make additional principal payments on our term loan at the rate of 50% of dividends paid.
Sale of CHCS: On April 26, 2010, we entered into an agreement to sell the outstanding common stock of CHCS, our administrative services company, to Patni Americas, Inc, a wholly-owned subsidiary of Patni Computer Systems Limited (NYSE: PTI), for $6.0 million in cash, subject to an adjustment for any net working capital remaining at CHCS on the closing date. The transaction closed on June 9, 2010, with an effective date of April 1, 2010. The operations of CHCS are included in consolidated results up to the effective date of the sale. The total consideration was approximately $7.5 million. Our carrying value of the assets disposed of in connection with the sale of CHCS was approximately
F-61
UNIVERSAL AMERICAN CORP. AND SUBSIDIARIES
NOTES TO CONSOLIDATED FINANCIAL STATEMENTS (Continued)
24. OTHER OPERATIONAL DISCLOSURES (Continued)
$7.1 million, including $4.4 million of goodwill. After consideration of transaction costs of approximately $0.3 million, we recognized an immaterial gain on the disposition.
Restructuring Charges: We have undertaken several initiatives to realign our organization and consolidate certain functions to increase efficiency and responsiveness to customers and reduce costs, in order to meet the challenges and opportunities presented by the current economic environment and anticipated Medicare reform. In 2009, we engaged a consultant and began a comprehensive review of our ongoing business with an emphasis on potential operating cost reductions. These efforts have taken on additional significance, in light of the reinsurance of the Life and Annuity business and the anticipated reductions in funding of Medicare Advantage Plans announced during the first quarter of 2009. As a result of this review, in the second quarter of 2009, we committed to a plan to reduce costs, including the in-sourcing of billing and enrollment for our health Plan business, workforce reduction and consolidation of facilities. This plan was substantially completed at December 31, 2009. We incurred total restructuring charges of $4.9 million during the year ended December 31, 2009. These charges are included in restructuring costs in our Consolidated Statements of Operations. A summary of our restructuring liability balance as of December 31, 2010 and 2009 and restructuring activity for the years then ended is as follows:
| |
Segment | January 1, Balance |
Charge to Earnings |
Cash Paid |
Non-cash | December 31, Balance |
||||||||||||
|---|---|---|---|---|---|---|---|---|---|---|---|---|---|---|---|---|---|---|
| |
(in thousands) |
|||||||||||||||||
2010 |
||||||||||||||||||
Contract termination costs |
Medicare Advantage | $ | — | $ | — | $ | — | $ | — | $ | — | |||||||
Workforce reduction |
Traditional | 147 | — | (147 | ) | — | — | |||||||||||
Facility consolidation |
Traditional | 697 | — | — | (149 | ) | 548 | |||||||||||
Total |
$ | 844 | $ | — | $ | (147 | ) | $ | (149 | ) | $ | 548 | ||||||
2009 |
||||||||||||||||||
Contract termination costs |
Medicare Advantage | $ | — | $ | 3,500 | $ | (3,500 | ) | $ | — | $ | — | ||||||
Workforce reduction |
Traditional | — | 608 | (461 | ) | — | 147 | |||||||||||
Facility consolidation |
Traditional | — | 796 | — | (99 | ) | 697 | |||||||||||
Total |
$ | — | $ | 4,904 | $ | (3,961 | ) | $ | (99 | ) | $ | 844 | ||||||
Agent Balances: In late 2006 we began recruiting career managers to develop offices for distribution of our new Medicare Advantage products. We have opened a significant number of new "expansion" offices since then. The Company has advanced much of the cost of the development of these new offices; however, these costs are the responsibility of the manager of the individual office, to be repaid from future profits of the office.
As a result of 2009 regulatory changes, the PFFS product is no longer available as of January 1, 2011, except in areas that have approved CMS network access requirements or in certain designated rural areas. Our PFFS membership is dispersed and our distribution was developed to have a presence in these areas. During 2009, in response to these and other changes (the reinsurance of the Life and Annuity business and the overall cost savings initiatives associated with the 2010 bids) we evaluated the
F-62
UNIVERSAL AMERICAN CORP. AND SUBSIDIARIES
NOTES TO CONSOLIDATED FINANCIAL STATEMENTS (Continued)
24. OTHER OPERATIONAL DISCLOSURES (Continued)
potential impacts to our distribution. During the second quarter of 2009, we performed a review of our career offices. This review consisted of determining whether the office was in a "core" market, the level of expenses being incurred by the office, the level of in-force commission and the anticipated production. As a result of this review, we identified a significant number of offices to be closed or restructured and in 2009 we incurred charges totaling $13.6 million related to the underperforming offices.
In 2010, CMS condensed the selling season for Medicare Advantage products for the 2011 plan year. The selling season for the 2010 plan year consisted of an annual enrollment period (from November 15, 2009 to December 31, 2009) and an open enrollment period (from January 1, 2010 to March 31, 2010). The open enrollment period was eliminated for the 2011 plan year, effectively reducing the selling period by three months. Additionally, on November 19, 2010, we received notice from CMS of the imposition of intermediate sanctions (suspension of enrollment and marketing) for all of our Medicare Advantage-prescription drug contracts, effective December 5, 2010 (For further discussion, see Government Regulations in Note 25—Commitments and Contingencies in the Notes to Consolidated Financial Statements). On account of the shortened selling season and the CMS sanction, we performed a more intensive review of our agency sales force during the fourth quarter of 2010 and incurred additional charges totaling $15.0 million related to underperforming offices.
Supplemental Cash Flow Information: Cash and cash equivalents reflect cash on deposit, money market funds, and short term investments that had an original maturity of three months or less from the time of purchase. At December 31, 2010, cash equivalents contained $31.4 million of government money market funds. Supplemental cash flow information for interest and income taxes paid is as follows:
| |
2010 | 2009 | 2008 | ||||||||
|---|---|---|---|---|---|---|---|---|---|---|---|
| |
(in thousands) |
||||||||||
Cash paid for interest |
$ | 20,067 | $ | 20,632 | $ | 22,721 | |||||
Cash paid for income taxes |
$ | 7,930 | $ | 33,322 | $ | 52,215 | |||||
Non-cash financing activities: |
|||||||||||
Return of common stock in connection with MemberHealth acquisition |
$ | — | $ | — | $ | (34,541 | ) | ||||
Unconsolidated Subsidiary: During 2005, we entered into a strategic alliance with Caremark and created Part D Management Services, L.L.C., known as PDMS. PDMS was 50% owned by Universal American and 50% owned by Caremark. We did not control PDMS and therefore PDMS is not consolidated in our financial statements. We accounted for our investment in PDMS on the equity basis and included it in other assets. PDMS was dissolved in December 2009.
Our investment in the equity in PDMS at December 31, 2009 was zero pursuant to the dissolution and final distribution. At December 31, 2008, our share in the equity of PDMS was $6.9 million. Our share in the income of PDMS is included in "equity in earnings (loss) of unconsolidated subsidiary." For the years ended December 31, 2009 and 2008, our share in the net income was $0.3 million and $72.8 million, respectively. During the years ended December 31, 2009 and 2008, PDMS made distributions to its owners, including the 2009 final distribution, aggregating $11.2 million and
F-63
UNIVERSAL AMERICAN CORP. AND SUBSIDIARIES
NOTES TO CONSOLIDATED FINANCIAL STATEMENTS (Continued)
24. OTHER OPERATIONAL DISCLOSURES (Continued)
$135.0 million, respectively. Our share of these distributions was $5.6 million and $67.5 million, respectively.
The condensed financial information for 100% of PDMS is as follows:
Years ended December 31,
|
2009 | 2008 | ||||||
|---|---|---|---|---|---|---|---|---|
| |
(in thousands) |
|||||||
Total revenue |
$ | 525 | $ | 149,348 | ||||
Total expenses |
(35 | ) | 3,722 | |||||
Net income |
$ | 560 | $ | 145,626 | ||||
25. COMMITMENTS AND CONTINGENCIES
Legal Proceedings
Plaintiff Arthur Tsutsui filed a shareholder derivative action (the "Tsutsui Action") on December 30, 2005, in the Supreme Court for New York State, Westchester County. The remaining defendants in Tsutsui v. Barasch, et al., index no. 05-22523, are officers Richard A. Barasch and Robert A. Waegelein, former officer Gary W. Bryant, as well as the three directors affiliated with Capital Z Partners who were sitting on our board of directors as of the time the complaint was filed. The Tsutsui Action alleges that the same alleged misstatements that were the subject of earlier shareholder actions, which have now all been dismissed or voluntarily withdrawn, constituted a breach of fiduciary duty by the officer defendants and the directors that caused the Company to sustain damages. The Tsutsui Action also seeks recovery of any proceeds derived by the officer and director defendants from the sale of our stock that the plaintiff claims was in breach of their fiduciary duties. The defendants filed a motion to dismiss the complaint for failure to state a claim, as well as on other grounds. The court granted this motion in a decision and order dated May 16, 2008, and the plaintiff appealed the dismissal. On appeal, the Appellate Division for the Second Department issued a decision dated November 17, 2009 affirming the dismissal with respect to one count of the complaint concerning alleged false statements, but reversing with respect to the two remaining counts concerning stock sales both by the officer defendants and by Capital Z Partners that the complaint alleges should be attributed to the three directors described above. The parties have entered into a stipulation of settlement to resolve the action which was preliminary approved by the Court on February 10, 2011. Under the terms of the Stipulation of Settlement, the Company has agreed to enhance existing corporate governance provisions concerning trades in the Company's stock by officers and directors. In addition, plaintiff's counsel will make an application for attorneys' fees in an amount not to exceed $450,000. A final hearing to approve the settlement is scheduled for April 15, 2011.
We are subject to legal proceedings, claims, and litigation arising in the ordinary course of business, including claims for medical, disability, life insurance and other benefits. In some cases, plaintiffs seek punitive damages. While the outcome of these matters is currently not determinable, we do not expect that the ultimate costs to resolve these matters will have a material adverse effect on our consolidated financial position, results of operations, or cash flows.
F-64
UNIVERSAL AMERICAN CORP. AND SUBSIDIARIES
NOTES TO CONSOLIDATED FINANCIAL STATEMENTS (Continued)
25. COMMITMENTS AND CONTINGENCIES (Continued)
Government Regulations
In July 2009 and March 2010, we received subpoenas from the Department of Health and Human Services, Office of Inspector General, known as HHS-OIG, requesting documents related to marketing, sales and enrollment practices for our Today's Health Medicare HMO Plans which are offered in the State of Wisconsin. We are cooperating with HHS-OIG in connection with their investigation.
Laws and regulations governing Medicare and other state and federal healthcare and insurance programs are complex and subject to significant interpretation. As part of the recent healthcare reform legislation, CMS has been exercising increased oversight and regulatory authority over our Medicare businesses. Compliance with such laws and regulations is subject to CMS audit, other governmental review and investigation and significant interpretation. There can be no assurance that we will be found to be in compliance with all such laws and regulations in connection with these audits, reviews and investigations. Failure to be in compliance can subject us to significant regulatory action including significant fines, penalties or operating restrictions on our business, including, without limitation, suspension of our ability to market to and enroll new members in our Medicare plans and exclusion from Medicare and other state and federal healthcare programs. In September 2010, CMS informed us that our Medicare Part D plans would not receive the one-time auto-assignment of new dual-eligible members on January 1, 2011. In addition, on November 19, 2010, CMS notified us that we were suspended from marketing to and enrolling new members in our Medicare Advantage plans, effective December 5, 2010. According to CMS, the suspension relates primarily to agent oversight and market conduct issues and will remain in effect until CMS is satisfied that we have corrected the issues and they are not likely to recur. The suspension does not affect current members in our Medicare Advantage plans, nor does it affect the marketing, enrollment or membership in our stand-alone Medicare Prescription Drug plans. We are working diligently to resolve these issues with CMS as quickly as possible.
Lease Obligations
We are obligated under lease arrangements for our executive and administrative offices in New York, Florida, Indiana, Texas, Wisconsin, Oklahoma, Ohio, Virginia, Missouri, and Washington, D.C. Rent expense was $6.0 million for the year ended December 31, 2010, $8.2 million for 2009 and $7.1 million for 2008. Annual minimum rental commitments, subject to escalation, under non-cancelable operating leases (in thousands) are as follows:
2011 |
$ | 6,118 | ||
2012 |
5,723 | |||
2013 |
4,853 | |||
2014 |
4,216 | |||
2015 |
3,737 | |||
Thereafter |
2,843 | |||
Total |
$ | 27,490 | ||
In addition to the above, Pennsylvania Life is the named lessee on 22 properties occupied by career agents for use as field offices. The career agents reimburse Pennsylvania Life the actual rent for these field offices. The total annual rent paid by the Company and reimbursed by the career agents for these field offices during 2010, 2009 and 2008 was approximately $2.3 million, $3.7 million and $4.0 million, respectively.
F-65
UNIVERSAL AMERICAN CORP. AND SUBSIDIARIES
NOTES TO CONSOLIDATED FINANCIAL STATEMENTS (Continued)
25. COMMITMENTS AND CONTINGENCIES (Continued)
Contractual Commitment
In connection with our sale of CHCS to Patni, we entered into a master services agreement covering the services Patni provides to us. The contract provides for guarantee payments if total fees are below $25 million per year or $142.5 million for services over the five year initial term of the master service agreement, which ends May 2015. Through December 31, 2010, we have utilized services in excess of the contractual minimums.
26. BUSINESS SEGMENT INFORMATION
Our business segments are based on product and consist of
- •
- Senior Managed Care—Medicare Advantage,
- •
- Medicare Part D, and
- •
- Traditional Insurance.
A description of our segments is as follows:
Senior Managed Care—Medicare Advantage—The Senior Managed Care—Medicare Advantage segment contains the operations of our initiatives in managed care for seniors.
- •
- We operate various HMOs, such as SelectCare of Texas, that offer coverage to Medicare beneficiaries under contracts with
CMS in Southeastern Texas, North Texas, Oklahoma and Wisconsin. Our career and independent agents sell the HMOs' products, as do our employee representatives on a direct basis.
- •
- In connection with the HMOs, we operate separate Management Service Organizations, known as MSOs that manage that business
and affiliated Independent Physician Associations or IPAs. We participate in the net results derived from these affiliated IPAs.
- •
- Our career and independent agents also sell our Medicare Advantage PFFS plans, which also operate under a contract with
CMS. We currently market PFFS products in approximately 1,500 counties throughout 45 states. As the result of 2009 regulatory changes, the PFFS product is no longer available as of January 1,
2011, except in areas that have approved CMS network access requirements or in certain designated rural areas.
- •
- In late 2007, we began efforts to cultivate provider relationships to establish Medicare Advantage preferred provider organizations, known as PPOs. In December 2007, we advised CMS of our intent to market PPO products. In 2009, we began offering PPO plans in 15 markets in 9 states. For 2010, we expanded our PPO plans to 114 counties in 17 states.
Medicare Part D—This segment consists of
- •
- Our Medicare Part D plans including our Community CCRxSM PDP, since the acquisition of MemberHealth on September 21, 2007 and our Prescriba RxSM PDP, the successor to the Prescription PathwaySM PDP after the termination of the strategic alliance with CVS. We also operate a pharmacy benefits manager, or PBM, servicing the PDPs as well as the members in our Medicare Advantage plans offering a Part D benefit.
F-66
UNIVERSAL AMERICAN CORP. AND SUBSIDIARIES
NOTES TO CONSOLIDATED FINANCIAL STATEMENTS (Continued)
26. BUSINESS SEGMENT INFORMATION (Continued)
- •
- Our Prescription PathwaySM PDP business, until its termination in December, 2008. In March 2005, we entered into a strategic alliance with PharmaCare Re, a subsidiary of CVS Caremark, known as CVS, to offer the Prescription PathwaySM prescription drug benefit plan. PharmaCare Re reinsured half of the risk assumed by our PDPs and the parties created Part D Management Services, L.L.C., known as PDMS, to perform marketing risk management services on behalf of the Prescription PathwaySM PDPs. PDMS was owned 50% by us and 50% by PharmaCare Re. The strategic alliance with CVS was mutually terminated effective December 31, 2008, and PDMS was dissolved in December 2009. Upon termination of the strategic alliance, CVS and Universal American each assumed responsibility for the drug benefit of specified Prescription PathwaySM plan members to achieve an approximately equal distribution of the value of business that has been generated by the strategic alliance. For 2009, we created Prescriba RxSM plans as our successor to the Prescription PathwaySM plans for the members distributed to us upon termination of the strategic alliance with CVS, as well as new members.
Traditional Insurance—This segment consists of
- •
- Medicare supplement and other senior health products,
- •
- Specialty health insurance products, primarily fixed benefit accident and sickness disability insurance sold to the middle
income self-employed market in the United States,
- •
- Senior life insurance business distributed through our career agency sales force and through our network of independent
general agencies,
- •
- Products that we no longer sell such as long-term care, major medical, universal life and fixed annuities.
Corporate—This segment reflects the activities of our parent holding company, such as debt service, senior executive compensation, and compliance with requirements resulting from our status as a public company. It also includes the operations formerly reported in the Senior Administrative Services segment.
During the second quarter of 2010 we sold CHCS (see "Sale of CHCS" in Note 24—Other Operational Disclosures in the Notes to Consolidated Financial Statements). The sale eliminated substantially all of the business operations of our Senior Administrative Services segment. As a result, beginning with our June 30, 2010 quarterly report on Form 10-Q, we began to report current and historical results of our former Senior Administrative Services and Corporate segments in one segment called Corporate & Other.
We report intersegment revenues and expenses on a gross basis in each of the operating segments but eliminate them in the consolidated results. These intersegment revenues and expenses affect the amounts reported on the individual financial statement line items, but we eliminate them in consolidation and they do not change income before taxes. The most significant items eliminated are intersegment revenue and expense relating to services performed by Corporate & Other segment for our other segments and interest on notes payable or receivable between the Corporate & Other segment and the operating segments.
F-67
UNIVERSAL AMERICAN CORP. AND SUBSIDIARIES
NOTES TO CONSOLIDATED FINANCIAL STATEMENTS (Continued)
26. BUSINESS SEGMENT INFORMATION (Continued)
Financial data by segment, with a reconciliation of segment revenues and segment income (loss) before income taxes to total revenue and net income in accordance with generally accepted accounting principles is as follows:
| |
2010 | 2009 | 2008 | |||||||||||||||||
|---|---|---|---|---|---|---|---|---|---|---|---|---|---|---|---|---|---|---|---|---|
| |
Revenues | Income (Loss) Before Income Taxes |
Revenues | Income (Loss) Before Income Taxes |
Revenues | Income (Loss) Before Income Taxes |
||||||||||||||
Senior Managed Care—Medicare Advantage |
$ | 3,182,435 | $ | 149,071 | $ | 2,642,990 | $ | 134,810 | $ | 2,420,693 | $ | 94,625 | ||||||||
Medicare Part D |
2,187,021 | 184,776 | 1,984,391 | 178,344 | 1,896,070 | 127,444 | ||||||||||||||
Traditional Insurance |
307,451 | 1,168 | 346,444 | (20,518 | ) | 455,584 | 4,845 | |||||||||||||
Corporate & Other |
11,295 | (65,697 | ) | 42,886 | (53,016 | ) | 88,314 | (15,929 | ) | |||||||||||
Intersegment revenues |
(5,972 | ) | — | (27,943 | ) | — | (68,994 | ) | — | |||||||||||
Adjustments to segment amounts: |
||||||||||||||||||||
Net realized gains (losses)(1) |
4,995 | 4,995 | (24,988 | ) | (24,988 | ) | (59,681 | ) | (59,681 | ) | ||||||||||
Equity in earnings of unconsolidated subsidiary(2) |
— | — | (280 | ) | — | (72,813 | ) | — | ||||||||||||
Total |
$ | 5,687,225 | $ | 274,313 | $ | 4,963,500 | $ | 214,632 | $ | 4,659,173 | $ | 151,304 | ||||||||
- (1)
- We
evaluate the results of operations of our segments based on income before realized gains and losses and income taxes. Management believes that realized
gains and losses are not indicative of overall operating trends.
- (2)
- We report the equity in the earnings of unconsolidated subsidiary as revenue for our Medicare Part D segment for purposes of analyzing the ratio of net pharmacy benefits incurred because the amount is incorporated in the calculation of the risk corridor adjustment. For consolidated reporting, this amount is included as a separate line following income from continuing operations.
Identifiable assets by segment are as follows:
As of December 31,
|
2010 | 2009 | |||||
|---|---|---|---|---|---|---|---|
| |
(in thousands) |
||||||
Senior Managed Care—Medicare Advantage |
$ | 990,194 | $ | 877,920 | |||
Medicare Part D |
943,168 | 1,133,976 | |||||
Traditional Insurance |
1,296,057 | 1,649,762 | |||||
Corporate & Other |
1,894,472 | 1,933,162 | |||||
Intersegment assets(1) |
(1,467,881 | ) | (1,779,964 | ) | |||
Total Assets |
$ | 3,656,010 | $ | 3,814,856 | |||
- (1)
- Intersegment assets include the elimination of the parent holding company's investment in its subsidiaries as well as the elimination of other intercompany balances.
F-68
UNIVERSAL AMERICAN CORP. AND SUBSIDIARIES
NOTES TO CONSOLIDATED FINANCIAL STATEMENTS (Continued)
27. CONDENSED QUARTERLY RESULTS OF OPERATIONS (UNAUDITED)
The quarterly results of operations are presented below. Due to the use of weighted average shares outstanding when determining the denominator for earnings per share, the sum of the quarterly per common share amounts may not equal the full year per common share amounts.
| |
Three Months Ended | ||||||||||||||
|---|---|---|---|---|---|---|---|---|---|---|---|---|---|---|---|
2010
|
March 31, | June 30, | September 30, | December 31, | |||||||||||
| |
(in thousands) |
||||||||||||||
Total revenue |
$ | 1,512,774 | $ | 1,456,594 | $ | 1,340,275 | $ | 1,377,582 | |||||||
(Loss) income before income taxes |
(1,426 | ) | 31,123 | 84,001 | 160,615 | ||||||||||
(Benefit) provision for income taxes |
(2,827 | ) | 10,114 | 23,257 | 56,090 | ||||||||||
Net income |
$ | 1,401 | $ | 21,009 | $ | 60,744 | $ | 104,525 | |||||||
Earnings per common share: |
|||||||||||||||
Basic: |
|||||||||||||||
Net income |
$ | 0.02 | $ | 0.27 | $ | 0.78 | $ | 1.34 | |||||||
Diluted: |
|||||||||||||||
Net income |
$ | 0.02 | $ | 0.27 | $ | 0.77 | $ | 1.32 | |||||||
| |
Three Months Ended | ||||||||||||||
|---|---|---|---|---|---|---|---|---|---|---|---|---|---|---|---|
2009
|
March 31, | June 30, | September 30, | December 31, | |||||||||||
| |
(in thousands) |
||||||||||||||
Total revenue |
$ | 1,361,776 | $ | 1,245,497 | $ | 1,149,705 | $ | 1,206,522 | |||||||
(Loss) income before income taxes |
(20,543 | ) | 7,970 | 87,722 | 139,483 | ||||||||||
(Benefit) provision for income taxes |
(7,395 | ) | 3,036 | 27,976 | 50,711 | ||||||||||
Net (loss) income |
$ | (13,148 | ) | $ | 4,934 | $ | 59,746 | $ | 88,772 | ||||||
(Loss) earnings per common share: |
|||||||||||||||
Basic: |
|||||||||||||||
Net (loss) income |
$ | (0.16 | ) | $ | 0.06 | $ | 0.74 | $ | 1.12 | ||||||
Diluted: |
|||||||||||||||
Net (loss) income |
$ | (0.16 | ) | $ | 0.06 | $ | 0.74 | $ | 1.12 | ||||||
The growth in our Medicare Part D business has resulted in an increase in the level of seasonality in our reported results during a given calendar year. This is due to the uneven nature of the standard benefit design under Medicare Part D. As a result, this business generally sees higher claims experience in the first two quarters of the year while beneficiaries are in the deductible and initial coverage phases of the benefit design. As the beneficiary reaches the coverage gap and catastrophic phases of the benefit design, the plan experiences lower claims liability which is generally in the last two quarters of the year, resulting in a pattern of increasing reported net income attributable to the Part D business.
During the years ended December 31, 2010 and 2009 we recognized other-than-temporary impairments in the value of our fixed income securities totaling $0.8 million, and $16.9 million, respectively.
F-69
Schedule I—Summary of Investments Other Than Investments in Related Parties
UNIVERSAL AMERICAN CORP.
December 31, 2010 and 2009
| |
December 31, 2010 | |||||||||||||
|---|---|---|---|---|---|---|---|---|---|---|---|---|---|---|
Classification
|
Par Value |
Amortized Cost |
Fair Value |
Carrying Value |
||||||||||
| |
(in thousands) |
|||||||||||||
U.S. Treasury securities and U.S. Government obligations |
$ | 73,685 | $ | 75,543 | $ | 75,192 | $ | 75,192 | ||||||
Government sponsored agencies |
81,355 | 81,097 | 82,963 | 82,963 | ||||||||||
Other political subdivisions |
138,200 | 154,348 | 151,184 | 151,184 | ||||||||||
Corporate debt securities |
565,080 | 585,629 | 595,260 | 595,260 | ||||||||||
Foreign debt securities |
101,123 | 104,554 | 104,634 | 104,634 | ||||||||||
Mortgage-backed and asset-backed securities |
379,875 | 387,433 | 389,265 | 389,265 | ||||||||||
Sub-total |
$ | 1,339,318 | $ | 1,388,604 | $ | 1,398,498 | 1,398,498 | |||||||
Other invested assets |
1,409 | |||||||||||||
Total investments |
$ | 1,399,907 | ||||||||||||
| |
December 31, 2009 | |||||||||||||
|---|---|---|---|---|---|---|---|---|---|---|---|---|---|---|
Classification
|
Par Value |
Amortized Cost |
Fair Value |
Carrying Value |
||||||||||
| |
(in thousands) |
|||||||||||||
U.S. Treasury securities and U.S. Government obligations |
$ | 35,195 | $ | 35,572 | $ | 36,122 | $ | 36,122 | ||||||
Government sponsored agencies |
137,405 | 137,839 | 140,831 | 140,831 | ||||||||||
Other political subdivisions |
10,060 | 10,020 | 10,014 | 10,014 | ||||||||||
Corporate debt securities |
309,538 | 312,225 | 327,845 | 327,845 | ||||||||||
Foreign debt securities |
19,423 | 19,465 | 20,724 | 20,724 | ||||||||||
Mortgage-backed and asset-backed securities |
532,822 | 446,144 | 429,017 | 429,017 | ||||||||||
Sub-total |
$ | 1,044,443 | $ | 961,265 | $ | 964,553 | 964,553 | |||||||
Other invested assets |
1,276 | |||||||||||||
Total investments |
$ | 965,829 | ||||||||||||
F-70
Schedule II—Condensed Financial Information of Registrant
UNIVERSAL AMERICAN CORP.
(Parent Company)
CONDENSED BALANCE SHEETS
December 31, 2010 and 2009
| |
2010 | 2009 | |||||
|---|---|---|---|---|---|---|---|
| |
(in thousands) |
||||||
ASSETS |
|||||||
Cash and cash equivalents |
$ | 48,837 | $ | 112,571 | |||
Investments—Fixed maturities, available for sale, at fair value (amortized cost: 2010, $21,236; 2009, $—) |
21,144 | — | |||||
Investments in subsidiaries |
1,660,627 | 1,656,193 | |||||
Advances to agents |
11,400 | 8,504 | |||||
Surplus note receivable from affiliate |
60,000 | 60,000 | |||||
Due from affiliates |
71,043 | 36,950 | |||||
Deferred loan origination fees |
5,015 | 6,045 | |||||
Deferred income tax asset |
22,308 | 19,891 | |||||
Other assets |
15,249 | 9,761 | |||||
Total assets |
$ | 1,915,623 | $ | 1,909,915 | |||
LIABILITIES AND STOCKHOLDERS' EQUITY |
|||||||
Loan payable |
$ | 232,872 | $ | 313,758 | |||
Other long-term debt |
110,000 | 110,000 | |||||
Fair value of interest rate swaps |
13,693 | 15,465 | |||||
Income tax payable |
48,649 | 17,740 | |||||
Amounts payable and other liabilities |
7,715 | 3,488 | |||||
Total liabilities |
412,929 | 460,451 | |||||
Total stockholders' equity |
1,502,694 | 1,449,464 | |||||
Total liabilities and stockholders' equity |
$ | 1,915,623 | $ | 1,909,915 | |||
See notes to condensed financial statements.
F-71
UNIVERSAL AMERICAN CORP.
(Parent Company)
CONDENSED STATEMENTS OF OPERATIONS
For the Three Years Ended December 31, 2010
| |
2010 | 2009 | 2008 | ||||||||
|---|---|---|---|---|---|---|---|---|---|---|---|
| |
(in thousands) |
||||||||||
REVENUES: |
|||||||||||
Surplus note investment income—affiliated |
$ | — | $ | 65 | $ | 570 | |||||
Net investment income—unaffiliated |
160 | 485 | 3,491 | ||||||||
Realized loss on investments |
(1,517 | ) | — | (449 | ) | ||||||
Total revenues |
(1,357 | ) | 550 | 3,612 | |||||||
EXPENSES: |
|||||||||||
Selling, general and administrative expenses |
11,075 | 5,349 | (1,104 | ) | |||||||
Stock compensation expense |
12,368 | 11,815 | 9,518 | ||||||||
Interest expense—loan payable |
13,356 | 13,069 | 15,467 | ||||||||
Interest expense—other long-term debt |
6,512 | 6,868 | 8,227 | ||||||||
Total expenses |
43,311 | 37,101 | 32,108 | ||||||||
Loss before income tax benefit and equity in net income of subsidiaries |
(44,668 | ) | (36,551 | ) | (28,496 | ) | |||||
Income tax benefit |
15,209 | 13,820 | 11,946 | ||||||||
Loss before equity in net income of subsidiaries |
(29,459 | ) | (22,731 | ) | (16,550 | ) | |||||
Equity in net income of subsidiaries, net of taxes |
217,138 | 163,035 | 111,642 | ||||||||
Net income |
$ | 187,679 | $ | 140,304 | $ | 95,092 | |||||
See notes to condensed financial statements.
F-72
UNIVERSAL AMERICAN CORP.
(Parent Company)
CONDENSED STATEMENTS OF CASH FLOWS
For the Three Years Ended December 31, 2010
| |
2010 | 2009 | 2008 | ||||||||
|---|---|---|---|---|---|---|---|---|---|---|---|
| |
(in thousands) |
||||||||||
Cash flows from operating activities: |
|||||||||||
Net income |
$ | 187,679 | $ | 140,304 | $ | 95,092 | |||||
Adjustments to reconcile net income to net cash provided by (used in) operating activities: |
|||||||||||
Equity in net income of subsidiaries |
(217,138 | ) | (163,035 | ) | (111,642 | ) | |||||
Realized loss on investments |
1,517 | — | 449 | ||||||||
Stock based compensation |
4,337 | 7,127 | 6,369 | ||||||||
Change in amounts due to/from subsidiaries |
(322 | ) | 165 | (2,034 | ) | ||||||
Amortization of deferred loan origination fees |
1,030 | 158 | 1,048 | ||||||||
Change in income taxes receivable |
50,659 | 17,769 | 6,756 | ||||||||
Deferred income taxes |
(3,004 | ) | (5,881 | ) | (1,571 | ) | |||||
Change in other assets and liabilities |
(2,031 | ) | (6,191 | ) | 13,642 | ||||||
Cash provided by (used in) operating activities |
22,727 | (9,584 | ) | 8,109 | |||||||
Cash flows from investing activities: |
|||||||||||
Purchase of fixed maturities |
(21,236 | ) | — | — | |||||||
Redemption of surplus note due from affiliate |
— | 5,549 | 12,000 | ||||||||
Dividends from subsidiaries |
166,155 | — | — | ||||||||
Purchase of business and return of purchase price |
— | — | 40,990 | ||||||||
Proceeds from sale of CHCS |
7,465 | — | — | ||||||||
Purchase of agent advances from subsidiaries, net of collections |
(2,896 | ) | 11,026 | 12,464 | |||||||
Cash provided by investing activities |
149,488 | 16,575 | 65,454 | ||||||||
Cash flows from financing activities: |
|||||||||||
Net proceeds from issuance of common stock |
6,969 | 4,411 | 7,661 | ||||||||
Purchase of treasury stock |
(5,937 | ) | (63,693 | ) | (74,821 | ) | |||||
Principal repayment on debt |
(80,885 | ) | (6,867 | ) | (28,500 | ) | |||||
Dividends received from subsidiaries |
(156,095 | ) | 7,871 | 15,660 | |||||||
Other financing activities |
— | (1,171 | ) | — | |||||||
Cash used in financing activities |
(235,948 | ) | (59,449 | ) | (80,000 | ) | |||||
Net decrease in cash and cash equivalents |
(63,733 | ) | (52,458 | ) | (6,437 | ) | |||||
Cash and cash equivalents: |
|||||||||||
At beginning of year |
112,571 | 165,029 | 171,466 | ||||||||
At end of year |
$ | 48,838 | $ | 112,571 | $ | 165,029 | |||||
Supplemental disclosure of cash flow information: |
|||||||||||
Cash paid during the year for: |
|||||||||||
Interest |
$ | 20,067 | $ | 20,632 | $ | 22,721 | |||||
Income taxes |
$ | 38,000 | $ | 53,301 | $ | 36,950 | |||||
See notes to condensed financial statements.
F-73
UNIVERSAL AMERICAN CORP.
(Parent Company)
NOTES TO CONDENSED FINANCIAL STATEMENTS
1. BASIS OF PRESENTATION
Universal American Corp., which we refer to as "we," the "Company," or "Universal American," is a specialty health and life insurance holding company with an emphasis on providing a broad array of health insurance and managed care products and services to the growing senior population.
In the parent-company-only financial statements, the parent company's investment in subsidiaries is stated at cost plus equity in undistributed earnings of subsidiaries since the date of acquisition less dividends paid to the parent company by the subsidiaries. The parent company's share of net income of its wholly owned unconsolidated subsidiaries is included in its net income using the equity method. These parent-company-only financial statements should be read in conjunction with the Company's consolidated financial statements.
2. ADVANCES TO AGENTS
Universal American's insurance subsidiaries advance commissions to their respective agents for business submitted by the agents. Universal American has agreements with certain of its insurance subsidiaries whereby it purchases certain of the related receivables. The advances are recovered as the commissions are earned through the balance of the policy period.
3. DERIVATIVE INSTRUMENTS—INTEREST RATE SWAPS
On December 4, 2007, we entered into two separate interest rate swap agreements, one with Citibank, N.A. and one with Calyon Corporate and Investment Bank, on a total notional amount of $250 million, where we pay an average locked-in fixed rate of 4.14% and receive a floating rate based on LIBOR to hedge the variability of cash flows to be paid under our credit facility. At inception, we determined that the critical terms of the hedging instrument and the hedged forecasted transaction were the same and we designated these swaps as cash flow hedges, with changes in the fair value reflected in other comprehensive income and the unrealized loss on these hedges in accumulated other comprehensive income. We perform periodic assessments of hedge effectiveness by verifying and documenting whether the critical terms of the hedging instrument and the forecasted transaction have changed during the period, rather than by quantifying the relevant changes in cash flows.
Due primarily to the $78 million debt prepayment made in the third quarter of 2010 (see Note 13—Loan Payable in the Notes to Consolidated Financial Statements), the outstanding principal balance on the hedged Credit Facility was reduced to $232.9 million at December 31, 2010, $17.1 million lower than the $250 million notional amounts on the swaps. As a result, this portion of the swaps was deemed ineffective and the notional amount on one of the swaps was decreased by $17.1 million to $107.9 million, which resulted in a realized loss of $1.3 million. In addition, we evaluated the likelihood of additional debt paydowns prior to the scheduled maturity of the Credit Facility and the related interest rate swaps in September 2012, and identified an additional $4.5 million of the swaps that would be considered ineffective as hedges. As a result, we realized an additional loss of $0.3 million on this ineffective portion of the swap, resulting in total realized losses on the cash flow hedge of $1.6 million in 2010.
The unrealized loss on the effective portion of the swap totaling $13.7 million is reflected in accumulated other comprehensive income. The combined fair value of these swaps was a $14.0 million other liability at December 31, 2010 and a $15.5 million other liability at December 31, 2009.
F-74
UNIVERSAL AMERICAN CORP.
(Parent Company)
NOTES TO CONDENSED FINANCIAL STATEMENTS (Continued)
3. DERIVATIVE INSTRUMENTS—INTEREST RATE SWAPS (Continued)
In connection with the swap transaction executed with Citibank, N.A., we are required to post collateral when we are in a net liability position. The collateral amount required is based on the fair value of the swap including net accrued interest less a $1 million threshold amount as determined by our credit rating of BB+. Should we be downgraded or cease to be rated by S&P or Moody's, the threshold amount would be reduced to zero and we would need to post $1 million in additional collateral. This collateral is reflected in cash and cash equivalents and was $6.1 million as of December 31, 2010 and $8.1 million as of December 31, 2009.
4. SURPLUS NOTES RECEIVABLE FROM AFFILIATES
American Exchange made $5.6 million in principal payments on its surplus note during June 2009 resulting in the note being paid in full. Prior to repayment, this note bore interest at LIBOR plus 250 basis points.
In 2007, Pyramid issued $60.0 million of surplus notes payable to our holding company, which bears interest at an average fixed rate of 7.5%. The notes are repayable beginning March 29, 2009 provided that capital and surplus are sufficient to maintain risk-based capital levels of 450% or greater in the immediate prior year end. However, at December 31, 2009, Pyramid's risk-based capital ratio was below 450%, thus no payments of principal or interest were made during the year ended December 31, 2010 As of December 31, 2010, Pyramid's risk-based capital ratio was below 450%, thus principal repayments are not likely to be made in 2011.
5. SPECIAL DIVIDEND
On July 28, 2010, the Board of Directors of the Company approved the payment of a special cash dividend of $2.00 per share to each holder of the Company's outstanding common stock and Series A Preferred Stock. This special cash dividend was paid on August 19, 2010 to the shareholders of record as of the close of business on August 5, 2010. On the payment date, as required under the terms of the 2007 Credit Facility, we made an additional principal payment on our term loan equal to 50% of the dividend payment. The cumulative dividend payment was $156.0 million and the principal payment was $78.0 million. In addition, pursuant to the terms of our 1998 Incentive Compensation Plan, we were required to reduce the exercise price on unexercised options by the amount of the dividend, $2.00 per share. We also established a liability for the dividends related to unvested restricted stock and performance shares. These dividends will be paid out as the restricted stock and performance shares vest. This dividend payable liability was $3.3 million at December 31, 2010. As these dividends are paid, we will also make additional principal payments on our term loan at the rate of 50% of dividends paid.
6. SALE OF CHCS
On April 26, 2010, we entered into an agreement to sell the outstanding common stock of CHCS, our administrative services company, to Patni Americas, Inc, a wholly-owned subsidiary of Patni Computer Systems Limited (NYSE: PTI), for $6.0 million in cash, subject to an adjustment for any net working capital remaining at CHCS on the closing date. The transaction closed on June 9, 2010, with an effective date of April 1, 2010. The operations of CHCS are included in consolidated results up to the effective date of the sale. The total consideration was approximately $7.5 million. Our carrying value of the assets disposed of in connection with the sale of CHCS was approximately $7.1 million,
F-75
UNIVERSAL AMERICAN CORP.
(Parent Company)
NOTES TO CONDENSED FINANCIAL STATEMENTS (Continued)
6. SALE OF CHCS (Continued)
including $4.4 million of goodwill. We recognized an immaterial gain on the disposition after consideration of transaction costs of approximately $0.1 million.
In connection with our sale of CHCS to Patni, we entered into a master services agreement covering the services Patni provides to us. The contract provides for guarantee payments if total fees are below $25 million per year or $142.5 million for services over the five year initial term of the master service agreement, which ends May 2015. Through December 31, 2010, we have utilized services in excess of the contractual minimums.
7. SALE OF MEDICARE PART D BUSINESS TO CVS CAREMARK
On December 30, 2010, we entered into (i) an Agreement and Plan of Merger (the "CVS Agreement") with CVS Caremark Corporation ("CVS Caremark") and Ulysses Merger Sub, L.L.C., an indirect wholly-owned subsidiary of CVS Caremark, to provide for the purchase of our Medicare Part D Business by CVS Caremark and (ii) a Separation Agreement with Universal American Spin Corp., a newly-formed wholly-owned subsidiary of the Company ("Newco"), to provide for the separation of our Medicare Part D Business from our remaining businesses, which include our Medicare Advantage and Traditional Insurance businesses (collectively, the "Newco Businesses.") We refer to the sale of our Medicare Part D Business to CVS Caremark and related transactions as the "Part D Sale Transaction" or the "Transactions."
Pursuant to the CVS Agreement, CVS Caremark will pay Universal American shareholders $1.25 billion plus the excess capital in the entities that operate our Medicare Part D Business as of December 31, 2010, less the amount of our outstanding debt and trust preferred securities and certain other amounts. At the effective time of the merger, we expect that each share of common stock and preferred stock of the Company will be cancelled and converted into the right to receive one share of common stock of Newco which will own the Newco Businesses and approximately $13.00 to $13.20 per share in cash. The transaction is expected to close by the end of the second quarter of 2011 and is subject to customary closing conditions, including approval of our shareholders and necessary regulatory approvals. On February 28, 2011 the Federal Trade Commission granted early termination of the waiting period under the Hart-Scott-Rodino Antitrust Improvements Act of 1976 with respect to the Part D Sale Transaction. We expect to file a Registration Statement on Form S-4/Proxy Statement Prospectus with the SEC by the middle of March that will contain additional information regarding the Part D Sale Transaction.
F-76
Schedule III—SUPPLEMENTAL INSURANCE INFORMATION
UNIVERSAL AMERICAN CORP.
(in thousands)
| |
Deferred Acquisition Costs |
Reserves for Future Policy Benefits |
Unearned Premiums |
Policy and Contract Claims |
Net Premium Earned |
Net Investment Income |
Policyholder Benefits |
Net Change in DAC |
Other Operating Expense |
|||||||||||||||||||
|---|---|---|---|---|---|---|---|---|---|---|---|---|---|---|---|---|---|---|---|---|---|---|---|---|---|---|---|---|
2010 |
||||||||||||||||||||||||||||
Senior Managed Care—Medicare Advantage |
$ | — | $ | — | $ | — | $ | 268,653 | $ | 3,155,805 | $ | 24,517 | $ | 2,638,586 | $ | — | $ | 394,778 | ||||||||||
Medicare Part D |
— | — | — | 68,149 | 2,183,951 | 2,971 | 1,798,217 | — | 204,028 | |||||||||||||||||||
Traditional Insurance |
144,750 | 977,698 | — | 49,599 | 289,833 | 14,891 | 222,075 | 5,648 | 78,560 | |||||||||||||||||||
Corporate & Other |
— | — | — | — | 351 | — | — | 76,991 | ||||||||||||||||||||
Intersegment and other adjustments |
— | — | — | — | 111 | 127 | (21 | ) | — | (5,950 | ) | |||||||||||||||||
Segment Total |
$ | 144,750 | $ | 977,698 | $ | — | $ | 386,401 | $ | 5,629,700 | $ | 42,857 | $ | 4,658,857 | $ | 5,648 | $ | 748,407 | ||||||||||
2009 |
||||||||||||||||||||||||||||
Senior Managed Care—Medicare Advantage |
$ | — | $ | — | $ | — | $ | 238,920 | $ | 2,616,596 | $ | 23,111 | $ | 2,156,603 | $ | — | $ | 351,577 | ||||||||||
Medicare Part D |
— | — | — | 91,027 | 1,980,907 | 2,844 | 1,587,075 | — | 218,972 | |||||||||||||||||||
Traditional Insurance |
150,398 | 992,736 | — | 65,903 | 321,423 | 23,062 | 254,991 | 7,786 | 104,185 | |||||||||||||||||||
Corporate & Other |
— | — | — | — | — | 665 | — | — | 97,076 | |||||||||||||||||||
Intersegment and other adjustments |
— | — | — | — | (28 | ) | 132 | (35 | ) | — | (29,082 | ) | ||||||||||||||||
Segment Total |
$ | 150,398 | $ | 992,736 | $ | — | $ | 395,850 | $ | 4,918,898 | $ | 49,814 | $ | 3,998,634 | $ | 7,786 | $ | 742,728 | ||||||||||
2008 |
||||||||||||||||||||||||||||
Senior Managed Care—Medicare Advantage |
$ | — | $ | — | $ | — | $ | 257,308 | $ | 2,404,067 | $ | 16,626 | $ | 2,001,163 | $ | — | $ | 324,905 | ||||||||||
Medicare Part D |
— | — | — | 180,309 | 1,802,127 | 1,052 | 1,533,090 | — | 235,536 | |||||||||||||||||||
Traditional Insurance |
237,630 | 1,021,712 | — | 73,093 | 394,275 | 60,189 | 317,344 | 14,273 | 119,122 | |||||||||||||||||||
Corporate & Other |
— | — | — | — | — | 3,345 | — | — | 104,140 | |||||||||||||||||||
Intersegment and other adjustments |
— | — | — | — | (15 | ) | 58 | (15 | ) | — | (68,876 | ) | ||||||||||||||||
Segment Total |
$ | 237,630 | $ | 1,021,712 | $ | — | $ | 510,710 | $ | 4,600,454 | $ | 81,270 | $ | 3,851,582 | $ | 14,273 | $ | 714,827 | ||||||||||
F-77
Schedule V
Valuation and Qualifying Accounts
(in Thousands)
|
Balance Jan 1 |
Charged to Statement of Operations |
Write-offs against allowance |
Acquisition and Other Adjs. |
Balance Dec 31 |
|||||||||||
|---|---|---|---|---|---|---|---|---|---|---|---|---|---|---|---|---|
2010 |
||||||||||||||||
Advances to agents |
$ | 24,446 | $ | 17,366 | $ | — | $ | 6,107 | $ | 47,919 | ||||||
Other assets(2) |
37,271 | 26,155 | (12,500 | ) | 1,255 | 52,181 | ||||||||||
Valuation allowance for deferred taxes |
5,778 | 2,040 | — | — | 7,818 | |||||||||||
2009 |
||||||||||||||||
Due and unpaid premiums |
$ | 3,282 | $ | — | $ | (3,282 | ) | $ | — | $ | — | |||||
Other Part D receivables |
16,079 | — | (16,079 | ) | — | — | ||||||||||
Advances to agents |
10,412 | 14,034 | — | — | 24,446 | |||||||||||
Other assets(2) |
20,814 | 18,549 | (3,534 | ) | 1,442 | 37,271 | ||||||||||
Valuation allowance for deferred taxes |
4,433 | 1,345 | — | — | 5,778 | |||||||||||
2008 |
||||||||||||||||
Due and unpaid premiums(1) |
$ | 7,298 | $ | 2,432 | $ | (8,881 | ) | $ | 2,433 | $ | 3,282 | |||||
Other Part D receivables(1) |
13,836 | 7,959 | (6,378 | ) | 662 | 16,079 | ||||||||||
Advances to agents |
4,682 | 5,730 | — | — | 10,412 | |||||||||||
Other assets(2) |
18,100 | 2,817 | (552 | ) | 449 | 20,814 | ||||||||||
Valuation allowance for deferred taxes |
3,144 | 1,289 | — | — | 4,433 | |||||||||||
- (1)
- Amount
in Acquisition and Other Adjs. column includes 50% share of 2008 increment recovered from joint venture partner.
- (2)
- Represents valuation account on receivables related to Medicare Advantage products.
F-78