Attached files
| file | filename |
|---|---|
| EX-21.01 - EX-21.01 - NEW FRONTIER MEDIA INC | a2197879zex-21_01.htm |
| EX-23.01 - EX-23.01 - NEW FRONTIER MEDIA INC | a2197879zex-23_01.htm |
| EX-32.01 - EX-32.01 - NEW FRONTIER MEDIA INC | a2197879zex-32_01.htm |
| EX-31.02 - EX-31.02 - NEW FRONTIER MEDIA INC | a2197879zex-31_02.htm |
| EX-32.02 - EX-32.02 - NEW FRONTIER MEDIA INC | a2197879zex-32_02.htm |
| EX-31.01 - EX-31.01 - NEW FRONTIER MEDIA INC | a2197879zex-31_01.htm |
| EX-10.46 - EX-10.46 - NEW FRONTIER MEDIA INC | a2197879zex-10_46.htm |
Use these links to rapidly review the document
TABLE OF CONTENTS
NEW FRONTIER MEDIA, INC. AND SUBSIDIARIES TABLE OF CONTENTS
UNITED STATES
SECURITIES AND EXCHANGE COMMISSION
WASHINGTON, D.C. 20549
FORM 10-K
Annual Report Pursuant to Section 13 or 15(d)
of the Securities Exchange Act of 1934
For the Fiscal Year Ended March 31, 2010
Commission File Number: 000-23697
NEW FRONTIER MEDIA, INC.
(Exact name of registrant as specified in its charter)
| Colorado (State of Incorporation) |
84-1084061 (I.R.S. Employer I.D. Number) |
7007 Winchester Circle, Suite 200, Boulder, CO 80301
(Address of principal executive offices and Zip Code)
(303) 444-0900
(Registrant's telephone number, including area code)
Securities registered pursuant to Section 12(b) of the Exchange Act:
| Title of Each Class | Name of Each Exchange on Which Registered | |
|---|---|---|
| Common Stock par value $.0001 | The Nasdaq Stock Market, LLC | |
| Rights to Purchase Series A Junior Participating Preferred Stock |
Securities registered pursuant to Section 12(g) of the Exchange Act: None.
Indicate by check mark if the registrant is a well-known seasoned issuer, as defined in Rule 405 of the Securities Act. o YES ý NO
Indicate by check mark if the registrant is not required to file reports pursuant to Section 13 or Section 15(d) of the Exchange Act. o YES ý NO
Indicate by check mark whether the Registrant (1) has filed all reports required to be filed by Section 13 or 15(d) of the Securities Exchange Act of 1934 during the preceding 12 months (or for such shorter period that the Registrant was required to file such reports), and (2) has been subject to such filing requirements for the past 90 days. ý YES o NO
Indicate by check mark whether the registrant has submitted electronically and posted on its corporate Web site, if any, every Interactive Data File required to be submitted and posted pursuant to Rule 405 of Regulation S-T (§ 229.405 of this chapter) during the preceding 12 months (or for such shorter period that the registrant was required to submit and post such files). o YES o NO
Indicate by check mark if disclosure of delinquent filers pursuant to Item 405 of Regulation S-K is not contained herein, and will not be contained, to the best of Registrant's knowledge, in definitive proxy or information statements incorporated by reference in Part III of this Form 10-K or any amendment to this Form 10-K. ý
Indicate by check mark whether the registrant is a large accelerated filer, an accelerated filer, a non-accelerated filer, or a smaller reporting company. See definitions of "large accelerated filer," "accelerated filer" and "smaller reporting company" in Rule 12b-2 of the Exchange Act.
| Large accelerated filer o | Accelerated filer o | Non-Accelerated filer ý (Do not check if a smaller reporting company) |
Smaller reporting company o |
Indicate by check mark whether the registrant is a shell company (as defined in Rule 12b-2 of the Exchange Act). Yes o No ý
The aggregate market value of the Registrant's common stock held by non-affiliates of the Registrant as of September 30, 2009 was approximately $40,676,000, based on the closing price of the common stock as reported on the NASDAQ Global Select Market on such date.
The Registrant had 19,432,317 shares of its common stock outstanding on June 4, 2010.
Documents Incorporated by Reference
The information required in response to Part III of Form 10-K is hereby incorporated by reference from the Registrant's Definitive Proxy Statement to be filed with the Securities and Exchange Commission within 120 days of March 31, 2010 with respect to the Registrant's Annual Meeting of Shareholders expected to be held on or about August 23, 2010.
NEW FRONTIER MEDIA INC. AND SUBSIDIARIES
FORM 10-K
FOR THE FISCAL YEAR ENDED MARCH 31, 2010
i
Forward-Looking Statements and Other Information
This Annual Report on Form 10-K of New Frontier Media, Inc. and its consolidated subsidiaries, or the Company or the Registrant, and the information incorporated by reference includes forward-looking statements within the meaning of the safe harbor provisions of Section 27A of the Securities Act of 1933, as amended, and Section 21E of the Securities Exchange Act of 1934, as amended. All statements regarding trend analysis and the Company's expected financial position and operating results, its business strategy, its financing plans and the outcome of contingencies are forward-looking statements. Forward-looking statements are also identified by the words "believe," "project," "expect," "anticipate," "estimate," "intend," "strategy," "plan," "may," "should," "could," "will," "would," and similar expressions. The forward-looking statements are subject to risks and uncertainties that could cause actual results to differ materially from those set forth or implied by any forward looking statements. Some of these risks are detailed in Part I, Item 1A, Risk Factors and elsewhere in this Form 10-K.
Readers are cautioned not to place undue reliance on these forward-looking statements, which speak only as of the date on which they are made. The Company undertakes no obligation to update or revise publicly any forward-looking statements, whether as a result of new information, future events or otherwise.
Registered trademarks identified herein that are not expressly stated to be the property of the Company are the property of the respective owners of such marks.
GENERAL
We are a leader in transactional television and the distribution of general motion picture entertainment. Our key customers include large cable and satellite operators, premium movie channel providers and major Hollywood studios. We distribute content world-wide. Our three principal businesses are reflected in the Transactional TV, Film Production and Direct-to-Consumer operating segments. Our Transactional TV segment distributes adult content to cable and satellite operators who then distribute the content to retail customers via pay-per-view ("PPV") and video-on-demand ("VOD") technology. We earn revenue through contractual percentage splits of the retail price. The Transactional TV segment has historically been our most profitable segment. The Film Production segment generates revenue through the distribution of mainstream content to large cable and satellite operators, premium movie channel providers and other international content distributors. This segment also periodically provides contract film production services to major Hollywood studios ("producer-for-hire" arrangements). The Film Production segment incurred operating losses in fiscal years 2010 and 2009 primarily due to large non-cash impairment charges. Our Direct-to-Consumer segment primarily generates revenue from membership fees earned through the distribution of adult content to consumer websites. The Direct-to-Consumer segment has historically incurred operating losses and is expected to continue to incur operating losses for the foreseeable future; however, we have been focused on returning the segment to profitability through efforts described below. Our Corporate Administration segment includes all costs associated with the operation of the public holding company, New Frontier Media, Inc.
The Film Production segment continues to experience challenging market conditions, and these market conditions are expected to continue for the foreseeable future. As a result and in connection with our annual goodwill impairment testing, we recorded a goodwill impairment charge within the segment in the fourth quarter of fiscal year 2010 of approximately $4.9 million. See additional information on the goodwill impairment charge within the Film Production segment discussions below.
1
Also in the fourth quarter of fiscal year 2010, we discontinued the operations of an Internet Protocol Television ("IPTV") set-top box business within the Direct-to-Consumer segment. See Note 19—Discontinued Operations within the Notes to Consolidated Financial Statements for further discussion on our discontinuation of the IPTV set-top box business.
The business models of each of our segments are discussed in further detail below.
OPERATING SEGMENTS
Transactional TV Segment
The Transactional TV segment generated the majority of its revenue in fiscal year 2010 through the distribution of adult entertainment content on domestic VOD platforms. VOD distribution primarily occurs through cable multiple system operators, or MSOs, and telephone company operators that also provide television services. VOD presents viewers with layered menus, similar to what is traditionally found in hotel room television offerings. These menus allow users to interactively select a movie or event and then view it immediately or at a later time once the transaction has been executed. VOD tends to have a more accretive impact on our Transactional TV segment's business relative to our PPV offering because of the variety of content available through VOD platforms and because of the flexibility VOD provides in viewing times.
Our Transactional TV segment also distributes adult entertainment programming to cable and satellite television companies through nine 24/7 PPV channels. PPV offers consumers access to a timed block of programming—for example, a movie or an event—for a set fee payable to the cable or satellite providers. Our PPV programming is offered on channels that are available to viewers through the same electronic program guides that display basic cable channels. A PPV transaction allows access to the purchased content for a given period of time and is executed either by telephone, internet or instantly through the use of the viewers' remote control. Some of our distributors also offer our Transactional TV segment's channels on a monthly subscription basis. However, the large majority of the PPV revenue we generate is based on individual title purchases, and subscription revenue represents a small portion of the segment's total PPV revenue.
We earn a percentage of the revenue, or "split", from our content for each VOD or PPV transaction that is purchased on our customers' platform. Our Transactional TV segment's products typically retail for a price between $10.99 and $14.99 for a single movie or event as determined by our customers with input from us.
We believe our VOD and PPV programming provides an attractive form of entertainment because it is offered conveniently in the comfort of users' homes and can be viewed on a large, high quality television. During our fiscal years ended March 31, 2010, 2009 and 2008, 74%, 81%, and 73%, respectively, of our consolidated net revenue was attributed to our Transactional TV segment. Our Transactional TV segment distributes content to nearly every television provider in the United States including:
- •
- the two largest providers of direct broadcast satellite, or DBS, services in the U.S.; and
- •
- the top ten largest operators of cable television systems in the U.S.
For most of its history, the Transactional TV segment has been focused on growing its distribution in the U.S. During fiscal year 2009, we began expanding our services into international markets in North America, Europe and Latin America. We believe that our business model, which we believe has been successful in the U.S., can also be successful in international markets. International expansion also provides us with an opportunity to leverage our existing content libraries and technology infrastructure. Thus far, we have had success in expanding our distribution to international markets and generated approximately $3.6 million of Transactional TV segment VOD and PPV international revenue during
2
fiscal year 2010. We plan to continue to expand our footprint to new international locations and customers, and gain additional market share and shelf space in international markets where we currently distribute content. The VOD infrastructure in many international markets is relatively undeveloped, and we expect that the development of the VOD infrastructure will continue to offer opportunities to improve our international revenue. Additionally, the revenue splits we receive internationally are typically higher than the splits we receive domestically because the international cable MSO and DBS industry has more market participants and is more fragmented, which provides us with better negotiating leverage. We have not historically operated internationally or dealt with international regulators, competitors or cultures and as a result, we may experience difficulties in increasing revenue from such operations while gaining experience with our international growth initiatives.
Programming Strategy
The Transactional TV segment's programming is designed to provide a wide variety of content to consumers while at the same time utilizing available titles from our content library. Because we do not duplicate titles across our channels or between PPV and VOD, we are able to give our consumers access to more unique titles, a wider variety of talent, and a greater variety of studio representation. We focus on prime time viewing blocks and program specific types of content in those blocks to create an appointment-viewing calendar designed to drive viewers to traditionally less popular nights of the week for viewing adult content.
Our programming department spends a significant amount of time and resources researching consumer choices and preferences. We periodically perform primary consumer research to understand buying habits and to obtain information on how we can best provide our consumers with an exceptional viewing experience. This research has enhanced our Transactional TV segment's performance and has assisted us in providing customer satisfaction. Additionally, we use this research to recommend changes to our customers' platforms in order to improve the overall performance of the adult content category.
Content Delivery System
Our Transactional TV segment delivers its PPV video programming to cable and satellite operators via satellite from our Digital Broadcast Center, or DBC, in Boulder, Colorado. The program signal is encrypted so that the signal is unintelligible unless it is passed through the properly authorized decoding devices. The signal is transmitted (uplinked) by a third party earth station to a designated transponder on a third party commercial communications satellite. The transponder receives the program signal that has been uplinked by the earth station, amplifies the program signal and then broadcasts (downlinks) the signal to commercial satellite dishes located within the satellite's area of signal coverage. The programming is downlinked by MSOs and DBS providers at their head-ends and uplink centers. This programming is received in the form of a scrambled signal. We provide these operators with decoder equipment which allows them to decode the signal and then re-distribute it via their own systems.
Our Transactional TV segment maintains a satellite transponder lease agreement for one full-time digital transponder with a total bandwidth of approximately 36 MHz on the Galaxy 23 satellite and approximately 9 MHz on the NSS 806 satellite. These transponders provide the satellite transmission necessary to broadcast our Transactional TV segment's networks. The signal of the satellites that we use covers the continental U.S., Alaska, Hawaii, Latin America and portions of the Caribbean Islands and Canada.
Our Transactional TV segment delivers its VOD service to cable MSOs via transport providers such as TVN Entertainment Corporation. In addition, our Transactional TV segment has agreements
3
with iN DEMAND L.L.C., and Global Digital Media Xchange to deliver VOD content to other cable MSOs.
Digital Broadcast Center
The 12,000 square foot DBC allows us to ingest, encode, edit, play out, store and digitally deliver our PPV and VOD services. The DBC is also home to one of the largest digital libraries of its kind. The DBC is a scalable, state of the art infrastructure, which includes playlist automation for all channels; encoding and playout to air; a storage area network for near-line content movement and storage; archiving capability in a digital format; and complete integration of our proprietary media asset management database for playlist automation and program scheduling.
Program and Content Acquisitions
We acquire our broadcast programming for each network by licensing rights from producers and producing content. The licenses generally cover a five-year term. We generally acquire and produce new premiere titles and scenes each month. In addition, we may license entire content libraries on an as-needed basis or in order to facilitate a larger transaction. Once we license a title, it undergoes rigorous quality control processes prior to broadcast in order to ensure compliance with strict internal and external broadcasting standards. We obtain age verification documentation for each title we license in accordance with federal statutes. This documentation is maintained on site for the duration of the license term in accordance with 18 U.S.C. § 2257 and 28 C.F.R. 75 et seq.
We maintain an office in California that (a) ensures all legal documentation is obtained for each title and scene licensed, (b) ensures acquired content is technically compliant, and (c) once the title is deemed acceptable, ships the title, related documentation and promotional content to our Boulder, Colorado location. Our Transactional TV segment's in-house programming and editing departments in Boulder conduct preliminary screening of potentially licensable content, license acceptable content, conform content into appropriate editing standards and program the monthly schedules for all networks and VOD services.
Competition
Our primary competitor in this segment has historically been Playboy Enterprises, Inc. ("Playboy") which, through its Playboy TV® service and its Spice Digital Networks®, has a long operating history in the adult entertainment space. Over the past several years, we have been successful in competing with Playboy, and we have experienced growth in our Transactional TV segment as a result of our ability to gain market share through the displacement of Playboy services. Other competitors, such as Hustler TV®, have also entered the market and are increasing competition.
Our content has typically outperformed our competitors' content on the majority of DBS and MSO platforms as measured by revenue per server hour. As a result, we have been able to increase our shelf space on these platforms through incremental platform hours and the replacement of our competitors' hours. We believe that some competitors have been willing to execute contracts with distributors that contain lower revenue splits and/or provide revenue guarantees in order to obtain or retain channels and VOD platform hours. While we believe that our content continues to outperform the competition, we cannot predict whether that performance advantage will insulate us from further pressure on revenue splits. If our competitors continue to provide the DBS and MSO platforms lower revenue splits and if we are unable to maintain a performance advantage or cause the DBS and MSO providers to recognize the value from this performance advantage, then our customers could put additional pressure on us to lower our revenue splits. A reduction in our revenue splits would have a material adverse impact on our results of operations and financial condition.
4
We also face competition in the adult entertainment market from other providers of adult programming including producers of adult content, adult internet sites, adult video/DVD rentals and sales, premium movie channels that broadcast adult-themed content, telephone adult chat lines, books and magazines aimed at adult consumers, and adult-oriented wireless services. Our Transactional TV segment also faces general competition from other forms of non-adult entertainment, including sporting and cultural events, other television networks, feature films, and other programming.
Film Production Segment
Our Film Production segment is a multi-faceted film production and distribution company. The Film Production segment expands our portfolio to the higher margin market for mainstream and erotic content and provides us with established relationships in international markets. Additionally, we have leveraged our existing Transactional TV segment customer relationships and deliver the Film Production segment's library of erotic and mainstream content to many of the same Transactional TV segment MSO and DBS customers.
Our Film Production segment derives revenue from two principal businesses: (1) the production and distribution of original motion pictures such as erotic thrillers, horror movies, and erotic, event styled content ("owned content"); and (2) the distribution of third party films where we act as a sales agent for the product ("repped content"). This segment also periodically provides contract film production services to major Hollywood studios ("producer-for-hire" arrangements).
During fiscal year 2009, the film markets were significantly impacted by the economic downturn. As a result, the Film Production segment's customers reduced their content acquisition budgets. We believe this occurred because our customers were relying upon their existing libraries to reduce spending and costs. These changes significantly impacted the Film Production segment operating results during the third quarter of fiscal year 2009 and as a result, we made material revisions to the segment's internal forecasts and engaged a third party valuation firm to assist us in performing a goodwill and intangible asset impairment analysis. Based on the analysis, we determined that the goodwill associated with the Film Production segment was impaired and recorded a $10.0 million goodwill impairment charge during the quarter ended December 31, 2008. We also recorded a film cost impairment charge of approximately $1.1 million during the quarter ended December 31, 2008 primarily as a result of the economic downturn.
Excluding goodwill and other impairment charges, the Film Production segment results in fiscal year 2010 were consistent with our internal budgets. However, industry conditions continue to be unfavorable in the film markets where we distribute content, and we believe these challenging conditions will continue for the foreseeable future. As a result, the five year internal forecast for the Film Production segment was revised downward in connection with our year end goodwill impairment testing. We engaged a third party valuation firm to assist us in performing the annual goodwill impairment analysis. Based on the analysis, we determined that the goodwill associated with the Film Production segment was impaired and recorded a $4.9 million goodwill impairment charge during the fourth quarter of fiscal year 2010. We also recorded a film cost impairment charge of approximately $1.2 million and a recoupable costs and producer advances impairment charge of approximately $0.8 million during the fourth quarter of fiscal year 2010 associated with the unfavorable film market conditions. It is reasonably possible that future unfavorable economic conditions could cause the operating results of this segment to remain depressed or decline.
Owned Content Revenue
The Film Production segment produces and distributes its owned content for three primary customer groups. The first customer group consists of cable MSO and DBS service providers. Since our acquisition of the Film Production segment, we have leveraged our existing Transactional TV segment
5
relationships and established new customer opportunities for our Film Production segment's owned content. The owned content that is distributed through PPV appears on unbranded linear channels within the mainstream or adult PPV movie location of the platform's electronic programming guide. Content that is distributed through VOD appears within menu categories such as "uncensored." Our movies and events are sold to end users at retail prices typically ranging from $7.99 to $9.99. We receive a percentage share of the revenue derived from sales on these platforms. Revenue splits are typically higher than those earned by our Transactional TV segment due to the mainstream nature of the content. Owned content is distributed to cable MSO and DBS service providers using the DBC and transport providers as described above in the Transactional TV segment discussion.
The second customer group for our owned content distribution consists of premium movie service providers such as Cinemax and Showtime. The premium movie service providers license and distribute the content as part of their late-night programming and within their subscription VOD product. The owned content is typically sold to these customers for a flat license fee.
The third customer group consists of various international distributors including international premium movie service providers. These international distributors typically re-distribute the content to end-users. We also typically charge these customers a flat license fee for the owned content.
The Film Production segment does not employ a production staff. Third-party production staff is used to produce owned content, and our employees provide in-house oversight over the critical areas of production such as scripting, casting, shoot location, and post production.
Sales Agency (Repped Content) Service Revenue
Our Film Production segment has established relationships with independent mainstream film producers. We act as a sales agent for the film producers and license both domestic and international rights to their movies under Lightning Entertainment Group. We also license titles under our Mainline Releasing Group. We earn a commission for licensing film rights on behalf of these producers. The commission we earn from domestic distribution is typically more favorable than the commission we earn from international distribution. We also earn a marketing fee for many titles that we represent. Each contract typically allows for the recoupment of any producer advances and costs incurred in preparing the title for market, including advertising costs, screening costs, costs to prepare the trailer, box art, screening material, and similar costs necessary to ensure the movie is market ready.
We generate revenue from our repped content through arrangements with mainstream distributors world-wide. Distributors deliver the repped content through various channels including theatrical, pay-television, free television and other similar distribution channels. We also recently began distribution of repped content on VOD platforms through U.S. cable MSOs. We continue to leverage the relationships we have established through the Transactional TV segment with U.S. cable and DBS providers and have successfully launched the Film Production segment's repped content in over 35 million network homes. Additionally, our repped content is distributed in large retail DVD markets through a distribution arrangement we executed with a leading independent home video/DVD entertainment partner.
Producer-for-Hire and Other Revenue
Producer-for-hire and other revenue relates to amounts earned through producer-for-hire arrangements, music royalty fees and the delivery of other miscellaneous film materials to customers. Through our producer-for-hire arrangements, we provide services and incur costs associated with the film production, and we earn a fee for our services once the film has been delivered to the customer. Although we maintain no ownership rights for the produced content, we are responsible for the management and oversight of the project and incur significant economic risk until the project is completed. The gross margins we generate from producer-for-hire arrangements are less than the
6
returns we generate from our owned content and have historically been between 10% and 20% of net revenue; however, we cannot reasonably predict whether the gross margins we receive will continue to be similar to those generated historically. We generated approximately $3.9 million of producer-for-hire services revenue during the fourth quarter of fiscal year 2010. We also expect to generate an additional $4.0 million to $4.1 million in producer-for-hire services revenue during fiscal year 2011.
Competition
For our owned content, we compete primarily with one small, privately-owned company and other branded content such as Girls Gone Wild® and Jerry Springer® Uncensored. With respect to our sales agency business, we compete with approximately 30 privately-owned companies. We compete with these companies based on licensing fees charged, content quality, ability to deliver our products on-time, relationships with decision makers in the industry, and the professionalism of our sales team. For our producer-for-hire services, we compete against a wide variety of independent movie producers.
Direct-to-Consumer Segment
Our Direct-to-Consumer segment derives revenue primarily through subscriptions to its consumer websites. Content for the websites is primarily obtained through licensing agreements executed by our Transactional TV segment for broadcast rights. Traffic to our consumer websites is primarily derived through either a targeted network of affiliates that earn a referral fee from us when diverted traffic converts into paying members, or "type-in" traffic in which users navigate directly to the sites by typing the addresses into their web browsers.
This segment also launched a test initiative related to the development of a set-top box and IPTV business model. During January 2008, we acquired certain intellectual property rights to an internet protocol set-top box. Through the set-top box, consumers could access content through the internet and view the content on their television. Based on lower than expected subscriber additions for the IPTV business model and other factors considered during the second half of fiscal year 2009, we reduced the resources allocated to the related new product offering operations. During fiscal year 2010, the IPTV business model's performance continued to be lower than expected. In the fourth quarter of fiscal year 2010, we discontinued the operations of the IPTV business model as a result of the underperformance in fiscal year 2010. See Note 19—Discontinued Operations within the Notes to Consolidated Financial Statements for further discussion on our discontinuation of the IPTV set-top box business.
Competition
The adult internet industry is highly competitive and highly fragmented given the relatively low barriers to entry. Recently, the introduction of a large number of free content sites that allow users to access large libraries of content has created an even more challenging environment.
OTHER INFORMATION
Customer Concentration
We derived 52% of our total revenue for the fiscal year ended March 31, 2010 from Comcast Corporation ("Comcast"), DIRECTV Group ("DirecTV"), DISH Network ("DISH"), and Time Warner Cable Inc. ("Time Warner"). We generate revenue from these customers through our Transactional TV and Film Production segments. The loss of any of these major customers would have a material adverse effect on these segments and our Company as a whole. Specific financial information about the total revenue and outstanding accounts receivable from each of our major customers is incorporated by reference herein to Note 13—Major Customers within the Notes to Consolidated Financial Statements included herein.
7
Employees
As of March 31, 2010, we had approximately 180 employees located only in the United States. Our employees are not members of a union, and we have never suffered a work stoppage.
Financial Information about Segments and Geographic Areas
Our revenue is primarily derived from customers located in the United States. Financial information about segments and geographic areas is incorporated herein by reference to Note 12—Segment and Geographic Information within the Notes to Consolidated Financial Statements included herein.
Seasonality
Although we do not consider our business to be highly seasonal, our Film Production segment sales team attends a large proportion of film trade shows just prior to and during the third fiscal quarter. In the 2008 and 2007 fiscal years, we executed contracts at those tradeshows and subsequently delivered the related content in the third fiscal quarter resulting in higher revenue relative to other quarters. During the third quarters of the fiscal years ended March 31, 2009 and 2010, the Film Production segment's revenue has not exhibited a similar level of seasonality due to the deterioration in film markets. We believe that it is reasonably possible that the film markets will continue to experience unfavorable economic conditions which could cause the Film Production segment's revenue in the third fiscal quarter to remain depressed or decline.
Intellectual Property
During fiscal year 2008, we acquired certain intellectual property rights associated with set-top box equipment that provides customers with IPTV and other new product development. We will seek to protect our intellectual property rights. Despite our efforts, unauthorized parties may attempt to copy aspects of our products or obtain and use information that we regard as proprietary. Policing unauthorized use of our rights is difficult. Additionally, third parties might independently develop technologies that are substantially equivalent or superior to our technologies.
Government Regulation
Our Company is regulated by governmental authorities. We have historically operated only in the United States and so we were only regulated by domestic authorities. However, because we have expanded to international markets, we must comply with diverse and evolving regulations both domestically and internationally. Regulation relates to, among other things, licensing, access to satellite transponders, foreign investment, use of confidential customer information and content, including standards of decency and obscenity. Changes in the regulation of our operations or changes in interpretations of existing regulations by courts or regulators or our inability to comply with current or future regulations could have a material adverse impact on our financial position and results of operations.
Available Information
We file annual, quarterly and current reports, and amendments thereto, with the Securities and Exchange Commission ("SEC") under Section 13(a) of the Securities Exchange Act of 1934. We make these reports available free of charge on or through our internet website, www.noof.com, as soon as reasonably practicable after we electronically file such material with, or furnish such material to, the SEC. Information on our website should not be considered to be a part of this report or any other
8
SEC filing unless explicitly incorporated by reference herein. You may request a copy of these filings at no cost. Please direct your requests to:
New
Frontier Media, Inc.
Attn: CFO
7007 Winchester Circle, Suite 200
Boulder, CO 80301
You can also read and copy any materials that we file with the SEC at the SEC's Public Reference Room at 100 F Street, NE, Washington DC 20549. You can obtain information on the operations of the Public Reference Room by calling the SEC at 1-800-SEC-0330. The SEC also maintains an internet site (www.sec.gov) that contains our reports, proxy and information statements and other information that we file electronically with the SEC.
EXECUTIVE OFFICERS OF THE REGISTRANT.
Our executive officers are as follows:
Name
|
Age | Position | |||
|---|---|---|---|---|---|
| Michael Weiner | 68 | Chairman of the Board, Chief Executive Officer and Secretary | |||
| Ken Boenish | 43 | President | |||
| Marc Callipari | 42 | General Counsel | |||
| Scott Piper | 47 | Chief Technology and Information Officer | |||
| Grant Williams | 34 | Chief Financial Officer | |||
Michael Weiner. Mr. Weiner was appointed President of New Frontier Media in February 2003 and was then appointed to the position of Chief Executive Officer in January 2004. Prior to being appointed President, he held the title of Executive Vice President and co-founded the Company. As Executive Vice President, Mr. Weiner oversaw content acquisitions, network programming, and all contract negotiations related to the business affairs of the Company. In addition, he was instrumental in securing over $20 million to finance the infrastructure build-out and key library acquisitions necessary to launch the Company's television networks. Mr. Weiner's experience in entertainment and educational software began with the formation of Inroads Interactive, Inc. in May 1995. Inroads Interactive, based in Boulder, Colorado, was a reference software publishing company dedicated to aggregating still picture, video, and text to create interactive, educational-based software. Among Inroads Interactive's award winning releases were titles such as Multimedia Dogs, Multimedia Photography, and Exotic Pets. These titles sold over 1 million copies throughout the world through its affiliate label status with Broderbund Software and have been translated into ten different languages. Mr. Weiner was instrumental in negotiating the sale of Inroads Interactive to Quarto Holdings PLC, a UK-based book publishing concern. Prior to Inroads Interactive, Mr. Weiner was in the real estate business for 20 years, specializing in shopping center development and redevelopment in the Southeast and Northwest United States. He was involved as an owner, developer, manager, and syndicator of real estate in excess of $250 million.
Ken Boenish. Mr. Boenish is a 20-year veteran of the cable television industry. In October 2000, he was named President of the Transactional TV segment and in June 2005 he was named President of New Frontier Media. Mr. Boenish joined New Frontier Media as the Senior Vice President of Affiliate Sales in February 1999. Prior to joining the Company, Mr. Boenish was employed by Jones Intercable ("Jones") from 1994 to 1999. While at Jones he held the positions of National Sales Manager for Superaudio, a cable radio service serving more than 9 million cable customers. He was promoted to Director of Sales for Great American Country, a then new country music video service, in 1997. While at Great American Country, Mr. Boenish was responsible for adding more than 5 million new customers to the service while competing directly with Country Music Television, a CBS cable network. From 1988 to 1994 he sold cable television advertising on systems owned by Time Warner, TCI, COX, Jones, Comcast and other cable systems. Mr. Boenish holds a bachelors degree from St. Cloud State University.
9
Marc Callipari. Mr. Callipari joined New Frontier Media in August 2006 as the Vice President of Legal Affairs and shortly thereafter was promoted to General Counsel. He is responsible for New Frontier Media's legal and human resources functions. Mr. Callipari started his legal career over 14 years ago in Washington, D.C. where he practiced commercial litigation from 1994 to 1999 with a large, international law firm and a boutique litigation firm. More recently, he served as captive outside and then in-house counsel to Level 3 Communications, an unaffiliated international communications company, from 1999 to 2006, where he was responsible for a wide range of world-wide litigation and transactional matters, including the negotiation of several multi-million dollar telecommunication infrastructure asset purchases and sales. He graduated from the University of San Diego School of Law in 1994, is a member of the Colorado, Virginia and District of Columbia Bars and has been admitted to practice before numerous federal courts throughout the United States.
Scott Piper. Mr. Piper joined New Frontier Media in February 2007 as Chief Technology and Information Officer. Mr. Piper has been an information technology professional for approximately 20 years and has held senior leadership roles for the past 12 years. He has extensive experience in infrastructure design and delivery for large scale enterprises, including the implementation of over fifteen customer contact centers, some with as many as 1,500 seats. He was responsible for one of the first successful large voice over internet protocol ("VoIP") contact centers in the U.S. Prior to joining New Frontier Media, Mr. Piper was employed from 1994 to 2006 by EchoStar Satellite L.L.C. While employed in a variety of roles during his tenure at EchoStar, he most recently held the title of Vice President of IPTV. Mr. Piper was responsible for the launch of DISH Network's web based entertainment portal prior to his departure. Mr. Piper holds a Bachelor of Science in Marketing and Finance from the University of Colorado and a Masters in Science in Telecommunications from the University of Denver.
Grant Williams. Mr. Williams has served as Chief Financial Officer since April 2008. Mr. Williams served as the Corporate Controller of New Frontier Media from October 2006 until April 2008. From February 2004 until October 2006, Mr. Williams was employed by eFunds Corporation and served in various senior manager roles, including management of Securities and Exchange Commission filings and correspondence; financial contract management for significant transactions including business acquisitions, business dispositions, and debt financing; and financial management and analysis of the company's corporate costs. Prior to February 2004, Mr. Williams was employed by Ernst and Young, LLP as a manager within the assurance and advisory services group. Mr. Williams holds a Bachelor of Accountancy from the University of Oklahoma and is a Certified Public Accountant in Colorado and Arizona.
The loss of any of our current major customers, or our inability to maintain or negotiate at renewal or otherwise favorable contractual terms with these customers, could have a material adverse effect on our financial position and results of operations.
We have agreements with the ten largest U.S. cable MSOs and two largest U.S. DBS providers. For our fiscal year ended March 31, 2010, the aggregate revenue we received from our major customers (customers that account for 10% or more of our consolidated revenue, namely Comcast, DISH, DirecTV and Time Warner) was approximately 52% of our total company-wide revenue. Our agreements with these operators may be terminated without penalty and with little advance notice, and as a result are sometimes subject to renegotiation during their stated term. If one or more of these cable MSO or DBS operators terminates or does not renew our agreements, or negotiates mid-term or agrees only to renew the agreements on terms less favorable than those of our current agreements (including removing or replacing with a competitive offering or otherwise one or more of our PPV channels or VOD offerings from their platforms), our financial position and results of operations could be materially adversely effected.
10
For example, the largest DBS provider in the U.S., which increased our distribution from two channels to three channels during the third quarter of fiscal year 2008, reduced its carriage of our PPV channels back to two channels in November 2009. Consistent with the terms of the original agreement, the customer has the right to discontinue carriage of any of the remaining two channels without penalty and with little advance notice. The removal of the channel in November 2009 resulted in an estimated decline in our PPV revenue of approximately $0.6 million during fiscal year 2010.
We rely on third party service providers to deliver our content to our customers via satellite uplink and transport services. If these services were disrupted, it could cause us to lose subscriber revenue and adversely affect our financial position and results of operations.
Our satellite uplink and transport provider services are critical to us. If our satellite uplink or transport provider fails to provide the contracted services, our programming operations would in all likelihood be suspended, resulting in a loss of substantial revenue. If our satellite uplink provider improperly manages its uplink facilities, we could experience signal disruptions and other quality problems that, if not immediately addressed, could cause us to lose customers and the related revenue.
Our continued access to satellite transponders is critical to us. Our satellite programming operations require continued access to satellite transponders to transmit programming to our cable and DBS customers. Limitations to satellite transponder capacity could materially adversely affect our financial position and results of operations. Access to transponders may be restricted or denied if:
- •
- we or the satellite owner is indicted or otherwise charged as a defendant in a criminal proceeding;
- •
- the Federal Communications Commission issues an order initiating a proceeding to revoke the satellite owner's
authorization to operate the satellite;
- •
- the satellite owner is ordered by a court or governmental authority to deny us access to the transponder;
- •
- a governmental authority commences an investigation concerning the content of the transmissions;
- •
- we are deemed by a governmental authority to have violated any obscenity law; or
- •
- our satellite transponder provider determines that the content of our programming is harmful to its name or business.
Our ability to convince cable operators and DBS providers to carry our programming is critical to us. We can give no assurance that we will be able to continue to obtain carriage with cable operators and DBS providers in the future.
If we are unable to compete effectively with other forms of adult and non-adult entertainment, we will not be able to sustain or increase revenue.
Our ability to increase or sustain revenue is impacted by our ability to compete effectively with other forms of adult and non-adult entertainment. We face competition in the adult entertainment industry from other providers of adult programming, adult video/DVD rentals and sales, books and magazines aimed at adult consumers, adult oriented telephone chat lines, adult oriented internet services, including free website content services, premium movie channels that broadcast adult-themed content and adult oriented wireless services. To a lesser extent, we also face general competition from other forms of non-adult entertainment, including sporting and cultural events, other television networks, feature films, and other programming and entertainment options.
11
Our ability to compete depends on a variety of factors, many of which are outside of our control. These factors include the quality and appeal of our competitors' content relative to our offerings; the strength of our competitors' brands; the technology utilized by our competitors; the effectiveness of our competitors' sales, marketing efforts and the attractiveness of their product offerings; general consumer behaviors; and preferences on how consumers choose to spend their discretionary income.
Our existing competitors, as well as potential new competitors, may have significantly greater financial, technical and marketing resources, as well as better name recognition than we do. This may allow them to devote greater resources than we can to the development and promotion of their product offerings. These competitors may also engage in more extensive technology research and development, and adopt more aggressive pricing policies for their content. Additionally, increased competition could result in license fee reductions, lower margins and a negative impact on our financial position and results of operations.
The popularity and notoriety of adult entertainment through low cost and free websites has resulted in additional pressure on our business. The quality and quantity of content available on these free and low cost websites has improved. The content we sell through the Transactional TV segment typically has a retail price between $10.99 and $14.99 and is typically less explicit than the content offered on internet websites. As a result of the recent deterioration in economic conditions, customers may view internet delivered content as a replacement to our content based on the difference in cost, edit standard and availability of certain niche content that we do not distribute. A migration of customers to internet delivered content could result in a decline in our buy rates and have a negative impact on our financial position and results of operations.
The continued addition of new competitors to our business could have a material adverse affect on our operating performance.
We face competition from established adult video producers, as well as independent companies that distribute adult entertainment, some of which is provided for free through internet websites. These competitors may include producers such as Hustler, Wicked Pictures and Vivid Entertainment. In the event that cable and/or satellite companies seek to purchase adult video content for their PPV or VOD service directly from adult video producers or other independent distributors of such content, our PPV and VOD business is likely to suffer. For example, an independent producer of adult content, which has historically distributed content only through the internet, replaced one of our PPV channels on the largest DBS platform in the U.S. during the third quarter of fiscal year 2010 resulting in a decrease in our revenue of approximately $0.6 million during fiscal year 2010. In addition, increased competition in the adult category could lead to downward pressure on the license fees that our customers are willing to pay for our content.
We may incur costs to defend ourselves against legal claims initiated in connection with our distribution of adult-themed content.
Because of the adult-oriented content that we distribute, we may be subject to obscenity or other legal claims by third parties. Our financial position and results of operations could be harmed if we were found liable for this content or if costs to defend such claims proved significant. Implementing measures to reduce our exposure to this liability may require us to take steps that would substantially limit the attractiveness of our content and/or its availability in various geographic areas, which would negatively impact our ability to generate revenue. Furthermore, our insurance may not adequately protect us against all of these types of claims.
12
Increased government regulation in the United States and abroad could impede our ability to deliver our content and expand our business.
New laws or regulations, or the new application of existing laws could prevent us from making our content available in various jurisdictions or otherwise have a material adverse affect on our business, financial position and operating results. These new laws or regulations may relate to liability for information retrieved from or transmitted over the internet, taxation, user privacy and other matters relating to our products and services. Moreover, the application of internet related laws governing issues such as intellectual property ownership and infringement, pornography, obscenity, libel, employment, and personal privacy is still developing.
Cable and DBS operators could become subject to new governmental regulations that could further restrict their ability to broadcast our programming. If new regulations make it more difficult for cable and DBS operators to broadcast our programming, our financial position and results of operations could be adversely affected.
Changes in our effective tax rate or assessments arising from tax audits may have an adverse impact on our results.
We are subject to taxation in various jurisdictions, both domestically and internationally, in which we conduct business. Significant judgment is required in the determination of our provision for income taxes and this determination requires the interpretation and application of complex and sometimes uncertain tax laws and regulations. Our effective tax rate may be adversely impacted by changes in the mix of earnings between jurisdictions with different statutory tax rates, in the valuation of our deferred tax assets, and by changes in tax rules and regulations. For instance, the availability and timing of lapses in the United States research and development tax credit, the accounting of uncertain tax positions and the amount of our estimated tax deduction for domestic production activities may add more variability to our future effective tax rates.
We recently filed amended and current tax returns that reflect a tax benefit associated with research and development tax credits. We are subject to examination of these amended and current tax returns and our determination of the research and development tax credits. If the Internal Revenue Service audits these returns and disallows some or all of the research and development tax credits, our financial position and results of operations could be materially adversely affected.
If the Film Production segment produces, acquires or represents film content that is not well-received by our customers, we may not be able to re-coup the investments made in the film.
We have a history of impairing titles in our content library and recoupable costs associated with our repped content when the future expected economic benefits to be derived by a particular film or event are not estimated to be sufficient to recover its related carrying value. The Film Production segment's ability to continue to create or acquire film content and obtain rights to represent content that is well-received by our customers is critical to the segment's future success. If a film produced, acquired or represented by the Film Production segment does not sell as well as anticipated, we may not be able to recover our investment in the film, including, but not limited to, the cost of producing or acquiring the film, the costs associated with promoting the film, costs associated with post-production work on the film, or advances and other recoupable costs associated with representing a film. No assurance can be given that the Film Production segment's past success in generating profits from its investment in its films will continue.
13
Antitakeover provisions in our Amended and Restated Articles of Incorporation, as amended, and our Rights Agreement may discourage or prevent a change of control.
Our charter documents may inhibit a takeover or change in control that our shareholders may consider beneficial. Provisions in our Amended and Restated Articles of Incorporation may have the effect of delaying or preventing a merger or acquisition of us, or making a merger or acquisition less desirable to a potential acquirer, even when the shareholders may consider the acquisition or merger favorable. For example, our Board of Directors, without further shareholder approval, may issue preferred stock that could delay or prevent a change of control as well as reduce the voting power of the holders of common stock, even with the effect of losing control to others. In addition, our Board of Directors has adopted a Rights Agreement, commonly known as a "poison pill," that may delay or prevent a change of control and may also make a merger or acquisition of us less desirable. If a change of control transaction perceived by the shareholders to be in their best interest were delayed or blocked by our protective measures, the value of an investment in our securities may be negatively impacted.
If we are not able to retain our key executives it will be more difficult for us to manage our operations and our financial position and result of operations could be adversely affected.
With only approximately 180 employees, our success depends greatly upon the contributions of our executive officers and our other key personnel. The loss of the services of any of our executive officers or other key personnel could have a material adverse effect on our financial position and results of operations. No assurance can be given that we will be successful in attracting and retaining these personnel.
Our inability to identify, fund the investment in, and commercially exploit new technology could have an adverse impact on our financial position and results of operations.
We are engaged in a business that has experienced tremendous technological change over the past several years and will likely continue to experience further changes. As a result, we face all the risks inherent in businesses that are subject to rapid technological advancement, such as the possibility that a technology that we have invested in becomes obsolete, our inability to identify in a timely manner emerging technologies that may impact our business, or technology advancement may make our offerings obsolete. In any such event, we may be required to invest significant amounts of capital in new technology. Our inability to identify, fund the investment in, and commercially exploit such new technology could have an adverse impact on our financial position and results of operations. Our ability to implement our business plan and to achieve the results projected by management will be dependent upon management's ability to predict technological advances and implement strategies to take advantage of such changes. We may also experience impairments related to existing investments that we have made in new technology.
Negative publicity, lawsuits or boycotts by opponents of adult content could adversely affect our financial position and results of operations and discourage investors from investing in our publicly traded securities.
We could become a target of negative publicity, lawsuits or boycotts by one or more advocacy groups who oppose the distribution of adult entertainment. These groups have mounted negative publicity campaigns, filed lawsuits and encouraged boycotts against companies whose businesses involve adult entertainment. The costs of defending against any such negative publicity, lawsuits or boycotts could be significant, could hurt our finances and could discourage investors from investing in our publicly traded securities. As a leading provider of adult entertainment, we cannot assure you that we may not become a target in the future.
14
Because we are involved in the adult programming business, it may be more difficult for us to raise money or attract market support for our stock.
Some banking entities, investors, investment banking entities, market makers, lenders and other service providers in the investment community may decide not to provide financing to us, or to participate in our public market or other activities due to the nature of our business, which, in turn, may adversely impact the value of our stock, and our ability to attract market support or obtain financing.
We may be unable to protect our intellectual property rights or others may claim that we are infringing on their intellectual property.
During fiscal year 2008, we acquired certain intellectual property rights. Third parties could assert infringement claims against our business in the future. Claims for infringement of all types of intellectual property rights are a common source of litigation. Infringement claims can require us to modify our products, services and technologies or require us to obtain a license to permit our continued use of those rights. We may not be able to perform either of these actions in a timely manner or upon reasonable terms and conditions. Failure to do so could harm our financial position and results of operations. In addition, future litigation relating to infringement claims could result in substantial costs to us and a diversion of management resources. Adverse determinations in any litigation or proceeding could also subject us to significant liabilities and could prevent us from selling some of our products, services or technologies.
Despite our efforts to protect our intellectual property rights, third parties may infringe or misappropriate them or otherwise independently develop substantially equivalent products and services. The loss of intellectual property protection or the inability to secure or enforce intellectual property protection could harm our business.
If we experienced system failures, the services we provide to our customers could be delayed or interrupted, which could harm our business reputation and result in a loss of customers.
Our ability to provide reliable service largely depends on the efficient and uninterrupted operations of our Digital Broadcast Center and related systems. Any significant interruptions could severely harm our business and reputation and result in a loss of revenue and customers. Our systems and operations could be exposed to damage or interruption from fire, natural disaster, unlawful acts, power loss, telecommunications failure, unauthorized entry, computer viruses, or similar events. Although we have taken steps to prevent system failures, we cannot be certain that our measures will be successful and that we will not experience service interruptions. Further, our property and business interruption insurance may not be adequate to compensate us for all losses or failures that may occur.
Our goodwill, intangible assets and other long-lived assets may have further impairment losses.
We conducted our annual goodwill and intangible assets impairment tests as of March 31, 2010, 2009 and 2008. We also performed goodwill and intangible assets impairment tests as of December 31, 2008 due to events and circumstances within our Film Production segment that caused us to believe that it was more likely than not that the segment's goodwill was impaired. We also perform quarterly analyses on the valuation of long-lived assets including our content and distribution rights, film library,
15
recoupable costs and producer advances, and other long-lived assets. We recognized the following continuing operations impairment charges in our statements of operations (in thousands):
| |
Year Ended March 31, | |||||||||
|---|---|---|---|---|---|---|---|---|---|---|
| |
2010 | 2009 | 2008 | |||||||
Goodwill |
$ | 4,856 | $ | 10,009 | $ | — | ||||
Film costs |
1,207 | 1,062 | 684 | |||||||
Intangible assets |
291 | — | — | |||||||
Other long-lived assets |
831 | 236 | 466 | |||||||
Total impairment loss |
$ | 7,185 | $ | 11,307 | $ | 1,150 | ||||
If our goodwill, intangible assets or other long-lived assets' future benefit does not exceed its carrying value, we may be required to further write down the related assets. Declines in the future benefits from these assets could cause us to incur additional impairment losses, which could materially affect our financial position and results of operations. The ongoing uncertainty in general economic and market conditions could increase the likelihood of additional asset impairment losses being recorded in future periods. In addition, the determination of the fair value of goodwill, intangible assets and long-lived assets is subject to a high degree of judgment and complexity and changes in the estimates used in the determination of the fair value of these assets could materially affect our financial position and results of operations.
We may pursue acquisitions, joint ventures, new services and other strategic transactions and activities to complement or expand our business and add shareholder value which may not be successful.
Our future success may depend on opportunities to acquire or form strategic partnerships with other businesses or technologies or establish new services that could complement, enhance or expand our current business or products or that might otherwise offer us growth opportunities. We may not be able to complete such transactions or activities and such transactions or activities, if executed, could pose significant risks and could have a negative effect on our financial position and results of operations. Any transactions or activities that we are able to identify and complete may involve a number of risks, including:
- •
- the diversion of our management's attention and resources from our existing business to integrate the operations and
personnel of the acquired, combined or created business or joint venture;
- •
- the diversion of our management's attention and resources from existing business to create new services;
- •
- possible adverse effects on our financial position and results of operations during the integration process or
implementation process; and
- •
- the inability to achieve the intended objectives of the transactions or activities.
In addition, we may not be able to successfully or profitably integrate, operate, maintain and manage our newly acquired operations, employees or activities. We may not be able to maintain uniform standards, controls, procedures and policies, and this may lead to operational inefficiencies.
New acquisitions, joint ventures, new services and other transactions may require the commitment of significant capital that would otherwise be directed to investments in our existing businesses or be distributed to shareholders. Commitment of this capital may cause us to defer or suspend any common stock dividends or share repurchases that we otherwise may have made.
16
Current market volatility and difficult economic conditions may materially and adversely impact our business and results of operations.
The global capital and credit markets continue to remain depressed, resulting in the reluctance of financial institutions to lend money, an increase in commercial and consumer delinquencies, a lack of consumer confidence, and a widespread reduction generally of business activity. If these conditions continue, which may be likely for the foreseeable future, or worsen, our ability to borrow funds or obtain other financing on terms acceptable to us could be materially adversely affected. These conditions could also, among other things, negatively impact our customers' ability to pay us, the number of subscribers and purchasers of our products and services, and require us to increase our reserves for bad debt, the occurrence of any or all of which could materially and negatively impact our business, our financial condition and our results of operations.
We believe the downturn in the economy has had a negative impact on our financial results for the past two years and will also impact our fiscal year 2011 results. Our Transactional TV segment revenue decreased in fiscal year 2010 by approximately 12% despite generating incremental international revenue of $3.6 million. We experienced a downturn in our Film Production segment results during the third quarter of fiscal year 2009 and recorded goodwill and other impairment charges in connection with that segment's deterioration in performance related to the downturn in the economy in both fiscal year 2010 and 2009. Additionally, the adverse economic conditions contributed to restructuring and intangible asset impairment charges during the fourth quarter of fiscal year 2009 in connection with unfavorable results connected to an IPTV set-top box business and other initiatives within the Direct-to-Consumer segment, and we discontinued the IPTV set-top box business in the fourth quarter of fiscal year 2010. If the difficult economic conditions persist or worsen, our financial condition and results of operations would also be materially adversely impacted.
We may be unsuccessful with our initiative to expand our Transactional TV segment distribution into international markets due to our inexperience with international adult content delivery and foreign government regulations.
During fiscal year 2009, we began expanding our Transactional TV segment services into new international markets. We have not historically operated internationally or transacted with international government regulators, competitors, cultures or consumers. As a result of our inexperience, we may be unsuccessful in executing our international growth initiatives.
ITEM 1B. UNRESOLVED STAFF COMMENTS.
None.
We use the following principal facilities in our operations. All facilities are 100% utilized.
Colorado: We lease space in two office buildings in Boulder, Colorado. The north Boulder facility is approximately 12,000 square feet and houses our Transactional TV segment's Digital Broadcast Center, encoding and technical operations groups, content screening, and quality control functions. Our Winchester Circle facility is approximately 18,000 square feet and is used as our corporate headquarters, as well as by our Direct-to-Consumer segment's web production department and by our Transactional TV segment's marketing, sales, branding, promotions and conforming departments.
California: We lease approximately 4,600 square feet in Santa Monica, California. This facility houses our Film Production segment's production and licensing business.
We believe that our facilities are adequate to maintain our existing business activities.
17
For a discussion of legal proceedings, see Note 14—Commitments and Contingencies in the Notes to Consolidated Financial Statements included herein and incorporated herein by reference.
ITEM 4. SUBMISSION OF MATTERS TO A VOTE OF SECURITY HOLDERS.
No matters were submitted for a vote of the shareholders during the fourth quarter of the fiscal year covered by this report.
ITEM 5. MARKET FOR REGISTRANT'S COMMON EQUITY, RELATED STOCKHOLDER MATTERS AND ISSUER PURCHASES OF EQUITY SECURITIES.
Our common stock is traded on the NASDAQ Global Select Market under the symbol "NOOF".
The following table sets forth the range of high and low sales prices for our common stock for each quarterly period indicated, as reported on the NASDAQ Global Select Market:
Quarter Ended
|
High | Low | Quarter Ended
|
High | Low | ||||||||||
|---|---|---|---|---|---|---|---|---|---|---|---|---|---|---|---|
June 30, 2009 |
$ | 2.95 | $ | 1.52 | June 30, 2008 | $ | 5.29 | $ | 3.31 | ||||||
September 30, 2009 |
2.50 | 1.87 | September 30, 2008 | 4.28 | 2.05 | ||||||||||
December 31, 2009 |
2.18 | 1.75 | December 31, 2008 | 2.56 | 1.27 | ||||||||||
March 31, 2010 |
2.40 | 1.76 | March 31, 2009 | 2.20 | 1.05 | ||||||||||
The high and low sales prices per share as reported on the NASDAQ Global Select Market on June 4, 2010, were $1.85 and $1.81, respectively. As of June 4, 2010, there were approximately 3,443 beneficial owners and 176 holders of record of New Frontier Media's Common Stock.
During each of the quarters in fiscal year 2008, the Company's Board of Directors declared a quarterly cash dividend of $0.125 per share of common stock. The Company paid approximately $9.0 million in cash dividends through March 31, 2008. Additionally, as of March 31, 2008, the Company had a dividend payable of $3.0 million that was subsequently paid in April 2008. The Board of Directors did not declare a quarterly dividend during fiscal year 2009 or 2010, and the payment of future quarterly dividends is at the discretion of the Board of Directors.
ISSUER PURCHASES OF EQUITY SECURITIES
From time to time, the Company has executed stock repurchase programs and stock purchase agreements based on current market conditions and the capital and financial position of the Company. This activity is conducted in a manner intended to comply with the safe harbor provisions of Rule 10b-18 promulgated under the Securities Exchange Act of 1934, as amended, and to minimize the impact of any purchases upon the market for its securities. Repurchased shares are returned to authorized but unissued shares of common stock in accordance with Colorado law.
In June 2008, the Company's Board of Directors extended a share repurchase plan allowing for the repurchase of approximately 1.1 million shares of common stock through June 2010. During the six month period ended September 30, 2008, the Company substantially completed the share repurchase plan and repurchased approximately 1.1 million shares for a total purchase price of approximately $4.3 million.
On November 14, 2008, the Company entered into a Stock Purchase Agreement pursuant to which a shareholder agreed to sell and the Company agreed to purchase approximately 2.6 million shares of the Company's common stock for a cash purchase price of $1.55 per share or an aggregate purchase
18
price for all of the shares of approximately $4.1 million. The Company funded the acquisition of the shares with available cash.
On March 11, 2009, the Company purchased through one broker in an unsolicited single block trade approximately 0.5 million shares of its common stock for a cash purchase price of $1.30 per share, or an aggregate purchase price for all of the shares of approximately $0.7 million. The acquisition was funded with available cash.
On August 28, 2009, the Company announced that its Board of Directors adopted a new stock repurchase program. Under the program, the Company may purchase with available cash and cash from operations up to 1.0 million shares of the Company's outstanding common stock, from time to time through open market or privately negotiated transactions, as market and business conditions permit. The program will expire in March 2012. Common stock purchases by the Company during the fourth quarter of fiscal year 2010 under this program were as follows (in thousands, except per share amounts):
Period
|
Total Number of Shares Purchased |
Average Price Paid Per Share |
Total Number of Shares Purchased as Part of Publicly Announced Plans or Programs |
Maximum Number of Shares that May Yet Be Purchased Under the Plans or Programs |
|||||||||
|---|---|---|---|---|---|---|---|---|---|---|---|---|---|
January 1 - 31, 2010 |
— | $ | — | — | 971 | ||||||||
February 1 - 28, 2010 |
20 | 1.94 | 20 | 951 | |||||||||
March 1 - 31, 2010 |
13 | 2.22 | 13 | 938 | |||||||||
Total |
33 | $ | 2.05 | 33 | |||||||||
19
STOCK PERFORMANCE GRAPH
The following graph compares the cumulative 5-year total return provided to shareholders of New Frontier Media, Inc.'s common stock relative to the cumulative total returns of the S&P SmallCap 600 index, and a customized peer group of two companies that includes: Playboy Enterprises Inc. and Private Media Group Inc. An investment of $100 (with reinvestment of all dividends) is assumed to have been made in the Company's common stock, in the peer group, and the index on 3/31/2005 and its relative performance is tracked through 3/31/2010.
COMPARISON OF 5 YEAR CUMULATIVE TOTAL RETURN*
Among New Frontier Media, Inc., The S&P SmallCap 600 Index
And a Peer Group
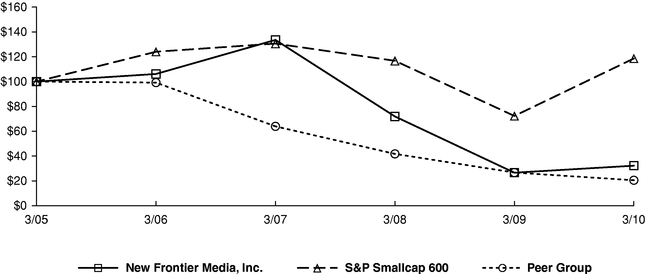
- *
- $100 invested on 3/31/05 in stock or index, including reinvestment of dividends.
Copyright© 2010 S&P, a division of The McGraw-Hill Companies Inc. All rights reserved.
The stock price performance included in this graph is not necessarily indicative of future stock price performance.
In accordance with the rules and regulations of the SEC, the above performance graph shall not be deemed to be "soliciting material" or deemed to be "filed" with the SEC or subject to Regulations 14A or 14C of the Securities Exchange Act of 1934, as amended, or to the liabilities of Section 18 of the Securities and Exchange Act of 1934, as amended, and shall not be deemed to be incorporated by reference into any filing under the Securities Act of 1933, as amended, or the Securities and Exchange Act of 1934, as amended, notwithstanding any general incorporation by reference of this report into any other filed document.
20
ITEM 6. SELECTED FINANCIAL DATA.
FIVE YEAR SELECTED CONSOLIDATED FINANCIAL DATA
(in thousands, except per share amounts)
| |
Year Ended March 31, | |||||||||||||||
|---|---|---|---|---|---|---|---|---|---|---|---|---|---|---|---|---|
| |
2010(4) | 2009(3) | 2008 | 2007(2) | 2006(1) | |||||||||||
Net revenue |
$ | 50,428 | $ | 52,595 | $ | 55,911 | $ | 63,271 | $ | 46,851 | ||||||
Income (loss) from continuing operations |
$ | (1,113 | ) | $ | (2,970 | ) | $ | 8,836 | $ | 12,309 | $ | 11,283 | ||||
Income (loss) from continuing operations per basic common share |
$ | (0.06 | ) | $ | (0.13 | ) | $ | 0.37 | $ | 0.51 | $ | 0.49 | ||||
Income (loss) from continuing operations per diluted share |
$ | (0.06 | ) | $ | (0.13 | ) | $ | 0.37 | $ | 0.51 | $ | 0.48 | ||||
Weighted average diluted shares outstanding |
19,481 | 22,039 | 24,148 | 24,355 | 23,338 | |||||||||||
Total assets |
$ | 61,813 | $ | 68,539 | $ | 83,661 | $ | 88,216 | $ | 86,765 | ||||||
Long-term liabilities |
$ | 837 | $ | 1,863 | $ | 2,013 | $ | 3,684 | $ | 7,035 | ||||||
Cash dividends declared per share of common stock |
$ | — | $ | — | $ | 0.50 | $ | 0.60 | $ | — | ||||||
- (1)
- In
February 2006, the Company acquired MRG Entertainment, Inc., its subsidiaries and a related company, Lifestyles Entertainment, Inc.
("MRG").
- (2)
- Beginning
in the first quarter of fiscal year 2007, the Company adopted new standards that changed the accounting for employee equity incentive plans
requiring the recognition of share-based compensation. See Note 3—Employee Equity Incentive Plans within the Notes to Consolidated Financial Statements for additional information.
- (3)
- During
the third quarter of fiscal year 2009, the Company incurred goodwill impairment charges of $10.0 million and film cost impairment charges of
$1.1 million associated with the Film Production segment. See Note 6—Goodwill and Other Intangible Assets and Note 9—Film Costs within the Notes to
Consolidated Financial Statements for additional information.
- (4)
- During the fourth quarter of fiscal year 2010, the Company incurred goodwill impairment charges of $4.9 million, film cost impairment charges of $1.2 million, and recoupable costs and producer advances impairment charges of $0.8 million associated with the Film Production segment. See the Recoupable Costs and Producer Advances discussion in Note 1—Organization and Summary of Significant Accounting Policies as well as Note 6—Goodwill and Other Intangible Assets and Note 9—Film Costs within the Notes to Consolidated Financial Statements for additional information.
ITEM 7. MANAGEMENT'S DISCUSSION AND ANALYSIS OF FINANCIAL CONDITION AND RESULTS OF OPERATIONS.
INTRODUCTION
Management's Discussion and Analysis of Financial Condition and Results of Operations ("MD&A") is intended to provide the readers of our accompanying consolidated financial statements with a narrative discussion about our business. The MD&A is provided as a supplement to the consolidated financial statements and accompanying notes and should be read in conjunction with those financial statements and accompanying notes. Our MD&A is organized as follows:
- •
- Forward-Looking Statements. Cautionary information about forward-looking statements and a description of certain risks and uncertainties that could cause actual results to differ materially from our historical results or our current expectations or projections.
21
- •
- Executive Overview. General description of our business
and operating segments as well as trends, challenges and growth objectives.
- •
- Critical Accounting Policies and Estimates. Discussion of
accounting policies that require critical judgments and estimates.
- •
- Results of Operations. Analysis of our consolidated
results of operations for the three years presented in our financial statements for each of our operating segments: Transactional TV, Film Production, Direct-to-Consumer, and
Corporate Administration.
- •
- Liquidity and Capital Resources. Analysis of cash flows, sources and uses of cash, contractual obligations, and financial position.
FORWARD-LOOKING STATEMENTS
This annual report on Form 10-K includes forward-looking statements. These are subject to certain risks and uncertainties, including those identified below, which could cause actual results to differ materially from such statements. The words "believe," "project," "expect," "anticipate," "estimate," "intend," "strategy," "plan," "may," "should," "could," "will," "would," "will be," "will continue," "will likely result," "are optimistic that," and similar expressions identify forward-looking statements. Readers are cautioned not to place undue reliance on these forward-looking statements, which speak only as of the date on which they are made. The Company undertakes no obligation to publicly update or revise any forward-looking statements, whether as a result of new information, future events, or otherwise.
Factors that could cause actual results to differ materially from the forward-looking statements include, but are not limited to, our ability to: 1) retain our four major customers that accounted for approximately 52% of our total revenue during the fiscal year ended March 31, 2010; 2) maintain the license fee structures currently in place with our customers; 3) maintain our pay-per-view ("PPV") channel and video-on-demand ("VOD") shelf space with existing customers; 4) compete effectively with our current competitors and potential future competitors that distribute adult content to U.S. and international cable multiple system operators ("MSOs") and direct broadcast satellite ("DBS") providers; 5) retain our key executives; 6) produce film content that is well received by our Film Production segment's customers; 7) comply with current and future regulatory developments both domestically and internationally; and 8) successfully compete against other forms of adult and non-adult entertainment such as pay and free adult oriented internet sites and adult oriented premium channel content. The foregoing list of factors is not exhaustive. For a more complete list of factors that may cause results to differ materially from projections, please refer to the Risk Factors section of this Form 10-K.
EXECUTIVE OVERVIEW
Overview
We are a leader in transactional television and the distribution of general motion picture entertainment. Our key customers include large cable and satellite operators, premium movie channel providers and major Hollywood studios. We distribute content world-wide. Our three principal businesses are reflected in the Transactional TV, Film Production and Direct-to-Consumer operating segments. Our Transactional TV segment distributes adult content to cable and satellite operators who then distribute the content to retail customers via PPV and VOD technology. We earn revenue through contractual percentage splits of the retail price. The Transactional TV segment has historically been our most profitable segment. The Film Production segment primarily generates revenue through the distribution of mainstream content to large cable and satellite operators, premium movie channel providers and other international content distributors. This segment also periodically provides contract
22
film production services to major Hollywood studios ("producer-for-hire" arrangements). The Film Production segment incurred operating losses in fiscal years 2010 and 2009 primarily due to large non-cash impairment charges. Our Direct-to-Consumer segment primarily generates revenue from membership fees earned through the distribution of adult content to consumer websites. The Direct-to-Consumer segment has historically incurred operating losses and is expected to continue to incur operating losses for the foreseeable future; however, we have focused our efforts on returning the segment to profitability through efforts described below. Our Corporate Administration segment includes all costs associated with the operation of the public holding company, New Frontier Media, Inc.
The business models of each of our segments are summarized below.
Transactional TV Segment
Our Transactional TV segment is focused on the distribution of its PPV and VOD service to MSOs and DBS providers worldwide. We earn a percentage of revenue, or "split", from our content for each VOD, PPV or subscription that is purchased on our customers' platform. Revenue growth can occur when we launch our services to new cable MSOs or DBS providers, experience growth in the number of digital subscribers for systems where our services are currently distributed, when we launch additional services or replace our competitors' services on existing customer cable and DBS platforms, and when our proportional buy rates improve relative to our competitors. Alternatively, our revenue could decline if we were to experience lower consumer buy rates as has been the case with the recent general economic downturn, if customers migrate to other forms of entertainment such as pay and free adult oriented internet sites, if the revenue splits we receive from our customers decline, if additional competitive channels are added to our customers' platforms or if our existing customers remove or replace our services on their platform.
Prior to fiscal year 2009, the Transactional TV segment focused on growing its distribution of content in the U.S. market. During fiscal year 2009, we began expanding our services into new international markets in North America, Europe and Latin America, and we generated approximately $1.0 million of revenue from this international distribution in fiscal year 2009. We continued to focus on growing our international distribution in fiscal year 2010 and improved international revenue to $3.6 million. Approximately 83% of our fiscal year 2010 international revenue was from VOD services, and the remaining proportion was from PPV services. We leverage our existing technology infrastructure to distribute content internationally. Our international VOD distribution resulted in minimal transport and sales staff costs, and our PPV channel distribution also resulted in minimal incremental costs because our existing transponder footprint reaches from north-central Canada to southern Mexico. As we continue to expand our international VOD services distribution footprint, we expect to incur minimal costs for this distribution including transport and sales staff costs. We expect the expansion of our international PPV channel services will require us to lease additional transponder space in order to obtain a broader international footprint for our channels. We believe the cost of leasing additional transponder space will increase our cost of sales; however, the cost will be relatively fixed in nature and will not vary relative to increases or decreases in the related revenue.
Transactional TV segment revenue during fiscal year 2010 as compared to the prior fiscal year experienced the following trends:
- •
- Our domestic VOD and PPV revenue declined, and we believe this is due to a reduction in consumer discretionary spending in response to the economic downturn. We believe consumers that have historically purchased our content with discretionary income have reduced or eliminated their acquisition of our content or are viewing adult content through less expensive alternatives such as pay and free internet websites in response to the economic downturn.
23
- •
- In November 2009, the largest DBS provider in the U.S. decreased their distribution of our channels from three channels to
two channels. The customer has the right to discontinue carriage of any of the remaining two channels without penalty and with little advance notice. The removal of the channel in November 2009
resulted in an estimated decline in our PPV revenue of between approximately $0.4 million and $0.5 million during the fourth quarter of fiscal year 2010 as compared to the same prior
year quarter. We expect that there will be a comparable decline in our PPV quarterly revenue in each of the first three quarters of fiscal year 2011 as compared to the same quarters in the prior
fiscal year as a result of the removal of the third channel.
- •
- Partially offsetting the decline in domestic revenue is incremental revenue from the expansion of our distribution into
international markets. As of March 31, 2010, we were distributing content to Canada, Latin America and Europe. We plan to continue to pursue opportunities to distribute our content to new
customers internationally and increase the quantity of content we distribute to existing international customers. We also expect to pursue distribution in new international regions in fiscal year 2011
such as Asia.
- •
- Our Transactional TV segment domestic revenue during the third and fourth quarters of fiscal year 2010 were relatively consistent with the results reported in the second quarter of fiscal year 2010 (excluding the impact from the loss of a PPV channel on the largest DBS platform in the U.S.). These results may be a leading indicator of the stabilization of the domestic revenue; however, we believe additional performance data is necessary to confirm this stabilization.
It is reasonably possible that difficult economic conditions will persist or worsen, which could cause our Transactional TV segment results to be materially adversely impacted. Our Transactional TV segment is reliant on discretionary consumer purchases of our content. When consumers spend less of their discretionary income on non-essential expenses such as our content, it adversely impacts our business. Additionally, the price point of our content is significantly higher than both mainstream content and adult content that is distributed through other less expensive and free media such as the internet. As a result, consumers that would otherwise purchase our content may opt to purchase less expensive mainstream content or obtain their adult entertainment through less expensive media such as pay and free internet. Although we believe that the deterioration in the economy has negatively impacted the Transactional TV segment's results, it is not possible for us to quantify or reasonably estimate the financial impact. We have remained focused on maintaining our competitive market position by offering a wide range of high-quality content that we believe is superior to other product offerings in the industry. We are currently in discussions with many of our largest customers to seek ways to encourage increased viewing of our content and to implement value-added offers in order for our content to be more competitive with alternative media.
When considering the future operating results of the Transactional TV segment, we believe the following challenges and risks could adversely impact the segment's future operating results:
- •
- declines in new and existing customer buys of adult TV services due to a migration to other lower cost or free adult media
services such as the internet;
- •
- adverse impacts to our business from a continued decline in discretionary consumer spending as a result of less favorable
economic conditions;
- •
- increased pressure from customers to reduce the revenue splits we receive or execute minimum guarantees or risk having
those customers remove one or more of our channels from their platform;
- •
- increased VOD competition from established adult entertainment companies or new entrants such as production studios and internet-based distributors because the barriers of entry for this product line are low;
24
- •
- challenges associated with our continued expansion into international markets and our inexperience with international
customers, buy rates, and consumer habits;
- •
- slowing growth of the overall adult entertainment category and limited incremental distribution opportunities within the
U.S.; and
- •
- continued product commoditization.
In addition to the above noted risks, our agreements typically allow our customers to make significant changes to our distribution (such as reduce the number of hours on the platform or remove one or more channels from the platform) and may be terminated on relatively short notice without penalty. If one or more of our cable MSO or DBS operators changes our distribution terms, terminates or does not renew our agreements, or does not renew the agreements on terms as favorable as those of our current agreements, our financial position and results of operations could be materially adversely affected.
All the above mentioned challenges and risks, and others that we may not have identified, could have a material adverse impact on our business. Nevertheless, we believe that we are well positioned to mitigate the impact of these risks and challenges. However, not all the risks and challenges can be managed by us because the ultimate outcome will be decided by other parties such as our customers.
During fiscal year 2011 and future periods, we believe that the Transactional TV segment will experience revenue growth if we can successfully manage and are not materially adversely impacted by the challenges and risks previously mentioned. We currently expect future growth in the segment to occur if we are successful with the following objectives:
- •
- continuing our international distribution expansion into new and existing geographic locations;
- •
- increasing the proportional VOD hours we receive on existing customer platforms;
- •
- replacing our competitors' PPV channels with our channels on both existing and new customer platforms;
- •
- transitioning cable MSO and DBS providers to less edited content standards;
- •
- improving the value proposition for customers such as including limited term internet access to our content for each PPV
or VOD purchase;
- •
- improving the VOD user interfaces; and
- •
- increasing the advertising revenue we receive from our PPV channels.
Film Production Segment
The Film Production segment has historically derived the majority of its revenue from two principal businesses: (1) the production and distribution of original motion pictures such as erotic thrillers, horror movies, and erotic, event styled content ("owned content"); and (2) the licensing of third party films in international and domestic markets where we act as a sales agent for the product ("repped content"). This segment also periodically provides contract film production services to certain major Hollywood studios ("producer-for-hire" arrangements).
We generate revenue by licensing our owned content for a one-time fee to free TV, premium TV and other domestic and international distributors. Additionally, we leveraged our existing customer relationships with our Transactional TV segment customers and license the Film Production segment's owned content to domestic and international cable MSO and DBS providers through revenue split arrangements that are structured in a similar manner to our Transactional TV segment agreements. The revenue splits we receive from cable MSO and DBS providers for the Film Production segment content are higher than the revenue splits we receive for our Transactional TV segment content
25
primarily due to the mainstream nature of the content. However, the retail price for our mainstream content is lower than our Transactional TV segment content, and our per-buy revenue per transaction is often the same as the Transactional TV segment.
We also generate repped revenue through sales agency arrangements whereby we earn a sales commission and marketing fees by selling mainstream titles on behalf of film producers. The Film Production segment has established relationships with independent mainstream filmmakers and represents these filmmakers' movies through its Lightning Entertainment Group. Beginning in late fiscal year 2009, we leveraged our existing Transactional TV segment customer relationships and began distributing repped content on VOD platforms through several domestic cable MSOs. We are also distributing repped content titles to domestic retail DVD markets through a distribution partner. Our distribution of repped content to VOD and retail DVD markets generated incremental sales agency commission revenue of approximately $0.4 million in fiscal year 2010, and we expect this revenue will improve in fiscal year 2011.
Our Film Production segment periodically acts as a contract film producer for major Hollywood studios. Through these producer-for-hire arrangements, we provide services and incur costs associated with the film production. Once the film has been delivered to the customer, we earn a fee for our services. Although we maintain no ownership rights for the produced content, we are responsible for the management and oversight of the production. We do not produce these movies unless we have an executed agreement with a customer. These services have historically generated between $2.0 million and $3.0 million of revenue with a gross margin of between 10% and 20%. However, our historical performance may not be representative of producer-for-hire performance in the future.
Film Production segment revenue during fiscal year 2010 as compared to the prior fiscal year experienced the following trends:
- •
- Owned content revenue declined primarily due to a $0.9 million decrease in revenue from premium cable channel
customers related to the delivery of episodic series. We recognized revenue in fiscal year 2010 from a premium cable channel customer for the remaining partial delivery of the third installment of an
episodic series, whereas in fiscal year 2009, we recognized the full revenue from the delivery of the second installment of an episodic series as well as revenue from the initial partial delivery of
the third installment of an episodic series. We completed the production of a fourth installment of an episodic series in fiscal year 2010 and expect to deliver and recognize revenue for this series
during the first half of fiscal year 2011. We expect the revenue from the fourth series will be between $1.7 million and $1.8 million, and we expect our total production costs for the
series will be $1.1 million. We also plan to continue to pursue these episodic productions in the future.
- •
- Repped content revenue improved due to our distribution of mainstream content to domestic VOD and retail DVD markets. Also
contributing to the increase was incremental revenue from the distribution of content to home video and VOD platforms through our arrangement with a mainstream film distributor. We expect the
mainstream repped content revenue will continue to improve as we expand our distribution of content to new customer VOD platforms and increase the amount of content we distribute on existing customer
VOD platforms.
- •
- Producer-for-hire and other revenue improved due to the completion of a producer-for-hire arrangement in the fourth quarter of fiscal year 2010, which generated $2.6 million in revenue and a profit margin percentage of approximately 19%. Revenue also improved due to the partial delivery of film titles associated with a second producer-for-hire arrangement in the fourth quarter of fiscal year 2010. The second producer for hire deal generated revenue of $1.3 million and a profit margin percentage of 14%, and we expect to recognize the remaining revenue of between approximately $0.7 million and $0.8 million in the first quarter of fiscal year 2011. We are also in the process of securing a new producer-for-hire arrangement scheduled for production in fiscal year 2011, and we currently estimate this production will generate approximately $3.3 million in additional producer-for-hire revenue in fiscal year 2011 and generate a profit margin of between 10% and 15%.
26
When considering the future operating results of the Film Production segment, we believe the following challenges and risks could adversely impact this segment's operating results:
- •
- the identification and execution of owned content deals with premium movie channels could become less frequent;
- •
- declines in new and existing customer VOD buys of our erotic owned content due to a migration to other lower cost or free
adult services such as the internet;
- •
- increased competition to our owned content from more explicit adult film offerings;
- •
- adverse impacts to our business from a continued depression or additional decline in discretionary consumer spending as a
result of less favorable economic conditions; and
- •
- we are making larger producer advances and incurring more significant costs for repped content films with larger production budgets and we may be unable to recover these advances and costs through the future sale of the films.
The impact of these challenges and risks, and others that we may not have identified, could have a material adverse impact on our business. Nevertheless, we believe that we are well positioned to mitigate the impact of these risks and challenges. However, not all the risks and challenges can be managed by us because the ultimate outcome will be decided by other parties such as our customers.
During fiscal year 2011 and in future periods, we will focus on improving the revenue we generate from this segment through the following strategic initiatives:
- •
- generating incremental mainstream repped content revenue by distributing higher quality titles with recognized actors and
actresses through domestic cable MSOs;
- •
- generating incremental mainstream repped content revenue by distributing higher quality titles through the DVD retail
market;
- •
- identifying other mainstream niche content, such as horror titles, for distribution through domestic cable MSOs and other
platforms;
- •
- expanding the quantity of owned episodic series content deals we execute with premium movie channels;
- •
- identifying new opportunities to provide producer-for-hire services to major Hollywood studios;
and
- •
- improving the buy rates of VOD owned content on cable MSO and DBS platforms through the same methods utilized by our Transactional TV segment.
During fiscal year 2009, the film markets were significantly impacted by the economic downturn. As a result, the Film Production segment's customers reduced their content acquisition budgets. We believe this occurred because our customers were relying upon their existing libraries to reduce spending and costs. These changes significantly impacted the Film Production segment operating results during the third quarter of fiscal year 2009 and as a result, we made material revisions to the segment's internal forecasts resulting in a $10.0 million goodwill impairment charge. We also recorded a film cost impairment charge of approximately $1.1 million during the third quarter of fiscal year 2009 as a result of the economic downturn. During fiscal year 2010, the Film Production segment results were consistent with our internal budgets excluding the impact of the goodwill and other impairment charges. However, industry conditions continue to be unfavorable in the film markets where we distribute content, and we believe these challenging conditions will continue for the foreseeable future. As a result, the five year internal forecast for the Film Production segment was revised downward in connection with our year end goodwill impairment testing resulting in a goodwill impairment charge of $4.9 million. We also recorded a film cost impairment charge of approximately $1.2 million and a
27
recoupable costs and producer advances impairment charge of approximately $0.8 million during fiscal year 2010 associated with the unfavorable film market conditions. It is reasonably possible that future unfavorable economic conditions could cause the operating results of this segment to remain depressed or decline.
Direct-to-Consumer Segment
Our Direct-to-Consumer segment generates revenue primarily by selling memberships to our adult consumer websites. During fiscal year 2010 and 2009, we experienced a decline in the Direct-to-Consumer segment revenue which we believe is due to a decline in consumer spending as a result of the unfavorable economic conditions as well as the availability of free and low-cost internet content. We expect this segment will continue to incur operating losses for the foreseeable future; however, we recently launched additional niche consumer websites during fiscal year 2010 as well as a dating website and are optimistic that these efforts will result in improved performance during fiscal year 2011.
The Direct-to-Consumer segment also operated an internet protocol television ("IPTV") set-top box business beginning in late fiscal year 2008. Customers of the IPTV set-top box product could obtain content directly through the internet and view the content on television. In the fourth quarter of fiscal year 2010, we discontinued the operations of the IPTV business model as a result of underperformance in fiscal year 2010. See Note 19—Discontinued Operations for further discussion on our discontinuation of the IPTV set-top box business.
Corporate Administration Segment
The Corporate Administration segment reflects all costs associated with the operation of the public holding company, New Frontier Media, Inc., that are not directly allocable to the Transactional TV, Film Production, or Direct-to-Consumer operating segments. These costs include, but are not limited to, legal expenses, accounting expenses, human resource department costs, insurance expenses, registration and filing fees with NASDAQ, executive employee costs, and costs associated with our public company filings and shareholder communications. Our focus for this operating segment is balancing cost containment with the need for administrative support for the growth of the Company.
CRITICAL ACCOUNTING POLICIES AND ESTIMATES
The consolidated financial statements have been prepared in accordance with accounting principles generally accepted in the United States. The methods, estimates, and judgments that the Company uses in applying the accounting policies have a significant impact on the results that the Company reports in its financial statements. Some of the accounting policies require the Company to make difficult and subjective judgments, often as a result of the need to make estimates regarding matters that are inherently uncertain. The Company bases its estimates and judgments on historical experience and on various other factors that it believes to be reasonable under the circumstances, the results of which form the basis for making judgments about the carrying values of assets and liabilities that are not readily apparent from other sources. Actual results may differ from these estimates under different assumptions or conditions. The Company continuously evaluates its methods, estimates and judgments. The Company believes the following critical accounting policies reflect the more significant judgments, estimates and considerations used in the preparation of its consolidated financial statements:
- •
- the recognition of revenue;
- •
- the recognition and measurement of income tax expenses, assets and liabilities (including the measurement of uncertain tax
positions and valuation of deferred tax assets);
- •
- the valuation of recoupable costs and producer advances;
28
- •
- the assessment of film costs and the forecast of anticipated revenue ("ultimate" revenue), which is used to amortize film
costs;
- •
- the amortization methodology and valuation of content and distribution rights;
- •
- the valuation of goodwill, intangible and other long-lived assets; and
- •
- the valuation and recognition of share-based compensation.
Each of these critical accounting policies is described in detail below.
Revenue Recognition
The Company's revenue consists primarily of fees earned through the distribution of its licensed and owned content through various media outlets including MSOs, DBS providers, the internet, premium movie channels, and other available media channels. Revenue also consists of fees earned through the licensing of third-party content whereby the Company acts as a sales agent for the film producer. Revenue is recognized when persuasive evidence of an arrangement exists as is typically evidenced through an executed contract, the services have been rendered or delivery conditions as described in the related contract for the completed film have been satisfied, the license period related to Film Production segment arrangements has begun and the customer can begin exploitation of the content, the fee is fixed or determinable and its collection is reasonably assured. The process involved in evaluating the appropriateness of revenue recognition involves judgment including estimating monthly revenue based on historical data and determining collectability of fees.
Transactional TV Segment VOD and PPV Services
The Transactional TV segment's VOD and PPV revenue are recognized based on buys and monthly subscriber counts reported each month by cable MSOs and DBS providers. The Company earns revenue through a contractual percentage split of the retail price of the content. The actual monthly sales information is not typically reported to the Transactional TV segment until approximately 30 - 90 days after the month of service. This practice requires management to make monthly revenue estimates based on the Transactional TV segment's historical experience with each customer. The revenue may be subsequently adjusted to reflect the actual amount earned upon receipt of the monthly sales reports.
Film Production Segment Owned Content Licensing
Revenue from the licensing of owned content is recognized when persuasive evidence of an arrangement exists as is typically evidenced through an executed contract, the delivery conditions of the completed film have been satisfied as required in the contract, the license period of the arrangement has begun, the fee is fixed or determinable and collection of the fees is reasonably assured. For agreements that involve the distribution of content to the home video market, PPV market and VOD market, the Company is unable to determine or reasonably estimate the revenue split earned from customers in advance of receiving the reported earnings because the performance materially varies by film and from period to period. As a result, the Company's share of licensing revenue from these arrangements is not recognized until the amounts are reported by the customers.
Film Production Segment Repped Content Licensing
The Company recognizes revenue from represented film licensing activities on a net basis as an agent. The revenue recognized for these transactions represents only the sales agency fee earned by the Company on the total content licensing fee. The producers' share of the licensing fee is recorded as a liability by the Company until the balance is remitted to the producer. For agreements that involve the distribution of repped content to the home video market, PPV market and VOD market, the Company
29
is unable to determine or reasonably estimate the revenue split due from customers in advance of receiving the reported earnings because the performance materially varies by film and from period to period. As a result, the Company's share of licensing revenue from these arrangements is not recognized until the amounts are reported by the customers.
The agreements entered into with the producers may also provide for a marketing fee that can be earned by the Company. The marketing fee is stated as a fixed amount and is contractually earned by the Company upon collection of sufficient film licensing fees as defined by the contract, the terms of which vary depending on film quality, distribution markets and other factors. The Company recognizes marketing fees as revenue when the amounts become determinable and the collection of the fee is reasonably assured, which typically occurs in the period of sufficient collection of licensing fees as defined by the respective contract.
Direct-to-Consumer Segment Membership Fees
Revenue from membership fees is recognized over the life of the membership. The Company records an allowance for refunds based on expected membership cancellations, credits and chargebacks.
Income Taxes
The Company makes certain estimates and judgments in determining its income tax provision expense. These estimates and judgments are used in the determination of tax credits, benefits and deductions, uncertain tax positions, and the calculation of certain tax assets and liabilities which are a result of differences in the timing of the recognition of revenue and expense for tax and financial statement purposes. The Company also uses estimates and judgments in determining interest and penalties on uncertain tax positions. Significant changes to these estimates could result in a material change to the Company's tax provision in subsequent periods.
The Company is required to evaluate the likelihood that it will be able to recover its deferred tax assets. If the Company's evaluation determines that the recovery is unlikely, it would increase the provision for taxes by recording a valuation allowance against the deferred tax assets equal to the amount that is not expected to be recoverable. The Company currently has a deferred tax asset valuation allowance of approximately $0.2 million to fully reserve for a deferred tax asset associated with the Company's discontinued set-top box operations in Europe. The Company has no other deferred tax asset valuation allowances and estimates that, with the exception of the set-top box European deferred tax assets, its deferred tax assets will be recoverable. If these estimates were to change and the Company's assessment indicated it would be unable to recover the deferred tax assets, the Company would be required to increase its income tax provision expense in the period of the change in estimate.
The calculation of the Company's tax liabilities involves dealing with uncertainties in the application of tax regulations. The Company accounts for uncertain tax positions using a two-step approach to recognizing and measuring uncertain tax position liabilities. The first step is to evaluate the tax position for recognition by determining if the weight of available evidence indicates that it is more likely than not that the position will be sustained on audit, including resolution of related appeals or litigation processes, if any. The second step is to measure the tax benefit as the largest amount that is more than 50% likely of being realized upon ultimate settlement. This process is based on various factors including, but not limited to, changes in facts and circumstances, changes in tax law, settlement of issues under audit, and new audit activity. Changes to these factors and the Company's estimates regarding these factors could result in the recognition of a tax benefit or an additional charge to the tax provision expense.
30
Recoupable Costs and Producer Advances
Recoupable costs and producer advances represent amounts paid by the Company that are expected to be subsequently recovered through the collection of fees associated with the Company's licensing of repped content. In connection with the Film Production segment's repped content operations, the Company enters into sales agency agreements whereby the Company acts as a sales agent for a producer's film ("Sales Agency Agreements"). These Sales Agency Agreements typically include provisions whereby certain costs that are incurred for promotion related activities will be paid by the Company on behalf of the producer (such as movie trailer and ad material costs). The Company may also pay the producer an advance for the related film prior to the distribution of such film. As the Company subsequently licenses the producer's film and license fees are collected, the recoupable costs and producer advances are recovered by the Company through these license fee collections. License fees typically are not paid to the producer of the related film until such recoupable costs and producer advances have been fully recovered by the Company.
The Company evaluates recoupable costs and producer advances for impairment on a quarterly basis based on estimates of future license fee collections. An impairment of these assets could occur if the Company's estimates indicated that it would be unable to collect fees from the licensing of a film sufficient to recover the related outstanding recoupable costs and producer advances. During each fiscal year ended March 31, 2010, 2009 and 2008, the Company incurred impairment charges related to recoupable costs and producer advances of approximately $0.8 million, $0.2 million, and $0.2 million, respectively. The impairment charges are recorded in the charge for restructuring and asset impairments other than goodwill line item within the consolidated statements of operations.
Film Costs
The Company capitalizes costs incurred for film production including costs to develop, acquire and produce films, which primarily consist of salaries, equipment and overhead costs, as well as the cost to acquire rights to films. Film costs include amounts for completed films and films still in development. Production overhead, a component of film costs, includes allocable costs of individuals or departments with exclusive or significant responsibility for the production of the films. Interest expense associated with film costs is not capitalized because the duration of productions is short-term in nature. Films are typically direct-to-television in nature. Film costs are stated at the lower of cost, less accumulated amortization, or fair value. Film costs are reviewed for impairment on a title-by-title basis each quarterly reporting period. The Company records an impairment charge when the fair value of the title is less than the unamortized cost. Examples of events or circumstances that could result in an impairment charge for film costs include (a) an unexpected less favorable performance of a film title or event on a MSO platform or (b) a downward adjustment in the estimated future performance of a film title or event due to an adverse change to the general business climate as was experienced during the third quarter of fiscal year 2009. Future adjustments associated with film cost valuations could have a material impact on the Company's financial position and results of operations in future periods.
Capitalized film costs are recognized as an expense within cost of sales using the film forecast method. Under this method, capitalized film costs are expensed based on the proportion of the film's revenue recognized for such period relative to the film's estimated remaining ultimate revenue, not to exceed ten years. Ultimate revenue is the estimated total revenue expected to be recognized over a film's useful life. Ultimate revenue for new film titles and events is typically estimated using actual historical performance of comparable films that are similar in nature (such as production cost and genre). Film revenue associated with this method includes amounts from all sources on an individual-film-forecast-computation method. Estimates of ultimate revenue are reviewed quarterly and adjusted if appropriate, and amortization is also adjusted on a prospective basis for such a change in estimate. Changes in estimated ultimate revenue could be due to a variety of factors, including the
31
proportional buy rates of the content as compared to competitive content as well as the level of market acceptance of the television product.
Content and Distribution Rights
The Transactional TV segments' content library primarily consists of licensed films. The Company capitalizes the costs associated with the licenses as well as certain editing and production costs and amortizes these capitalized costs on a straight-line basis over the term of the licensing agreement (generally 5 years). These costs should be amortized using a basis that is consistent with the manner in which the related film revenue is expected to be recognized. The Company amortizes the cost of content and distribution rights on a straight-line basis because each usage of the film is expected to generate similar revenue and the revenue for the films is expected to be recognized ratably over the related license term. The Company regularly reviews and evaluates the appropriateness of amortizing film costs on a straight-line basis as opposed to an alternative method of amortization such as an accelerated basis. Based on these analyses, the Company has determined that the amortization of the film library costs using a straight-line basis most accurately reflects the manner in which the revenue for the related films will be recognized.
The Company periodically reviews the content library and assesses whether the unamortized cost approximates the fair market value of the library based on expected forecast results. In the event that the unamortized costs exceed the fair market value of the film library, the Company will expense the excess of the unamortized costs to reduce the carrying value to the fair market value.
Goodwill, Intangible and Long-lived Assets
The Company records goodwill when the purchase price of an acquisition exceeds the estimated fair value of the net identified tangible and intangible assets acquired. Goodwill is tested for impairment at the operating segment level on an annual basis (March 31 for the Company) and between annual tests if an event occurs or circumstances change that would more likely than not reduce the fair value of a reporting unit below its carrying value. These events or circumstances could include, but are not limited to, a significant change in the business climate, legal factors, operating performance indicators, competition, or sale or disposition of a significant portion of a reporting unit. Application of the goodwill impairment test requires judgment in the determination of the fair value of each reporting unit. The fair value of each reporting unit is estimated using considerations of various valuation methodologies which could include income and market valuation approaches. The income approach involves discounting the reporting unit's projected free cash flow at its weighted average cost of capital, and the market approach considers comparable publicly traded company valuations and recent merger and acquisition valuations. The analysis requires significant judgments, including estimation of future cash flows, which is dependent on internal forecasts; estimation of the long-term rate of growth; determination of the weighted average cost of capital; and other similar estimates. Changes in these estimates and assumptions could materially affect the determination of fair value for each reporting unit. The Company allocates goodwill to each operating segment based on the operating segment expected to benefit from the related acquisition and/or combination.
As an overall test of the reasonableness of the estimated fair value of the reporting segments and consolidated Company, a reconciliation of the fair value estimates for the reporting segments to the Company's market capitalization was performed as of March 31, 2010. The reconciliation considered a reasonable control premium based on merger and acquisition transactions within the media and entertainment industry and other available information. A control premium is the amount that a buyer is willing to pay over the current market price of a company as indicated by the traded price per share (i.e. market capitalization), in order to acquire a controlling interest. The premium is justified by the expected synergies, such as the expected increase in cash flow resulting from cost savings and revenue enhancements.
32
Other identifiable intangible assets subject to amortization primarily include amounts paid to acquire non-compete agreements with certain key executives, contractual and non-contractual customer relationships, intellectual property rights, patents and websites. These costs are capitalized and amortized on a straight-line basis over their estimated useful lives which is typically five years. Intangible asset balances are removed from the gross asset and accumulated amortization amounts in the period in which they become fully amortized or impaired and are no longer in use.
The Company continually reviews long-lived assets that are held and used and identifiable intangible assets that are subject to amortization for possible impairment whenever events or changes in circumstances indicate that the carrying amount of an asset may not be recoverable. In evaluating the fair value and future benefits of such assets, the Company considers whether the estimated undiscounted future net cash flows of the individual assets is less than the related assets' carrying value and if so, the Company records an impairment loss for the excess recorded carrying value of the asset as compared to its fair value.
Employee Equity Incentive Plans
The Company has an employee equity incentive plan, which is described more fully in Note 3—Employee Equity Incentive Plans. Employee equity awards are accounted for under the fair value method. Accordingly, the Company measures share-based compensation at the grant date based on the fair value of the award. The Company uses the straight-line attribution method to recognize the fair value of the award over the related service period.
The Company uses the Black-Scholes option pricing model to estimate the fair value of options granted. Volatility assumptions are derived using historical volatility data. The expected term data was stratified between officers and non-officers and determined using the weighted average exercise behavior for these two groups of employees. The dividend yield assumption is based on dividends declared by the Company's Board of Directors and estimates of dividends to be declared in the future. Share-based compensation expense is based on awards ultimately expected to vest, reduced for estimated forfeitures. Forfeitures are estimated at the time of grant and revised, if necessary, in subsequent periods if actual forfeitures differ from those estimates. Forfeitures were estimated based on historical experience and are stratified between officers and non-officers.
33
RESULTS OF OPERATIONS
Transactional TV Segment
The following table sets forth certain financial information for the Transactional TV segment for each of the three fiscal years presented (amounts may not sum due to rounding):
| |
(In millions) Year Ended March 31, |
Percent Change | |||||||||||||||
|---|---|---|---|---|---|---|---|---|---|---|---|---|---|---|---|---|---|
| |
2010 | 2009 | 2008 | '10 vs '09 | '09 vs '08 | ||||||||||||
Net revenue |
|||||||||||||||||
VOD |
$ | 20.4 | $ | 22.2 | $ | 18.9 | (8 | )% | 17 | % | |||||||
PPV |
16.1 | 19.5 | 20.8 | (17 | )% | (6 | )% | ||||||||||
Other revenue |
0.8 | 0.8 | 1.3 | 0 | % | (38 | )% | ||||||||||
Total |
37.4 | 42.6 | 41.0 | (12 | )% | 4 | % | ||||||||||
Cost of sales |
11.9 | 11.5 | 11.0 | 3 | % | 5 | % | ||||||||||
Gross profit |
25.5 | 31.1 | 30.0 | (18 | )% | 4 | % | ||||||||||
Gross profit % |
68 | % | 73 | % | 73 | % | |||||||||||
Operating expenses |
10.3 | 9.5 | 8.6 | 8 | % | 10 | % | ||||||||||
Operating income |
$ | 15.1 | $ | 21.6 | $ | 21.4 | (30 | )% | 1 | % | |||||||
Net Revenue
VOD
The decline in VOD revenue during fiscal year 2010 as compared to fiscal year 2009 was due to a reduction in revenue from several of the largest cable MSOs in the U.S. We believe the decline is due to a reduction in discretionary consumer spending in response to the economic downturn. We believe consumers that have historically purchased our content with discretionary income have reduced or eliminated their acquisition of our content or are viewing adult content through less expensive or free alternatives such as pay and free internet websites in response to the economic downturn. The decline in revenue was also due to a settlement of paid and unpaid historical amounts with a domestic MSO customer in fiscal year 2009 that resulted in $0.9 million of additional revenue as further discussed below, and no similar settlement occurred in fiscal year 2010. Partially offsetting the decline in revenue was (a) a $2.1 million increase in revenue primarily associated with new international VOD distribution, (b) a $0.6 million increase in domestic VOD revenue associated with distribution to a new cable MSO customer in the eastern U.S., and (c) a $0.4 million increase in revenue from domestic telecommunication companies associated with their growth in subscribers.
Revenue increased in fiscal year 2009 as compared to fiscal year 2008 due to (a) a $1.2 million increase in revenue from the largest MSO in the U.S. due to our improved content performance and from a related increase in the quantity of content available on the platform, (b) an increase in revenue from performance improvement on several of the other top ten largest cable MSOs in the U.S. related to new content packages and recommended changes to our customers' menu positioning, and (c) $0.9 million of incremental international revenue. The fiscal year 2009 results also included approximately $0.9 million in additional revenue associated with settling paid and unpaid historical amounts with a domestic MSO customer. Based on a joint research analysis with the MSO customer, we entered into an arrangement and agreed that any historical billings and payments were resolved resulting in the completion of the earning process and settlement of the $0.9 million in revenue. We also made recommendations to the related MSO regarding process changes to prevent similar future issues, and we believe the issues that gave rise to the adjustment are isolated to the related MSO. The increases in revenue were partially offset by a $0.7 million decline in revenue from the second largest
34
cable MSO in the U.S. because the operator increased the retail price of content during fiscal year 2009 and since the economic downturn, we believe consumers are less willing to purchase content at the higher retail price.
PPV
Revenue from our PPV distribution declined during fiscal year 2010 as compared to fiscal year 2009 primarily due to a decrease in revenue from the two largest DBS providers and other top ten cable MSOs in the U.S., which we believe to be primarily associated with the general economic downturn and related reduction in discretionary consumer spending. Revenue also declined by approximately $0.6 million due to our loss of a third channel on the largest DBS provider in the U.S., which is discussed in more detail below. The decline in revenue was partially offset by a $0.6 million increase in revenue associated with our international expansion into markets primarily in Latin America.
In November 2009, the largest DBS provider in the U.S. decreased their distribution of our channels from three channels to two channels. The customer has the right to discontinue carriage of any of the remaining two channels without penalty and with little advance notice. The removal of the channel in November 2009 resulted in an estimated decline in our PPV revenue of between $0.4 million and $0.5 million during the fourth quarter of fiscal year 2010, which was the first full quarter impact of the removal of the third channel. We expect that there will be a materially comparable decline in our PPV quarterly revenue in each of the first three quarters of fiscal year 2011 as compared to the same quarters in the prior fiscal year as a result of the removal of the third channel.
The decline in PPV revenue during fiscal year 2009 as compared to fiscal year 2008 was primarily due to a $1.7 million reduction in revenue from the second largest DBS provider in the U.S. due to an increase in the number of competitors on the platform and a reduction in consumer spending related to the economic downturn. Also contributing to the decline was lower revenue from several of the other top ten largest cable MSOs in the U.S. due to the economic downturn. We believe consumers that historically purchased our content with discretionary income reduced or eliminated their acquisition of our content or are viewing adult content through less expensive or free alternatives such as the internet in response to the economic downturn. Partially offsetting the revenue decline was an increase in revenue of approximately $0.9 million from the addition of a new channel on the largest DBS platform in the U.S.
Other Revenue
Other revenue primarily includes revenue from advertising on our PPV channels and from content distribution services. Other revenue in fiscal year 2010 was consistent with fiscal year 2009. The decline in other revenue in fiscal year 2009 as compared to fiscal year 2008 was from lower C-Band revenue because we ceased offering these services during the third quarter of fiscal year 2008. We did not incur any material costs associated with removing this service offering.
Cost of Sales
Our cost of sales primarily consists of expenses associated with our Digital Broadcast Center, satellite uplinking, satellite transponder leases, programming acquisitions, VOD transport, amortization of content, depreciation of equipment, and related employee costs.
Cost of sales increased during fiscal year 2010 as compared to fiscal year 2009 primarily due to (a) a $0.1 million increase in transport costs to support the increase in VOD distribution, (b) a $0.2 million increase in transponder and uplink costs to support additional PPV channel offerings, and (c) a $0.2 million increase in content and distribution amortization expense associated with licensing higher quality content to attract additional consumer purchases.
35
Cost of sales increased during fiscal year 2009 as compared to fiscal year 2008 due to (a) a $0.5 million increase in transport costs to support the increase in U.S. VOD distribution, (b) a $0.4 million increase in transponder costs to support additional PPV channel offerings, and (c) a $0.3 million increase in content and distribution amortization expense associated with licensing higher quality content to attract additional customer purchases. The increase in cost of sales was partially offset by a $0.5 million decline in costs related to the termination of the C-Band services and a reduction in employee expenses from cost reduction efforts.
Operating Expenses and Operating Income
Operating expenses increased during fiscal year 2010 as compared to fiscal year 2009 primarily due to (a) a $0.4 million increase in consulting fees primarily associated with new business development, and (b) a $0.4 million increase in advertising and promotion costs incurred in an effort to improve domestic revenue. Operating income for fiscal year 2010 was $15.1 million as compared to $21.6 million for fiscal year 2009.
The increase in operating expenses during fiscal year 2009 as compared to fiscal year 2008 was due to higher advertising and promotion costs of approximately $1.1 million which were incurred in connection with efforts to increase domestic revenue. This increase in costs was partially offset by a $0.3 million reduction in expenses associated with equipment and tenant improvement disposition and impairment charges that were incurred in the prior fiscal year but did not recur in fiscal year 2009. Operating income for the fiscal years 2009 and 2008 was $21.6 million and $21.4 million, respectively.
Film Production Segment
The following table sets forth certain financial information for the Film Production segment for each of the three fiscal years presented (amounts in table may not sum due to rounding):
| |
(In millions) Year Ended March 31, |
Percent Change | |||||||||||||||
|---|---|---|---|---|---|---|---|---|---|---|---|---|---|---|---|---|---|
| |
2010(1) | 2009(2) | 2008(3) | '10 vs '09 | '09 vs '08 | ||||||||||||
Net revenue |
|||||||||||||||||
Owned content |
$ | 5.5 | $ | 6.7 | $ | 8.1 | (18 | )% | (17 | )% | |||||||
Repped content |
2.2 | 1.3 | 2.0 | 69 | % | (35 | )% | ||||||||||
Producer-for-hire and other revenue |
4.3 | 0.5 | 2.9 | # | (83 | )% | |||||||||||
Total |
12.0 | 8.6 | 13.1 | 40 | % | (34 | )% | ||||||||||
Cost of sales |
6.6 | 3.6 | 5.9 | 83 | % | (39 | )% | ||||||||||
Gross profit |
5.4 | 5.0 | 7.2 | 8 | % | (31 | )% | ||||||||||
Gross profit % |
45 | % | 58 | % | 55 | % | |||||||||||
Operating expenses |
10.9 | 15.9 | 5.0 | (31 | )% | # | |||||||||||
Operating income (loss) |
$ | (5.4 | ) | $ | (10.9 | ) | $ | 2.2 | 50 | % | # | ||||||
- (1)
- The
fiscal year 2010 operating expenses include a $4.9 million goodwill impairment charge, a $1.2 million film cost impairment charge, and a
$0.8 million recoupable costs and producer advances impairment charge. These items are discussed in more detail below.
- (2)
- The fiscal year 2009 operating expenses include a $10.0 million goodwill impairment charge and a $1.1 million film cost impairment charge. These items are discussed in more detail below.
36
- (3)
- The
fiscal year 2008 operating expenses include a $0.7 million film cost impairment charge and a net $0.2 million reversal of
earn-out accrual expenses. These items are discussed in more detail below.
- #
- Represents an increase or decrease in excess of 100%.
Net Revenue
Owned Content
Owned content revenue declined during fiscal year 2010 as compared to fiscal year 2009 primarily due to a $0.9 million decline in revenue from premium cable channel customers related to the delivery of episodic series. We recognized revenue in fiscal year 2010 from a premium cable channel customer for the remaining partial delivery of the third installment of an episodic series, whereas in fiscal year 2009, we recognized the full revenue from the delivery of the second installment of an episodic series as well as revenue from the initial partial delivery of the third installment of an episodic series. We also completed the production of a fourth installment of an episodic series in fiscal year 2010 and expect to deliver and recognize revenue of between $1.7 million and $1.8 million for this series during the first half of fiscal year 2011, and we expect our total production costs for this series will be approximately $1.1 million. Also contributing to the decline in revenue in fiscal year 2010 was lower revenue from the second largest DBS provider in the U.S. because fewer owned content titles were distributed on that platform in fiscal year 2010 as compared to the prior fiscal year.
The revenue decline in fiscal year 2009 as compared to fiscal year 2008 is due to (a) a $0.7 million decline in revenue from a large PPV aggregator that no longer distributes our content, (b) a $0.4 million decline in revenue from the largest DBS provider in the U.S. because our content was moved to a more competitive location within that provider's electronic programming guide, (c) a $0.4 million decline in certain horror film revenue generated through an arrangement with a mainstream film distributor due to less favorable film performance, and (d) a general decline in revenue believed to be due to unfavorable economic conditions in the film markets during the second half of fiscal year 2009. We believe the unfavorable economic conditions caused potential customers to reduce or eliminate acquisitions of our content in an effort to reduce spending which resulted in the execution of fewer owned content deals. The decline in owned content revenue was partially offset by a $0.5 million increase in revenue from new VOD distribution on U.S. cable platforms.
Repped Content
Repped content revenue includes revenue from the licensing of film titles that we represent (but do not own) under domestic and international sales agency relationships with various film producers.
The increase in revenue in fiscal year 2010 as compared to fiscal year 2009 was primarily due to (a) a $0.4 million increase in revenue from the new distribution of repped content on domestic VOD platforms and through retail DVD markets, and (b) a $0.2 million increase in revenue from the distribution of content to home video and VOD platforms through our arrangements with mainstream film distributors. We also believe that our ability to represent and distribute mainstream film titles with widely recognized actors and actresses has contributed to the improvement in repped content revenue as compared to the prior fiscal year.
The decline in repped content revenue during fiscal year 2009 as compared to fiscal year 2008 was believed to be due to the impact of unfavorable economic conditions on the independent film market consistent with the conditions described above within the owned content revenue discussion.
37
Producer-for-hire and Other Revenue
Producer-for-hire and other revenue relates to amounts earned through producer-for-hire arrangements, music royalty fees and the delivery of other miscellaneous film materials to distributors. Approximately $2.6 million of the increase in revenue during fiscal year 2010 as compared to fiscal year 2009 is due to our completion of a producer-for-hire arrangement with a major Hollywood studio in fiscal year 2010. We also recognized approximately $1.3 million of revenue associated with the initial delivery of films from a second producer-for-hire arrangement. We expect to recognize between approximately $0.7 million and $0.8 million of revenue in the first quarter of fiscal year 2011 associated with the remaining delivery of films from the second producer-for-hire arrangement.
Producer-for-hire and other revenue declined in fiscal year 2009 as compared to fiscal year 2008 because we did not generate revenue from a producer-for-hire arrangement during fiscal year 2009 whereas in fiscal year 2008, we recognized approximately $2.5 million of revenue from a producer-for-hire arrangement.
Cost of Sales
Our cost of sales is primarily comprised of the amortization of our owned content film costs as well as delivery and distribution costs related to that content. These expenses also include the costs we incur to provide producer-for-hire services. There is no significant cost of sales related to the repped content services.
Cost of sales increased during fiscal year 2010 as compared to fiscal year 2009 due to $3.2 million of producer-for-hire costs associated with the completion of a producer-for-hire arrangement and the partial delivery of films related to a second producer-for-hire arrangement. The increase in costs was partially offset by a decline in film cost amortization consistent with the decline in owned content revenue. Film cost amortization as a percentage of the related owned content revenue during fiscal year 2010 was 47% as compared to 39% during fiscal year 2009. Film cost amortization as a percentage of owned content revenue has increased because the prior year periods included a larger proportion of revenue from older titles whose film costs had been fully amortized.
The decline in cost of sales during fiscal year 2009 as compared to the prior fiscal year was primarily due to (a) a $2.1 million decline in costs related to a producer-for-hire deal that occurred during the prior fiscal year but no similar producer-for-hire deals recurred during fiscal year 2009, and (b) a decline in film cost amortization related to the decline in owned content revenue. Film cost amortization as a percentage of the related owned content revenue during fiscal years 2009 and 2008 was 39% and 34%, respectively.
Operating Expenses and Operating Income (Loss)
Operating expenses declined during fiscal year 2010 as compared to fiscal year 2009 primarily because the fiscal year 2009 results included a $10.0 million non-cash goodwill impairment charge and a $1.1 million non-cash film cost impairment charge whereas the fiscal year 2010 results included a $4.9 million non-cash goodwill impairment charge and a $1.2 million non-cash film cost impairment charge. These impairment charges are discussed in additional detail below. Operating expenses in fiscal year 2010 also included approximately $0.8 million of recoupable costs and producer advances impairment charges because we do not believe the amounts can be recovered through future sales of the related repped content. Operating expenses declined in fiscal year 2010 by approximately $0.4 million due to a reduction in tradeshow and travel costs associated with efforts to further reduce expenses in response to the economic downturn. Operating loss for fiscal year 2010 was $5.4 million as compared to $10.9 million in fiscal year 2009.
38
Operating expenses increased during fiscal year 2009 as compared to fiscal year 2008 due to (a) a $10.0 million non-cash goodwill impairment charge, and (b) a $1.1 million non-cash impairment charge for certain owned content film costs. The prior fiscal year 2008 operating expense results included a $0.7 million non-cash film cost impairment charge which was partially offset by the reversal of $0.2 million in net earn-out accrual expenses that had been previously accrued but were reversed because the former principals of MRG did not achieve the required performance targets. The Film Production segment's operating loss was $10.9 million for fiscal year 2009 as compared to operating income of $2.2 million for fiscal year 2008.
Goodwill Impairment Charge
Throughout fiscal year 2010, the Company did not identify any indications of goodwill impairment within the Film Production segment, and the results of the segment in fiscal year 2010 were consistent with the Company's internal forecast excluding the goodwill and other impairment charges. As part of our year end procedures, we performed a goodwill impairment analysis as of March 31, 2010. We engaged an independent firm to assist us in performing the impairment test. The income and market valuation approaches were considered in determining the estimated fair value of the Film Production segment. Using these methods, we determined that the estimated fair value of the Film Production segment was less than its carrying value as of March 31, 2010. We then performed additional analysis to estimate the implied fair value of goodwill. We determined the implied fair value of the goodwill by first allocating the estimated fair value of the Film Production segment to the tangible and identifiable intangible assets and liabilities of the operating segment. The excess of the estimated fair value over the amounts assigned to the assets and liabilities is the implied fair value of goodwill. Based on this analysis, we recorded a goodwill impairment charge in the fourth quarter of fiscal year 2010 of $4.9 million to reduce the Film Production segment's goodwill from $4.9 million to the implied fair value of goodwill of zero. Although the fiscal year 2010 performance of the Film Production segment was consistent with our internal forecasts (excluding the impact of impairment charges), conditions within the film markets continue to be challenging. Based on our historical and current experience within the film production markets and in connection with our year end annual goodwill impairment test, we modified our five year forecast for the Film Production segment downward to reflect our estimate that film market conditions will remain depressed and decline further. As a result of our downward adjustment to the five year forecast, we incurred a goodwill impairment charge in fiscal year 2010. See additional discussion at the Fiscal Year 2010 Goodwill Impairment Testing section below.
During the third quarter of fiscal year 2009, we determined that continued adverse changes in the business climate and material revisions to the Film Production segment's internal three year forecasts based on lower than expected revenue for the third quarter of fiscal year 2009 were events that could indicate that the fair value of the reporting unit was less than its carrying amount. We therefore engaged an independent firm to assist us in performing an impairment test. The income and market valuation approaches were considered in determining the estimated fair value of the Film Production segment. Using these methods, we determined that the estimated fair value of the Film Production segment was less than its carrying value at December 31, 2008. We then performed additional analysis to estimate the implied fair value of goodwill. Based on this analysis, we recorded a goodwill impairment charge during the third quarter of fiscal year 2009 of $10.0 million to reduce the Film Production segment's goodwill from $14.9 million to the implied fair value of goodwill of $4.9 million.
Film Cost Impairment Charge
During the fourth quarter of fiscal year 2010, we recorded a non-cash impairment expense of approximately $1.2 million associated with several Film Production segment owned content films and events. As part of our quarterly film performance analysis and in connection with our annual goodwill impairment analysis, we estimated that conditions within the film markets would continue to be
39
challenging and adjusted downward the Film Production segment's forecasts as well as certain estimated future film and event performance. As a result of the downward adjustment to certain estimated future film and event performance, we recorded an impairment charge of approximately $1.2 million representing the difference in the unamortized film costs and the estimated fair value of the related films and events. This difference was recorded as an asset impairment charge within the Film Production segment's operating expenses. The fair value of the films and events was estimated by discounting the film or event's projected cash flow by the weighted average cost of capital.
During the third quarter of fiscal year 2009, we recorded a non-cash impairment expense of approximately $1.1 million associated with several Film Production segment owned content films and events. During that quarter and as part of our process to continually assess the expected performance of owned content, we determined that downward adjustments to the estimated performance of the films and events should be recorded as a result of adverse changes to the business climate as discussed above. As a result, we recorded an impairment charge of approximately $1.1 million representing the difference in the unamortized film costs and the estimated fair value of the films and events. This difference was recorded as an asset impairment charge within the Film Production segment's operating expenses. The fair value of the films and events was estimated by discounting the film or event's projected cash flow by the weighted average cost of capital.
During the third quarter of fiscal year 2008, we recorded a non-cash impairment expense of approximately $0.7 million associated with several Film Production segment owned content films and events. The films and events were originally valued when we acquired the Film Production segment in 2006. During the quarter ended December 31, 2007, we obtained initial revenue data that indicated the actual performance of the films and events would not meet the original estimates that were established when we acquired the Film Production segment. As a result, we lowered our estimate of the expected future benefits to be derived from these films and events and recorded an impairment charge of approximately $0.7 million representing the difference in the unamortized film costs and the estimated fair value of the films and events. The fair value of the films and events was estimated by discounting the film or event's projected cash flow by the weighted average cost of capital.
Direct-to-Consumer Segment
The following table sets forth certain financial information for the Direct-to-Consumer segment for each of the three fiscal years presented (amounts in table may not sum due to rounding):
| |
(In millions) Year Ended March 31, |
Percent Change | |||||||||||||||
|---|---|---|---|---|---|---|---|---|---|---|---|---|---|---|---|---|---|
| |
2010 | 2009 | 2008 | '10 vs '09 | '09 vs '08 | ||||||||||||
Net revenue |
|||||||||||||||||
Net membership |
$ | 0.9 | $ | 1.2 | $ | 1.4 | (25 | )% | (14 | )% | |||||||
Other revenue |
0.1 | 0.2 | 0.4 | (50 | )% | (50 | )% | ||||||||||
Total |
1.0 | 1.5 | 1.8 | (33 | )% | (17 | )% | ||||||||||
Cost of sales |
1.4 | 0.9 | 0.8 | 56 | % | 13 | % | ||||||||||
Gross profit (loss) |
(0.3 | ) | 0.5 | 1.0 | # | (50 | )% | ||||||||||
Gross profit % |
^ | 33 | % | 56 | % | ||||||||||||
Operating expenses |
0.6 | 0.9 | 1.0 | (33 | )% | (10 | )% | ||||||||||
Operating income (loss) |
$ | (0.9 | ) | $ | (0.3 | ) | $ | 0.1 | # | # | |||||||
- #
- Represents
an increase or decrease in excess of 100%.
- ^
- Information is not meaningful.
40
Net Revenue
Net Membership
We believe the decline in net membership revenue during fiscal year 2010 as compared to fiscal year 2009 was primarily due to the economic downturn and a related reduction in consumer spending. Net membership revenue during fiscal year 2009 was consistent with fiscal year 2008.
Other Revenue
Other revenue primarily relates to the sale of content to other webmasters and wireless platforms. Other revenue in fiscal year 2010 was generally consistent with fiscal year 2009. We believe other revenue declined during fiscal year 2009 as compared to fiscal year 2008 as a result of the general economic downturn and a related reduction in spending by our customers.
Cost of Sales
Cost of sales consists of expenses associated with credit card processing, bandwidth, traffic acquisition, content amortization, depreciation of equipment, and related employee costs.
The increase in cost of sales during fiscal year 2010 as compared to fiscal year 2009 was primarily due to additional employee costs incurred in an effort to improve our website membership revenue. Cost of sales in fiscal year 2009 as compared to fiscal year 2008 was relatively flat.
Operating Expenses and Operating Income (Loss)
Operating expenses declined during fiscal year 2010 as compared to fiscal year 2009 primarily as a result of a $0.3 million reduction in website maintenance fees. Operating expenses were also lower because the fiscal year 2009 results included a $0.2 million settlement expense associated with a vendor and no similar expenses were incurred in fiscal year 2010. The decline in operating expenses was partially offset by a $0.3 million intangible asset impairment charge discussed in further detail below. The Direct-to-Consumer segment incurred an operating loss of $0.9 million in fiscal year 2010 as compared to an operating loss of $0.3 million in fiscal year 2009.
Operating expenses in fiscal year 2009 were relatively flat as compared to fiscal year 2008, and the Direct-to-Consumer segment incurred an operating loss of $0.3 million in fiscal year 2009 as compared to operating income of $0.1 million in fiscal year 2008.
Intangible Assets Impairment Charge
During the fourth quarter of fiscal year 2010, we determined that certain internally developed websites and related software used to manage our consumer websites no longer met our quality standards. Additionally, the software did not provide sufficient support or functionality for content management, database interface, consumer facing websites, or accumulation or reporting of website traffic. As a result, we ceased using the websites and software, and we determined the websites and software would not provide us with service potential in the future. As a result, we recorded an impairment charge of $0.3 million to reduce the fair value of the websites and related software to zero.
41
Corporate Administration
The following table sets forth certain financial information for the Corporate Administration segment for each of the three fiscal years presented:
| |
(In millions) Year Ended March 31, |
Percent Change | ||||||||||||||
|---|---|---|---|---|---|---|---|---|---|---|---|---|---|---|---|---|
| |
2010 | 2009 | 2008 | '10 vs '09 | '09 vs '08 | |||||||||||
Operating expenses |
$ | 8.8 | $ | 9.9 | $ | 10.4 | (11 | )% | (5 | )% | ||||||
Expenses related to the Corporate Administration segment include all costs associated with the operation of the public holding company, New Frontier Media, Inc., that are not directly allocable to the Transactional TV, Film Production, or Direct-to-Consumer operating segments. These costs include, but are not limited to, legal expenses, accounting expenses, human resource department costs, insurance expenses, registration and filing fees with NASDAQ, executive employee costs, and costs associated with our public company filings and shareholder communications. Our focus for this operating segment is balancing cost containment with the need for administrative support for the growth of the Company.
Corporate administration expenses declined in fiscal year 2010 as compared to fiscal year 2009 primarily due to (a) a $0.7 million decline in audit, accounting and related third-party advisor fees from ongoing cost reduction efforts, (b) a $0.1 million decline in external legal fees, and (c) a $0.1 million decline in tradeshow and travel costs. Operating expenses also declined as a result of our efforts to renegotiate our contracts with vendors in order to obtain more favorable fee structures.
Corporate administration expenses were lower in fiscal year 2009 as compared to fiscal year 2008 primarily due to a $0.5 million decline in employee costs primarily related to a reduction in executive bonus accruals and from lower legal and human resource costs of $0.2 million related to organizational improvements. The reduction in costs was partially offset by an increase in third party advisor fees of approximately $0.1 million and higher stock option expenses from grants that occurred during the first quarter of fiscal year 2009.
Fiscal Year 2010 Goodwill Impairment Testing
Goodwill impairment testing requires us to use judgment in determining assumptions for the analysis. We performed annual goodwill impairment tests for the Transactional TV and Film Production segments at March 31, 2010. The market and income valuation approaches were considered in determining the estimated fair value of the segments. The market valuation approach requires us to estimate and consider market multiples for companies considered to be comparable to ours. There is a lack of comparable public companies to consider for the market valuation approach; however, we believe the comparable companies considered are reasonably similar to our operations. The income valuation approach requires us to consider the projected operating results and cash flows of the segments discounted by a risk adjusted discount rate. The projected results include estimates of revenue, cost of sales, operating expenses, content acquisitions, capital expenditures and other related cash flows and activities over a five year future period. For the Transactional TV segment, the market valuation approach was more heavily weighted than the income approach because (a) the overall Company valuation is believed to be primarily based on the performance and results of the Transactional TV segment, and (b) the results of the Transactional TV segment represent the large majority of the Company's overall activity. For the Film Production segment, the valuation methodologies were weighted equally.
The Company assumed an average annual growth (decline) rate of 10.6% and (1.7)% for the Transactional TV and Film Production segments, respectively, based on both company-specific and general economic risk. The Company used a weighted average cost of capital of 28% and 25% for the
42
risk adjusted discount rates for the Transactional TV and Film Production segments, respectively. The weighted average cost of capital was determined by considering comparable companies and their cost of equity, cost of debt, capital structure and other specific risk factors. The fair value of the Transactional TV segment exceeded the carrying value by approximately 46%, and the fair value of the Film Production segment was less than the carrying value by approximately 30%. A 1% change in the growth rate would cause the percentage by which the Transactional TV segment's fair value exceeded the carrying value to change by approximately 300 basis points, and the percentage by which the Film Production segment's fair value was less than the carrying value to change by approximately 200 basis points. A 1% change in the weighted average cost of capital would cause the percentage by which the Transactional TV segment's fair value exceeded the carrying value to change by approximately 200 basis points, and the percentage by which the Film Production segment's fair value was less than the carrying value to change by approximately 100 basis points.
Due to the continued pressure on the Company's stock price during fiscal year 2010, the Company's market capitalization was less than its shareholders' equity balance at March 31, 2010. As an overall test of the reasonableness of the estimated fair value of the reporting segments and consolidated Company, a reconciliation of the fair value estimates for the reporting segments to the Company's market capitalization was also performed as of March 31, 2010. The reconciliation reflected an implied control premium of 55%, which is reflective of historical merger and acquisition transactions involving comparable companies as well as other relevant information. Based on the reconciliation, the Company's fair value was in excess of its shareholders' equity balance by approximately 18% and there was no indicator of additional goodwill impairment. A 1% change in the control premium would cause the percentage by which the fair value exceeded the shareholders' equity balance to change by approximately 100 basis points.
Other Income (Expense) and Provision for Income Taxes
Other Income (Expense)
The following table sets forth certain financial information for other income (expense) for each of the three fiscal years presented:
| |
(In millions) Year Ended March 31, |
Percent Change | ||||||||||||||
|---|---|---|---|---|---|---|---|---|---|---|---|---|---|---|---|---|
| |
2010 | 2009 | 2008 | '10 vs '09 | '09 vs '08 | |||||||||||
Other income (expense) |
$ | (0.2 | ) | $ | 0.4 | $ | 0.7 | # | (43 | )% | ||||||
- #
- Represents an increase or decrease in excess of 100%.
Amounts included in other income (expense) primarily relate to interest expense on our line of credit borrowings; interest expense on our uncertain tax positions; and interest income from our cash, cash equivalents and investments.
The change in other income (expense) in fiscal year 2010 as compared to fiscal year 2009 is primarily because the fiscal year 2009 results included the reversal of approximately $0.4 million of interest expense associated with the reversal of uncertain tax position liabilities due to the expiration of the statute of limitations. There was no similar reversal of interest expense during fiscal year 2010. Also contributing to the change was an increase in interest expense in fiscal year 2010 associated with an outstanding line of credit balance throughout the fiscal year. We had no outstanding line of credit balance until the third quarter of fiscal year 2009.
The decline in other income (expense) in fiscal year 2009 as compared to fiscal year 2008 was primarily due to a decline in interest income associated with a decline in investments balances as well as interest rates as compared to fiscal year 2008. The investments were redeemed and used to pay
43
dividends and repurchase stock in fiscal year 2008. Also contributing to the decline was an increase in interest expense associated with an outstanding line of credit balance during the second half of fiscal year 2009.
Provision for Income Taxes
During fiscal year 2010, we performed a research and development tax credit study. The study considered fiscal years for which amended or current tax returns could be filed. We concluded that we were eligible for research and development tax credits that would result in a reduction in the provision for income tax expense for the noted fiscal years as follows (in thousands):
March 31,
|
|
|||
|---|---|---|---|---|
2009(1) |
$ | 217 | ||
2008(1) |
169 | |||
2007 |
129 | |||
2006 |
86 | |||
Total |
$ | 601 | ||
- (1)
- Approximately $25,000 and $3,000 of research and development tax credits during the fiscal years ended March 31, 2009 and 2008, respectively, related to discontinued operations.
We filed amended and current tax returns during the third quarter of fiscal year 2010 for each of the fiscal years noted above and included the research and development tax credits identified in the study. As a result of the filings, we recorded a reduction in the provision for income tax expense of $0.6 million during the third quarter of fiscal year 2010. We also estimated that we will utilize research and development tax credits during fiscal year 2010 of between $0.1 million and $0.2 million. Approximately $0.1 million of the estimated fiscal year 2010 tax credit was reflected in the third quarter of fiscal year 2010 and the remaining amount was reflected in the fourth quarter of fiscal year 2010. We also recorded a non-cash goodwill impairment charge of $4.9 million within our Film Production segment in the fourth quarter of fiscal year 2010, and the impairment charge was a non-deductible expense for purposes of the fiscal year 2010 tax return. No other discreet items had a material impact on our tax rate during fiscal year 2010.
During fiscal year 2009, we recorded a non-cash goodwill impairment charge of $10.0 million within our Film Production segment. The impairment charge was a non-deductible expense for purposes of our fiscal year 2009 tax return. Additionally, the statute of limitations expired on approximately $1.6 million of uncertain tax positions in fiscal year 2009. This reversal of uncertain tax positions resulted in a $0.4 million reduction in tax expense and a $0.4 million reversal of related interest expense during the third quarter of fiscal year 2009.
See Note 10—Income Taxes within the Notes to Consolidated Financial Statements for additional information on our tax provision.
Discontinued Operations
The Direct-to-Consumer segment acquired certain intellectual property rights to an IPTV set-top box and other intangible assets in late fiscal year 2008 in an effort to expand the product lines that are delivered directly to consumers. The intellectual property rights technology allowed us to manufacture a device through which consumers could obtain content directly through the internet and view the content on television. Based primarily on (a) lower than expected subscriber additions for the IPTV business model during the second half of fiscal year 2009, (b) the significant downturn in economic
44
conditions and related reduction in consumer spending during the second half of fiscal year 2009, and (c) slower than expected development of new product lines, we restructured the Direct-to-Consumer segment operations as it relates to these new product lines. Although we continued to operate the IPTV set-top box business and other new Direct-to-Consumer product lines through the first nine months of fiscal year 2009, we materially changed the nature of those operations and dedicated fewer resources towards marketing and generating revenue for the products. Based on the change in operations and an analysis of the future expected benefits, we determined that certain intangible assets associated with the related new product lines were impaired and recorded a $0.9 million non-cash intangible asset impairment charge in the fourth quarter of fiscal year 2009. Additionally, several contracts were cancelled prior to the end of the related term in connection with the restructuring and as a result, we also incurred an early contract termination fee of approximately $0.2 million in the fourth quarter of fiscal year 2009 which was paid in April 2009.
During fiscal year 2010, the Company entered into arrangements with third-party affiliates to distribute the IPTV set-top box in Europe and the U.S. Throughout fiscal year 2010, these affiliates marketed the IPTV set-top box product through a variety of advertising programs including print, billboards and other miscellaneous media. The performance of the IPTV set-top box business in fiscal year 2010 was lower than expected and as a result, the Company implemented a plan to discontinue the operations of the IPTV set-top box business in the fourth quarter of fiscal year 2010. As a result, the Company recorded an inventory obsolescence impairment charge of $0.1 million and an equipment impairment charge of $0.1 million. The Company has classified approximately $0.1 million of certain equipment as held for sale based on, among other things, the Company's intent and ability to sell the assets. The assets held for sale are reflected in the prepaid and other assets line item in the consolidated balance sheets. We do not expect to incur material expenses or cash flows in the future associated with the discontinued operations.
LIQUIDITY AND CAPITAL RESOURCES
Our current priorities for the use of our cash and cash equivalents are:
- •
- investments in processes intended to improve the quality and marketability of our products;
- •
- funding our operating and capital requirements; and
- •
- funding, from time to time, opportunities to enhance shareholder value, whether in the form of repurchase of shares of our common stock, cash dividends or other strategic transactions.
We anticipate that our existing cash, cash equivalents and cash flows from operations will be sufficient during the next 12 months to satisfy our operating requirements. We also anticipate that we will be able to fund our estimated outlay for capital expenditures, repayment of outstanding debt and other related purchases that may occur during the next 12 months through our available cash, cash equivalents and our expected cash flows from operations during that period.
45
Operating and Investing Cash Flow Activities of Continuing Operations:
Our operating and investing cash flow activities of continuing operations for each of the three fiscal years presented are as follows (amounts in table may not sum due to rounding):
| |
(In millions) Year Ended March 31, |
||||||||||
|---|---|---|---|---|---|---|---|---|---|---|---|
| |
2010 | 2009 | 2008 | ||||||||
Net cash provided by operating activities of continuing operations |
$ | 6.5 | $ | 10.7 | $ | 8.4 | |||||
Cash flows from investing activities: |
|||||||||||
Purchases of investments |
(1.0 | ) | (2.0 | ) | (2.8 | ) | |||||
Redemptions of investments |
1.1 | 2.8 | 11.2 | ||||||||
Purchases of equipment and furniture |
(1.1 | ) | (2.3 | ) | (1.9 | ) | |||||
Purchases of intangible assets |
(0.1 | ) | (0.3 | ) | — | ||||||
Payment of related party note arising from business acquisition |
— | (0.0 | ) | (0.6 | ) | ||||||
Net cash provided by (used in) investing activities of continuing operations |
$ | (1.1 | ) | $ | (1.8 | ) | $ | 5.8 | |||
Cash flows from operating activities of continuing operations
Cash provided by operating activities of continuing operations during fiscal year 2010 as compared to fiscal year 2009 was primarily impacted by the following:
- •
- the decline in the operating income (excluding the impact of goodwill and other impairment charges) primarily associated
with lower Transactional TV segment revenue;
- •
- a $3.8 million comparable decrease in cash flows from accounts receivable collections because fiscal year 2009
benefited from the collection of certain Transactional TV and Film Production segment customer balances which did not recur in fiscal year 2010;
- •
- a $0.6 million decrease in cash flows from the use of funds for the Film Production segment's
producer-for-hire services; and
- •
- a $3.6 million comparable increase in cash flows related to recoupable costs and producer advances because the Company generated a net recovery of these funds in fiscal year 2010 whereas the prior fiscal year reflected net cash outflows.
The changes in cash flows from operating activities of continuing operations during fiscal year 2009 compared to the fiscal year 2008 primarily reflect the following:
- •
- a $5.3 million increase in cash flows from improved efficiencies related to the collection of accounts receivable
in our Transactional TV and Film Production segments;
- •
- a $1.3 million increase in cash flows from the decline in owned content creation within the Film Production
segment;
- •
- a $0.9 million increase in cash flows arising primarily from lower employee bonus payments made during the first
quarter of fiscal year 2009 as compared to the same prior year quarter;
- •
- a $1.4 million decline in cash flows from recoupable costs incurred to obtain higher quality repped content to support existing repped content sales and our new initiatives to distribute repped content through retail DVD and VOD markets; and
46
- •
- a general decline in cash flows associated with unfavorable performance within the Film Production segment.
Cash flows from operating activities during fiscal years 2010 and 2009 were significantly higher as compared to the operating loss incurred as a result of non-cash goodwill and other asset impairment charges.
Cash flows from investing activities of continuing operations
Cash from investing activities of continuing operations during fiscal year 2010 included approximately $0.1 million of cash received from net redemptions of investments, approximately $1.1 million of cash used to purchase equipment and furniture, and approximately $0.1 million of cash disbursements associated with purchases of intangible assets within our Direct-to-Consumer segment. We expect cash used for capital expenditures will increase in fiscal year 2011 in order to improve our current infrastructure capacity to support the international distribution growth within the Transactional TV segment.
Cash used in investing activities of continuing operations during fiscal year 2009 reflected approximately $0.8 million of cash received from net redemptions of investments. Approximately $2.3 million of cash was used for capital expenditures primarily to acquire additional electronic storage equipment for our Transactional TV segment and to upgrade certain administrative hardware and software, such as our financial reporting system. We also used approximately $0.3 million to purchase intangible assets associated with our internet website operations within the Direct-to-Consumer segment.
The increase in cash provided by investing activities of continuing operations during fiscal year 2008 was primarily related to the net $8.4 million of cash received from the redemption of investments. Capital expenditures of $1.9 million primarily related to purchases of servers and editing equipment to maintain our Digital Broadcast Center and computers. The related party note payable disbursement of $0.6 million was paid to the former principals of MRG from whom we acquired the Film Production segment.
Cash Flows from Financing Activities of Continuing Operations:
Our cash flows from financing activities of continuing operations for each of the three fiscal years presented are as follows (amounts in table may not sum due to rounding):
| |
(In millions) Year Ended March 31, |
||||||||||
|---|---|---|---|---|---|---|---|---|---|---|---|
| |
2010 | 2009 | 2008 | ||||||||
Cash flows from financing activities: |
|||||||||||
Payments on short-term debt |
$ | (6.0 | ) | $ | — | $ | — | ||||
Proceeds from short-term debt |
3.0 | 4.0 | — | ||||||||
Purchases of common stock |
(0.1 | ) | (9.1 | ) | (3.9 | ) | |||||
Payment of long-term seller financing |
(0.1 | ) | — | — | |||||||
Payment of dividends |
— | (3.0 | ) | (9.0 | ) | ||||||
Proceeds from stock option and warrant exercises |
— | — | 0.5 | ||||||||
Excess tax (shortfall) benefit from option/warrant exercises |
— | — | (0.1 | ) | |||||||
Net cash used in financing activities of continuing operations |
$ | (3.2 | ) | $ | (8.0 | ) | $ | (12.5 | ) | ||
Our cash flows from financing activities of continuing operations during fiscal year 2010 were primarily impacted by net payments on short-term debt of $3.0 million. Also impacting the cash flows from financing activities was $0.1 million used to repurchase approximately 62,000 shares of common
47
stock at an average purchase price of $1.99 per share, and $0.1 million in payments for long-term seller financing related to our purchase of a patent in fiscal year 2008.
Net cash used in financing activities of continuing operations during fiscal year 2009 included $9.1 million for the purchase of approximately 4.3 million shares of our common stock and $3.0 million in payments for cash dividends that were declared in the fourth quarter of fiscal year 2008 and paid in the first quarter of fiscal year 2009. We borrowed $4.0 million from our line of credit to support our working capital needs.
Net cash used in financing activities of continuing operations during fiscal year 2008 reflected $9.0 million in payments for quarterly cash dividends and $3.9 million for the purchase of approximately 0.6 million shares of common stock through our stock repurchase plan. This use of cash was slightly offset by $0.5 million in proceeds from the exercise of stock options. The excess tax (shortfall) benefit related to the tax deductions that we received upon exercise of options by employees or non-employee directors in excess of those anticipated at the time of the option grants, and amounts were immaterial in fiscal year 2008.
Stock Repurchase and Cash Dividends
Stock Repurchase
In June 2008, our Board of Directors extended a share repurchase plan allowing for the repurchase of approximately 1.1 million shares of common stock through June 2010. During the six month period ended September 30, 2008, we substantially completed the share repurchase plan and repurchased approximately 1.1 million shares for a total purchase price of approximately $4.3 million. The repurchased shares were returned to authorized but unissued shares of common stock in accordance with Colorado law.
On November 14, 2008, we entered into a Stock Purchase Agreement pursuant to which a shareholder agreed to sell and we agreed to purchase approximately 2.6 million shares of our common stock for a cash purchase price of $1.55 per share or an aggregate purchase price for all of the shares of approximately $4.1 million. We funded the acquisition of the shares with available cash.
On March 11, 2009, we purchased through one broker in an unsolicited single block trade approximately 0.5 million shares of our common stock for a cash purchase price of $1.30 per share, or an aggregate purchase price for all of the shares of approximately $0.7 million. The acquisition was funded with available cash.
On August 28, 2009, our Board of Directors adopted a new stock repurchase program. Under the program, we may purchase with available cash and cash from operations up to 1.0 million shares of the Company's outstanding common stock, from time to time through open market or privately negotiated transactions, as market and business conditions permit. The program will expire in March 2012. We have repurchased approximately 0.1 million shares through this repurchase program as of March 31, 2010.
Cash Dividends
During each of the quarters in fiscal year 2008, our Board of Directors declared a quarterly cash dividend of $0.125 per share of common stock. We paid approximately $9.0 million in cash dividends through March 31, 2008. Additionally, as of March 31, 2008, we had a dividend payable of $3.0 million that was subsequently paid in April 2008. The Board of Directors did not declare a quarterly dividend during fiscal year 2009 or 2010, and the payment of future quarterly dividends is at the discretion of the Board of Directors. We currently have no plans to effect any further dividends; however, we will continue to evaluate available methods to enhance shareholder value, whether in the form of cash dividends or otherwise.
48
Borrowing Arrangements
On December 15, 2009, our former line of credit matured and we obtained a new line of credit from a financial institution. The line of credit is secured by certain trade accounts and accounts receivable, is scheduled to mature on December 15, 2010, and bears interest at the greater of (a) the current prime rate less 0.125 percentage points per annum or (b) 5.75% per annum. The remainder of the line of credit may be drawn from time to time to support our operations and short-term working capital needs, if any. A loan origination fee of 0.5% of the available line was paid upon the execution of the line of credit. The line of credit includes a maximum borrowing base equal to the lesser of 75% of the trade accounts and accounts receivable securing the line of credit or $5.0 million, and the maximum borrowing base at March 31, 2010 was $5.0 million.
The line of credit contains both conditions precedent that must be satisfied prior to any borrowing and affirmative and negative covenants customary for facilities of this type, including, without limitation, (a) a requirement to maintain a current asset to current liability ratio of at least 1.5 to 1.0, (b) a requirement to maintain a total liability to tangible net worth ratio not to exceed 1.0 to 1.0, (c) prohibitions on additional borrowing, lending, investing or fundamental corporate changes without prior consent, (d) a prohibition on declaring without consent any dividends, other than dividends payable in our stock, and (e) a requirement that there be no material adverse change in our current client base as it relates to our largest clients. The line of credit provides that an event of default will exist in certain circumstances, including without limitation, our failure to make payment of principal or interest on borrowed amounts when required, failure to perform certain obligations under the line of credit and related documents, defaults in certain other indebtedness, our insolvency, a change in control, any material adverse change in our financial condition and certain other events customary for facilities of this type. As of March 31, 2010, our outstanding principal balance under the line of credit was $1.0 million, and we were in compliance with the related covenants.
Commitments and Contingencies
Contractual Cash Obligations
The following table reflects our contractual cash obligations as of March 31, 2010 for each of the fiscal year time periods specified (amounts may not sum due to rounding):
| |
Payments Due by Period (In millions): | ||||||||||||||||
|---|---|---|---|---|---|---|---|---|---|---|---|---|---|---|---|---|---|
Contractual Obligations
|
Total | 2011 | 2012 - 2013 | 2014 - 2015 | 2016 and thereafter | ||||||||||||
Operating lease obligations |
$ | 3.9 | $ | 1.9 | $ | 1.7 | $ | 0.4 | $ | — | |||||||
Vendor obligations |
10.3 | 2.6 | 3.2 | 2.0 | 2.5 | ||||||||||||
Line of credit |
1.0 | 1.0 | — | — | — | ||||||||||||
Employment contract obligations |
8.8 | 4.5 | 3.9 | 0.5 | — | ||||||||||||
Total |
$ | 24.1 | $ | 9.9 | $ | 8.8 | $ | 2.9 | $ | 2.5 | |||||||
For the purposes of this table, contractual obligations are defined as agreements that are enforceable and legally binding and that specify all significant terms, such as fixed or minimum services to be purchased and the approximate timing of the transaction. Obligations to acquire specified quantities of movie license rights that are subject to the delivery of the related movies are included in vendor obligations because we estimate that the movies will be delivered in the specified time periods.
We maintain non-cancelable leases for office space and equipment under various operating leases. The leases for office space expire through November 2013 and contain annual Consumer Price Index escalation clauses. Our Transactional TV segment has entered into direct lease agreements that expire through December 2010 with an unrelated party for the use of transponders to broadcast its channels on satellites. We expect to have continued access to transponders subsequent to the expiration of the
49
current leases. As the lessee of transponders under the transponder agreements, we are subject to arbitrary refusal of service by the service provider if that service provider determines that the content being transmitted by us is harmful to the service provider's name or business. Any such service disruption would substantially and adversely affect the financial position and results of operations. We also bear the risk that the access of their networks to transponders may be restricted or denied if a governmental authority commences an investigation concerning the content of the transmissions. Additionally, cable operators may be reluctant to carry less edited or partially edited adult programming on their systems. If either of the above scenarios occurred, it could adversely affect our financial position and results of operations. We had no equipment under capital lease at March 31, 2010 or 2009.
From time to time, we enter into arrangements with movie studios to acquire license rights for a fixed and/or minimum quantity of movies over various purchase periods as defined by the agreements. Additionally, we are party to certain uplinking, transport and marketing services that contractually obligate us to receive services over specified terms as per these arrangements. We are also obligated to make future payments associated with our purchase of patent rights. These contractual obligations are reflected in the above table as vendor obligations.
We have recorded long-term income taxes payable of $0.3 million for uncertain tax positions, reduced by the associated federal deduction for state taxes. We are unable to reliably estimate the timing of future payments, if any, related to these uncertain tax positions. Therefore, the amounts have been excluded from the above table.
Uncertain Tax Positions
We had total unrecognized tax benefits of approximately $0.3 million at March 31, 2010 that are not expected to be settled within one year and have been classified within long-term taxes payable. If we were to prevail or the uncertainties were settled in our favor for all uncertain tax positions, the net effect is estimated to be a benefit to tax expense of approximately $0.3 million. As of March 31, 2010, we had accrued immaterial amounts of interest expense related to uncertain tax position liabilities. There were no material changes in our unrecognized tax benefits during fiscal year 2010.
During fiscal year 2009, the statute of limitations expired on approximately $1.6 million of uncertain tax positions resulting in a decline in the uncertain tax position balance as reflected in the current portion of taxes payable. This reversal of the uncertain tax positions resulted in a $0.4 million reduction in our current period tax expense and a $0.4 million reversal of related interest expense. Approximately $1.1 million of the reversal of the uncertain tax position liabilities was recorded as an increase to additional paid-in capital because the amount was originally recorded as a reduction of additional paid-in capital and had no impact on income tax expense.
We file U.S. federal, state and foreign income tax returns. During fiscal year 2009, we concluded an audit by the Internal Revenue Service ("IRS") for the fiscal year 2007, and the IRS proposed no changes to the fiscal year 2007 tax return in connection with the audit. There are currently no tax audits in process with taxing authorities. With few exceptions, we are no longer subject to examination of our federal and state income tax returns for years prior to fiscal year 2006.
RECENT ACCOUNTING PRONOUNCEMENTS
See Recently Issued Accounting Pronouncements in Note 1—Organization and Summary of Significant Accounting Policies within the Company's Financial Statements and Supplementary Data commencing on page F-2 herein.
50
ITEM 7A. QUANTITATIVE AND QUALITATIVE DISCLOSURES ABOUT MARKET RISK.
Market Risk. The Company's exposure to market risk is principally confined to cash in deposit accounts and money market accounts and, therefore, minimal and immaterial market risk.
Interest Rate Sensitivity. Changes in interest rates could impact our anticipated interest income on cash, cash equivalents and investments. An adverse change in interest rates in effect at March 31, 2010 would not have a material impact on the Company's net loss or cash flows.
Changes in interest rates could also impact the amount of interest we pay on borrowings under our line of credit. A 10% adverse change in the interest rates on borrowings under our line of credit would not have a material impact on the Company's interest expense.
Foreign Currency Exchange Risk. The Company does not have material foreign currency transactions.
ITEM 8. FINANCIAL STATEMENTS AND SUPPLEMENTARY DATA.
The consolidated financial statements of New Frontier Media, Inc. and its subsidiaries, including the notes thereto and the report of independent accountants therein, commence at page F-2 of this Report and are incorporated herein by reference.
ITEM 9. CHANGES IN AND DISAGREEMENTS WITH ACCOUNTANTS ON ACCOUNTING AND FINANCIAL DISCLOSURE.
None.
ITEM 9A. CONTROLS AND PROCEDURES.
Evaluation of Disclosure Controls and Procedures
Based on management's evaluation (with the participation of our Chief Executive Officer ("CEO") and Chief Financial Officer ("CFO")), as of the end of the period covered by this report, our CEO and CFO have concluded that our disclosure controls and procedures (as defined in Rules 13a-15(e) and 15d-15(e) under the Securities Exchange Act of 1934, as amended (the "Exchange Act")), are effective to provide reasonable assurance that information required to be disclosed by us in reports that we file or submit under the Exchange Act is recorded, processed, summarized, and reported within the time periods specified in SEC rules and forms, and is accumulated and communicated to management, including our principal executive officer and principal financial officer, as appropriate, to allow timely decisions regarding required disclosure.
Changes in Internal Control over Financial Reporting
There were no changes to our internal control over financial reporting (as defined in Rules 13a-15(f) and 15d-15(f) under the Exchange Act) that occurred during the period covered by this report that have materially affected, or are reasonably likely to materially affect, our internal control over financial reporting.
Management Report on Internal Control over Financial Reporting
Our management is responsible for establishing and maintaining adequate internal control over financial reporting (as defined in Rules 13a-15(f) and 15d-15(f) under the Exchange Act) to provide reasonable assurance regarding the reliability of our financial reporting and the preparation of financial statements for external purposes in accordance with U.S. generally accepted accounting principles.
51
Management assessed our internal control over financial reporting as of March 31, 2010, the end of our fiscal year. Management based its assessment on criteria established in Internal Control—Integrated Framework issued by the Committee of Sponsoring Organizations of the Treadway Commission. Management's assessment included evaluation of elements such as the design and operating effectiveness of key financial reporting controls, process documentation, accounting policies, and our overall control environment.
Based on the assessment, management has concluded that our internal control over financial reporting was effective as of the end of the fiscal year to provide reasonable assurance regarding the reliability of financial reporting and the preparation of financial statements for external reporting purposes in accordance with U.S. generally accepted accounting principles. We reviewed the results of management's assessment with the Audit Committee of our Board of Directors.
Inherent Limitations on Effectiveness of Controls
Our management, including the CEO and CFO, does not expect that our disclosure controls or our internal control over financial reporting will prevent or detect all errors and all fraud. A control system, no matter how well designed and operated, can provide only reasonable, not absolute, assurance that the control system's objectives will be met. The design of a control system must reflect the fact that there are resource constraints, and the benefits of controls must be considered relative to their costs. Further, because of the inherent limitations in all control systems, no evaluation of controls can provide absolute assurance that misstatements due to error or fraud will not occur or that all control issues and instances of fraud, if any, have been detected. These inherent limitations include the realities that judgments in decision-making can be faulty and that breakdowns can occur because of simple error or mistake. Controls can also be circumvented by the individual acts of some persons, by collusion of two or more people, or by management override of the controls. The design of any system of controls is based in part on certain assumptions about the likelihood of future events, and there can be no assurance that any design will succeed in achieving its stated goals under all potential future conditions. Projections of any evaluation of controls effectiveness to future periods are subject to risks. Over time, controls may become inadequate because of changes in conditions or deterioration in the degree of compliance with policies or procedures.
None.
ITEM 10. DIRECTORS, EXECUTIVE OFFICERS AND CORPORATE GOVERNANCE.
Incorporated by reference to "Information about the Nominees" in the definitive proxy statement to be filed with the SEC relating to the registrant's Annual Meeting of Shareholders expected to be held on or about August 23, 2010.
Please see "Executive Officers of the Registrant" in Part I, Item 1 of this form.
All of our directors, officers and employees are subject to a Code of Business Conduct and Ethics, and our financial management, including our principal executive, financial and accounting officers, are also subject to an additional Code of Ethics for Financial Management, each of which codes are available for review under the Corporate Governance link in the Investor Relations portion of the Company's website: www.noof.com. Any amendments to any of the provisions of the codes that are applicable to our principal executive, financial or accounting officers and are required under applicable laws, rules and regulations to be disclosed publicly will be posted for review in the above identified
52
area of our website, and any waivers of such provisions or similar provisions applicable to our directors will be disclosed on Form 8-K as required by the applicable rules of The Nasdaq Stock Market, LLC.
ITEM 11. EXECUTIVE COMPENSATION.
Incorporated by reference to "Compensation Discussion and Analysis," "Compensation Committee Report," "Summary Compensation Table," "Fiscal Year 2010 Grants of Plan-Based Awards," "Outstanding Equity Awards at Fiscal Year-End," "Potential Payments Upon Termination" and "Non-Employee Directors Compensation for Fiscal Year 2010" in the definitive proxy statement to be filed with the SEC relating to the registrant's Annual Meeting of Shareholders expected to be held on or about August 23, 2010.
ITEM 12. SECURITY OWNERSHIP OF CERTAIN BENEFICIAL OWNERS AND MANAGEMENT AND RELATED STOCKHOLDER MATTERS.
Incorporated by reference to "Security Ownership of Certain Beneficial Owners and Management" and "Securities Authorized for Issuance Under Equity Compensation Plans" in the definitive proxy statement to be filed with the SEC relating to the registrant's Annual Meeting of Shareholders expected to be held on or about August 23, 2010.
ITEM 13. CERTAIN RELATIONSHIPS AND RELATED TRANSACTIONS AND DIRECTOR INDEPENDENCE.
Incorporated by reference to "Transactions with Related Persons" and "Director Independence" in the definitive proxy statement to be filed with the SEC relating to the registrant's Annual Meeting of Shareholders expected to be held on or about August 23, 2010.
ITEM 14. PRINCIPAL ACCOUNTING FEES AND SERVICES.
Incorporated by reference to "Fees Billed by Independent Registered Public Accounting Firm" in the definitive proxy statement to be filed with the SEC relating to the registrant's Annual Meeting of Shareholders expected to be held on or about August 23, 2010.
ITEM 15. EXHIBITS AND FINANCIAL STATEMENT SCHEDULES.
The following documents are filed as part of this report:
- 1)
- FINANCIAL STATEMENTS
The financial statements listed in the Table of Contents to Consolidated Financial Statements are filed as part of this report.
- 2)
- FINANCIAL STATEMENT SCHEDULES
All schedules have been included in the Consolidated Financial Statements, Notes thereto, or Supplemental Information Schedules.
53
- 3)
- EXHIBITS
| Exhibit No. |
Exhibit Description | ||
|---|---|---|---|
| 3.01 | Amended and Restated Articles of Incorporation of the Company(1) | ||
3.02 |
Amended and Restated Bylaws of the Company(2) |
||
4.01 |
Form of Common Stock Certificate(3) |
||
4.02 |
Amended and Restated Rights Agreement between New Frontier Media, Inc. and Corporate Stock Transfer, Inc., as rights agent(4) |
||
4.03 |
Form of Certificate of Designation, Preferences and Rights of Series A Junior Participating Preferred Stock, together with the related Rights Certificate, included as Appendices A and B to the Rights Agreement incorporated by reference herein as Exhibit 4.02 |
||
10.01 |
Lease Agreement for premises at 5435 Airport Boulevard, Boulder CO(5) |
||
10.02 |
Agreement between Colorado Satellite Broadcasting, Inc. and Loral Skynet Concerning Skynet Transponder Service(6) |
||
10.03 |
Agreement between Colorado Satellite Broadcasting, Inc. and Loral Skynet Concerning Skynet Space Segment Service(6) |
||
10.04 |
Amendment Number One to Agreement between Colorado Satellite Broadcasting, Inc. and Loral Skynet Concerning Skynet Space Segment Service(6) |
||
10.05 |
License Agreement between Colorado Satellite Broadcasting, Inc. and Metro Global Media, Inc.(6) |
||
10.06 |
Amendment Number Two to the Agreement between Colorado Satellite Broadcasting, Inc. and Loral Skynet Concerning Skynet Space Segment Service(7) |
||
10.07 |
Amendment Number One to the Agreement between Colorado Satellite Broadcasting, Inc. and Loral Skynet Concerning Skynet Transponder Service(8) |
||
10.08 |
Amendment Number Four to the Agreement between Colorado Satellite Broadcasting, Inc. and Loral Skynet Concerning Skynet Space Segment Service(9) |
||
10.09 |
Office Lease Agreement between New Frontier Media, Inc. and Northview Properties, LLC(9) |
||
10.10 |
Lease Modification Agreement between New Frontier Media, Inc. and LakeCentre Plaza Limited, LLLP(9) |
||
10.11 |
Catalog License Agreement between Pleasure Productions, Inc. and Colorado Satellite Broadcasting, Inc.(9) |
||
10.12 |
Telecommunications Services Agreement between WilTel Communications, LLC and Colorado Satellite Broadcasting, Inc.(10) |
||
10.13 |
Amendment No. 3 to Contract Number T70112100 between Colorado Satellite Broadcasting, Inc. and Intelsat USA Sales Corp.(11) |
||
10.14 |
# |
Satellite Capacity Lease between Colorado Satellite Broadcasting, Inc. and Transponder Encryption Services Corporation(12) |
|
10.15 |
* |
Summary of Director Compensation Arrangements(22) |
|
10.16 |
* |
1998 Incentive Stock Plan(13) |
|
54
| Exhibit No. |
Exhibit Description | ||
|---|---|---|---|
| 10.17 | * | 1999 Incentive Stock Plan(14) | |
10.18 |
* |
Millennium Incentive Stock Option Plan(15) |
|
10.19 |
* |
2001 Incentive Stock Plan(16) |
|
10.20 |
* |
2007 Stock Incentive Plan(17) |
|
10.21 |
* |
Form of Award Agreements under 2007 Stock Incentive Plan(18) |
|
10.22 |
* |
Amended and Restated Independent Contractor Agreement, dated November 7, 2007, between New Frontier Media, Inc. and Matthew Pullam(19) |
|
10.23 |
* |
Amended and Restated Employment Agreement between New Frontier Media, Inc. and Michael Weiner(2) |
|
10.24 |
* |
Amended and Restated Employment Agreement between New Frontier Media, Inc. and Grant Williams(2) |
|
10.25 |
* |
Amended and Restated Employment Agreement between New Frontier Media, Inc. and Ira Bahr(2) |
|
10.26 |
* |
Amended and Restated Employment Agreement between New Frontier Media, Inc. and Ken Boenish(2) |
|
10.27 |
* |
Amended and Restated Employment Agreement between New Frontier Media, Inc. and Marc Callipari(2) |
|
10.28 |
* |
Amended and Restated Employment Agreement between New Frontier Media, Inc. and Scott Piper(2) |
|
10.29 |
# |
Amended and Restated Affiliation Agreement for DTH Satellite Exhibition of Cable Network Programming by and between Colorado Satellite Broadcasting, Inc. and DirecTV, Inc.(19) |
|
10.30 |
Stock Purchase Agreement, dated and effective as of November 13, 2008, by and between New Frontier Media, Inc. and Steel Partners II, L.P.(20) |
||
10.31 |
# |
Affiliation Agreement, dated January 1, 2000 and as amended to date, between the Company and Time Warner Cable, a division of Time Warner Entertainment Company, L.P.(21) |
|
10.32 |
# |
Video On Demand License Agreement, dated March 13, 2000 and as amended to date, between the Company and Time Warner Cable, a division of Time Warner Entertainment Company, L.P.(21) |
|
10.33 |
# |
Adult VOD License Agreement, dated October 18, 2002 and as amended to date, between Colorado Satellite Broadcasting, Inc. and Comcast Cable Communications, Inc.(21) |
|
10.34 |
# |
Pleasure Service License Agreement, dated November 16, 2000 and as amended to date, between Colorado Satellite Broadcasting, Inc. and Comcast Programming, a division of Comcast Corporation(21) |
|
10.35 |
First Amendment to Satellite Capacity Lease between Colorado Satellite Broadcasting, Inc. and Transponder Encryption Services Corporation(21) |
||
10.36 |
# |
Second Amendment to Satellite Capacity Lease between Colorado Satellite Broadcasting, Inc. and Transponder Encryption Services Corporation(21) |
|
55
| Exhibit No. |
Exhibit Description | ||
|---|---|---|---|
| 10.37 | # | Third Amendment to Satellite Capacity Lease between Colorado Satellite Broadcasting, Inc. and Transponder Encryption Services Corporation(22) | |
10.38 |
* |
First Amendment to the Amended and Restated Employment Agreement between New Frontier Media, Inc. and Michael Weiner(22) |
|
10.39 |
* |
First Amendment to the Amended and Restated Employment Agreement between New Frontier Media, Inc. and Grant Williams(22) |
|
10.40 |
* |
First Amendment to the Amended and Restated Employment Agreement between New Frontier Media, Inc. and Ken Boenish(22) |
|
10.41 |
* |
First Amendment to the Amended and Restated Employment Agreement between New Frontier Media, Inc. and Scott Piper(22) |
|
10.42 |
* |
First Amendment to the Amended and Restated Employment Agreement between New Frontier Media, Inc. and Marc Callipari(22) |
|
10.43 |
Promissory Note, dated December 15, 2009 between New Frontier Media, Inc. and Great Western Bank(23) |
||
10.44 |
# |
Business Loan Agreement, dated December 15, 2009 between New Frontier Media, Inc. and Great Western Bank(23) |
|
10.45 |
Commercial Security Agreement, dated December 15, 2009 between New Frontier Media, Inc. and Great Western Bank(23) |
||
10.46 |
## |
TVN-CSB Adult VOD Services Agreement dated April 8, 2010 between Colorado Satellite Broadcasting, Inc. and TVN Entertainment Corporation |
|
21.01 |
Subsidiaries of the Company |
||
23.01 |
Consent of Grant Thornton LLP |
||
31.01 |
CEO Certification pursuant to Rule 13a-14(a)/15d-14(a) |
||
31.02 |
CFO Certification pursuant to Rule 13a-14(a)/15d-14(a) |
||
32.01 |
Section 1350 Certification of CEO |
||
32.02 |
Section 1350 Certification of CFO |
||
- (1)
- Incorporated
by reference to the corresponding exhibit included in the Company's Current Report on Form 8-K filed on May 9, 2007
(File No. 000-23697).
- (2)
- Incorporated
by reference to the corresponding exhibit included in the Company's Quarterly Report filed on Form 10-Q for the quarter
ended September 30, 2008 (File No. 000-23697).
- (3)
- Incorporated
by reference to the corresponding exhibit included in the Company's Registration Statement on Form SB-2 filed on
September 10, 1997 (File No. 333-35337).
- (4)
- Incorporated
by reference to the corresponding exhibit included in the Company's Current Report on Form 8-K filed on August 1,
2008 (File No. 000-23697).
- (5)
- Incorporated
by reference to the corresponding exhibit included in the Company's Annual Report on Form 10-KSB for the fiscal year ended
March 31, 1999 (File No. 000-23697).
- (6)
- Incorporated by reference to the corresponding exhibit included in the Company's Quarterly Report on Form 10-Q for the quarter ended June 30, 2002 (File No. 000-23697).
56
- (7)
- Incorporated
by reference to the corresponding exhibit included in the Company's Quarterly Report on Form 10-Q for the quarter ended
September 30, 2002 (File No. 000-23697).
- (8)
- Incorporated
by reference to the corresponding exhibit included in the Company's Quarterly Report on Form 10-Q for the quarter ended
December 31, 2002 (File No. 000-23697).
- (9)
- Incorporated
by reference to the corresponding exhibit included in the Company's Annual Report filed on Form 10-K for the fiscal year
ended March 31, 2004 (File No. 000-23697).
- (10)
- Incorporated
by reference to the corresponding exhibit included in the Company's Quarterly Report filed on Form 10-Q for the quarter
ended September 30, 2004 (File No. 000-23697).
- (11)
- Incorporated
by reference to the corresponding exhibit included in the Company's Quarterly Report filed on Form 10-Q for the quarter
ended September 30, 2005 (File No. 000-23697).
- (12)
- Incorporated
by reference to the corresponding exhibit included in the Company's Quarterly Report filed on Form 10-Q for the quarter
ended September 30, 2006 (File No. 000-23697).
- (13)
- Incorporated
by reference to the Company's definitive proxy statement filed under cover of Schedule 14A on August 7, 1998 (File
No. 000-23697).
- (14)
- Incorporated
by reference to the Company's definitive proxy statement filed under cover of Schedule 14A on September 28, 1999 (File
No. 000-23697).
- (15)
- Incorporated
by reference to the Company's definitive proxy statement filed under cover of Schedule 14A on August 29, 2000 (File
No. 000-23697).
- (16)
- Incorporated
by reference to the Company's definitive proxy statement filed under cover of Schedule 14A on July 23, 2001 (File
No. 000-23697).
- (17)
- Incorporated
by reference to Appendix A to the Company's definitive proxy statement filed under cover of Schedule 14A on July 16, 2007
(File No. 000-23697).
- (18)
- Incorporated
by reference to the corresponding exhibit included in the Company's Current Report on Form 8-K filed on August 24,
2007 (File No. 000-23697).
- (19)
- Incorporated
by reference to the corresponding exhibit included in the Company's Quarterly Report filed on Form 10-Q for the quarter
ended September 30, 2007 (File No. 000-23697).
- (20)
- Incorporated
by reference to the corresponding exhibit included in the Company's Current Report on Form 8-K filed on November 14,
2008 (File No. 000-23697).
- (21)
- Incorporated
by reference to the corresponding exhibit included in the Company's Annual Report filed on Form 10-K for the fiscal year
ended March 31, 2009 (File No. 000-23697).
- (22)
- Incorporated
by reference to the corresponding exhibit included in the Company's Quarterly Report filed on Form 10-Q for the quarter
ended September 30, 2009 (File No. 000-23697).
- (23)
- Incorporated
by reference to the corresponding exhibit included in the Company's Quarterly Report filed on Form 10-Q for the quarter
ended December 31, 2009 (File No. 000-23697).
- *
- Denotes
management contract or compensatory plan or arrangement.
- #
- Confidential
portions of this agreement have been redacted pursuant to a confidential treatment request filed separately with the SEC.
- ##
- Confidential treatment has been requested as to portions of this exhibit. Such portions have been redacted and filed separately with the SEC.
57
Pursuant to the requirements of Section 13 or 15(d) of the Securities Exchange Act of 1934, the registrant has duly caused this report to be signed on its behalf by the undersigned, thereunto duly authorized.
| NEW FRONTIER MEDIA, INC. | ||||||
By: |
/s/ MICHAEL WEINER |
|||||
| Name: | Michael Weiner | |||||
| Title: | Chief Executive Officer | |||||
| Date: | June 11, 2010 | |||||
Pursuant to the requirements of the Securities Exchange Act of 1934, this report has been signed below by the following persons on behalf of the registrant and in the capacities and on the dates indicated.
Name and Capacity
|
Date
|
|||
|---|---|---|---|---|
| /s/ MICHAEL WEINER |
June 11, 2010 | |||
| Name: | Michael Weiner | |||
| Title: | Chief Executive Officer and Chairman of the Board (Principal Executive Officer) |
|||
/s/ GRANT WILLIAMS |
June 11, 2010 |
|||
| Name: | Grant Williams | |||
| Title: | Chief Financial Officer (Principal Financial Officer and Principal Accounting Officer) |
|||
/s/ MELISSA HUBBARD |
June 11, 2010 |
|||
| Name: | Melissa Hubbard | |||
| Title: | Director | |||
/s/ ALAN ISAACMAN |
June 11, 2010 |
|||
| Name: | Alan Isaacman | |||
| Title: | Director | |||
/s/ DAVID NICHOLAS |
June 11, 2010 |
|||
| Name: | David Nicholas | |||
| Title: | Director | |||
/s/ WALTER TIMOSHENKO |
June 11, 2010 |
|||
| Name: | Walter Timoshenko | |||
| Title: | Director | |||
/s/ HIRAM WOO |
June 11, 2010 |
|||
| Name: | Hiram Woo | |||
| Title: | Director | |||
58
NEW FRONTIER MEDIA, INC. AND SUBSIDIARIES
TABLE OF CONTENTS
F-1
REPORT OF INDEPENDENT REGISTERED PUBLIC ACCOUNTING FIRM
To the Board of Directors and Shareholders of
New Frontier Media, Inc. and Subsidiaries
We have audited the accompanying consolidated balance sheets of New Frontier Media, Inc. (a Colorado corporation) and subsidiaries (collectively, the "Company") as of March 31, 2010 and 2009, and the related consolidated statements of operations, comprehensive income (loss), shareholders' equity, and cash flows for each of the three years in the period ended March 31, 2010. Our audits of the basic financial statements included the financial statement schedule listed in the index appearing under Schedule II—Valuation and Qualifying Accounts. These financial statements and financial statement schedule are the responsibility of the Company's management. Our responsibility is to express an opinion on these financial statements and financial statement schedule based on our audits.
We conducted our audits in accordance with the standards of the Public Company Accounting Oversight Board (United States). Those standards require that we plan and perform the audit to obtain reasonable assurance about whether the financial statements are free of material misstatement. The Company is not required to have, nor were we engaged to perform an audit of its internal control over financial reporting as of March 31, 2010. Our audit included consideration of internal control over financial reporting as a basis for designing audit procedures that are appropriate in the circumstances, but not for the purpose of expressing an opinion on the effectiveness of the Company's internal control over financial reporting. Accordingly, we express no such opinion. An audit also includes examining, on a test basis, evidence supporting the amounts and disclosures in the financial statements, assessing the accounting principles used and significant estimates made by management, as well as evaluating the overall financial statement presentation. We believe that our audits provide a reasonable basis for our opinion.
In our opinion, the consolidated financial statements referred to above present fairly, in all material respects, the financial position of New Frontier Media, Inc. and subsidiaries as of March 31, 2010 and 2009, and the results of their operations and their cash flows for each of the three years in the period ended March 31, 2010, in conformity with accounting principles generally accepted in the United States of America. Also in our opinion, the related financial statement schedule, when considered in relation to the basic financial statements taken as a whole, presents fairly, in all material respects, the information set forth therein.
/s/ GRANT THORNTON LLP
Denver,
Colorado
June 11, 2010
F-2
NEW FRONTIER MEDIA, INC. AND SUBSIDIARIES
CONSOLIDATED BALANCE SHEETS
(in thousands, except par values)
| |
March 31, | |||||||
|---|---|---|---|---|---|---|---|---|
| |
2010 | 2009 | ||||||
Assets |
||||||||
Current assets: |
||||||||
Cash and cash equivalents |
$ | 17,187 | $ | 16,049 | ||||
Restricted cash |
112 | 16 | ||||||
Investments—other |
— | 90 | ||||||
Accounts receivable, net of allowance for doubtful accounts of $253 and $308, at March 31, 2010 and 2009, respectively |
10,112 | 10,242 | ||||||
Deferred producer-for-hire costs |
625 | 60 | ||||||
Taxes receivable |
944 | 683 | ||||||
Deferred tax assets |
— | 358 | ||||||
Prepaid and other assets |
1,749 | 1,592 | ||||||
Total current assets |
30,729 | 29,090 | ||||||
Equipment and furniture, net |
4,557 | 5,573 | ||||||
Content and distribution rights, net |
11,316 | 10,933 | ||||||
Recoupable costs and producer advances, net |
3,421 | 4,999 | ||||||
Film costs, net |
5,705 | 6,672 | ||||||
Goodwill |
3,743 | 8,599 | ||||||
Other identifiable intangible assets, net |
673 | 1,630 | ||||||
Deferred tax assets |
349 | — | ||||||
Other assets |
1,320 | 1,043 | ||||||
Total assets |
$ | 61,813 | $ | 68,539 | ||||
Liabilities and shareholders' equity |
||||||||
Current liabilities: |
||||||||
Accounts payable |
$ | 1,103 | $ | 2,144 | ||||
Producers payable |
951 | 950 | ||||||
Deferred revenue |
685 | 737 | ||||||
Accrued compensation |
1,802 | 1,188 | ||||||
Deferred producer liabilities |
1,377 | 1,970 | ||||||
Short-term debt |
1,000 | 4,000 | ||||||
Deferred tax liabilities |
107 | — | ||||||
Accrued and other liabilities |
1,823 | 2,112 | ||||||
Total current liabilities |
8,848 | 13,101 | ||||||
Deferred tax liabilities |
— | 903 | ||||||
Taxes payable |
309 | 242 | ||||||
Other long-term liabilities |
528 | 718 | ||||||
Total liabilities |
9,685 | 14,964 | ||||||
Commitments and contingencies |
||||||||
Shareholders' equity: |
||||||||
Preferred stock, $.10 par value, 4,999 shares authorized, no shares issued and outstanding |
— | — | ||||||
Common stock, $.0001 par value, 50,000 shares authorized, 19,432 and 19,494 shares issued and outstanding, at March 31, 2010 and 2009, respectively |
2 | 2 | ||||||
Additional paid-in capital |
54,929 | 54,702 | ||||||
Accumulated deficit |
(2,735 | ) | (997 | ) | ||||
Accumulated other comprehensive loss |
(68 | ) | (132 | ) | ||||
Total shareholders' equity |
52,128 | 53,575 | ||||||
Total liabilities and shareholders' equity |
$ | 61,813 | $ | 68,539 | ||||
Refer to Notes to Consolidated Financial Statements.
F-3
NEW FRONTIER MEDIA, INC. AND SUBSIDIARIES
CONSOLIDATED STATEMENTS OF OPERATIONS
(in thousands, except per share amounts)
| |
Year Ended March 31, | ||||||||||
|---|---|---|---|---|---|---|---|---|---|---|---|
| |
2010 | 2009 | 2008 | ||||||||
Net revenue |
$ | 50,428 | $ | 52,595 | $ | 55,911 | |||||
Cost of sales |
19,858 | 15,938 | 17,647 | ||||||||
Gross margin |
30,570 | 36,657 | 38,264 | ||||||||
Operating expenses: |
|||||||||||
Sales and marketing |
8,072 | 8,559 | 7,239 | ||||||||
General and administrative |
15,406 | 16,283 | 16,506 | ||||||||
Charge for goodwill impairment |
4,856 | 10,009 | — | ||||||||
Charge for restructuring and asset impairments other than goodwill |
2,329 | 1,298 | 1,150 | ||||||||
Total operating expenses |
30,663 | 36,149 | 24,895 | ||||||||
Operating income (loss) |
(93 | ) | 508 | 13,369 | |||||||
Other income (expense): |
|||||||||||
Interest income |
49 | 208 | 711 | ||||||||
Interest expense |
(243 | ) | (208 | ) | (155 | ) | |||||
Reversal of interest expense for uncertain tax positions |
— | 429 | — | ||||||||
Other income, net |
12 | 2 | 97 | ||||||||
Total other income (expense) |
(182 | ) | 431 | 653 | |||||||
Income (loss) from continuing operations before provision for income taxes |
(275 | ) | 939 | 14,022 | |||||||
Provision for income taxes |
(838 | ) | (3,909 | ) | (5,186 | ) | |||||
Income (loss) from continuing operations |
(1,113 | ) | (2,970 | ) | 8,836 | ||||||
Loss from discontinued operations, net of income tax benefit of $391, $1,313 and $107 |
(625 | ) | (2,218 | ) | (176 | ) | |||||
Net income (loss) |
$ | (1,738 | ) | $ | (5,188 | ) | $ | 8,660 | |||
Basic income (loss) per share: |
|||||||||||
Continuing operations |
$ | (0.06 | ) | $ | (0.13 | ) | $ | 0.37 | |||
Discontinued operations |
(0.03 | ) | (0.10 | ) | (0.01 | ) | |||||
Net basic income (loss) per share(1) |
$ | (0.09 | ) | $ | (0.24 | ) | $ | 0.36 | |||
Diluted income (loss) per share: |
|||||||||||
Continuing operations |
$ | (0.06 | ) | $ | (0.13 | ) | $ | 0.37 | |||
Discontinued operations |
(0.03 | ) | (0.10 | ) | (0.01 | ) | |||||
Net diluted income (loss) per share(1) |
$ | (0.09 | ) | $ | (0.24 | ) | $ | 0.36 | |||
Dividends declared per share |
$ | — | $ | — | $ | 0.50 | |||||
- (1)
- May not sum due to rounding.
Refer to Notes to Consolidated Financial Statements.
F-4
NEW FRONTIER MEDIA, INC. AND SUBSIDIARIES
CONSOLIDATED STATEMENTS OF COMPREHENSIVE INCOME (LOSS)
(in thousands)
| |
Year Ended March 31, | |||||||||||
|---|---|---|---|---|---|---|---|---|---|---|---|---|
| |
2010 | 2009 | 2008 | |||||||||
Net income (loss) |
$ | (1,738 | ) | $ | (5,188 | ) | $ | 8,660 | ||||
Other comprehensive income (loss), net of tax: |
||||||||||||
Unrealized gain on investments |
— | 10 | 20 | |||||||||
Currency translation adjustment |
64 | (132 | ) | — | ||||||||
Total comprehensive income (loss) |
$ | (1,674 | ) | $ | (5,310 | ) | $ | 8,680 | ||||
Refer to Notes to Consolidated Financial Statements.
F-5
NEW FRONTIER MEDIA, INC. AND SUBSIDIARIES
CONSOLIDATED STATEMENTS OF SHAREHOLDERS' EQUITY
(in thousands, except per share amounts)
| |
Common Stock $.0001 Par Value |
|
|
|
|
|||||||||||||||
|---|---|---|---|---|---|---|---|---|---|---|---|---|---|---|---|---|---|---|---|---|
| |
|
Retained Earnings (Accumulated Deficit) |
Accumulated Other Comprehensive Loss |
|
||||||||||||||||
| |
Additional Paid-In Capital |
|
||||||||||||||||||
| |
Shares | Amounts | Total | |||||||||||||||||
Balance at March 31, 2007 |
24,302 | $ | 2 | $ | 64,191 | $ | 7,536 | $ | (30 | ) | $ | 71,699 | ||||||||
Exercise of stock options/warrants |
94 | — | 511 | — | — | 511 | ||||||||||||||
Tax benefit for stock option/warrant exercises |
— | — | 120 | — | — | 120 | ||||||||||||||
Purchases of common stock |
(621 | ) | — | (3,874 | ) | — | — | (3,874 | ) | |||||||||||
Share-based compensation |
— | — | 906 | — | — | 906 | ||||||||||||||
Unrealized gain on investments |
— | — | — | — | 20 | 20 | ||||||||||||||
Net income |
— | — | — | 8,660 | — | 8,660 | ||||||||||||||
Declared dividend ($0.50 per share) |
— | — | — | (12,005 | ) | — | (12,005 | ) | ||||||||||||
Balance at March 31, 2008 |
23,775 | 2 | 61,854 | 4,191 | (10 | ) | 66,037 | |||||||||||||
Purchases of common stock |
(4,281 | ) | — | (9,058 | ) | — | — | (9,058 | ) | |||||||||||
Share-based compensation |
— | — | 902 | — | — | 902 | ||||||||||||||
Reversal of tax benefit for stock option forfeitures/cancellations |
— | — | (54 | ) | — | — | (54 | ) | ||||||||||||
Reversal of uncertain tax position for capital transaction |
— | — | 1,058 | — | — | 1,058 | ||||||||||||||
Unrealized gain on investments |
— | — | — | — | 10 | 10 | ||||||||||||||
Currency translation adjustment |
— | — | — | — | (132 | ) | (132 | ) | ||||||||||||
Net loss |
— | — | — | (5,188 | ) | — | (5,188 | ) | ||||||||||||
Balance at March 31, 2009 |
19,494 | 2 | 54,702 | (997 | ) | (132 | ) | 53,575 | ||||||||||||
Purchases of common stock |
(62 | ) | — | (123 | ) | — | — | (123 | ) | |||||||||||
Share-based compensation |
— | — | 555 | — | — | 555 | ||||||||||||||
Reversal of tax benefit for stock option forfeitures/cancellations |
— | — | (205 | ) | — | — | (205 | ) | ||||||||||||
Currency translation adjustment |
— | — | — | — | 64 | 64 | ||||||||||||||
Net loss |
— | — | — | (1,738 | ) | — | (1,738 | ) | ||||||||||||
Balance at March 31, 2010 |
19,432 | $ | 2 | $ | 54,929 | $ | (2,735 | ) | $ | (68 | ) | $ | 52,128 | |||||||
Refer to Notes to Consolidated Financial Statements.
F-6
NEW FRONTIER MEDIA, INC. AND SUBSIDIARIES
CONSOLIDATED STATEMENTS OF CASH FLOWS
(in thousands)
| |
Year Ended March 31, | ||||||||||||
|---|---|---|---|---|---|---|---|---|---|---|---|---|---|
| |
2010 | 2009 | 2008 | ||||||||||
Cash flows from operating activities: |
|||||||||||||
Net income (loss) |
$ | (1,738 | ) | $ | (5,188 | ) | $ | 8,660 | |||||
Add: Loss from discontinued operations |
625 | 2,218 | 176 | ||||||||||
Income (loss) from continuing operations |
(1,113 | ) | (2,970 | ) | 8,836 | ||||||||
Adjustments to reconcile income (loss) from continuing operations to net cash provided by operating activities of continuing operations: |
|||||||||||||
Depreciation and amortization |
8,835 | 8,706 | 8,246 | ||||||||||
Tax benefit from option/warrant exercises |
— | — | 227 | ||||||||||
Share-based compensation |
555 | 907 | 905 | ||||||||||
Deferred taxes |
(925 | ) | 625 | (277 | ) | ||||||||
Charge for goodwill impairment |
4,856 | 10,009 | — | ||||||||||
Charges for impairments other than goodwill |
2,329 | 1,298 | 1,150 | ||||||||||
Reversal of uncertain tax positions |
— | (429 | ) | — | |||||||||
Reversal of interest expense for uncertain tax positions |
— | (429 | ) | — | |||||||||
Changes in operating assets and liabilities: |
|||||||||||||
Accounts receivable |
(172 | ) | 3,635 | (1,625 | ) | ||||||||
Accounts payable |
(705 | ) | (537 | ) | 505 | ||||||||
Content and distribution rights |
(4,060 | ) | (4,171 | ) | (4,553 | ) | |||||||
Film costs |
(2,919 | ) | (2,762 | ) | (4,093 | ) | |||||||
Deferred producer-for-hire costs |
(566 | ) | (60 | ) | — | ||||||||
Deferred revenue |
(60 | ) | (263 | ) | 95 | ||||||||
Producers payable |
1 | (62 | ) | (37 | ) | ||||||||
Taxes receivable and payable |
172 | 1,082 | 333 | ||||||||||
Accrued compensation |
649 | (637 | ) | (1,507 | ) | ||||||||
Recoupable costs and producer advances |
807 | (2,751 | ) | (1,360 | ) | ||||||||
Other assets and liabilities |
(1,211 | ) | (531 | ) | 1,540 | ||||||||
Net cash provided by operating activities of continuing operations |
6,473 | 10,660 | 8,385 | ||||||||||
Net cash used in operating activities of discontinued operations |
(1,061 | ) | (2,155 | ) | (201 | ) | |||||||
Net cash provided by operating activities |
5,412 | 8,505 | 8,184 | ||||||||||
Cash flows from investing activities: |
|||||||||||||
Purchases of investments |
(1,000 | ) | (2,011 | ) | (2,828 | ) | |||||||
Redemptions of investments |
1,090 | 2,846 | 11,201 | ||||||||||
Purchases of equipment and furniture |
(1,064 | ) | (2,307 | ) | (1,921 | ) | |||||||
Purchases of intangible assets |
(108 | ) | (297 | ) | — | ||||||||
Payment of related party note arising from business acquisition |
— | (21 | ) | (626 | ) | ||||||||
Net cash provided by (used in) investing activities of continuing operations |
(1,082 | ) | (1,790 | ) | 5,826 | ||||||||
Net cash provided by (used in) investing activities of discontinued operations |
9 | (906 | ) | (537 | ) | ||||||||
Net cash provided by (used in) investing activities |
(1,073 | ) | (2,696 | ) | 5,289 | ||||||||
Cash flows from financing activities: |
|||||||||||||
Payments on short-term debt |
(6,000 | ) | — | — | |||||||||
Proceeds from short-term debt |
3,000 | 4,000 | — | ||||||||||
Purchases of common stock |
(123 | ) | (9,058 | ) | (3,874 | ) | |||||||
Payment of long-term seller financing |
(75 | ) | — | — | |||||||||
Payment of dividends |
— | (2,982 | ) | (9,023 | ) | ||||||||
Proceeds from stock option and warrant exercises |
— | — | 511 | ||||||||||
Excess tax (shortfall) benefit from option/warrant exercises |
— | — | (107 | ) | |||||||||
Net cash used in financing activities of continuing operations |
(3,198 | ) | (8,040 | ) | (12,493 | ) | |||||||
Net cash provided by (used in) financing activities of discontinued operations |
— | — | — | ||||||||||
Net cash used in financing activities |
(3,198 | ) | (8,040 | ) | (12,493 | ) | |||||||
Net increase (decrease) in cash and cash equivalents |
1,141 | (2,231 | ) | 980 | |||||||||
Effect of exchange rate changes on cash and cash equivalents |
(3 | ) | (45 | ) | — | ||||||||
Cash and cash equivalents, beginning of year |
16,049 | 18,325 | 17,345 | ||||||||||
Cash and cash equivalents, end of year |
$ | 17,187 | $ | 16,049 | $ | 18,325 | |||||||
F-7
NEW FRONTIER MEDIA, INC. AND SUBSIDIARIES
CONSOLIDATED STATEMENTS OF CASH FLOWS (Continued)
(in thousands)
| |
Year Ended March 31, | ||||||||||
|---|---|---|---|---|---|---|---|---|---|---|---|
| |
2010 | 2009 | 2008 | ||||||||
Supplemental cash flow data: |
|||||||||||
Interest paid |
$ | 246 | $ | 73 | $ | 26 | |||||
Income taxes paid |
$ | 1,379 | $ | 2,452 | $ | 5,533 | |||||
Noncash investing and financing activities: |
|||||||||||
Escrow funds included in restricted cash used to settle liabilities related to business acquisition |
$ | — | $ | — | $ | 1,660 | |||||
Increase in other identifiable intangible assets, net, for the purchase of intellectual property and a patent |
$ | — | $ | — | $ | 661 | |||||
Refer to Notes to Consolidated Financial Statements.
F-8
NEW FRONTIER MEDIA, INC. AND SUBSIDIARIES
NOTES TO CONSOLIDATED FINANCIAL STATEMENTS
NOTE 1—ORGANIZATION AND SUMMARY OF SIGNIFICANT ACCOUNTING POLICIES
Organization
New Frontier Media, Inc. is a publicly traded holding company for its operating subsidiaries which are reflected in the Transactional TV, Film Production, Direct-to-Consumer and Corporate Administration segments.
Transactional TV Segment
The Transactional TV segment provides adult programming to cable multiple system operators ("MSOs") and direct broadcast satellite ("DBS") providers. The Transactional TV segment is able to provide a variety of editing styles and programming mixes to a broad range of consumers. The Company earns a percentage of revenue, or "split", for each video-on-demand ("VOD"), pay-per-view ("PPV") or subscription that is purchased on customer platforms.
Film Production Segment
The Film Production segment derives its revenue from: a) the production and distribution of original motion pictures known as erotic thrillers, horror movies, and erotic, event styled content (collectively, "owned content") which is provided through MRG Entertainment; b) the licensing of third party films in international and domestic markets where it acts as a sales agent for the product ("repped content") which is provided through Lightning Entertainment Group; and c) the provision of contract film production services to major Hollywood studios ("producer-for-hire" arrangements).
Direct-to-Consumer Segment
The Direct-to-Consumer segment generates revenue primarily by selling memberships to the Company's adult consumer websites. The Direct-to-Consumer segment also historically operated an internet protocol television ("IPTV") set-top box business beginning in late fiscal year 2008. The Company restructured the IPTV operations in the fourth quarter of fiscal year 2009 and discontinued the IPTV operations in the fourth quarter of fiscal year 2010. See Note 19—Discontinued Operations for additional discussion.
Corporate Administration Segment
Expenses reported as Corporate Administration include all costs associated with the operation of the public holding company, New Frontier Media, Inc. that are not directly allocable to the Transactional TV, Film Production, or Direct-to-Consumer segments.
Significant Accounting Policies
Principles of Consolidation
The accompanying consolidated financial statements include the accounts of New Frontier Media, Inc. and its wholly owned subsidiaries (collectively herein referred to as "New Frontier Media," the "Company," and other similar pronouns). All intercompany accounts, transactions and profits have been eliminated in consolidation.
F-9
NEW FRONTIER MEDIA, INC. AND SUBSIDIARIES
NOTES TO CONSOLIDATED FINANCIAL STATEMENTS (Continued)
NOTE 1—ORGANIZATION AND SUMMARY OF SIGNIFICANT ACCOUNTING POLICIES (Continued)
Use of Estimates
The Company is required to make estimates and assumptions that affect the amounts reported in the consolidated financial statements and accompanying notes. The accounting estimates that require the Company's most significant, difficult and subjective judgments include:
- •
- estimated revenue for certain Transactional TV segment PPV and VOD services;
- •
- the recognition and measurement of income tax expenses, assets and liabilities (including the measurement of uncertain tax
positions and valuation of deferred tax assets);
- •
- the valuation of recoupable costs and producer advances;
- •
- the assessment of film costs and the forecast of anticipated revenue ("ultimate" revenue), which is used to amortize film
costs;
- •
- the amortization methodology and valuation of content and distribution rights;
- •
- the valuation of goodwill, intangible and other long-lived assets; and
- •
- the valuation and recognition of share-based compensation.
The Company bases its estimates and judgments on historical experience and on various other factors that are considered reasonable under the circumstances, the results of which form the basis for making judgments that are not readily apparent from other sources. Actual results could differ materially from these estimates.
Reclassifications
Certain prior year amounts have been reclassified to conform with the current year presentation of discontinued operations.
Cash and Cash Equivalents
Cash and cash equivalents include cash on hand, cash in banks and cash equivalents, which are highly liquid investment instruments with original maturities of less than 90 days. The Company had approximately $0.1 million of cash held in foreign bank accounts at March 31, 2010.
Restricted Cash
Restricted cash during the periods presented includes amounts that are contractually restricted in connection with agreements between the Company and certain film producers.
FDIC Limits
The Company maintains cash deposits with major banks, which exceed federally insured limits. As of March 31, 2010, the Company exceeded the federally insured limits by approximately $16.3 million. The Company periodically assesses the financial condition of the institutions and estimates that the risk of any loss is low.
F-10
NEW FRONTIER MEDIA, INC. AND SUBSIDIARIES
NOTES TO CONSOLIDATED FINANCIAL STATEMENTS (Continued)
NOTE 1—ORGANIZATION AND SUMMARY OF SIGNIFICANT ACCOUNTING POLICIES (Continued)
Fair Value of Financial Instruments
The carrying amounts of financial instruments, including cash, cash equivalents, accounts receivable, accounts payable, accrued liabilities, short-term debt, and certain other current assets and liabilities approximate fair value because of their generally short maturities. See Note 5—Fair Value Measurements—for additional detail and discussion.
Accounts Receivable
The majority of the Company's accounts receivable are due from customers in the cable and satellite industries and from the film distribution industry. Credit is extended based on an evaluation of a customer's financial condition and collateral is not required. Accounts receivable are stated at amounts due from customers net of an allowance for doubtful accounts. Customer balances that remain outstanding longer than the contractual payment terms are considered past due. The Company determines its allowance for doubtful accounts on a quarterly basis by considering a number of factors, including the length of time accounts receivable are past due, the Company's previous loss history, the customer's current ability to pay its obligation to the Company, and the condition of the general economy and the cable, satellite and film distribution industries as a whole. Bad debt is reflected as a component of operating expenses in the consolidated statements of operations. When a specific account receivable is determined to be uncollectible, the Company reduces both its accounts receivable and allowances for doubtful accounts accordingly.
Accounts receivable balances associated with the Film Production segment's repped content include the entire license fee due to the Company from the licensee. Amounts collected for these receivables are disbursed to the Company and the producers of the licensed films in accordance with the terms of the related producer agreements.
Inventory
Inventory is stated at the lower of cost or market, using the average cost method. Inventory consisted of IPTV set-top box finished goods within the Direct-to-Consumer segment and were reported within prepaid and other assets in the current asset section on the consolidated balance sheet. As discussed in Note 19—Discontinued Operations, the Company discontinued the IPTV set-top box operations in the fourth quarter of fiscal year 2010. As a result, the Company fully impaired the value of the related inventory, and there are no net inventory balances at March 31, 2010. The inventory balance at March 31, 2009 was $0.1 million.
Equipment and Furniture
Equipment and furniture are stated at historical cost less accumulated depreciation. The cost of maintenance and repairs to equipment and furniture is expensed as incurred, and significant additions and improvements are capitalized. The capitalized costs of leasehold and building improvements are depreciated using a straight-line method over the estimated useful life of the assets or the term of the related leases, whichever is shorter. All other equipment and furniture assets are depreciated using a
F-11
NEW FRONTIER MEDIA, INC. AND SUBSIDIARIES
NOTES TO CONSOLIDATED FINANCIAL STATEMENTS (Continued)
NOTE 1—ORGANIZATION AND SUMMARY OF SIGNIFICANT ACCOUNTING POLICIES (Continued)
straight-line method over the estimated useful life of the assets. At March 31, 2010, the estimated useful lives of equipment and furniture assets were as follows:
Furniture and fixtures |
3 to 5 years | |
Computers, equipment and servers |
3 to 7 years | |
Leasehold improvements |
2 to 10 years |
Content and Distribution Rights
The Transactional TV segment's content library primarily consists of licensed films. The Company capitalizes the costs associated with the licenses as well as certain editing and production costs and amortizes these capitalized costs on a straight-line basis over the term of the licensing agreement (generally 5 years). These costs are amortized using a basis that is consistent with the manner in which the related film revenue is expected to be recognized. The Company amortizes the cost of content and distribution rights on a straight-line basis because each usage of the film is expected to generate similar revenue and the revenue for the films is expected to be recognized ratably over the related license term. The Company regularly reviews and evaluates the appropriateness of amortizing film costs on a straight-line basis as opposed to an alternative method of amortization such as an accelerated basis. Based on these analyses, the Company has determined that the amortization of the film library costs using a straight-line basis most accurately reflects the manner in which the revenue for the related films will be recognized.
The Company periodically reviews the content library and assesses whether the unamortized cost exceeds the fair market value of the library based on expected forecast results when events or circumstances indicate an assessment is warranted. In the event that the unamortized costs exceed the fair market value of the content library, the Company will expense the excess of the unamortized costs to reduce the carrying value to the fair market value.
Recoupable Costs and Producer Advances
Recoupable costs and producer advances represent amounts paid by the Company that are expected to be subsequently recovered through the collection of fees associated with the Company's licensing of repped content. In connection with the Film Production segment's repped content operations, the Company enters into sales agency agreements whereby the Company acts as a sales agent for a producer's film ("Sales Agency Agreements"). These Sales Agency Agreements typically include provisions whereby certain costs that are incurred for promotion related activities will be paid by the Company on behalf of the producer (such as movie trailer and ad material costs). The Company may also pay the producer an advance for the related film prior to the distribution of such film. As the Company subsequently licenses the producer's film and license fees are collected, the recoupable costs and producer advances are recovered by the Company through these license fee collections. License fees typically are not paid to the producer of the related film until such recoupable costs and producer advances have been fully recovered by the Company.
The Company evaluates recoupable costs and producer advances for impairment on a quarterly basis based on estimates of future license fee collections. An impairment of these assets could occur if the Company's estimates indicated that it would be unable to collect fees from the licensing of a film
F-12
NEW FRONTIER MEDIA, INC. AND SUBSIDIARIES
NOTES TO CONSOLIDATED FINANCIAL STATEMENTS (Continued)
NOTE 1—ORGANIZATION AND SUMMARY OF SIGNIFICANT ACCOUNTING POLICIES (Continued)
sufficient to recover the related outstanding recoupable costs and producer advances. During the fiscal years ended March 31, 2010, 2009 and 2008, the Company incurred impairment charges related to recoupable costs and producer advances of $0.8 million, $0.2 million, and $0.2 million, respectively. The impairment charges are recorded in the charge for restructuring and asset impairments other than goodwill line item within the consolidated statements of operations.
Film Costs
The Company capitalizes costs incurred for film production including costs to develop, acquire and produce films, which primarily consist of salaries, equipment and overhead costs, as well as the cost to acquire rights to films. Film costs include amounts for completed films and films still in development. Production overhead, a component of film costs, includes allocable costs of individuals or departments with exclusive or significant responsibility for the production of the films. Interest expense associated with film costs is not capitalized because the duration of productions is short-term in nature. Films are typically direct-to-television in nature. Film costs are stated at the lower of cost, less accumulated amortization, or fair value.
Film costs are reviewed for impairment on a title-by-title basis each quarterly reporting period when events or circumstances indicate an assessment is warranted. The Company records an impairment charge when the fair value of the title is less than the unamortized cost. Examples of events or circumstances that could result in an impairment charge for film costs include (a) an unexpected less favorable performance of a film title or event on a MSO platform or (b) a downward adjustment in the estimated future performance of a film title or event due to an adverse change to the general business climate as was experienced during the third quarter of fiscal year 2009. During each fiscal year ended March 31, 2010, 2009 and 2008, the Company incurred impairment charges related to film costs of $1.2 million, $1.1 million, and $0.7 million, respectively. The impairment charges are recorded in the charge for restructuring and asset impairments other than goodwill line item within the consolidated statements of operations.
Capitalized film costs are recognized as an expense within cost of sales using the film forecast method. Under this method, capitalized film costs are expensed based on the proportion of the film's revenue recognized for such period relative to the film's estimated remaining ultimate revenue, not to exceed ten years. Ultimate revenue is the estimated total revenue expected to be recognized over a film's useful life. Ultimate revenue for new film titles and events is typically estimated using actual historical performance of comparable films that are similar in nature (such as production cost and genre). Film revenue associated with this method includes amounts from all sources on an individual-film-forecast-computation method. Estimates of ultimate revenue are reviewed quarterly and adjusted if appropriate, and amortization is also adjusted on a prospective basis for such a change in estimate. Changes in estimated ultimate revenue could be due to a variety of factors, including the proportional buy rates of the content as compared to competitive content as well as the level of market acceptance of the television product.
Goodwill and Other Intangible Assets
The Company records goodwill when the purchase price of an acquisition exceeds the estimated fair value of the net identified tangible and intangible assets acquired. Goodwill is tested for
F-13
NEW FRONTIER MEDIA, INC. AND SUBSIDIARIES
NOTES TO CONSOLIDATED FINANCIAL STATEMENTS (Continued)
NOTE 1—ORGANIZATION AND SUMMARY OF SIGNIFICANT ACCOUNTING POLICIES (Continued)
impairment at the operating segment level on an annual basis (March 31 for the Company) and between annual tests if an event occurs or circumstances change that would more likely than not reduce the fair value of a reporting unit below its carrying value. These events or circumstances could include, but are not limited to, a significant change in the business climate, legal factors, operating performance indicators, competition, or sale or disposition of a significant portion of a reporting unit. Application of the goodwill impairment test requires judgment in the determination of the fair value of each reporting unit. The fair value of each reporting unit is estimated using considerations of various valuation methodologies which could include income and market valuation approaches. The income approach involves discounting the reporting unit's projected free cash flow at its weighted average cost of capital, and the market approach considers comparable publicly traded company valuations and recent merger and acquisition valuations. The analysis requires significant judgments, including estimation of future cash flows, which is dependent on internal forecasts; estimation of the long-term rate of growth; determination of the weighted average cost of capital; and other similar estimates. Changes in these estimates and assumptions could materially affect the determination of fair value for each reporting unit. The Company allocates goodwill to each operating segment based on the operating segment expected to benefit from the related acquisition and/or combination.
Other identifiable intangible assets subject to amortization primarily include amounts paid to acquire non-compete agreements with certain key executives, contractual and non-contractual customer relationships, intellectual property rights, patents and websites. These costs are capitalized and amortized on a straight-line basis over their estimated useful lives which is typically five years. Intangible asset balances are removed from the gross asset and accumulated amortization amounts in the period in which they become fully amortized or impaired and are no longer in use. Other identifiable intangible assets are reviewed for possible impairment whenever events or changes in circumstances indicate that the carrying amount of an asset may not be recoverable.
See Note 6—Goodwill and Other Intangible Assets for additional detail and discussion on goodwill and other intangible asset impairments.
Long-Lived Assets
The Company continually reviews long-lived assets that are held and used and identifiable intangible assets that are subject to amortization for possible impairment whenever events or changes in circumstances indicate that the carrying amount of an asset may not be recoverable. In evaluating the fair value and future benefits of such assets, the Company considers whether the estimated undiscounted future net cash flows of the individual assets is less than the related assets' carrying value and if so, the Company records an impairment loss for the excess recorded carrying value of the asset as compared to its fair value.
Accrued and Other Liabilities
Accrued and other liabilities included approximately $0.5 million and $0.4 million of accrued transport fees as of March 31, 2010 and 2009, respectively. No other current liability amounts within accrued and other liabilities was in excess of 5% of total current liabilities.
F-14
NEW FRONTIER MEDIA, INC. AND SUBSIDIARIES
NOTES TO CONSOLIDATED FINANCIAL STATEMENTS (Continued)
NOTE 1—ORGANIZATION AND SUMMARY OF SIGNIFICANT ACCOUNTING POLICIES (Continued)
Deferred Producer Liabilities
Deferred producer liabilities represent outstanding amounts due to the producer or to be retained by the Company upon the collection of license fee amounts related to the sale of repped content by the Film Production segment. In accordance with the Sales Agency Agreements entered into by the Company and repped content producers, when license fees associated with the Company's sale of repped content are collected, the amounts are paid to the producer and/or retained by the Company. Amounts are retained by the Company for its sales agency commission, recoupment of outstanding film costs and producer advances ("Recoupable Costs") or as market fee revenue. The terms of the Sales Agency Agreements provide that collected license fees are distributed to the producer and/or retained by the Company based on a specific allocation order as defined by each agreement. The allocation order is dependent on certain criteria including total license fee collections, outstanding Recoupable Cost balances and certain other criteria as specified by the Sales Agency Agreements. Because these criteria cannot be reasonably determined until the license fees are collected, the appropriate allocation order of uncollected license fees cannot be established. Accordingly, the uncollected license fee amounts are recorded as deferred producer liabilities until such time as the amounts are collected and the allocation order can be reasonably determined.
Revenue Recognition
The Company's revenue consists primarily of fees earned through the distribution of its licensed and owned content through various media outlets including MSOs, DBS providers, the internet, premium movie channels, and other available media channels. Revenue also consists of fees earned through the licensing of third-party content whereby the Company acts as a sales agent for the film producer. Revenue is recognized when persuasive evidence of an arrangement exists as is typically evidenced through an executed contract, the services have been rendered or delivery conditions as described in the related contract for the completed film have been satisfied, the license period related to Film Production segment arrangements has begun and the customer can begin exploitation of the content, the fee is fixed or determinable and its collection is reasonably assured. The process involved in evaluating the appropriateness of revenue recognition involves judgment including estimating monthly revenue based on historical data and determining collectability of fees.
Transactional TV Segment VOD and PPV Services
The Transactional TV segment's VOD and PPV revenue are recognized based on buys and monthly subscriber counts reported each month by cable MSOs and DBS providers. The Company earns revenue through a contractual percentage split of the retail price of the content. The actual monthly sales information is not typically reported to the Transactional TV segment until approximately 30 - 90 days after the month of service. This practice requires management to make monthly revenue estimates based on the Transactional TV segment's historical experience with each customer. The revenue may be subsequently adjusted to reflect the actual amount earned upon receipt of the monthly sales reports.
F-15
NEW FRONTIER MEDIA, INC. AND SUBSIDIARIES
NOTES TO CONSOLIDATED FINANCIAL STATEMENTS (Continued)
NOTE 1—ORGANIZATION AND SUMMARY OF SIGNIFICANT ACCOUNTING POLICIES (Continued)
Film Production Segment Owned Content Licensing
Revenue from the licensing of owned content is recognized when persuasive evidence of an arrangement exists as is typically evidenced through an executed contract, the delivery conditions of the completed film have been satisfied as required in the contract, the license period of the arrangement has begun, the fee is fixed or determinable and collection of the fees is reasonably assured. For agreements that involve the distribution of content to the home video market, PPV market and VOD market, the Company is unable to determine or reasonably estimate the revenue split earned from customers in advance of receiving the reported earnings because the performance materially varies by film and from period to period. As a result, the Company's share of licensing revenue from these arrangements is not recognized until the amounts are reported by the customers.
Film Production Segment Repped Content Licensing
The Company recognizes revenue from represented film licensing activities on a net basis as an agent. The revenue recognized for these transactions represents only the sales agency fee earned by the Company on the total content licensing fee. The producers' share of the licensing fee is recorded as a liability by the Company until the balance is remitted to the producer. For agreements that involve the distribution of repped content to the home video market, PPV market and VOD market, the Company is unable to determine or reasonably estimate the revenue split due from customers in advance of receiving the reported earnings because the performance materially varies by film and from period to period. As a result, the Company's share of licensing revenue from these arrangements is not recognized until the amounts are reported by the customers.
The agreements entered into with the producers may also provide for a marketing fee that can be earned by the Company. The marketing fee is stated as a fixed amount and is contractually earned by the Company upon collection of sufficient film licensing fees as defined by the contract, the terms of which vary depending on film quality, distribution markets and other factors. The Company recognizes marketing fees as revenue when the amounts become determinable and the collection of the fee is reasonably assured, which typically occurs in the period of sufficient collection of licensing fees as defined by the respective contract.
Direct-to-Consumer Segment Membership Fees
Revenue from membership fees is recognized over the life of the membership. The Company records an allowance for refunds based on expected membership cancellations, credits and chargebacks.
Multiple Element Transactions
From time to time, the Company enters into transactions involving multiple elements. These multiple element transactions can involve the licensing of content (i.e., the licensing of multiple titles in a single arrangement), the sale of content (i.e., the distribution of multiple titles in a single agreement), the sale of content and contemporaneous purchase of advertising (i.e., receiving a revenue split from a cable MSO or DBS operator and purchasing advertising space on that same operator's platform in a single agreement), or the licensing of content and contemporaneous purchase of advertising (i.e., licensing multiple titles and purchasing advertising space in a publication in a single agreement). Multiple-element transactions require the exercise of judgment in determining the selling price or fair
F-16
NEW FRONTIER MEDIA, INC. AND SUBSIDIARIES
NOTES TO CONSOLIDATED FINANCIAL STATEMENTS (Continued)
NOTE 1—ORGANIZATION AND SUMMARY OF SIGNIFICANT ACCOUNTING POLICIES (Continued)
value of the different elements. The judgments impact the amount of revenue and expenses recognized over the term of the contract, as well as the period in which they are recognized.
The Company accounts for multiple element transactions by first obtaining evidence of the selling price or fair value of the elements. In determining the selling price or fair value of the respective elements, the Company refers to quoted market prices, historical transactions or comparable transactions. If neither vendor specific objective evidence nor third party evidence is available to determine selling price or fair value, the Company uses its best estimate for individual elements of an arrangement. Based on the determined selling price or fair values of each element of the transaction, the value of the single agreement is allocated to each deliverable based on each element's proportional fair value.
Producer-for-Hire Arrangements
The Company's Film Production segment periodically acts as a producer-for-hire for customers. Through these arrangements, the Company provides services and incurs costs associated with the film production, and the Company earns a fee for its services once the film has been delivered to the customer. The Company maintains no ownership rights for the produced content. Revenue for these arrangements is recognized when persuasive evidence of an arrangement exists as evidenced by an executed contract, the film has been delivered to the customer in accordance with the contract terms, the fee is fixed and determinable and collection is reasonably assured. The costs incurred for production in these arrangements are initially recorded as a deferred cost within the current assets section of the balance sheet, and the deferred costs are subsequently recorded as a cost of sales when the Company recognizes revenue for the related services. During the fiscal year ended March 31, 2010, the Company completed and recognized revenue on a producer-for-hire arrangement and completed the initial delivery and recognized revenue related to films from a second producer-for-hire arrangement resulting in total producer-for-hire revenue of $3.9 million in fiscal year 2010. The Company had approximately $0.6 million in deferred costs recorded in connection with the uncompleted portion of the second producer-for-hire arrangement. The Company had no significant producer-for-hire arrangements and no material deferred costs recorded in connection with producer-for-hire arrangements during the fiscal year ended March 31, 2009. During the fiscal year ended March 31, 2008, the Company completed and recognized approximately $2.5 million of revenue on a producer-for-hire arrangement.
Advertising Costs
The Company expenses advertising costs, which includes tradeshow and promotional related expenses, as incurred. Advertising costs for the fiscal years ended March 31, 2010, 2009 and 2008 were approximately $2.3 million, $2.3 million and $1.3 million, respectively.
Research and Development Costs
Costs related to the research, design and development of products are charged to research and development expense as incurred. The Company did not incur any material research and development costs during the fiscal years ended March 31, 2010, 2009 and 2008 related to continuing operations. Research and development costs related to discontinued operations for the fiscal years ended March 31, 2010 and 2009 were approximately $0.2 million and $0.3 million, respectively. No material research and development costs related to discontinued operations were incurred during the fiscal year ended March 31, 2008.
F-17
NEW FRONTIER MEDIA, INC. AND SUBSIDIARIES
NOTES TO CONSOLIDATED FINANCIAL STATEMENTS (Continued)
NOTE 1—ORGANIZATION AND SUMMARY OF SIGNIFICANT ACCOUNTING POLICIES (Continued)
Employee Equity Incentive Plans
The Company has an employee equity incentive plan, which is described more fully in Note 3—Employee Equity Incentive Plans. Employee equity awards are accounted for under the fair value method. Accordingly, the Company measures share-based compensation at the grant date based on the fair value of the award. The Company uses the straight-line attribution method to recognize the fair value of the award over the related service period.
The Company uses the Black-Scholes option pricing model to estimate the fair value of options granted. Volatility assumptions are derived using historical volatility data. The expected term data was stratified between officers and non-officers and determined using the weighted average exercise behavior for these two groups of employees. The dividend yield assumption is based on dividends declared by the Company's Board of Directors and estimates of dividends to be declared in the future. Share-based compensation expense is based on awards ultimately expected to vest, reduced for estimated forfeitures. Forfeitures are estimated at the time of grant and revised, if necessary, in subsequent periods if actual forfeitures differ from those estimates. Forfeitures were estimated based on historical experience and are stratified between officers and non-officers.
Income Taxes
The Company makes certain estimates and judgments in determining its income tax provision expense. These estimates and judgments are used in the determination of tax credits, benefits and deductions, uncertain tax positions, and the calculation of certain tax assets and liabilities which are a result of differences in the timing of the recognition of revenue and expense for tax and financial statement purposes. The Company also uses estimates and judgments in determining interest and penalties on uncertain tax positions. Significant changes to these estimates could result in a material change to the Company's tax provision expense in subsequent periods.
The Company is required to evaluate the likelihood that it will be able to recover its deferred tax assets. If the Company's evaluation determines that the recovery is unlikely, it would increase the tax provision expense by recording a valuation allowance against the deferred tax assets equal to the amount that is not expected to be recoverable. The Company currently has a deferred tax asset valuation allowance of approximately $0.2 million to fully reserve for a deferred tax asset associated with the Company's discontinued IPTV set-top box operating losses in Europe. The Company has no other deferred tax asset valuation allowances and estimates that, with the exception of the IPTV set-top box European deferred tax assets, its deferred tax assets will be recoverable. If these estimates were to change and the Company's assessment indicated it would be unable to recover the deferred tax assets, the Company would be required to increase its tax provision expense in the period of the change in estimate.
The calculation of the Company's tax liabilities involves dealing with uncertainties in the application of tax regulations. The Company accounts for uncertain tax positions using a two-step approach to recognizing and measuring uncertain tax position liabilities. The first step is to evaluate the tax position for recognition by determining if the weight of available evidence indicates that it is more likely than not that the position will be sustained on audit, including resolution of related appeals or litigation processes, if any. The second step is to measure the tax benefit as the largest amount that is more than 50% likely of being realized upon ultimate settlement. This process is based on various
F-18
NEW FRONTIER MEDIA, INC. AND SUBSIDIARIES
NOTES TO CONSOLIDATED FINANCIAL STATEMENTS (Continued)
NOTE 1—ORGANIZATION AND SUMMARY OF SIGNIFICANT ACCOUNTING POLICIES (Continued)
factors including, but not limited to, changes in facts and circumstances, changes in tax law, settlement of issues under audit, and new audit activity. Changes to these factors and the Company's estimates regarding these factors could result in the recognition of a tax benefit or an additional charge to the tax provision expense.
Income (Loss) per Share
Basic income (loss) per share is computed on the basis of the weighted average number of common shares outstanding. Diluted income (loss) per share is computed on the basis of the weighted average number of common shares outstanding plus the potential dilutive effect of outstanding warrants and stock options.
Comprehensive Income (Loss)
The Company's comprehensive income (loss) includes all changes in equity (net assets) during the period from non-owner sources. During the periods presented, comprehensive income (loss) includes the Company's net income (loss), unrealized gain on investments and the cumulative adjustment from foreign currency translation.
Foreign Currency Translations
The functional currency for all of the Company's U.S. based subsidiaries is the U.S. dollar. The functional currency for the Company's foreign subsidiaries is the local currency. Assets and liabilities denominated in foreign currencies are translated using the exchange rates on the balance sheet dates. Revenues and expenses are translated using the average exchange rates prevailing during the periods presented. Any translation adjustments resulting from this process are shown separately as a component of accumulated other comprehensive income (loss) within shareholders' equity in the consolidated balance sheets. Foreign currency transaction gains and losses are reported in the operating expense section of the consolidated statements of operations.
Recently Issued Accounting Pronouncements
From time to time, new accounting pronouncements are issued that are adopted by the Company as of the specified effective date. Unless otherwise discussed below, the Company believes that the impact of recently issued standards that are not yet effective will not have a material impact on the Company's results of operations and financial position.
Accounting Standards Codification Pronouncement
On July 1, 2009, the Company adopted the provisions of Accounting Standards Update ("ASU") No. 2009-1, Generally Accepted Accounting Principles, which establishes the Financial Accounting Standards Board ("FASB") Accounting Standards Codification ("FASB ASC" or "Codification"). The Codification is the single source of authoritative nongovernmental generally accepted accounting principles ("GAAP"), superseding existing FASB, American Institute of Certified Public Accountants, Emerging Issues Task Force, and related accounting pronouncements. The Codification reorganizes the GAAP pronouncements into accounting topics and displays them using a consistent structure. The Codification also organizes the relevant Securities and Exchange Commission ("SEC") guidance using
F-19
NEW FRONTIER MEDIA, INC. AND SUBSIDIARIES
NOTES TO CONSOLIDATED FINANCIAL STATEMENTS (Continued)
NOTE 1—ORGANIZATION AND SUMMARY OF SIGNIFICANT ACCOUNTING POLICIES (Continued)
the same topic structure. The impact on the Company's financial statements is limited to disclosures as all future references to authoritative accounting literature will be referenced in accordance with the Codification.
Fair Value Measurement Pronouncement
On July 1, 2009, the Company adopted certain provisions of FASB ASC Topic 320-10-65 (Staff Position No FAS 107-1 and APB 28-1, Interim Disclosure about Fair Value of Financial Instruments). This guidance requires interim disclosures regarding the fair values of financial instruments on an interim basis as well as changes in the methods and significant assumptions from prior periods. The impact on the Company's financial statements from the adoption of this guidance is limited to disclosures regarding the fair values of financial instruments and did not have any other material impact on the Company's results of operations and financial position.
Revenue Recognition Pronouncement
In October 2009, the FASB issued ASU No 2009-13, Revenue Recognition—Multiple-Deliverable Revenue Arrangements (FASB ASC Topic 605), a consensus of the FASB Emerging Issues Task Force. This guidance modifies the fair value requirements of FASB ASC subtopic 605-25, Revenue Recognition-Multiple Element Arrangements, by allowing the use of the "best estimate of selling price" in addition to vendor specific objective evidence ("VSOE"), now referred to as third-party evidence ("TPE") for determining the selling price of a deliverable. A vendor is now required to use its best estimate of the selling price when VSOE or TPE of the selling price cannot be determined. In addition, the residual method of allocating arrangement consideration is no longer permitted.
This update requires expanded qualitative and quantitative disclosures and is effective for fiscal years beginning on or after June 15, 2010. However, companies may elect to adopt as early as interim periods ended September 30, 2009. This update may be applied either prospectively from the beginning of the fiscal year for new or materially modified arrangements or retrospectively. The Company elected to adopt this guidance early as of October 1, 2009 and the adoption of the guidance did not have a material impact on the Company's results of operations and financial position.
F-20
NEW FRONTIER MEDIA, INC. AND SUBSIDIARIES
NOTES TO CONSOLIDATED FINANCIAL STATEMENTS (Continued)
NOTE 2—INCOME (LOSS) PER SHARE
The components of basic and diluted income (loss) per share from continuing operations are as follows (in thousands, except per share data):
| |
Year Ended March 31, | |||||||||
|---|---|---|---|---|---|---|---|---|---|---|
| |
2010 | 2009 | 2008 | |||||||
Income (loss) from continuing operations |
$ | (1,113 | ) | $ | (2,970 | ) | $ | 8,836 | ||
Average outstanding shares of common stock |
19,481 | 22,039 | 24,020 | |||||||
Dilutive effect of warrants/stock options |
— | — | 128 | |||||||
Common stock and common stock equivalents |
19,481 | 22,039 | 24,148 | |||||||
Basic income (loss) per share from continuing operations |
$ | (0.06 | ) | $ | (0.13 | ) | $ | 0.37 | ||
Diluted income (loss) per share from continuing operations |
$ | (0.06 | ) | $ | (0.13 | ) | $ | 0.37 | ||
The Company computed basic income (loss) per share from continuing operations using net income (loss) from continuing operations and the weighted average number of common shares outstanding during the period. The Company computed diluted income (loss) per share from continuing operations using net income (loss) from continuing operations and the weighted average number of common shares outstanding plus potentially dilutive common shares outstanding during the period. For the years ended March 31, 2010 and 2009, there was no dilutive effect from options or warrants because the inclusion of options and warrants in the calculation of diluted loss per share would be antidulitive. Potentially dilutive common shares outstanding were approximately 1.0 million for fiscal year 2008. Inclusion of these options and warrants would be antidilutive
NOTE 3—EMPLOYEE EQUITY INCENTIVE PLANS
Equity Plan
The Company adopted the New Frontier Media, Inc. 2007 Stock Incentive Plan (the "2007 Plan") during fiscal year 2008. The 2007 Plan was approved by the Company's shareholders and the purpose of the 2007 Plan was to replace prior plans with one incentive plan. No awards or grants are available to be made under prior plans. Under the 2007 Plan, employees and directors of the Company may be granted incentive stock options, restricted stock, bonus stock and other awards, or any combination thereof. There were 1,250,000 shares of the Company's common stock originally authorized for issuance under the 2007 Plan and the maximum number of shares of common stock that may be subject to one or more awards granted to a participant during any calendar year is 350,000 shares. Awards granted under the 2007 Plan that are subsequently forfeited or cancelled may be reissued under the provisions of the 2007 Plan. Options have been granted to employees and non-employee directors of New Frontier Media with exercise prices equal to, or in excess of, the fair market value of the underlying common stock at the date of grant. As of March 31, 2010, there are no awards available for issuance under the 2007 Plan. The Company issues new shares of common stock upon the exercise of stock options.
F-21
NEW FRONTIER MEDIA, INC. AND SUBSIDIARIES
NOTES TO CONSOLIDATED FINANCIAL STATEMENTS (Continued)
NOTE 3—EMPLOYEE EQUITY INCENTIVE PLANS (Continued)
Stock Options
The Company accounts for employee and non-employee director stock options under the fair value method which requires the use of an option pricing model for estimating fair value. Accordingly, share-based compensation is measured at grant date based on the estimated fair value of the award. The Company uses the straight-line attribution method to recognize share-based compensation costs over the requisite service period of the award. Share-based compensation is determined using the Black-Scholes option pricing model for estimating the fair value of options granted under the Company's equity incentive plan. The Company uses certain assumptions in order to calculate the fair value of an option using the Black-Scholes option pricing model. The volatility assumptions are derived using historical volatility data. The expected term assumptions are stratified between officers and non-officers and are determined using the estimated weighted average exercise behavior for these two groups of employees. The dividend yield assumption is based on dividends declared by the Company's Board of Directors and estimates of dividends to be declared in the future.
The weighted average estimated fair values of stock option grants and the weighted average assumptions that were used in calculating such values for the three years ended March 31 were as follows:
| |
2010 | 2009 | 2008 | |||||||
|---|---|---|---|---|---|---|---|---|---|---|
Weighted average estimated fair value per award |
$ | 0.91 | $ | 2.33 | $ | 1.40 | ||||
Expected term from grant date (in years) |
5 | 5 | 5 | |||||||
Risk free interest rate |
2.4 | % | 2.7 | % | 3.5 | % | ||||
Expected volatility |
56 | % | 52 | % | 53 | % | ||||
Expected dividend yield |
— | % | — | % | 8 | % | ||||
Share-based compensation expense recognized in the consolidated statements of operations is based on awards ultimately expected to vest, which considers estimated forfeitures. Forfeitures are estimated at the time of grant and revised, if necessary, in subsequent periods if actual forfeitures differ from those estimates. The Company recognizes the effect of adjusting the estimated forfeiture rate for all expense amortization in the period that the Company changes the forfeiture estimate. The effect of forfeiture adjustments during the fiscal years 2010, 2009, and 2008 was to reduce the related expenses by approximately $0.3 million, $0.2 million and $0.1 million, respectively.
The following table summarizes the effects of share-based compensation resulting from options granted under the Company's equity incentive plans. This expense is included in cost of sales, sales and marketing expenses, and general and administrative expenses (in thousands, except per share amounts):
| |
Year Ended March 31, | |||||||||
|---|---|---|---|---|---|---|---|---|---|---|
| |
2010 | 2009 | 2008 | |||||||
Share-based compensation expense before income taxes |
$ | 555 | $ | 907 | $ | 905 | ||||
Income tax benefit |
(189 | ) | (363 | ) | (335 | ) | ||||
Total share-based compensation expense after income taxes |
$ | 366 | $ | 544 | $ | 570 | ||||
Share-based compensation effects on basic earnings (loss) per common share |
$ | 0.02 | $ | 0.02 | $ | 0.02 | ||||
Share-based compensation effects on diluted earnings (loss) per common share |
$ | 0.02 | $ | 0.02 | $ | 0.02 | ||||
F-22
NEW FRONTIER MEDIA, INC. AND SUBSIDIARIES
NOTES TO CONSOLIDATED FINANCIAL STATEMENTS (Continued)
NOTE 3—EMPLOYEE EQUITY INCENTIVE PLANS (Continued)
Stock option transactions during the year ended March 31, 2010 are summarized as follows:
| |
Stock Options | Weighted Average Exercise Price |
Weighted Average Remaining Contractual Term (Years) |
Aggregate Intrinsic Value(1) (in thousands) |
|||||||||
|---|---|---|---|---|---|---|---|---|---|---|---|---|---|
Outstanding at March 31, 2009 |
1,991,902 | $ | 6.08 | ||||||||||
Granted |
617,000 | $ | 2.16 | ||||||||||
Forfeited/expired |
(380,000 | ) | $ | 5.41 | |||||||||
Outstanding at March 31, 2010 |
2,228,902 | $ | 5.11 | 7.2 | $ | — | |||||||
Options exercisable at March 31, 2010 |
1,144,027 | $ | 6.84 | 5.4 | $ | — | |||||||
Options vested and expected to vest—non-officers |
914,299 | $ | 5.73 | 6.5 | $ | — | |||||||
Options vested and expected to vest—officers |
1,141,719 | $ | 4.92 | 7.4 | $ | — | |||||||
- (1)
- The aggregate intrinsic value represents the difference between the exercise price and the value of New Frontier Media, Inc. stock at the time of exercise or at the end of the period if unexercised.
During fiscal year 2010, approximately 28,000 warrants expired. There are no remaining outstanding warrants as of March 31, 2010.
As of March 31, 2010, there was approximately $0.2 million and $0.8 million of total unrecognized compensation costs for non-officers and officers, respectively, related to stock options granted under the Company's equity incentive plan. The unrecognized compensation cost for non-officers and officers is expected to be recognized over a weighted average period of two years.
NOTE 4—INVESTMENTS—OTHER
Certificates of deposit held for investment that are not debt securities are included in investments—other. The Company had no investments—other at March 31, 2010. The Company had $0.1 million of investments—other at March 31, 2009.
NOTE 5—FAIR VALUE MEASUREMENTS
The Company accounts for certain assets and liabilities at fair value. The hierarchy below lists the three levels of fair value based on the extent to which inputs used in measuring fair value are observable in the market. The Company categorizes each of its fair value measurements in one of these three levels based on the lowest level input that is significant to the fair value measurement in its entirety. These levels are:
- •
- Level 1—inputs are based upon unadjusted quoted prices for identical instruments traded in active
markets.
- •
- Level 2—inputs are based upon quoted prices for similar instruments in active markets, quoted prices for identical or similar instruments in markets that are not active, and model-based valuation techniques (such as a Black-Scholes model) for which all significant inputs are
F-23
NEW FRONTIER MEDIA, INC. AND SUBSIDIARIES
NOTES TO CONSOLIDATED FINANCIAL STATEMENTS (Continued)
NOTE 5—FAIR VALUE MEASUREMENTS (Continued)
- •
- Level 3—inputs are generally unobservable and typically reflect management's estimates of assumptions that market participants would use in pricing the asset or liability. The fair values are therefore determined using model-based techniques, including option pricing models and discounted cash flow models.
observable in the market or can be corroborated by observable market data for substantially the full term of the assets or liabilities.
Assets and Liabilities Measured at Fair Value on a Nonrecurring Basis
The Company measures certain assets, such as goodwill, film costs and intangible assets, at fair value on a nonrecurring basis when they are deemed to be impaired. The fair values are determined based on valuation techniques using the best information available and may include quoted market prices, market comparables, and discounted cash flow projections. An impairment charge is recorded when the cost of the asset exceeds its fair value. The following table presents the Company's assets and liabilities measured at fair value on a nonrecurring basis as of March 31, 2010 (in thousands):
| |
Level 1 | Level 2 | Level 3 | Net Fair Value |
Impairment Charge |
|||||||||||
|---|---|---|---|---|---|---|---|---|---|---|---|---|---|---|---|---|
Goodwill(1) |
$ | — | $ | — | $ | — | * | $ | — | $ | 4,856 | |||||
Film costs(2) |
— | — | 257 | 257 | 1,207 | |||||||||||
Intangible assets(3) |
— | — | — | * | — | 291 | ||||||||||
Assets held for sale(4) |
— | — | 134 | 134 | 64 | |||||||||||
Inventory(5) |
— | — | — | * | — | 146 | ||||||||||
Other long-lived assets(6) |
— | — | 301 | 301 | 831 | |||||||||||
Total |
$ | — | $ | — | $ | 692 | $ | 692 | $ | 7,395 | ||||||
- *
- Fair
values were measured using Level 3 inputs, and the fair values were zero.
- (1)
- Measurement
relates to the Film Production segment goodwill impairment analysis. See Note 6—Goodwill and Other Intangible Assets for
additional discussion.
- (2)
- Measurement
relates to the Film Production segment film cost impairment analysis. See Note 9—Film Costs for additional discussion.
- (3)
- Measurement
relates to the Direct-to-Consumer segment website and related software impairment analysis. See
Note 6—Goodwill and Other Intangible Assets for additional discussion.
- (4)
- Measurement
relates to the discontinued IPTV set-top box equipment impairment analysis. See Note 19—Discontinued Operations
for additional discussion.
- (5)
- Measurement
relates to the discontinued IPTV set-top box inventory impairment analysis. See Note 19—Discontinued Operations
for additional discussion.
- (6)
- Measurement primarily relates to property, equipment, recoupable costs and producer advances, and other long-lived assets.
F-24
NEW FRONTIER MEDIA, INC. AND SUBSIDIARIES
NOTES TO CONSOLIDATED FINANCIAL STATEMENTS (Continued)
NOTE 5—FAIR VALUE MEASUREMENTS (Continued)
The following table presents the Company's assets and liabilities measured at fair value on a nonrecurring basis as of March 31, 2009 (in thousands):
| |
Level 1 | Level 2 | Level 3 | Net Fair Value |
Impairment Charge |
|||||||||||
|---|---|---|---|---|---|---|---|---|---|---|---|---|---|---|---|---|
Goodwill(1) |
$ | — | $ | — | $ | 4,856 | $ | 4,856 | $ | 10,009 | ||||||
Film costs(2) |
— | — | 504 | 504 | 1,062 | |||||||||||
Intangible assets(3) |
— | — | — | * | — | 938 | ||||||||||
Other long-lived assets(4) |
— | — | 82 | 82 | 236 | |||||||||||
Total |
$ | — | $ | — | $ | 5,442 | $ | 5,442 | $ | 12,245 | ||||||
- *
- Fair
values were measured using Level 3 inputs, and the fair values were zero.
- (1)
- Measurement
relates to the Film Production segment goodwill impairment analysis. See Note 6—Goodwill and Other Intangible Assets for
additional discussion.
- (2)
- Measurement
relates to the Film Production segment film cost impairment analysis. See Note 9—Film Costs for additional discussion.
- (3)
- Measurement
relates to the discontinued IPTV set-top box intangible asset impairment analysis. See Note 19—Discontinued
Operations and Note 6—Goodwill and Other Intangible Assets for additional discussion.
- (4)
- Measurement primarily relates to property, equipment, recoupable costs and producer advances, and other long-lived assets.
NOTE 6—GOODWILL AND OTHER INTANGIBLE ASSETS
Goodwill
Goodwill is classified within the segment that employs the goodwill in its operations. Changes in the carrying amount of goodwill for the years ended March 31, 2010 and 2009, by reportable segment, were as follows (in thousands):
| |
Transactional TV | Film Production | Total | |||||||
|---|---|---|---|---|---|---|---|---|---|---|
Balance as of March 31, 2008 |
$ | 3,743 | $ | 14,865 | $ | 18,608 | ||||
Impairment |
— | (10,009 | ) | (10,009 | ) | |||||
Balance as of March 31, 2009 |
3,743 | 4,856 | 8,599 | |||||||
Impairment |
— | (4,856 | ) | (4,856 | ) | |||||
Balance as of March 31, 2010 |
$ | 3,743 | $ | — | $ | 3,743 | ||||
F-25
NEW FRONTIER MEDIA, INC. AND SUBSIDIARIES
NOTES TO CONSOLIDATED FINANCIAL STATEMENTS (Continued)
NOTE 6—GOODWILL AND OTHER INTANGIBLE ASSETS (Continued)
Fiscal Year 2010
The Company performed annual goodwill impairment tests for the Transactional TV and Film Production segments at March 31, 2010 and engaged a third party valuation firm to assist with the tests. The income and market valuation approaches were considered in determining the estimated fair value of the segments. For the Transactional TV segment, the market valuation approach was more heavily weighted than the income valuation approach because (a) the overall Company valuation is believed to be primarily based on the performance and results of the Transactional TV segment, and (b) the results of the Transactional TV segment represent the large majority of the Company's overall activity. For the Film Production segment, the valuation methodologies were weighted equally. The results of the analysis did not indicate any goodwill impairment for the Transactional TV segment. The results of the analysis did indicate that the estimated fair value of the Film Production segment was less than its carrying value. The Company then performed additional analysis to estimate the implied fair value of goodwill. The Company determined the implied fair value of the goodwill by first allocating the estimated fair value of the Film Production segment to the tangible and identifiable intangible assets and liabilities of the operating segment. The excess of the estimated fair value over the amounts assigned to the assets and liabilities is the implied fair value of goodwill. Based on this analysis, the Company recorded a goodwill impairment charge of $4.9 million to reduce the Film Production segment's goodwill from $4.9 million to the implied fair value of goodwill of zero. Although the fiscal year 2010 performance of the Film Production segment was consistent with the Company's internal forecasts, conditions within the film markets continued to be challenging. Based on historical and current experience within the film production markets and in connection with the year end annual goodwill impairment test, the Company modified its five year forecast for the Film Production segment downward to reflect the expectation that film market conditions would remain depressed and decline further. As a result of the downward adjustment to the five year forecast, the Company's Film Production segment incurred the goodwill impairment charge.
Due to the continued pressure on the Company's stock price during fiscal year 2010, the Company's market capitalization was less than its shareholders' equity balance at March 31, 2010. As an overall test of the reasonableness of the estimated fair value of the reporting segments and consolidated Company, a reconciliation of the fair value estimates for the reporting segments to the Company's market capitalization was also performed as of March 31, 2010. The reconciliation considered a reasonable control premium based on merger and acquisition transactions within the media and entertainment industry and other relevant information. Based on the reconciliation, the Company's fair value was in excess of its market capitalization and there was no indicator of additional goodwill impairment. A control premium is the amount that a buyer is willing to pay over the current market price of a company as indicated by the traded price per share (i.e. market capitalization), in order to acquire a controlling interest. The premium is justified by the expected synergies, such as the expected increase in cash flow resulting from cost savings and revenue enhancements.
Fiscal Year 2009
During the third quarter of fiscal year 2009, the Company determined that continued adverse changes in the business climate and material revisions to the Film Production segment's internal three year forecasts based on lower than expected revenue for the third quarter of fiscal year 2009 were events that could indicate that the fair value of the reporting unit was less than its carrying amount. The Company therefore performed an impairment test as of December 31, 2008 and engaged an
F-26
NEW FRONTIER MEDIA, INC. AND SUBSIDIARIES
NOTES TO CONSOLIDATED FINANCIAL STATEMENTS (Continued)
NOTE 6—GOODWILL AND OTHER INTANGIBLE ASSETS (Continued)
independent firm to assist in performing the impairment test. The income and market approaches were considered in determining the estimated fair value of the segment. The income approach was more heavily weighted than the market valuation approaches primarily because (a) the comparable market valuation approach companies were not profitable in certain instances which required the Company to estimate enterprise value based on revenue multiples and revenue multiples are considered to be a less accurate measure of fair value as compared to alternative measures such as EBITDA, (b) the difference in the revenue multiples for the comparable companies were material and (c) there was a lack of comparability between the reporting unit and comparable companies. Based on the impairment testing, the Company determined that the estimated fair value of the Film Production segment was less than its carrying value. The Company then performed additional analysis to estimate the implied fair value of goodwill. Based on this analysis, the Company recorded a goodwill impairment charge of $10.0 million to reduce the Film Production segment's goodwill from $14.9 million to the implied fair value of goodwill of $4.9 million. The Company also performed the annual goodwill impairment tests for the Transactional TV and Film Production segments at March 31, 2009. The valuation methodologies for the Transactional TV and Film Production segments were similar to the methodologies used at March 31, 2010 and December 31, 2008, respectively. The results of the analysis did not indicate any additional goodwill impairment.
Due to the deterioration in the overall stock market during the second half of fiscal year 2009, the Company's market capitalization was below its shareholders' equity balance at March 31, 2009. As an overall test of the reasonableness of the estimated fair value of the reporting segments and consolidated Company, a reconciliation of the fair value estimates for the reporting segments to the Company's market capitalization was also performed as of March 31, 2009. The reconciliation considered a reasonable control premium based on merger and acquisition transactions within the media and entertainment industry and other relevant information. Based on the reconciliation, the Company's fair value was in excess of its market capitalization and there was no indicator of additional goodwill impairment.
Other Identifiable Intangible Assets
Intangible assets that are subject to amortization were as follows (in thousands, except useful life):
| |
|
March 31, 2010 | March 31, 2009 | ||||||||||||||||||||||||
|---|---|---|---|---|---|---|---|---|---|---|---|---|---|---|---|---|---|---|---|---|---|---|---|---|---|---|---|
| |
Useful Life (Years) |
Gross Carrying Amounts |
Accumulated Amortization |
Impairment | Net | Gross Carrying Amounts |
Accumulated Amortization |
Impairment | Net | ||||||||||||||||||
Non-compete agreement |
5 | $ | 2,131 | $ | (1,739 | ) | $ | (47 | ) | $ | 345 | $ | 2,131 | $ | (1,325 | ) | $ | (47 | ) | $ | 759 | ||||||
Contractual/noncontractual relationship |
5 | 1,375 | (1,146 | ) | — | 229 | 1,375 | (871 | ) | — | 504 | ||||||||||||||||
Intellectual property |
5 | 540 | (126 | ) | (414 | ) | — | 540 | (126 | ) | (414 | ) | — | ||||||||||||||
Websites |
5 | 156 | (65 | ) | (54 | ) | 37 | 497 | (94 | ) | (54 | ) | 349 | ||||||||||||||
Patents |
5 | 460 | (107 | ) | (353 | ) | — | 460 | (107 | ) | (353 | ) | — | ||||||||||||||
Other |
2.5 - 15 | 234 | (102 | ) | (70 | ) | 62 | 178 | (90 | ) | (70 | ) | 18 | ||||||||||||||
|
$ | 4,896 | $ | (3,285 | ) | $ | (938 | ) | $ | 673 | $ | 5,181 | $ | (2,613 | ) | $ | (938 | ) | $ | 1,630 | |||||||
Amortization expense for intangible assets subject to amortization during each of the fiscal years ended March 31, 2010, 2009 and 2008 was approximately $0.8 million. Amortization expense for intangible assets subject to amortization for the fiscal year ending March 31, 2011 is estimated to be
F-27
NEW FRONTIER MEDIA, INC. AND SUBSIDIARIES
NOTES TO CONSOLIDATED FINANCIAL STATEMENTS (Continued)
NOTE 6—GOODWILL AND OTHER INTANGIBLE ASSETS (Continued)
approximately $0.6 million. Amortization expense for intangible assets subject to amortization for the fiscal year ending March 31, 2012 and thereafter is expected to be immaterial.
During the fourth quarter of fiscal year 2010, the Company determined that certain internally developed websites and related software used to manage its Direct-to-Consumer segment consumer websites no longer met its quality standards. Additionally, the software did not provide sufficient support or functionality for content management, database interface, consumer facing websites, or accumulation or reporting of website traffic. As a result, the Company ceased using the websites and software and determined the websites and software would not provide any service potential in the future. As a result, the Company recorded an impairment charge of $0.3 million to reduce the fair value of the websites and related software to zero. The Company removed the websites and related software gross carrying amounts and accumulated amortization balances because the assets were fully impaired and no longer in use.
Based primarily on lower than expected performance and the economic downturn in fiscal year 2009, the Company restructured the Direct-to-Consumer segment's new product operations including the IPTV set-top box business. In connection with the restructuring, the Company evaluated whether the anticipated undiscounted future net cash flows associated with the related intangible assets was in excess of the assets' carrying value and recorded an impairment expense of approximately $0.9 million for the excess carrying value as compared to its fair value in the fourth quarter of fiscal year 2009. The impairment expense is recorded within discontinued operations. See additional discussion at Note 19—Discontinued Operations.
NOTE 7—EQUIPMENT AND FURNITURE
The components of equipment and furniture as of March 31 were as follows (in thousands):
| |
2010 | 2009 | |||||
|---|---|---|---|---|---|---|---|
Furniture and fixtures |
$ | 701 | $ | 594 | |||
Computers, equipment and servers |
7,274 | 7,368 | |||||
Leasehold improvements |
2,816 | 2,736 | |||||
Equipment and furniture, at cost |
10,791 | 10,698 | |||||
Less accumulated depreciation |
(6,234 | ) | (5,125 | ) | |||
Total equipment and furniture, net |
$ | 4,557 | $ | 5,573 | |||
Depreciation expense was approximately $1.7 million, $1.7 million, and $1.5 million for the fiscal years ended March 31, 2010, 2009, and 2008, respectively. During the fiscal years ended March 31, 2010 and 2009, the Company retired approximately $0.6 million and $2.2 million, respectively, of fully depreciated equipment and furniture.
NOTE 8—CONTENT AND DISTRIBUTION RIGHTS
The Company's Transactional TV and Direct-to-Consumer segments' content and distribution rights consist of content licensing agreements and original productions. The Company capitalizes the costs associated with the licenses, certain editing costs, and content. These costs are amortized on a
F-28
NEW FRONTIER MEDIA, INC. AND SUBSIDIARIES
NOTES TO CONSOLIDATED FINANCIAL STATEMENTS (Continued)
NOTE 8—CONTENT AND DISTRIBUTION RIGHTS (Continued)
straight-line basis, typically over 5 years. The components of content and distribution rights as of March 31 were as follows (in thousands):
| |
2010 | 2009 | |||||
|---|---|---|---|---|---|---|---|
In release |
$ | 19,705 | $ | 18,458 | |||
Acquired, not yet released |
1,341 | 944 | |||||
In production |
116 | — | |||||
Accumulated amortization |
(9,846 | ) | (8,469 | ) | |||
Total content and distribution rights, net |
$ | 11,316 | $ | 10,933 | |||
Amortization expense for the years ended March 31, 2010, 2009 and 2008 was approximately $3.8 million, $3.6 million and $3.2 million, respectively. During the years ended March 31, 2010 and 2009, the Company retired approximately $2.4 million and $2.6 million, respectively, of fully amortized content and distribution rights. The Company had no material write-offs of content and distribution rights during the fiscal years ended March 31, 2010, 2009 or 2008.
During the fourth quarter of fiscal year 2010, the Company began producing original content for the Transactional TV and Direct-to-Consumer segments.
NOTE 9—FILM COSTS
The components of film costs, which are primarily direct-to-television, are as follows (in thousands):
| |
March 31, | ||||||
|---|---|---|---|---|---|---|---|
| |
2010 | 2009 | |||||
In release |
$ | 18,477 | $ | 17,782 | |||
Completed, not yet released |
82 | 134 | |||||
In production |
1,645 | 691 | |||||
Accumulated amortization |
(14,499 | ) | (11,935 | ) | |||
Total film costs, net |
$ | 5,705 | $ | 6,672 | |||
Amortization expense for the years ended March 31, 2010, 2009 and 2008 was approximately $2.6 million, $2.7 million and $2.8 million, respectively. The Company expects to amortize approximately $2.5 million in capitalized film costs during fiscal year 2011. The Company expects to amortize substantially all unamortized film costs for released films by March 31, 2013.
F-29
NEW FRONTIER MEDIA, INC. AND SUBSIDIARIES
NOTES TO CONSOLIDATED FINANCIAL STATEMENTS (Continued)
NOTE 9—FILM COSTS (Continued)
During the fourth quarter of fiscal year 2010, the Company recorded a non-cash impairment expense of approximately $1.2 million associated with several Film Production segment owned content films and events. As part of the quarterly film performance analysis and in connection with the annual goodwill impairment analysis, the Company estimated that conditions within the film markets would continue to be challenging and adjusted downward the Film Production segment forecasts as well as certain estimated future film and event performance. As a result of the downward adjustment to certain estimated future film and event performance, the Company recorded an impairment charge of approximately $1.2 million representing the difference in the unamortized film costs and the estimated fair value of the related films and events. This expense was recorded in the charge for restructuring and asset impairments other than goodwill line item in the consolidated statements of operations. The fair value of the films and events was estimated by discounting the film or event's projected cash flow by the weighted average cost of capital.
During fiscal year 2009, the Company recorded a non-cash impairment expense of approximately $1.1 million associated with several Film Production segment owned content films and events. During the third quarter of fiscal year 2009 and as part of the Company's process to continually assess the expected performance of owned content, the Company determined that downward adjustments to the estimated performance of films and events should be recorded as a result of adverse changes to the business climate. As a result, the Company recorded an impairment charge of approximately $1.1 million representing the difference in the unamortized film costs and the estimated fair value of the films and events. This expense was recorded in the charge for restructuring and asset impairments other than goodwill line item in the consolidated statements of operations. The fair value of the films and events was estimated by discounting the film or event's projected cash flow by the weighted average cost of capital.
During fiscal year 2008, the Company recorded a non-cash impairment expense of approximately $0.7 million associated with two Film Production segment owned content events. During the third quarter of fiscal year 2008, the Company obtained initial revenue data that indicated the actual performance of the events would not meet the original estimates. As a result, the Company lowered its estimate of the expected future benefits to be derived from these events and recorded an impairment charge of approximately $0.7 million representing the difference in the unamortized film costs and the estimated fair value of the events. This expense was recorded in the charge for restructuring and asset impairments other than goodwill line item in the consolidated statements of operations. The fair value of the films and events was estimated by discounting the film or event's projected cash flow by the weighted average cost of capital.
F-30
NEW FRONTIER MEDIA, INC. AND SUBSIDIARIES
NOTES TO CONSOLIDATED FINANCIAL STATEMENTS (Continued)
NOTE 10—INCOME TAXES
The components of the continuing operations income tax provision expense for the three years ended March 31 were as follows (in thousands):
| |
2010 | 2009 | 2008 | ||||||||||
|---|---|---|---|---|---|---|---|---|---|---|---|---|---|
Current |
|||||||||||||
Federal |
$ | 1,469 | $ | 3,460 | $ | 4,505 | |||||||
State |
186 | 636 | 836 | ||||||||||
Total current |
1,655 | 4,096 | 5,341 | ||||||||||
Deferred |
|||||||||||||
Federal |
(715 | ) | (167 | ) | 7 | ||||||||
State |
(102 | ) | (20 | ) | (162 | ) | |||||||
Total deferred |
(817 | ) | (187 | ) | (155 | ) | |||||||
Total |
$ | 838 | $ | 3,909 | $ | 5,186 | |||||||
A reconciliation of the expected income tax computed using the federal statutory income tax rate to the Company's recorded income tax provision expense for continuing operations is as follows for the three years ended March 31 (in thousands):
| |
2010 | 2009 | 2008 | ||||||||
|---|---|---|---|---|---|---|---|---|---|---|---|
Income tax computed at federal statutory tax rate of 35% |
$ | (96 | ) | $ | 329 | $ | 4,908 | ||||
State taxes, net of federal benefit |
83 | 338 | 441 | ||||||||
Non-deductible goodwill impairment |
1,700 | 3,503 | — | ||||||||
Reversal of uncertain tax positions |
— | (429 | ) | — | |||||||
Federal research and development tax credits |
(751 | ) | — | — | |||||||
Other non-deductible (deductible) differences, net |
95 | 152 | (29 | ) | |||||||
Other temporary differences, net |
(193 | ) | 16 | (134 | ) | ||||||
Total |
$ | 838 | $ | 3,909 | $ | 5,186 | |||||
F-31
NEW FRONTIER MEDIA, INC. AND SUBSIDIARIES
NOTES TO CONSOLIDATED FINANCIAL STATEMENTS (Continued)
NOTE 10—INCOME TAXES (Continued)
Significant components of the Company's deferred tax liabilities and assets as of March 31 were as follows (in thousands):
| |
2010 | 2009 | |||||||
|---|---|---|---|---|---|---|---|---|---|
Deferred tax liabilities: |
|||||||||
Depreciation |
$ | (426 | ) | $ | (481 | ) | |||
Goodwill |
(972 | ) | (795 | ) | |||||
Film library |
(1,010 | ) | (2,537 | ) | |||||
Tax method changes |
(1,499 | ) | (199 | ) | |||||
Identifiable intangibles |
(107 | ) | (222 | ) | |||||
Other |
(75 | ) | (44 | ) | |||||
Total deferred tax liabilities |
(4,089 | ) | (4,278 | ) | |||||
Deferred tax assets: |
|||||||||
Net operating loss carryforward |
945 | 800 | |||||||
Deferred revenue |
70 | 70 | |||||||
Asset disposition, impairment and other reserves |
1,570 | 804 | |||||||
Allowance for doubtful accounts and reserve for sales returns |
97 | 121 | |||||||
Share-based compensation |
838 | 886 | |||||||
Amortization |
306 | 297 | |||||||
Accruals |
126 | 290 | |||||||
Identifiable intangibles |
465 | 361 | |||||||
Other |
134 | 104 | |||||||
Gross deferred tax assets |
4,551 | 3,733 | |||||||
Valuation allowance |
(220 | ) | — | ||||||
Total deferred tax assets |
4,331 | 3,733 | |||||||
Net deferred tax assets (liabilities) |
$ | 242 | $ | (545 | ) | ||||
The Company realized tax benefits from option and warrant exercises of $0.1 million for the fiscal year ended March 31, 2008. These deductions result in an increase in additional paid-in capital. No tax benefits from option and warrant exercises were realized during the fiscal years ended March 31, 2010 or 2009.
Deferred income tax assets and liabilities reflect the net tax effects of temporary differences between the carrying amounts of assets and liabilities for financial reporting purposes and the amount used for income tax purposes. The Company establishes valuation allowances when, based on an evaluation of objective evidence, there is a likelihood that some portion or all of the deferred tax assets will not be realized. As of March 31, 2010, the Company determined that it was more likely than not that deferred tax assets associated with the discontinued operations international operating losses would not be realized and recorded a valuation allowance for the full operating loss deferred tax asset of $0.2 million. The Company had no other valuation allowances at March 31, 2010.
The Company has domestic net operating loss carryforwards of approximately $1.9 million for federal income tax purposes, which expire through 2019. For tax purposes, there is an annual limitation of approximately $0.2 million for the remaining 9 years on all of the Company's net operating loss under Internal Revenue Code Section 382. Internal Revenue Code Section 382 also places a limitation
F-32
NEW FRONTIER MEDIA, INC. AND SUBSIDIARIES
NOTES TO CONSOLIDATED FINANCIAL STATEMENTS (Continued)
NOTE 10—INCOME TAXES (Continued)
on the utilization of net operating loss carryforwards when an ownership change, as defined in the tax law, occurs. Generally, an ownership change occurs when there is a greater than 50 percent change in ownership. When a change occurs, the actual utilization of net operating loss carryforwards is limited annually to a percentage of the fair market value of the Company at the time of such change.
The Company files U.S. federal, state, and foreign income tax returns. During the third quarter of fiscal year 2009, the Company concluded an audit by the Internal Revenue Service ("IRS") for its fiscal year 2007, and the IRS proposed no changes to the Company's fiscal year 2007 tax return in connection with the audit. With few exceptions, the Company is no longer subject to examination of its federal and state income tax returns for years prior to fiscal year 2006.
Uncertain Tax Positions
The Company accounts for uncertain tax positions using a two-step approach. The first step is to evaluate the tax position for recognition by determining if the weight of available evidence indicates that it is more likely than not that the position will be sustained on audit, including resolution of related appeals or litigation processes, if any. The second step is to measure the tax benefit as the largest amount that is more than 50% likely of being realized upon effective settlement. There were no material changes in the Company's uncertain tax position liabilities during fiscal year 2010. As of March 31, 2010 the Company had total unrecognized tax benefits of approximately $0.3 million that are not expected to be settled within one year and have been classified within long-term taxes payable. If the Company was to prevail or the uncertainties were settled in favor of the Company on all uncertain tax positions, the net effect is estimated to be a benefit to the Company's tax expense of approximately $0.3 million. As of March 31, 2010, the Company had accrued immaterial amounts of interest expense related to uncertain tax position liabilities. If the Company was to prevail or the uncertainties were settled in favor of the Company on all uncertain tax positions, the reversal of the accrued interest would result in a benefit to the Company.
The aggregate change in the balance of the unrecognized tax benefits during the fiscal year ended March 31, 2010 was as follows (in thousands):
Beginning balance at April 1, 2009 |
$ | 242 | ||
Increases related to prior period tax positions |
67 | |||
Ending balance at March 31, 2010 |
$ | 309 | ||
During the third quarter of fiscal year 2009, the statute of limitations expired on approximately $1.6 million of uncertain tax positions resulting in a decline in the uncertain tax position balance as reflected in the current portion of taxes payable. This reversal of the uncertain tax positions resulted in a $0.4 million reduction in the Company's fiscal year 2009 tax expense and a $0.4 million reversal of related interest expense. Approximately $1.1 million of the reversal of the uncertain tax position liabilities was recorded as an increase to additional paid-in capital because the amount was originally recorded as a reduction of additional paid-in capital and had no impact on income tax expense.
Research and Development Tax Credits
During fiscal year 2010, the Company performed a research and development tax credit study. The study considered fiscal years for which amended or current tax returns could be filed. The Company
F-33
NEW FRONTIER MEDIA, INC. AND SUBSIDIARIES
NOTES TO CONSOLIDATED FINANCIAL STATEMENTS (Continued)
NOTE 10—INCOME TAXES (Continued)
concluded that it was eligible for research and development tax credits that would result in a reduction in the provision for income tax expense for the noted fiscal years as follows (in thousands):
March 31,
|
|
|||
|---|---|---|---|---|
2009(1) |
$ | 217 | ||
2008(1) |
169 | |||
2007 |
129 | |||
2006 |
86 | |||
Total |
$ | 601 | ||
- (1)
- Approximately $25,000 and $3,000 of the research and development tax credits during the fiscal years ended March 31, 2009 and 2008, respectively, related to discontinued operations.
The Company filed amended and current tax returns during the third quarter of fiscal year 2010 for each of the fiscal years noted above and included the research and development tax credits identified in the study. As a result of the filings, the Company recorded a reduction in the provision for income tax expense of $0.6 million during the third quarter of fiscal year 2010. The Company also estimated that it would utilize research and development tax credits during the fiscal year ended March 31, 2010 of between $0.1 million and $0.2 million. Approximately $0.1 million of the estimated fiscal year 2010 tax credit was reflected in the third quarter of fiscal year 2010 and the remaining amount was reflected in the fourth quarter of fiscal year 2010.
NOTE 11—STOCK REPURCHASE
In June 2008, the Company's Board of Directors extended a share repurchase plan allowing for the repurchase of approximately 1.1 million shares of common stock through June 2010. During the six month period ended September 30, 2008, the Company substantially completed the share repurchase plan and repurchased approximately 1.1 million shares for a total purchase price of approximately $4.3 million.
During fiscal year 2009, the Company purchased through one broker in an unsolicited single block trade approximately 0.5 million shares of common stock for a total purchase price of approximately $0.7 million. Additionally, the Company entered into a Stock Purchase Agreement pursuant to which a shareholder agreed to sell and the Company agreed to purchase approximately 2.6 million shares of the Company's common stock for a total purchase price of approximately $4.1 million.
In August 2009, the Company announced that its Board of Directors adopted a new stock repurchase program. The Board of Directors adopted the program in light of current market conditions and the capital and financial position of the Company. Under the program, the Company may purchase with available cash and cash from operations up to 1.0 million shares of the Company's outstanding common stock, from time to time through open market or privately negotiated transactions, as market and business conditions permit. The program will expire in March 2012. Any repurchased shares will be returned to authorized but unissued shares of common stock in accordance with Colorado law. The Company acquired approximately 0.1 million shares under the program for a total purchase price of approximately $0.1 million during fiscal year 2010.
F-34
NEW FRONTIER MEDIA, INC. AND SUBSIDIARIES
NOTES TO CONSOLIDATED FINANCIAL STATEMENTS (Continued)
NOTE 12—SEGMENT AND GEOGRAPHIC INFORMATION
Operating segments are defined as components of an enterprise for which separate financial information is available and regularly reviewed by the Company's chief operating decision maker. The Company has the following reportable operating segments:
- •
- Transactional TV—distributes branded adult entertainment PPV networks and VOD content through electronic
distribution platforms including cable television and DBS operators.
- •
- Film Production—produces and distributes mainstream films and erotic features and events. These titles are
distributed on U.S. and international premium channels, PPV channels and VOD systems across a range of cable and satellite distribution platforms. The Film Production segment also distributes a full
range of independently produced motion pictures to markets around the world. Additionally, this segment periodically provides producer-for-hire services to major Hollywood
studios.
- •
- Direct-to-Consumer—aggregates and resells adult content via the internet. The
Direct-to-Consumer segment sells content to subscribers primarily through its consumer websites.
- •
- Corporate Administration—includes all costs associated with the operation of the public holding company, New Frontier Media, Inc., that are not directly allocable to the Transactional TV, Film Production, or Direct-to-Consumer segments. These costs include, but are not limited to, legal expenses, accounting expenses, human resource department costs, insurance expenses, registration and filing fees with NASDAQ, executive employee costs, and costs associated with the public company filings and shareholder communications.
The accounting policies of the reportable segments are the same as those described in the summary of accounting policies. Segment profit (loss) is based on income (loss) from continuing operations before provision for income taxes. The reportable segments are distinct business units,
F-35
NEW FRONTIER MEDIA, INC. AND SUBSIDIARIES
NOTES TO CONSOLIDATED FINANCIAL STATEMENTS (Continued)
NOTE 12—SEGMENT AND GEOGRAPHIC INFORMATION (Continued)
separately managed with different distribution channels. The selected operating results of the Company's segments during the three years ended March 31 were as follows (in thousands):
| |
2010 | 2009 | 2008 | |||||||||
|---|---|---|---|---|---|---|---|---|---|---|---|---|
Net revenue |
||||||||||||
Transactional TV |
$ | 37,380 | $ | 42,559 | $ | 40,998 | ||||||
Film Production |
12,013 | 8,584 | 13,094 | |||||||||
Direct-to-Consumer |
1,035 | 1,452 | 1,819 | |||||||||
Total |
$ | 50,428 | $ | 52,595 | $ | 55,911 | ||||||
Segment profit (loss) |
||||||||||||
Transactional TV |
$ | 15,139 | $ | 21,637 | $ | 21,423 | ||||||
Film Production |
(5,427 | ) | (10,916 | ) | 2,307 | |||||||
Direct-to-Consumer |
(943 | ) | (306 | ) | 118 | |||||||
Corporate Administration |
(9,044 | ) | (9,476 | ) | (9,826 | ) | ||||||
Total |
$ | (275 | ) | $ | 939 | $ | 14,022 | |||||
Interest income |
||||||||||||
Transactional TV |
$ | — | $ | — | $ | 2 | ||||||
Film Production |
5 | 5 | 7 | |||||||||
Corporate Administration |
44 | 203 | 702 | |||||||||
Total |
$ | 49 | $ | 208 | $ | 711 | ||||||
Interest expense |
||||||||||||
Corporate Administration |
$ | 243 | $ | 208 | $ | 155 | ||||||
Reversal of interest expense for uncertain tax positions |
||||||||||||
Corporate Administration |
$ | — | $ | 429 | $ | — | ||||||
Depreciation and amortization |
||||||||||||
Transactional TV |
$ | 5,222 | $ | 5,015 | $ | 4,404 | ||||||
Film Production |
3,309 | 3,452 | 3,619 | |||||||||
Direct-to-Consumer |
256 | 209 | 209 | |||||||||
Corporate Administration |
48 | 30 | 14 | |||||||||
Total |
$ | 8,835 | $ | 8,706 | $ | 8,246 | ||||||
F-36
NEW FRONTIER MEDIA, INC. AND SUBSIDIARIES
NOTES TO CONSOLIDATED FINANCIAL STATEMENTS (Continued)
NOTE 12—SEGMENT AND GEOGRAPHIC INFORMATION (Continued)
The Company's total net identifiable asset balance by operating segment at March 31 was as follows (in thousands):
| |
2010 | 2009 | 2008 | |||||||||
|---|---|---|---|---|---|---|---|---|---|---|---|---|
Net identifiable assets |
||||||||||||
Transactional TV |
$ | 26,474 | $ | 27,184 | $ | 27,366 | ||||||
Film Production |
15,490 | 22,453 | 33,194 | |||||||||
Direct-to-Consumer |
775 | 1,166 | 1,111 | |||||||||
Corporate Administration |
18,850 | 17,066 | 20,657 | |||||||||
Total continuing operations assets |
61,589 | 67,869 | 82,328 | |||||||||
Total discontinued operations assets |
224 | 670 | 1,333 | |||||||||
Total assets |
$ | 61,813 | $ | 68,539 | $ | 83,661 | ||||||
As of March 31, 2010, approximately $0.2 million of the Company's assets were located in Europe. All other assets were located in the U.S.
Net revenue, classified by geographic billing location of the customer, during the three years ended March 31 was as follows (in thousands):
| |
2010 | 2009 | 2008 | ||||||||||
|---|---|---|---|---|---|---|---|---|---|---|---|---|---|
Domestic net revenue |
$ | 43,370 | $ | 48,216 | $ | 51,976 | |||||||
International net revenue: |
|||||||||||||
Europe, Middle East and Africa |
1,643 | 1,814 | 1,635 | ||||||||||
Latin America |
3,036 | 944 | 649 | ||||||||||
Canada |
1,896 | 939 | 215 | ||||||||||
Asia |
161 | 443 | 1,207 | ||||||||||
Other |
322 | 239 | 229 | ||||||||||
Total international net revenue |
7,058 | 4,379 | 3,935 | ||||||||||
Total net revenue |
$ | 50,428 | $ | 52,595 | $ | 55,911 | |||||||
NOTE 13—MAJOR CUSTOMERS
The Company's major customers (revenue in excess of 10% of net revenue) are Comcast Corporation ("Comcast"), DirecTV, Inc. ("DirecTV"), DISH Network Corporation ("DISH"), and Time Warner, Inc. ("Time Warner"). These customers are included in the Transactional TV and Film Production segments. Net revenue from these customers as a percentage of total net revenue for the three years ended March 31 was as follows:
| |
2010 | 2009 | 2008 | |||||||
|---|---|---|---|---|---|---|---|---|---|---|
Comcast |
17 | % | 24 | % | 18 | % | ||||
DirecTV |
12 | % | 15 | % | 13 | % | ||||
Time Warner |
12 | % | 13 | % | 14 | % | ||||
DISH |
11 | % | 13 | % | 14 | % | ||||
F-37
NEW FRONTIER MEDIA, INC. AND SUBSIDIARIES
NOTES TO CONSOLIDATED FINANCIAL STATEMENTS (Continued)
NOTE 13—MAJOR CUSTOMERS (Continued)
The Company's outstanding accounts receivable balances due from its major customers as of March 31 are as follows (in thousands):
| |
2010 | 2009 | |||||
|---|---|---|---|---|---|---|---|
DISH |
$ | 1,810 | $ | 940 | |||
Comcast |
1,221 | 1,735 | |||||
DirecTV |
699 | 1,121 | |||||
Time Warner |
448 | 683 | |||||
The loss of any of the Company's major customers would have a material adverse effect on the Company's results of operations and financial condition.
NOTE 14—COMMITMENTS AND CONTINGENCIES
The following table reflects the Company's contractual cash obligations as of March 31, 2010 for each of the time periods specified (in thousands):
Year Ending March 31,
|
Operating Leases |
Vendor Obligations |
Total | ||||||||
|---|---|---|---|---|---|---|---|---|---|---|---|
2011 |
$ | 1,888 | $ | 2,568 | $ | 4,456 | |||||
2012 |
1,049 | 1,617 | 2,666 | ||||||||
2013 |
620 | 1,588 | 2,208 | ||||||||
2014 |
349 | 1,035 | 1,384 | ||||||||
2015 |
1 | 1,000 | 1,001 | ||||||||
Thereafter |
— | 2,500 | 2,500 | ||||||||
Total minimum payments |
$ | 3,907 | $ | 10,308 | $ | 14,215 | |||||
For the purposes of this table, contractual obligations are defined as agreements that are enforceable and legally binding and that specify all significant terms, such as fixed or minimum services to be purchased and the approximate timing of the transaction. Obligations to acquire specified quantities of movie license rights that are subject to the delivery of the related movies are included in vendor obligations because the Company estimates that the movies will be delivered in the specified time periods based on historical experience with the movie studios.
The Company entered into certain non-cancelable contracts subsequent to March 31, 2010 primarily related to transport services. The future obligations under these agreements for the fiscal year ending March 31, 2011 is $1.1 million, and the future obligations for each of the fiscal years ending March 31, 2012, 2013 and 2014 is $1.0 million.
The Company has recorded long-term income taxes payable of approximately $0.3 million for uncertain tax positions, reduced by the associated federal deduction for state taxes. The Company is unable to reliably estimate the timing of future payments, if any, related to these uncertain tax positions. Therefore, the amounts have been excluded from the above table.
F-38
NEW FRONTIER MEDIA, INC. AND SUBSIDIARIES
NOTES TO CONSOLIDATED FINANCIAL STATEMENTS (Continued)
NOTE 14—COMMITMENTS AND CONTINGENCIES (Continued)
Operating Lease Obligations
The Company maintains non-cancelable leases for office space and equipment under various operating leases. The leases for office space expire through November 2013 and contain annual Consumer Price Index escalation clauses. The Company's Transactional TV segment has entered into direct lease agreements that expire through December 2010 with an unrelated party for the use of transponders to broadcast its channels on satellites. As the lessee of transponders under the transponder agreements, the Company is subject to arbitrary refusal of service by the service provider if that service provider determines that the content being transmitted by the Company is harmful to the service provider's name or business. The Company had no equipment under capital lease at March 31, 2010 or 2009.
Rent expense for the years ended March 31, 2010, 2009 and 2008 was approximately $1.9 million, $1.8 million and $1.7 million, respectively, which includes transponder expenses.
Vendor Obligations
From time to time, the Company enters into arrangements with movie studios to acquire license rights for a fixed and/or minimum quantity of movies over various purchase periods as defined by the agreements. Additionally, the Company is party to certain uplinking, transport and marketing services that contractually obligate the Company to receive services over specified terms as per these arrangements. The Company is also obligated to make future payments associated with its purchase of patent rights. These contractual obligations are reflected in the above table as vendor obligations.
Employment Contracts
The Company employs executives and certain other key employees under non-cancelable employment contracts in Colorado, California, Florida and Georgia. These employment contracts expire through August 31, 2013. Commitments under these obligations at March 31, 2010 were as follows (in thousands):
Year Ending March 31,
|
|
||||
|---|---|---|---|---|---|
2011 |
$ | 4,478 | |||
2012 |
2,309 | ||||
2013 |
1,581 | ||||
2014 |
467 | ||||
Total obligation under employment contracts |
$ | 8,835 | |||
Subsequent to March 31, 2010, executives and certain other key employees' salaries were increased effective April 1, 2010. The impact of the change in salaries is an increase in the Company's commitments under the obligations for the years ending March 31, 2011, 2012 and 2013 of $0.2 million, $0.1 million and $35,000, respectively.
Indemnification
The Company has agreements whereby it indemnifies officers and directors for certain events or occurrences while the officer or director is, or was, serving in such capacity at the Company's request.
F-39
NEW FRONTIER MEDIA, INC. AND SUBSIDIARIES
NOTES TO CONSOLIDATED FINANCIAL STATEMENTS (Continued)
NOTE 14—COMMITMENTS AND CONTINGENCIES (Continued)
The term of the indemnification period is for the officer's or director's lifetime. The maximum potential amount of future payments the Company could be required to make under these indemnification agreements is unlimited; however, the Company has a director and officer insurance policy that limits exposure and the Company believes that this policy would enable it to recover a portion, if not all, of any future indemnification payments. As a result of its insurance policy coverage, the Company believes that its estimated exposure on these indemnification agreements is minimal.
The Company enters into standard indemnification agreements in the ordinary course of business. Pursuant to these agreements, the Company indemnifies, holds harmless, and agrees to reimburse the indemnified party for losses suffered or incurred by the indemnified party in connection with any claim by any third party, including customers, with respect to the Company's products or services, including, but not limited to, alleged negligence, breach of contract, or infringement of a patent, copyright or other intellectual property right. The term is any time after execution of the agreement. The maximum potential amount of future payments the Company could be required to make under these indemnification agreements is unlimited. The Company has never incurred costs to defend lawsuits or settle claims related to these indemnification agreements. As a result, the Company believes that its estimated exposure on these agreements is minimal.
Legal Proceedings
In the normal course of business, the Company is subject to various lawsuits and claims. The Company believes that the final outcome of these matters, either individually or in the aggregate, will not have a material effect on its financial statements.
NOTE 15—BORROWING ARRANGEMENTS
On December 15, 2009, the Company's former line of credit matured and the Company obtained a new line of credit from a financial institution. The line of credit is secured by certain trade accounts and accounts receivable, is scheduled to mature on December 15, 2010, and bears interest at the greater of (a) the current prime rate less 0.125 percentage points per annum or (b) 5.75% per annum. The line of credit may be drawn from time to time to support the Company's operations and short-term working capital needs, if any. A loan origination fee of 0.5% of the available line was paid by the Company upon the execution of the line of credit and is being amortized over the life of the line of credit. The line of credit includes a maximum borrowing base equal to the lesser of 75% of the trade accounts and accounts receivable securing the line of credit or $5.0 million, and the maximum borrowing base at March 31, 2010 was $5.0 million.
The line of credit contains both conditions precedent that must be satisfied prior to any borrowing and affirmative and negative covenants customary for facilities of this type, including without limitation, (a) a requirement to maintain a current asset to current liability ratio of at least 1.5 to 1.0, (b) a requirement to maintain a total liability to tangible net worth ratio not to exceed 1.0 to 1.0, (c) prohibitions on additional borrowing, lending, investing or fundamental corporate changes without prior consent, (d) a prohibition on declaring without consent any dividends, other than dividends payable in our stock, and (e) a requirement that there be no material adverse change in the Company's current client base as it relates to its largest clients. The line of credit provides that an event of default will exist in certain circumstances, including without limitation, the Company's failure to make payment of principal or interest on borrowed amounts when required, failure to perform certain obligations
F-40
NEW FRONTIER MEDIA, INC. AND SUBSIDIARIES
NOTES TO CONSOLIDATED FINANCIAL STATEMENTS (Continued)
NOTE 15—BORROWING ARRANGEMENTS (Continued)
under the line of credit and related documents, defaults in certain other indebtedness, the Company's insolvency, a change in control of the Company, any material adverse change in the Company's financial condition and certain other events customary for facilities of this type. As of March 31, 2010 the Company's outstanding principal balance under the line of credit was $1.0 million, and the Company was in compliance with the related covenants.
NOTE 16—DEFINED CONTRIBUTION PLAN
The Company sponsors a 401(k) retirement plan. The plan covers all eligible employees of the Company. Employee contributions to the plan are elective, and the Company has discretion to match employee contributions. Contributions by the Company vest ratably over a three-year period during the first three years of employee service, and contributions by the Company vest immediately after three or more years of employee service. Contributions by the Company during each of the years ended March 31, 2010, 2009, and 2008 were approximately $0.3 million.
NOTE 17—STOCKHOLDER RIGHTS PLAN
On November 29, 2001, the Company's Board of Directors adopted a Stockholder Rights Plan in which Rights were distributed at the rate of one Right for each share of the Company's common stock held by stockholders of record as of the close of business on December 21, 2001. The Rights generally will be exercisable only if a person or group acquires beneficial ownership of 15% or more of the Company's outstanding common stock after November 29, 2001, or commences a tender offer upon consummation of which the person or group would beneficially own 15% or more of the Company's outstanding common stock. Each Right is initially exercisable at $10.00 and will expire on December 21, 2011. Effective August 1, 2008, pursuant to an Amended and Restated Rights Agreement between the Company and the rights agent made effective as of such date, the Company eliminated the continuing director or so-called "dead hand" provisions included in the originally adopted Shareholder Rights Plan.
NOTE 18—RELATED PARTY TRANSACTIONS
The Company paid approximately $0.1 million, $0.1 million and $0.2 million to Isaacman, Kaufman & Painter during the fiscal years ended March 31, 2010, 2009 and 2008, respectively, associated with legal services. The Company's board member, Alan Isaacman, is a Senior Member of Isaacman, Kaufman & Painter.
NOTE 19—DISCONTINUED OPERATIONS
The Direct-to-Consumer segment acquired certain intangible assets in late fiscal year 2008 in an effort to expand the product lines that are delivered directly to consumers. The acquired intangible assets primarily related to intellectual property rights technology that allow the Company to manufacture a set-top box through which consumers can obtain content directly through the internet and view the content on television. The Company tested the market for the related IPTV set-top box product by establishing a test business model during fiscal year 2009. Based primarily on (a) lower than expected subscriber additions for the IPTV test business model during the second half of fiscal year 2009, (b) the significant downturn in economic conditions and related reduction in consumer spending during the second half of fiscal year 2009, and (c) slower than expected development of new product
F-41
NEW FRONTIER MEDIA, INC. AND SUBSIDIARIES
NOTES TO CONSOLIDATED FINANCIAL STATEMENTS (Continued)
NOTE 19—DISCONTINUED OPERATIONS (Continued)
lines, the Company restructured the Direct-to-Consumer segment operations as it related to its new product lines. Based on this restructuring, the Company evaluated whether the anticipated undiscounted future net cash flows associated with the related intangible assets was in excess of the assets' carrying value and recorded an impairment expense of approximately $0.9 million for the excess carrying value as compared to its estimated fair value. Additionally, the Company incurred approximately $0.2 million of early contract termination fees for consulting contracts in connection with the restructuring and subsequently paid the related fees in April 2009. The $1.1 million intangible asset impairment and restructuring charges are reflected in the fiscal year 2009 discontinued operations results.
During fiscal year 2010, the Company entered into arrangements with third-party affiliates to distribute the IPTV set-top box in Europe and the U.S. Throughout fiscal year 2010, these affiliates marketed the IPTV set-top box product through a variety of advertising programs including print, billboards and other miscellaneous media. The performance of the IPTV set-top box business in fiscal year 2010 was lower than expected and as a result, the Company implemented a plan to discontinue the operations of the IPTV set-top box business in the fourth quarter of fiscal year 2010. The Company expects cash flows associated with the IPTV set-top box business will be eliminated from the ongoing operations of the Company, and the Company will not have any significant continuing involvement in the operations of the IPTV set-top box business after the disposal transaction. The Company does not expect to incur material expenses or cash flows in the future associated with the discontinued operations, and the disposal is expected to be completed during fiscal year 2011.
As a result of the discontinuation of the IPTV set-top box business, the Company recorded an inventory obsolescence impairment charge of $0.1 million and an equipment impairment charge of $0.1 million during the fourth quarter of fiscal year 2010. Additionally, the Company has classified certain equipment as held for sale based on, among other things, the Company's intent and ability to sell the assets. The discontinued operations generated net revenue of $0.1 million during each of the fiscal years ended March 31, 2010 and 2009 and no net revenue during the fiscal year ended March 31, 2008, and the pre-tax loss was $1.0 million, $3.5 million and $0.3 million during the fiscal years ended March 31, 2010, 2009 and 2008, respectively. The carrying amount of the discontinued operations assets as of March 31, 2010 primarily includes current assets of approximately $0.1 million related to assets held for sale. There were no material discontinued operations liabilities at March 31, 2010.
F-42
NEW FRONTIER MEDIA, INC. AND SUBSIDIARIES
NOTES TO CONSOLIDATED FINANCIAL STATEMENTS (Continued)
NOTE 20—QUARTERLY INFORMATION (UNAUDITED)
The consolidated results of operations on a quarterly basis were as follows (in thousands, except per share amounts):
| |
Fiscal Year 2010 | |||||||||||||
|---|---|---|---|---|---|---|---|---|---|---|---|---|---|---|
| |
First Quarter |
Second Quarter |
Third Quarter |
Fourth Quarter |
||||||||||
Net revenue |
$ | 12,487 | $ | 11,375 | $ | 11,479 | $ | 15,087 | ||||||
Gross margin |
8,071 | 7,336 | 7,476 | 7,687 | ||||||||||
Income (loss) from continuing operations(1) |
986 | 1,139 | 1,571 | (4,809 | ) | |||||||||
Loss from discontinued operations |
(159 | ) | (133 | ) | (66 | ) | (267 | ) | ||||||
Net income (loss) |
827 | 1,006 | 1,505 | (5,076 | ) | |||||||||
Basic income per share: |
||||||||||||||
Income (loss) from continuing operations per share |
0.05 | 0.06 | 0.08 | (0.25 | ) | |||||||||
Loss from discontinued operations per share |
(0.01 | ) | (0.01 | ) | (0.00 | ) | (0.01 | ) | ||||||
Net income (loss) per share |
0.04 | 0.05 | 0.08 | (0.26 | ) | |||||||||
Diluted income per share: |
||||||||||||||
Income (loss) from continuing operations per share |
0.05 | 0.06 | 0.08 | (0.25 | ) | |||||||||
Loss from discontinued operations per share |
(0.01 | ) | (0.01 | ) | (0.00 | ) | (0.01 | ) | ||||||
Net income (loss) per share |
0.04 | 0.05 | 0.08 | (0.26 | ) | |||||||||
| |
Fiscal Year 2009 | |||||||||||||
|---|---|---|---|---|---|---|---|---|---|---|---|---|---|---|
| |
First Quarter |
Second Quarter |
Third Quarter |
Fourth Quarter |
||||||||||
Net revenue |
$ | 13,058 | $ | 13,365 | $ | 12,604 | $ | 13,568 | ||||||
Gross margin |
9,331 | 9,246 | 8,822 | 9,258 | ||||||||||
Income (loss) from continuing operations(2) |
1,484 | 1,711 | (8,400 | ) | 2,235 | |||||||||
Loss from discontinued operations |
(305 | ) | (416 | ) | (453 | ) | (1,044 | ) | ||||||
Net income (loss) |
1,179 | 1,295 | (8,853 | ) | 1,191 | |||||||||
Basic income per share(3): |
||||||||||||||
Income (loss) from continuing operations per share |
0.06 | 0.07 | (0.39 | ) | 0.11 | |||||||||
Loss from discontinued operations per share |
(0.01 | ) | (0.02 | ) | (0.02 | ) | (0.05 | ) | ||||||
Net income (loss) per share |
0.05 | 0.06 | (0.42 | ) | 0.06 | |||||||||
Diluted income per share(3): |
||||||||||||||
Income (loss) from continuing operations per share |
0.06 | 0.07 | (0.39 | ) | 0.11 | |||||||||
Loss from discontinued operations per share |
(0.01 | ) | (0.02 | ) | (0.02 | ) | (0.05 | ) | ||||||
Net income (loss) per share |
0.05 | 0.06 | (0.42 | ) | 0.06 | |||||||||
- (1)
- During
the fourth quarter of fiscal year 2010, the Company incurred goodwill impairment charges of $4.9 million, film cost impairment charges of
$1.2 million, and recoupable costs and producer advances impairment charges of $0.8 million associated with the Film Production segment. See the Recoupable Costs and Producer Advances
discussion in Note 1—Organization and Summary of Significant Accounting Policies as well as Note 6—Goodwill and Other Intangible Assets and
Note 9—Film Costs for additional information.
- (2)
- During the third quarter of fiscal year 2009, the Company incurred goodwill impairment charges of $10.0 million and film cost impairment charges of $1.1 million associated with the Film Production
F-43
NEW FRONTIER MEDIA, INC. AND SUBSIDIARIES
NOTES TO CONSOLIDATED FINANCIAL STATEMENTS (Continued)
NOTE 20—QUARTERLY INFORMATION (UNAUDITED) (Continued)
segment. See Note 6—Goodwill and Other Intangible Assets and Note 9—Film Costs for additional information.
- (3)
- Earnings per share amounts for each quarter are required to be calculated independently. The sum of the earnings per share amounts for each quarter may not equal the earnings per share computed for the total fiscal year. Additionally, the sum of income (loss) from continuing operations per share and loss from discontinued operations per share may not equal net income (loss) per share due to rounding.
F-44
VALUATION AND QUALIFYING ACCOUNTS—SCHEDULE II
| |
Balance, Beginning of Year |
Additions (Deductions) Charged to Operations |
Additions (Deductions) from Reserve |
Balance, End of Year |
||||||||||
|---|---|---|---|---|---|---|---|---|---|---|---|---|---|---|
Allowance for doubtful accounts |
||||||||||||||
March 31, 2010 |
$ | 308 | $ | (3 | ) | $ | (52 | ) | $ | 253 | ||||
March 31, 2009 |
$ | 169 | $ | 169 | $ | (30 | ) | $ | 308 | |||||
March 31, 2008 |
$ | 41 | $ | 307 | $ | (179 | ) | $ | 169 | |||||
| |
Balance, Beginning of Year |
Additions (Deductions) Charged to Operations |
Additions (Deductions) from Reserve |
Balance, End of Year |
||||||||||
|---|---|---|---|---|---|---|---|---|---|---|---|---|---|---|
Reserve for chargebacks/credits |
||||||||||||||
March 31, 2010 |
$ | 14 | $ | 48 | $ | (58 | ) | $ | 4 | |||||
March 31, 2009 |
$ | 11 | $ | 106 | $ | (103 | ) | $ | 14 | |||||
March 31, 2008 |
$ | 7 | $ | 40 | $ | (36 | ) | $ | 11 | |||||
| |
Balance, Beginning of Year |
Additions (Deductions) Charged to Operations |
Additions (Deductions) from Reserve |
Balance, End of Year |
||||||||||
|---|---|---|---|---|---|---|---|---|---|---|---|---|---|---|
Accrued restructuring expense |
||||||||||||||
March 31, 2010 |
$ | 189 | $ | — | $ | (189 | ) | $ | — | |||||
March 31, 2009 |
$ | — | $ | 189 | $ | — | $ | 189 | ||||||
March 31, 2008 |
$ | 46 | $ | (46 | ) | $ | — | $ | — | |||||
F-45
| Exhibit No. | Exhibit Description | ||
|---|---|---|---|
| 3.01 | Amended and Restated Articles of Incorporation of the Company(1) | ||
| 3.02 | Amended and Restated Bylaws of the Company(2) | ||
| 4.01 | Form of Common Stock Certificate(3) | ||
| 4.02 | Amended and Restated Rights Agreement between New Frontier Media, Inc. and Corporate Stock Transfer, Inc., as rights agent(4) | ||
| 4.03 | Form of Certificate of Designation, Preferences and Rights of Series A Junior Participating Preferred Stock, together with the related Rights Certificate, included as Appendices A and B to the Rights Agreement incorporated by reference herein as Exhibit 4.02 | ||
| 10.01 | Lease Agreement for premises at 5435 Airport Boulevard, Boulder CO(5) | ||
| 10.02 | Agreement between Colorado Satellite Broadcasting, Inc. and Loral Skynet Concerning Skynet Transponder Service(6) | ||
| 10.03 | Agreement between Colorado Satellite Broadcasting, Inc. and Loral Skynet Concerning Skynet Space Segment Service(6) | ||
| 10.04 | Amendment Number One to Agreement between Colorado Satellite Broadcasting, Inc. and Loral Skynet Concerning Skynet Space Segment Service(6) | ||
| 10.05 | License Agreement between Colorado Satellite Broadcasting, Inc. and Metro Global Media, Inc.(6) | ||
| 10.06 | Amendment Number Two to the Agreement between Colorado Satellite Broadcasting, Inc. and Loral Skynet Concerning Skynet Space Segment Service(7) | ||
| 10.07 | Amendment Number One to the Agreement between Colorado Satellite Broadcasting, Inc. and Loral Skynet Concerning Skynet Transponder Service(8) | ||
| 10.08 | Amendment Number Four to the Agreement between Colorado Satellite Broadcasting, Inc. and Loral Skynet Concerning Skynet Space Segment Service(9) | ||
| 10.09 | Office Lease Agreement between New Frontier Media, Inc. and Northview Properties, LLC(9) | ||
| 10.10 | Lease Modification Agreement between New Frontier Media, Inc. and LakeCentre Plaza Limited, LLLP(9) | ||
| 10.11 | Catalog License Agreement between Pleasure Productions, Inc. and Colorado Satellite Broadcasting, Inc.(9) | ||
| 10.12 | Telecommunications Services Agreement between WilTel Communications, LLC and Colorado Satellite Broadcasting, Inc.(10) | ||
| 10.13 | Amendment No. 3 to Contract Number T70112100 between Colorado Satellite Broadcasting, Inc. and Intelsat USA Sales Corp.(11) | ||
| 10.14 | # | Satellite Capacity Lease between Colorado Satellite Broadcasting, Inc. and Transponder Encryption Services Corporation(12) | |
| 10.15 | * | Summary of Director Compensation Arrangements(22) | |
| 10.16 | * | 1998 Incentive Stock Plan(13) | |
| 10.17 | * | 1999 Incentive Stock Plan(14) | |
| 10.18 | * | Millennium Incentive Stock Option Plan(15) | |
| Exhibit No. | Exhibit Description | ||
|---|---|---|---|
| 10.19 | * | 2001 Incentive Stock Plan(16) | |
| 10.20 | * | 2007 Stock Incentive Plan(17) | |
| 10.21 | * | Form of Award Agreements under 2007 Stock Incentive Plan(18) | |
| 10.22 | * | Amended and Restated Independent Contractor Agreement, dated November 7, 2007, between New Frontier Media, Inc. and Matthew Pullam(19) | |
| 10.23 | * | Amended and Restated Employment Agreement between New Frontier Media, Inc. and Michael Weiner(2) | |
| 10.24 | * | Amended and Restated Employment Agreement between New Frontier Media, Inc. and Grant Williams(2) | |
| 10.25 | * | Amended and Restated Employment Agreement between New Frontier Media, Inc. and Ira Bahr(2) | |
| 10.26 | * | Amended and Restated Employment Agreement between New Frontier Media, Inc. and Ken Boenish(2) | |
| 10.27 | * | Amended and Restated Employment Agreement between New Frontier Media, Inc. and Marc Callipari(2) | |
| 10.28 | * | Amended and Restated Employment Agreement between New Frontier Media, Inc. and Scott Piper(2) | |
| 10.29 | # | Amended and Restated Affiliation Agreement for DTH Satellite Exhibition of Cable Network Programming by and between Colorado Satellite Broadcasting, Inc. and DirecTV, Inc.(19) | |
| 10.30 | Stock Purchase Agreement, dated and effective as of November 13, 2008, by and between New Frontier Media, Inc. and Steel Partners II, L.P.(20) | ||
| 10.31 | # | Affiliation Agreement, dated January 1, 2000 and as amended to date, between the Company and Time Warner Cable, a division of Time Warner Entertainment Company, L.P.(21) | |
| 10.32 | # | Video On Demand License Agreement, dated March 13, 2000 and as amended to date, between the Company and Time Warner Cable, a division of Time Warner Entertainment Company, L.P.(21) | |
| 10.33 | # | Adult VOD License Agreement, dated October 18, 2002 and as amended to date, between Colorado Satellite Broadcasting, Inc. and Comcast Cable Communications, Inc.(21) | |
| 10.34 | # | Pleasure Service License Agreement, dated November 16, 2000 and as amended to date, between Colorado Satellite Broadcasting, Inc. and Comcast Programming, a division of Comcast Corporation(21) | |
| 10.35 | First Amendment to Satellite Capacity Lease between Colorado Satellite Broadcasting, Inc. and Transponder Encryption Services Corporation(21) | ||
| 10.36 | # | Second Amendment to Satellite Capacity Lease between Colorado Satellite Broadcasting, Inc. and Transponder Encryption Services Corporation(21) | |
| 10.37 | # | Third Amendment to Satellite Capacity Lease between Colorado Satellite Broadcasting, Inc. and Transponder Encryption Services Corporation(22) | |
| 10.38 | * | First Amendment to the Amended and Restated Employment Agreement between New Frontier Media, Inc. and Michael Weiner(22) | |
| Exhibit No. | Exhibit Description | ||
|---|---|---|---|
| 10.39 | * | First Amendment to the Amended and Restated Employment Agreement between New Frontier Media, Inc. and Grant Williams(22) | |
| 10.40 | * | First Amendment to the Amended and Restated Employment Agreement between New Frontier Media, Inc. and Ken Boenish(22) | |
| 10.41 | * | First Amendment to the Amended and Restated Employment Agreement between New Frontier Media, Inc. and Scott Piper(22) | |
| 10.42 | * | First Amendment to the Amended and Restated Employment Agreement between New Frontier Media, Inc. and Marc Callipari(22) | |
| 10.43 | Promissory Note, dated December 15, 2009 between New Frontier Media, Inc. and Great Western Bank(23) | ||
| 10.44 | # | Business Loan Agreement, dated December 15, 2009 between New Frontier Media, Inc. and Great Western Bank(23) | |
| 10.45 | Commercial Security Agreement, dated December 15, 2009 between New Frontier Media, Inc. and Great Western Bank(23) | ||
| 10.46 | ## | TVN-CSB Adult VOD Services Agreement dated April 8, 2010 between Colorado Satellite Broadcasting, Inc. and TVN Entertainment Corporation | |
| 21.01 | Subsidiaries of the Company | ||
| 23.01 | Consent of Grant Thornton LLP | ||
| 31.01 | CEO Certification pursuant to Rule 13a-14(a)/15d-14(a) | ||
| 31.02 | CFO Certification pursuant to Rule 13a-14(a)/15d-14(a) | ||
| 32.01 | Section 1350 Certification of CEO | ||
| 32.02 | Section 1350 Certification of CFO | ||
- (1)
- Incorporated
by reference to the corresponding exhibit included in the Company's Current Report on Form 8-K filed on May 9, 2007
(File No. 000-23697).
- (2)
- Incorporated
by reference to the corresponding exhibit included in the Company's Quarterly Report filed on Form 10-Q for the quarter
ended September 30, 2008 (File No. 000-23697).
- (3)
- Incorporated
by reference to the corresponding exhibit included in the Company's Registration Statement on Form SB-2 filed on
September 10, 1997 (File No. 333-35337).
- (4)
- Incorporated
by reference to the corresponding exhibit included in the Company's Current Report on Form 8-K filed on August 1,
2008 (File No. 000-23697).
- (5)
- Incorporated
by reference to the corresponding exhibit included in the Company's Annual Report on Form 10-KSB for the fiscal year ended
March 31, 1999 (File No. 000-23697).
- (6)
- Incorporated
by reference to the corresponding exhibit included in the Company's Quarterly Report on Form 10-Q for the quarter ended
June 30, 2002 (File No. 000-23697).
- (7)
- Incorporated
by reference to the corresponding exhibit included in the Company's Quarterly Report on Form 10-Q for the quarter ended
September 30, 2002 (File No. 000-23697).
- (8)
- Incorporated
by reference to the corresponding exhibit included in the Company's Quarterly Report on Form 10-Q for the quarter ended
December 31, 2002 (File No. 000-23697).
- (9)
- Incorporated by reference to the corresponding exhibit included in the Company's Annual Report filed on Form 10-K for the fiscal year ended March 31, 2004 (File No. 000-23697).
- (10)
- Incorporated
by reference to the corresponding exhibit included in the Company's Quarterly Report filed on Form 10-Q for the quarter
ended September 30, 2004 (File No. 000-23697).
- (11)
- Incorporated
by reference to the corresponding exhibit included in the Company's Quarterly Report filed on Form 10-Q for the quarter
ended September 30, 2005 (File No. 000-23697).
- (12)
- Incorporated
by reference to the corresponding exhibit included in the Company's Quarterly Report filed on Form 10-Q for the quarter
ended September 30, 2006 (File No. 000-23697).
- (13)
- Incorporated
by reference to the Company's definitive proxy statement filed under cover of Schedule 14A on August 7, 1998 (File
No. 000-23697).
- (14)
- Incorporated
by reference to the Company's definitive proxy statement filed under cover of Schedule 14A on September 28, 1999 (File
No. 000-23697).
- (15)
- Incorporated
by reference to the Company's definitive proxy statement filed under cover of Schedule 14A on August 29, 2000 (File
No. 000-23697).
- (16)
- Incorporated
by reference to the Company's definitive proxy statement filed under cover of Schedule 14A on July 23, 2001 (File
No. 000-23697).
- (17)
- Incorporated
by reference to Appendix A to the Company's definitive proxy statement filed under cover of Schedule 14A on July 16, 2007
(File No. 000-23697).
- (18)
- Incorporated
by reference to the corresponding exhibit included in the Company's Current Report on Form 8-K filed on August 24,
2007 (File No. 000-23697).
- (19)
- Incorporated
by reference to the corresponding exhibit included in the Company's Quarterly Report filed on Form 10-Q for the quarter
ended September 30, 2007 (File No. 000-23697).
- (20)
- Incorporated
by reference to the corresponding exhibit included in the Company's Current Report on Form 8-K filed on November 14,
2008 (File No. 000-23697).
- (21)
- Incorporated
by reference to the corresponding exhibit included in the Company's Annual Report filed on Form 10-K for the fiscal year
ended March 31, 2009 (File No. 000-23697).
- (22)
- Incorporated
by reference to the corresponding exhibit included in the Company's Quarterly Report filed on Form 10-Q for the quarter
ended September 30, 2009 (File No. 000-23697).
- (23)
- Incorporated
by reference to the corresponding exhibit included in the Company's Quarterly Report filed on Form 10-Q for the quarter
ended December 31, 2009 (File No. 000-23697).
- *
- Denotes
management contract or compensatory plan or arrangement.
- #
- Confidential
portions of this agreement have been redacted pursuant to a confidential treatment request filed separately with the SEC.
- ##
- Confidential treatment has been requested as to portions of this exhibit. Such portions have been redacted and filed separately with the SEC.