Attached files
| file | filename |
|---|---|
| 8-K - 8-K - RETAIL PROPERTIES OF AMERICA, INC. | a10-11795_18k.htm |
EXHIBIT 99.1
|
|
2010 First Quarter Update |
|
|
Corporate Profile 1 Focused on the acquisition and management of a diverse national retail portfolio, primarily multi-tenant shopping centers 46 million square feet under management $6.9 billion total assets Self-managed, publicly registered, non-traded REIT |
|
|
Adhering to Our Long-Term Strategy 2 Diversification Acquire and manage a diverse national retail portfolio Reduce risk of overexposure by diversifying retail property type, location and tenant base Asset Management Regularly review the portfolio for opportunities Continually monitor financial health of tenants Maintain strength of national retailer relationships Conservative Capital Structure Individual mortgage loans = limited corporate debt Retain sufficient capital to support operations, stockholder distributions and future growth |
|
|
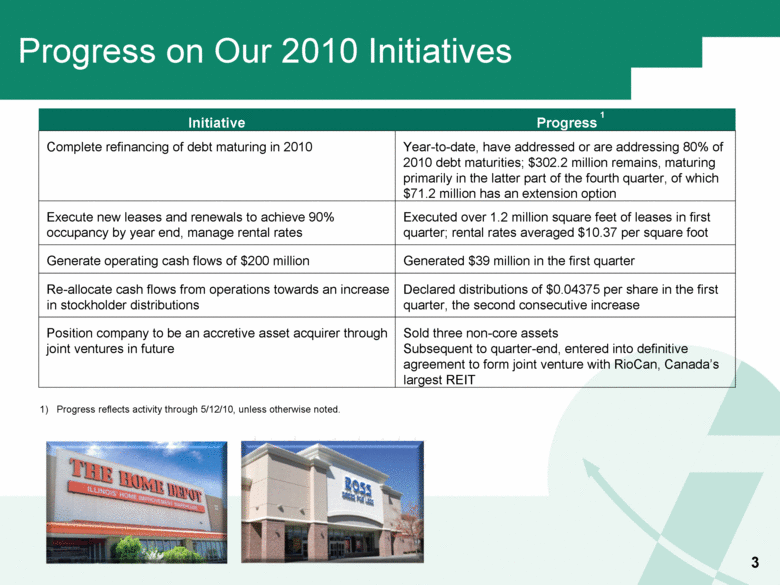
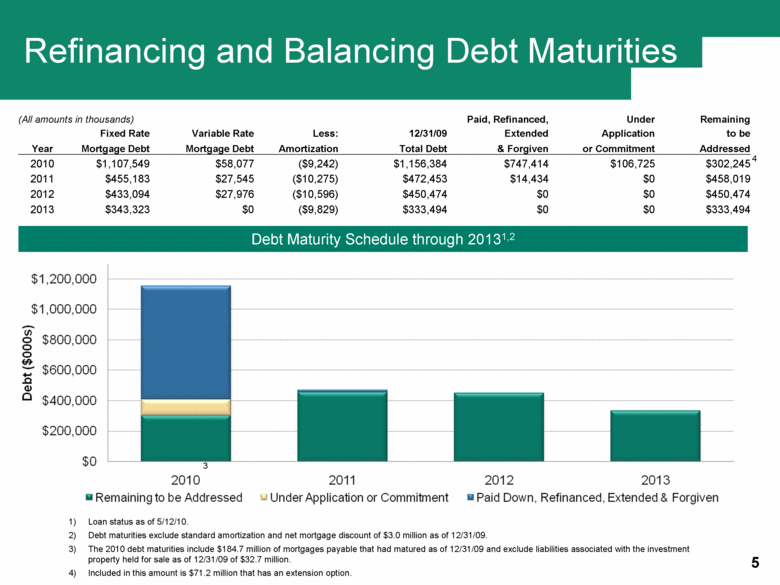
Initiative Progress Complete refinancing of debt maturing in 2010 Year-to-date, have addressed or are addressing 80% of 2010 debt maturities; $302.2 million remains, maturing primarily in the latter part of the fourth quarter, of which $71.2 million has an extension option Execute new leases and renewals to achieve 90% occupancy by year end, manage rental rates Executed over 1.2 million square feet of leases in first quarter; rental rates averaged $10.37 per square foot Generate operating cash flows of $200 million Generated $39 million in the first quarter Re-allocate cash flows from operations towards an increase in stockholder distributions Declared distributions of $0.04375 per share in the first quarter, the second consecutive increase Position company to be an accretive asset acquirer through joint ventures in future Sold three non-core assets Subsequent to quarter-end, entered into definitive agreement to form joint venture with RioCan, Canada’s largest REIT 1) Progress reflects activity through 5/12/10, unless otherwise noted. Progress on Our 2010 Initiatives 3 1 |
|
|
4 FINANCIAL UPDATE |
|
|
Refinancing and Balancing Debt Maturities Loan status as of 5/12/10. Debt maturities exclude standard amortization and net mortgage discount of $3.0 million as of 12/31/09. The 2010 debt maturities include $184.7 million of mortgages payable that had matured as of 12/31/09 and exclude liabilities associated with the investment property held for sale as of 12/31/09 of $32.7 million. Included in this amount is $71.2 million that has an extension option. Debt Maturity Schedule through 20131, 2 5 3 (All amounts in thousands) Paid, Refinanced, Under Remaining Fixed Rate Variable Rate Less: 12/31/09 Extended Application to be Year Mortgage Debt Mortgage Debt Amortization Total Debt & Forgiven or Commitment Addressed 2010 $1,107,549 $58,077 ($9,242) $1,156,384 $747,414 $106,725 $302,245 2011 $455,183 $27,545 ($10,275) $472,453 $14,434 $0 $458,019 2012 $433,094 $27,976 ($10,596) $450,474 $0 $0 $450,474 2013 $343,323 $0 ($9,829) $333,494 $0 $0 $333,494 4 1) 2) 3) 4) |
|
|
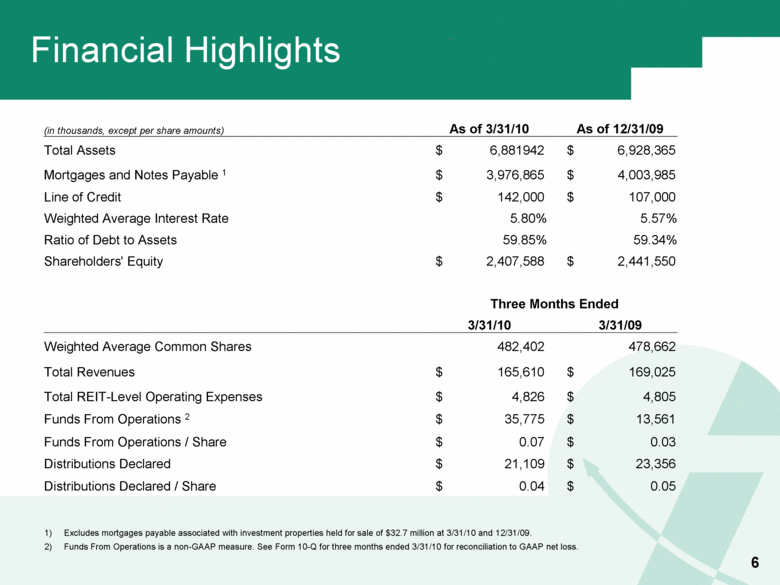
Financial Highlights Excludes mortgages payable associated with investment properties held for sale of $32.7 million at 3/31/10 and 12/31/09. Funds From Operations is a non-GAAP measure. See Form 10-Q for three months ended 3/31/10 for reconciliation to GAAP net loss. 6 (in thousands, except per share amounts) As of 3/31/10 As of 12/31/09 Total Assets $ 6,881942 $ 6,928,365 Mortgages and Notes Payable 1 $ 3,976,865 $ 4,003,985 Line of Credit $ 142,000 $ 107,000 Weighted Average Interest Rate 5.80% 5.57% Ratio of Debt to Assets 59.85% 59.34% Shareholders' Equity $ 2,407,588 $ 2,441,550 Three Months Ended 3/31/10 3/31/09 Weighted Average Common Shares 482,402 478,662 Total Revenues $ 165,610 $ 169,025 Total REIT-Level Operating Expenses $ 4,826 $ 4,805 Funds From Operations 2 $ 35,775 $ 13,561 Funds From Operations / Share $ 0.07 $ 0.03 Distributions Declared $ 21,109 $ 23,356 Distributions Declared / Share $ 0.04 $ 0.05 1) 2) |
|
|
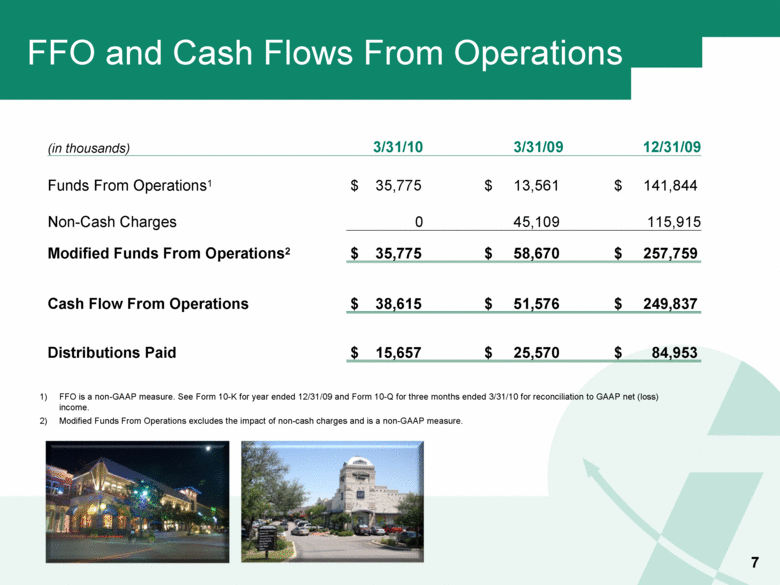
FFO and Cash Flows From Operations FFO is a non-GAAP measure. See Form 10-K for year ended 12/31/09 and Form 10-Q for three months ended 3/31/10 for reconciliation to GAAP net (loss) income. Modified Funds From Operations excludes the impact of non-cash charges and is a non-GAAP measure. (in thousands) 3/31/10 3/31/09 12/31/09 Funds From Operations1 $ 35,775 $ 13,561 $ 141,844 Non-Cash Charges 0 45,109 115,915 Modified Funds From Operations2 $ 35,775 $ 58,670 $ 257,759 Cash Flow From Operations $ 38,615 $ 51,576 $ 249,837 Distributions Paid $ 15,657 $ 25,570 $ 84,953 7 1) 2) |
|
|
8 PORTFOLIO UPDATE |
|
|
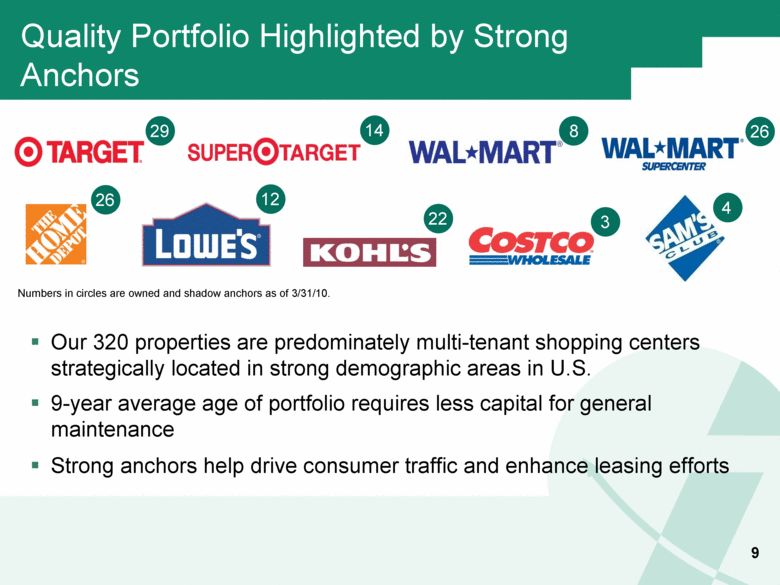
Quality Portfolio Highlighted by Strong Anchors 9 Numbers in circles are owned and shadow anchors as of 3/31/10. Our 320 properties are predominately multi-tenant shopping centers strategically located in strong demographic areas in U.S. 9-year average age of portfolio requires less capital for general maintenance Strong anchors help drive consumer traffic and enhance leasing efforts 29 14 8 26 26 12 22 3 4 |
|
|
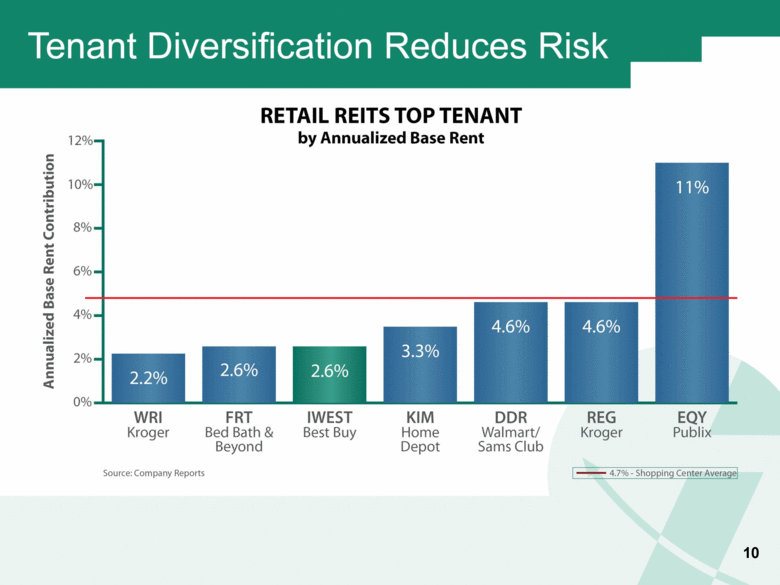
10 Tenant Diversification Reduces Risk RETAIL REITS TOP TENANT by Annualized Base Rent |
|
|
11 Award Winning Marketing Program Benefits Retailers and Consumers Inland Western’s marketing team partners with retailers and community groups to create one of a kind marketing programs that drive traffic, enhance retail sales and make an impact on the community. The marketing team was recognized by the International Council of Shopping Centers with 7 Silver Maxi awards for 2009 programs, including in the inaugural “NEW MEDIA” category. facebook twitter over 17,232 fans and followers receive regular information regarding events, special offers and giveaways, which drive retail sales. Award winning Social Media programs provide a cost effective way to communicate with shoppers. |
|
|
Property Management Goals and Initiatives Cost control and property monitoring measures Focus on reduction of property level expenses – 9.3% reduction in first quarter of 2010 when compared to first quarter of 2009 State of the art business intelligence reporting system Aggressive review of vendor contracts; use economies of scale Dedicated collections team to improve timeliness of cash flows Sustainability initiatives Mission is to operate portfolio in an environmentally friendly manner to improve efficiency and enhance value for tenants and stockholders Implementation of property level energy management systems Orchestration of property level waste collection and recycling Conduct regular audits at select centers to target opportunities and develop best practices 12 |
|
|
13 LEASING & ASSET MANAGEMENT UPDATE |
|
|
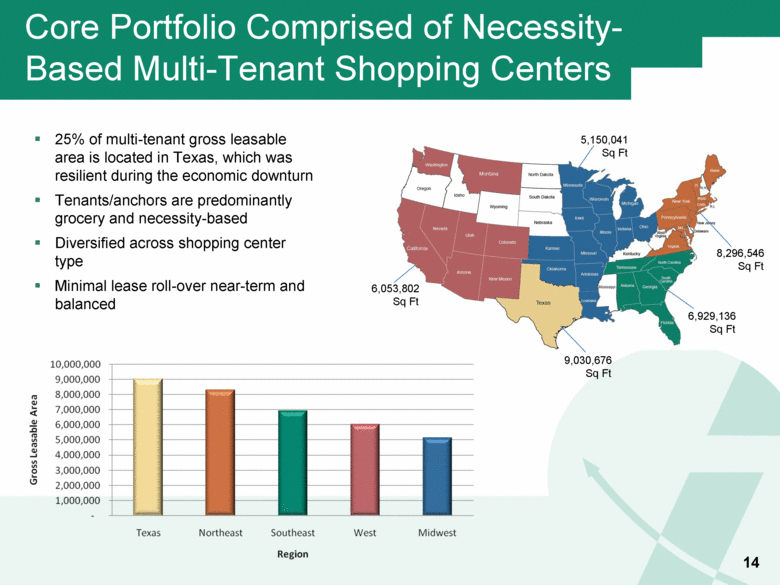
Core Portfolio Comprised of Necessity-Based Multi-Tenant Shopping Centers 25% of multi-tenant gross leasable area is located in Texas, which was resilient during the economic downturn Tenants/anchors are predominantly grocery and necessity-based Diversified across shopping center type Minimal lease roll-over near-term and balanced 14 6,053,802 Sq Ft 9,030,676 Sq Ft 6,929,136 Sq Ft 5,150,041 Sq Ft 8,296,546 Sq Ft |
|
|
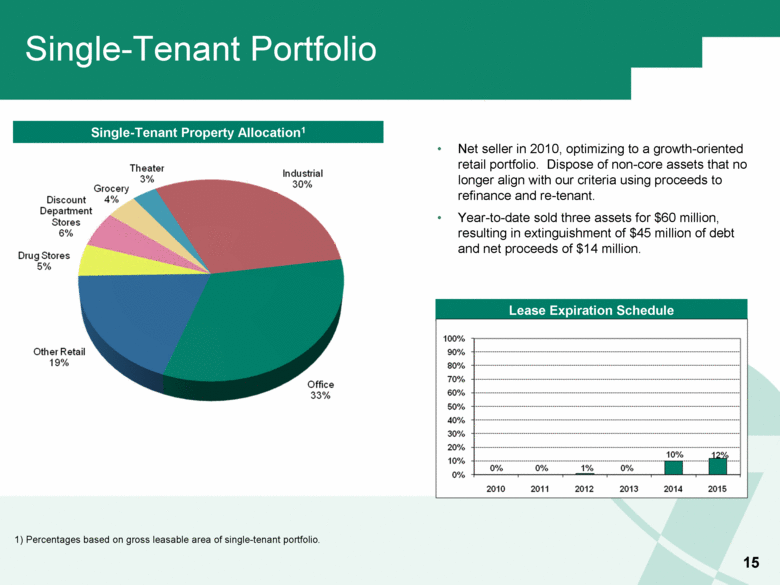
Single-Tenant Portfolio Single-Tenant Property Allocation1 Lease Expiration Schedule Net seller in 2010, optimizing to a growth-oriented retail portfolio. Dispose of non-core assets that no longer align with our criteria using proceeds to refinance and re-tenant. Year-to-date sold three assets for $60 million, resulting in extinguishment of $45 million of debt and net proceeds of $14 million. 1) Percentages based on gross leasable area of single-tenant portfolio. 15 |
|
|
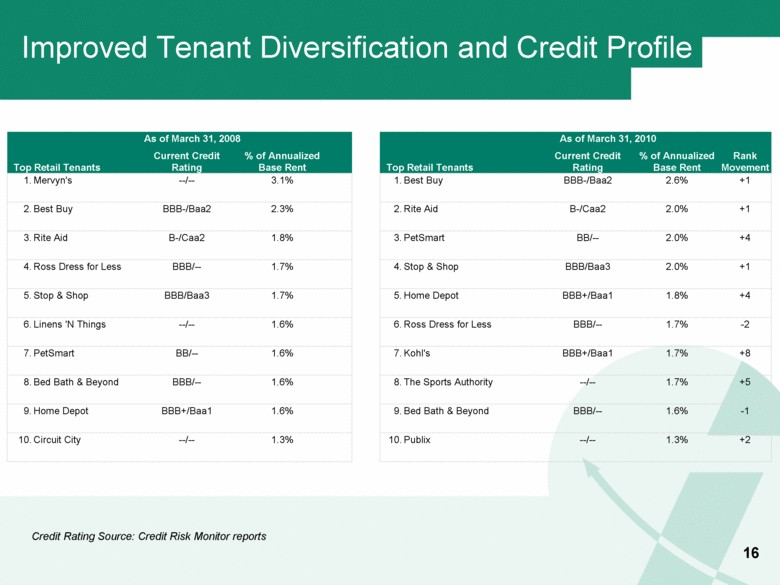
Improved Tenant Diversification and Credit Profile 16 Credit Rating Source: Credit Risk Monitor reports As of March 31, 2008 As of March 31, 2010 Top Retail Tenants Current Credit Rating % of Annualized Base Rent Top Retail Tenants Current Credit Rating % of Annualized Base Rent Rank Movement 1. Mervyn's --/-- 3.1% 1. Best Buy BBB-/Baa2 2.6% +1 2. Best Buy BBB-/Baa2 2.3% 2. Rite Aid B-/Caa2 2.0% +1 3. Rite Aid B-/Caa2 1.8% 3. PetSmart BB/-- 2.0% +4 4. Ross Dress for Less BBB/-- 1.7% 4. Stop & Shop BBB/Baa3 2.0% +1 5. Stop & Shop BBB/Baa3 1.7% 5. Home Depot BBB+/Baa1 1.8% +4 6. Linens 'N Things --/-- 1.6% 6. Ross Dress for Less BBB/-- 1.7% -2 7. PetSmart BB/-- 1.6% 7. Kohl's BBB+/Baa1 1.7% +8 8. Bed Bath & Beyond BBB/-- 1.6% 8. The Sports Authority --/-- 1.7% +5 9. Home Depot BBB+/Baa1 1.6% 9. Bed Bath & Beyond BBB/-- 1.6% -1 10. Circuit City --/-- 1.3% 10. Publix --/-- 1.3% +2 |
|
|
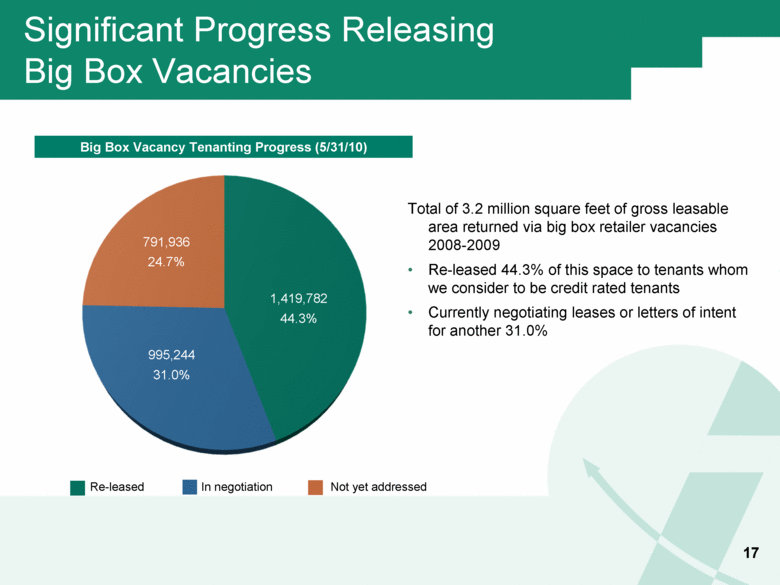
17 Significant Progress Releasing Big Box Vacancies Big Box Vacancy Tenanting Progress (5/31/10) Re-leased In negotiation Not yet addressed 791,936 24.7% 1,419,782 44.3% 995,244 31.0% Total of 3.2 million square feet of gross leasable area returned via big box retailer vacancies 2008-2009 Re-leased 44.3% of this space to tenants whom we consider to be credit rated tenants Currently negotiating leases or letters of intent for another 31.0% |
|
|
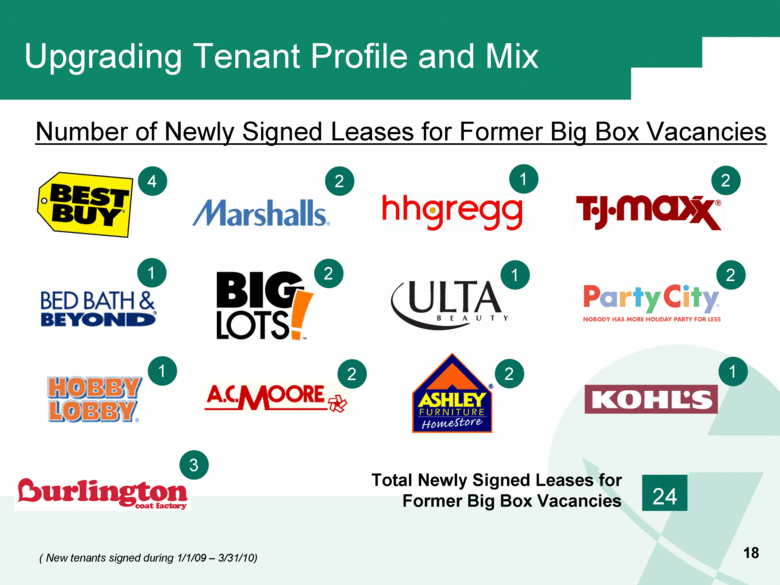
Upgrading Tenant Profile and Mix ( New tenants signed during 1/1/09 – 3/31/10) 18 4 2 1 2 1 2 1 2 1 2 1 2 3 Number of Newly Signed Leases for Former Big Box Vacancies Total Newly Signed Leases for Former Big Box Vacancies 24 |
|
|
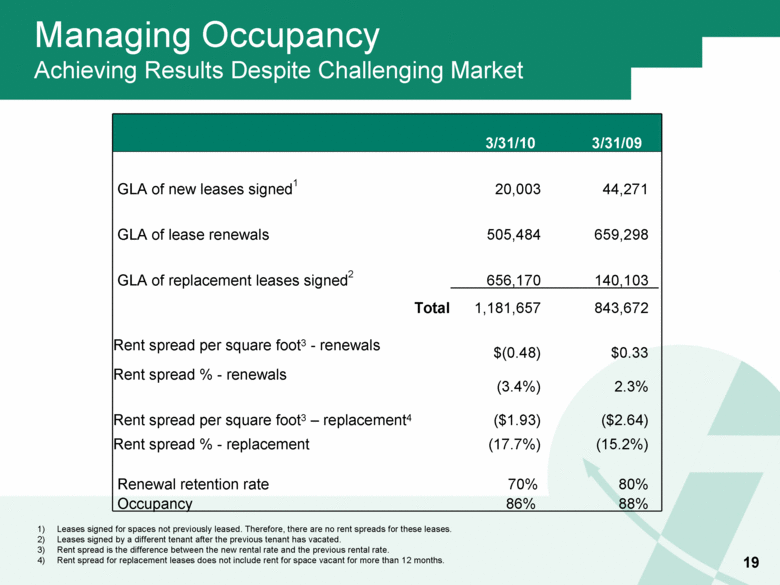
Managing Occupancy Achieving Results Despite Challenging Market Leases signed for spaces not previously leased. Therefore, there are no rent spreads for these leases. Leases signed by a different tenant after the previous tenant has vacated. Rent spread is the difference between the new rental rate and the previous rental rate. Rent spread for replacement leases does not include rent for space vacant for more than 12 months. 3/31/10 3/31/09 GLA of new leases signed1 20,003 44,271 GLA of lease renewals 505,484 659,298 GLA of replacement leases signed2 656,170 140,103 Total 1,181,657 843,672 Rent spread per square foot3 - renewals $(0.48) $0.33 Rent spread % - renewals (3.4%) 2.3% Rent spread per square foot3 – replacement4 ($1.93) ($2.64) Rent spread % - replacement (17.7%) (15.2%) Renewal retention rate 70% 80% Occupancy 86% 88% 19 1) 2) 3) 4) |
|
|
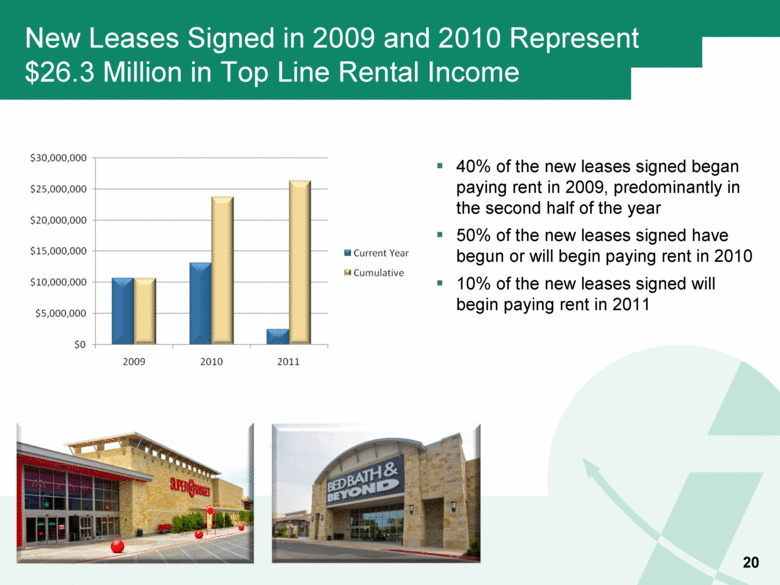
New Leases Signed in 2009 and 2010 Represent $26.3 Million in Top Line Rental Income 40% of the new leases signed began paying rent in 2009, predominantly in the second half of the year 50% of the new leases signed have begun or will begin paying rent in 2010 10% of the new leases signed will begin paying rent in 2011 20 |
|
|
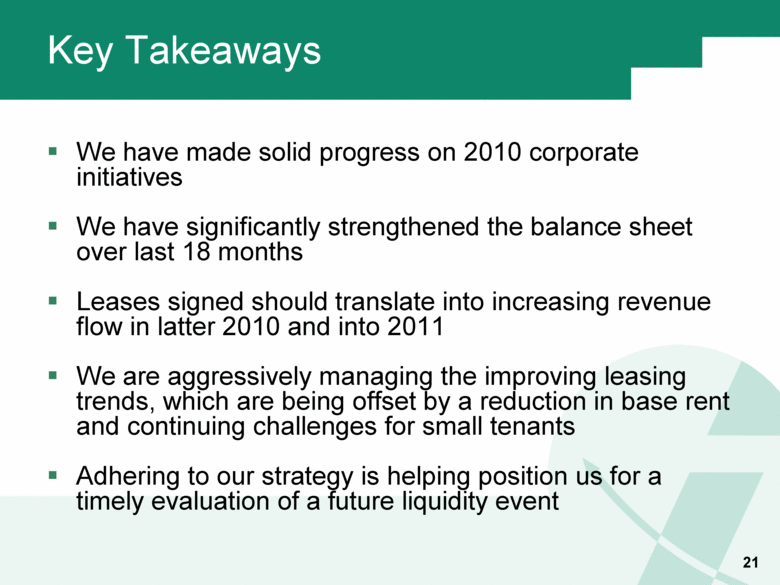
Key Takeaways We have made solid progress on 2010 corporate initiatives We have significantly strengthened the balance sheet over last 18 months Leases signed should translate into increasing revenue flow in latter 2010 and into 2011 We are aggressively managing the improving leasing trends, which are being offset by a reduction in base rent and continuing challenges for small tenants Adhering to our strategy is helping position us for a timely evaluation of a future liquidity event 21 |
|
|
Forward-Looking Statements Certain statements in this presentation may constitute “forward-looking statements.” Forward-looking statements are statements that are not historical, including statements regarding management’s intentions, beliefs, expectations, representations, plans or predictions of the future and are typically identified by such words as “believe,” “expect,” “anticipate,” “intend,” “estimate,” “plan,” “may,” “should” and “could.” We intend that such forward-looking statements be subject to the safe harbor provisions created by Section 27A of the Securities Act of 1933 and Section 21E of the Securities Exchange Act of 1934 and the Federal Private Securities Litigation Reform Act of 1995 and we include this statement for the purpose of complying with such safe harbor provisions. Future events and actual results, performance, transactions or achievements, financial or otherwise, may differ materially from the results, performance, transactions or achievements expressed or implied by the forward-looking statements. Risks, uncertainties and other factors that might cause such differences, some of which could be material. For more information refer to Part 1. Items 1A. Risk Factors in our 2009 annual report on Form 10-K for the year ended December 31, 2009, as amended. We disclaim any intention or obligation to update or revise any forward-looking statement whether as a result of new information, future events or otherwise. Readers are cautioned not to place undue reliance on these forward-looking statements, which speak only as of March 31, 2010. This presentation should also be read in conjunction with our Annual Reports on Form 10-K, as amended, and our Quarterly Reports on Form 10-Q as filed with the SEC. Tenant Photographs and Logos The companies depicted may have proprietary interests in their trade names and trademarks. Nothing herein shall be considered to be an endorsement authorization or approval of Inland Western Retail Real Estate Trust, Inc. by the aforementioned companies. Further, none of the aforementioned companies are affiliated with Inland Western Retail Real Estate Trust, Inc. in any manner, other than being a tenant in properties that Inland Western Retail Real Estate Trust, Inc. owns or has interest in. Property Photographs Properties depicted in photographs in this presentation are wholly or partially owned by Inland Western Retail Real Estate Trust, Inc. However, some photographs are of shadow anchors, which are located in or adjacent to our center, but that are not owned by Inland Western Retail Real Estate Trust, Inc. 22 |

