Attached files
| file | filename |
|---|---|
| 8-K - FORM 8-K - STRATEGIC HOTELS & RESORTS, INC | d8k.htm |
Exhibit 99.1
|
|

STRATEGIC
Hotels & Resorts
NAREIT Presentation June 2010
|
|
Agenda
I. Company Overview
II. Industry Update
III. BEE Growth Profile
IV. Balance Sheet Review
2
|
|
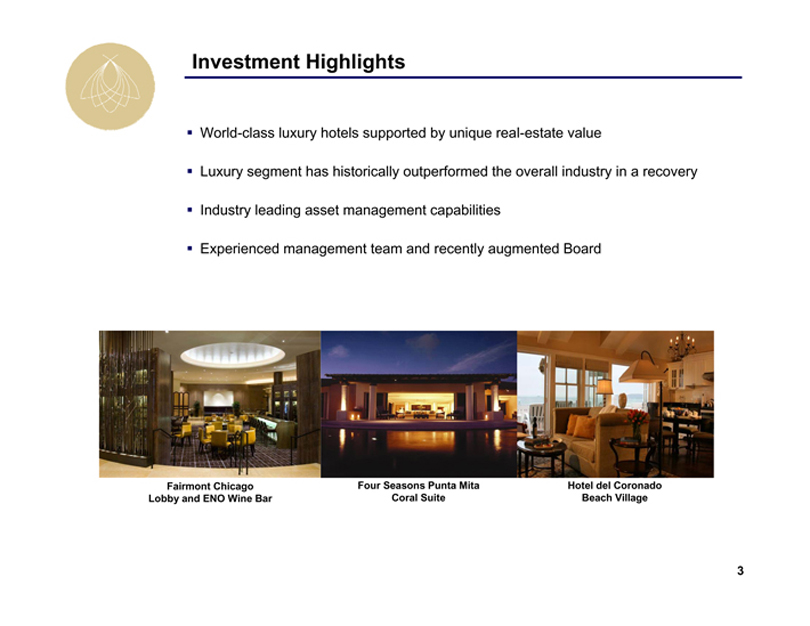
Investment Highlights
• World-class luxury hotels supported by unique real-estate value
• Luxury segment has historically outperformed the overall industry in a recovery
• Industry leading asset management capabilities
• Experienced management team and recently augmented Board
Fairmont Chicago Lobby and ENO Wine Bar
Four Seasons Punta Mita Coral Suite
Hotel del Coronado Beach Village
3
|
|
Strategic Hotels 2.0
• Plan to exit Europe and focus on North American business strategy
• Pursuing balance sheet initiatives in order to improve capital structure and liquidity
• Disciplined approach to capital allocation
• Initiatives to reduce corporate overhead
• Augmented management organization and Board with industry leaders
– Appointed REIT industry veteran Diane Morefield to CFO
– Appointed Raymond “Rip” Gellein, Jr. to Board of Directors. Former President, Global Development Group of Starwood Hotels and Resorts Worldwide, Inc.
– Appointed Eugene Reilly to Board of Directors. Current President of the Americas for AMB Property Corporation
– Appointed Richard Kincaid to Board of Directors. Former President and CEO of Equity Office Properties Trust
4
|
|
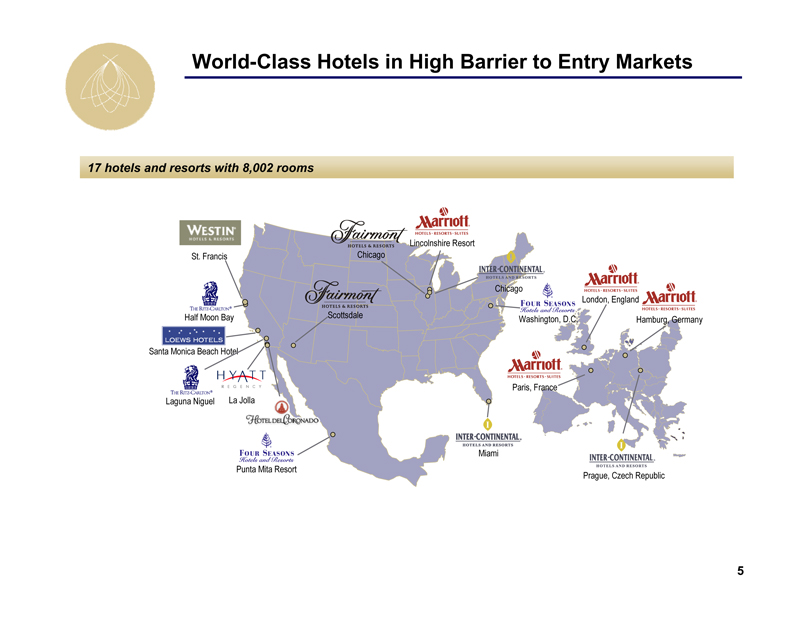
World-Class Hotels in High Barrier to Entry Markets
17 hotels and resorts with 8,002 rooms
WESTIN HOTELS & RESORTS St. Francis
THE RITZ-CARLTON®
Half Moon Bay
LOEWS HOTELS
Santa Monica Beach Hotel
THE RITZ-CARLTON®
Laguna Niguel
HYATT REGENCY
La Jolla
HOTEL DEL CORONADO
FOUR SEASONS Hotels and Resorts
Punta Mita Resort
Fairmont HOTELS & RESORTS Chicago
Fairmont HOTELS & RESORTS Scottsdale
Marriott HOTELS • RESORTS • SUITES
Lincolnshire Resort
INTER-CONTINENTAL
HOTELS AND RESORTS
Chicago
FOUR SEASONS Hotels and Resorts Washington, D.C.
Marriott HOTELS • RESORTS • SUITES
Paris, France
INTER-CONTINENTAL
HOTELS AND RESORTS Miami
Marriott HOTELS • RESORTS • SUITES
London, England
Marriott HOTELS • RESORTS • SUITES
Hamburg, Germany
INTER-CONTINENTAL
HOTELS AND RESORTS
Prague, Czech Republic
5
|
|
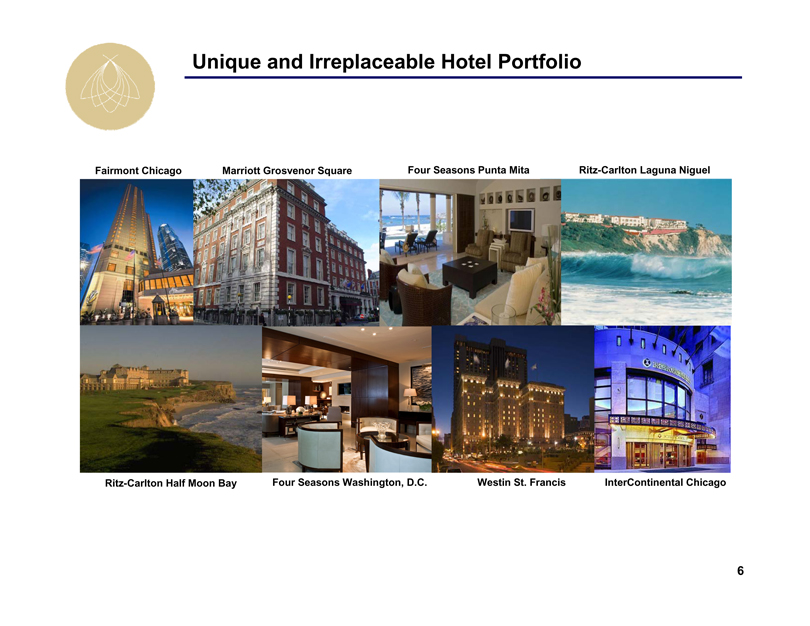
Unique and Irreplaceable Hotel Portfolio
Fairmont Chicago
Marriott Grosvenor Square
Four Seasons Punta
Mita Ritz-Carlton Laguna Niguel
Ritz-Carlton Half Moon Bay
Four Seasons Washington, D.C.
Westin St. Francis
InterContinental Chicago
6
|
|
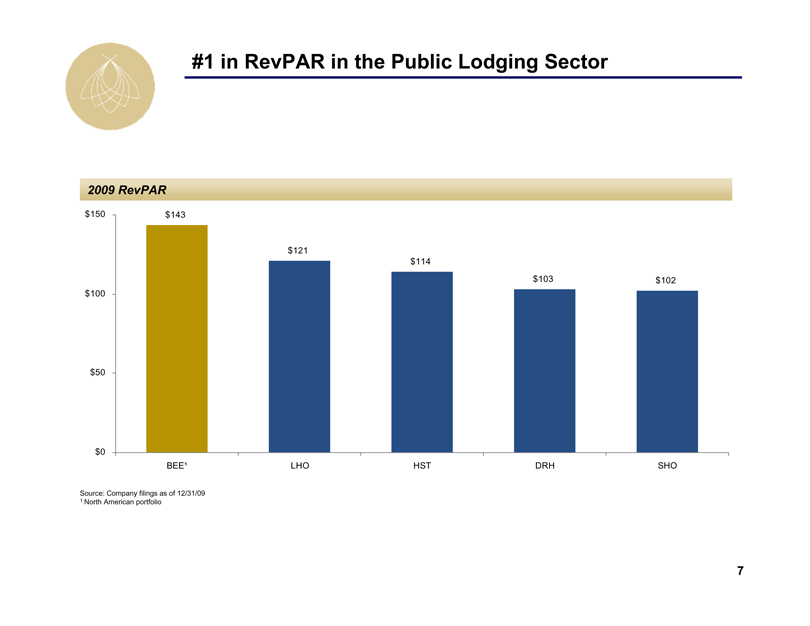
#1 in RevPAR in the Public Lodging Sector
2009 RevPAR
$150 $100 $50 $0
$143 $121 $114 $103 $102
BEE1 LHO HST DRH SHO
Source: Company filings as of 12/31/09
1 North American portfolio
7
|
|
Agenda
I. Company Overview
II. Industry Update
8
|
|
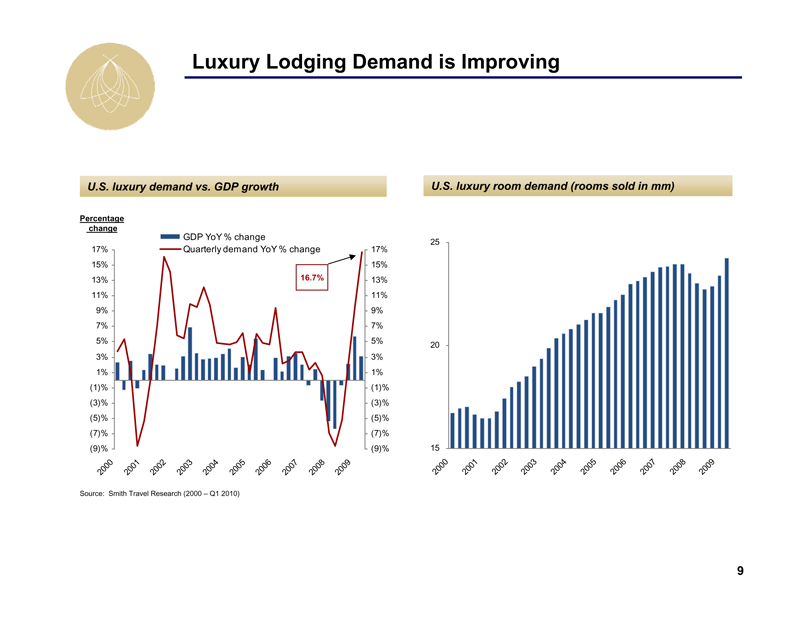
Luxury Lodging Demand is Improving
U.S. luxury demand vs. GDP growth
Percentage change
GDP YoY % change
Quarterly demand YoY % change
16.7%
17% 15% 13% 11% 9% 7% 5% 3% 1% (1)% (3)% (5)% (7)% (9)%
2000 2001 2002 2003 2004 2005 2006 2007 2008 2009
17% 15% 13% 11% 9% 7% 5% 3% 1% (1)% (3)% (5)% (7)% (9)%
U.S. luxury room demand (rooms sold in mm)
25 20 15
2000 2001 2002 2003 2004 2005 2006 2007 2008 2009
Source: Smith Travel Research (2000 – Q1 2010)
9
|
|
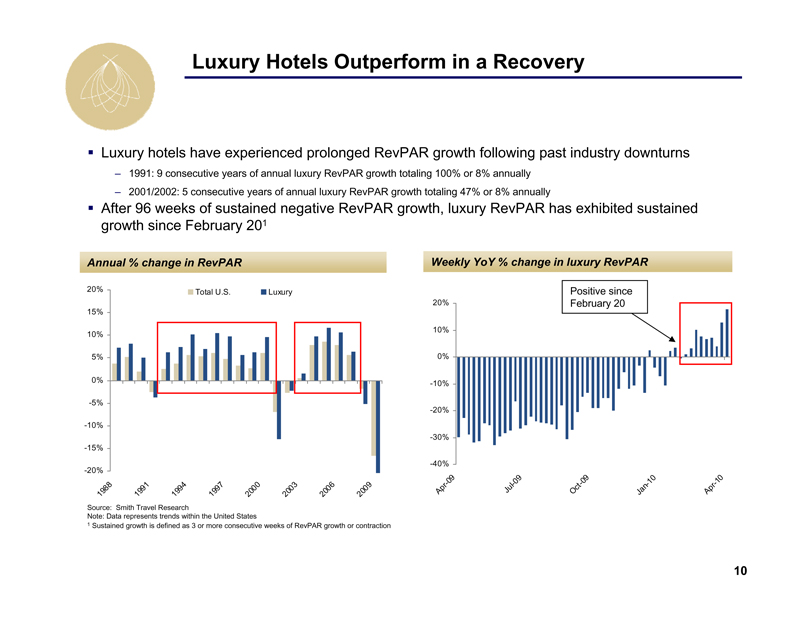
Luxury Hotels Outperform in a Recovery
• Luxury hotels have experienced prolonged RevPAR growth following past industry downturns
– 1991: 9 consecutive years of annual luxury RevPAR growth totaling 100% or 8% annually
– 2001/2002: 5 consecutive years of annual luxury RevPAR growth totaling 47% or 8% annually
• After 96 weeks of sustained negative RevPAR growth, luxury RevPAR has exhibited sustained growth since February 201
Annual % change in RevPAR
Total U.S. Luxury
20% 15% 10% 5% 0% -5% -10% -15% -20%
1988 1991 1994 1997 2000 2003 2006 2009
Weekly YoY % change in luxury RevPAR
Positive since February 20
20% 10% 0% -10% -20% -30% -40%
Apr-09 Jul-09 Oct-09 Jan-10 Apr-10
Source: Smith Travel Research
Note: Data represents trends within the United States
1 Sustained growth is defined as 3 or more consecutive weeks of RevPAR growth or contraction
10
|
|
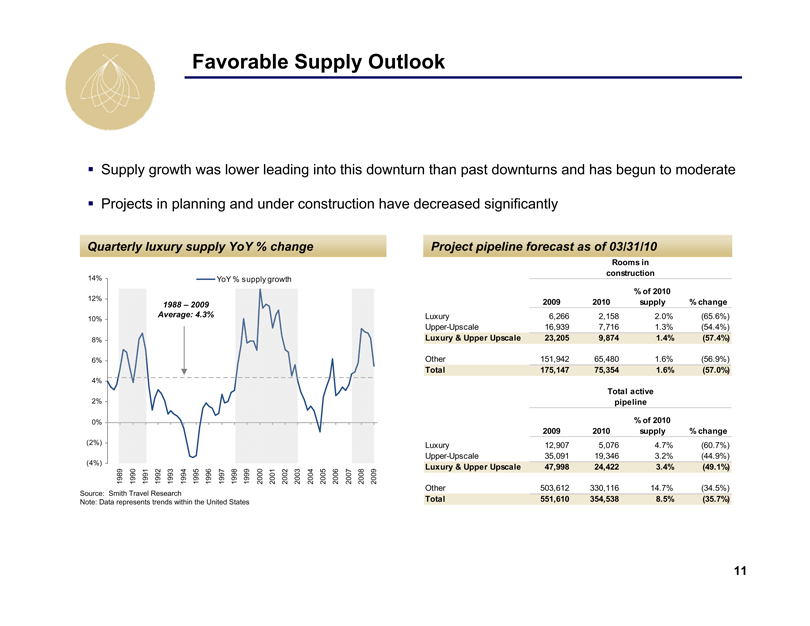
Favorable Supply Outlook
• Supply growth was lower leading into this downturn than past downturns and has begun to moderate
• Projects in planning and under construction have decreased significantly
Quarterly luxury supply YoY % change
YoY % supply growth
1988 – 2009
Average: 4.3%
14% 12% 10% 8% 6% 4% 2% 0% (2%) (4%)
1989 1990 1991 1992 1993 1994 1995 1996 1997 1998 1999 2000 2001 2002 2003 2004 2005 2006 2007 2008 2009
Project pipeline forecast as of 03/31/10
Rooms in construction
% of 2010
2009 2010 supply % change
Luxury 6,266 2,158 2.0% (65.6%)
Upper-Upscale 16,939 7,716 1.3% (54.4%)
Luxury & Upper Upscale 23,205 9,874 1.4% (57.4%)
Other 151,942 65,480 1.6% (56.9%)
Total 175,147 75,354 1.6% (57.0%)
Total active pipeline
% of 2010
2009 2010 supply % change
Luxury 12,907 5,076 4.7% (60.7%) Upper-Upscale 35,091 19,346 3.2% (44.9%)
Luxury & Upper Upscale 47,998 24,422 3.4% (49.1%)
Other 503,612 330,116 14.7% (34.5%)
Total 551,610 354,538 8.5% (35.7%)
Source: Smith Travel Research
Note: Data represents trends within the United States
11
|
|
Agenda
I. Company Overview
II. Industry Update
III. BEE Growth Profile
12
|
|
Industry Leading Asset Management Capabilities
• Revenue enhancement through market research based programs
• Exceptional asset management supported by internally developed operating systems
• Aggressive and early cost cutting initiatives implemented in advance of the downturn
• Rigorous oversight of brand managers to ensure alignment of interests
• Evaluation and implementation of value add ROI projects
13
|
|
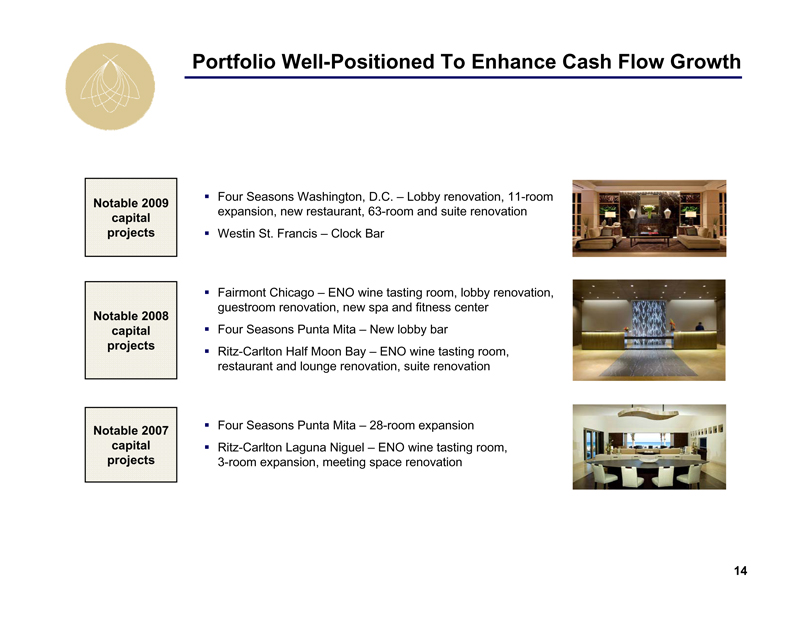
Portfolio Well-Positioned To Enhance Cash Flow Growth
Notable 2009 capital projects • Four Seasons Washington, D.C. – Lobby renovation, 11-room expansion, new restaurant, 63-room and suite renovation • Westin St. Francis – Clock Bar
Notable 2008 capital projects • Fairmont Chicago – ENO wine tasting room, lobby renovation, guestroom renovation, new spa and fitness center • Four Seasons Punta Mita – New lobby bar • Ritz-Carlton Half Moon Bay – ENO wine tasting room, restaurant and lounge renovation, suite renovation
Notable 2007 capital projects • Four Seasons Punta Mita – 28-room expansion • Ritz-Carlton Laguna Niguel – ENO wine tasting room, 3-room expansion, meeting space renovation
14
|
|
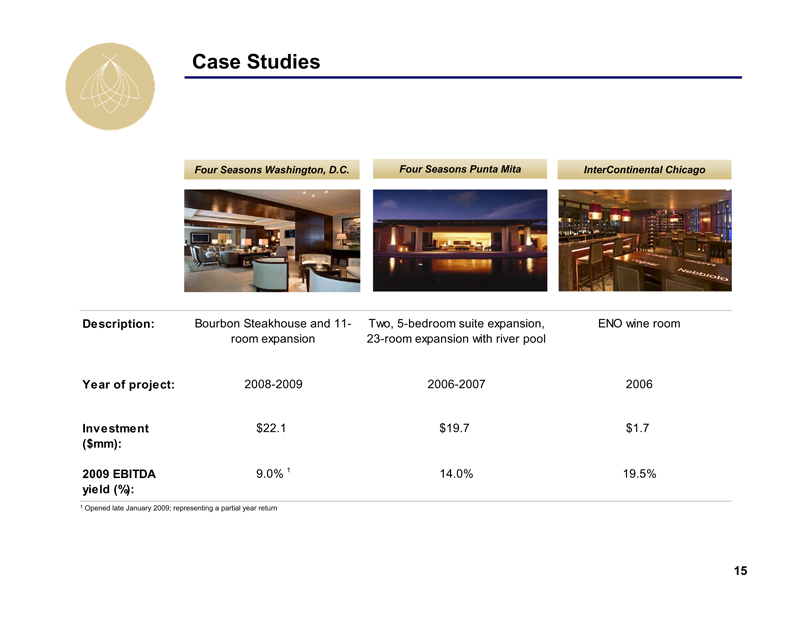
Case Studies
Four Seasons Washington, D.C.
Four Seasons Punta Mita
InterContinental Chicago
Description: Bourbon Steakhouse and 11-room expansion
Two, 5-bedroom suite expansion, 23-room expansion with river pool
ENO wine room
Year of project: 2008-2009 2006-2007 2006
Investment $22.1 $19.7 $1.7
($mm):
2009 EBITDA 9.0% 1 14.0% 19.5%
yield (%):
1 Opened late January 2009; representing a partial year return
15
|
|
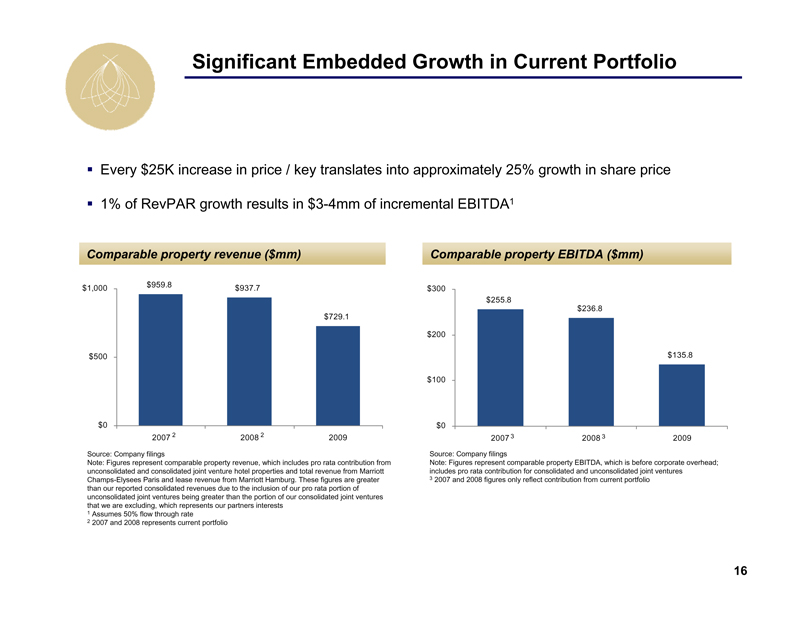
Significant Embedded Growth in Current Portfolio
• Every $25K increase in price / key translates into approximately 25% growth in share price
• 1% of RevPAR growth results in $3-4mm of incremental EBITDA1
Comparable property revenue ($mm)
$1,000 $959.8 $937.7 $729.1
$500
$0
2007 2 2008 2 2009
Source: Company filings
Note: Figures represent comparable property revenue, which includes pro rata contribution from unconsolidated and consolidated joint venture hotel properties and total revenue from Marriott Champs-Elysees Paris and lease revenue from Marriott Hamburg. These figures are greater than our reported consolidated revenues due to the inclusion of our pro rata portion of unconsolidated joint ventures being greater than the portion of our consolidated joint ventures that we are excluding, which represents our partners interests
1 Assumes 50% flow through rate
2 2007 and 2008 represents current portfolio
Comparable property EBITDA ($mm)
$300 $255.8 $236.8 $135.8
$200
$100
$0
2007 3 2008 3 2009
Source: Company filings
Note: Figures represent comparable property EBITDA, which is before corporate overhead; includes pro rata contribution for consolidated and unconsolidated joint ventures
3 2007 and 2008 figures only reflect contribution from current portfolio
16
|
|
Agenda
I. Company Overview
II. Industry Update
III. BEE Growth Profile
IV. Balance Sheet Review
17
|
|
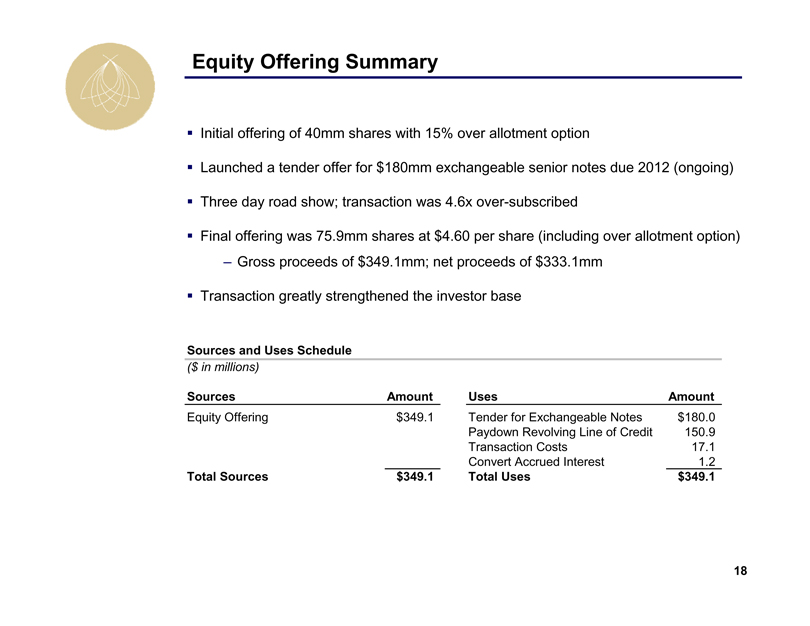
Equity Offering Summary
• Initial offering of 40mm shares with 15% over allotment option
• Launched a tender offer for $180mm exchangeable senior notes due 2012 (ongoing)
• Three day road show; transaction was 4.6x over-subscribed
• Final offering was 75.9mm shares at $4.60 per share (including over allotment option)
– Gross proceeds of $349.1mm; net proceeds of $333.1mm
• Transaction greatly strengthened the investor base
Sources and Uses Schedule
($ in millions)
Sources Amount
Equity Offering $349.1
Total Sources $349.1
Uses Amount
Tender for Exchangeable Notes $180.0
Paydown Revolving Line of Credit 150.9
Transaction Costs 17.1
Convert Accrued Interest 1.2
Total Uses $349.1
18
|
|
Recent Balance Sheet Strengthening Initiatives
• $349mm equity offering and exchangeable note tender offer
• Sold three hotels generating $202mm in gross proceeds
– 12/09: Renaissance Paris Hotel Le Parc Trocodero ($52mm)
– 10/09: Four Seasons Mexico City ($54mm)
– 07/08: Hyatt Regency Phoenix ($96mm)
• Extended certain property level debt
– 01/10: InterContinental Prague – $148mm: Extension until 2015
– 05/10: Westin St. Francis & Fairmont Chicago – $318mm: Extension until 2017
• Credit facility provides access to liquidity through 2012
19
|
|
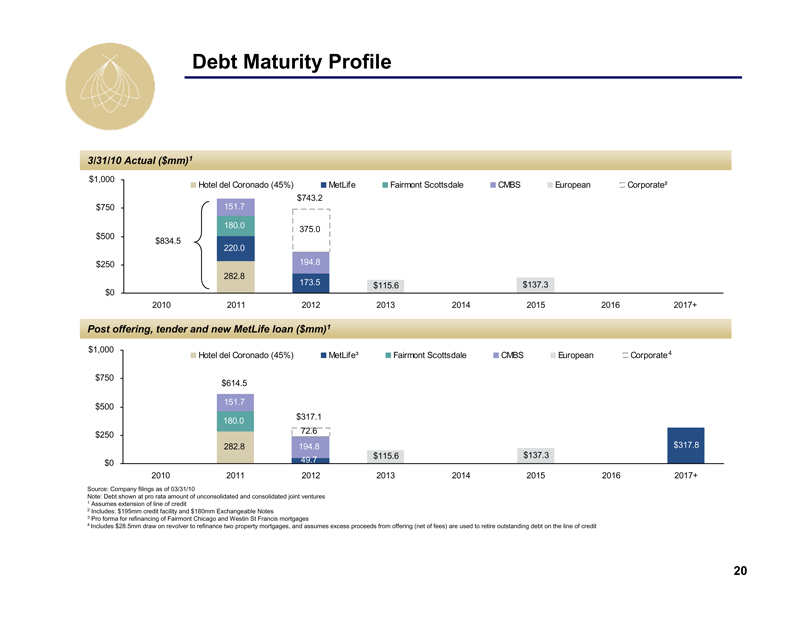
Debt Maturity Profile
3/31/10 Actual ($mm)1
$1,000 $750 $500 $250 $0
Hotel del Coronado (45%) MetLife Fairmont Scottsdale CMBS European Corporate2
$834.5 { 151.7 180.0 220.0 282.8
$743.2 375.0 194.8 173.5
$115.6 $137.3
2010 2011 2012 2013 2014 2015 2016 2017+
Post offering, tender and new MetLife loan ($mm)1
Hotel del Coronado (45%) MetLife3 Fairmont Scottsdale CMBS European Corporate4
$1,000 $750 $500 $250 $0
$614.5 151.7 180.0 282.8
$317.1 72.6 194.8 49.7
$115.6 $137.3 $317.8
2010 2011 2012 2013 2014 2015 2016 2017+
Source: Company filings as of 03/31/10
Note: Debt shown at pro rata amount of unconsolidated and consolidated joint ventures
1 Assumes extension of line of credit
2 Includes: $195mm credit facility and $180mm Exchangeable Notes
3 Pro forma for refinancing of Fairmont Chicago and Westin St Francis mortgages
4 Includes $28.5mm draw on revolver to refinance two property mortgages, and assumes excess proceeds from offering (net of fees) are used to retire outstanding debt on the line of credit
20
|
|
Key Objectives
ü Issue equity
ü Retire the exchangeable notes
• Maximize earnings through organic revenue growth and cost containment
• Exit Europe
• Address debt maturities
• Evaluate ROI capital projects within existing portfolio
21
|
|

STRATEGIC
Hotels & Resorts