Attached files
 A
Valuable, Unique & Stable Bridge from Mixed C4 to Purity Products
Ruth Dreessen
Executive Vice President & Chief Financial Officer
Wells Fargo NGL Summit
May 26, 2010
A Service-Based Intermediary
with Strong Infrastructure
& Logistics Network
Exhibit 99.1 |
 Forward-Looking Statements & Non-GAAP Financial Measures
This
presentation
may
contain
“forward-looking
statements”
within
the
meaning
of
the
securities
laws.
These
statements
include
assumptions,
expectations,
predictions,
intentions
or
beliefs
about
future
events,
particularly statements that may relate to future operating results, existing and
expected competition, financing and refinancing sources and availability,
and plans related to strategic alternatives or future expansion activities
and capital expenditures. Although TPC Group believes that such statements are
based on reasonable assumptions, no assurance can be given that such statements
will prove to have been
correct.
A
number
of
factors
could
cause
actual
results
to
vary
materially
from
those
expressed
or
implied in any forward-looking statements, including risks and uncertainties
such as volatility in the petrochemicals industry, limitations on the
Company’s access to capital, the effects of competition, leverage and
debt service, general economic conditions, litigation and governmental investigations, and
extensive
environmental,
health
and
safety
laws
and
regulations.
More
information
about
the
risks
and
uncertainties relating to TPC Group and the forward-looking statements are
found in the Company’s SEC filings, including the Registration
Statement on Form 10, as amended, which are available free of charge
on
the
SEC’s
website
at
http://www.sec.gov
.
TPC
Group
expressly
disclaims
any
obligation
to
update
any
forward-looking statements contained herein to reflect events or circumstances
that may arise after the date of this presentation.
This presentation may also include non-GAAP financial information. A
reconciliation of non-GAAP financial measures to the most directly
comparable GAAP financial measures, as well as additional detail regarding
the utility of such non-GAAP financial information, is included in the
Appendix. 2
Wells
Fargo
NGL
Summit
-
May
26,
2010 |
 Investment Highlights
3
Wells
Fargo
NGL
Summit
-
May
26,
2010
Attractive
Market Position in
Consolidated Industry
Substantial
and Strategic
Asset Value
Significant and
Stable Free
Cash Flow
Differentiated
Business Model
Positioned for
Margin Expansion
and Growth
Valuation
Upside |
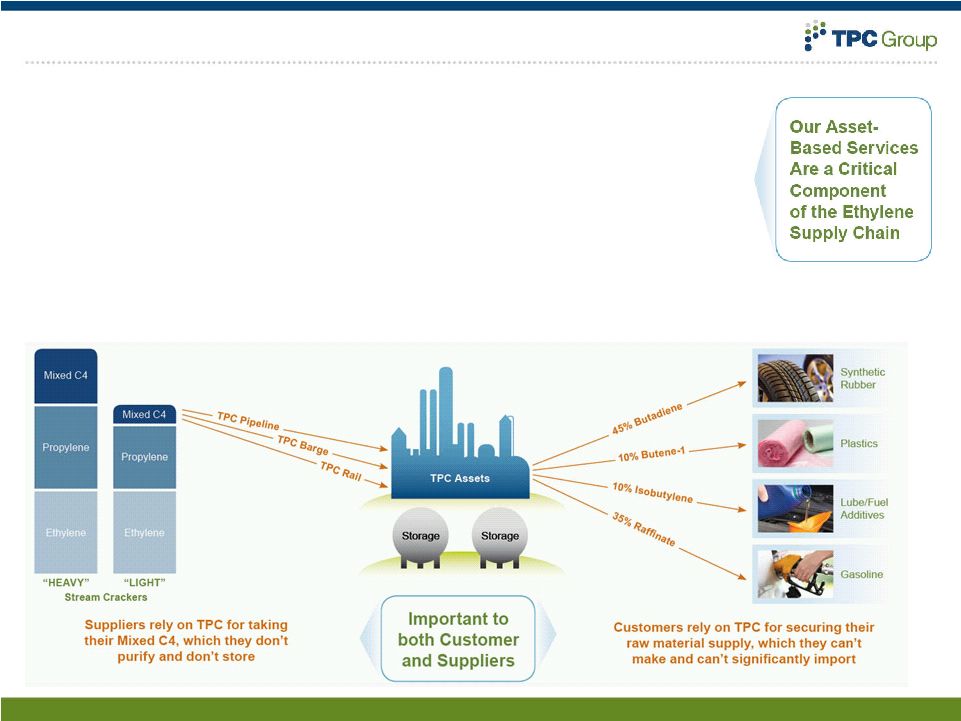 Differentiated Business Model
TPC Group: a C4 processor, logistics provider & marketer
•
C4: four carbon hydrocarbon by-products of ethylene production
•
Ethylene
produced
by
cracking
“heavy”
(naphtha)
or
“light”
(NGL’s)
–
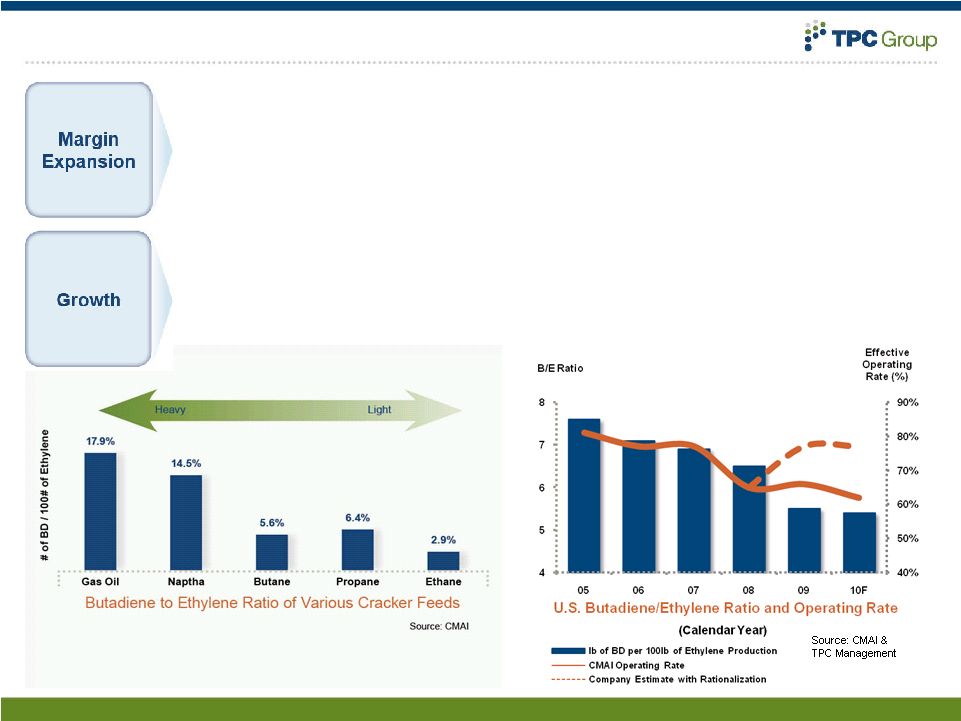
Cracking “heavy”
produces significantly more C4 than cracking “light”
–
“Heavy”
crackers: integrated with their own C4 processing
–
“Light”
crackers: non-integrated and therefore outsource to TPC
•
Long-standing, service-based contracts mitigate exposure to commodity
prices –
TPC receives processing fees from its suppliers
–
TPC receives service fees from its customers
•
Key drivers of profitability are unit margins, volume & production
efficiency 4
Wells
Fargo
NGL
Summit
-
May
26,
2010 |
 Substantial & Strategic Asset Value
5
Wells
Fargo
NGL
Summit
-
May
26,
2010 |
 Business
Segments
–
C4
Processing
&
Performance
Products
6
Wells
Fargo
NGL
Summit
-
May
26,
2010 |
 C4
Processing – Attractive Market Position
7
•
Products: Butadiene, Butene-1, Raffinates
•
Suppliers: Dow, Formosa, Nova, CP Chem,
Others (15 different ethylene plants)
•
Customers: Goodyear, Firestone, Lanxess,
Invista, Dow, Motiva, Valero, Others
•
Market leader with 35% of overall North American C4 processing capacity
•
Approximately 65% market share of non-integrated C4 processing
•
Contractually aligned with cost-advantaged ethylene producers
•
Profitability model: fixed margin and index-based contracts
•
Best-in-class logistical system and operational reliability
•
Bringing diverse C4 supplies together
•
Integral to ethylene value chain
Wells
Fargo
NGL
Summit
-
May
26,
2010
FY 07
FY 08
FY 09
LTM
3/10
Volume (MMlbs)
2,905
2,832
2,295
2,486
Gross Profit ($ MM)
(1)
$170
$177
$121
$197
Gross Profit (¢/lb)
5.9
6.2
5.3
8.0
(1) Includes insurance recovery proceeds |
 C4
Processing – Attractive Market Position
8
•
C4 markets remain tight, allowing margin increase opportunities
•
Raffinates
margin is a percentage of gasoline price
•
Service fees for use of our logistical network
•
Any industry movement toward heavier feeds increases mixed C4 volumes
•
Light cracking may lead integrated producers to outsource C4 handling
•
Butene-1 demand continues to increase faster than plastic demand
Wells
Fargo
NGL
Summit
-
May
26,
2010 |
 C4
Processing – Logistics, Credibility, Competency
9
Wells
Fargo
NGL
Summit
-
May
26,
2010 |
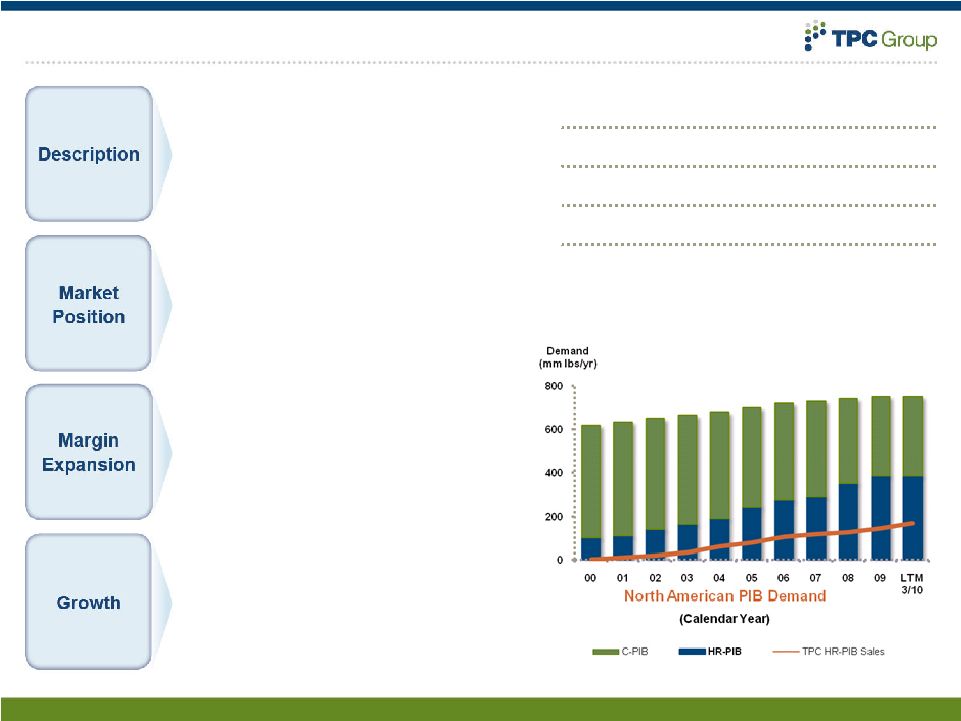 Performance Products –
Poised for Growth
10
•
Products: PIB, HPIB, DIB, Nonene, Tetramer
•
Suppliers: C4 Processing, LyondellBasell, BP, Others
•
Customers: Afton, SI Group, Lanxess, Others
•
Profitability model: index-based contracts
•
Only merchant producer of HR-PIB in North America
•
Patent protected technology (PIB)
•
Second largest merchant HPIB producer,
90+% market share of DIB market
•
Only dedicated Nonene
& Tetramer production
plant in North America
•
Merchant HPIB player exited market
•
Strong alternative value for Isobutylenes
•
Operating ramp-up & efficiency gains for
Nonene
plant
•
Second HR-PIB plant on-line in early 2009,
with market expanding
•
Increasing HPIB & Nonene
sales
•
Additional product lines from upgrading
by-products
Wells
Fargo
NGL
Summit
-
May
26,
2010
FY 07
FY 08
FY 09
LTM
3/10
Volume (MMlbs)
528
788
602
572
Gross Profit ($ MM)
$65
$80
$62
$58
Gross Profit (¢/lb)
(1)
12.4
10.7
11.1
11.3
(1) Does not contain propane volume |
 Butane Dehydrogenation
World-scale Units
•
Two 12,500 BPD butane to butylene
Catofin
dehydrogenation units
•
Successfully operated for many years; idled in 2007
•
Operate on normal butane or isobutane
Tight Product Markets
•
Gasoline
components
–
MTBE,
ETBE
•
Petrochemicals
–
Butadiene,
Butene-1,
Isobutylene
Attractive Margins
•
Butane
feedstock
is
NGL
–
tracking
natural
gas
•
Butylene
based products track gasoline & crude oil
•
Light cracking creating shortage of all C4 olefins
Associated Equipment in Place
•
Butadiene extraction, butene-1 purification, & MTBE
production units
•
All necessary utilities & logistics network
11
Wells Fargo NGL Summit -
May 26, 2010 |
 TPC
Business Model
12
Wells Fargo NGL Summit -
May 26, 2010
Component
Cost Basis
Product
Sale Basis
Butadiene
-
55%
Benchmark –
Processing Fee
Butadiene
Benchmark Posting
Butylenes
-
32%
Butene-1
Isobutylene
Butene-2
Gasoline
Butene-1
MTBE
HPIB
Raffinates
Gasoline + Fixed Factor
Market Based
Iso-butane
Gasoline
Butanes -
13%
Normal Butane
Raffinates
Gasoline
Isobutylene
Normal Butane
PIB
DIB
Iso-butane
Iso-butane
Propylene
Propylene
Nonene
Tetramer
Propylene + Fixed Factor
Propylene + Fixed Factor
All feedstocks
and products are purchased and sold at prices based on, and highly correlated to
prices for WTI, Unleaded Gasoline, and Normal Butane
C4 Processing
Performance
Products |
 Financials –
Past Performance
Wells
Fargo
NGL
Summit
-
May
26,
2010
13
(1)
2007 CapEx
for Propylene Derivatives facility
(2)
2008 CapEx
for second HR-PIB plant
(3)
See Appendix for reconciliation
4-year
Average
Maintenance Cap Ex |
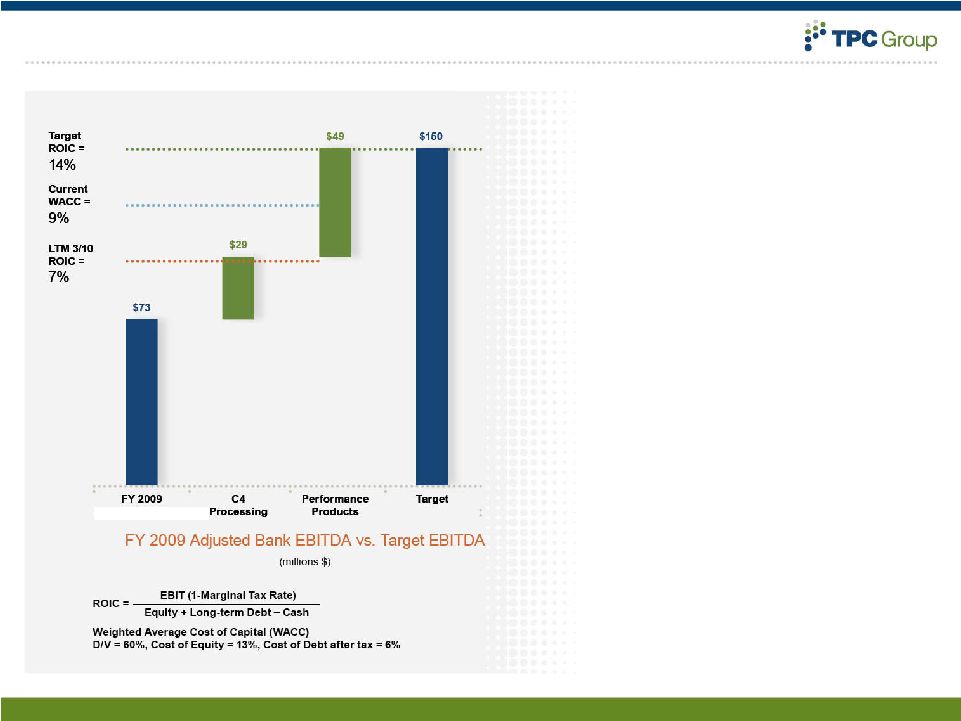 Financials –
Target
14
•
Target EBITDA levels allow the
company to earn in excess of WACC
•
C4 processing driven by margin
expansion from favorable market
conditions and reliable supply
•
Performance products driven by
volume and margin expansion
–
Recent capital investments
in Polyisobutylene and
Propylene Derivatives
Wells
Fargo
NGL
Summit
-
May
26,
2010
Adj. Basic EBITDA
(a)
(a) Please refer to slide 18 for a reconciliation of Adj. Basic EBITDA to Net
Income |
 Significant & Stable Free Cash Flow
A Valuable, Unique and Stable Bridge
15
Wells
Fargo
NGL
Summit
-
May
26,
2010 |
 Why
TPC Group? Why Now? Differentiated Business Model
•
Service-based intermediary with strong infrastructure & logistics
network •
Long-standing, service-based contracts limit exposure to commodity
prices Substantial and Strategic Asset Value
•
TPC asset-based services are a critical component of the ethylene supply
chain •
High replacement value is strong barrier to entry
Attractive Market Position in Consolidated Industry
•
#1 position in BD, B-1, DIB and HR-PIB
•
Contractually
aligned
with
cost-advantaged
“light”
ethylene
producers
Positioned for Margin Expansion and Growth
•
Market dynamics allow for increased margins
•
Increased usage of highly reactive Polyisobutylene
•
Recent capital investment projects now complete
Significant and Stable Free Cash Flow
•
Minimal maintenance CapEx
& cost-efficient capital structure
•
Strong cash generation throughout cycle (average of $3.00/share over last four
years) •
Strong focus on operational excellence and cost management
TPCG Valuation Upside
•
Business model stabilizes unit margins
16
Wells
Fargo
NGL
Summit
-
May
26,
2010 |
 Investor Presentation –
May 2010
Appendix
17 |
 Reconciliation of Adjusted Basic EBITDA to Net Income
18
Wells
Fargo
NGL
Summit
-
May
26,
2010
($ millions)
Fiscal year ended June 30,
LTM ended
2007
2008
2009
March 31, 2010
Adjusted Basic EBITDA
(a)
$ 88.8
$ 97.3
$ 72.6
$ 97.8
Reconciliation to Adjusted EBITDA as reported
Non-Core MTBE
(1)
(2.7)
6.2
-
-
BI Insurance / Hurricane, net
(2)
-
-
(37.0)
26.1
Freight payment recovery
(3)
-
-
4.7
-
Turnaround adjustments
(4)
-
-
-
(4.3)
Hypothetical net service-based fees
(5)
-
-
-
(19.6)
Adjusted EBITDA (as reported)
$ 86.1
$ 103.5
$ 40.3
$ 100.0
Reconciliation to Net Income (Loss)
Income taxes
(13.7)
(14.6)
11.7
(15.3)
Interest expense, net
(17.0)
(18.9)
(16.8)
(14.6)
Depreciation and amortization
(29.1)
(35.9)
(41.9)
(40.5)
Loss on sale of assets
-
(1.1)
-
Asset impairment
-
-
(6.0)
(6.0)
Non-cash stock-based compensation
(5.3)
(6.5)
(6.3)
(2.3)
Unrealized gain (loss) on derivatives
0.1
0.1
(3.7)
2.7
Net Income (Loss)
$ 21.2
$ 26.6
$ (22.8)
$ 24.0
(a)
Please refer to slides 20-21 contained in this Appendix for discussion of
notes Source: Company Data |
 Reconciliation of Cash Flows
19
Adjusted
Basic
Cash
Flow
from
Operations
to
Net
Cash
Provided
by
Operating
Activities
Wells
Fargo
NGL
Summit
-
May
26,
2010
($ millions)
Fiscal year ended June 30,
LTM ended
2007
2008
2009
March 31, 2010
Adjusted
Basic
Cash
Flow
from
Operations
(a)
$ 79.0
$ 51.6
$ 82.5
$ 53.9
Reconciliation to Net Cash From Operating Activities as reported
Non-Core MTBE
(1)
17.9
6.2
-
-
Port Neches Acquisition
(3.3)
-
-
-
BI
Insurance
/
Hurricane,
net
(2)
-
-
(37.0)
26.1
Freight
payment
recovery
(3)
-
-
4.7
-
Turnaround
adjustments
(4)
-
-
-
(4.3)
Hypothetical
net
service-based
fees
(5)
-
-
-
(19.6)
Net cash provided by operating activities
$ 93.6
$ 57.8
$ 50.2
$ 56.1
(a)
Please refer to slides 20-21 contained in this Appendix for discussion of
notes Source: Company Data |
 Notes to EBITDA and Cash Flow Reconciliations
Adjusted Basic EBITDA is included in this presentation to provide investors with a
view of the TPC Group’s financial performance as adjusted to exclude
certain items that might affect the comparability of results, and to
hypothetically reflect recent financial improvements in results for prior periods. Adjusted Basic EBITDA is
not reflective of actual results, and therefore should not be unduly relied upon.
Adjusted Basic EBITDA is not a measure computed in accordance with GAAP.
Accordingly it does not represent cash flow from operations, nor is it
intended to be presented herein as a substitute to operating income or net income as indicators of our
operating performance. The reconciliation provided above is to Adjusted EBITDA (as
reported), another non- GAAP measure. Adjusted EBITDA is reconciled to
net income, the most directly comparable GAAP financial measure,
on
slide
18.
Adjusted
Basic
EBITDA
is
not
calculated
in
accordance
with
the
definition
of
“Consolidated EBITDA”
in the credit facilities.
1.In the first quarter of fiscal 2008, TPC idled its Houston dehydrogenation units
and stopped production of MTBE from those units. Subsequent to the
dehydrogenation units being idled, MTBE has been produced only from
TPC’s C4 processing activities at significantly reduced volumes, and is
used either as a feedstock to the Performance
Products
segment
or
sold
opportunistically
into
overseas
markets.
From
third
quarter
of
fiscal
2008 forward, MTBE revenues and operating results are included in the C4 Processing
segment category for reporting purposes. The Non-core MTBE adjustments
reflect the exclusion from prior years of the now idled dehydrogenation
units. 2.Based on total net business insurance claim of $47.0 million,
comprised of (a) $19.5 million deductible, (b) $10.0 million cash recovery
received in June 2009 and (c) $17.5 million cash recovery received in
December 2010. Adjustment of $37.0 million in FY2009 period reflects total net
business insurance claim of $47.0 million less $10.0 million cash recovery
received in June 2009. Negative adjustment of $26.1 million in LTM period
ending 3/31/10 reflects $10.0 million cash recovery received in June 2009 plus $17.1 cash
recovery (net of fees) received in December 2010 less $1.0 million of
hurricane-related repairs completed during the period. This adjustment
has been made to enhance the comparability of operating results by excluding
items that are nonrecurring or for which the timing and/or amount cannot reasonably be estimated.
20
Wells
Fargo
NGL
Summit
-
May
26,
2010 |
 Notes to EBITDA and Cash Flow Reconciliations
(continued) 21
Wells
Fargo
NGL
Summit
-
May
26,
2010
In 3
rd
Quarter Fiscal Year 2010, TPC’s
average monthly net service-based fees increased relative to
3.
Adjustment reflects recovery of $4.7 million from restitution of freight payments. This adjustment has
been made to enhance the comparability of operating results by excluding items that are
nonrecurring or for which the timing and/or amount cannot reasonably be estimated.
4.
Adjustment adds back $4.3 million of Adjusted EBITDA (or Adjusted Cash Flow from Operations)
estimated to have resulted from reduced contracted sales volumes and feedstock processing fees
due to a turnaround at our Houston facility in February 2010. This adjustment has been made to
illustrate what TPC’s operating performance might have been had the turnaround not been
undertaken; note, however, that turnarounds typically occur every three to four years at
TPC’s facilities, and their exclusion from this calculation is not intended to suggest
that they will not occur again in future periods. prior months in the LTM period, in order to hypothetically illustrate what TPC’s performance
would have been had these higher average fees actually been achieved throughout the period. The
adjustment by nine (for the nine months from and including April 2009 to December 2009), less (b) $12.7 million,
the actual amount of service-based fees for the April - December 2009 period (which was
already included in estimated Adjusted EBITDA). This adjustment has been made to illustrate the
effect of TPC’s recently improved service-based fees on Adjusted EBITDA in prior
periods, but it is not intended to suggest that these fees were achieved or could have been
achieved in prior periods, or will continue to be achieved in future periods. The adjustment is
for illustrative purposes only and is not reflective of actual results; accordingly, you are
cautioned not to place undue reliance upon it.
prior months.
This
adjustment
applies
the
higher
average
fees
from
3
rd
Quarter
Fiscal
Year
2010
to
5.
is
calculated
as
(a)
$32.3
million,
reflecting
the
actual
3
rd
Quarter
Fiscal
Year
2010 average multiplied |