Attached files
| file | filename |
|---|---|
| EX-31.1 - ZCO LIQUIDATING Corp | v185858_ex31-1.htm |
| EX-23.2 - ZCO LIQUIDATING Corp | v185858_ex23-2.htm |
| EX-23.1 - ZCO LIQUIDATING Corp | v185858_ex23-1.htm |
| EX-31.2 - ZCO LIQUIDATING Corp | v185858_ex31-2.htm |
| EX-32.1 - ZCO LIQUIDATING Corp | v185858_ex32-1.htm |
| EX-14.1 - ZCO LIQUIDATING Corp | v185858_ex14-1.htm |
| EX-10.33 - ZCO LIQUIDATING Corp | v185858_ex10-33.htm |
| EX-10.31 - ZCO LIQUIDATING Corp | v185858_ex10-31.htm |
| EX-10.32 - ZCO LIQUIDATING Corp | v185858_ex10-32.htm |
United
States
Securities
And Exchange Commission
Washington,
D.C. 20549
Form
10-K
(Mark
One)
|
x
|
Annual
Report
Pursuant
To
Section
13 Or
15(D) Of
The
Securities
Exchange
Act
Of 1934
For
the fiscal year ended February 28,
2010
|
OR
|
¨
|
Transition
Report
Pursuant
To
Section
13 Or
15(D) Of
The
Securities
Exchange
Act Of 1934
|
For
the transition period
from
to
.
Commission
file number 000-53633
OCZ
Technology Group, Inc.
(Exact
name of Registrant as specified in its charter)
|
Delaware
|
04-3651093
|
|
|
(State or other jurisdiction of
incorporation or organization)
|
(I.R.S. Employer
Identification No.)
|
|
|
6373 San Ignacio Avenue
San Jose, California
|
95119
|
|
|
(Address of principal executive offices)
|
(Zip Code)
|
|
Registrant’s
telephone number, including area code: (408) 733-8400
Securities
registered pursuant to Section 12(b) of the Act: None
Securities
registered pursuant to Section 12(g) of the Act:
Common
stock, $0.0025 par value
Indicate
by check mark if the registrant is a well-known seasoned issuer, as defined in
Rule 405 of the Securities Act. Yes ¨ No x
Indicate
by check mark if the registrant is not required to file reports pursuant to
Section 13 or Section 15(d) of the
Act. Yes x No ¨
Indicate
by check mark whether the registrant (1) has filed all reports required to
be filed by Section 13 or 15(d) of the Securities Exchange Act of 1934
during the preceding 12 months (or for such shorter period that the
registrant was required to file such reports), and (2) has been subject to
such filing requirements for the past
90 days. Yes x No ¨
Indicate
by check mark if disclosure of delinquent filers pursuant to Item 405 of
Regulation S-K (§229.405 of this chapter) is not contained herein, and will
not be contained, to the best of registrant’s knowledge, in definitive proxy or
information statements incorporated by reference in Part III of this
Form 10-K or any amendment to this Form 10-K. x
Indicate
by check mark whether the registrant has submitted electronically and posted on
its corporate Web site, if any, every Interactive Data File required to be
submitted and posted pursuant to Rule 405 of Regulation S-T (§229.405 of this
chapter) during the preceding 12 months (or for such shorter period that the
registrant was required to submit and post such files).
Yes ¨ No x
Indicate
by check mark whether the registrant is a large accelerated filer, an
accelerated filer, a non-accelerated filer, or a smaller reporting company. See
definitions of “large accelerated filer,” “accelerated filer” and “smaller
reporting company” in Rule 12b-2 of the Exchange Act. (Check
One):
|
Large
Accelerated Filer
|
¨
|
Accelerated
Filer
|
¨
|
|
Non-Accelerated
Filer
|
x
|
Smaller
reporting company
|
¨
|
Indicate
by check mark whether the registrant is a shell company (as defined in
Rule 12b-2 of the Exchange
Act). Yes ¨ No x
The
aggregate market value of voting stock held by non-affiliates of the Registrant
was approximately $14.3 million as of August 31, 2009, the last business day of
the Registrant’s most recently completed second fiscal quarter. This
calculation does not reflect a determination that certain persons are affiliates
of the Registrant for any other purpose.
21,278,643
shares of the Registrant’s common stock, $0.0025 par value, and 60,990 shares of
Registrant’s Series A preferred stock, $0.0025 par value, were outstanding as of
the fiscal year ended February 28, 2010.
Documents Incorporated By
Reference
None.
OCZ
Technology Group, Inc.
Form
10-K
Index
|
Page
|
||
|
Forward
Looking Statements
|
3
|
|
|
Part
I
|
||
|
Item
1.
|
Business
|
3
|
|
Item
1A.
|
Risk
Factors
|
15
|
|
Item
1B.
|
Unresolved
Staff Comments
|
29
|
|
Item
2.
|
Properties
|
29
|
|
Item
3.
|
Legal
Proceedings
|
30
|
|
Item
4.
|
(Removed
and Reserved)
|
31
|
|
Part
II
|
||
|
Item
5.
|
Market
for Registrant’s Common Equity. Related Stockholder Matters and
Issuer Purchases of Equity Securities
|
32
|
|
Item
6.
|
Selected
Financial Data
|
36
|
|
Item
7.
|
Management’s
Discussion and Analysis of Financial Condition and Results of
Operations
|
37
|
|
Item
7A.
|
Quantitative
and Qualitative Disclosures about Market Risk
|
48
|
|
Item
8.
|
Financial
Statements and Supplementary Data
|
49
|
|
Item
9.
|
Changes
in and Disagreements with Accountants on Accounting and Financial
Disclosure
|
71
|
|
Item
9A(t).
|
Controls
and Procedures
|
71
|
|
Item
9B.
|
Other
Information
|
72
|
|
Part
III
|
||
|
Item
10.
|
Directors,
Executive Officers and Corporate Governance
|
73
|
|
Item
11.
|
Executive
Compensation
|
78
|
|
Item
12.
|
Security
Ownership of Certain Beneficial Owners and Management and Related
Stockholder Matters
|
91
|
|
Item
13.
|
Certain
Relationships and Related Transactions, and Director
Independence
|
92
|
|
Item
14
|
Principal
Accounting Fees and Services
|
93
|
|
Item
15
|
Exhibits,
Financial Statement Schedules
|
94
|
|
Part
IV
|
||
|
Signatures
|
95
|
|
2
Forward
Looking Statements
This
annual report on Form 10-K, including the following sections, contains
forward-looking statements within the meaning of the Private Securities
Litigation Reform Act of 1995, particularly, our expectations regarding results
of operations, our ability to expand our market penetration, our ability to
expand our distribution channels, customer acceptance of our products, our
ability to meet the expectations of our customers, product demand and revenue,
cash flows, product gross margins, our expectations to continue to develop new
products and enhance existing products, our expectations regarding the amount of
our research and development expenses, our expectations relating to our selling,
general and administrative expenses, our efforts to achieve additional operating
efficiencies and to review and improve our business systems and cost structure,
our expectations to continue investing in technology, resources and
infrastructure, our expectations concerning the availability of products from
suppliers and contract manufacturers, anticipated product costs and sales
prices, our expectations that we have sufficient capital to meet our
requirements for at least the next twelve months, and our expectations regarding
materials and inventory management. These forward-looking statements
involve risks and uncertainties, and the cautionary statements set forth below
and those contained in the section entitled “Risk
Factors” identify important factors that could cause actual results to
differ materially from those predicted in any such forward-looking
statements. We caution investors that actual results may differ
materially from those projected in the forward-looking statements as a result of
certain risk factors identified in this Form 10-K and other filings we have made
with the Securities and Exchange Commission. More information about
potential factors that could affect our business and financial results is set
forth under “Risk
Factors” and “Management’s
Discussion and Analysis of Financial Condition and Results of
Operations.”
Part
I
|
Item
1.
|
Business
|
General
OCZ
Technology Group, Inc., a Delaware corporation (“OCZ”) was
formed in 2002. OCZ has two subsidiaries, OCZ Canada, Inc., a
Canadian corporation, and OCZ Technology Ireland Limited, an Irish corporation.
Unless the context requires otherwise, references in this document to “us” or
“we” are to OCZ on a consolidated basis.
Overview
We are a
leading provider of high performance solid state drives (“SSDs”) and
memory modules for computing devices and systems. Founded in 2002,
OCZ is incorporated in Delaware with headquarters in San Jose, California and
offices in Canada, the Netherlands, and Taiwan. Our fiscal year ends
on the last day of February.
Historically,
we primarily sold high performance memory modules to individual computing
enthusiasts through catalog and online retail channels. However, SSDs
have emerged as a strong market alternative to conventional disk drive
technology and SSDs are rooted in much of the same basic technological concepts
as our legacy memory module business. Today, as part of a
diversification strategy which began in fiscal year 2009, our product mix is
significantly more weighted toward the sale of SSDs and the SSD product line has
become central to our business. As a result, our target customers are
increasingly enterprises and original equipment manufacturers (or “OEMs”).
In
addition to our SSD and Memory Module product lines, we design, develop,
manufacture and distribute other high performance components for computing
devices and systems, including thermal management solutions and AC/DC switching
power supply units (“PSUs”). We
offer our customers flexibility and customization by providing a broad array of
solutions which are interoperable and can be configured alone or in combination
to make computers run faster, more reliably, efficiently and cost
effectively. Through our diversified and global distribution channel,
we offer more than 450 products to 376 customers, including leading retailers,
on-line retailers (“etailers”),
OEMs and computer distributors.
3
Our ten
largest customers measured by net revenue for our fiscal year ended February 28,
2010 are listed as follows in alphabetical order:
|
|
§
|
Amazon.com;
|
|
|
§
|
ASK
Corporation;
|
|
|
§
|
BAS
Group;
|
|
|
§
|
D&H
Distribution Company;
|
|
|
§
|
Maxcom
Memory GmbH;
|
|
|
§
|
Memoryworld
GmbH & Co., KG;
|
|
|
§
|
Micro
Center Corporation;
|
|
|
§
|
Micro
Peripherals LTD;
|
|
|
§
|
NewEgg.com,
operated by Magnell Associate Inc.;
and
|
|
|
§
|
SYX
Distribution, Inc.
|
These ten
customers represented approximately 51% our net revenue for the period set forth
above. Our largest customer is NewEgg.com, which represented
approximately 19% of our revenue. No other customer was responsible
for 10% or more of our net revenue.
We
develop flexible and customizable component solutions quickly and efficiently to
meet the ever changing market needs and provide superior customer
service. We believe our high performance computer components offer
the speed, density, size and reliability necessary to meet the special demands
of:
|
|
§
|
industrial
equipment and computer systems;
|
|
|
§
|
computer
and computer gaming and
enthusiasts;
|
|
|
§
|
mission
critical servers and high end
workstations;
|
|
|
§
|
personal
computer (“PC”)
upgrades to extend the useable life of existing
PCs;
|
|
|
§
|
high
performance computing and scientific
computing;
|
|
|
§
|
video
and music editing;
|
|
|
§
|
home
theatre PCs and digital home convergence products;
and
|
|
|
§
|
digital
photography and digital image manipulation
computers.
|
We
perform the majority of our research and development efforts in-house, which
increases communication and collaboration between design teams, streamlines the
development process and reduces time-to-market.
4
We
commenced operations in 2002 and shares of our common stock began trading on the
Alternative Investment Market (“AIM”) of
the London Stock Exchange in June 2006. On April 28, 2006, we amended
our certificate of incorporation to, among other matters, affect a 3-for-1
forward stock split. In May 2007, we acquired PC Power and Cooling,
Inc., a privately-held manufacturer of PSUs that was based in San Diego,
California. We now offer both PC Power and Cooling, Inc. and OCZ
branded PSUs. In October 2007, we acquired substantially all of the
assets of Silicon Data Inc., doing business as Hypersonic PC Systems, a
privately-held manufacturer of high performance gaming PCs and laptops aimed at
the computer gaming community that was based in Great Neck, New
York. In March 2009, we amended our certificate of incorporation
primarily to increase the number of authorized shares and eliminate a number of
provisions which required us to comply with various United Kingdom laws in the
case of, among other things, takeovers and tender offers. On April 1,
2009, following appropriate stockholder approval, we voluntarily delisted our
common stock from trading on AIM. From January 14, 2010 to April 22,
2010 our common stock was quoted on the Over-the-Counter Bulletin Board (“OTCBB”). Since
April 23, 2010, our common stock has been quoted on The NASDAQ Capital
Market.
Currently,
our products are purchased by 376 customers, most of which are distributors or
etailers in 69 countries. For our fiscal years ended February 28,
2010, February 28, 2009 and February 29, 2008, our net sales were $144 million,
$156 million and $118.3 million, respectively, and our net income (loss) was
$(13.5) million, $(11.7) million and $1.4 million, respectively.
In
September 2009, we sold all inventory, patents and other assets related to our
Neural Impulse Actuator product line to BCInet, Inc., a Delaware corporation, in
exchange for notes with principal amounts in the aggregate of $895,415 and
shares of BCInet, Inc.’s Series A preferred stock, representing a 27%
equity stake in BCInet, Inc. Also in September 2009, we amended our
certificate of incorporation to affect a 1 for 2.5 reverse stock
split. All share amounts in this report have been adjusted for the
effect of this reverse split.
Under the
terms of our certificate of incorporation with respect to our Series A preferred
stock, each share of Series A preferred stock was to be automatically converted
into shares of common stock on the sixtieth (60th)
trading day following the commencement of trading of our common shares on a
public stock exchange, including OTCBB (“Mandatory
Conversion”). The trading of our common shares commenced on
OTCBB on February 10, 2010, and the 60th trading
day following the commencement of trading was May 4, 2010. The number
of shares of our common stock issued upon Mandatory Conversion was determined by
dividing $5.00 by the Denominator Price, which was determined as
follows: If the sixty (60) day per share average closing price of our
common stock on such public stock exchange (the “60 Day
Average”) is between $3.00 and $5.00, then the Denominator Price will be
the 60 Day Average. Based on the 60 Day Average of $4.86, and after
taking into account fractional shares, on May 4, 2010, 60,990 shares of our
Series A preferred stock were converted into 62,733 shares of our common stock,
and warrants to purchase 140,520 shares of our Series A preferred stock were
converted into warrants to purchase 144,541 shares of our common
stock.
Industry
Overview
PCs and
other industrial and consumer electronics products and systems are increasingly
complex and require additional functionality and processing power to allow more
effective gaming, high performance computing, scientific computing, video and
music editing, virtual home theatres, digital home convergence products, digital
photography and digital image manipulation. As these products and
systems increase in complexity, functionality and processing power, demand for
high performance components and solutions increases.
Anatomy
of the Computing Environment
A PC is
most often considered to be a desktop computer, a laptop computer, or a netbook
solution. PCs are most often utilized by consumers for work and
entertainment purposes. A typical PC contains the following key
components:
5
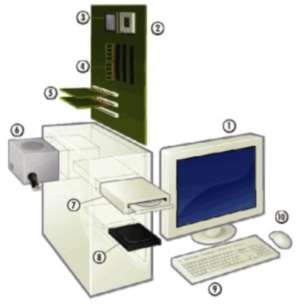
|
1.
|
Visual
Display Unit (Monitor)
|
|
2.
|
Motherboard
|
|
3.
|
Central
Processing Unit (CPU)
|
|
4.
|
Memory
|
|
5.
|
Graphics
Processing Unit (Video Card)
|
|
6.
|
Power
Supply and Chassis
|
|
7.
|
Optical
Drive (DVD-ROM, DVD Writer,
Blue-Ray)
|
|
8.
|
Storage
Drive (Traditional Hard Drive or Solid State
Drive)
|
|
9.
|
Keyboard
|
|
10.
|
Mouse
|
Corporations
or “enterprises”, in addition to deploying PCs for individual employee use,
perform a substantial amount of computing in “server rooms” housed in local
offices or “data centers” where computing resources are consolidated on a
regional or global basis. In both the server room and data center,
the computing resources are comprised of high performance servers
(which can be thought of as special purpose PCs often comprised of only a
motherboard, power supply and memory), storage arrays (banks of independently
housed storage drives with a power unit), and other network equipment
(infrastructure that facilitates communication between network
resources).
PCs are
primarily built by OEMs (such as Dell, Lenovo, and HP), valued-added resellers
(“VARs”) and
technically advanced consumers who prefer to assemble customized systems rather
than purchase pre-assembled computers. PC performance enhancements
are often necessary in order to take advantage of the latest applications and
increase the useable life of the PC. Historically, we have been
supplying high-performance memory (#4 above) for VARs and after-market
installation. Our product mix is now more heavily weighted toward
providing SSDs (#8) and power supply units (#6) for use in PCs and laptops with
an increasing emphasis for sales to OEM and enterprise customers.
Memory
Market
Memory is
a critical component of electronic products and systems and is used in a wide
variety of end markets, such as PCs and other industrial and consumer electronic
markets and is a key component in a variety of applications. As these
products and systems increase in complexity, functionality and processing power,
they require increasing amounts and densities of memory. Key drivers
of the demand for memory are both the increasing number and variety of
electronic products and systems and the increasing amount of memory they require
by such electronic products and systems. Demand for memory is also
fueled by a shift toward higher data rates, new operating systems that require
higher levels of memory, greater storage content in high-end computing, and
higher IT hardware replacement cycle and general corporate IT
spending.
6
Memory
semiconductors can be divided into two types, volatile and non-volatile
memory. Volatile memory, consisting of Dynamic Random Access Memory
(“DRAM”) and
Static Random Access Memory (“SRAM”),
maintains stored data only when connected to a power
source. Non-volatile memory, consisting principally of flash memory
(which are used to make SSDs), is able to maintain stored data even when the
power source is removed.
Solid
State Drives
SSDs use
flash memory chips, rather than the rotating platters used by hard disk drives
(“HDDs”), to
store data. Flash memory is a type of non-volatile memory, meaning
that it can continue to store information even when the power is turned
off. It also allows information to be erased and
rewritten. SSDs based on flash memory have a number of unique
advantages over conventional hard disk drive technology and represent the next
step in the evolution of storage technology:
|
|
§
|
faster
start-up because, unlike HDDs, there is no spinning
disk;
|
|
|
§
|
at
least 10x faster than HDDs, allowing quicker access to the stored data,
because no read/write head is
required;
|
|
|
§
|
high
mechanical reliability and durability due to lack of moving
parts;
|
|
|
§
|
far
more resistant to the failure due to shock, high altitude, vibration,
humidity, and extreme temperature;
|
|
|
§
|
less
failure while writing or erasing data, which translates into lower chance
of irrecoverable data damage; and
|
|
|
§
|
require
less power to operate and generate less heat than that of conventional
hard disk drives, resulting in decreased power consumption specifically in
data centers, which reduces operating costs significantly for data center
operators. The reduced power consumption also makes SSDs ideal
for use in laptop computers and appliances where battery life is a
consideration.
|

Note the
numerous mechanical parts included in the traditional hard disk drive shown
above on the left picture. Solid state drives, pictured on the right,
have no moving parts.
7
According
to International Data Corporation (“IDC”) and
Web-Feet Research, Inc., the SSD market grew from approximately $400 million in
2007 to $700 million in 2008. According to IDC, the SSD market was
projected to have grown to $1.1 billion in 2009. In addition, the SSD
market is projected to grow from $1.8 billion in 2010 to $2.8 billion in
2011, to $3.9 billion in 2012 and to $5.3 billion by 2013. A
significant portion of this growth will be driven by penetration of SSDs into
the laptop and netbook markets.
We
believe the advantages of SSD technology are particularly beneficial to at least
five distinct market segments:
|
|
§
|
enterprise
storage and video-on-demand (VoD)
applications;
|
|
|
§
|
military
and industrial applications;
|
|
|
§
|
servers
and workstations;
|
|
|
§
|
portable,
ULPC and desktop PCs; and
|
|
|
§
|
consumer
related markets.
|
According
to IDC, these market segments are all expected to grow substantially in the near
and medium term.
Enterprise
SSDs
The
enterprise segment is comprised of high performance servers (a form of
specialized computer), storage arrays (banks of independently housed hard drives
or SSDs) and network equipment. Performance is paramount to this
segment of the market. Traditional enterprise storage solutions make
use of HDDs, whose ability to input and output data is limited by the maximum
speed of about 15,000 RPM with which the disk can rotate. To work
around the speed limitations of HDDs, existing solutions employ complex
strategies to speed up access to data on disk such as “striping” or
“short-stroke”. Although such strategies increase the speed with
which data can be read from and written to the disk they also reduce the usable
capacity of each disk. Less capacity per disk creates a need for
additional disks to achieve a desired total capacity. SSDs also have
faster read and write speeds, at least 10x that of HDDs, according to
LaptopAdvisor and Gartner, an independent analysis firm. Also, while
HDDs are highly economic on a cost per amount of storage basis at the time of
purchase, the total cost of ownership of an enterprise storage solution is
heavily influenced by the power consumption and heat
generation. Without moving parts, SSDs require significant less power
to operate compared to HDDs. This means less heat generation, which
in turn means lower power requirement for cooling at the system
level. Reduced power consumption and cooling requirements for the
datacenter translate into lower datacenter operating costs.
We have
focused on gaining market-share within the enterprise segment of the SSD market,
which we believe will be the highest margin segment of the
market. Our solutions are designed to address what we believe to be
the key challenges enterprises currently face with regard to high performance
storage solutions: performance, reliability, power consumption, and cooling
requirements. At this time we believe OCZ, STEC, Toshiba and Fusion
I/O are the only vendors currently shipping enterprise-ready SSD
products.
DRAM
DRAM is
the most common type of memory semiconductor. iSuppli Corporation, an
independent market research firm, projects DRAM to have a market size of
$31.9 billion in 2010, representing more than a 40% increase from the 2009
market size.
8
Flash
and Solid State Drive Technology
Flash
memory is a type of non-volatile memory, meaning that it can continue to store
information when the power to a particular device is turned off. It
also allows information to be erased and rewritten. Flash is the
largest segment of the non-volatile memory market according to Web-Feet
Research, Inc., an independent research firm. Many consumers are
familiar with a flash technology known as “NAND Flash,” which is typically used
in USB “memory sticks,” digital cameras and mobile phones. Flash
drives are increasing in density and capacity and are becoming alternatives to
traditional hard disk drives in certain devices such as personal MP3
players. According to In-Stat, an independent market research firm,
worldwide NAND flash revenues are expected to grow at a compound annual growth
rate (“CAGR”) of
29.7% during 2007-2012 and to reach $61 billion annually by 2012.
Memory
Modules
Memory
modules are compact circuit board assemblies consisting of DRAM or other
semiconductor memory devices and related circuitry. The use of memory
modules enables systems to be easily configured with a variety of different
levels of memory, thus increasing their flexibility to address multiple price
points or applications with a single base system design. In addition,
the use of memory modules provides a relatively easy path for upgradeability of
PCs or workstation, a feature of system design that is increasingly required by
end users. To achieve this flexibility and upgradeability, systems
are designed to use memory modules as a “daughter card,” reducing the need to
include memory devices on the motherboard. This design structure
frees up space on the motherboard and enables a single motherboard to be a
common central element for a variety of different systems, resulting in
significant cost savings.
The
market for memory modules includes both standard and specialty
modules. The high volume standard memory module market includes
modules that can be sourced from many module suppliers, and are designed to be
incorporated into a wide variety of equipment. These modules employ
designs meeting widely used industry specifications and are available with a
variety of options to address the needs of multiple users. Standard
memory modules are typically used in desktop PCs and printers and are sold to
OEMs and through computer resellers and directly to end users.
Specialty
memory modules include both custom and application specific
modules. The varying requirements of different electronic systems and
the increased number of memory device options have resulted in a market for
specialized memory modules that are designed to enhance the performance of a
particular system or a set of applications. These modules are based
on DRAM technologies and may include additional control
circuitry. Specialty memory modules are typically sourced from a
limited number of suppliers. Application specific and custom memory
modules are used in PCs, mobile computers and workstations for computer gaming,
video editing, and generally any area where higher performance and/or
reliability is a customer requirement.
Opportunity
for Manufacturers of Memory Modules
As the
variety of memory devices available to address specific high-performance
applications has expanded, the design and manufacture of memory modules have
increasingly become areas of opportunity for independent memory module
manufactures such as OCZ.
There are
two main types of suppliers of memory modules: memory semiconductor
manufacturers and independent “third party” memory module
manufacturers. The world’s largest memory semiconductor manufacturers
focus on industry standard memory modules for high volume applications such as
desktop PCs. Some independent memory module manufacturers also focus
on high volume industry standard applications; however, most independent memory
module manufacturers, including OCZ, focus on providing broad product portfolios
that cover a variety of type, density, data rate, voltage, packaging and other
increasingly complex features.
Power
Supply Units
Power
supply units are the main source of conversion between main alternating current
and the direct current used by computers and other electronic
devices. As modern electronics, computers, servers and workstations
become more complicated, the increased power handling and efficiency of AC/DC
conversion become paramount. Key drivers in the power supply unit
industry are the release of new PCs and industry standards, as well as growing
regulatory requirements in the European Union, North America and Japan for
increased power consumption. According to Databeans, an independent
marketing research firm, the global market for power management products for
2009 is estimated at $15.4 billion, and is expected to grow at 10% for
2010.
9
Thermal
Management
A
computer system’s components produce large amounts of heat during operation,
including integrated circuits such as central processing units (“CPUs”),
chipset and graphics cards, along with hard drives. This heat must be
dissipated in order to keep these components within their safe operating
temperatures. This is done mainly using heat sinks to increase the
surface area which dissipates heat, and, separately, fans to speed up the
exchange of air heated by the computer parts for cooler
ambient air. According to BCC Research, an independent market
research firm, the global market for thermal management technologies increased
from approximately $6.8 billion in 2008 to approximately $11.1 billion by 2013,
a compound annual growth rate of approximately 10.3%. Thermal
management hardware accounts for more than 80% of the total thermal management
market. The largest end-markets for thermal management technologies
in 2007 were the computer industry (57% of total revenues) and
telecommunications (16% of total revenue). By 2013, medical and
office electronics are expected to increase to 12% of total revenue, tying the
expected telecommunications market.
The
OCZ Approach
We
design, develop, manufacture and distribute high performance components for
computing devices and systems, including SSDs, other flash memory storage,
memory modules, thermal management solutions and PSUs. We believe our
primary competitive advantages arise from how we use our internal research and
development team to develop the intellectual property used in our component
solutions. These have enabled us to incorporate advanced
functionality and capabilities and to quickly and efficiently develop new
component solutions that are optimized for our customers’
requirements.
Flexible
and Customizable Component Solutions
We
provide flexible and customizable component solutions to address the specific
application needs of our end users. Our design principles allow us to
develop proprietary components to deliver a broad range of products with
superior features. As of our fiscal year ended February 28, 2010 we
offered over 450 SKUs including SKUs for memory, SSDs, laptop computers and
power supplies.
Rapid
Time to Market
We strive
to reduce the design and development time required to incorporate the latest
technologies and to deliver the next generation of products and
solutions. Our in-house design competencies and control of the design
of many of the pieces used within our component solutions enable us to rapidly
develop, build and test components.
Extensive
Distribution Channels
We have
built a diverse and extensive distribution network reaching a wide range of
customers in 69 countries. This network includes traditional
retailers and etailers, as well as OEMs, systems integrators and
distributors.
Strategic
Relationship
We have
engineering and marketing relationships (for example, being a nominated
“solutions partner” or “certified supplier”) with certain motherboard
manufacturers and integrated circuit manufacturers and chipset/platform
providers such as ATI Technologies, Inc., Advanced Micro Devices, Inc., NVIDIA
Corporation, DFI USA, MSI Computer Corporation and First International Computer,
Inc. We believe that these relationships enable us to respond to
changing consumer needs, to develop product ranges which are compatible with
multiple platforms and to develop other products designed to obtain optimum
performance from a specific platform.
10
Customer
Service
We seek
to build brand loyalty by offering product warranties, comprehensive return and
replacement policies and accessible technical support. Members of our
customer service staff have technical expertise which we believe supports us in
maintaining our reputation for technical expertise and attentive customer
care.
Strategy
Our goal
is to be a worldwide leader in the design, manufacture and distribution of SSDs
and other high performance computer components and solutions. The following are
key elements of our strategy:
|
|
§
|
increase
our penetration of the international consumer electronics and OEM markets
by expanding our sales and marketing
efforts;
|
|
|
§
|
expand
and broaden our product line by leveraging our technology and design
expertise;
|
|
|
§
|
build
strong supplier relationships with our primary component
vendors;
|
|
|
§
|
identify
new applications and customers for our
technology;
|
|
|
§
|
increase
our manufacturing efficiencies; and
|
|
|
§
|
pursue
acquisitions of complementary businesses and
technologies.
|
Our
Products and Services
We
provide our customers with a variety of advanced technological products,
including:
Solid
State Storage and Other Flash Memory Based Products
We design
and manufactures flash memory products in a broad variety of forms and
capacities. Our wide range of flash storage products come in a
variety of formats and interfaces. Our SSD products are predominantly
used in computers, servers and industrial equipment that require increased
speed, lower power consumption and or increased reliability. Our
Solid State storage products are available with a variety of interfaces
including PCIe, SATA, PATA, USB, IE 1394, SAS and mini PCIe and in various form
factors, including 3.5 inch, 2.5 inch as well as card based and external (pen
drive based formats). We also manufacture Secure Digital (“SD”) cards
meant for use primarily in consumer applications, such as digital
photography.
The
following table summarizes certain of our SSDs and other flash product
offerings:
|
Product
|
Density
|
Features
|
Applications
|
|||
|
MLC-
Based Solid State Disk Drives
|
Up
to 2TB
|
Low
power consumption Read/write speeds up to 1.3GB/s
|
Mobile
computing, PCs, RAID controllers
|
|||
|
SLC-Based
Solid State Disk Drives
|
Up
to 512GB
|
Low
power consumption Read/write speeds up to 1.3GB/s, Lower
latency
|
Enterprise,
Servers, workstations, storage area networks, high performance
computing
|
|||
|
USB
Key Drives
|
128MB
-64GB
|
18MB
per second read/write
|
Mobile
computing, PCs
|
|||
|
Normal
and High Capacity SD and Micro SD Cards
|
128MB-16GB
|
Speeds
up to 25Mbs
|
Notebooks,
networking, communications,
photography
|
|||
11
DRAM
Modules
We offer
a comprehensive lineup of DRAM memory modules utilizing a wide range of DRAM
technologies from legacy DDR SDRAM (double data rate synchronous dynamic random
access memory) to leading-edge high performance DDR3 SDRAM devices, the
evolutionary improvements over DDR SDRAM. These modules encompass a
broad range of form factors and functions including dual in-line memory modules
(“DIMMs”),
small outline dual in-line memory modules (“SODIMMs”),
and very low profile (“VLP”)
DIMMs and mini-DIMMs for space-constrained blade server, or 1.75 inch thin
computing server, and networking applications. These memory modules
come in configurations of up to 244 pins, which is the number of pins that plug
into a motherboard, and densities of up to 8GB. We also accommodate
custom module designs based on specific OEM requirements. Our modules
are tested at-speed on high-end proprietary functional testers utilizing
comprehensive test suites, enabling these modules to meet the
stringent requirements of our focus markets.
The
following table summarizes certain of our DRAM memory product
offerings:
|
DDR3
|
Density
|
Speed (MHz)
|
Applications
|
|||
|
High
Speed / Low Latency DIMMs
|
512MB-8GB
|
533-2133Mhz
|
Overclocking,
gaming, home theater, 3d modeling and audio/video editing computers and
workstations
|
|||
|
High
Speed / Low Latency SODIMMs
|
256MB-4GB
|
533-1600Mhz
|
High
performance notebooks, sub-notebooks
|
|||
|
Industry
Standard Unbuffered DIMM
|
256MB-4GB
|
400-1600Mhz
|
PCs
|
|||
|
Registered
DIMMs
|
512MB-8GB
|
400/533/667
|
Servers,
workstations, storage area networks, high performance
computing
|
|||
|
Industry
Standard SODIMMs
|
256MB-4GB
|
533/667
|
Notebooks,
sub-notebooks
|
|||
Power
Supply
We
manufacture power supplies that are designed to power computers and industrial
devices while maintaining interoperability, adhering to industry standards and
increasing output efficiency through design. Our power supplies are
designed to operate at higher temperatures and under more demanding internal
conditions with stricter load regulation than is required under normal
circumstances.
The
following table contains some of our power supply product
offerings:
|
Product
|
Density
|
Features
|
Applications
|
|||
|
High
Wattage Power Supplies
|
Up
to 1200 watts
|
50
C operation, 80%+ efficiency and 1% load regulation, multiple
formats
|
OEM
applications servers, workstations, storage area networks, high
performance computing
|
|||
|
Low
Noise Power Supplies
|
Up
to 750 watts
|
Low
audible noise
|
Overclocking,
PCs and video/audio workstations
|
|||
|
Modular
PSUs
|
Up
to 1000 watts
|
Removable
reconfigurable cables
|
End-user
upgrades, gaming computers and home theater PCs
|
|||
|
High
Efficiency PSUs
|
Up
to 1000 watts
|
Green
friendly with 85% plus efficiency
|
End-user
upgrades, gaming computers and home theater
PCs
|
|||
Thermal
Management
We
design, manufacture and sell various computer related thermal management
products that sell through substantially the same sales channel as other OCZ
products. These products take advantage of OCZ developed technology
and concepts in order to deliver products that our customer base requests or
that we believe they will have interest in.
12
Suppliers
We do not
have any long term supplier contracts or obligations to purchase raw
materials.
Manufacturing
We
believe that one of the keys to our product development and manufacturing is our
speed testing and sorting of components, which enables us to grade components
and select the highest speed memory, and allows us to sell such memory at
premium prices. Our products are built to our requirements and
specifications in our own facilities as well as at several
contract-manufacturing facilities in the United States and Taiwan. In
order to maintain quality control, products are tested when they reach the point
of final assembly at our premises. Certain items are purchased
from several manufacturers with final assembly, testing and packaging completed
in our in-house manufacturing facilities.
In
September 2007, we established our own testing and manufacturing facilities in
Taiwan, followed by the addition, in August 2008, of our own surface mount
assembly equipment. The establishment of our manufacturing facilities
has helped improve and expand our ability to manufacture certain key components
and products, such as memory modules, in-house.
Research
and Development
We
believe that the timely development of new products is essential to maintaining
our competitive position. Our research and development activities are
focused primarily on new high-speed SSDs memory modules, flash technology, power
supplies and ongoing improvement in manufacturing processes and technologies and
continual improvement in test routines and software. We plan to
continue to devote research and development efforts to the design of new
products which address the requirements of our end users.
Our
engineering staff continually explores practical applications of new
technologies, works closely with our customers and provides services throughout
the product life cycle, including architecture definition, component selection,
schematic design, layout, manufacturing and test engineering. We
design our products to be compatible with existing industry standards and, where
appropriate, develop and promote new standards. An important aspect
of our research and development effort is to understand the challenges presented
by our customers’ requirements and satisfy them by utilizing our industry
knowledge, proprietary technologies and technical expertise.
Our
research and development expenses totaled $5.3 million, $2.6 million and $1.6
million in the fiscal years ended February 28, 2010, February 28, 2009 and
February 29, 2008, respectively.
Intellectual
Property
We
attempt to protect our intellectual property rights through a variety of
measures, including non-disclosure agreements, trade secrets and to a lesser
extent, patents and trademarks. We have three issued patents in the
United States that will expire between 2024 and 2025, and fifteen patent
applications pending in the United States. We expect to file new
patent applications where appropriate to protect our proprietary technologies;
however, we believe that our continued success depends primarily on factors such
as the know-how, technological skills and innovation of our personnel rather
than on patent protection.
Competition
The
market for our products is highly competitive, rapidly evolving and subject to
new technological developments, changing customer needs and new product
introductions. We compete primarily with large vendors of computer
components, and to a lesser extent, large vendors of PCs. In
addition, we also compete with a number of smaller vendors who specialize in the
sale of high performance products and computer systems and
components.
13
We
believe our principal competitors include:
|
|
§
|
specialized
solid state storage makers such as STEC, Inc., Fusion I/O and Mtron
Storage Technology Co., Ltd.;
|
|
|
§
|
global
technology vendors such as Intel Corporation and Samsung Electronics Co.,
Ltd.;
|
|
|
§
|
specialized
memory module and flash product vendors such as Kingston Technology
Corporation, SanDisk Corporation, Crucial Technology, the consumer brand
of Micron Technology, Inc., and Corsair Memory, Inc.;
and
|
|
|
§
|
specialized
power supply chassis and cooling manufacturers such as Antec, Inc.,
Thermaltake Technology Inc. USA and Enermax Technology
Corporation.
|
We
believe that the principal competitive factors in our market include the
following:
|
|
§
|
first
to market with new emerging
technologies;
|
|
|
§
|
flexible
and customizable products to fit customers’
objectives;
|
|
|
§
|
high
product performance reliability;
|
|
|
§
|
early
identification of emerging
opportunities;
|
|
|
§
|
cost-effectiveness;
|
|
|
§
|
interoperability
of products;
|
|
|
§
|
scalability;
and
|
|
|
§
|
localized
and responsive customer support on a worldwide
basis.
|
We
believe that we compete favorably with respect to most of these
factors. However, most of our competitors have longer operating
histories, significantly greater resources and greater name
recognition. They may be able to devote greater resources to the
development, promotion and sale of their products than we can, which could allow
them to respond more quickly to new technologies and changes in customer
needs.
Backlog
Sales of
our products are generally made pursuant to purchase orders. We
include in backlog only those customer orders for which we have accepted
purchase orders and to which we expect to ship within
45 days. Since orders constituting our current backlog are
subject to changes in delivery schedules or cancellation with only limited or no
penalties, we believe that the amount of our backlog is not necessarily an
accurate indication of our future net sales.
Employees
As of our
fiscal year ended February 28, 2010, we employed 312 full-time employees, of
which 202 were in general and administration (including operations, finance,
administration, information technology, quality assurance, procurement and
materials work), 76 were in research and development, and 34 were in sales and
marketing. Our employees are not represented by any collective
bargaining agreements and we have never experienced a work
stoppage. Our employees are located in San Jose and Carlsbad,
California; Ontario, Canada; the Netherlands and Taiwan.
Environmental
Matters
Our
business involves purchasing finished goods as components from different vendors
and then assembly of these components into finished products at our
facilities. Accordingly, we are not involved in the actual
manufacturing of components, which can often involve significant environmental
regulations with respect to the materials used, as well as work place safety
requirements. Our operations and properties, however, do remain
subject in particular to domestic and foreign laws and regulations governing the
storage, disposal and recycling of computer products. For example,
our products may be subject to the European Union’s Directive 2002/96/EC Waste
Electrical and Electronic Equipment and Directive 2002/95/EC on Restriction on
the Certain Hazardous Substances in Electrical and Electronic
Equipment. To date, we have not been the subject of any material
investigation or enforcement action by either U.S. or foreign environmental
regulatory authorities. Further, because we do not engage in primary
manufacturing processes like those performed by our suppliers who are industrial
manufacturers, we believe that costs related to our compliance with
environmental laws should not materially adversely affect us.
14
|
Item
1A.
|
Risk
Factors
|
In
addition to the other information described elsewhere in this Annual Report, you
should carefully consider the following risk factors, which could materially
adversely affect our business, financial condition and results of
operations. The risks described below are not the only risks facing
OCZ. Additional risks and uncertainties not currently known to us or
that we currently deem to be immaterial may materially adversely affect our
business, financial condition and results of operations.
Risks
Related to Our Business
We
are subject to the cyclical nature of the markets in which we compete and a
continued downturn could adversely affect our business.
The
markets in which we compete, including SSDs, flash, memory, thermal management
and power supply markets, are highly cyclical and characterized by constant and
rapid technological change, rapid product obsolescence and price erosion,
evolving standards, short product life cycles and wide fluctuations in product
supply and demand. These markets have experienced significant
downturns often connected with, or in anticipation of, maturing product cycles
of both manufacturers’ and their customers’ products and declines in
general economic conditions. These downturns have been characterized
by diminished product demand, production overcapacity, high inventory levels and
accelerated erosion of average selling prices.
Our
historical operating results have been subject to substantial fluctuations and
we may experience substantial period-to-period fluctuations in future operating
results. A downturn in these markets could have a material adverse
effect on the demand for our products and therefore a material adverse effect on
our business, financial condition and results of
operations. Moreover, changes in end-user demand for the products
sold by any individual customer can have a rapid and disproportionate effect on
demand for our products from that customer in any given period,
particularly if the customer has accumulated excess inventories of products
purchased from us. There can be no assurance that our net sales and
results of operations will not be materially and adversely affected in the
future due to changes in demand from individual customers or cyclical changes in
the industries utilizing our products.
We
have experienced quarterly and annual losses in the past and may experience
losses in the future.
We have
experienced losses on a quarterly and annual basis in the past. We
have expended, and will continue to expend, substantial funds to pursue
engineering, research and development projects, enhance sales and marketing
efforts and otherwise operate our business. There can be no assurance
that we will be profitable on a quarterly or annual basis in the
future.
Declines
in our average selling prices of DRAM may result in declines in our net sales
and gross profit.
Our
average selling prices may decline due to several factors. Over the
last few years, overcapacity in the DRAM memory component market resulted in
significant declines in component prices, which negatively impacted our average
selling prices and net sales. During periods of overcapacity, our net
sales may decline if we do not increase unit sales of existing products or fail
to introduce and sell new products in quantities sufficient to offset declines
in selling prices. Our efforts to increase unit sales, reduce costs
and develop new products to offset the impact of further declines in average
selling prices may not be successful. Declines in DRAM prices, which
represent a significant component of our memory sales could also (as they have
in the past) affect our gross profit and the valuation of our inventory, which
could harm our financial results.
Declines
in average selling prices would enable OEMs to pre-install higher capacity based
memory into new systems at existing price points and thereby reduce the demand
for future memory upgrades. Further, our net sales and gross profit
may be negatively affected by shifts in our product mix during periods of
declining average selling prices.
15
In
addition, the continued transition to smaller design geometries and the use of
300 millimeter wafers by existing memory manufacturers could lead to a
significant increase in the worldwide supply of DRAM. Increases in
the worldwide supply of memory components could also result from manufacturing
capacity expansions. If not offset by increases in demand, these
increases would likely lead to further declines in the average selling
prices of our products and have a material adverse effect on our business,
financial condition and results of operations. Furthermore, even if
supply remains constant, if demand were to decrease, it would harm our average
selling prices.
Sales
to a limited number of customers represent a significant portion of our net
sales, and the loss of any key customer would materially harm our
business.
Our
dependence on a limited number of customers means that the loss of a major
customer or any reduction in orders by a major customer would materially reduce
our net sales and adversely affect our results of operations. We
expect that sales to relatively few customers will continue to account for a
significant percentage of our net sales for the foreseeable
future. However, there can be no assurance that any of these
customers or any of our other customers will continue to utilize our products at
current levels, if at all. We have no firm, long-term volume
commitments from any of our major customers and we generally enter into
individual purchase orders with our customers, in certain cases under master
agreements that govern the terms and conditions of the
relationship. We have experienced cancellations of orders and
fluctuations in order levels from period to period and expect that we will
continue to experience such cancellations and fluctuations in the
future. Customer purchase orders may be cancelled and order volume
levels can be changed, cancelled or delayed with limited or no
penalties. The replacement of cancelled, delayed or reduced purchase
orders with new orders cannot be assured.
For our
fiscal years ended February 28, 2010, February 28, 2009 and February 29, 2008,
our ten largest customers accounted for 51%, 49% and 47% of net sales,
respectively. For our fiscal years ended February 28, 2010, February
28, 2009 and February 29, 2008, NewEgg accounted for 19%, 19% and 12% of our net
sales, respectively. During these periods, no other customers
accounted for more than 10% of our net sales.
If
a standardized memory solution which addresses the demands of our customers is
developed, our net sales and market share may decline.
Many of
our memory subsystems are specifically designed for our OEM customers’ high
performance systems. In a drive to reduce costs and assure supply of
their memory module demand, our OEM customers may endeavor to design JEDEC
standard DRAM modules into their new products. This trend could
reduce the demand for our higher priced customized memory solutions which in
turn would have a negative impact on our financial results. In addition,
customers deploying custom memory solutions today may in the future choose to
adopt a JEDEC standard, and the adoption of a JEDEC standard module instead of a
previously custom module might allow new competitors to participate in a share
of our customers’ memory module business.
If our
OEM customers were to adopt JEDEC standard modules, our future business may be
limited to identifying the next generation of high performance memory demands of
OEM customers and developing solutions that addresses such
demands. Until fully implemented, this next generation of products
may constitute a much smaller market, which may reduce our net sales and market
share.
Our
customers are primarily in the computing markets and fluctuations in demand in
these markets may adversely affect sales of our products.
Sales of
our products are dependent upon demand in the computing markets. We
may experience substantial period-to-period fluctuations in future operating
results due to factors affecting the computing markets. From time to
time, these markets have experienced downturns, often in connection with, or in
anticipation of, declines in general economic conditions. A decline
or significant shortfall in demand in any one of these markets could have a
material adverse effect on the demand for our products and therefore a material
adverse effect on our business, financial condition and results of
operations.
16
Customer
demand is difficult to accurately forecast and, as a result, we may be unable to
optimally match production to customer demand.
We make
significant decisions, including determining the levels of business that we will
seek and accept, production schedules, component procurement commitments,
personnel needs and other resource requirements, based on our estimates of
customer’s future requirements. The short-term nature of commitments
by many of our customers and the possibility of unexpected changes in demand for
their products reduces our ability to accurately estimate future customer
requirements. On occasion, customers may require rapid increases in
production, which can challenge our resources and can reduce
margins. We may not have sufficient capacity at any given time to
meet our customers’ demands. Conversely, downturns in the markets in
which our customers compete can, and have, caused our customers to significantly
reduce the amount of products ordered from us or to cancel existing orders
leading to lower-utilization of our facilities. Because many of our
costs and operating expenses are relatively fixed, reduction in customer demand
would have an adverse effect on our gross margins, operating income and cash
flow.
During an
industry downturn, there is also a higher risk that our trade receivables would
be uncollectible, which would be materially adverse to our cash flow and
business.
Order
cancellations or reductions, product returns and product obsolescence could
result in substantial inventory write-downs.
To the
extent we manufacture products in anticipation of future demand that does not
materialize, or in the event a customer cancels or reduces outstanding orders,
we could experience an unanticipated increase in our
inventory. Slowing demand for our products may lead to product
returns which would also increase our inventory. In the past, we have had to
write-down inventory due to obsolescence, excess quantities and declines in
market value below our costs.
We
may be less competitive if we fail to develop new or enhanced products and
introduce them in a timely manner.
The
markets in which we compete are subject to rapid technological change, product
obsolescence, frequent new product introductions and enhancements, changes in
end-user requirements and evolving industry standards. Our ability to
successfully compete in these markets and to continue to grow our business
depends in significant part upon our ability to develop, introduce and sell new
and enhanced products on a timely and cost-effective basis, and to anticipate
and respond to changing customer requirements.
The
markets for our products are characterized by frequent transitions in which
products rapidly incorporate new features and performance
standards. A failure to develop products with required feature sets
or performance standards or a delay as short as a few months in bringing a new
product to market could significantly reduce our net sales for a substantial
period, which would have a material adverse effect on our business, financial
condition and results of operations.
We have
experienced, and may in the future experience, delays in the development and
introduction of new products. These delays could provide a competitor
a first-to-market opportunity and allow a competitor to achieve greater market
share. Defects or errors found in our products after commencement of
commercial shipment could result in delays in market acceptance of these
products. Lack of market acceptance for our new products will
jeopardize our ability to recoup research and development expenditures, hurt our
reputation and harm our business, financial condition and results of
operations. Accordingly, there can be no assurance that our future
product development efforts will result in future profitability or market
acceptance.
17
Our
dependence on a small number of suppliers for components, including integrated
circuit devices, and inability to obtain a sufficient supply of these components
on a timely basis could harm our ability to fulfill orders and therefore
materially harm our business.
Typically,
integrated circuit (“IC”)
devices represent a significant majority of our component costs for our memory
and SSD products. We are dependent on a small number of suppliers
that supply key components used in the manufacture of our
products. Since we have no long-term supply contracts, there is no
assurance that our suppliers will agree to supply the quantities of components
we may need to meet our production goals. Samsung, Toshiba and Intel
currently supply substantially all of the IC devices used in our Flash
memory products. Micron, Elpida and PSC (Powerchip) currently supply
substantially all of the DRAM IC devices used in our DRAM products.
Additionally,
because of constraints on working capital, we have delayed payments to a number
of vendors which could have an adverse effect on our ability to source
product. Moreover, from time to time, our industry experiences shortages
in IC devices and foundry services which have resulted
in foundries putting their customers, ourselves included, on component
allocation. While to date neither delayed payment nor component
shortages has disrupted our business in a material way, in the future,
we may not be able to obtain the materials that we need to fill orders in a
timely manner or at competitive prices. As a result, our reputation could
be harmed, we may lose business from our customers, our revenues may decline,
and we may lose market share to our competitors.
The
markets in which we compete are constantly evolving and competitive, and we may
not have rights to manufacture and sell certain types of products utilizing
emerging formats, or we may be required to pay a royalty to sell products
utilizing these formats.
The
markets in which we compete are constantly undergoing rapid technological change
and evolving industry standards. For example, many consumer devices,
such as digital cameras, PDAs and smartphones, are transitioning to emerging
flash memory formats, such as the Memory Stick and xD Picture Card formats,
which we do not currently manufacture and do not have rights to manufacture, and
which could result in a decline in demand, on a relative basis, for other
products that we manufacture such as CompactFlash and secured digital USB
drives. If we decide to manufacture products utilizing emerging
formats such as those mentioned, we will be required to secure licenses to give
us the right to manufacture such products which may not be available at
reasonable rates or at all. If we are not able to supply formats at
competitive prices or if we were to have product shortages, our net sales could
be adversely impacted and our customers would likely cancel orders or seek other
suppliers to replace us.
Our
growth strategy includes expanding our presence in the SSD and high performance
memory markets both of which are highly competitive.
SSD and
high performance memory markets are highly competitive. Certain of
our competitors are more diversified than us and may be able to sustain lower
operating margins in their SSD and high performance memory businesses based on
the profitability of their other businesses. We expect competition in
these markets to increase as existing manufacturers introduce new products and
process technologies, new manufacturers enter the market, industry-wide
production capacity increases and competitors aggressively price products to
increase market share. We only have limited experience competing in
these markets. Our growth strategy includes expanding our presence in these
markets, and there can be no assurance that we will be successful in doing
so.
The
market for enterprise Flash-based SSD products is relatively new and evolving,
which makes it difficult to forecast end user adoption rates and customer
demand, for our products.
The
enterprise Flash-based SSD market is new and rapidly evolving. As a
result, we may encounter risks and uncertainties related to our business and
future prospects. It is difficult to predict, with any precision, end
user adoption rates, customer demand for our products or the future growth rate
and size of this market. The rapidly evolving nature of the markets
in which we sell our products, as well as other factors that are beyond our
control, reduce our ability to accurately evaluate our future outlook and
forecast quarterly or annual performance. Furthermore, our ability to
predict future sales is limited and our SSD product may never reach mass
adoption.
18
Industry
consolidation could adversely affect our business by reducing the number of our
potential significant customers and increasing our reliance on our existing key
customers.
Many
significant participants in our customers’ industries are merging and
consolidating as a result of competitive pressures and we expect this trend to
continue. Consolidation will likely decrease the number of potential
significant customers for our products and services. Fewer
significant customers will increase our reliance on key customers and, due to
the increased size of these companies, may negatively impact our bargaining
position and profit margins. Consolidation in some of our customers’
industries may result in increased customer concentration and the potential loss
of customers. The loss of, or a reduced role with, key customers due
to industry consolidation could negatively impact our business.
We
may make acquisitions which involve numerous risks. If we are not
successful in integrating the acquisition, our operations may be adversely
affected.
As part
of our business and growth strategy, we expect to acquire or make significant
investments in businesses, products or technologies that allow us to complement
our existing product offering, expand our market coverage, increase our
engineering workforce or enhance our technological capabilities. For
example, in 2007, we acquired PC Power and Cooling, Inc., a producer of PC
thermal management products, and substantially all the assets of Silicon Data
Inc., doing business as Hypersonic PC Systems, a manufacturer of boutique high
performance gaming PCs and laptops. We stopped the manufacture and
sale of certain Hypersonic PC products in our fiscal year ended February 28,
2010. Any future acquisitions or investments would expose us to the
risks commonly encountered in acquisitions of businesses. Such risks
include, among others:
|
|
§
|
lower
than anticipated sales and
profitability;
|
|
|
§
|
problems
integrating the purchased operations, technologies or
products;
|
|
|
§
|
costs
associated with the acquisition;
|
|
|
§
|
negative
effects on profitability resulting from the
acquisition;
|
|
|
§
|
adverse
effects on existing business relationships with suppliers and
customers;
|
|
|
§
|
risks
associated with entering markets in which we have no or limited prior
experience;
|
|
|
§
|
loss
of key employees of the acquired business;
and
|
|
|
§
|
litigation
arising from the acquired company’s operations before the
acquisition.
|
Our
inability to overcome problems encountered in connection with any acquisition
could divert the attention of management, utilize scarce corporate resources and
otherwise harm our business. In addition, we are unable to predict whether
or when any prospective acquisition candidate will become available or the
likelihood that any acquisition will be completed. Even if we do find
suitable acquisition opportunities, we may not be able to consummate the
acquisitions on commercially acceptable terms or realize the anticipated
benefits of any acquisitions we do undertake.
We
may make acquisitions that are dilutive to existing stockholders, result in
unanticipated accounting charges or otherwise adversely affect our results of
operations.
We may
grow our business through business combinations or other acquisitions of
businesses, products or technologies that allow us to complement our existing
product offerings, expand our market coverage, increase our engineering
workforce or enhance our technological capabilities. If we make any
future acquisitions, we could issue stock that would dilute our stockholders’
percentage ownership, incur substantial debt, reduce our cash reserves or assume
contingent liabilities. Furthermore, acquisitions may require
material charges and could result in adverse tax consequences, substantial
depreciation, deferred compensation charges, in-process research and development
charges, the amortization of amounts related to deferred compensation and
identifiable purchased intangible assets or impairment of goodwill, any of which
could negatively impact our results of operations.
We
may not be able to maintain or improve our competitive position because of the
intense competition in the markets we serve.
We
conduct business in markets characterized by intense competition, rapid
technological change, constant price pressures and evolving industry
standards. Our competitors include many large domestic and
international companies that have substantially greater financial, technical,
marketing, distribution and other resources, broader product lines, lower cost
structures, greater brand recognition and longer-standing relationships with
customers and suppliers than we do. As a result, our competitors may
be able to respond better to new or emerging technologies or standards and to
changes in customer requirements. Further, some of our competitors
are in a better financial and marketing position from which to influence
industry acceptance of a particular industry standard or competing technology
than we are. Our competitors may also be able to devote greater
resources to the development, promotion and sale of products, and may be able to
deliver competitive products at a lower price.
19
We
compete against global technology vendors such as Intel Corporation and Samsung
Electronics Co., Ltd. Our primary competitors in the specialized
memory module and flash products industry include Kingston Technology, SanDisk,
Crucial Memory and Corsair. Our primary competitors in the solid
state storage maker industry include STEC, Fusion I/O and Mtron. Our
primary competitors in the specialized power supply chassis and cooling
manufacturing industry include Antec, Inc., Thermaltake Technology Inc. USA and
Enermax Technology Corporation.
We expect
to face competition from existing competitors and new and emerging companies
that may enter our existing or future markets with similar or alternative
products, which may be less costly or provide additional features. In
the PC market in Asia, we expect to face increasing competition from local
competitors such as A-DATA Technology Co., Ltd. and GSkill International
Enterprise. We also face competition from current and prospective
customers that evaluate our capabilities against the merits of manufacturing
products internally. In addition, some of our significant suppliers,
including Samsung Electronics Co., Ltd., Infineon Technologies AG and Micron
Technology, Inc., are also our competitors, many of whom have the ability to
manufacture competitive products at lower costs as a result of their higher
levels of integration. Competition may also arise due to the
development of cooperative relationships among our current and potential
competitors or third parties to increase the ability of their products to
address the needs of our prospective customers. Accordingly, it is
possible that new competitors or alliances among competitors may emerge and
rapidly acquire significant market share.
We expect
that our competitors will continue to improve the performance of their current
products, reduce their prices and introduce new products that may offer greater
performance and improved pricing, any of which could cause a decline in sales or
loss of market acceptance of our products. In addition, our
competitors may develop enhancements to, or future generations of, competitive
products that may render our technology or products obsolete or
uncompetitive.
The
future growth of our OEM-focused products is dependent on achieving design wins
into commercially successful OEM systems and the failure to achieve design wins
or of OEM customers to incorporate our products in their systems could adversely
affect our operating results and prospects.
We rely
on OEMs to select our OEM-focused products to be designed into their systems,
which we refer to as a design win. We often incur significant
expenditures in the development of a new product without any assurance that an
OEM will select our product for design into its system. Additionally,
in some instances, we may be dependent on third parties to obtain or provide
information that we need to achieve a design win. Some of these third
parties may not supply this information to us on a timely basis, if at
all. Furthermore, even if an OEM designs one of our products into its
system, we cannot be assured that its product will be commercially successful or
that we will receive any net sales as a result of that design
win. Our OEM customers are typically not obligated to purchase our
products and can choose at any time to stop using our products if their own
systems are not commercially successful, if they decide to pursue other systems
strategies, or for any other reason. If we are unable to achieve
design wins or if our OEM customers’ systems incorporating our products are not
commercially successful, our net sales would suffer.
Our
future success is dependent on our ability to retain key personnel, including
our executive officers, and attract qualified personnel. If we lose
the services of these individuals or are unable to attract new talent, our
business will be adversely affected.
Our
future operating results depend in significant part upon the continued
contributions of our key technical and senior management personnel, many of whom
would be difficult to replace. We are particularly dependent on the
continued service of Ryan M. Petersen, our chief executive officer, Kerry T.
Smith, our chief financial officer, and Alex Mei, our chief marketing
officer. Our future operating results also depend in significant part
upon our ability to attract, train and retain qualified management,
manufacturing and quality assurance, engineering, marketing, sales and support
personnel. We are continually recruiting such
personnel. However, competition for such personnel is intense, and
there can be no assurance that we will be successful in attracting,
training or retaining such personnel now or in the future. There may
be only a limited number of persons with the requisite skills to serve in these
positions and it may be increasingly difficult for us to hire such persons over
time. The loss of any key employee, the failure of any key employee
to perform in his or her current position, our inability to attract, train and
retain skilled employees as needed or the inability of our officers and key
employees to expand, train and manage our employee base could materially and
adversely affect our business, financial condition and results of
operations.
20
We
have and will continue to incur increased costs as a result of becoming a public
reporting company.
We have
incurred, and will continue to face, increased legal, accounting, administrative
and other costs as a result of becoming a reporting company that we did not
incur as a private company. The Sarbanes-Oxley Act of 2002, as well
as rules subsequently implemented by the Securities and Exchange Commission (the
“SEC”), and
the Public Company Accounting Oversight Board, have required changes in the
corporate governance practices of public companies. We expect these
rules and regulations to increase our legal and financial compliance costs and
to make legal, accounting and administrative activities more time-consuming and
costly. We have also incurred substantially higher costs to obtain
directors’ and officers’ insurance. In addition, as we gain experience with the
costs associated with being a reporting company, we may identify and incur
additional overhead costs.
If
we fail to maintain an effective system of internal controls over financial
reporting, we may not be able to report our financial results accurately or
detect fraud, which could harm our business and the trading price of our common
stock.
Effective
internal controls are necessary for us to produce reliable financial reports and
are important in our effort to prevent financial fraud. Beginning
with our fiscal year ended February 28, 2011, we are required to periodically
evaluate the effectiveness of the design and operation of our internal
controls. These evaluations may result in the conclusion that
enhancements, modifications or changes to our internal controls are necessary or
desirable. While management evaluates the effectiveness of our
internal controls on a regular basis, these controls may not always be
effective. There are inherent limitations on the effectiveness of
internal controls including collusion, management override, and failure of
human judgment. Because of this, control procedures are designed to
reduce rather than eliminate business risks. If we fail to maintain
an effective system of internal controls or if management or our independent
registered public accounting firm were to discover material weaknesses in our
internal controls, we may be unable to produce reliable financial reports or
prevent fraud and it could harm our financial condition and results of
operations and result in loss of investor confidence and a decline in our share
price.
Our
indemnification obligations to our customers and suppliers for product defects
could require us to pay substantial damages.
A number
of our product sales and product purchase agreements provide that we will
defend, indemnify and hold harmless our customers and suppliers from damages and
costs which may arise from product warranty claims or claims for injury or
damage resulting from defects in our products. We maintain insurance
to protect against certain claims associated with the use of our products, but
our insurance coverage may not be adequate to cover all or any part of the
claims asserted against us. A successful claim brought against us
that is in excess of, or excluded from, our insurance coverage could
substantially harm our business, financial condition and results of
operations.
Our
operations in the United States and foreign countries are subject to political
and economic risks, which could have a material adverse effect on our business
and operating results.
Our
financial success may be sensitive to adverse changes in general political and
economic conditions in the United States such as changes in regulatory
requirements, taxes, recession, inflation, unemployment and interest
rates. Such changing conditions could reduce demand in the
marketplace for our products or increase the costs involved for us to
manufacture our products.
Sales
outside of the United States accounted for approximately 57% of net sales for
the fiscal year ended February 28, 2010. Sales outside of the United
States accounted for approximately 61% and 63% of net sales in fiscal years
ended February 28, 2009 and February 29, 2008, respectively. We
anticipate that international sales will continue to constitute a meaningful
percentage of our total net sales in future periods. In
addition, a significant portion of our design and manufacturing is performed at
our facilities in Taiwan. As a result, our operations may be subject
to certain risks, including changes in regulatory requirements, tariffs and
other barriers, increased price pressure, timing and availability of export
licenses, difficulties in accounts receivable collections, difficulties in
protecting our intellectual property, natural disasters, difficulties in
staffing and managing foreign operations, difficulties in managing distributors,
difficulties in obtaining governmental approvals for products that may require
certification, restrictions on transfers of funds and other assets of our
subsidiaries between jurisdictions, foreign currency exchange fluctuations, the
burden of complying with a wide variety of complex foreign laws and treaties,
potentially adverse tax consequences and uncertainties relative to regional,
political and economic circumstances.
21
We are
also subject to the risks associated with the imposition of legislation and
regulations relating to the import or export of high technology
products. We cannot predict whether quotas, duties, taxes or other
charges or restrictions upon the importation or exportation of our products will
be implemented by the United States or other countries. Some of our
customers’ purchase orders and agreements are governed by foreign laws, which
often differ significantly from those of the United
States. Therefore, we may be limited in our ability to enforce our
rights under such agreements and to collect damages, if
awarded. These factors may have a material adverse effect on our
business, financial condition and results of operations.
Our
inability to effectively manage our operations in foreign countries could harm
our operating results.
A
significant portion of our design and manufacturing operations are carried out
outside of the United States at our foreign facilities. Further,
international sales have accounted for a significant portion of our overall
sales. In some of the countries in which we operate or sell our
products, it is difficult to recruit, employ and retain qualified personnel to
manage and oversee our local operations, sales and other
activities. Further, given our executive officers’ existing
managerial burdens, their lack of physical proximity to the activities being
managed and the inherent limitations of cross-border information flow, our
executive officers who reside in the United States may be unable to effectively
oversee the day-to-day management of our foreign subsidiaries and
operations. The inability of or failure by our domestic and
international management to effectively and efficiently manage our overseas
operations could have a negative impact on our business and adversely affect our
operating results.
Worldwide
economic and political conditions may adversely affect demand for our
products.
The
current economic slowdown in the United States and worldwide has adversely
affected and may continue to adversely affect demand for our
products. Another decline in the worldwide computing markets or a
future decline in economic conditions or consumer confidence in any significant
geographic area would likely decrease the overall demand for our products, which
could have a material adverse effect on us. For example, a decline in
economic conditions in China could lead to declining worldwide economic
conditions. If economic conditions decline, whether in China or
worldwide, we could be materially adversely affected.
The
occurrence and threat of terrorist attacks and the consequences of sustained
military action in the Middle East have in the past, and may in the future,
adversely affect demand for our products. In addition, terrorist
attacks may negatively affect our operations directly or indirectly and such
attacks or related armed conflicts may directly impact our physical facilities
or those of our suppliers or customers. Furthermore, these attacks
may make travel and the transportation of our products more difficult and more
expensive, ultimately affecting our sales.
Also as a
result of terrorism, the United States has been and may continue to be involved
in armed conflicts that could have a further impact on our sales, our supply
chain and our ability to deliver products to our customers. Political
and economic instability in some regions of the world could negatively impact
our business. The consequences of armed conflicts are unpredictable
and we may not be able to foresee events that could have a material adverse
effect on us.
More
generally, any of these events could cause consumer confidence and spending to
decrease or result in increased volatility to the United States economy and
worldwide financial markets. Any of these occurrences could have a
material adverse effect on our business, financial condition and results of
operations.
Unfavorable
currency exchange rate fluctuations could result in our products becoming
relatively more expensive to our overseas customers or increase our
manufacturing costs, each of which could adversely affect our
profitability.
Our
international sales and our operations in foreign countries make us subject to
risks associated with fluctuating currency values and exchange
rates. Because sales of our products have been denominated to date
primarily in U.S. dollars, increases in the value of the U.S. dollar could
increase the price of our products so that they become relatively more expensive
to customers in the local currency of a particular country, leading to a
reduction in sales and profitability in that country. Future
international activity may result in increased foreign currency denominated
sales. Gains and losses on the conversion to U.S. dollars of accounts
receivable, accounts payable and other monetary assets and liabilities arising
from international sales or operations may contribute to fluctuations in our
results of operations. In addition, as a result of our foreign sales
and operations, we have revenues, costs, assets and liabilities that are
denominated in foreign currencies. Therefore, decreases in the value
of the U.S. dollar could result in significant increases in our manufacturing
costs that could have a material adverse effect on our business and results of
operations.
22
Our
worldwide operations could be subject to natural disasters and other business
disruptions, which could materially adversely affect our business and increase
our costs and expenses.
Our
worldwide operations could be subject to natural disasters and other business
disruptions, which could harm our future revenue and financial condition and
increase our costs and expenses. For example, our corporate
headquarters in San Jose, California and our manufacturing facilities in Taiwan
are located near major earthquake fault lines. Taiwan is also subject
to typhoons during certain times of the year. In the event of a major
earthquake, typhoon or hurricane, or other natural or manmade disaster, we could
experience business interruptions, destruction of facilities and/or loss of
life, any of which could materially adversely affect our business and increase
our costs and expenses.
Our
ability to compete successfully and achieve future growth will depend, in part,
on our ability to protect our intellectual property, as well as our ability to
operate without infringing the intellectual property of others.
We
attempt to protect our intellectual property rights through trade secret laws,
non-disclosure agreements, confidentiality procedures and employee disclosure
and invention assignment agreements. To a lesser extent, we also
protect our intellectual property through patents, trademarks and
copyrights. It is possible that our efforts to protect our
intellectual property rights may not:
|
|
§
|
prevent
our competitors from independently developing similar products,
duplicating our products or designing around the patents owned by
us;
|
|
|
§
|
prevent
third-party patents from having an adverse effect on our ability to do
business;
|
|
|
§
|
provide
adequate protection for our intellectual property
rights;
|
|
|
§
|
prevent
disputes with third parties regarding ownership of our intellectual
property rights;
|
|
|
§
|
prevent
disclosure of our trade secrets and know-how to third parties or into the
public domain;
|
|
|
§
|
prevent
the challenge, invalidation or circumvention of our existing
patents;
|
|
|
§
|
result
in patents that lead to commercially viable products or provide
competitive advantages for our products;
and
|
|
|
§
|
result
in issued patents and registered trademarks from any of our pending
applications.
|
If any of
our issued patents are found to be invalid or if any of our patent applications
are rejected, our ability to exclude competitors from making, using or selling
the same or similar products as ours could be compromised. We have
occasionally applied for and may in the future apply for patent protection in
foreign countries. The laws of foreign countries, however, may not
adequately protect our intellectual property rights. Many U.S. companies
have encountered substantial infringement problems in foreign countries.
Because we conduct a substantial portion of our operations and sell some
of our products overseas, we have exposure to foreign intellectual property
risks.
In
addition, the industries in which we compete are characterized by vigorous
protection and pursuit of intellectual property rights. We believe
that it may be necessary, from time to time, to initiate litigation against one
or more third parties to preserve our intellectual property
rights. From time to time, we have received, and may receive in
the future, notices that claim we have infringed upon, misappropriated or
misused other parties’ proprietary rights. Any of the foregoing
events or claims could result in litigation. Such litigation, whether
as plaintiff or defendant, could result in significant expense to us and divert
the efforts of our technical and management personnel, whether or not such
litigation is ultimately determined in our favor. In the event of an
adverse result in such litigation, we could be required to pay substantial
damages, cease the manufacture, use and sale of certain products, expend
significant resources to develop or acquire non-infringing technology,
discontinue the use of certain processes or obtain licenses to use the infringed
technology. Product development or license negotiating would likely
result in significant expense to us and divert the efforts of our technical and
management personnel. We cannot assure you that we would be
successful in such development or acquisition or that necessary licenses would
be available on reasonable terms, or at all.
23
Our
indemnification obligations for the infringement by our products of the
intellectual property rights of others could require us to pay substantial
damages.
We
currently have in effect a number of agreements in which we have agreed to
defend, indemnify and hold harmless our customers and suppliers from damages and
costs which may arise from the infringement by our products of third-party
patents, trademarks or other proprietary rights. We may periodically
have to respond to claims and litigate these types of indemnification
obligations. Any such indemnification claims could require us to pay
substantial damages. Our insurance does not cover intellectual
property infringement.
We
could incur substantial costs as a result of violations of or liabilities under
environmental laws.
Our
business involves purchasing finished goods as components from different vendors
and then assembly of these components into finished products at our
facilities. We therefore are not involved in the actual manufacturing
of components, which can often involve significant environmental regulations
with respect to the materials used, as well as work place safety
requirements. Our operations and properties, however, do remain
subject in particular to domestic and foreign laws and regulations governing the
storage, disposal and recycling of computer products. For example,
our products may be subject to the European Union’s Directive 2002/96/EC Waste
Electrical and Electronic Equipment and Directive 2002/95/EC on Restriction
on the Certain Hazardous Substances in Electrical and Electronic
Equipment. Our failure to comply with present and future requirements
could cause us to incur substantial costs, including fines and penalties,
investments to upgrade our product cycle or curtailment of
operations. Further, the identification of presently unidentified
environmental conditions, more vigorous enforcement by regulatory agencies,
enactment of more stringent laws and regulations, or other unanticipated events
may arise in the future and give rise to material environmental liabilities and
related costs which could have a material adverse effect on our business,
financial condition and results of operations.
We
are subject to a variety of federal, state and foreign laws and regulatory
regimes. Failure to comply with governmental laws and regulations
could subject us to, among other things, mandatory product recalls, penalties
and legal expenses which could have an adverse effect on our
business.
Our
business is subject to regulation by various federal and state governmental
agencies. Such regulation includes the radio frequency emission
regulatory activities of the Federal Communications Commission, the anti-trust
regulatory activities of the Federal Trade Commission and Department of Justice,
the consumer protection laws of the Federal Trade Commission, the import/export
regulatory activities of the Department of Commerce, the product safety
regulatory activities of the Consumer Products Safety Commission, the regulatory
activities of the Occupational Safety and Health Administration, the
environmental regulatory activities of the Environmental Protection Agency, the
labor regulatory activities of the Equal Employment Opportunity Commission and
tax and other regulations by a variety of regulatory authorities in each of the
areas in which we conduct business. We are also subject to regulation
in other countries where we conduct business. In certain
jurisdictions, such regulatory requirements may be more stringent than in the
United States. We are also subject to a variety of federal and state employment
and labors laws and regulations, including the Americans with Disabilities Act,
the Federal Fair Labor Standards Act, the WARN Act and other regulations related
to working conditions, wage-hour pay, over-time pay, employee benefits,
anti-discrimination, and termination of employment.
We have
voluntarily disclosed potential violations of the Iranian Transaction
Regulations and the Export Administration Regulations of the U.S. Department of
Treasury, Office of Foreign Assets Control and the U.S. Department of Commerce,
Office of Export Enforcement as a result of recently discovered actions by a
former employee.
Noncompliance
with applicable regulations or requirements could subject us to investigations,
sanctions, mandatory product recalls, enforcement actions, disgorgement of
profits, fines, damages, civil and criminal penalties, or
injunctions. In addition from time to time we have received, and
expect to continue to receive, correspondence from former employees terminated
by us who threaten to bring claims against us alleging that we have violated one
or more labor and employment regulations. In certain instances former
employees have brought claims against us and we expect that we will encounter
similar actions against us in the future. An adverse outcome in any
such litigation could require us to pay contractual damages, compensatory
damages, punitive damages, attorneys’ fees and costs.
24
Any
enforcement action could harm our business, financial condition and results of
operations. If any governmental sanctions are imposed, or if we do
not prevail in any possible civil or criminal litigation in the future, our
business, financial condition and results of operations could be materially
adversely affected. In addition, responding to any action will likely
result in a significant diversion of management’s attention and resources and an
increase in professional fees.
Changes
in the applicable tax laws could materially affect our future
results.
We
operate in different countries and are subject to taxation in different
jurisdictions. As a result, our future effective tax rates could be
impacted by changes in the applicable tax laws of such jurisdictions or the
interpretation of such tax laws. For example, on May 5, 2009,
President Obama and the U.S. Treasury Department proposed changing certain tax
rules for U.S. corporations doing business outside the U.S. The
proposed changes would restrict the ability of U.S. corporations to transfer
funds between foreign subsidiaries without triggering U.S. income tax, limit the
ability of U.S. corporations to deduct expenses attributable to un-repatriated
foreign earnings and modify the foreign tax credit rules. These
changes have been proposed to be effective beginning January 1,
2011. We cannot determine whether these proposals will be enacted
into law or what changes, if any, may be made to such proposals prior to their
being enacted into law. Depending on their content, such proposals
(if enacted) or other changes in the applicable tax laws could increase our
effective tax rate and adversely affect our after-tax
profitability.
Risks
Related to our Debt
Our
indebtedness could impair our financial condition, harm our ability to operate
our business, limit our ability to borrow additional funds or capitalize on
acquisition or other business opportunities.
We have
entered into a Sale of Accounts and Security Agreement with Faunus Group
International, Inc, pursuant to which we may factor our foreign receivables up
to $10 million in the aggregate (as amended, the “FGI
Agreement”). We have entered into a Loan and Security
Agreement with Silicon Valley Bank dated as of July 2009 (as amended, the “SVB
Agreement” and collectively with the FGI Agreement, the “Factoring Loan
Agreements”) to factor all our domestic receivables up to $10 million in
the aggregate. As of May 10, 2010, the SVB Agreement also caps the
aggregate debt under both Factoring Loan Agreements to $17.5
million. Under the Factoring Loan Agreements we have guaranteed our
obligations thereunder and have pledged substantially all of our assets as
security. As of our fiscal year ended February 28, 2010, the
outstanding loan balances under the Factoring Loan Agreements were $10.4 million
in the aggregate. Also, we may incur additional debt in the future,
subject to certain limitations contained in our debt instruments.
The
degree to which we are leveraged and the restrictions governing this
indebtedness, such as a minimum Quick Ratio, (our cash and accounts receivable
divided by current liabilities) could have important consequences including, but
not limited to, the following:
|
|
§
|
it
may limit our ability to service all of our debt
obligations;
|
|
|
§
|
it
may impair our ability to incur additional indebtedness or obtain
additional financing in the future for working capital, capital
expenditures, acquisitions, general corporate purposes or other
purposes;
|
|
|
§
|
some
of our debt is and will continue to be at variable rates of interest,
which may result in higher interest expense in the event of increases in
interest rates;
|
|
|
§
|
our
debt agreements contain, and any agreements to refinance our debt likely
will contain, financial and restrictive covenants, and our failure to
comply with them may result in an event of default which, if not cured or
waived, could have a material adverse effect on
us;
|
|
|
§
|
our
level of indebtedness will increase our vulnerability to general economic
downturns and adverse industry
conditions;
|
|
|
§
|
our
debt service obligations could limit our flexibility in planning for, or
reacting to, changes in our business and our industry;
and
|
|
|
§
|
it may limit our ability to
engage in certain transactions or capitalize on acquisition or other
business opportunities.
|
25
The
Factoring Loan Agreements also have “material adverse change” provisions that
essentially grant the lenders broad discretion in determining whether to
accelerate the payment of all amounts due under the Factoring Loan Agreements
when adverse events occur with respect to our Company, its business, financial
condition, results of operation, assets, liabilities or prospects. As
of November 30, 2008 and February 28, 2009 we failed to comply with one or more
loan covenants under the loan agreement with Silicon Valley Bank which was the
predecessor to the Factoring Loan Agreements. We received a waiver from
Silicon Valley Bank for such non-compliances. We cannot assure that we
will not violate one or more loan covenants in the future. As we are in
violation of covenants in either of the Factoring Loan Agreements and do not
receive a waiver, the lender could choose to accelerate payment on all
outstanding loan balances. There can be no assurance that we would be able
to quickly obtain equivalent or suitable replacement financing in this event.
If we are unable to secure alternative sources of funding, such
acceleration would have a material adverse impact on our financial
condition.
To
service our debt, we will require cash and we may not be able to generate
sufficient cash flow from operations to satisfy these obligations or to
refinance these obligations on acceptable terms, or at all.
Our
ability to generate cash depends on many factors beyond our
control. Our ability to make payments on our debt and to fund working
capital requirements, capital expenditures and research and development efforts
will depend on our ability to generate cash in the future. Our
historical financial results have been, and we expect our future financial
results will be, subject to substantial fluctuation based upon a wide variety of
factors, many of which are not within our control including, among others, those
described in this section.
Unfavorable
changes in any of these factors could harm our operating results and our ability
to generate cash to service our debt obligations. If we do not
generate sufficient cash flow from operations to satisfy our debt obligations,
we may have to undertake alternative financing plans, such as refinancing or
restructuring our debt, selling assets, reducing or delaying capital investments
or seeking to raise additional capital. Also, certain of these
actions would require the consent of our lenders. The terms of our
financing agreements contain limitations on our ability to incur
debt. We cannot assure you that any refinancing would be possible,
that any assets could be sold, or, if sold, of the timing of the sales and the
amount of proceeds realized from those sales, or that additional financing could
be obtained on acceptable terms, if at all, or would be permitted under the
terms of our various debt instruments then in effect. Our inability
to generate sufficient cash flow to satisfy our debt obligations, or to
refinance our obligations on commercially reasonable terms, would have an
adverse effect on our business, financial condition and results of
operations.
Risks
Related to our Common Stock
The
price of our common stock may be volatile and subject to wide
fluctuations.
The
market price of the securities of technology companies has been especially
volatile. In addition, our common stock was listed on the OTCBB since
January 14, 2009 and only recently began trading on The NASDAQ Capital Market on
April 23, 2010. Accordingly, we have an extremely limited history of
public trading of our common stock within the United States. Thus,
the market price of our common stock may be subject to wide
fluctuations. If our net sales do not increase or increase less than
we anticipate, or if operating or capital expenditures exceed our expectations
and cannot be adjusted accordingly, or if some other event adversely affects us,
the market price of our common stock could decline. Broad market and
industry factors may adversely affect the market price of our common stock,
regardless of our actual operating performance. Factors that could
cause fluctuations in our stock price may include, among other
things:
|
|
§
|
actual
or anticipated variations in quarterly operating
results;
|
|
|
§
|
changes
in financial estimates by us or by any securities analysts who might cover
our stock, or our failure to meet the estimates made by securities
analysts;
|
|
|
§
|
changes
in the market valuations of other companies operating in our
industry;
|
|
|
§
|
announcements
by us or our competitors of significant acquisitions, strategic
partnerships or divestitures;
|
|
|
§
|
additions
or departures of key personnel; and
|
|
|
§
|
a general downturn in the stock
market.
|
26
The
market price of our stock also might decline in reaction to events that affect
other companies in our industry, even if these events do not directly affect us.
In the past, companies that have experienced volatility in the market
price of their stock have been the subject of securities class action
litigation. If we were to become the subject of securities class action
litigation, it could result in substantial costs and a diversion of management’s
attention and resources.
We
may experience significant period-to-period quarterly and annual fluctuations in
our net sales and operating results, which may result in volatility in our share
price.
We may
experience significant period-to-period fluctuations in our net sales and
operating results in the future due to a number of factors and any such
variations may cause our share price to fluctuate. It is likely that
in some future period our operating results will be below the expectations of
securities analysts or investors. If this occurs, our share price
could drop significantly.
A number
of factors, in addition to those cited in other risk factors applicable to our
business, may contribute to fluctuations in our sales and operating results,
including:
|
|
§
|
the
timing and volume of orders from our
customers;
|
|
|
§
|
the
rate of acceptance of our products by our customers, including the
acceptance of design wins;
|
|
|
§
|
the
demand for and life cycles of the products incorporating our
products;
|
|
|
§
|
the
rate of adoption of our products in the end markets we
target;
|
|
|
§
|
cancellations
or deferrals of customer orders in anticipation of new products or product
enhancements from us or our competitors or other
providers;
|
|
|
§
|
changes
in product mix; and
|
|
|
§
|
the
rate at which new markets emerge for products we are currently developing
or for which our design expertise can be utilized to develop products for
these new markets.
|
The
sale of our outstanding common stock and exercise of outstanding warrants and
options are not subject to lock-up restrictions and may have an adverse effect
of the market price of the our stock.
As of our
fiscal year ended February 28, 2010, we had 60,990 shares of Series A preferred
stock outstanding (which were converted into 62,733 shares of common stock on
May 4, 2010), 21,278,643 shares of common stock outstanding, 2,779,111 options
to purchase an aggregate of 2,779,111 shares of common stock outstanding,
140,520 warrants to purchase an aggregate of 140,520 shares of Series A
preferred stock outstanding (which were converted into warrants to purchase
144,541 shares of common stock on May 4, 2010) and 142,564 warrants to purchase
an aggregate of 142,564 shares of common stock outstanding. Since
only 1,405,199 shares of our common stock are subject to lock-up restrictions,
we cannot assure investors that the holders of our stock will not sell
substantial amounts of their holdings of our stock. The sale or even
the possibility of sale of such stock or the stock underlying the options and
warrants could have an adverse effect on the market price for our securities or
on our ability to obtain a future public financing. If and to the
extent that warrants and/or options are exercised, stockholders could be
diluted.
Future
sales of shares could depress our share price.
As of our
fiscal year ended February 28, 2010, we had 21,278,643 shares of common
stock outstanding. On May 20, 2010 we expect to file a
registration statement with the SEC pursuant to which we would register the
resale of 5,244,105 shares of common stock, as well as shares issuable upon the
exercise of warrants, for a total of 8,338,866 shares of our common
stock. Sales by the Selling Stockholders (as defined in the
registration statement) thereunder, especially if in heavy volume and at the
same time, could negatively affect our stock price. Moreover, the
perception in the public market that these stockholders might sell our common
stock could depress the market price of the common
stock. Additionally, we may sell or issue shares of common stock in a
public offering or in connection with acquisitions, which will result in
additional dilution and may adversely affect market prices for our common
stock.
No
prediction can be made as to the precise effect, if any, that sales of shares of
our common stock or the availability of such shares for sale will have on the
market prices prevailing from time to time. Nevertheless, the
possibility that substantial amounts of common stock may be sold in the public
market may adversely affect prevailing market prices for our common stock and
could impair our ability to raise capital through the sale of our equity
securities.
27
Anti-takeover
provisions in our organizational documents may discourage our acquisition by a
third party, which could limit your opportunity to sell your shares at a
premium.
Our
fourth amended and restated certificate of incorporation (“Certificate of
Incorporation”) includes provisions that could limit the ability of
others to acquire control of us, modify our structure or cause us to engage in
change of control transactions, including, among other things, provisions that
restrict the ability of our stockholders to call meetings and provisions that
authorize our board of directors, without action by our stockholders, to issue
additional common stock. These provisions could deter, delay or
prevent a third party from acquiring control of us in a tender offer or similar
transactions, even if such transaction would benefit our
stockholders.
28
Item
1B. Unresolved
Staff Comments
Not Applicable.
Item
2.
Properties
We lease
the following properties:
|
Property
|
Square Feet
|
Lease Expiration
|
Property Uses
|
|||
|
6373
San Ignacio Avenue
|
41,000
|
July
31, 2011
|
-Corporate
Headquarters
|
|||
|
San
Jose, California, USA
|
-General,
administrative, sales and
marketing
office
|
|||||
|
-Research
and Development
|
||||||
|
-Warehouse
|
||||||
|
160
Konrad Crescent, Unit #1,
|
3,375
|
June
30, 2010
|
-Sales
and marketing office
|
|||
|
Markham,
Ontario, Canada
|
-Warehouse
|
|||||
|
Kleveringweg
23, Unit 6
|
3,229
|
May
31, 2010
|
-Sales
and marketing office
|
|||
|
Delft,
The Netherlands
|
-Warehouse
|
|||||
|
16F-3,
No. 700, Chung Cheng
|
2,334
|
August
31, 2011
|
-Sales
and marketing office
|
|||
|
Road
|
-Research
and Development
|
|||||
|
Chung
Ho City, Taipei County
|
-Purchasing
|
|||||
|
Taiwan,
235, RoC
|
||||||
|
No. 165,
Changrong Road,
|
40,920
|
June
15, 2011
|
-Research
and Development
|
|||
|
Lujhu
Township, Taiwan RoC
|
-Manufacturing
|
|||||
|
-Warehouse
|
||||||
|
5995
Avenida Encinas, Suite 101
|
13,031
|
March
31, 2012
|
-Research
and Development
|
|||
|
Carlsbad,
California, USA
|
-Warehouse
|
We
consider each facility to be in good operating condition and adequate for its
present use, and believe that each facility has sufficient capacity to meet our
current and anticipated operating requirements.
29
Item
3.
Legal Proceedings
We are
from time to time involved in legal matters that arise in the normal course of
business. We do not believe that the ultimate resolution of any
current matters, individually or in the aggregate, will have a material adverse
effect on our business, financial condition and results of
operations.
In 2009,
we received inquiries from the U.S. Department of Commerce and the Federal
Bureau of Investigation regarding the potential re-export of our products from
the United Arab Emirates into Iran. We consequently launched an
internal investigation performed by outside counsel. The
investigation concluded that while between 2004 and 2008, we maintained a
relationship with a distributor in the United Arab Emirates, we have not found
any specific facts confirming these suspicions or any information about when
such re-exports would have occurred or who may have received the
products. However, we did provide approximately $500 in sales support
materials to the distributor in connection with a sales presentation in
Iran. We have terminated our relationship with this
distributor.
The
investigation separately discovered that in 2007 and 2008, in a total of three
instances, we sent one of our high speed Reaper memory module products free of
charge as either samples or replacement parts to individuals in Iran and an
individual who claimed an address in Cuba but subsequently changed the address
to one in Mexico.
We also
have received information that a distributor in Lebanon to whom we sold Neural
Impulse Actuators September 2008 may have re-exported one of these units into
Syria and in general was interested in distributing our products in Syria, but
we have not found specific facts confirming when such re-export would have
occurred or who may have received the product. We have terminated our
relationship with this distributor.
We have
voluntarily disclosed these transactions to the U.S. Department of Commerce and
the U.S. Department of the Treasury and have cooperated fully with requests for
information from these entities as well as the Federal Bureau of
Investigation. Should the U.S. government allege that we have
violated the Iranian Transaction Regulations and/or Export Administration
Regulations, the maximum fine for each violation that we could be subject to
would be the greater of $250,000 or two times the value of the illegal
transaction. Based on the list price of the products in question, we
believe the maximum fine per violation would be $250,000. We believe,
however, there is a good faith basis for leniency if any fines are assessed,
given the relatively small number of units and revenue at issue, our full
cooperation with the U.S. government and our immediate attention to rectifying
the underlying causes of the problems. As a result of the discovery
of these events, we have implemented more stringent export control procedures to
prevent inadvertent transfers and retransfers to sanctioned
countries.
30
Item
4.
(Removed and Reserved)
31
Part
II
|
Item 5.
|
Market
for Registrant’s Common
Equity. Related Stockholder Matters and Issuer Purchases of
Equity Securities
|
From June
21, 2006 through April 1, 2009, our common stock was traded on the Alternative
Investment Market (“AIM”) of
the London Stock Exchange under the symbol “OCZ.” On January 14, 2010 our
common stock was listed on the Over-the-Counter Bulletin Board (“OTCBB”), and was traded on the
OTCBB from February 10, 2010 to April 22, 2010. Since April 23, 2010, our
common stock has been quoted on The NASDAQ Capital Market. The
quotations below reflect the high and low bid prices for our common stock since
May 31, 2007 as reported on AIM, OTCBB and The NASDAQ Capital Market, as
applicable. The quotations below reflect inter-dealer prices, without
retail mark-up, mark-down or commission and may not necessarily represent actual
transactions.
|
The
NASDAQ Capital Market
|
||||||||
|
High
|
Low
|
|||||||
|
2010:
|
||||||||
|
Period
of April 23 – May 14, 2010
|
$ | 5.05 | $ | 3.75 | ||||
|
OTCBB
|
||||||||
|
High
|
Low
|
|||||||
|
2010:
|
||||||||
|
Period
of March 1 – April 22, 2010
|
$ | 6.00 | $ | 3.95 | ||||
|
Period
of January 14 – February 28, 2010
|
$ | 6.25 | $ | 5.25 | ||||
|
AIM
|
||||||||
|
High
|
Low
|
|||||||
|
2009:
|
||||||||
|
Period
of March 1 – April 1, 2009
|
$ | 0.36 | $ | 0.12 | ||||
|
4th
Quarter (February 28, 2009)
|
$ | 0.51 | $ | 0.11 | ||||
|
2008:
|
||||||||
|
3rd
Quarter (November 30, 2008)
|
$ | 0.65 | $ | 0.38 | ||||
|
2nd Quarter
(August 31, 2008)
|
$ | 1.25 | $ | 0.75 | ||||
|
1st Quarter
(May 31, 2008)
|
$ | 1.88 | $ | 0.90 | ||||
|
2
Month Period Ended February 29, 2008
|
$ | 2.28 | $ | 1.48 | ||||
|
2007:
|
||||||||
|
4th
Quarter (December 31, 2007)
|
$ | 7.28 | $ | 2.10 | ||||
|
3rd
Quarter (September 30, 2007)
|
$ | 9.72 | $ | 6.00 | ||||
|
2nd Quarter
(June 30, 2007)
|
$ | 8.78 | $ | 5.65 | ||||
The
closing sales price for our common stock on May 14, 2010 was $4.04, as
reported by The NASDAQ Capital Market.
As of our
fiscal year ended February 28, 2010 we have approximately 167 stockholders
and 130 holders of outstanding options.
32
As of our
fiscal year ended February 28, 2010, 60,990 shares of our Series A preferred
stock (which were converted into 62,733 shares of common stock on May 4, 2010),
21,278,643 shares of our common stock, and 2,779,111 shares of our common stock
subject to options were issued and outstanding. In addition, there
were warrants to purchase (i) 140,520 shares of our Series A preferred stock at
an exercise price of $5.00 per share, and (ii) 142,564 shares of our common
stock at exercise prices ranging between $2.25 and $3.90 and an average exercise
price of $2.80 per share outstanding.
Dividends
We have
not paid any dividends on any of our shares to date, and we do not anticipate
declaring or paying any dividends on our common stock. Any future
determination as to the declaration and payment of dividends, if any, will be at
the discretion of our Board of Directors (the “Board”)
and will be contingent upon our then existing conditions, operating results,
revenues and earnings, if any, contractual restrictions, capital requirements,
business prospects and general financial condition, and other factors our Board
may deem relevant. The payment of any dividends will also be subject
to the requirements of the Delaware General Corporation Law (“DGCL”) and
certain restrictions contained in the Factoring Loan Agreements for our credit
lines from Silicon Valley Bank and Faunus Group International. For as
long as such agreements remain in effect, we would need both lenders’ written
consent before making a cash dividend payment. There are currently no
restrictions that materially limit our ability to pay stock dividends, or that
we reasonably believe are likely to limit materially the future payment of stock
dividends.
Equity
Compensation Plan Information
In
December 2004, our Board adopted and our stockholders approved a stock incentive
plan with 1,800,000 shares of common stock authorized for issuance (the “Stock Incentive
Plan”). The shares subject to the Stock Incentive Plan was
subsequently increased to 5,232,873. The shares to be purchased are
subject to forfeiture conditions, rights of repurchase, rights of first refusal
and other transfer restrictions as the Board may determine. The
purpose of the Stock Incentive Plan is to offer selected providers the
opportunity to acquire equity in OCZ through awards of options over common stock
(which may constitute incentive stock options (an “ISO”) or
non-statutory stock options (an “NSO”)) and
the award or sale of common stock. The options granted will expire in
a term not to exceed 10 years.
The
following table summarizes our equity compensation plans as of our fiscal year
ended February 28, 2010:
|
Plan Category
|
Number of securities
to be issued upon
exercise of
outstanding options,
warrants and rights
|
Weighted-average
exercise price of
outstanding
options, warrants
and rights
|
Number of
securities
remaining
available for
future
issuance
under equity
compensation
plans
|
|||||||||
|
Equity
compensation plans approved by security holders
|
2,779,111 | $ | 2.20 | 1,659,614 | ||||||||
|
Equity
compensation plans not approved by security holders
|
- | - | - | |||||||||
|
Totals
|
2,779,111 | $ | 2.20 | 1,659,614 | ||||||||
Stock
Price Performance Graph
The
following graph shows a comparison of cumulative a total stockholder return
calculated on a dividend reinvested basis, for us, the NASDAQ Composite Index
and the Standard & Poor’s Semiconductor Index assuming an Investment of $100
on February 28, 2007. Periods prior to February 28, 2010 reflect the
trading prices of our common stock on the AIM. No dividends have been
declared on our common stock. The graph covers the Period from February
28, 2007 to the last trading day of our year ended February 28, 2010. The
comparison below are based upon historical data and are not indicative of, nor
intended to forecast, the future performance of our common
stock.
33
Comparison
Of Cumulative Return From February 28, 2007
Among
OCZ Technology Group, Inc., The NASDAQ Composite index and the S&P
Semiconductors Index
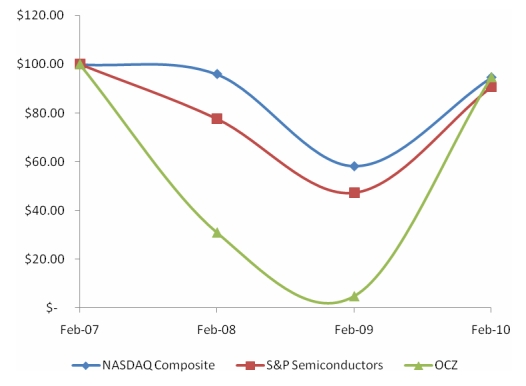
Notwithstanding
anything to the contrary set forth in any of our previous filings made under the
Securities Act of 1933, as amended, or the Securities Exchange Act of 1934, as
amended, that might incorporate future filings made by us under those statutes,
the preceding Stock Performance Graph is not to be incorporated by reference
into any such prior filings, nor shall such graph be incorporated by reference
into any future filings made by us under those statutes.
Recent
Sales of Unregistered Securities
We have
sold or issued the following securities that were not registered under the
Securities Act during the past three years. The historical share data
set forth in this document have been adjusted to reflect the 1 for 2.5 reverse
stock split that took place in September 2009.
In June
2006, we issued 3,020,000 shares of common stock in connection with our initial
listing on AIM for 163 pence (or $3.00) per share. Also, in
conjunction with this initial listing, we issued 484,000 shares upon conversion
of convertible unsecured loans at a conversion price of 121.88 pence (or $2.25)
per share. We raised an aggregate of $8.2 million net of costs in
connection with the initial listing. The shares were offered and sold
outside of the United States in reliance upon Regulation S (“Regulation
S”) under the Securities Act.
In
October 2006, we issued an additional 516,000 shares of common stock in
connection with our listing on AIM at 212.5 pence (or $4.15) per share, with net
aggregate proceeds of approximately $1.7 million. The shares were
offered and sold outside of the United States in reliance upon Regulation
S.
34
During
the remainder of 2006, we issued approximately 141,600 shares of common stock
upon the exercise of stock option and warrants. The shares related to
the exercise of the warrants were offered and sold outside of the United States
in reliance upon Regulation S. Certain shares of common stock were
offered and sold in connection with the exercise of stock options outside of the
United States in reliance upon Regulation S. The remaining shares
were offered and sold in connection with the exercise of stock options in the
United States in reliance upon Rule 701 of the Securities Act.
During
May 2007, we completed a secondary offering of 2,651,000 shares of common stock
at 312.5 pence (or $6.18) per share, with aggregate net proceeds of
approximately $15.3 million. These shares were offered and sold
outside of the United States in reliance upon Regulation S.
Also in
May 2007, we issued 249,200 shares of common stock in connection with our
acquisition of PC Power and Cooling, Inc. In February 2008, we issued
231,600 shares of its common stock as part of a capitalization of $500,000 of an
acquisition-related note. These shares were issued in the United
States in reliance of Rule 506 of Regulation D under the Securities Act and all
recipients of our common stock were “accredited” as defined under the rules of
the SEC.
During
the fiscal year ended February 29, 2008, we issued approximately 328,528 shares
of common stock in connection with the exercise of stock options in the United
States in reliance of Rule 701 of the Securities Act.
In
February 2009, we issued 339,200 shares of common stock as part of a
capitalization of $200,000 of an acquisition-related note in favor of Douglas A.
Dodson. The shares were issued in reliance upon Rule 506 of
Regulation D under the Securities Act. Mr. Dodson was an “accredited”
investor as defined under the rules of the SEC.
As of our
fiscal year ended February 28, 2010, we issued 60,990 shares of our Series A
preferred stock at $5.00 per share. These shares were issued in reliance
on Rule 506 of the Securities Act. In addition, we also issued warrants to
purchase up to 140,520 shares of our Series A preferred stock. Such
warrants have been issued in reliance on Regulation S of the Securities
Act. Under the terms of our certificate of incorporation with respect to
our Series A Preferred Stock, each share of Series A Preferred Stock was to be
automatically converted into shares of common stock on the sixtieth (60th) trading day following
the commencement of trading of our common shares on a public stock exchange,
including OTCBB (“Mandatory
Conversion”). The
trading of our common shares commenced on OTCBB on February 10, 2010, and the
60th trading day
following the commencement of trading was May 4, 2010. The number of
shares of our common stock issued upon Mandatory Conversion was determined by
dividing $5.00 by the sixty (60) day per share average closing price of our
common stock on such public stock exchange (the “60 Day Average”). Based on the 60 Day Average
of $4.86, and after taking into account fractional shares, on May 4, 2010,
60,990 shares of our Series A Preferred Stock were converted into 62,733 shares
of our common stock, and warrants to purchase 140,520 shares of our Series A
Preferred Stock were converted into warrants to purchase 144,541 shares of our
common stock at $4.86 per share.
In March
2010, we issued an aggregate of 5,151,662 shares of our common stock at $3.00
per share in connection with a private placement. These shares were
issued in the United States in reliance of Rule 506 of Regulation D under the
Securities Act and all recipients of our common stock were “accredited” as
defined under the rules of the SEC. As part of the private placement
offering, we also issued warrants to purchase up to (i) 2,575,831 shares of our
common stock at $5.25 per share (the “$5.25
Warrants”) and (ii) 154,550 shares of our common stock at $3.00 per share
(the “$3.00
Warrants”). The warrants have been issued in reliance on the
exemptions provided by Section 4(2) of the Securities Act. In
addition, we have a commitment to issue a warrant for up to 77,275 shares of our
common stock at $5.25 per share. Each of the $5.25 Warrants and the
$3.00 Warrants are immediately exercisable, will expire on March 23, 2015 and
may be exercised by the holders on a cashless basis.
Since
March 1, 2008, we have issued options to purchase an aggregate of 2,156,000
shares of our common stock under our stock option plan with a weighted average
exercise price of $1.22 per share, including options to purchase an aggregate of
330,000 shares of our common stock issued to our newly elected directors, at an
exercise price of $4.35. These options were granted in reliance of
Rule 701 of the Securities Act. Further information regarding grants
made to our executive officers and directors may be found under “Executive Compensation - Director
Compensation” and “Executive Compensation -
Outstanding Equity Awards at February 28, 2010” herein.
35
Item
6.
Selected Financial Data
The
following table sets forth our selected historical consolidated financial data
as of the dates and for the periods indicated. The selected
historical consolidated financial data for each of the fiscal years in the three
year period ended February 28, 2010, February 28, 2009 and February 29, 2008 has
been derived from our audited historical consolidated financial statements
included elsewhere in this report. The selected historical
consolidated financial data as of and for the fiscal years ended
December 31, 2006 and December 31, 2005 and for the two months period
ended February 28, 2007 has been derived from our audited historical
consolidated financial statements not included in this report. The
selected historical consolidated financial data for the two months ended
February 28, 2006 has been derived from our unaudited condensed consolidated
financial statements not included in this report, which have been prepared on a
basis consistent with our annual audited consolidated financial
statements. In the opinion of management, such unaudited financial
data reflect all adjustments, consisting of normal and recurring adjustments,
necessary for a fair statement of our financial position and results of our
operations for the periods. The historical results of operations for
any period are not necessarily indicative of the results to be expected for any
future period.
The
selected historical consolidated financial data should be read in conjunction
with, and are qualified by reference to, “Management’s
Discussion and Analysis of Financial Condition and Results of Operations”
and by our consolidated financial statements and related notes thereto, each
appearing elsewhere in this report.
|
Years Ended
February 28/29,
|
Years Ended
December 31,
|
Two months
Ended February 28,
|
||||||||||||||||||||||||||
|
2010
|
2009
|
2008
|
2006
|
2005
|
2007
|
2006
|
||||||||||||||||||||||
|
(in thousands, except per share data)
|
(unaudited)
|
|||||||||||||||||||||||||||
|
Statement
of Operations Data:
|
||||||||||||||||||||||||||||
|
Revenue
|
$ | 143,959 | $ | 155,982 | $ | 118,352 | $ | 67,772 | $ | 35,718 | $ | 16,335 | $ | 8,310 | ||||||||||||||
|
Cost
of Revenue
|
125,303 | 136,191 | 95,419 | 58,826 | 29,493 | 13,153 | 7,117 | |||||||||||||||||||||
|
Gross
profit
|
18,656 | 19,791 | 22,933 | 8,946 | 6,225 | 3,182 | 1,193 | |||||||||||||||||||||
|
Operating
Expenses:
|
||||||||||||||||||||||||||||
|
Sales
and marketing
|
10,249 | 11,401 | 9,125 | 4,735 | 3,059 | 1,136 | 542 | |||||||||||||||||||||
|
Research
and development
|
5,331 | 2,575 | 1,570 | 452 | 232 | 202 | 52 | |||||||||||||||||||||
|
General
and administrative
|
14,711 | 16,709 | 11,704 | 5,006 | 3,067 | 1,212 | 573 | |||||||||||||||||||||
|
Impairment
of goodwill and intangible assets
|
911 | - | - | - | - | - | - | |||||||||||||||||||||
|
Total
operating expenses
|
31,202 | 30,685 | 23,399 | 10,193 | 6,358 | 2,550 | 1,167 | |||||||||||||||||||||
|
Income
(loss) from operations
|
(12,546 | ) | (10,894 | ) | 534 | (1,247 | ) | (133 | ) | 632 | 26 | |||||||||||||||||
|
Other
income and expense:
|
||||||||||||||||||||||||||||
|
Other
(expense) income
|
727 | (169 | ) | 256 | (30 | ) | 4 | (5 | ) | - | ||||||||||||||||||
|
Interest
and financing expense
|
(1,716 | ) | (600 | ) | (289 | ) | (682 | ) | (570 | ) | (51 | ) | (165 | ) | ||||||||||||||
|
Interest
and other income (expense), net
|
(989 | ) | (769 | ) | (33 | ) | (712 | ) | (566 | ) | 56 | (165 | ) | |||||||||||||||
|
Income
(loss) before income taxes
|
(13, 535 | ) | (11,663 | ) | 501 | (1,959 | ) | (699 | ) | 576 | (139 | ) | ||||||||||||||||
|
Income
tax expense (benefit)
|
(1 | ) | 61 | (936 | ) | (120 | ) | (110 | ) | 196 | (9 | ) | ||||||||||||||||
|
Net
income (loss)
|
$ | (13,534 | ) | $ | (11,724 | ) | $ | 1,437 | $ | (1,839 | ) | $ | (589 | ) | $ | 380 | $ | (130 | ) | |||||||||
|
Income
(loss) per share attributable to common stockholders:
|
||||||||||||||||||||||||||||
|
Basic
|
$ | (0.64 | ) | $ | (0.56 | ) | $ | 0.07 | $ | (0.12 | ) | $ | (0.14 | ) | ||||||||||||||
|
Diluted
|
$ | (0.64 | ) | $ | (0.56 | ) | $ | 0.07 | $ | (0.12 | ) | $ | (0.14 | ) | ||||||||||||||
|
Common
shares and equivalents outstanding:
|
||||||||||||||||||||||||||||
|
Basic
weighted average shares
|
21,300 | 21,000 | 19,800 | 15,400 | 4,200 | |||||||||||||||||||||||
|
Diluted
weighted average shares
|
21,300 | 21,000 | 20,400 | 15,400 | 4,200 | |||||||||||||||||||||||
|
Balance
Sheet Data:
|
||||||||||||||||||||||||||||
|
Cash
and cash equivalents
|
$ | 1,224 | $ | 420 | $ | 1,544 | $ | 1,423 | $ | 120 | ||||||||||||||||||
|
Total
assets
|
47,849 | 57,703 | 52,947 | 19,358 | 3,567 | |||||||||||||||||||||||
|
Deferred
revenue
|
95 | 167 | 92 | 89 | 61 | |||||||||||||||||||||||
|
Notes
payable, capital lease obligation, long term deferred rent
|
532 | 200 | 575 | - | 317 | |||||||||||||||||||||||
|
Total
stockholders’ equity
|
$ | 6,288 | $ | 18,923 | $ | 29,798 | $ | 9,026 | $ | 556 | ||||||||||||||||||
36
|
Item 7.
|
Management’s Discussion
and Analysis of Financial Condition and Results of Operations
|
Overview
We are a
leading provider of high performance Solid State Drives (“SSDs”) and
Memory Modules for computing devices and systems. Founded in 2002, we
are incorporated in Delaware and have our headquarters in San Jose, California
and offices in Canada, the Netherlands, and Taiwan. Our fiscal year
ends on the last day of February.
Historically,
we primarily sold high performance memory modules to individual computing
enthusiasts through catalog and online retail channels. However, SSDs
have emerged as a strong market alternative to conventional disk drive
technology and SSDs are rooted in much of the same basic technological concepts
as our legacy memory module business. Today, as part of a
diversification strategy which began in fiscal year 2009, our product mix is
significantly more weighted toward the sale of SSDs and the SSD product line has
become central to our business. As a result, our target customers are
increasingly enterprises and original equipment manufacturers (or “OEMs”).
In
addition to our SSD and Memory Module product lines, we design, develop,
manufacture and distribute other high performance components for computing
devices and systems, including thermal management solutions, AC/DC switching
PSUs and computer gaming solutions. We offer our customers
flexibility and customization by providing a broad array of solutions which are
interoperable and can be configured alone or in combination to make computers
run faster, more reliably, efficiently and cost effectively. Through
our diversified and global distribution channel, we offer more than 450 products
to 376 customers, including leading retailers, etailers, OEMs and computer
distributors.
Our ten
largest customers measured by net revenue for our fiscal year ended February 28,
2010 are listed as follows in alphabetical order:
|
|
§
|
Amazon.com;
|
|
|
§
|
ASK
Corporation;
|
|
|
§
|
BAS
Group;
|
|
|
§
|
D&H
Distribution Company;
|
|
|
§
|
Maxcom
Memory GmbH;
|
|
|
§
|
Memoryworld
GmbH & Co., KG;
|
|
|
§
|
Micro
Center Corporation;
|
|
|
§
|
Micro
Peripherals LTD;
|
|
|
§
|
NewEgg.com,
operated by Magnell Associate Inc.;
and
|
|
|
§
|
SYX
Distribution, Inc.
|
These ten
customers represented approximately 51% our net revenue for the period set forth
above. Our largest customer is NewEgg.com, which represented
approximately 19% of our revenue for our fiscal year ended February 28,
2010. No other customer was responsible for 10% or more of our net
revenue.
We
develop flexible and customizable component solutions quickly and efficiently to
meet the ever changing market needs and provide superior customer
service. We believe our high performance computer components offer
the speed, density, size and reliability necessary to meet the special demands
of:
37
|
|
§
|
industrial
equipment and computer systems;
|
|
|
§
|
computer
and computer gaming and
enthusiasts;
|
|
|
§
|
mission
critical servers and high end
workstations;
|
|
|
§
|
personal
computer (“PC”)
upgrades to extend the useable life of existing
PCs;
|
|
|
§
|
high
performance computing and scientific
computing;
|
|
|
§
|
video
and music editing;
|
|
|
§
|
home
theatre PCs and digital home convergence products;
and
|
|
|
§
|
digital
photography and digital image manipulation
computers.
|
We
perform the majority of our research and development efforts in-house, which
increases communication and collaboration between design teams, streamlines the
development process and reduces time-to-market.
We
commenced operations in 2002 and shares of our common stock began trading on AIM
in June 2006. On April 28, 2006, we amended our certificate of
incorporation to, among other matters, affect a 3 for 1 forward stock
split. In May 2007, we acquired PC Power and Cooling, Inc., a
privately-held manufacturer of PSUs that was based in San Diego,
California. We now offer both PC Power and Cooling, Inc. and OCZ
branded PSUs. In October 2007, we acquired substantially all of the
assets of Silicon Data Inc., doing business as Hypersonic PC Systems, a
privately-held manufacturer of high performance gaming PCs and laptops aimed at
the computer gaming community that was based in Great Neck, New
York. In March 2009, we amended our certificate of incorporation
primarily to increase the number of authorized shares and eliminate a number of
provisions which required us to comply with various United Kingdom laws in the
case of, among other things, takeovers and tender offers. On April 1,
2009, following appropriate stockholder approval, we voluntarily delisted our
common stock from trading on AIM. On January 14, 2010 our common
stock was listed on the OTCBB, and from February 10, 2010 to April 22, 2010, our
common stock was traded on the OTCBB. Since April 23, 2010, our
common stock has been traded on The NASDAQ Capital Market.
Our
fiscal years ended on December 31 from 2002 to 2006. Effective March
1, 2008, we changed our fiscal year end from December 31 to the last day of
February resulting in a 14-month period from January 1, 2007 to February 29,
2008. However, for comparison purposes throughout this report, the
twelve month period which began March 1, 2007 and ended February 29, 2008 has
been presented and is named “the fiscal year ended February 29,
2008.”
As of our
fiscal year ended February 28, 2010, we had 376 customers, most of which are
distributors or etailers in 69 countries.
For the
fiscal years ended February 28, 2010 and February 28, 2009, our net sales were
$144 million and $156 million, respectively and our net (loss) was $(13.5)
million and $(11.7) million, respectively.
In
September 2009, we sold all inventory, patents and other assets related to our
Neural Impulse Actuator product line to BCInet, Inc., a Delaware corporation, in
exchange for notes with principal amounts in the aggregate of $895,415 and
shares of BCInet, Inc.’s Series A preferred stock, representing a 27% equity
stake in BCInet, Inc. Also in September 2009, we amended our
certificate of incorporation to affect a 1 for 2.5 reverse stock
split. All share amounts in this document have been adjusted for the
effect of this reverse split.
38
Results of
Operations for Fiscal
Years Ended
February 28, 2010, February 28, 2009 and February 29, 2008
The
following table sets forth our financial results, as a percentage of net sales
for the periods indicated.
|
Year Ended
February 28/29,
|
||||||||||||
|
2010
|
2009
|
2008
|
||||||||||
|
(audited)
|
(audited)
|
(audited)
|
||||||||||
|
Revenue
|
||||||||||||
|
Sales
– net
|
100 | % | 100 | % | 100 | % | ||||||
|
Cost
of revenue
|
87.0 | 87.3 | 80.6 | |||||||||
|
Gross
Profit
|
13.0 | 12.7 | 19.4 | |||||||||
|
Expenses
|
||||||||||||
|
Sales
and marketing
|
7.1 | 7.3 | 7.7 | |||||||||
|
Research
and development
|
3.7 | 1.7 | 1.3 | |||||||||
|
General,
administrative and operations
|
10.3 | 10.7 | 9.9 | |||||||||
|
Impairment
of goodwill and intangible assets
|
0.6 | - | - | |||||||||
|
Total
operating expenses
|
21.7 | 19.7 | 18.9 | |||||||||
|
Operating
profit/(loss)
|
(8.7 | ) | (7.0 | ) | 0.5 | |||||||
|
Other
income/(expense)
|
||||||||||||
|
Other
income – net
|
0.5 | (0.1 | ) | 0.2 | ||||||||
|
Interest
and financing costs
|
(1.2 | ) | (0.4 | ) | (0.2 | ) | ||||||
|
Total
other income/(expense)
|
(0.7 | ) | (0.5 | ) | 0.0 | |||||||
|
Profit/(Loss)
before tax
|
(9.4 | ) | (7.5 | ) | 0.4 | |||||||
|
Tax
(expense) benefit
|
- | - | 0.8 | |||||||||
|
Net
profit/(loss)
|
(9.4 | )% | (7.5 | )% | 1.2 | % | ||||||
Comparison
of Fiscal Years Ended February 28, 2009 and February 28, 2010
Net sales. Net
sales decreased by $12.0 million, or 7.7%, from $155.9 million in fiscal
year ended February 28, 2009 to $143.9 million in fiscal year ended February 28,
2010. This decrease was due primarily to several
factors. Overall, there was a 25% decrease, in the aggregate, of unit
sales across all product lines from 3.4 million units in fiscal year ended
February 28, 2009 to 2.6 million units in fiscal year ended February 28,
2010. Memory processing unit sales decreased from fiscal year
ended February 28, 2009 to fiscal year ended February 28, 2010 by
34%. This was partially offset by a 3.4% increase in the average
selling price per units of these products. Power supply unit sales
remained flat from fiscal year ended February 28, 2009 to fiscal year ended
February 28, 2010, while the average selling prices of our power supply units
fell 13.3% over the same period. Decreases in memory processing and
power supply unit sales were partially offset by a 194% increase in SSD units
sold from fiscal year ended February 28, 2009 to fiscal year ended February 28,
2010 coupled with an increase in the average selling price per SSD units of 14%
over the same period. In general, the decrease in unit sales was the
result of working capital constraints which prohibited us from buying
sufficient raw materials necessary to fulfill the demand for our products.
Cost of
revenue. Cost of revenue decreased by $10.9 million, or 8.0%,
from $136.2 million in fiscal year ended February 28, 2009 to $125.3 million in
fiscal year ended February 28, 2010. Cost of revenue as a percentage
of net sales was 87.3% in fiscal year ended February 28, 2009 compared to 87.0%
in fiscal year ended February 28, 2010. The decrease in absolute
dollars of cost of sales was attributable to the decrease in net
sales. The lower cost of revenues as a percentage of net sales in
fiscal year ended February 28, 2010 was driven by slightly higher average sales
prices.
39
Cost of
revenue does not include any stock-based compensation expense for fiscal year
ended February 28, 2009 and fiscal year ended February 28, 2010.
Sales and marketing
expenses. Sales and marketing expenses decreased by $1.2
million, or 10.1%, from $11.4 million in fiscal year ended February 28, 2009 to
$10.2 million in fiscal year ended February 28, 2010. Sales and
marketing expenses were 7.3% and 7.1% of net sales in fiscal year ended February
28, 2009 and 2010, respectively. The decrease in absolute dollars was
primarily due to a decrease in the sales and marketing programs necessary
to support the lower sales volume.
Sales and
marketing expenses include stock-based compensation expense of $287,000 and
$166,000 for fiscal year ended February 28, 2009 and fiscal year ended February
28, 2010, respectively.
Research and development
expenses. Research and development expenses increased by $2.7
million, or 107.0% from $2.6 million in fiscal year ended February 28, 2009 to
$5.3 million in fiscal year ended February 28, 2010. Research and
development expenses were 1.7% and 3.7% of net sales in fiscal year ended
February 28, 2009 and 2010, respectively. The increase in absolute
dollars was primarily due to additional resources being used in the development
of our SSD products.
Research
and development expenses include stock-based compensation expense of $130,000
and $184,000 for fiscal year ended February 28, 2009 and fiscal year ended
February 28, 2010, respectively.
General, administrative and
operations expenses. General, administrative and operations
expenses decreased by $1.9 million, or 11.9%, from $16.7 million in fiscal year
ended February 28, 2009 to $14.7 million in fiscal year ended February 28,
2010. General, administrative and operations expenses remained
relatively flat as a percentage of net sales at 10.7% and 10.2%,
respectively. The decrease in absolute dollars was primarily due to
$1.3 million of lower shipping costs because of lower sales volume and $991,000
of lower bad debt expenses, partially offset by a $264,000 increase in
contractor costs.
General
and administrative expenses include stock-based compensation expenses of
$461,000 and $313,000 for fiscal year ended February 28, 2009 and February 28,
2010, respectively.
Impairment of goodwill and
intangible assets. In February 2010, we stopped the
manufacture and sale the Hypersonic PC Systems products which we purchased from
Silicon Data in 2007. Therefore, the $911,000 carrying value of goodwill
and related intangibles recorded from that acquisition were determined to be
fully impaired and were written off in their entirety.
Other
income/(expense)-net. Other expense-net increased by $220,000
or 28.6% from $668,000 in fiscal year ended February 28, 2009 to $989,000 in
fiscal year ended February 28, 2010. Included in the total is
$600,000 and $1.7 million, respectively, of interest expense. The
increase in interest expense was primarily due to the higher interest rates
charged on borrowed funds payable under our new credit facilities which began in
August 2009 coupled with higher borrowing amounts. The increase in
interest expense in the period was partially offset by a $668,000 increase in
other gains relating to the sale of the NIA product line in fiscal year ended
February 28, 2010.
Provision for income
taxes. The income tax provision/(benefit) amounted to $61,000
in fiscal year ended February 28, 2009 and ($1,000) in fiscal year ended
February 28, 2010 We did not record a tax benefit at the statutory combined
federal and state income tax rates of approximately 40% due to the uncertainty
surrounding the future realization of the potential tax benefit associated with
net operating loss carryforwards.
Comparison
of Fiscal Years Ended February 29, 2008 and February 28, 2009
Net sales. Net
sales increased by $37.6 million, or 31.8%, from $118.3 million in fiscal
year ended February 29, 2008 to $155.9 million in fiscal year ended
February 28, 2009. This was due primarily to a 62% increase in unit
sales from 2.1 million units in fiscal year ended February 29, 2008 to 3.4
million units in fiscal year ended February 28, 2009. Sales of memory
processing units increased by 32% and power supplies increased by 95% during
this period. However, these unit increases were partially offset by
decreases in average per-unit selling prices of approximately 20% for memory
processing products and 23% for power supplies. Sales of flash memory
storage units increased by 242% and average selling prices increased by 38% from
fiscal year ended February 28, 2009 to fiscal year ended February 28, 2010.
The flash growth was partially due to the introduction of solid state
drives as without them, the unit growth would have been approximately 215% while
average selling prices would have decreased by 8%. In general, the growth
in unit volumes was primarily due to the introduction and growth of our new
products coupled with the continued expansion of our sales channels outside of
North America.
40
Cost of revenue. Cost
of revenue increased by $40.8 million, or 42.7%, from $95.4 million in fiscal
year ended February 29, 2008 to $136.2 million in fiscal year ended February 28,
2009. Cost of revenue as a percentage of net sales was 80.6% in
fiscal year ended February 29, 2008 and 87.3% in fiscal year ended February 28,
2009. The increase in absolute dollars of cost of sales was
attributable to the increase in net sales. The higher cost of revenues as
a percentage of net sales in fiscal year ended February 28, 2009 was driven by
lower average selling prices of products due to falling prices of memory
components.
Cost of
revenue does not include any stock-based compensation expense for fiscal year
ended February 29, 2008 and fiscal year ended February 28, 2009.
Sales and marketing expenses.
Sales and marketing expenses increased by $2.3 million, or 24.9%, from
$9.1 million in fiscal year ended February 28, 2009 to $11.4 million in fiscal
year ended February 28, 2010. Sales and marketing expenses were 7.7%
and 7.3% of net sales for the fiscal year ended February 29, 2008 and fiscal
year ended February 28, 2009, respectively. The increase in absolute
dollars was primarily due to an increase in the sales and marketing programs
necessary to support the higher sales volume.
Sales and
marketing expenses include stock-based compensation expense of $272,000 and
$287,000 for fiscal year ended February 29, 2008 and fiscal year ended February
28, 2009, respectively.
Research and development
expenses. Research and development expenses increased by $1.0
million, or 64.0%, from $1.6 million in fiscal year ended February 29, 2008 to
$2.6 million in fiscal year ended February 28, 2009. Research and
development expenses were 1.3% and 1.7% of net sales for the fiscal year ended
February 29, 2008 and fiscal year ended February 28, 2009, respectively.
The increase in absolute dollars was primarily due to an increase of
$552,000 in salary and benefits resulting from growth in research and
development personnel and an increase of $217,000 in development costs
associated with new products. The increase in personnel was primarily
related to expanded product development initiatives.
Research
and development expenses include stock-based compensation expense of $99,000 and
$130,000 for fiscal year ended February 29, 2008 and fiscal year ended February
28, 2009, respectively.
General, administrative and operations
expenses. General, administrative and operations expenses increased
by $5.0 million, or 42.7%, from $11.7 million in fiscal year ended February 29,
2008 to $16.7 million in fiscal year ended February 28,
2009. General, administrative and operations expenses were 9.9% and
10.7% of net sales for the fiscal year ended February 29, 2008 and fiscal year
ended February 28, 2009, respectively. The increase in absolute
dollars was primarily due to an increase of $938,000 in salary and benefits, an
increase of $1.6 million in shipping costs due to increased sales volume, an
increase of $296,000 in facility expenses, an increase of $479,000 in
professional and legal fees, an increase of $134,000 in depreciation expenses
and an increase of $1.3 million in bad debt expense primarily related to a
single customer.
General
and administrative expenses include stock-based compensation expenses of
$452,000 and $461,000 for fiscal year ended February 29, 2008 and fiscal year
ended February 28, 2009, respectively.
Other
income/(expense)-net. Other expense-net increased by $736,000
from $33,000 in fiscal year ended February 29, 2008 to ($769,000) in fiscal year
ended February 28, 2009. Included in the total is interest expense of
$289,000 and $600,000, respectively. The increase in interest expense
was primarily due to higher borrowing levels to support the working capital
needs associated with the increased revenue levels in fiscal year ended February
28, 2009 as compared to fiscal year ended February 29, 2008.
41
Provision for income
taxes. The income tax provision (benefit) amounted to
($936,000) in fiscal year ended February 29, 2008 and $61,000 in fiscal
year ended February 28, 2009. The effective tax rates of 186% in
fiscal year ended February 29, 2008 and (0.5%) in fiscal year ended February 28,
2009 reflect the estimated tax benefit of net operating loss carry forwards and
other deferred taxes, net of valuation allowances.
Liquidity
and Capital Resources
Since our
inception, we have historically not generated cash from operations and have
relied upon funds from equity offerings and debt financing.
Operating Activities.
Net cash provided (used) by operating activities was ($9.9) million, ($1.0)
million and $640,000 for fiscal year ended February 29, 2008, fiscal year ended
February 28, 2009 and fiscal year ended February 28, 2010,
respectively. Net cash used by operating activities during fiscal year
ended February 29, 2008 was due primarily to increases in inventories of
$10.5 million, in accounts receivable of $7.4 million, and in prepaid
expenses of $2.1 million, partially offset by an increase in accounts
payable of $7.6 million, and net income of $1.4 million. Net
cash used by operating activities during fiscal year ended February 28, 2009 was
due primarily to increases in accounts payable of $12.3 million and prepaid
expenses of $974,000 partially offset by an increase in accounts receivable of
$3.5 million and inventory of $1.9 million. Net cash provided by
operating activities during fiscal year ended February 28, 2010 was due
primarily to an increase in accounts payable of $924,000, a decrease in
inventories of $6.6 million, a decrease in accounts receivable of
$3.6 million, a decrease in accrued expenses of $573,000 and a decrease in
prepaid expenses of $301,000, partially offset by a non-cash gain on disposition
of the NIA product line of $668,000 and a net loss of $13.5 million. The
decreases in accounts receivable and inventory in fiscal year ended February 28,
2010 was primarily due to lower sales levels while the increase in accounts
payable was due to us paying vendors later because of working capital
constraints. The increases in accounts receivable and inventory in fiscal
year ended February 29, 2008 and fiscal year ended February 28,
2009 were primarily due to higher sales levels, while increases in accounts
payable was due to the ability to negotiate longer payment terms and an increase
in the sales mix of power supplies which have longer payment
terms. Due to the $15.4 million which we raised in March 2010,
we anticipate that accounts receivable, inventory and accounts payable will
increase because we have additional working capital to grow our product line and
our business.
Investing activities.
Net cash used by our investing activities was $9.3 million, $2.2 million and
$1.3 million for fiscal year ended February 29, 2008, fiscal year ended February
28, 2009 and fiscal year ended February 28, 2010, respectively. Of these
amounts, $1.5 million, $1.6 million and $887,000, respectively, were related to
the purchase of fixed assets including those needed to support our growth and
establishment of a warehouse and manufacturing facility in Taiwan.
In fiscal year ended February 29, 2008, we used $7.8 million for the
acquisitions of PC Power and Cooling, Inc. and Silicon Data Inc., doing business
as Hypersonic PC Systems. The expansion of our manufacturing capability
has to date not been capital intensive as our internal manufacturing has
historically been limited to assembly and test while board level assembly
was outsourced. In August 2008, we acquired our first surface mount
technology (“SMT”) line
as a beginning initiative to move memory module manufacturing in-house. We
expect to make additional capital investments in the future to expand this
in-house manufacturing as well as our assembly and test capabilities. We
will also invest in our infrastructure in order to improve our controls and
procedures as part of growing our business and meeting regulatory requirement
associated with being a public company.
Financing activities.
Net cash provided by our financing activities was $19.9 million, $2.4 million
and $1.5 million for fiscal year ended February 29, 2008, fiscal year ended
February 28, 2009 and fiscal year ended February 28, 2010,
respectively. Cash provided by financing activities in fiscal year ended
February 29, 2008 was primarily from common stock offerings on AIM in accordance
with Regulation S of approximately $15.5 million in May 2007 as well as
increases in bank loans of $3.9 million. Cash provided by financing
activities in fiscal year ended February 28, 2009 was primarily due to
increases in bank loans of $2.5 million. Cash provided by financing
activities in fiscal year ended February 28, 2010 was primarily due to common
stock and preferred stock issuances of $7,000 and $281,000, respectively, as
well as increases in bank loans of $919,000 and $500,000 borrowings from Ryan M.
Petersen, our Chief Executive Officer, made to us in fiscal year ended February
28, 2010. In March 2010, we issued an aggregate of 5,151,662 shares of our
common stock at $3.00 per share in connection with a private placement, whereby
we received gross proceeds of $15.45 million. As part of the private
placement offering, we also issued warrants to purchase up to (i) 2,575,831
shares of our common stock at $5.25 per share and (ii) 154,550 shares of our
common stock at $3.00 per share.
42
Other factors affecting liquidity
and capital resources.
We have
historically not generated cash from operations and have relied upon equity
offerings and debt financing such as receivable factoring, increased trade terms
from vendors, and bank lines of credit as we have grown. In July 2009, we
entered into a Sale of Accounts and Security Agreement with Faunus Group
International, Inc, pursuant to which we may factor our foreign receivables up
to $10 million in the aggregate (as amended, the “FGI
Agreement”). Additionally, in July 2009, we entered into a Loan and
Security Agreement with Silicon Valley Bank (as amended, the “SVB
Agreement” and collectively with the FGI Agreement, the “Factoring Loan
Agreements”) to factor all our domestic receivables up to $10 million in
the aggregate. The SVB Loan Agreement caps the aggregate debt under both
Factoring Loan Agreements to $17.5 million. Under the Factoring Loan
Agreements we have guaranteed our obligations thereunder and have pledged
substantially all of our assets as security. As of February 28, 2010, the
outstanding loan balances under the Factoring Loan Agreement were $10.4 million
in the aggregate.
Under the
SVB Agreement, we can borrow an amount up to 75% of the value of our approved
factored customer invoices. Interest is payable monthly on the
aggregate of the face amounts of the unpaid factored customer invoices each
month. SVB also charges a monthly collateral handling fee based upon
the unpaid factored customer invoices each month. The rate of
interest and the amount of the collateral handling fee is dependent upon our
Quick Ratio which is defined for this purpose as our cash, marketable securities
and accounts receivable divided by our current liabilities. If our Quick Ratio
is greater than 0.75:1.00 in any month, the applicable interest rate is SVB
Prime plus 2.25% per annum and the collateral handling fee is
0.10%. If our Quick Ratio is less than 0.75:1.00 in any month, the
applicable interest rate is SVB Prime plus 2.75% per annum and the collateral
handling fee is 0.45%. The SVB Agreement requires a minimum Quick
Ratio of 0.50:1.00. Receivables are subject to recourse in the event
of nonpayment by the customer.
Under the
FGI Agreement, we can borrow an amount up to 75% of the value of its approved
factored customer invoices. Interest is payable each month on the
aggregate of the face amounts of the unpaid factored customer invoices at a rate
greater of 8.00% per annum or 3.00% above the rate of interest designated by FGI
as its selected “Prime Rate” or “Base Rate”, as the case may be (currently based
upon the Wall Street Journal, Money Rates Section). Additionally, FGI
charges a collateral management fee equal to 0.58% of the average monthly
balance of the face amount of the outstanding unpaid factored customer
invoices. If we fail to maintain minimum monthly borrowings of at
least $2.5 million, FGI will assess a deficiency charge in an amount equal to
charges that would apply had we maintained a $2.5 million borrowing minimum for
the applicable month less the actual charges paid for such month. FGI
has the option under the FGI Agreement of buying customer invoices without
recourse. To date, FGI has not done so and we do not anticipate that
it will do so. Receivables are subject to recourse in the event of
nonpayment by the customer.
In order
to provide some bridge financing as these new financing arrangements were
established, in August 2009 we borrowed $500,000 from our Chief Executive
Officer, Ryan M. Petersen, at 7.5% interest per annum. The loan is
repayable in equal installments in February 2010 and September 2010. Even
though the first installment of the loan to Mr. Petersen was due in February,
Mr. Petersen waived payment until April 2010, at which time he was paid the
first installment amount plus interest accrued through April
2010. Also, we may incur additional debt in the future, subject to
certain limitations contained in our debt instruments.
We expect
to experience growth in our working capital requirements as we continue to
expand our business. We cannot assure that we will find additional debt or
equity financing allowing us to grow. We intend to fund this continued
expansion through cash generated by operations, increased debt facilities, and
proceeds from any equity offerings. We anticipate that working capital
will constitute a material use of our cash resources.
43
The SVB
Agreement was a result of renegotiation with Silicon Valley Bank and replaced
our prior agreement with them. Since we entered into this new agreement,
we have not failed to comply with any of its requirements. However, under
our prior agreement, we had certain measures of financial performance that we
were required to meet and, on occasion, with which we were unable to
comply. In February through May of 2009, we did not meet a minimum
required threshold as set forth in the original Silicon Valley Bank agreement
for a financial performance ratio called a ‘quick ratio’ which is the ratio of
our cash, marketable securities and accounts receivable divided by our
liabilities, and Silicon Valley Bank granted us a waiver for these months.
In addition, in May 2009, we did not meet a threshold requirement for a minimum
amount of earnings before interest, taxes, depreciation and amortization (“EBITDA”)
and Silicon Valley Bank also granted us a waiver in this instance as well.
Although the ‘quick ratio’ test remains in our current SVB Agreement, this
agreement does not contain a requirement of a minimum amount of
EBITDA.
The SVB
Agreement also has a number of other requirements, also called covenants, with
which we are required to comply, including among other things:
|
|
§
|
delivery
of monthly and annual financial
statements;
|
|
|
§
|
tax,
deposit account and insurance
requirements;
|
|
|
§
|
restrictions
on our ability to complete dispositions, debt incurrence, distributions,
investments, liens, mergers and acquisitions;
and
|
|
|
§
|
certain
financial covenants that are tested on a monthly
basis.
|
The FGI
Agreement has a number of covenants with which we are required to comply,
including among other things:
|
|
§
|
delivery
of monthly and annual financial
statements;
|
|
|
§
|
giving
notice if we have a material adverse change and under other circumstances;
and
|
|
|
§
|
restrictions
on our ability to complete dispositions, debt incurrence, distributions,
investments and other liens.
|
Our
long-term future capital requirements will depend on many factors, including our
level of revenues, the timing and extent of spending to support our product
development efforts, the expansion of sales and marketing activities, the timing
of our introductions of new products, the costs to ensure access to adequate
manufacturing capacity and the continuing market acceptance of our
products. We could be required, or could elect, to seek additional
funding through public or private equity or debt financing and additional funds
may not be available on terms acceptable to us or at all.
There is
no assurance that we will not become out of compliance with one or more
covenants of our Factoring Loan Agreements in the future. If we dare
in violation of covenants in the Factoring Loan Agreements and do not receive a
waiver, the lender could choose to accelerate payment effectively causing all
loan balances to become due.
Off-Balance Sheet
Arrangements
We do not
have any off-balance sheet arrangements.
Contractual
Obligations
The
following table summarizes our outstanding contractual obligations as of
February 28, 2010:
Payments due by
period
|
(in thousands)
|
Total
|
Less
than 1
year
|
1-3
years
|
3-5
years
|
More
than 5
years
|
|||||||||||||||
|
Long-term
debt obligations
|
$ | 500 | $ | 500 | $ | - | $ | - | $ | - | ||||||||||
|
Operating
lease obligations
|
$ | 1,002 | $ | 667 | $ | 335 | - | - | ||||||||||||
|
Total
|
$ | 1,502 | $ | 1,167 | $ | 335 | $ | - | $ | - | ||||||||||
44
Inflation
Inflation
was not a material factor in either revenue or operating expenses during our
fiscal year ended February 28, 2010.
Critical
Accounting Policies and Estimates
Our
discussion and analysis of our financial condition and results of operations are
based upon our consolidated financial statements, which have been prepared in
accordance with accounting principles generally accepted in the United States of
America (“GAAP”). The
preparation of these financial statements requires us to make estimates and
judgments that affect the reported amount of assets and liabilities and
disclosure of contingent assets and liabilities at the date of the financial
statements and the reported amount of revenues and expenses for each
period. Information with respect to our critical accounting policies
which we believe could have the most significant effect on our reported results
and require subjective or complex judgments is contained in the notes to the
consolidated financial statements in this report for the fiscal year ended
February 28, 2010.
We
believe the following are our most critical accounting policies as they require
our more significant judgments in the preparation of our financial
statements.
Revenue
recognition. We record all of our product sales net of
allowances for returns, product rebates, sales credits, and market development
funds. We recognize revenue when there is persuasive evidence of an
arrangement, product shipment by a common carrier has occurred, risk of loss has
passed, the terms are fixed and collection is probable. We generally
use customer purchase orders and/or contracts as evidence of an arrangement and
the underlying payment terms to determine if the sales price is
fixed. We also purchase credit insurance for the majority of our
accounts.
We offer
certain customers limited product return rights. To estimate reserves
for future sales returns, we regularly review our history of actual returns and
monitor the inventory levels of our customers. Reserves for future
returns are adjusted as necessary, based on returns experience, future
expectations and communication with our customers.
Probability
of collection is assessed for each customer as it is subjected to a credit
review process that evaluates its financial position, ability to pay, and the
potential coverage by our credit insurer. If it is determined from
the outset of an arrangement that collection is not probable, the customer is
required to pay cash in advance of shipment. We provide for price
protection credits on a case-by-case basis after assessing the market
competition and product technology obsolescence. These credits are
recorded as a reduction to revenue at the time we reduce the product
prices.
Marketing cooperative
arrangements. We have arrangements with resellers of our
products to reimburse the resellers for cooperative marketing costs meeting
specified criteria. In certain arrangements, we record advertising
costs meeting specified criteria within sales and marketing expenses in the
accompanying consolidated statements of operations. For those
reimbursements that do not meet the criteria for advertising costs, the amounts
are recorded as a reduction to sales in the accompanying consolidated statements
of operations.
Product
warranties. We offer our customers warranties on certain
products sold to them. These warranties typically provide for the
replacement of its products if they are found to be faulty within a specified
period. Concurrent with the sale of products, a provision for
estimated warranty expenses is recorded with a corresponding increase in cost of
goods sold. The provision is adjusted periodically based on
historical and anticipated experience. Actual expense of replacing
faulty products under warranty, including parts and labor, are charged to this
provision when incurred.
45
Inventory. Inventory
is valued at the lower of cost or market value with cost being valued using the
average cost method. Inventory consists of raw materials, work in
progress and finished goods. We write down inventory for slow moving
and obsolete inventory based on assessments of future demands and market
conditions.
Income taxes. We
account for income taxes using an asset and liability approach, which requires
us to recognize deferred tax assets and liabilities for the expected future tax
consequences of events that have been recognized in a company’s financial
statements or tax returns. Under this method, deferred tax assets and
liabilities are determined based on the difference between the financial
information’s carrying amounts and tax basis of assets and liabilities using the
enacted tax rates. In addition, a valuation allowance is established
to reduce any deferred tax asset for which it is determined that it is more
likely than not that some portion of the deferred tax asset will not be
realized. Our Canadian subsidiary pays taxes in Canada. We
do not file consolidated tax returns.
Goodwill and Other
Intangibles. We review goodwill for impairment annually or
more frequently whenever events or changes in circumstances indicate its
carrying value may not be recoverable.
There are
two steps in assessing whether impairment of goodwill and other indefinite lived
intangible assets has occurred The first step compares the carrying
amount of the net assets (including goodwill), to the reporting unit’s fair
value (OCZ comprises a single reporting unit). If OCZ’s fair value
exceeds the carrying amount of OCZ’s net assets, goodwill is not considered to
be impaired and the second step of the impairment test is not
required. If the carrying amount of OCZ’s net assets exceeds OCZ’s
fair value, the second step of the impairment test is undertaken to measure the
amount of impairment loss, if any. In determining OCZ’s fair value
consideration is first given to quoted market prices of OCZ’s stock and, where
this is not available, the estimate of OCZ’s fair value will be based upon the
best information available and consideration of other valuation
techniques. The second step, if necessary, is used the measure the
amount of impairment loss by comparing the implied fair value of OCZ’s goodwill
with the carrying amount of that goodwill. An impairment loss is
recognized to the extent the carrying amount of OCZ’s goodwill exceeds the
implied fair value of that goodwill. The implied fair value of
goodwill is determined by allocating OCZ’s fair value in a manner similar to a
purchase price allocation in a business combination. The residual
fair value after this allocation is OCZ’s implied fair value of
goodwill.
Once a
goodwill impairment loss is recognized, the adjusted carrying amount of goodwill
shall be the new accounting basis and there is no subsequent reversal of
previously recognized goodwill impairment loss in future years.
Determining
the fair value of a reporting unit involves the use of significant estimates and
assumptions. These estimates and assumptions include revenue growth
rates and operating margins used to calculate projected future cash flows,
risk-adjusted discount rates, future economic and market conditions and
determination of appropriate market comparables. We base our fair
value estimates on assumptions we believe to be reasonable but that are
unpredictable and inherently uncertain. Actual future results may
differ from those estimates.
Our most
recent annual goodwill impairment analysis, which was performed during the
fourth quarter of fiscal year ended February 28, 2010, did not result in an
impairment charge with respect to our acquisition of the assets of PC Power
& Cooling in 2007 since the fair values exceeded the carrying values by
amounts of 5% to 40%, nor did we record any goodwill or intangible asset
impairments in prior fiscal periods. We stopped the manufacture and
sale of certain Hypersonic PC products which were purchased in
2007. Therefore, all goodwill related to that acquisition was deemed
fully impaired and written off.
Stock-based
compensation.
On
January 1, 2006 we adopted FASB Accounting Standards Codification (“ASC”) 718,
Accounting for Stock-Based Compensation using the modified prospective
application method. Under this method, compensation cost recognized
for the fiscal years ended February 28, 2010, February 28, 2009 and February 29,
2008, included: (a) compensation cost for all share-based payments granted prior
to, but not yet vested as of January 1, 2006, based on the grant-date fair value
estimated in accordance with the original provisions of ASC 718, and (b)
compensation cost for all share-based payments granted subsequent to January 1,
2006, based on the grant-date fair value estimated in accordance with the
provisions of ASC 718.
46
Since our
stock-based compensation plan was established in December 2004, all options have
been issued at or above the estimated fair market value so that there is no
intrinsic value to be expensed. Stock based compensation charged to
expenses was $663,000, $877,000 and $722,000 for the fiscal years ended February
28, 2010, February 28, 2009 and February 29, 2008, respectively. As
of our fiscal year ended February 28, 2010, compensation costs related to non
vested awards amounted to approximately $1.3 million and will be recognized in
the periods to February 29, 2014 over a weighted average term of
15.5 months.
The fair
value of options grants was determined using the Black-Scholes option pricing
model with the following weighted average assumptions:
|
Fiscal Year Ended
|
Fiscal Year Ended
|
Fiscal Year Ended
|
||||||||||
|
February 28, 2010
|
February 28, 2009
|
February 29, 2008
|
||||||||||
|
Expected
dividend
|
0 | % | 0 | % | 0 | % | ||||||
|
Risk
free interest rate
|
2.0 | % | 2.8 | % | 4.7 | % | ||||||
|
Expected
volatility
|
0.58 | 0.40 | 0.37 | |||||||||
|
Expected
life (in years)
|
4.28 | 4.24 | 4.28 | |||||||||
New
Accounting Pronouncements
In June
2009, the FASB issued the Accounting Standards Codification ("Codification"),
which became the single source of authoritative non-governmental Generally
Accepted Accounting Principles. The Codification does not change
Generally Accepted Accounting Principles, but instead introduces a new structure
that combines all authoritative standards into a comprehensive,
topically-organized online database. All references to the
authoritative accounting literature in our financial statements are referenced
in accordance with the Codification. There were no material changes
to the financial statements as a result of implementing the
Codification.
In May
2009, we adopted FASB ASC 855, Subsequent
Events. ASC 855 establishes general standards of accounting
for and disclosure of events that occur after the balance sheet date but before
the financial statements are issued or are available to be
issued. ASC 855 provides guidance on the period after the balance
sheet date during which management of a reporting entity should evaluate events
or transactions that may occur for potential recognition or disclosure in the
financial statements, the circumstances under which an entity should recognize
events or transactions occurring after the balance sheet date in its financial
statements and the disclosures that an entity should make about events or
transactions that occurred after the balance sheet date. The
statement was effective for OCZ during the fiscal year ended February 28,
2010.
In
February 2010, the FASB issued a new accounting standards update that eliminated
the requirement for an entity that is an SEC filer to disclose the date through
which subsequent events have been evaluated in its financial statement
disclosures. This new accounting standards update is effective upon
release. The adoption of the new accounting standards update did not
have a material impact on our consolidated results of operations, financial
condition or financial disclosures.
In
January 2010, the FASB issued a new accounting standards update for fair value
measurements and disclosures. A reporting entity should disclose
separately the amounts of significant transfers in and out of Level 1 and Level
2 and describe the reasons for the transfers. A reporting entity
should separately disclose information about purchases, sales, issuances and
settlements for Level 3 reconciliation disclosures. The new
disclosures and clarifications of existing disclosures are effective for
financial statements issued interim or annual financial periods ending after
December 15, 2009, with the exception for the reconciliation disclosures for
Level 3, which are effective for financial statements issued interim or annual
financial periods ending after December 15, 2010. The adoption of the new
accounting standards update did not have a material impact on our consolidated
results of operations, financial condition or financial
disclosures.
47
|
Item
7A.
|
Quantitative
and Qualitative Disclosures about Market
Risk
|
Foreign
Currency Exchange Risk
Although
the functional currency of our foreign offices is their local currency, we bill
almost all of our sales for our products in U.S.
dollars. Accordingly, our results of operations and cash flows are
subject to a limited extent to fluctuations due to changes in foreign currency
exchange rates. In the event our foreign sales and expenses increase,
and we also increase our sales denominated in currencies other than U.S.
dollars, our operating results may be more affected by fluctuations in the
exchange rates of other currencies. The volatility of applicable
rates is dependent on many factors that we cannot forecast with reliable
accuracy. At this time we do not, but we may in the future, invest in
derivatives or other financial instruments in an attempt to hedge our foreign
currency exchange risk.
Interest
Rate Sensitivity
Interest
income and expense are sensitive to changes in the general level of U.S.
interest rates. However, because our interest income historically has
been negligible, we believe that there is no material risk of
exposure.
48
|
Item
8.
|
Financial
Statements and Supplementary Data
|
|
Index to Consolidated Financial Statements of OCZ
Technology Group, Inc.
|
|
|
Page
|
|
|
Reports
of Independent Registered Public Accountants
|
50
|
|
Consolidated
Statements of Operations
|
52
|
|
Consolidated
Balance Sheets
|
53
|
|
Consolidated
Statements of Stockholders’ Equity and Comprehensive Loss
|
54
|
|
Consolidated
Statements of Cash Flows
|
55
|
|
Notes
to Consolidated Financial Statements
|
56
|
49
REPORT
OF INDEPENDENT REGISTERED PUBLIC ACCOUNTING FIRM
To the
Board of Directors and Stockholders
OCZ
Technology Group, Inc.
We have
audited the accompanying consolidated balance sheet of OCZ Technology Group,
Inc. and Subsidiaries (the “Company”) as of February 28, 2010, and the related
consolidated statements of operations, stockholders’ equity and comprehensive
income (loss), and cash flows for the year then ended. These financial
statements are the responsibility of the Company’s management. Our
responsibility is to express an opinion on these financial statements based on
our audit.
We
conducted our audit in accordance with the standards of the Public Company
Accounting Oversight Board (United States). Those standards require that we plan
and perform the audit to obtain reasonable assurance about whether the financial
statements are free of material misstatement. The Company is not required to
have, nor were we engaged to perform, an audit of its internal control over
financial reporting. Our audit included consideration of internal control over
financial reporting as a basis for designing audit procedures that are
appropriate in the circumstances, but not for the purpose of expressing an
opinion on the effectiveness of the Company’s internal control over financial
reporting. Accordingly, we express no such opinion. An audit includes examining,
on a test basis, evidence supporting the amounts and disclosures in the
financial statements. An audit also includes assessing the accounting principles
used and significant estimates made by management, as well as evaluating the
overall financial statement presentation. We believe that our audit provides a
reasonable basis for our opinion.
In our
opinion, the financial statements referred to above present fairly, in all
material respects, the consolidated financial position of the Company as of
February 28, 2010, and the consolidated results of their operations and
their cash flows for the year then ended, in conformity with accounting
principles generally accepted in the United States of America.
Crowe
Horwath LLP
Sherman
Oaks, California
May 20,
2010
50
Report
of the Independent Registered Public Accounting Firm
To the
Board of Directors and Stockholders
OCZ
Technology Group, Inc.
We have
audited the accompanying consolidated balance sheet of OCZ Technology Group Inc
(“OCZ”) as of February
28, 2009, and the related consolidated statements of operations, stockholders’
equity and comprehensive income (loss), and cash flows for the 12 months ended
February 28, 2009 and 12 months ended February 29, 2008. These
financial statements and financial statement schedule are the responsibility of
our management. Our responsibility is to express an opinion on these
financial statements and financial statement schedule based on our
audits.
We
conducted our audits in accordance with the standards of the Public Company
Accounting Oversight Board (United States). Those standards require
that we plan and perform the audits to obtain reasonable assurance about whether
the financial statements are free of material misstatement. We are
not required to have, nor were we engaged to perform, an audit of its internal
control over financial reporting. Our audit included consideration of
internal control over financial reporting as a basis for designing audit
procedures that are appropriate in the circumstances, but not for the purpose of
expressing an opinion on the effectiveness of our internal control over
financial reporting. Accordingly, we express no such
opinion. An audit includes examining, on a test basis, evidence
supporting the amounts and disclosures in the financial statements. An audit
also includes assessing the accounting principles used and significant estimates
made by management, as well as evaluating the overall financial statement
presentation.
We
believe that our audits provide a reasonable basis for our opinion.
In our
opinion, the financial statements referred to above present fairly, in all
material respects, the consolidated financial position of OCZ as of February 28,
2009, and the consolidated results of its operations and its cash flows for the
12 months ended February 28, 2009 and 12 months ended February 29, 2008, in
conformity with U.S. generally accepted accounting principles.
Horwath
Clark Whitehill LLP
London,
United Kingdom
May 1,
2009
51
OCZ
technology Group, Inc.
Consolidated
Statements of Operations
($ in thousands, expect
for per share data)
|
Year Ended February 28/29
|
||||||||||||
|
2010
|
2009
|
2008
|
||||||||||
|
Net
revenues
|
$ | 143,959 | $ | 155,982 | $ | 118,352 | ||||||
|
Cost
of revenues
|
125,303 | 136,191 | 95,419 | |||||||||
|
Gross
profit
|
18,656 | 19,791 | 22,933 | |||||||||
|
Sales
and marketing
|
10,249 | 11,401 | 9,125 | |||||||||
|
Research
and development
|
5,331 | 2,575 | 1,570 | |||||||||
|
General,
administrative and operations
|
14,711 | 16,709 | 11,704 | |||||||||
|
Impairment
of goodwill and intangible assets
|
911 | - | - | |||||||||
|
Total
operating expenses
|
31,202 | 30,685 | 22,399 | |||||||||
|
Operating
income (loss)
|
(12,546 | ) | (10,894 | ) | 534 | |||||||
|
Other
income (expense) - net
|
727 | (169 | ) | 256 | ||||||||
|
Interest
and financing costs
|
(1,716 | ) | (600 | ) | (289 | ) | ||||||
|
Income
(loss) before income taxes
|
(13,535 | ) | (11,663 | ) | 501 | |||||||
|
Income
tax expense (benefit)
|
(1 | ) | 61 | (936 | ) | |||||||
|
Net
income (loss)
|
$ | (13,534 | ) | $ | (11,724 | ) | $ | 1,437 | ||||
|
Net
income (loss) per share:
|
||||||||||||
|
Basic
|
$ | (0.64 | ) | $ | (0.56 | ) | $ | 0.07 | ||||
|
Diluted
|
$ | (0.64 | ) | $ | (0.56 | ) | $ | 0.07 | ||||
|
Shares
used in per share computation:
|
||||||||||||
|
Basic
|
21,300 | 21,000 | 19,800 | |||||||||
|
Diluted
|
21,300 | 21,000 | 20,400 | |||||||||
See
accompanying notes to the Consolidated Financial Statements.
52
OCZ
technology Group, Inc.
Consolidated
Balance Sheets
($ in
thousands)
|
February 28, 2010
|
February 28, 2009
|
|||||||
|
ASSETS
|
||||||||
|
Current
Assets:
|
||||||||
|
Cash
and cash equivalents
|
$ | 1,224 | $ | 420 | ||||
|
Accounts
receivable, net of allowances of $2,853 and $2,279
|
20,380 | 23,995 | ||||||
|
Inventory,
net
|
9,846 | 16,787 | ||||||
|
Note
receivable
|
375 | - | ||||||
|
Deferred
tax asset, net
|
836 | 836 | ||||||
|
Prepaid
expenses and other assets
|
1,811 | 2,112 | ||||||
|
Total
current assets
|
34,472 | 44,150 | ||||||
|
Property
and equipment, net
|
2,629 | 2,855 | ||||||
|
Intangible
assets
|
88 | 268 | ||||||
|
Goodwill
|
9,954 | 10,342 | ||||||
|
Investment
|
668 | - | ||||||
|
Other
assets
|
38 | 88 | ||||||
|
Total
assets
|
$ | 47,849 | $ | 57,703 | ||||
|
LIABILITIES
AND STOCKHOLDERS' EQUITY
|
||||||||
|
Current
liabilities:
|
||||||||
|
Loans
payable
|
$ | 10,354 | $ | 9,435 | ||||
|
Notes
payable
|
500 | 200 | ||||||
|
Accounts
payable
|
26,318 | 25,394 | ||||||
|
Accrued
and other liabilities
|
4,389 | 3,751 | ||||||
|
Total
liabilities
|
41,561 | 38,780 | ||||||
|
Commitments
and contingencies
|
||||||||
|
Stockholders’
equity:
|
||||||||
|
Preferred
stock, $0.0025 par value; 20,000,000 shares authorized, 60,990 shares
issued and outstanding as of February 28, 2010 (none at February 28,
2009)
|
- | - | ||||||
|
Common
stock, $0.0025 par value; 120,000,000 shares authorized, 21,278,643 shares
issued and outstanding as of February 28, 2010 and 100,000,000 shares
authorized, 21,278,643 shares issued and outstanding as of February 28,
2009
|
53 | 53 | ||||||
|
Additional
paid-in capital
|
31,862 | 30,911 | ||||||
|
Accumulated
translation adjustment
|
(164 | ) | (112 | ) | ||||
|
Accumulated
deficit
|
(25,463 | ) | (11,929 | ) | ||||
|
Total
stockholders' equity
|
6,288 | 18,923 | ||||||
|
Total
liabilities and stockholders' equity
|
$ | 47,849 | $ | 57,703 | ||||
See
accompanying notes to the Consolidated Financial Statements.
53
OCZ
technology Group, Inc.
Consolidated
Statements of Changes in Stockholders’ Equity and Other Comprehensive
Loss
($ and
shares in thousands)
|
Preferred Stock
|
Common Stock
|
|||||||||||||||||||||||||||||||
|
Shares
Number
|
Shares
Amount
|
Shares
Number
|
Shares
Amount
|
Additional
Paid-in Capital
|
Accumulated
Other
Comprehensive
Income (Loss)
|
Accumulated
Deficit
|
Total
|
|||||||||||||||||||||||||
|
As
at March 1, 2007
|
- | $ | - | 17,405 | $ | 44 | $ | 11,108 | $ | (135 | ) | $ | (1,642 | ) | $ | 9,375 | ||||||||||||||||
|
Components
of comprehensive income:
|
||||||||||||||||||||||||||||||||
|
Net
income
|
- | - | - | - | - | - | 1,437 | 1,437 | ||||||||||||||||||||||||
|
Foreign
currency translation adjustment
|
- | - | - | - | - | 290 | - | 290 | ||||||||||||||||||||||||
|
Total
comprehensive income
|
155 | (205 | ) | 1,727 | ||||||||||||||||||||||||||||
|
Issuance
of common stock for acquisition
|
- | - | 249 | 1 | 1,975 | - | - | 1,976 | ||||||||||||||||||||||||
|
Issuance
of common stock
|
- | - | 2,651 | 6 | 15,251 | - | - | 15,257 | ||||||||||||||||||||||||
|
Capitalization
of promissory note
|
- | - | 232 | - | 500 | - | - | 500 | ||||||||||||||||||||||||
|
Exercise
of stock options and warrants
|
- | - | 328 | 1 | 235 | - | - | 236 | ||||||||||||||||||||||||
|
Stock
based compensation
|
- | - | - | - | 772 | - | - | 772 | ||||||||||||||||||||||||
|
Tax
effect of stock based compensation
|
- | - | - | - | (45 | ) | - | - | (45 | ) | ||||||||||||||||||||||
|
As
at February 29, 2008
|
- | - | 20,865 | 52 | 29,796 | 155 | (205 | ) | 29,798 | |||||||||||||||||||||||
|
Components
of comprehensive income:
|
||||||||||||||||||||||||||||||||
|
Net
Loss
|
- | - | - | - | - | - | (11,724 | ) | (11,724 | ) | ||||||||||||||||||||||
|
Foreign
currency translation adjustment
|
- | - | - | - | - | (267 | ) | - | (267 | ) | ||||||||||||||||||||||
|
Total
comprehensive income
|
(112 | ) | (11,929 | ) | (11,991 | ) | ||||||||||||||||||||||||||
|
Exercise
of stock options
|
- | - | 74 | - | 35 | - | - | 35 | ||||||||||||||||||||||||
|
Capitalization
of promissory note
|
- | - | 339 | 1 | 199 | - | - | 200 | ||||||||||||||||||||||||
|
Stock
based compensation
|
- | - | - | - | 877 | - | - | 877 | ||||||||||||||||||||||||
|
Tax
effect of stock based compensation
|
- | - | - | - | 4 | - | - | 4 | ||||||||||||||||||||||||
|
As
at February 28, 2009
|
- | - | 21,278 | 53 | 30,911 | (112 | ) | (11,929 | ) | 18,923 | ||||||||||||||||||||||
|
Components
of comprehensive income:
|
||||||||||||||||||||||||||||||||
|
Net
Loss
|
- | - | - | - | - | - | (13,534 | ) | (13,534 | ) | ||||||||||||||||||||||
|
Foreign
currency translation adjustment
|
- | - | - | - | - | (52 | ) | (52 | ) | |||||||||||||||||||||||
|
Total
comprehensive income
|
(164 | ) | (25,463 | ) | (13,586 | ) | ||||||||||||||||||||||||||
|
Adjustment
of exercise of stock options
|
- | - | - | - | 7 | - | - | 7 | ||||||||||||||||||||||||
|
Issuance
of preferred stock
|
61 | - | - | - | 281 | - | - | 281 | ||||||||||||||||||||||||
|
Stock
based compensation
|
- | - | - | - | 663 | - | - | 663 | ||||||||||||||||||||||||
|
As
at February 28, 2010
|
61 | $ | - | 21,278 | $ | 53 | $ | 31,862 | $ | (164 | ) | $ | (25,463 | ) | $ | 6,288 | ||||||||||||||||
See
accompanying notes to the Consolidated Financial Statements.
54
OCZ
technology Group, Inc.
Consolidated
Statements of Cash Flow
($ in
thousands)
|
Year
Ended February 28/29
|
||||||||||||
|
2010
|
2009
|
2008
|
||||||||||
|
Cash
flows from operating activities:
|
||||||||||||
|
Net
income (loss)
|
$ | (13,534 | ) | $ | (11,724 | ) | $ | 1,437 | ||||
|
Adjustments
to reconcile net income/(loss) to net cash flows from operating
activities:
|
||||||||||||
|
Depreciation
of property and equipment
|
1,009 | 744 | 468 | |||||||||
|
Amortization
of intangibles
|
111 | 112 | 56 | |||||||||
|
Impairment
of goodwill and intangible assets
|
911 | - | - | |||||||||
|
Bad
debt expense
|
644 | 1,410 | 299 | |||||||||
|
Stock-based
compensation
|
663 | 877 | 772 | |||||||||
|
Non-cash
write-off of leasehold improvements
|
104 | - | - | |||||||||
|
Non-cash
gain on disposition of product line
|
(668 | ) | - | - | ||||||||
|
Changes
in operating assets and current liabilities:
|
||||||||||||
|
Accounts
receivable
|
2,971 | (4,925 | ) | (7,726 | ) | |||||||
|
Inventory
|
6,566 | (1,960 | ) | (10,550 | ) | |||||||
|
Prepaid
expenses and other assets
|
301 | 974 | (2,142 | ) | ||||||||
|
Accounts
payable
|
924 | 12,361 | 7,637 | |||||||||
|
Deferred
tax asset, net
|
(716 | ) | ||||||||||
|
Accrued
and other liabilities
|
638 | 1,110 | 519 | |||||||||
|
Net
cash provided by (used in) operating activities
|
640 | (1,021 | ) | (9,946 | ) | |||||||
|
Cash
flows from investing activities:
|
||||||||||||
|
Purchases
of property and equipment
|
(887 | ) | (1,659 | ) | (1,546 | ) | ||||||
|
Decrease
(increase) in deposits
|
50 | (23 | ) | 44 | ||||||||
|
Business
acquisition earn out payments
|
(454 | ) | (553 | ) | (7,729 | ) | ||||||
|
Net
cash used in investing activities
|
1,291 | (2,235 | ) | (9,231 | ) | |||||||
|
Cash
flows from financing activities:
|
||||||||||||
|
Issuance
of common stock
|
7 | 238 | 15,499 | |||||||||
|
Issuance
of preferred stock
|
281 | - | - | |||||||||
|
Proceeds
from bank loan, net
|
919 | 2,536 | 3,869 | |||||||||
|
Proceeds
from shareholder loan
|
500 | - | - | |||||||||
|
Proceeds
from (repayment of) notes payable
|
(200 | ) | (375 | ) | 575 | |||||||
|
Net
cash provided by financing activities
|
1,507 | 2,399 | 19,943 | |||||||||
|
Effect
of foreign exchange rate changes on cash and cash
equivalents
|
(52 | ) | (267 | ) | 388 | |||||||
|
Net
increase (decrease) in cash and cash equivalents
|
804 | (1,124 | ) | 1,154 | ||||||||
|
Cash
and cash equivalents at beginning of period
|
420 | 1,544 | 390 | |||||||||
|
Cash
and cash equivalents at end of period
|
$ | 1,224 | $ | 420 | $ | 1,544 | ||||||
|
Supplemental
disclosures:
|
||||||||||||
|
Interest
paid
|
$ | 823 | $ | 593 | $ | 285 | ||||||
|
Income
taxes paid
|
$ | - | $ | 60 | $ | - | ||||||
Supplemental
disclosures of non-cash investing activities:
In August
2009, OCZ received a note receivable and recorded an investment for preferred
stock received related to the sale of various tangible and intangible
property. In connection with this transaction, OCZ recorded a note
receivable in the amount of $375,000 and recorded an investment in the amount of
$668,000 in the accompanying consolidated balance sheet.
See
accompanying notes to the Consolidated Financial Statements.
55
OCZ
Technology Group, Inc. Notes to Consolidated Financial Statements
|
1.
|
History
|
OCZ
Technology Group, Inc. a Delaware Corporation and Subsidiaries (“OCZ”)
develops, produces, and distributes high-performance computer components
including flash memory storage, memory modules, thermal management solutions and
computer power supplies, designed to make computers run faster, more reliably
and more efficiently. During 2007, OCZ acquired the assets of two
companies in order to further diversify its product offerings: PC
Power and Cooling, Inc., a leading brand of power supplies and Silicon Data
Inc., doing business as Hypersonic PC Systems, a manufacturer of high
performance laptop and desktop computer systems. In February 2010,
OCZ divested certain Hypersonic PC Systems product lines.
OCZ’s
wholly owned subsidiaries include OCZ Canada and OCZ Ireland Technology Limited
(“OCZ Ireland”). On
September 30, 2009, OCZ amended its certificate of incorporation to, among other
matters, affect a 1 for 2.5 reverse stock split. All references to
share and per share amounts have been retrospectively restated to reflect this
amendment.
Under the
terms of our certificate of incorporation with respect to our Series A preferred
stock, each share of Series A preferred stock was to be automatically converted
into shares of common stock on the sixtieth (60th)
trading day following the commencement of trading of our common shares on a
public stock exchange, including OTCBB (“Mandatory
Conversion”). The trading of our common shares commenced on
OTCBB on February 10, 2010, and the 60th trading
day following the commencement of trading was May 4, 2010. The number
of shares of our common stock issued upon Mandatory Conversion was determined by
dividing $5.00 by the Denominator Price, which was determined as
follows: If the sixty (60) day per share average closing price of our
common stock on such public stock exchange (the “60 Day
Average”) is between $3.00 and $5.00, then the Denominator Price will be
the 60 Day Average. Based on the 60 Day Average of $4.86, and after
taking into account fractional shares, on May 4, 2010, 60,990 shares of our
Series A preferred stock were converted into 62,733 shares of our common stock,
and warrants to purchase 140,520 shares of our Series A preferred stock were
converted into warrants to purchase 144,541 shares of our common
stock.
|
2.
|
Summary
of significant accounting policies
|
Basis
of preparation
OCZ’s
financial statements have been prepared in accordance with the accounting
principles generally accepted in the United States (“GAAP”). The
significant accounting policies used in the preparation of the financial
statements are summarized below.
Change
of year end
Effective
March 1, 2007, OCZ changed its financial year end from a calendar year to a year
ended February 28/29 in order to better conform to its natural business
cycle.
Principles
of consolidation
The
consolidated financial statements include the financial statements of OCZ and
its subsidiaries, OCZ Canada and OCZ Ireland. All material
intercompany balances and transactions have been eliminated upon
consolidation.
Use
of estimates
The
preparation of these financial statements requires OCZ to make estimates and
judgments that affect the reported amounts of assets, liabilities, revenues and
expenses and related disclosure of contingent liabilities.
On an
ongoing basis, OCZ evaluates its estimates, including, among others, those
related to bad debts and allowances, inventories and related reserves,
investments, income taxes, warranty obligations, stock compensation,
contingencies and litigation. OCZ bases its estimates on historical
experience and on other assumptions that OCZ believes are reasonable under the
circumstances, the results of which form the basis for OCZ’s judgments about the
carrying values of assets and liabilities when those values are not readily
apparent from other sources. Estimates have historically approximated
actual results. However, future results will differ from these
estimates under different assumptions and conditions.
56
Cash
equivalents
For the
purposes of the statement of cash flows, OCZ considers all highly liquid
investments with an original maturity of three months or less to be cash
equivalents.
Concentration
of credit risks
Financial
instruments which potentially subject OCZ to concentrations of credit risk
consist of cash and cash equivalents and accounts receivable. OCZ
maintains credit insurance on the majority of its receivables. During
the periods presented herein OCZ had deposits in banks in excess of the Federal
Deposit Insurance Corporation insurance limit. OCZ has not
experienced any losses in such accounts, and does not believe it is exposed to
any significant risk on trade receivables, cash and cash
equivalents.
Comprehensive
income
Comprehensive
income consists of net income (loss) and other comprehensive income
(loss). Other comprehensive income (loss) consists of foreign
currency translation adjustments, which are also recognized as a separate
component of stockholders’ equity.
Trade
accounts receivable and allowance for doubtful accounts
Accounts
receivable is stated at the net amount which management expects to collect after
providing allowances for doubtful accounts, sales payments and sales credits
based on an evaluation of a customer’s specific financial
situation. These allowances amounted to approximately $2.9 million as
of February 28, 2010 and $2.3 million as of February 28, 2009 (see also Note
14). Historically,
OCZ has not charged interest on past due accounts.
On August
31, 2009, OCZ was issued notes receivable related to the sale of various
tangible and intangible property. Notes receivable are stated at the net
amount
which management expects to collect after providing a valuation allowance. Based
upon management's assessment of the note holder's ability to repay the
note, OCZ has not recorded a valuation allowance as of February 28,
2010.
Inventory
Inventory
is valued at the lower of cost or market with cost determined using the average
cost method. Inventory consists of raw materials, work in progress
and finished goods.
OCZ
writes down inventory for slow moving and obsolete inventory based on
assessments of future demands and market conditions as well as the condition of
product on hand.
Property
and equipment
Property
and equipment are carried at cost, net of accumulated
depreciation. The cost of maintenance and repairs
is expensed as incurred. Depreciation of property and
equipment is provided using the straight line method over the estimated useful
lives of the assets as follows:
|
Vehicles
|
3
years
|
|
Furniture
and fixtures
|
3 —
5 years
|
|
Equipment
|
3 —
5 years
|
|
Leasehold
improvements
|
Shorter
of term of lease or asset
life
|
Goodwill
and Intangibles
Goodwill
represents the excess of the purchase price over the estimated fair value of the
identifiable tangible and intangible net assets acquired in business
acquisitions. Goodwill is reviewed at least annually for impairment
as of the last day of February, or more frequently if events and circumstances
indicate that the asset might be impaired, in accordance with ASC Topic 350,
Intangible – Goodwill and Other. The brand name intangible assets are
being amortized over a 4-year period. Subsequent payments made for
any contingent consideration are charged to goodwill if the acquisition was made
prior to our fiscal year ended February 28, 2010, in accordance with the
December 2007 revisions to SFAS No. 141 (ASC Topic 805). For tax
purposes, goodwill is deductible over a 15-year period.
57
In
accordance with the provisions of ASC Topic 805, Business Combinations, OCZ
allocates the purchase price to the tangible and intangible assets acquired,
liabilities assumed, and in-process research and development based on its
estimated fair values. Management makes significant estimates and
assumptions, which are believed to be reasonable, in determining the fair values
of certain assets acquired and liabilities assumed, especially with respect to
intangible assets. These estimates are based on historical experience
and information obtained from the management of the acquired companies and are
inherently uncertain. Critical estimates in valuing certain of the
intangible assets include, but are not limited to, future expected cash flows
from product sales, customer relationships, acquired developed technologies and
patents, expected costs to develop the in-process research and development into
commercially viable products and estimated cash flows from the projects when
completed, expected life of the core technology and discount
rates. Unanticipated events and circumstances may occur which may
affect the accuracy or validity of such assumptions, estimates or actual
results.
Impairment
of long-lived assets
OCZ
reviews long-lived assets for impairment whenever events or changes in
circumstances indicate that the carrying amount of the asset may not become
recoverable. If the sum of the expected future undiscounted cash
flows is less than the carrying amount of the asset, OCZ recognizes an
impairment loss based on the estimated fair value of the asset.
Income
taxes
Income
taxes are accounted for using an asset and liability approach whereby deferred
tax assets and liabilities are recorded for differences in the financial
reporting bases and tax bases of OCZ’s assets and liabilities. If it
is more likely than not that some portion of deferred tax assets will not be
realized, a valuation allowance is recorded.
GAAP
prescribes a comprehensive model for how companies should recognize, measure,
present, and disclose in their financial statements uncertain tax positions
taken or expected to be taken on a tax return. Tax positions shall
initially be recognized in the financial statements when it is more likely than
not the position will be sustained upon examination by the tax
authorities. Such tax positions shall initially and subsequently be
measured as the largest amount of tax benefit that is greater than 50% likely of
being realized upon ultimate settlement with the tax authority assuming full
knowledge of the position and all relevant facts. It is
management's policy to recognize interest and penalties related to tax
uncertainties to income tax expense. OCZ has
no amounts accrued for interest or penalties as of February 28, 2010 and does
not expect the total amount of unrecognized tax benefits to significantly change
in the next 12 months.
OCZ
Canada pays taxes in Canada. OCZ does not file consolidated tax
returns.
All tax
periods after our fiscal year ended December 31, 2005 remain open and subject to
audit by the IRS and the State of California.
Fair
value of financial instruments
OCZ’s
financial instruments consist primarily of cash, cash equivalents, accounts
receivable, goodwill
and intangible assets, notes receivable, investment, accounts payable and
bank loans and factoring arrangements. The carrying values of these
financial instruments approximate fair value as they are short-term to
mature.
In
September 2006, FASB issued FASB Accounting Standards Codification (“ASC”) 820,
Fair Value Measurements and
Disclosures, which defines fair value, establishes a framework for
measuring fair value in Generally Accepted Accounting Principles (“GAAP”), and
expands disclosures about fair value measurements. ASC 820 does not require any
new fair value measurements, but provides guidance on how to measure fair value
by providing a fair value hierarchy used to classify the source of the
information.
ASC 820
establishes a fair value hierarchy which prioritizes the inputs to valuation
techniques used to measure fair value into three levels as follows:
|
|
§
|
Level
1: Financial assets and liabilities whose values are based on unadjusted
quoted market prices for identical assets and liabilities in an active
market that the Company has the ability to
access.
|
|
|
§
|
Level
2: Financial assets and liabilities whose values are based onquoted prices
in markets that are not active or model inputs that are observable for
substantially the full term of the asset or
liability.
|
|
|
§
|
Level
3: Financial assets and liabilities whose values are based onprices or
valuation techniques that require inputs that are both unobservable and
significant to the overall fair value
measurement.
|
|
Level
I
|
Level
II
|
Level
III
|
||||||||||
|
Note
Receivable
|
- | - | $ | 635,000 | ||||||||
|
Investment
|
- | - | $ | 408,000 | ||||||||
OCZ’s
value assigned to the note receivable and investment are based on amounts
determined in conjunction with the sale of various tangible and intangible
assets.
Revenue
recognition
OCZ
records all of our product sales net of allowances for returns, product rebates,
sales credits, and market development funds. Revenue is recognized
when there is persuasive evidence of an arrangement, product shipment by a
common carrier has occurred, risk of loss has passed, the terms are fixed and
collection is probable. OCZ generally uses customer purchase orders
and/or contracts as evidence of an arrangement and the underlying payment terms
to determine if the sales price is fixed. OCZ also purchases credit
insurance for the majority of its accounts.
58
Probability
of collection is assessed for each customer as it is subjected to a credit
review process that evaluates its financial position, ability to pay, and the
potential coverage by our credit insurer. If it is determined from
the outset of an arrangement that collection is not probable, the customer is
required to pay cash in advance of shipment. We provide for price
protection credits on a case-by-case basis after assessing the market
competition and product technology obsolescence. These credits are
recorded as a reduction to revenue at the time we reduce the product
prices.
Deferred
income
We offer
terms to certain customers which defer recognition of a sale transaction until
such time that our customer sells the product to its customers. As of
our fiscal years ended February 28, 2010, February 28, 2009 and February 29,
2008, OCZ shipped merchandise totaling $453,000, $452,800 and $325,000,
respectively, to a certain customer under such arrangement. The sales
and related cost of sales have been removed from the financial statements and
the income shown as deferred margin. Deferred margin as of our fiscal
years ended February 28, 2010, February 28, 2009 and February 29, 2008 was
$95,000, $167,000 and $92,000, respectively; which
are included in accrued and other liabilities.
Marketing cooperative
arrangements
We have
arrangements with resellers of our products to reimburse the resellers for
cooperative marketing costs meeting specified criteria. In certain
arrangements, we record advertising costs meeting specified criteria within
sales and marketing expenses in the accompanying consolidated statements of
operations. For those reimbursements that do not meet the criteria
for advertising costs, the amounts are recorded as a reduction to sales in the
accompanying consolidated statements of operations.
Research
and development costs
Costs of
researching and developing new technology or significantly altering existing
technology are expensed as incurred.
Shipping
and handling
Historically,
amounts billed to customers for shipping and handling have been de
minimus. For the fiscal years ended February 28, 2010, February 28,
2009 and February 29, 2008 these amounts were $133,000, $223,000 and $129,000,
respectively and were accounted for as a reduction in general, administrative
and operations expense.
Advertising
Advertising
costs are expensed as incurred and in the fiscal years ended February 28, 2010,
February 28, 2009 and February 29, 2008 were $3 million, $2.8 million and $2.4
million, respectively. Advertising costs are included in sales and
marketing expense.
Foreign
currency translation
All of
OCZ’s sales are invoiced in U.S. dollars.
The
accounts of OCZ’s operations in Canada are maintained in Canadian
dollars. All of OCZ’s other accounts are maintained in US
dollars. Assets and liabilities are translated into US dollars at
rates in effect at the balance sheet date. Revenues, cost of sales
and expenses are translated at weighted average rates during the reporting
period. Foreign currency transaction gains of approximately $111,000,
$160,000 and $57,000 were included in other income or expense in the
accompanying statement of operations for the fiscal years ended February 28,
2010, February 28, 2009 and February 29, 2008, respectively.
Product
warranties
OCZ
offers its customers warranties on certain products sold to
them. These warranties typically provide for the replacement of its
products if they are found to be faulty within a specified
period. Concurrent with the sale of products, a provision for
estimated warranty expenses is recorded with a corresponding increase in cost of
goods sold. The provision is adjusted periodically based on
historical and anticipated experience. Actual expense of replacing
faulty products under warranty, including parts and labor, are charged to this
provision when incurred.
59
Stock-based
compensation
On
January 1, 2006, OCZ adopted ASC Topic 718 using the modified prospective
application method. Under this method, compensation cost recognized
includes: (a) compensation cost for all share-based payments granted
prior to, but not yet vested as of January 1, 2006, based on the grant-date fair
value estimated in accordance with the original provisions of SFAS 123, and (b)
compensation cost for all share-based payments granted subsequent to January 1,
2006, based on the grant-date fair value.
OCZ uses
the Black-Scholes model to determine the fair value of stock options on the date
of grant and recognizes compensation expense for stock options on a
straight-line basis over the period earned and vested. Restricted
stock grants are measured based on the fair market value of the underlying stock
on the date of grant and compensation expense for restricted stock grants is
recognized on a straight-line basis over the requisite service
period. In addition to the recognition of compensation expense,
non-vested restricted stock grants are included in the diluted shares
outstanding calculation.
The
amount of compensation expense recognized using the Black-Scholes model requires
OCZ to exercise judgment and make assumptions relating to the factors that
determine the fair value of its stock option grants. The fair value
calculated by this model is a function of several factors, including the grant
price, the expected future volatility and the expected term of the option and
the risk-free interest rate of the option. The expected term and
expected future volatility of the options require judgment. In
addition, OCZ is required to estimate the expected forfeiture rate and only
recognize expense for those stock options expected to vest. OCZ
estimates the forfeiture rate based on historical experience and to the extent
its actual forfeiture rate is different from its estimate, share-based
compensation expense is adjusted accordingly.
Since
OCZ’s stock-based compensation plan was established in December 2004, all
options have been issued at or above the estimated fair market value so that
there is no intrinsic value to be expensed. Stock based compensation
charged to expenses was $663,000, $877,000 and $772,000 for the fiscal years
ending February 28, 2010, February 28, 2009 and February 29, 2008,
respectively. As of our fiscal year ended February 28, 2010,
compensation costs related to non vested options amounted to approximately
$1.3 million and will be recognized in the periods to February 29, 2014 over a
weighted average term of 15.5 months.
The fair
value of options grants was determined using the Black-Scholes option pricing
model with the following weighted average assumptions:
|
Fiscal Year Ended
|
Fiscal Year Ended
|
Fiscal Year Ended
|
||||||||||
|
February 28, 2010
|
February 28, 2009
|
February 29, 2008
|
||||||||||
|
Expected
dividend
|
0%
|
0%
|
0%
|
|||||||||
|
Risk
free interest rate
|
2.0%
|
2.8%
|
4.7%
|
|||||||||
|
Expected
volatility
|
0.58
|
0.40
|
0.37
|
|||||||||
|
Expected
life (in years)
|
4.28
|
4.24
|
4.28
|
|||||||||
|
3.
|
Recent
accounting pronouncements
|
Recent
accounting pronouncements which are deemed relevant to OCZ’s operations
included:
In June
2009, the FASB issued the Accounting Standards Codification ("Codification"),
which became the single source of authoritative non-governmental Generally
Accepted Accounting Principles. The Codification does not change
Generally Accepted Accounting Principles, but instead introduces a new structure
that combines all authoritative standards into a comprehensive,
topically-organized online database. All references to the
authoritative accounting literature in our financial statements are referenced
in accordance with the Codification. There were no material changes
to the financial statements as a result of implementing the
Codification.
In May
2009, the FASB issued ASC 855, Subsequent
Events. ASC 855 establishes general standards of accounting
for and disclosure of events that occur after the balance sheet date but before
the financial statements are issued or are available to be
issued. ASC 855 provides guidance on the period after the balance
sheet date during which management of a reporting entity should evaluate events
or transactions that may occur for potential recognition or disclosure in the
financial statements, the circumstances under which an entity should recognize
events or transactions occurring after the balance sheet date in its financial
statements and the disclosures that an entity should make about events or
transactions that occurred after the balance sheet date. The
statement was effective for OCZ during the fiscal year ended February 28,
2010.
60
In
February 2010, the FASB issued a new accounting standards update that eliminated
the requirement for an entity that is an SEC filer to disclose the date through
which subsequent events have been evaluated in its financial statement
disclosures. This new accounting standards update is effective upon
release. The adoption of the new accounting standards update did not
have a material impact on our consolidated results of operations, financial
condition or financial disclosures.
In
January 2010, the FASB issued a new accounting standards update for fair value
measurements and disclosures. A reporting entity should disclose
separately the amounts of significant transfers in and out of Level 1 and Level
2 and describe the reasons for the transfers. A reporting entity
should separately disclose information about purchases, sales, issuances and
settlements for Level 3 reconciliation disclosures. The new
disclosures and clarifications of existing disclosures are effective for
financial statements issued interim or annual financial periods ending after
December 15, 2009, with the exception for the reconciliation disclosures for
Level 3, which are effective for financial statements issued interim or annual
financial periods ending after December 15, 2010. The adoption of the new
accounting standards update are not expected to have a material impact on our
consolidated results of operations, financial condition or financial
disclosures.
|
4.
|
Inventory
|
Inventory
consists of the following:
|
February 28,
2010
(’000)
|
February 28,
2009
(’000)
|
|||||||
|
Raw
materials
|
$ | 3,246 | $ | 5,484 | ||||
|
Work
in progress
|
5,319 | 5,972 | ||||||
|
Finished
goods
|
1,281 | 5,331 | ||||||
| $ | 9,846 | $ | 16,787 | |||||
|
5.
|
Property
and equipment
|
Net
property and equipment consists of the following:
|
February 28,
2010
(’000)
|
February 28,
2009
(’000)
|
|||||||
|
Vehicles
|
$ | 135 | $ | 135 | ||||
|
Furniture
and fixtures
|
38 | 154 | ||||||
|
Equipment
|
4,471 | 3,689 | ||||||
|
Leasehold
Improvements
|
439 | 414 | ||||||
| 5,083 | 4,392 | |||||||
|
Less: accumulated
depreciation
|
(2,454 | ) | (1,537 | ) | ||||
| $ | 2,629 | $ | 2,855 | |||||
Depreciation
expense for the fiscal years ended February 28, 2010, February 28, 2009 and
February 29, 2008 amounted to $1.0 million, $744,000 and $468,000,
respectively.
|
6.
|
Goodwill
and other intangible assets
|
Goodwill
represents the excess of the purchase price over the estimated fair value of the
identifiable tangible and intangible net assets acquired in business
acquisitions.
61
An
impairment loss would be recognized to the extent that the carrying amount
exceeds the implied fair value of the goodwill. This is determined in
a two step process.
The first
step compares the carrying amount of the net assets (including goodwill) of the
reporting unit to its fair value. If fair value exceeds the carrying
amount of net assets, goodwill is not considered to be impaired and the second
step of the impairment test is not required. If the carrying amount
of net assets exceeds the reporting unit’s fair value, the second step of the
impairment test is undertaken to measure the amount of impairment loss, if
any. In determining fair value, consideration is first given to
quoted market prices of OCZ’s stock and where this is not available the estimate
of fair value will be based upon the best information available and
consideration of other valuation techniques.
The
second step measures the amount of impairment loss by comparing the implied fair
value of goodwill with the carrying amount of that goodwill. An
impairment loss is recognized to the extent the carrying amount of goodwill
exceeds the implied fair value of that goodwill. The implied fair
value of goodwill is determined by allocating fair value in a manner similar to
a purchase price allocation applied in a business combination. The
residual fair value after this allocation is the implied fair value of
goodwill.
Once a
goodwill impairment loss is recognized, the adjusted carrying amount of goodwill
shall be the new accounting basis and there is no subsequent reversal of
previously recognized goodwill impairment loss in future years.
During
the year ended February 28, 2010, OCZ has recorded a $911,000 charge for
impairment of goodwill and other intangibles. In February 2010, OCZ
stopped the manufacture and sale of certain Hypersonic PC Systems
products. As a result, the goodwill recorded from that acquisition
was determined to be fully impaired and all remaining goodwill from the
Hypersonic PC Systems acquisition was written off.
Changes
in the carrying amount in goodwill and other intangible assets are summarized as
follows:
|
Goodwill
(’000)
|
Other
Intangible
assets
(’000)
|
|||||||
|
Cost
|
||||||||
|
As
at February 29, 2008
|
$ | 9,789 | $ | 446 | ||||
|
Additions
during the period for Goodwill contingent payment
|
553 | — | ||||||
|
As
at February 28, 2009
|
10,342 | 446 | ||||||
|
Additions
during the period for Goodwill contingent payment
|
454 | — | ||||||
|
As
at February 28, 2010
|
$ | 10,796 | $ | 446 | ||||
|
Accumulated
Amortization/Impairment
|
||||||||
|
As
at February 29, 2008
|
$ | — | $ | 66 | ||||
|
Amortization
for the period
|
— | 112 | ||||||
|
As
at February 28, 2009
|
— | 178 | ||||||
|
Amortization
for the period
|
— | 111 | ||||||
|
Impairment
|
842 | 69 | ||||||
|
As
at February 28, 2010
|
$ | 842 | $ | 358 | ||||
|
Net carrying value
|
||||||||
|
As
at February 28, 2009
|
$ | 10,342 | $ | 268 | ||||
|
As
at February 28, 2010
|
$ | 9,954 | $ | 88 | ||||
Other
intangible assets
Intangible
assets totaling $446,000 ($280,000 PC Power and Cooling, Inc., and $166,000
Silicon Data Inc., doing business as Hypersonic PC Systems) allocated to trade
name and trade marks from the above acquisitions are being amortized over 48
months on a straight-line basis. The remaining balance of intangible
assets relating to the acquisition of the Hypersonic PC Systems assets was
written off as of February 28, 2010. Amortization expense during the
fiscal years ended February 28, 2010, February 28, 2009 and February 29, 2008
was $180,000, $112,000 and $66,000, respectively.
62
The
expected amortization for the future periods is as follows:
|
Fiscal years ending February 28,
|
|
|||
|
2011
|
$ | 70,000 | ||
|
2012
|
17,500 | |||
| $ | 87,500 | |||
|
7.
|
Accrued
expenses
|
Accrued
expenses consist of the following:
|
February 28,
2010
(’000)
|
February 28,
2009
(’000)
|
|||||||
|
Professional fees
|
$ | 230 | $ | 198 | ||||
|
Interest
expense
|
50 | 21 | ||||||
|
Mail
in rebate provision
|
544 | 529 | ||||||
|
Sales
marketing program
|
741 | 763 | ||||||
|
Employee
related payments
|
522 | 392 | ||||||
|
Product
warranty provision
|
289 | 109 | ||||||
|
Uninvoiced
goods and services
|
1,196 | 1,055 | ||||||
|
Other
liabilities
|
817 | 684 | ||||||
| $ | 4,389 | $ | 3,751 | |||||
|
8.
|
Commitments
and contingencies
|
Lease
commitments.
OCZ and its subsidiaries lease office and warehouse facilities under
lease terms expiring at various dates through 2013. Rent expense
amounted to $783,000, $1.2 million, and $811,000 in the fiscal years ended
February 28, 2010, February 28, 2009 and February 29, 2008,
respectively. As our fiscal year ended February 28, 2010, the future
minimum payments due under these non cancellable lease agreements are as
follows:
|
Fiscal
years ending February 28/29
|
(’000)
|
|||
|
2011
|
$ | 668 | ||
|
2012
|
343 | |||
|
2013
|
13 | |||
| $ | 1,024 | |||
Contingencies.
In 2009,
we received inquiries from the U.S. Department of Commerce and the Federal
Bureau of Investigation regarding the potential re-export of our products from
the United Arab Emirates into Iran. We consequently launched an
internal investigation performed by outside counsel. The
investigation concluded that while between 2004 and 2008, we maintained a
relationship with a distributor in the United Arab Emirates, we have not found
any specific facts confirming these suspicions or any information about when
such re-exports would have occurred or who may have received the
products. However, we did provide approximately $500 in sales support
materials to the distributor in connection with a sales presentation in
Iran. We have terminated our relationship with this
distributor.
The
investigation separately discovered that in 2007 and 2008, in a total of three
instances, we sent one of our high speed Reaper memory module products free of
charge as either samples or replacement parts to individuals in Iran and an
individual who claimed an address in Cuba but subsequently changed the address
to one in Mexico.
63
We also
have received information that a distributor in Lebanon to whom we sold Neural
Impulse Actuators September 2008 may have re-exported one of these units into
Syria and in general was interested in distributing our products in Syria, but
we have not found specific facts confirming when such re-export would have
occurred or who may have received the product. We have terminated our
relationship with this distributor.
We have
voluntarily disclosed these transactions to the U.S. Department of Commerce and
the U.S. Department of the Treasury and have cooperated fully with requests for
information from these entities as well as the Federal Bureau of
Investigation. Should the U.S. government allege that we have
violated the Iranian Transaction Regulations and/or Export Administration
Regulations, the maximum fine for each violation that we could be subject to
would be the greater of $250,000 or two times the value of the illegal
transaction. Based on the list price of the products in question, we
believe the maximum fine per violation would be $250,000. We believe,
however, there is a good faith basis for leniency if any fines are assessed,
given the relatively small number of units and revenue at issue, our full
cooperation with the U.S. government and our immediate attention to rectifying
the underlying causes of the problems. As a result of the discovery
of these events, we have implemented more stringent export control procedures to
prevent inadvertent transfers and retransfers to sanctioned countries. At this
time, we cannot determine an estimated cost, or range of costs, that may be
incurred upon resolution of this matter. Accordingly, no provision
has been provided for this matter.
|
9.
|
Bank
loan and notes payable
|
In
November 2007, OCZ obtained a bank line of credit facility in the initial amount
of $10 million which was subsequently increased to $12 million during
2008. The bank has essentially all OCZ’s assets as collateral and
requires periodic operational reporting in lieu of any financial covenants other
than tangible net worth as defined. In February 2009, in connection
with the execution of an Amendment, the line of credit was reduced to $10
million because OCZ was not in compliance with 2 financial covenants that the
bank waived.
In order
to replace the SVB credit facility, in July 2009, OCZ entered into a Sale of
Accounts and Security Agreement with Faunus Group International, Inc, pursuant
to which OCZ may factor our foreign receivables up to $10 million in the
aggregate (as amended, the “FGI
Agreement”). Additionally, in July 2009, OCZ entered into a Loan
and Security Agreement with Silicon Valley Bank (as amended, the “SVB
Agreement” and collectively with the FGI Agreement, the “Factoring Loan
Agreements”) to factor all its domestic receivables up to $10 million in
the aggregate. The SVB Loan Agreement also capped the aggregate debt under
both Factoring Loan Agreements to $14 million until May 10, 2010 at which time
the $14 million cap was increased to $17.5 million. Under the Factoring
Loan Agreements, OCZ has guaranteed its obligations thereunder and has pledged
substantially all of its assets as security. As of February 28, 2010, the
outstanding loan balances under the Factoring Loan Agreement were $10.4 million
in the aggregate.
Under the
SVB Agreement, OCZ can borrow an amount up to 75% of the value of its approved
factored customer invoices. Interest is payable monthly on the
aggregate of the face amounts of the unpaid factored customer invoices each
month. SVB also charges a monthly collateral handling fee based upon
the unpaid factored customer invoices each month. The rate of
interest and the amount of the collateral handling fee is dependent upon our
Quick Ratio which is defined for this purpose as OCZ’s cash, marketable
securities and accounts receivable divided by our current
liabilities. If OCZ’s Quick Ratio is greater than 0.75:1.00 in any
month, the applicable interest rate is SVB Prime plus 2.25% per annum and the
collateral handling fee is 0.10%. If OCZ Quick Ratio is less than
0.75:1.00 in any month, the applicable interest rate is SVB Prime plus 2.75% per
annum and the collateral handling fee is 0.45%. The SVB Agreement
requires that OCZ maintain a minimum Quick Ratio of at least
0.50:1.00. Receivables are subject to recourse in the event of
nonpayment by the customer. At
February 28, 2010, there were no material recourse accounts
receivable.
Under the
FGI Agreement, OCZ can borrow an amount up to 75% of the value of its approved
factored customer invoices. Interest is payable each month on the
aggregate of the face amounts of the unpaid factored customer invoices at a rate
greater of 8.00% per annum or 3.00% above the rate of interest designated by FGI
as its selected “Prime Rate” or “Base Rate”, as the case may be (currently based
upon the Wall Street Journal, Money Rates Section). Additionally, FGI
charges a collateral management fee equal to 0.58% of the average monthly
balance of the face amount of the outstanding unpaid factored customer
invoices. If OCZ fails to maintain minimum monthly borrowings of at
least $2.5 million FGI will assess a deficiency charge in an amount equal to
charges that would apply had we maintained a $2.5 million borrowing minimum for
the applicable month less the actual charges paid for such month. FGI
has the option under the FGI Agreement of buying customer invoices without
recourse. To date, FGI has not done so and OCZ doesn’t anticipate
that it will do so. Receivables are subject to recourse in the event
of nonpayment by the customer.
64
In order
to provide some bridge financing as these new financing arrangements were
established, in August 2009 OCZ borrowed $500,000 from our Chief
Executive Officer, Ryan M. Petersen, at 7.5% interest per annum. The
loan is repayable in equal installments in February 2010 and September
2010. Even though the principal amount of $250,000 was due in
February, Mr. Petersen waived payment until April 2010, at which time he was
paid the $250,000 principal amount plus interest accrued through April
2010. OCZ also has notes payable in connection with the 2007
acquisitions described in Note 1 which bear interest at 6%. The
amounts outstanding were $575,000 as of our fiscal year ended February 29, 2008
and $200,000 as of our fiscal year ended February 28, 2009. The
$200,000 acquisition related note outstanding at February 2009 was repaid in
September 2009.
|
10.
|
Stockholders’
Equity
|
(The
numbers of shares and their prices have been adjusted to reflect the 1 for 2.5
stock reverse split that took place in September 2009).
In
November 2008, OCZ issued 339,200 shares as part of a capitalization of $200,000
of an acquisition related note in favor of Douglas A. Dodson.
During
the quarter ended November 30, 2009, the Board of Directors granted options to
purchase an aggregate of 1,630,400 shares of OCZ’s common stock under OCZ’s
stock option plan with the exercise price of $1.28 per share. These options were
granted in reliance on Rule 701 of the Securities Act
During
the fiscal year ended February 28, 2010, OCZ issued 60,990 shares of its Series
A preferred stock at $5.00 per share, which were converted into 62,733 shares of
common stock on May 4, 2010. These shares were issued in reliance on
Rule 506 of the Securities Act. In addition, OCZ also issued warrants
to purchase up to 140,520 shares of its Series A preferred stock at $5.00 per
share, which warrants were converted, on May 4, 2010, into warrants to
purchase 144,541 shares of common stock at $4.86 per share. Such
warrants were issued in reliance on Regulation S of the Securities
Act.
During
fiscal years ended February 28, 2009 and February 29, 2008, approximately 74,000
and 328,528 shares of common stock, respectively, were issued in connection with
the exercise of stock options. There were no stock option exercises
during the fiscal year ended February 28, 2010.
As set
forth in more detail in note 16 below, in March 2010, OCZ issued additional
shares of common stock and warrants to certain investors. In
addition, OCZ granted options to purchase shares of its common stock under its
stock option plan.
The
following table summarizes shares outstanding for each of the three fiscal years
ended February 28, 2010.
|
Fiscal Year Ended
|
Fiscal Year Ended
|
Fiscal Year Ended
|
||||||||||
|
February 28, 2010
|
February 28, 2009
|
February 29, 2008
|
||||||||||
|
Shares
outstanding, beginning
|
21,278 | 20,865 | 17,406 | |||||||||
|
Weighted-average
shares issued
|
- | 135 | 2,394 | |||||||||
|
Weighted-average
shares, basic
|
21,278 | 21,000 | 19,800 | |||||||||
|
Effect
of dilutive stock options and warrants
|
- | - | 600 | |||||||||
|
Weighted-average
shares, diluted
|
21,278 | 21,000 | 20,400 | |||||||||
Stock
incentive plan
In
December 2004, OCZ adopted a stock incentive plan with 1,800,000 shares of
common stock authorized for issuance. The shares subject to the stock
incentive plan was subsequently increased to 5,232,873. The shares to
be purchased are subject to forfeiture conditions, rights of repurchase, rights
of first refusal and other transfer restrictions as the Board may
determine. The options granted will expire in a term not to exceed 10
years.
65
The
following table summarizes option activity for each of the two fiscal years
ended February 28, 2010.
|
Number of
|
Weighted
|
|||||||||||||||||||
|
Shares
|
shares
|
Average
|
||||||||||||||||||
|
available
|
under
|
Exercise
|
Total
|
exercise
|
||||||||||||||||
|
for grant
|
option
|
Price
|
$
|
price
|
||||||||||||||||
|
Balance
at March 1, 2008
|
465,062 | 2,047,663 | $ | 10,065,859 | $ | 4.92 | ||||||||||||||
|
Options
granted (weighted average fair value of $0.37)
|
(525,600 | ) | 525,600 | $ | 0.40-$1.43 | 547,760 | $ | 1.05 | ||||||||||||
|
Options
exercised
|
— | (74,000 | ) | $ | 0.63 | (46,250 | ) | $ | 0.63 | |||||||||||
|
Options
forfeited
|
940,116 | (940,116 | ) | $ | 0.63-$8.53 | (4,912,033 | ) | $ | 5.23 | |||||||||||
|
Balance
at February 28, 2009
|
879,578 | 1,559,147 | $ | 5,655,336 | $ | 3.63 | ||||||||||||||
|
New
authorized
|
2,000,000 | - | - | - | - | |||||||||||||||
|
Options
granted (weighted average fair value of $0.61)
|
(1,630,400 | ) | 1,630,400 | $ | 1.28 | 2,078,760 | $ | 1.28 | ||||||||||||
|
Options
exercised
|
— | — | — | — | — | |||||||||||||||
|
Options
forfeited
|
410,436 | (410,436 | ) | $ | 0.42-$8.28 | 1,611,878 | $ | 3.93 | ||||||||||||
|
Balance
at February 28, 2010
|
1,659,614 | 2,779,111 | $ | 6,122,218 | $ | 2.20 | ||||||||||||||
The
following table summarizes information about stock options outstanding and
exercisable:
|
February 28, 2010
|
February 28, 2009
|
|||||||
|
Exercise
price range
|
$ | 0.40-$8.53 | $ | 0.40-$8.53 | ||||
|
Shares
outstanding
|
2,779,111 | 1,559,147 | ||||||
|
Weighted
average exercise price
|
$ | 2.20 | $ | 3.63 | ||||
|
Weighted
average contractual life
|
8.4
years
|
8.0
years
|
||||||
|
Shares
exercisable
|
1,287,695 | 733,929 | ||||||
|
Weighted
average exercise price
|
$ | 2.76 | $ | 3.74 | ||||
|
Weighted
average contractual life
|
7.5
years
|
7.2
years
|
||||||
On April
20, 2008 options for 301,200 shares with exercise prices ranging from $4.18 to
$8.53 were cancelled. An equivalent number of share options, for
non-senior management employees, were then re-granted with a three year vesting
period and an exercise price of $1.05 which was the fair market value at date of
grant. Incremental compensation cost of the excess fair value of the
replacement awards will be recognized over the three year term.
Warrants
We issued
warrant instruments on April 28, 2006, June 12, 2006 and October 12, 2006 to
John East & Partners Limited as part of fee arrangements relating to our
initial and follow-on offerings on AIM and a previous private placement. The
remaining warrants are convertible into an aggregate of 142,564 shares of our
common stock, of which warrants to exercise 97,354 shares expire on September
16, 2013, and warrants to exercise the remaining shares expire on June 21, 2011.
The exercise prices of the shares subject to warrants are 121.88 pence
(approximately $1.75 at current exchange rates) for 45,210 shares, 162.50 pence
(approximately $2.35 at current exchange rates) for 92,194 shares and 200.00
pence (approximately $2.90 at current exchange rates). The exercise prices are
subject to appropriate adjustment in the event of stock splits or stock
dividends, and the numbers presented in this paragraph have been adjusted to
reflect the recent 1 for 2.5 reverse stock split.
We issued
warrant instruments in January and February 2010 to various investors in
connection with a lockup agreement. These warrants are convertible into an
aggregate of 140,520 shares of our Series A preferred stock and expire between
July 20 and August 24, 2010 (the "Series A Warrants") at the exercise price of
$5.00 per share. On May 4, 2010, all of these warrants were converted into
warrants to purchase 144,541 shares of common stock with an exercise price of
$4.86 per share.
The
following table summarizes warrant activity for each of the three fiscal years
ended February 28, 2010.
|
Weighted
|
||||||||||||||||
|
average
|
||||||||||||||||
|
Number
|
Exercise
|
Total
|
exercise
|
|||||||||||||
|
of shares
|
price
|
$
|
price
|
|||||||||||||
|
Balance
at March 1, 2008
|
142,564
|
$
|
2.25-$3.90
|
398,428
|
$
|
2.80
|
||||||||||
|
Warrants
granted
|
—
|
—
|
—
|
—
|
||||||||||||
|
Warrants
exercised
|
—
|
—
|
—
|
—
|
||||||||||||
|
Warrants forfeited
|
—
|
—
|
—
|
—
|
||||||||||||
|
Balance
at February 28, 2009
|
142,564
|
$
|
2.25-$3.90
|
398,428
|
$
|
2.80
|
||||||||||
|
Warrants
granted
|
140,520
|
$ |
5.00
|
702,600
|
5.00
|
|||||||||||
|
Warrants
exercised
|
—
|
—
|
—
|
—
|
||||||||||||
|
Warrants forfeited
|
—
|
—
|
—
|
—
|
||||||||||||
|
Balance
at February 28, 2010
|
283,084
|
$
|
2.25-$5.00
|
$ |
1,101,028
|
$
|
3.89
|
|||||||||
66
|
11.
|
Employee
savings and retirement plan
|
OCZ has a
401(k) plan, known as the “OCZ Pension
Plan.” Eligibility to participate in the plan is subject to
certain minimum service requirements. Employees may voluntarily contribute
up to $16,500 per annum (or $22,000 for individuals over 50 years of age), being
the IRS maximum and OCZ may make matching contributions as determined by the
Board in a resolution on or before the end of the fiscal year. Any
contributions by OCZ are immediately 100% vested. OCZ did not make any
contributions in the fiscal years ended February 28, 2010, February 28, 2009 or
February 29, 2008.
|
12.
|
Income
taxes
|
Income/(loss)
before income tax expense/(benefit) consists of the following:
|
February 28,
|
February 28,
|
February 29,
|
||||||||||
|
2010
|
2009
|
2008
|
||||||||||
|
(’000)
|
(’000)
|
(’000)
|
||||||||||
|
Domestic
|
$ | (12,826 | ) | $ | (11,091 | ) | $ | 426 | ||||
|
International
|
(709 | ) | (572 | ) | 75 | |||||||
| $ | (13,535 | ) | $ | (11,663 | ) | $ | 501 | |||||
The
primary components of deferred income tax assets were as follows:
|
February 28,
|
February 28,
|
|||||||
|
|
2010
|
2009
|
||||||
|
|
(’000)
|
(’000)
|
||||||
|
|
||||||||
|
Intangible
assets
|
$
|
162
|
$
|
369
|
||||
|
Temporary
differences of accruals and allowances
|
3,595
|
2,850
|
||||||
|
Stock
based compensation
|
203
|
(81
|
)
|
|||||
|
Net
operating loss carry forwards
|
6,339
|
2,513
|
||||||
|
State
deferred tax effect on federal
|
(474
|
)
|
(318
|
)
|
||||
|
Gross
deferred tax assets
|
9,825
|
5,333
|
||||||
|
Valuation
allowance
|
(8,989
|
)
|
(4,497
|
)
|
||||
|
Net
deferred tax assets
|
$
|
836
|
$
|
836
|
||||
|
Reported
as:
|
||||||||
|
Current
deferred tax assets
|
$
|
836
|
$
|
836
|
||||
|
Non-current
deferred tax assets
|
-
|
-
|
||||||
|
Net
deferred tax assets
|
$
|
836
|
$
|
836
|
||||
67
The
provision for income taxes (benefit) consists of the following:
|
February 28, 2010
|
February 28, 2009
|
February 29, 2008
|
||||||||||
|
(’000)
|
(’000)
|
(’000)
|
||||||||||
|
Current:
|
||||||||||||
|
Federal
(provision)/benefit
|
$ | — | $ | — | $ | 720 | ||||||
|
State
(provision)/benefit
|
— | — | 216 | |||||||||
|
Foreign
(provision)/benefit
|
1 | (61 | ) | - | ||||||||
| $ | 1 | $ | (61 | ) | $ | 936 | ||||||
OCZ
evaluates the need for tax contingency reserves at the end of each financial
reporting period.
For
Federal and State income tax purposes, as of February 28, 2010, OCZ has
approximately $17 million and $6.2 million for Federal and
California State, respectively, of net operating loss carry-forwards available
to offset future taxable income. Any unused Federal carry forwards will expire
between 2027 and 2030 and any unused California State carry-forwards will expire
between 2017 and 2019.
OCZ’s
effective tax rate differed from the statutory federal income tax rate as shown
in the following table:
|
Fiscal Year Ended
|
||||||||||||
|
February 28, 2010
|
February 28, 2009
|
February 29, 2008
|
||||||||||
|
(%)
|
(%)
|
(%)
|
||||||||||
|
Statutory
federal income tax/(benefit) rate
|
(34 | ) | (34 | ) | 34 | |||||||
|
State
taxes, net of federal tax benefit
|
(5.8 | ) | (5.8 | ) | 5.8 | |||||||
|
Depreciation
& Amortizations
|
(2.0 | ) | 3.1 | - | ||||||||
|
Valuation
allowances
|
5.5 | 22.2 | (25.7 | ) | ||||||||
|
Stock
based compensation
|
1.9 | 3.0 | (81.2 | ) | ||||||||
|
NOL
not utilized (utilized)
|
27.6 | 20.5 | (123.4 | ) | ||||||||
|
Foreign
tax differential
|
— | 0.5 | — | |||||||||
|
Other
– net
|
6.8 | (9.0 | ) | 3.7 | ||||||||
|
Effective
tax rate
|
— | % | 0.5 | % | (186.8 | )% | ||||||
|
13.
|
Segment
and geographic information
|
OCZ
operates in a single industry segment and has three product groups comprised of
memory processing, power supplies, and SSD/flash memory storage.
The
following table sets forth the revenues for each of OCZ’s product groups for the
years ended February 28, 2010, February 28, 2009 and February 29,
2008:
|
Fiscal Year Ended
|
||||||||||||
|
February 28, 2010
|
February 28, 2009
|
February 29, 2008
|
||||||||||
|
(’000)
|
(’000)
|
(’000)
|
||||||||||
|
Memory
processing
|
$ | 72,830 | $ | 100,956 | $ | 95,290 | ||||||
|
SSD/Flash
memory storage
|
49,611 | 29,635 | 6,292 | |||||||||
|
Power
supplies
|
21,518 | 25,391 | 16,770 | |||||||||
|
Total
|
$ | 143,959 | $ | 155,982 | $ | 118,352 | ||||||
68
OCZ’s
revenues by major geographic area (based on destination) were as
follows:
|
Fiscal Year Ended
|
||||||||||||
|
February 28, 2010
|
February 28, 2009
|
February 29, 2008
|
||||||||||
|
($’000)
|
(’000)
|
(’000)
|
||||||||||
|
United
States
|
$ | 62,489 | $ | 60,428 | $ | 44,030 | ||||||
|
Canada
|
7,667 | 10,508 | 11,260 | |||||||||
|
Europe/Middle
East/Africa
|
56,535 | 74,699 | 57,500 | |||||||||
|
Rest
of World
|
17,268 | 10,347 | 5,562 | |||||||||
|
Total
|
$ | 143,959 | $ | 155,982 | $ | 118,352 | ||||||
During
the fiscal years ended February 28, 2010, February 28, 2009 and February 29,
2008, sales to one customer represented 19%, 19% and 12%, respectively of net
revenues and sales to another customer represented 8%, 8% and 7%, respectively,
of net revenues.
|
14.
|
Accounts
receivable allowances
|
The
following table summarizes information about the allowances for accounts
receivable:
|
($’000)
|
Beginning
Balance of
Doubtful
Accounts
|
Additions
Charged to
Expense or
Other Accounts
|
Write-offs
|
Ending
Balance of
Doubtful
Accounts
|
Ending
Balance of
Other
Allowances
|
Total
Allowances for
Accounts
Receivable
|
||||||||||||||||||
|
Periods Ended:
|
||||||||||||||||||||||||
|
Fiscal year
ended February 29, 2008
|
$ | 473 | $ | 299 | $ | (510 | ) | $ | 262 | $ | 254 | $ | 516 | |||||||||||
|
Fiscal
year ended February 28, 2009
|
$ | 262 | $ | 1,410 | (635 | ) | $ | 1,037 | $ | 1,242 | $ | 2,279 | ||||||||||||
|
Fiscal
year ended February 28, 2010
|
$ | 1,037 | $ | 644 | $ | (35 | ) | $ | 1,646 | $ | 1,207 | $ | 2,853 | |||||||||||
The other
allowances category relates primarily to accruals for contractual sales credits
to be deducted from future payments which are treated as reduction of revenue at
the time of sale.
|
15.
|
Supplementary
Financial Information – Quarterly Financial Data
(unaudited)
|
The
following table sets forth our quarterly consolidated statements of operations
for each of the ten most recent quarters:
|
February 28, 2010
|
February 28, 2009
|
February 29, 2008
|
||||||||||||||||||||||||||||||||||||||
|
Q4
|
Q3
|
Q2
|
Q1
|
Q4
|
Q3
|
Q2
|
Q1
|
Q4
|
Q3
|
|||||||||||||||||||||||||||||||
|
Feb 28
|
Nov 30
|
Aug 31
|
May 31
|
Feb 28
|
Nov 30
|
Aug 31
|
May 31
|
Feb 29
|
Nov 30
|
|||||||||||||||||||||||||||||||
|
Net
revenues
|
$ | 32,369 | $ | 38,024 | $ | 37,795 | $ | 35,771 | $ | 41,119 | $ | 35,230 | $ | 41,859 | $ | 37,774 | $ | 33,679 | $ | 33,346 | ||||||||||||||||||||
|
Gross
profit
|
2,243 | 6,457 | 6,261 | 3,695 | 6,750 | 338 | 5,905 | 6,798 | 6,839 | 5,217 | ||||||||||||||||||||||||||||||
|
Operating
profit/(loss)
|
(5,995 | ) | (1,050 | ) | (1,301 | ) | (4,200 | ) | (373 | ) | (9,046 | ) | (1,625 | ) | 150 | (120 | ) | (350 | ) | |||||||||||||||||||||
|
Earnings
(loss) per share – basic
|
$ | (0.31 | ) | $ | (0.05 | ) | $ | (0.08 | ) | $ | (0.20 | ) | $ | (0.03 | ) | $ | (0.46 | ) | $ | (0.07 | ) | $ | 0.00 | $ | 0.01 | $ | 0.03 | |||||||||||||
|
Earnings
(loss) per share - diluted
|
$ | (0.31 | ) | $ | (0.05 | ) | $ | (0.08 | ) | $ | (0.20 | ) | $ | (0.03 | ) | $ | (0.46 | ) | $ | (0.07 | ) | $ | 0.00 | $ | 0.01 | $ | 0.03 | |||||||||||||
69
|
16.
|
Subsequent
Events
|
In March
2010, OCZ issued 5,151,662 shares of its common stock at $3.00 per share, and
29,710 shares of common stock in connection with certain services
received. OCZ also issued warrants to purchase up to 2,575,831 shares of
its common stock at $5.25 per share. In addition, OCZ issued a warrant to
purchase up to 154,550 shares of its common stock at $3.00 per share and, if
such a warrant were exercised, the right to purchase up to 77,275 shares of its
common stock at $5.25 per share. All of these shares of common stock and
warrants were issued in reliance on Rule 506, Regulation D, of the Securities
Act.
In
connection with OCZ’s March 23, 2010 fund raising, OCZ entered into a
registration rights agreement which requires OCZ to file a registration
statement with the SEC no later than May 21, 2010, to register 2,575,831 shares
of its common stock and 5,151,662 shares of its common stock issuable upon
exercise of certain warrants.
In April
2010, OCZ granted options to purchase an aggregate of 330,000 shares of its
common stock under OCZ’s stock option plan with the exercise price of $4.35 per
share, which was the fair market value per share on the date of
grant.
In May
2010, all shares of our Series A preferred stock and all warrants to purchase
shares of Series A preferred stock were converted into shares of common stock
and warrants to purchase shares of common stock, respectively. Under the terms
of our certificate of incorporation with respect to our Series A Preferred
Stock, each share of Series A Preferred Stock was to be automatically converted
into shares of common stock on the sixtieth (60th)
trading day following the commencement of trading of our common shares on a
public stock exchange, including OTCBB (“Mandatory
Conversion”). The trading of our common shares commenced on OTCBB on
February 10, 2010, and the 60th trading
day following the commencement of trading was May 4, 2010. The number of shares
of our common stock issued upon Mandatory Conversion was determined by dividing
$5.00 by the Denominator Price, which was determined as follows: If the sixty
(60) day per share average closing price of our common stock on such public
stock exchange (the “60 Day
Average”) is between $3.00 and $5.00, then the Denominator Price will be
the 60 Day Average. Based on the 60 Day Average of $4.86, and after taking into
account fractional shares, on May 4, 2010, 60,990 shares of our Series A
preferred stock were converted into 62,733 shares of our common stock, and
warrants to purchase 140,520 shares of our Series A preferred stock were
converted into warrants to purchase 144,541 shares of our common stock at $4.86
per share.
70
|
Item
9.
|
Changes
in and Disagreements with Accountants on Accounting and Financial
Disclosure
|
Changes in Registrant’s Certifying
Accountant. Effective April 5, 2010, our Audit Committee appointed
Crowe Horwath LLP (“Crowe
Horwath”), based in the United States, as our independent registered
public accounting firm. Crowe Horwath replaced Horwath Clark Whitehill LLP
(“Horwath
Clark Whitehill”), based in the United Kingdom, as our auditors.
Both Crowe Horwath and Horwath Clark Whitehill are members of Crowe Horwath
International, an organization of independent accounting and management
consulting firms.
The
reports of Horwath Clark Whitehill on OCZ’s consolidated financial statements
for each of the fiscal years ended February 28, 2009 and February 29, 2008 did
not contain an adverse opinion or a disclaimer of opinion and were not qualified
or modified as to uncertainty, audit scope, or accounting
principles.
During
the fiscal years ended February 28, 2009 and February 29, 2008 and the
subsequent interim periods thereto, there were no disagreements with Horwath
Clark Whitehill on any matter of accounting principles, financial statement
disclosure, or auditing scope or procedure which, if not resolved to the
satisfaction of Horwath Clark Whitehill, would have caused Horwath Clark
Whitehill to make reference to the subject matter of the disagreements in
connection with its report for such fiscal years or interim periods; and there
were no “reportable events” as defined in Item 304(a)(1)(v) of Regulation
S-K.
During
the fiscal years ended February 28, 2009 and February 29, 2008 and through the
date hereof, neither we, and nor anyone acting on our behalf has consulted Crowe
Horwath on any of the matters or events set forth in Item 304(a)(2) of
Regulation S-K.
|
Item
9A(t).
|
Controls
and Procedures
|
Evaluation of Disclosure Controls and
Procedures
Disclosure
controls and procedures are controls and procedures designed to reasonably
assure that information required to be disclosed in our reports filed under the
Securities Exchange Act of 1934 as amended, (the “Exchange
Act”), such as this report, is recorded, processed, summarized and
reported within the time periods specified in the SEC’s rules and forms and to
reasonably assure that such information is accumulated and communicated to our
management, including the Chief Executive Officer and the Chief Financial
Officer, as appropriate to allow timely decisions regarding required
disclosure.
Under the
supervision and with the participation of our management, including our Chief
Executive Officer and Chief Financial Officer, we evaluated the effectiveness of
the design and operation of our disclosure controls and procedures as of the end
of the period covered by this report. Based on this evaluation, our Chief
Executive Officer and Chief Financial Officer concluded that our disclosure
controls and procedures (as defined in Rules 13a-15(f) and 15d-15(f) under
the Exchange Act) were effective as of our fiscal year ended February 28,
2010.
Changes in Internal Control over
Financial Reporting
There
were no changes to our internal control over financial reporting (as defined in
Rules 13a-15(f) and 15d-15(f) under the Exchange Act) that occurred during the
fourth quarter of fiscal year ended February 28, 2010 that have materially
affected, or are reasonably likely to materially affect, our internal control
over financial reporting.
This
Annual Report on Form 10-K does not include a report of management's assessment
regarding internal control over financial reporting or an attestation report of
the company's registered public accounting firm due to a transition period
established by rules of the SEC for newly public companies.
71
Inherent
Limitations on Effectiveness of Controls
Our
management, including the Chief Executive Officer and Chief Financial Officer,
does not expect that our disclosure controls or our internal control over
financial reporting will prevent or detect all error and all fraud. A
control system, no matter how well designed and operated, can provide only
reasonable, not absolute, assurance that the control system’s objectives will be
met. Our controls and procedures are designed to provide reasonable
assurance that our control system’s objective will be met and our Chief
Executive Officer and Chief Financial Officer have concluded that our disclosure
controls and procedures are effective at the reasonable assurance level.
The design of a control system must reflect the fact that there are resource
constraints, and the benefits of controls must be considered relative to their
costs. Further, because of the inherent limitations in all control
systems, no evaluation of controls can provide absolute assurance that
misstatements due to error or fraud will not occur or that all control issues
and instances of fraud, if any, within OCZ have been detected. These
inherent limitations include the realities that judgments in decision-making can
be faulty and that breakdowns can occur because of simple error or
mistake. Controls can also be circumvented by the individual acts of some
persons, by collusion of two or more people, or by management override of the
controls. The design of any system of controls is based in part on certain
assumptions about the likelihood of future events. Projections of any
evaluation of the effectiveness of controls in future periods are subject to
risks. Over time, controls may become inadequate because of changes in
conditions or deterioration in the degree of compliance with policies or
procedures. Notwithstanding these limitations, our disclosure controls and
procedures are designed to provide reasonable assurance of achieving their
objectives. Our Chief Executive Officer and Chief Financial Officer have
concluded that our disclosure controls and procedures are, in fact, effective at
the “reasonable assurance” level.
|
Item
9B.
|
Other
Information
|
Not
applicable.
72
Part
III
|
Item
10.
|
Directors,
Executive Officers and Corporate
Governance
|
Set forth
below are the names, ages, tenure with us, and positions of those persons who
are our executive officers and directors. Each director serves for a
three-year term expiring at the annual meeting of stockholders in the year
indicated in the section titled “Composition of the Board of
Directors” below.
|
Name
|
Age
|
Position(s)
|
Director/Officer
Since
|
|||
|
Ryan
M. Petersen
|
35
|
Chief
Executive Officer and Director
|
2002
|
|||
|
Kerry
T. Smith
|
48
|
Chief
Financial Officer and Director
|
2009
|
|||
|
Alex
Mei
|
34
|
Executive
Vice President, Chief Marketing Officer
|
2004
|
|||
|
Justin
Shong
|
42
|
Senior
Vice President of Sales
|
2007
|
|||
|
Adam
Epstein
|
44
|
Director
|
2010
|
|||
|
Richard
L. Hunter
|
57
|
Director
|
2010
|
|||
|
Sunit
Saxena1
|
|
51
|
|
Director
|
|
2010
|
Ryan M.
Petersen has served as Chief Executive Officer and a member of our Board
since founding OCZ in 2002. Mr. Petersen is the inventor or co-inventor of
much of our proprietary technology. Our Board has concluded that
Mr. Petersen should serve as a director based on his experience and insight
as one of our founders and as our Chief Executive Officer.
Kerry T.
Smith has served as our Chief Financial Officer and a member of our Board
since March 2009. Mr. Smith joined us in January 2009 as our Executive
Vice President, Corporate Development and General Counsel. Mr. Smith
previously was a corporate and securities partner with the international law
firm of DLA Piper (US) LLP from January 2006 until December 2008. From
April 2002 until January 2006, he was a corporate and securities partner with
Pillsbury Winthrop Shaw and Pitman LLP. Mr. Smith also spent several years
in public accounting and holds a CPA certificate (inactive). He is
licensed to practice law in California and Illinois. Mr. Smith holds a
B.S. in Accountancy from the University of Illinois, Urbana-Champaign and a J.D.
from Loyola University School of Law. Our Board has concluded that Mr.
Smith should serve as a director based upon his ability to offer the
perspective of a practicing attorney and his public accounting experience.
Mr. Smith’s background brings knowledge of the legal and accounting frameworks
in which public companies operate.
Alex Mei
became our Executive Vice President and Chief Marketing Officer in February 2006
responsible for our branding, product launches, channel support, and public
relations. From October 2004 to February 2006, Mr. Mei served as our
Senior Vice President of Marketing. Mr. Mei also served as one of our
directors from April 2007 to July 2009. From 1999 to 2003, Mr. Mei served
as global marketing manager of First International Computer Inc. Mr. Mei
holds a B.S. in Marketing Management from California Polytechnic State
University, San Luis Obispo.
Justin
Shong has served as our Senior Vice President of Sales since 2007.
Mr. Shong is responsible for developing sales strategies for the consumer and
commercial markets, as well as providing leadership to global sales team.
From September 2005 to December 2007, he served as Vice President of
Sales for GBH Communications, a leading video conferencing provider. From
August 2003 to September 2005, he was National Sales Manager at Acer America
Corporation, a leading global PC manufacturer, and was responsible for all sales
of Acer products into the U.S. market. Prior to that, he served in various
senior management and sales roles at companies such as Quantum3D, Savoir
Technologies, Avnet, Synnex, SGI, and Western Micro Technologies. Mr.
Shong obtained his B.S. and M.B.A. degrees from Santa Clara
University.
1 Mr. Sunit Saxena, who was appointed to
serve as the Chairman of our Audit Committee on March 23, 2010, tendered his
resignation from his position on May 6, 2010. Mr.
Saxena resigned solely because Mr. Saxena and OCZ disagreed about the
interpretation of prior discussions regarding the level of Mr. Saxena's
compensation for his service to the Board. We intend to appoint a successor to Mr.
Saxena to both the Board and our Audit Committee within the time frame required
by The NASDAQ Capital
Market
rules.
73
Outside
Directors
Adam
Epstein is the founding principal of Third Creek Advisors, LLC (“TCA”),
which acts as a special advisor to boards of small-cap companies in connection
with corporate finance. He has been with TCA since January 2010.
From 2003 to 2009, Mr. Epstein was a co-founder and principal at Enable Capital
Management, LLC, an investment firm that provides growth financing to
publicly-traded companies. Mr. Epstein previously held managerial roles
with Enable Capital, LLC, Surge Components, Inc., MailEncrypt, Inc.,
Tickets.com, Inc., and Achilles’ Wheels, Inc. Mr. Epstein started his
career as an attorney at the law firm of Brobeck, Phleger & Harrison.
He received a bachelor’s degree, cum laude, from Vassar College, and a J.D. from
Boston University. Our Board has concluded that Mr. Epstein should serve
as a director and member of our audit and compensation committees and as
chairman of our nominating and governance committee based upon his experience
with public company financings, corporate management and his prior knowledge of
our company as one of our investors.
Richard L.
Hunter has been a partner with Daylight Partners, a venture capital firm
since 2008. From 1998 to 2008, Mr. Hunter was with Dell, Inc., a computer
manufacturer and services company, where he most recently served as Vice
President of Consumer Technical Support and Customer Service and was responsible
for managing over 14,000 customer service agents. For seven years, Mr.
Hunter led Dell’s Americas manufacturing operations. Mr. Hunter previously
served in managerial roles with Matco Electronics, Texas Instruments,
Incorporated, Ericcson/General Electric, Ryan Homes, Exide Electronics and
General Electric Company. Mr. Hunter received a bachelor’s degree in
mechanical engineering from Georgia Tech. Our Board has concluded that Mr.
Hunter should serve as a director, member of our audit and nominating and
governance committees, and as chairman of our compensation committee based upon
his experience as a corporate executive and corporate management and his
knowledge of the technology and customer service sectors.
None of
our directors, nominees for director or executive officers were selected
pursuant to any arrangement or understanding, other than with our directors and
executive officers acting within their capacity as such. There are no
family relationships among our directors or executive officers and, other than
as set forth above, as of the date hereof, no directorships are held by any
director in a company which has a class of securities registered pursuant to
Section 12 of the Exchange Act, or subject to the requirements of Section 15(d)
of the Exchange Act or any company registered as an investment company under the
Investment Company Act of 1940. Officers serve at the discretion of the
Board.
Composition
of the Board of Directors
The size
of our Board is set at five directors, and our Board is currently comprised of
four directors. Our certificate of incorporation and bylaws provide that
the number of directors will be fixed from time to time by resolution of the
Board. All directors will hold office until the expiration of the term of
which elected and until their respective successors are elected, except in the
case of death, resignation or removal of any director.
Our Board
is divided into three classes with staggered three-year terms. At each
annual general meeting of stockholders, the successors to directors whose terms
then expire will be elected to serve from the time of election and qualification
until the third annual meeting following election.
The name,
term and position on committees of our Board, if any, are as
follows:
|
Director
|
Term Expires at the
Annual Meeting of
Stockholders in:
|
Audit
Committee
|
Compensation
Committee
|
Nominating and
Governance
Committee
|
||||
|
Ryan
M. Petersen
|
2010
|
|||||||
|
Kerry
T. Smith
|
2011
|
|||||||
|
Adam
Epstein
|
2011
|
Member
|
Member
|
Chairman
|
||||
|
Richard
L. Hunter
|
2012
|
Member
|
Chairman
|
Member
|
74
Board
Committees
Our Board
has established the following committees: an Audit Committee, a
Compensation Committee and a Nominating and Governance Committee. Our
Board may, from time to time, establish other committees. The composition
and responsibilities of each committee are described below. Members serve
on these committees until their resignation or until otherwise determined by our
Board.
Audit
Committee
Our Audit
Committee oversees our corporate accounting and financial reporting process and
assists the Board in monitoring our financial systems and our legal regulatory
compliance. Our Audit Committee will also:
|
|
§
|
oversee
the work of our independent
auditors;
|
|
|
§
|
approve
the hiring, discharging and compensation of our independent
auditors;
|
|
|
§
|
review
the qualifications and independence of our independent auditors; monitor
the rotation of partners of the independent auditors on our engagement
team as required by law;
|
|
|
§
|
review
our financial statements and review our critical accounting policies and
estimates;
|
|
|
§
|
review
the adequacy and effectiveness of our internal control policies and
procedures;
|
|
|
§
|
review
and discuss with management and the independent auditors the results of
our annual audits, our quarterly financial statements and our publicly
filed reports; and
|
|
|
§
|
prepare
our Audit Committee report if required by any government
agency.
|
Currently,
Messrs. Epstein and Hunter serve as members of our Audit Committee, with the
Chairman position of the Audit Committee currently vacant. Our Board has
concluded that, because of the resignation of Mr. Sunit Saxena, who was
appointed to serve as the Chairman of our Audit Committee on March 23, 2010 and
who tendered his resignation on May 6, 2010, solely
because Mr. Saxena and OCZ disagreed about the interpretation of prior
discussions regarding the level of Mr. Saxena's compensation for his service to
the Board, the
composition of our Audit Committee does not meet the requirements for three
independent members on our Audit Committee as required by The NASDAQ Capital
Market corporate governance requirements and the rules and regulations of the
SEC. We intend to appoint a successor to Mr. Saxena to both the Board and
our Audit Committee within the time frame required by The NASDAQ Capital Market
rules.
Compensation
Committee
Our
Compensation Committee reviews and recommends policy relating to compensation
and benefits of our officers and directors, administers our stock option and
benefit plans and reviews general policy relating to compensation and
benefits. Duties of the Compensation Committee include:
|
|
§
|
reviewing
and approving compensation of our executive officers, including their
annual base salary, annual incentive bonuses, equity compensation,
employment agreements, severance and change in control arrangements, and
any other benefits, compensations or
arrangements;
|
|
|
§
|
reviewing
and approving corporate goals and objectives relevant to compensation of
the chief executive officer and other executive
officers;
|
|
|
§
|
evaluating
the performance of the chief executive officer and other executive
officers in light of those goals and
objectives;
|
|
|
§
|
setting
compensation of the chief executive officer and other executive
officers;
|
|
|
§
|
administering
the issuance of stock options and other awards to executive officers and
directors under our stock plan;
|
|
|
§
|
reviewing
and evaluating, at least annually, the performance of the Compensation
Committee and its members, including compliance of the Compensation
Committee with its charter; and
|
|
|
§
|
preparing
the Compensation Committee report if required by any government
agency.
|
75
Currently,
Messrs. Epstein and Hunter serve as members of our Compensation Committee, with
Mr. Hunter serving as Chairman of the Compensation Committee. Our Board
has concluded that the composition of our Compensation Committee meets the
requirements for independence under the rules and regulations of the
SEC.
Nominating
and Governance Committee
The
primary responsibilities of the Nominating and Governance Committee are to
identify individuals qualified to become Board members, select, or recommend to
the Board, director nominees for each election of directors, develop and
recommend to the Board criteria for selecting qualified director candidates,
consider committee member qualifications, appointment and removal, recommend
corporate governance principles, codes of conduct and compliance mechanisms
applicable to us, and provide oversight in the evaluation of the Board and each
committee.
Duties of
the Nominating and Governance Committee include:
|
|
§
|
evaluate
and select, or recommend to the Board, nominees for each election of
directors, except that if we are at any time legally required by contract
or otherwise to provide any third party with the ability to nominate a
director, the Committee need not evaluate or propose such nomination,
unless required by contract or requested by the
Board;
|
|
|
§
|
determine
criteria for selecting new directors, including desired board skills and
attributes, and identify and actively seek individuals qualified to become
directors;
|
|
|
§
|
consider
any nominations of director candidates validly made by our
stockholders;
|
|
|
§
|
review
and make recommendations to the Board concerning qualifications,
appointment and removal of committee
members;
|
|
|
§
|
review
and make recommendations to the Board concerning Board and committee
compensation;
|
|
|
§
|
develop,
recommend for Board approval, and review on an ongoing basis the adequacy
of, the corporate governance principles applicable to
us;
|
|
|
§
|
in
consultation with the Audit Committee, consider and present to the Board
for adoption a Code of Conduct and Business Ethics applicable to all
employees, officers and directors, which meets the requirements of Item
406 of the SEC’s Regulation S-K, and provide for and review prompt
disclosure to the public of any change in, or waiver of, such Code of
Conduct;
|
|
|
§
|
review,
at least annually, our compliance with The NASDAQ Capital Market corporate
governance listing requirements, and report to the Board regarding the
same;
|
|
|
§
|
assist
the Board in developing criteria for the evaluation of Board and committee
performance;
|
|
|
§
|
evaluate
the Committee’s own performance on an annual
basis;
|
|
|
§
|
if
requested by the Board, assist the Board in its evaluation of the
performance of the Board and each committee of the
Board;
|
|
|
§
|
review
and recommend to the Board changes to our bylaws as
needed;
|
|
|
§
|
develop
orientation materials for new directors and corporate governance-related
continuing education for all Board members;
and
|
|
|
§
|
make
reports to the Board regarding the foregoing as
appropriate.
|
Currently,
Messrs. Epstein and Hunter serve as members of our Nominating and Governance
Committee, with Mr. Epstein serving as Chairman of our Nominating and Governance
Committee. Our Board has concluded that the composition of our Nominating
and Governance Committee meets the requirements for independence under the rules
and regulations of the SEC.
76
Compensation
Committee Interlocks and Insider Participation
Currently,
no member of our Compensation Committee is or has been a current or former
officer or employee of ours or had any related person transaction involving
us. None of our executive officers served as a director or a member of a
compensation committee (or other committee serving an equivalent function) of
any other entity, one of whose executive officers serviced as a director or
member of our Compensation Committee during the fiscal year ended February 28,
2010.
Section
16(a) Beneficial Ownership Reporting Compliance
Section 16(a)
of the Exchange Act requires our executive officers, directors and persons who
beneficially own more than 10% of our common stock to file initial reports of
beneficial ownership and reports of changes in beneficial ownership with the
SEC. These persons are required by SEC regulations to furnish us with
copies of all Section 16(a) forms filed by such person. Based solely
on our review of the forms furnished to us and written representations from
certain reporting persons, we believe that all filing requirements applicable to
our executive officers, directors and persons who beneficially own more than 10%
of our common stock were complied with in the fiscal year ended February 28,
2010.
Code
of Ethics and Corporate Governance Materials
The Board
has adopted a charter for each of the committees described above which are
available on our website at http://ir.stockpr.com/ocztechnology/governance-documents.
The Board has also adopted a Code of Conduct and Business Ethics that applies to
all of our employees, officers and directors. The Code of Conduct and
Business Ethics can be found on our website at http://ir.stockpr.com/ocztechnology/governance-documents.
77
|
Item
11.
|
Executive
Compensation
|
This
section of the report discusses the principles underlying our policies and
decisions with respect to the compensation that are paid or awarded to, or
earned by, or paid to our “Named Executive Officers,” who consist of our
principal executive officer, principal financial officer, and the three
other most highly compensated executive officers. For our fiscal year
ended February 28, 2010, our Named Executive Officers are:
|
|
§
|
Ryan
M. Petersen, President and Chief Executive
Officer
|
|
|
§
|
Kerry
T. Smith, Chief Financial Officer(1)
|
|
|
§
|
Arthur
Knapp, former Chief Financial Officer(2)
|
|
|
§
|
Alex
Mei, Chief Marketing Officer
|
|
|
§
|
Justin
Shong, Senior Vice President of Global
Sales
|
|
|
(1)
|
Mr.
Smith became our Chief Financial Officer in March 2009. From January
1, 2009 to March 2009, Mr. Smith was our Executive Vice President and
General Counsel.
|
|
|
(2)
|
Mr.
Knapp resigned as our Chief Financial Officer in March
2009.
|
Overview;
Objectives
The
Compensation Committee of our Board has overall responsibility for the
compensation program for our executive officers. The Board appoints
members of the Compensation Committee, none of whom is an executive officer of
our Company.
We have
created a compensation program that includes short-term and long-term
components, and cash and equity elements that we believe will provide
appropriate incentives to reward our executives and help to achieve the
following objectives:
|
|
§
|
attract
and retain talented and experienced
executives;
|
|
|
§
|
motivate
and reward executives whose knowledge, skills and performance are critical
to our success;
|
|
|
§
|
align
the interests of our executive officers and stockholders by motivating
executive officers to increase stockholder value and rewarding executive
officers when stockholder value
increases;
|
|
|
§
|
compensate
our executives to manage our business to meet our long-range objectives;
and
|
|
|
§
|
ensure
that total compensation is fair, reasonable and
competitive.
|
Our
executive compensation program provides for the following elements:
|
|
§
|
base
salaries, which are designed to allow us to attract and retain qualified
candidates in a highly competitive
market;
|
|
|
§
|
variable
compensation, which provides additional cash compensation and is designed
to support our pay-for-performance
philosophy;
|
|
|
§
|
equity
compensation, principally in the form of stock options, which are granted
to incentivize executive behavior that results in increased stockholder
value;
|
|
|
§
|
a
benefits package that is available to all of our employees;
and
|
|
|
§
|
post-termination
compensation.
|
A
detailed description of these components is provided below.
78
Elements
of Our Executive Compensation Program
Base Salary. We utilize
base salary as the primary means of providing compensation for performing the
essential elements of an executive’s job. We believe our base salaries are
set at levels that allow us to attract and retain executives in competitive
markets.
Variable Pay. Our
variable pay compensation, in the form of an annual cash bonus, is intended to
compensate our executives for meeting our corporate objectives and their
individual performance objectives and to incentivize our executives to meet
these objectives. In addition, our variable pay compensation is intended
to reward and incentivize our executives for exceeding their objectives.
These objectives may be both financial and non-financial and may be based on
Company, divisional or individual performance. Bonuses for our Named
Executive Officers (other than bonuses we are contractually obligated to pay
under employment agreements or arrangements) are currently determined on a
case-by-case basis by the Compensation Committee based on a mix of Company and
individual performance objectives.
Equity-Based Compensation.
Our equity-based compensation is intended to enhance our ability to
retain talent over a longer period of time, to reward longer-term efforts that
enhance future value and to provide executives with a form of reward that aligns
their interests with those of our stockholders. Executives whose skills
and results we deem to be critical to our long-term success are eligible to
receive higher levels of equity-based compensation. Executives typically
receive an equity award in the form of a stock option that vests over a period
of time upon commencement of their employment. Thereafter, they may
receive additional awards from time to time as the Compensation Committee
determines consistent with the objectives described above. Our
Compensation Committee expects to make annual equity compensation awards to our
executives in amounts that are competitive with awards then being made by
comparable companies with whom we compete for talent.
Benefits. Our benefits, such
as our basic health benefits and 401(k) plan are intended to provide a stable
array of support to executives and their families throughout various stages of
their careers and these core benefits are provided to all executives regardless
of their individual performance levels. We currently do not provide any
matching contributions made to our 401(k) plan.
Post-Termination
Compensation. We have entered into employment agreements with
certain executives to provide for specific payments and benefits to such
executives in the event of termination of employment. These severance
benefits were generally intended to match what is provided by our competitors
and also intended to provide compensation while the officer searches for new
employment after experiencing termination without “cause” and upon resignation
for “good reason.” Such post-termination compensation is also
intended to minimize the distraction caused by a potential transaction involving
a change in control and reduce the risk that an executive would leave his
employment before a transaction is consummated. We believe that providing
such severance protection for certain Named Executive Officers is an
important retention tool that is necessary in the competitive marketplace
for talented executives. We believe that the amounts of these payments and
benefits and the periods of time during which they would be provided are fair
and reasonable.
Determining
the Amount of Each Element of Compensation
Overview. The amount of each
element of our compensation program is determined by our Compensation Committee
on an annual basis taking into consideration our results of operations, long and
short-term goals, individual goals, the competitive market for our executives,
the experience of our Compensation Committee members with similar stage
companies and general economic factors. In 2009, the Compensation
Committee reviewed certain survey data purchased from the Employers Group
relating to executive compensation at various companies, which are classified
according to their numbers of employees. The Compensation Committee also
studied data on executive compensation adopted at a peer group companies,
including the following companies:
|
|
§
|
Staktek
Holdings, Inc.
|
|
|
§
|
Mindspeed
Technologies, Inc.
|
79
|
|
§
|
STEC,
Inc.
|
|
|
§
|
Silicon
Storage Technology, Inc.
|
The peer
group companies were selected because they were either of a similar size or in a
similar business to us at the time of the study and the Compensation Committee
considered them to be high-performing technology companies who are competing
with us from the similar pool of talented and experienced
executives.
The
Compensation Committee also studied compensation data from www.Salary.com and
compared such data with our then existing compensation figures for our executive
officers.
In
addition to these data, our Chief Executive Officer provides input to the
Compensation Committee on the performance and compensation levels of our
executives, other than himself. Once the level of compensation is set for
the year, the Compensation Committee may revisit its decisions if there are
material developments during the year, such as promotions, that may warrant a
change in compensation. After the year is over, the Compensation Committee
reviews the performance of the executive officers and key employees to determine
the achievement of variable pay targets and to assess the overall functioning of
our compensation plans against our goals.
We
believe it is essential to attract and retain experienced and proven
performers. Accordingly, the Compensation Committee seeks to set the base
salary and total compensation of our executives, including the Named Executive
Officers, at approximately the average of the compensation of similarly-situated
executives in comparable companies in our industry with whom we compete directly
in our hiring and retention of executives. However, the Compensation
Committee has the authority to approve position specific compensation packages
that are above or below this level based on the executive’s specific experience,
knowledge, skills, education, performance and importance to the business.
In addition to these factors, the Compensation Committee also considers
comparative compensation of our other officers when determining an individual’s
actual pay level.
We do not
have any pre-established program for bonuses. Bonuses are determined from
time to time on a case by case basis. Likewise, we do not have a
formalized policy, including any pre-set formula, in allocating stock options to
executives as a group or to any particular executive.
Base
Pay. Our
Compensation Committee reviews our executives’ base salaries on an annual basis
taking into consideration the factors described above as well as changes in
position or responsibilities. In the event of material changes in
position, responsibilities or other factors, the Compensation Committee may
consider changes in base pay during the year.
In
calendar year 2009, our Compensation Committee determined that, in general, the
annual cash compensation amounts for all of our Named Executive Officers were
substantially below the average compensation for comparable officers of the peer
group companies or the broader survey sample. Compensation received by our
Chief Executive Officer, our then Chief Financial Officer and Vice President of
Marketing were below the www.Salary.com
average figures by 31%, 29% and 25%, respectively. The Compensation
Committee recommended, and the Board adopted, the following increases in base
salary of our executives for fiscal year ended February 28, 2009. The base
salary of our executives for fiscal year ended February 28, 2010 remained the
same as those for fiscal year ended February 28, 2009.
|
Name
|
2008 Base
Salary
|
2009 Base
Salary
|
$ Increase
(2008 to
2009)
|
% Increase
(2008 to
2009)
|
2010 Base
Salary
|
$ Increase
(2009 to
2010)
|
% Increase
(2009 to
2010)
|
||||||||||||||||||||||
|
Ryan
M. Petersen
|
$ | 250,000 | $ | 325,000 | $ | 75,000 | 30 | % | $ | 325,000 | $ | - | - | % | |||||||||||||||
|
Kerry
T. Smith
|
$ | - | $ | 400,000 | $ | - | - | % | $ | 400,000 | $ | - | - | % | |||||||||||||||
|
Arthur
Knapp
|
$ | 150,000 | $ | 205,000 | $ | 55,000 | 37 | % | $ | 205,000 | $ | - | - | % | |||||||||||||||
|
Alex
Mei
|
$ | 155,000 | $ | 205,000 | $ | 50,000 | 32 | % | $ | 205,000 | $ | - | - | % | |||||||||||||||
|
Justin
Shong
|
$ | 165,000 | $ | 165,000 | $ | - | - | % | $ | 165,000 | $ | - | - | % | |||||||||||||||
80
For the
fiscal year ended February 29, 2008, it was shown that Mr. Petersen’s then base
salary was substantially lower than the average figure for a comparable company
based on any of the categories - employment size, gross revenue, or type of
ownership (i.e., private company). Mr. Petersen’s then base salary of
$250,000 was substantially lower than the base salary for any chief executive
officer at any of the peer group companies referenced above, which averaged
approximately $354,000, with this figure adjusted for inflation for comparison
purposes since the data from these peer group companies was two to three years
old. Further, based on the figures tabulated by www.Salary.com, Mr.
Petersen’s base salary was significantly lower than the average amount for his
counterparts at comparable companies, which averaged $376,000. The average
of the two comparison indices was $365,000. From its salary reviews, the
Compensation Committee recommended, and the Board adopted, an increase in Mr.
Petersen’s salary for the fiscal year ended February 28, 2009 to $325,000 such
that his base salary would be closer to (though still lower by 11% than) the
average figure provided by www.Salary.com and
certain other compensation surveys. For fiscal year ended February 28,
2010, Mr. Petersen’s salary remained at $325,000.
Mr.
Smith’s compensation was pre-determined under the terms of his employment
agreement with us.
Similar
to that of Mr. Petersen’s, Mr. Knapp’s base salary during the fiscal year ended
February 29, 2008 was significantly lower than the average figure for his
counterparts at other comparable companies, whether based on employment size,
gross revenue, or type of ownership, and whether the data were compiled by or
obtained from the Employers Group, the above referred peer group companies or
www.Salary.com.
Based on these analyses, the Compensation Committee recommended, and the Board
adopted, an increase in Mr. Knapp’s base salary starting from the beginning of
the fiscal year that ended February 28, 2009, such that Mr. Knapp’s base salary
would be closer to the average figure provided by www.Salary.com.
In the
case of Mr. Mei, the Compensation Committee determined that, based on
compensation data obtained from the Employers Group, his base salary was in line
with the average base salary for chief marketing executives at other companies
having the same range of employees. However, his base salary was
substantially lower than the average figure for his counterparts based on data
compiled by www.Salary.com.
The Compensation Committee recommended, and the Board adopted, an increase in
Mr. Mei’s base salary starting from the beginning of the fiscal year that ended
February 28, 2009, such that Mr. Mei’s base salary would be more in line with
the average figure compiled by www.Salary.com.
In the
case of Mr. Shong, the Compensation Committee determined that his base salary
was slightly more than the average base salary for his counterparts at other
similar companies, based on compensation data obtained from the Employers Group,
but was less than the average figure for those with similar responsibilities at
other companies, based on compensation data compiled by www.Salary.com.
Based on these analyses, the Compensation Committee concluded that no
adjustments to Mr. Shong’s base salary was necessary. For fiscal year
ended February 28, 2010, Mr. Shong’s salary remained at $165,000.
Variable Pay;
Bonuses.
In
addition to base salaries, annual cash bonus opportunities have been awarded to
our Named Executive Officers when our Compensation Committee and Board have
determined that such an incentive is necessary to align our corporate goals with
the cash compensation payable to an executive.
Generally,
each year the Compensation Committee considers paying our executives an annual
cash bonus. However, we do not have a bonus plan and we do not establish
corporate objectives or individual performance objectives against which an
executive is subsequently reviewed. Accordingly, bonuses for our Named
Executive Officers (other than bonuses we are contractually obligated to pay
under employment agreements or arrangements) are currently determined on a
case-by-case basis by the Compensation Committee based on their subjective
assessment of an individual’s performance within our organization during the
past year, as well as our Company’s overall financial performance and the
availability of cash with which we are able to pay bonuses. We do not have
a set formula or measure performance against pre-established targets to
determine bonus amounts for our executives.
81
Based on
this general approach, in 2008, the Compensation Committee granted Messrs.
Petersen and Knapp bonuses of $3,000 and $4,500, respectively. In the same
year, the Compensation Committee granted Mr. Mei a $6,000 bonus and a
discretionary award of $100,000 in recognition of his individual performance in
executing our marketing and branding programs. Mr. Petersen, Mr. Knapp
and Mr. Mei did not receive any bonuses or discretionary awards for
fiscal years 2009 and 2010.
For Mr.
Shong, part of his cash compensation has been commission, which is calculated
based on a percentage of sales generated by him in a given period. In 2008
and 2009, we paid Mr. Shong $8,750 and $89,880, respectively, all of which were
commission, and none of which was discretionary. Other than making a
commission payment to Mr. Shong, we did not pay a discretionary bonus in
2009. In 2010, we paid Mr. Shong $79,172 in commissions, none of which was
discretionary.
Equity
Compensation
In fiscal
years 2008 and 2009, we did not grant any options to our Named Executive
Officers. In fiscal year ended February 28, 2010, in accordance with Mr.
Smith’s employment agreement with us, we granted Mr. Smith options to purchase
200,000 shares of fully vested common stock. Other than these options
granted to Mr. Smith, options granted to executives and other employees
generally vest over a period of four years, with 25% of the shares vesting on
the one-year anniversary of the beginning vesting date, which is typically the
date of grant, except for new hires whose begin vesting date is typically the
date of hire, and in either case with 1/48 of the
shares vesting of each month thereafter. Our Compensation Committee does
not apply a rigid formula in allocating stock options to executives as a group
or to any particular executive. Instead, our Compensation Committee
exercises its judgment and discretion and considers, among other things, the
role and responsibility of the executive, competitive factors, the amount of
stock-based equity compensation already held by the executive, the non-equity
compensation received by the executive and the total number of options to be
granted to all participants during the year. Our Compensation Committee
typically makes annual grants of equity awards, if any, to our employees in
connection with its annual review of our employees’ compensation and then
throughout the year, for new hires, promotions or other changes that may warrant
additional grants.
The
following table provides information concerning options outstanding as the
fiscal year ended February 28, 2010 to our Named Executive
Officers:
|
Option Awards (1)
|
|||||||||||||||||||
|
Name
|
Number of
Securities
Underlying
Unexercised
Options (#)
Exercisable
|
Number of Securities
Underlying Unexercised
Options (#)
Unexercisable
|
Equity Incentive
Plan Awards:
Number of
Securities
Underlying
Unexercised
Unearned
Options (#)
|
Options Exercise
Price ($)
|
Option
Expiration
Date
|
||||||||||||||
|
Ryan
M. Petersen
Chief
Executive Officer
|
- | - | - | - |
-
|
||||||||||||||
|
Kerry T. Smith(2)
Chief
Financial Officer
|
200,000 | - | - | $ | 1.28 |
09/17/19
|
|||||||||||||
|
Alex
Mei
Chief
Marketing Officer
|
216,750 | 103,250 | - | $ | 4.42 |
09/17/19
|
|||||||||||||
|
Arthur Knapp(3)
Former
Chief Financial Officer
|
- | - | - | $ | - |
-
|
|||||||||||||
|
Justin
Shong
Sr.
VP of Global Sales
|
48,889 | 71,111 | - | $ | 2.09 |
09/17/09
|
|||||||||||||
|
|
(1)
|
Unless
otherwise noted, all option grants are immediately exercisable, subject to
our right to repurchase shares upon termination of employment or other
service which right lapses in accordance with the vesting schedule of the
option. These figures have been adjusted to reflect the 1 for 2.5
reverse stock split that took place in September
2009.
|
82
|
|
(2)
|
Mr.
Smith became our Chief Financial Officer in March 2009.
Mr. Smith was issued options to purchase 200,000 shares of fully
vested common stock in September
2009.
|
|
|
(3)
|
Mr.
Knapp resigned as our Chief Financial Officer in March
2009.
|
Timing
of Equity Awards
Our
Compensation Committee generally grants stock options to executives and current
employees from time to time during the year. With respect to newly hired
employees, our practice is typically to make stock grants at the first meeting
of the Compensation Committee following such employee’s hire date. We do
not have any program, plan or practice to time stock option grants in
coordination with the release of material non-public information or any
particular event.
Executive
Equity Ownership
We
encourage our executives to hold a significant equity interest in our
Company. However, we do not have specific share retention and ownership
guidelines for our executives.
Severance
and Change in Control Arrangements
Our 2004
Stock Incentive Plan, as amended (the “Stock Incentive
Plan”) permits a potential acceleration of outstanding awards in the
event that we undergo a change in control, as defined in such plan.
Whether or not a particular option grant contains an acceleration provision is
determined on a case-by-case basis. See “Employment Agreements with Named
Executive Officers” and “Severance Terms and Change of
Control Provisions” below for a description of the severance and change
in control arrangements we have with our Named Executive Officers. The
Compensation Committee believed that these arrangements were necessary to
attract and retain our Named Executive Officers. The terms of each
arrangement were determined in negotiation with the applicable Named
Executive Officer in connection with his hiring and were not based on any set
formula.
Effect
of Accounting and Tax Treatment on Compensation Decisions
In the
review and establishment of our compensation programs, we consider the
anticipated accounting and tax implications to us and our executives.
While we consider the applicable accounting and tax treatment of alternative
forms of equity compensation, these factors alone are not dispositive, and we
also consider the cash and non-cash impact of the programs and whether a program
is consistent with our overall compensation philosophy and
objectives.
Section
162(m) of the Internal Revenue Code of 1986, as amended (the “IRC”)
imposes a limit on the amount of compensation that we may deduct in any one year
with respect to our chief executive officer and each of our next three most
highly compensated executive officers, unless specific and detailed criteria are
satisfied. Performance-based compensation, as defined in the IRC, is
fully deductible if the programs are approved by stockholders and meet
other requirements. We believe that grants of equity awards under our
existing stock plans qualify as performance-based for purposes of satisfying the
conditions of Section 162(m), thereby permitting us to receive a federal income
tax deduction in connection with such awards. In general, we have
determined that we will not seek to limit executive compensation so that it is
deductible under Section 162(m). However, from time to time, we monitor
whether it might be in our interests to structure our compensation programs to
satisfy the requirements of Section 162(m). We seek to maintain
flexibility in compensating our executives in a manner designed to promote our
corporate goals and therefore our Compensation Committee has not adopted a
policy requiring all compensation to be deductible. Our Compensation
Committee will continue to assess the impact of Section 162(m) on our
compensation practices and determine what further action, if any, is
appropriate.
Role
of Executives in Executive Compensation Decisions
Our
Compensation Committee generally seeks input from our Chief Executive Officer,
Ryan M. Petersen, when discussing the performance of and compensation levels for
executives other than himself. The Compensation Committee also works with
Mr. Petersen and with our Chief Financial Officer and the head of our Human
Resources department in evaluating the financial, accounting, tax and retention
implications of our various compensation programs. Neither Mr. Petersen
nor any of our other executives participates in deliberations relating to his or
her own compensation.
83
Summary
Compensation Table
The
following table summarizes the compensation paid to our Named Executive Officers
for services rendered in all capacities to us during the fiscal years ended
February 29, 2008, February 28, 2009 and February 28, 2010
Summary
Compensation Table
|
Name and
Principal
Position
|
Fiscal Year
Ended
|
Salary ($)
|
Bonus
($)(1)
|
Stock
Awards
($)
|
Option
Awards
($)(2)
|
Non-Equity
Incentive Plan
Compensation
($)
|
All Other
Compensation
($)
|
Total ($)
|
||||||||||||||||||||||
|
Ryan
M. Petersen
|
Feb.
29, 2008
|
$ | 250,000 | $ |
3,000
|
- | - | - | - | $ | 253,000 | |||||||||||||||||||
|
Chief
Executive
|
Feb.
28, 2009
|
$ | 325,000 | - | - | - | - | - | $ | 325,000 | ||||||||||||||||||||
|
Officer
|
Feb.
28, 2010
|
$ | 325,000 | - | - | - | - | - | $ | 325,000 | ||||||||||||||||||||
|
Kerry T. Smith(3)
|
Feb.
29, 2008
|
- | - | - | - | - | - | - | ||||||||||||||||||||||
|
Chief
Financial
|
Feb.
28, 2009
|
$ | 66,666 | - | - | $ | 121,060 | - | - | $ | 187,726 | |||||||||||||||||||
|
Officer
|
Feb.
28, 2010
|
$ | 400,000 | - | - | - | - | - | $ | 400,000 | ||||||||||||||||||||
|
Alex
Mei
|
Feb.
29, 2008
|
$ | 155,000 | $ | 106,000 | (4) | - | $ | 84,616 | - | - | $ | 345,616 | |||||||||||||||||
|
Chief
Marketing
|
Feb.
28, 2009
|
$ | 205,000 | - | - | $ | 124,100 | - | - | $ | 329,100 | |||||||||||||||||||
|
Officer
|
Feb.
28, 2010
|
$ | 205,000 | - | - | $ | 108,408 | - | - | $ | 313,408 | |||||||||||||||||||
|
Arthur Knapp(5)
|
Feb.
29, 2008
|
$ | 150,000 | $ | 4,500 | - | $ | 61,358 | - | - | $ | 215,858 | ||||||||||||||||||
|
Former
Chief
|
Feb.
28, 2009
|
$ | 205,000 | - | - | $ | 83,600 | - | - | $ | 288,600 | |||||||||||||||||||
|
Financial
Officer
|
Feb.
28, 2010
|
- | - | - | - | - | - | - | ||||||||||||||||||||||
|
Justin
Shong
|
Feb.
29, 2008
|
$ | 43,150 | $ | 8,750 | - | $ | 4,600 | - | - | $ | 56,500 | ||||||||||||||||||
|
Sr.
VP of Global
|
Feb.
28, 2009
|
$ | 165,000 | $ | 89,882 | - | $ | 18,500 | - | - | $ | 273,382 | ||||||||||||||||||
|
Sales
|
Feb.
28, 2010
|
$ | 165,000 | $ | 79,172 | - | $ | 21,179 | - | - | $ | 265,351 | ||||||||||||||||||
|
|
(1)
|
From
time to time, the Board will review quarterly results and, based on those
results, will determine whether employees are entitled to receive
bonuses. Historically, the Board has not set pre-established targets
for bonuses.
|
|
|
(2)
|
An
Option award values reflect the grant date fair value of awards computed
in accordance with stock-based accounting rules (FASB ASC topic
718). See Stock
Based Compensation in the “Management’s Discussion
and Analysis of
Financial
Condition and Results of Operations” for
a discussion of assumptions made in determining the grant date fair value
and compensation expense of our stock
options.
|
|
|
(3)
|
Mr.
Smith joined us as our Senior Vice President and General Counsel on
January 1, 2009 at a base salary of $400,000 with a guaranteed bonus of
$100,000 and an additional bonus of $120,000 worth of fully vested common
stock. In March 2009, Mr. Smith became our Chief Financial
Officer. Mr. Smith agreed to take an option for 200,000 fully
vested shares in lieu of receiving a bonus of
$120,000.
|
|
|
(4)
|
Represents
$6,000 discretionary bonus and $100,000 to recognize successful marketing
and branding efforts.
|
|
|
(5)
|
Mr.
Knapp resigned as our Chief Financial Officer in March
2009.
|
Outstanding
Equity Awards for our fiscal year ended February 28, 2010
We have
granted and plan to continue to grant options to purchase our common stock to
executive officers, employees and other service providers. The following
table provides information concerning options outstanding as the fiscal year
ended February 28, 2010 to our Named Executive Officers:
84
|
Option Awards(1)
|
|||||||||||||||||||
|
Name
|
Number of
Securities
Underlying
Unexercised
Options (#)
Exercisable
|
Number of Securities
Underlying Unexercised
Options (#)
Unexercisable
|
Equity Incentive
Plan Awards:
Number of
Securities
Underlying
Unexercised
Unearned
Options (#)
|
Options Exercise
Price ($)
|
Option
Expiration
Date
|
||||||||||||||
|
Ryan
M. Petersen
|
- | - | - | - |
-
|
||||||||||||||
|
Chief
Executive Officer
|
|||||||||||||||||||
|
Kerry T. Smith(2)
|
200,000 | - | - | $ | 1.28 |
09/17/19
|
|||||||||||||
|
Chief
Financial Officer
|
|||||||||||||||||||
|
Alex
Mei
|
216,750 | 103,250 | - | $ | 4.42 |
09/17/19
|
|||||||||||||
|
Chief
Marketing Officer
|
|||||||||||||||||||
|
Arthur Knapp(3)
|
- | - | - | $ | - |
-
|
|||||||||||||
|
Former
Chief Financial Officer
|
|||||||||||||||||||
|
Justin
Shong
|
48,889 | 71,111 | - | $ | 2.09 |
09/17/09
|
|||||||||||||
|
Sr.
VP of Global Sales
|
|||||||||||||||||||
|
|
(1)
|
Unless
otherwise noted, all option grants are immediately exercisable, subject to
our right to repurchase shares upon termination of employment or other
service which right lapses in accordance with the vesting schedule of the
option.
|
|
|
(2)
|
Mr. Smith
was issued options to purchase 200,000 shares of fully vested common stock
in September 2009.
|
|
|
(3)
|
Mr.
Knapp resigned as our Chief Financial Officer in March
2009.
|
Option
Exercises and Stock Vested
None of
our Named Executive Officers exercised any options to purchase shares of common
stock or acquired any shares of common stock on vesting of restricted stock
during our fiscal year ended February 29, 2008 or February 28,
2009.
Pension
Benefits
We
currently do not sponsor any pension benefits plan.
Nonqualified
Defined Contribution and Other Nonqualified Deferred Compensation
Plans
We
currently do not sponsor any nonqualified defined contribution or nonqualified
deferred compensation plans.
Perquisites
We
provide our employees, including our Named Executive Officers, with life
insurance policies and payments of a portion of medical and dental insurance
premiums.
Employment
Agreements with Named Executive Officers
The
following information summarizes the employment agreements for our Named
Executive Officers.
85
We have
entered into executive employment agreements with each of our Named Executive
Officers. The executive employment agreements contain the executive
officers’ initial base salaries, which may have since been increased by the
Board, bonus opportunities, certain stock option grants and other employee
benefits. Each of our executive officers is an at-will employee. The
base salaries of each of the Named Executive Officers are reflected in the
Summary Compensation Table above. In March 2008, we implemented raises of
30% - 37% over 2007 salaries.
Employment
Agreement with Ryan M. Petersen
Mr.
Petersen has signed an executive employment agreement which provides for at-will
employment, salary, stock options and right to participate in our employee
benefit plans.
Employment
Agreement with Kerry T. Smith
Mr. Smith
is subject to an executive employment agreement that provides for at-will
employment. We have agreed to pay Mr. Smith severance of 6 months of base
salary plus one half of his annual bonus and cause all of his unvested shares
and options to become fully vested if he is terminated without cause or he
leaves for good reason, provided that he signs a general release of all claims
in our favor. Additionally, we have agreed in Mr. Smith’s executive
employment agreement to pay him if there is a change of control in the first
year of his employment an amount equal to 6 months of base salary plus one half
of his annual bonus as well as cause all of his unvested shares or options to
become fully vested. Currently, Mr. Smith has no unvested shares or
options.
Employment
Agreement with Alex Mei
Mr. Mei
is subject to an executive employment agreement that provides for at-will
employment. We have agreed to pay severance of 3 months of base salary if
he is terminated without cause, provided that he signs a general release of all
claims in our favor.
Employment
Agreement with Justin Shong
Mr. Shong
is subject to an executive employment agreement that provides for at-will
employment. We agree to pay Mr. Shong 3 months of salary if we terminate
without cause his employment after the first anniversary but prior to the second
anniversary of his employment. All of his option shares will be fully
vested if there is a change of control and after which Mr. Shong terminates his
employment because of a material reduction in duties or his employment is
terminated within one year of such change of control other than for
cause.
Bonuses
for our Named Executive Officers are currently determined on a case-by-case
basis by the Compensation Committee based on a mix of Company and individual
performance objectives. The Board has in the past authorized annual
bonuses to our Named Executive Officers. We have also entered into
indemnification agreements with our directors and officers. We enter into
agreements with all of our employees containing confidentiality
provisions.
Severance
Terms and Change of Control Provisions
Mr. Smith
is subject to an executive employment agreement in which we have agreed to pay
severance of 6 months of base salary plus one half of his annual bonus and cause
all his unvested shares and options to become fully vested if he is terminated
without cause or he leaves for good reason, provided that he signs a general
release of all claims in our favor. Additionally, we have agreed in
Mr. Smith’s executive employment agreement to pay him if there is a change of
control in the first year of his employment an amount equal to 6 months of base
salary plus one half of his annual bonus as well as cause all of his
unvested shares or options to become fully vested. Currently, Mr. Smith has no
unvested shares or options.
Mr. Mei
is subject to an executive employment agreement in which we have agreed to pay
severance of 3 months of base salary if he is terminated without cause, provided
that he signs a general release of all claims in our favor.
Mr. Shong
is subject to an executive employment agreement in which we have agreed to pay
severance of 3 months of base salary if his employment relationship with us is
terminated after the first anniversary but prior to the second anniversary of
his employment. Additionally, all of his option shares will be fully
vested if there is a change of control and after which Mr. Shong terminates his
employment because of a material reduction in duties or his employment is
terminated within one year of such change of control other than for
cause.
86
In
connection with Mr. Knapp’s resignation from his position as our Chief Financial
Officer, in lieu of any severance payment, we entered into a Confidential
Resignation and Consulting Agreement and General Release of Claims with Mr.
Knapp, dated March 13, 2009. Under this agreement, Mr. Knapp provided
consulting services to us as an independent contractor for up to 30 hours per
week. In exchange, Mr. Knapp received an amount equal to his base salary
starting from March 31, 2009 to June 30, 2009, but without receiving any fringe
benefits or participating in any benefit plans, other than health
insurance. Mr. Knapp was also responsible for providing, at his own
expense and in his own name, disability, liability, workers’ compensation and
other business insurance as appropriate or required by law. In August
2009, Mr. Knapp was subsequently re-hired as a regular employee.
401(k)
Defined Contribution Deferred Income Qualified Retirement Plan
We have a
tax-qualified employee savings and retirement plan, or 401(k) plan which
generally covers our employees. The plan is intended to qualify under
Sections 401(a), 401(k) and 401(m) of the IRC so that contributions, and income
earned thereon, are not taxable to employees until withdrawn from the
plan. Under the plan, employees may elect to reduce their current
compensation by up to the statutorily prescribed annual limit ($16,500 in
calendar year 2010) and have the amount of the reduction contributed to the
plan. The plan also permits, but does not require, us to make matching
contributions and profit-sharing contributions to the plan on behalf of
participants. In addition, eligible employees may elect to contribute
an additional amount of their eligible compensation as a catch-up contribution
to the 401(k) plan provided that such employees are age 50 or older ($5,500 in
calendar year 2010). As a tax-qualified plan, we generally deduct
contributions to the 401(k) plan when made, and such contributions are not
taxable to participants until distributed from the plan. Pursuant to the
terms of the plan, participants may direct the trustees to invest their accounts
in selected investment options.
2004
Stock Incentive Plan
In
December 2004, our Board adopted and our stockholders approved the Stock
Incentive Plan.
Purpose. The purpose of
the Stock Incentive Plan is to offer selected providers the opportunity to
acquire equity in OCZ through awards of options over common stock (which may
constitute incentive stock options (an “ISO”) or
non-statutory stock options (an “NSO”)) and
the award or sale of common stock. ISOs have a more favorable tax
treatment under U.S. law for the optionee. The award of options and the
award or sale of common stock under the Stock Incentive Plan is intended to be
exempt from the securities qualification requirements of the California
Corporations Code.
Shares Subject to the Stock Incentive Plan.
Subject to any additional common stock or adjustment, the aggregate number of
shares of common stock which may be issued under the Stock Incentive Plan shall
not exceed 5,232,873 shares. The number of shares of common stock which
are subject to options or other rights outstanding at any time shall not exceed
the number of shares of common stock which then remain available for issue under
the Stock Incentive Plan. In the event that any outstanding option or
other right expires or is cancelled for any reason, the shares of common stock
allocable to the unexercised portion of such option or other rights shall remain
available for issuance pursuant to the Stock Incentive Plan. If we
reacquire a share of common stock previously issued under the Stock Incentive
Plan pursuant to a forfeiture provision, a right of repurchase or a right of
first refusal, then such share shall again become available for issuance under
the Stock Incentive Plan.
Administration. The
Stock Incentive Plan is administered by the Board. However, the Board may
delegate any or all administrative functions under the Stock Incentive Plan
otherwise exercisable by the Board to one or more committees. Subject to
the provisions of the Stock Incentive Plan, the Board shall have full authority
and discretion to take any actions it deems necessary or advisable for the
administration of the Stock Incentive Plan.
Eligibility. All of our
employees are eligible for the grant of ISOs. Our employees, consultants
and non-executive directors are eligible for the grant of NSOs or the award or
sale of common stock.
Restricted Shares. Each
award or sale of shares of common stock under the Stock Incentive Plan (other
than upon exercise of any option) shall be evidenced by a restricted share
agreement between the recipient and OCZ. Any right to acquire shares of
common stock (other than an option) shall automatically expire if not exercised
by the purchaser within 30 days after OCZ communicates a grant of such right to
the purchaser. Such right shall be nontransferable and shall be
exercisable only by the purchaser to whom the right was granted. The
purchase price for common stock offered under the Stock Incentive Plan shall not
be less than 85% of the fair market value of such common stock; provided,
however, if the purchaser is a 10% stockholder, the purchase price shall not be
less than 100% of the fair market value of such common stock. Subject to
this, the Board shall determine the amount of the purchase price in its sole
discretion.
87
Stock Options. Each
option grant under the Stock Incentive Plan shall be evidenced by a stock option
agreement between us and the option holder. The stock option agreement
shall specify the number of shares of common stock that are subject to the
option, provide for the adjustment of such number and whether the option is
intended to be an ISO or an NSO.
The
exercise price per share of an ISO shall not be less than 100% of the fair
market value on the date of grant. The exercise price per share of an NSO
shall not be less than 85% of the fair market value of a share on the date of
grant. If the option holder is a 10% stockholder, the exercise price per
share of any ISO or NSO must be at least 110% of the fair market value on the
date of grant. Subject to this, the exercise price under any option shall
be determined by the Board in its sole discretion.
The term
of an option shall in no event exceed 10 years from the date of grant. The
term of an ISO granted to a 10% stockholder shall not exceed 5 years from the
date of grant. Subject to this, the Board, in its sole discretion, shall
determine when an option shall expire.
The date
when all or any installment of the option is to become exercisable shall be
specified in the stock option agreement; provided, however, that no option shall
be exercisable unless the option holder has delivered to us an executed copy of
the stock option agreement. An option granted to an option holder who is
not a consultant, officer or director shall be exercisable at the minimum rate
of 20% per year for each of the first 5 years starting from the date of grant,
subject to reasonable conditions such as continued service. An option
granted to an option holder who is a consultant or an officer or director shall
be exercisable at any time during any period established by the Board, subject
to reasonable conditions such as continued service. Subject to the
preceding conditions, the Board shall determine when all or any installment of
an option is to become exercisable. A stock option agreement may permit
the option holder to exercise their option early, provided any unvested shares
remain subject to our right of repurchase.
Common
stock purchased upon exercise of options shall be subject to such forfeiture
conditions, rights of repurchase, rights of first refusal and other transfer
restrictions as the Board may determine.
During an
option holder’s lifetime, his or her options shall be exercisable only by the
option holder or by the option holder’s guardian or legal representative, and
shall not be transferable other than by beneficiary designation, will, or the
laws of descent and distribution. If a stock option agreement so provides,
an NSO may be transferred by the option holder to one or more family members or
a trust established for the benefit of the option holder and/or one or more
family members.
The
option shall set forth the extent to which the option holder shall have the
right to exercise the option following termination of the option holder’s
service. To the extent the option was vested and exercisable upon the
option holder’s termination of service, the option holder will have the right to
exercise the option for at least 30 days after termination of service that is
due to any reason other than cause, death or disability, and for at least 6
months after termination of service that is due to death or disability (but in
no event later than the expiration of the option term). If the option
holder’s service is terminated for cause, the stock option agreement may provide
that the option holder’s right to exercise the option terminates immediately on
the effective date of the option holder’s termination of service. To the
extent the option was not exercisable for vested common stock upon termination
of service, the option shall terminate when the option holder’s service
terminates.
An option
holder or a transferee of an option holder shall have no rights as a stockholder
with respect to any common stock covered by the option until such person becomes
entitled to receive such common stock by filing a notice of exercise and paying
the exercise price.
88
Within
the limitations of the Stock Incentive Plan, the Board may modify, extend or
renew outstanding options or may accept the cancellation of outstanding options
in return for the grant of new options for the same or a different number of
shares of common stock, and at the same or different exercise
price.
Amendment and
Terminations. The Stock Incentive Plan automatically terminates 10
years after adoption by the Board, and the Board may amend, suspend or terminate
the Stock Incentive Plan at any time or for any reason. To amend the Stock
Incentive Plan or an outstanding option or common stock purchased under the
Stock Incentive Plan in a manner that is adverse to the holder of such option or
common stock requires the consent of the holder of such option or common
stock. No shares of common stock shall be issued or sold under the Stock
Incentive Plan after the termination thereof, except upon exercise of an
option granted prior to such termination.
Director
Compensation
Under our
director compensation policy, we reimburse non-employee directors for reasonable
expenses in connection with attendance at board and committee meetings.
Director compensation is reviewed and benchmarked against comparable companies
by our Compensation Committee. For fiscal year ending February 28, 2011,
each of our nonemployee directors will receive: (i) $5,000 as a quarterly
stipend; (ii) $1,000 per meeting of the Board if the director attends in person
or $500 per meeting of the Board if the director attends via telephone; (iii)
$5,000 annually if the director serves on the Audit Committee; (iv) $2,500
annually for each of the Board committees; and (v) $7,500 annually for being a
chair of any of the Board committees. In addition, each non-employee
director has been granted options to purchase up to 110,000 shares of common
stock at an exercise price of $4.35 per share. The options will vest
ratably monthly over a thirty-six month period.
The
following table sets forth information concerning compensation paid or accrued
for services rendered to us by our non-employee directors for the fiscal year
ended February 28, 2010.
|
Name(1)
|
Fees Earned or
Paid in Cash ($)
|
Stock
Awards ($)
|
Option
Awards
($)(2)
|
Non-Equity
Incentive Plan
Compensation
|
Change in
Pension Value
and
Nonqualified
Deferred
Compensation
Earnings
|
All Other
Compensation
($)
|
Total ($)
|
|||||||||||||||||||||
|
George Kynoch(3)
|
$ | 52,500 | - | $ | 15,731 | - | - | - | $ | 68,231 | ||||||||||||||||||
|
Quentin Solt(4)
|
$ | 78,600 | - | $ | 30,294 | - | - | - | $ | 108,894 | ||||||||||||||||||
|
|
(1)
|
See
the Summary Compensation Table for disclosure related to Ryan M. Petersen
and Kerry T. Smith, who are our Chief Executive Officer and Chief
Financial Officer, respectively. Messrs. Petersen and Smith, as
employee directors, did not receive any additional compensation for their
services as members of our Board.
|
|
|
(2)
|
Option
award values reflect the grant date fair value of awards computed in
accordance with stock-based accounting rules (FASB ASC topic 718).
See Note 2 of Notes to Consolidated Financial Statements for a discussion
of valuation assumptions made in determining the grant date fair value and
compensation expense of our stock
options.
|
|
|
(3)
|
George
Kynoch had a written consulting agreement with OCZ in connection with his
position as a director. The consulting agreement provided for
compensation of £40,000 (approximately $60,000) per year for his service
as a member of the Board, a member of each of the Compensation and Audit
Committees, Chairman of the Board and Chairman of the Audit
Committee. The Board subsequently increased Mr. Kynoch’s
compensation to £54,000 (approximately $81,000) per year. If
Mr. Kynoch’s services to OCZ exceeded an aggregate of three days in
any single month, then he would have received £1,000 (approximately
$1,500) per eight hours of service to the Board. In connection with
his services on the Board, Mr. Kynoch received options to purchase 60,000
shares of our common stock. Mr. Kynoch resigned from all
positions with OCZ in
July 2009.
|
89
|
|
(4)
|
Quentin
Solt had a written consulting agreement with OCZ in connection with his
position as a director. The consulting agreement provided for
compensation of £25,000 (approximately $37,500) per year for his service
as a member of the Board, a member of each of the Compensation and Audit
Committees and Chairman of the Compensation Committee. The
Board subsequently increased Mr. Solt’s compensation to £36,000
(approximately $54,000) per year. If Mr. Solt’s services to OCZ
exceeded an aggregate of three days in any single month, then he would
have received £1,000 (approximately $1,500) per eight hours of service to
the Board. In connection with his services on the Board, Mr.
Solt received options to purchase 60,000 shares of our common
stock. Mr. Solt resigned from all positions with OCZ in January
2010 resulting in forfeiture of all of his then outstanding vested options
because they were not subsequently exercised within the prescribed 90 day
period.
|
90
|
Item
12.
|
Security
Ownership of Certain Beneficial Owners and Management and Related
Stockholder Matters
|
The
following table contains information as of April 30, 2010 as to the number of
shares of our common stock beneficially owned by (i) each person we know to own
beneficially more than 5% of our common stock, (ii) each person who is a
director, (iii) the executive officers for whom information is included in the
Summary Compensation Table and (iv) all persons as a group who are directors and
executive officers and as to the percentage of outstanding shares held by these
persons on that date. The numbers set forth below give affect to the
1 for 2.5 reverse stock split that occurred in September 2009. As of
April 30, 2010, 26,460,015 shares of our common stock were issued and
outstanding. Unless otherwise indicated, all persons named as
beneficial owners of our common stock have sole voting power and sole investment
power with respect to the shares indicated as beneficially owned.
Unless
otherwise indicated, all persons named below can be reached at OCZ Technology
Group, Inc., 6373 San Ignacio Avenue, San Jose, California 95119.
|
Name and Address of Beneficial Owner(1)
|
Number of Shares
Beneficially Owned(2)
|
Percent(3)
|
||||||
|
CIM
Investment Management Limited(4)
British
Columbia House
1
Regent Street
London
SW1Y 4NS
United
Kingdom
|
1,355,000 | 5.12 | % | |||||
|
Arthur
Armagast(5)
|
4,068,800 | 15.38 | % | |||||
|
Ryan
M. Petersen(6)
|
4,996,348 | 18.88 | % | |||||
|
Kerry
T. Smith(7)
|
207,015 | * | % | |||||
|
Alex
Mei(8)
|
350,000 | 1.31 | % | |||||
|
Arthur
Knapp
|
447,117 | 1.69 | % | |||||
|
Justin
Shong(9)
|
120,000 | * | % | |||||
|
Quentin
Solt
|
160,458 | * | % | |||||
|
George
Kynoch
|
9,200 | * | % | |||||
|
Adam
Epstein(10)
|
159,998 | * | % | |||||
|
Richard
L. Hunter(11)
|
110,000 | * | % | |||||
|
Sunit
Saxena(12)
|
110,000 | * | % | |||||
|
Directors
and executive officers as a group (10 persons)(13)
|
6,670,136 | 24.30 | % | |||||
|
|
*
|
Represents
less than 1% of the issued and outstanding shares of our common stock as
of April 30, 2010.
|
|
|
(1)
|
Except
as otherwise indicated, the persons named in this table have sole voting
and investment power with respect to all shares of common stock shown as
beneficially owned by them, subject to community property laws where
applicable and to the information contained in the footnotes to this
table.
|
|
|
(2)
|
Under
the rules of the Securities and Exchange Commission, a person is deemed to
be the beneficial owner of shares that can be acquired by such person
within 60 days upon the exercise of their options. Except
as otherwise noted, options granted under our Stock Incentive Plan are
immediately exercisable, subject our right to repurchase unvested shares
upon termination of employment or other service at a price equal to the
option exercise price.
|
|
|
(3)
|
Calculated
on the basis of 26,460,015 shares of common stock outstanding as of
April 30, 2010 provided that any additional shares of common stock that a
stockholder has the right to acquire within 60 days after the date of
this filing are deemed to be outstanding for the purpose of calculating
that stockholder’s percentage beneficial
ownership.
|
91
|
|
(4)
|
CIM
Investment Management Limited has sole voting and dispositive power with
respect to these shares, as set forth in Schedule 13G filed with the SEC
on April 9, 2010.
|
|
|
(5)
|
Includes
2,400,000 shares held by Pearl Investments LLC. Mr. Armagast
has sole voting and dispositive power with respect to these
shares. Also includes 1,468,800 shares held by The Arthur P.
Armagast Trust and 200,000 shares held by The Christine Armagast Trust
and of which
Mr. Armagast disclaims any interest. Mr. Armagast is the
trustee of both trusts.
|
|
|
(6)
|
All
of the shares are held by the Petersen Family Trust. Mr.
Petersen, as trustee of these trusts, has voting and dispositive power
over these securities.
|
|
|
(7)
|
Mr.
Smith is entitled to purchase 200,000 shares of our common stock, in
addition to the 7,015 which he currently
owns.
|
|
|
(8)
|
Includes
320,000 shares subject to immediately exercisable options, of which
233,000 shares will be vested within 60 days of April 30,
2010.
|
|
|
(9)
|
Includes
120,000 shares subject to immediately exercisable options, of which 61,666
shares will be vested within 60 days of April 30,
2010.
|
|
|
(10)
|
Includes
(i) immediately exercisable warrants to purchase 16,666 shares of our
common stock and (ii) 110,000 shares subject to immediately exercisable
options, of which 9,166 shares will be vested within 60 days of April 30,
2010.
|
|
|
(11)
|
Includes
110,000 shares subject to immediately exercisable options, of which 9,166
shares will be vested within 60 days of April 30,
2010.
|
|
|
(12)
|
Includes
110,000 shares subject to immediately exercisable options, of which 3,055
shares were vested as of his resignation on May 6, 2010. No
additional shares will be vested within 60 days of April 30,
2010.
|
|
|
(13)
|
See
notes 6 through 12. Includes 986,666 shares subject to
options and warrants that are currently exercisable or will become
exercisable within 60 days of April 30, 2010 that are beneficially owned
by executive officers and
directors.
|
|
Item 13.
|
Certain
Relationships and Related Transactions, and Director
Independence
|
Since
January 1, 2007, we have not participated in nor currently plan to participate
in any transaction of a material amount in which any founder, officer, director,
greater than 5% stockholder or other related person had or will have a direct or
indirect material interest except those compensatory arrangements described
elsewhere in this report and the following transaction: Ryan M.
Petersen, our President and Chief Executive Officer loaned us $500,000 on August
19, 2009. One half of the principal of such loan was on February 19,
2010 and the balance is due on September 1, 2010. Interest at the
rate of 7.5% per annum is payable monthly beginning November 19,
2009. Even though half of the principal loan amount was due in
February, Mr. Petersen waived payment until April 2010, at which time he was
paid half of the principal loan amount plus interest accrued through April
2010. The transaction was reviewed and approved by our Audit
Committee. As a founder and significant equity holder in OCZ, Mr.
Petersen is a “promoter” of OCZ as such term is defined under the rules of the
SEC.
We have
not adopted a written policy or procedure for the review, approval and
ratification of related party transactions. However, our Audit
Committee Charter requires the Audit Committee to review and approve any related
party transaction to determine if such transaction presents any potential
conflict of interest or any other improprieties. Further, it is our
intention to ensure that all transactions between us and any of our officers,
directors and principal stockholders and their affiliates are approved by a
majority of our Board, including a majority of the disinterested members of our
Board, and are on terms no less favorable to us than those that we could obtain
from unaffiliated third parties.
92
|
Item 14.
|
Principal
Accounting Fees and Services
|
The
following table sets forth the aggregate fees billed to us for the fiscal years
ended February 28, 2010 and February 28, 2009 by Crowe Horwath LLP and Horwath
Clark Whitehill, LLP:
|
Fiscal Year
Ended February
28, 2010
|
Fiscal Year
Ended February
28, 2009
|
|||||||
|
Audit
fees
|
$ | 125,259 | $ | 208,074 | ||||
|
Audit
related fees
|
$ | 26,372 | $ | 1,256 | ||||
|
Tax
fees
|
$ | - | $ | - | ||||
|
All
other fees
|
$ | 9,015 | $ | 37,180 | ||||
| $ | 160,646 | $ | 246,510 | |||||
93
|
Item 15.
|
Exhibits,
Financial Statement Schedules
|
|
|
1.
|
Financial
Statements
|
The
information required by this item is included in Item 8 of Part II of this
report.
|
|
2.
|
Financial
Statement Schedules
|
None.
|
|
3.
|
Exhibits
|
The
information required by this item is included on the exhibit index that follows
the signature page of this report.
94
Part
IV
Signatures
Pursuant
to the requirements of Section 13 or 15(d) of the Securities Exchange Act of
1934, the Registrant has duly caused this report to be signed on its behalf by
the undersigned, thereunto duly authorized, in San Jose, California on May
20, 2010.
|
OCZ
Technology Group, Inc.
|
|
|
By:
|
/s/
Ryan M. Petersen
|
|
Ryan
M. Petersen
|
|
|
President
and Chief Executive Officer
|
|
|
By:
|
/s/ Kerry T. Smith |
|
Kerry
T. Smith
|
|
|
Chief
Financial Officer
|
Pursuant
to the requirements of the Securities Exchange Act of 1934, this report has been
signed by the following persons below on behalf of the registrant in the
capacities and on the dates indicated.
|
Name
|
Title
|
Date
|
||
| /s/ Ryan M. Petersen |
Chief
Executive Officer and Director
|
May
20, 2010
|
||
|
Ryan
M. Petersen
|
(Principal
Executive Officer)
|
|||
|
Chief
Financial Officer and Director
|
May
20, 2010
|
|||
| /s/ Kerry T. Smith |
(Principal
Financial and Accounting Officer)
|
|||
|
Kerry
T. Smith
|
||||
| /s/ Adam Epstein |
Director
|
May
20, 2010
|
||
|
Adam
Epstein
|
||||
| /s/ Richard L. Hunter |
Director
|
May
20, 2010
|
||
|
Richard
L. Hunter
|
95
Exhibit
Index
|
Exhibit
No.
|
Description
|
|
|
2.1
|
Agreement
and Plan of Merger dated December 17, 2004 of OCZ Technology Group,
Inc., an Indiana corporation, with and into OCZ Technology Group, Inc., a
Delaware corporation. (1)
|
|
|
2.2
|
Asset
Purchase Agreement dated May 25, 2007 by and among OCZ Technology
Group, Inc., PC Power and Cooling, Inc. and Douglas Dodson. (1)
|
|
|
2.3
|
Asset
Purchase Agreement dated October 25, 2007 by and among OCZ Technology
Group, Inc., Silicon Data Inc., a New York corporation, Fred Cohen, and
Eyal Akler. (1)
|
|
|
3.1
|
Fourth
Amended and Restated Certificate of Incorporation as filed with the
Delaware Secretary of State on September 30, 2009.
(1)
|
|
|
3.2
|
Fourth
Amended and Restated Bylaws. (1)
|
|
|
3.3
|
Certificate
of Designation as filed with the Delaware Secretary of State on November
4, 2009. (4)
|
|
|
4.1
|
Specimen
common stock certificate of OCZ Technology Group, Inc. (1)
|
|
|
10.1
|
OCZ
Technology Group, Inc. 2004 Stock Incentive Plan.
(1)
|
|
|
10.2
|
Executive
Employment Agreement dated April 4, 2006 by and between OCZ
Technology Group, Inc. and Ryan M. Petersen.
(1)
|
|
|
10.3
|
Executive
Employment Agreement dated April 4, 2006 by and between OCZ
Technology Group, Inc. and Arthur Knapp.
(1)
|
|
|
10.4
|
Executive
Employment Agreement dated April 4, 2006 by and between OCZ
Technology Group, Inc. and Alex Mei.
(1)
|
|
|
10.5
|
Executive
Employment Agreement dated December 17, 2008 by and between OCZ
Technology Group, Inc. and Kerry Smith.
(1)
|
|
|
10.6
|
Offer
Letter dated June 13, 2006 memorializing the terms of Mr. George
Kynoch’s services as a non-executive director. (1)
|
|
|
10.7
|
Offer
Letter dated June 13, 2006 memorializing the terms of
Mr. Quentin Colin Maxwell Solt’s services as a non-executive
director.
(1)
|
|
|
10.8
|
Sub-Sublease
dated January 30, 2009 by and between Oracle USA, Inc. and OCZ
Technology Group, Inc. for the property located in San Jose, California,
USA. (1)
|
|
|
10.9
|
Lease
dated April 21, 2005 by and between Buckgolf Inc., & Greengolf
Inc. and OCZ Technology Group, Inc. dated for the property located in
Markham, Ontario, Canada. (1)
|
|
|
10.10
|
English
translation of lease dated August 7, 2005 by and between Vrodest
Delft C.V. and OCZ Technology Group, Inc. for the property located in
Delft, The Netherlands. (1)
|
|
|
10.11
|
English
summary of lease for the property located in Taipei County, Taiwan. (1)
|
|
|
10.12
|
English
summary of lease for the property located in Lujhu Township, Taiwan. (1)
|
96
|
10.13
|
Form
of Indemnification Agreement for Directors and Officers of OCZ Technology
Group, Inc. (1)
|
|
|
10.14
|
Executive
Employment Agreement dated November 30, 2007 by and between OCZ
Technology Group, Inc. and Justin Shong.
(1)
|
|
|
10.15
|
Loan
and Security Agreement dated July 2009 by and between OCZ Technology
Group, Inc. and Silicon Valley Bank. (1)
|
|
|
10.16
|
Sale
of Accounts and Security Agreement by and between OCZ Technology Group,
Inc. and Faunus Group International, Inc. dated July 6, 2009. (1)
|
|
|
10.17
|
Asset
Purchase Agreement dated August 31, 2009, by and between OCZ
Technology Group, Inc. and BCInet, Inc. (1)
|
|
|
10.18
|
Secured
Promissory Note, dated August 31, 2009, issued by BCInet, Inc. to OCZ
Technology Group, Inc. in the amount of $311,215. (1)
|
|
|
10.19
|
Secured
Promissory Note, dated August 31, 2009, issued by BCInet, Inc. to OCZ
Technology Group, Inc. in the amount of $170,000. (1)
|
|
|
10.20
|
Secured
Convertible Promissory Note, dated August 31, 2009, issued by BCInet,
Inc. to OCZ Technology Group, Inc. in the amount of $414,200. (1)
|
|
|
10.21
|
Series A
Preferred Stock Purchase Agreement dated August 31, 2009 by and
between BCInet, Inc. and OCZ Technology Group, Inc. (1)
|
|
|
10.22
|
Security
Agreement dated August 31, 2009 by and between BCI net, Inc. and OCZ
Technology Group, Inc.
(2).
|
|
|
10.23
|
Confidential
Resignation and Consulting Agreement and General Release dated March 12,
2009 by and between OCZ Technology Group, Inc. and Arthur Knapp. (3)
|
|
|
10.24
|
Promissory
Note dated August 19, 2009 from OCZ Technology Group, Inc. to The Ryan
Petersen and Sarita Nuez Family Trust. (3)
|
|
|
10.25
|
Distribution
Agreement June 2009, by and between OCZ Technology Group, Inc.
and Bell Microproducts Canada. (5)
|
|
|
10.26
|
Securities
Purchase Agreement dated March 23, 2010 by and among OCZ Technology Group,
Inc. and the institutional and accredited investors listed therein (6)
|
|
|
10.27
|
Registration
Rights Agreement dated March 23, 2010 by and among OCZ Technology Group,
Inc. and the Purchasers (as defined therein). (6)
|
|
|
10.28
|
Form
of Warrant for the institutional and accredited investors. (6)
|
|
|
10.29
|
Form
of Warrant for Placement Agent (as defined therein). (6)
|
|
|
10.30
|
Second
Amendment to the Loan and Security Agreement dated May 10, 2010 by and
between OCZ Technology Group, Inc. and Silicon Valley Bank. (8)
|
|
|
10.31
|
Offer
Letter dated December 30, 2009 memorializing the terms of Mr. Adam
Epstein’s services as a non-executive director. (9)
|
|
|
10.32
|
Offer
Letter dated December 30, 2009 memorializing the terms of Mr. Richard
L. Hunter’s services as a non-executive director. (9)
|
97
|
10.33
|
Offer
Letter dated December 30, 2009 memorializing the terms of Mr. Sunit
Saxena’s services as a non-executive director. (9)
|
|
|
14.1
|
Code
of Ethics. (9)
|
|
|
16.1
|
Letter
regarding change in certifying accountants dated April 5, 2010 from
Horwath Clark Whitehill. (7)
|
|
|
21.1
|
Subsidiaries
of OCZ Technology Group, Inc. (1)
|
|
|
23.1
|
Consent
of Independent Certified Public Accountant – Crowe Horwath, LLP. (9)
|
|
|
23.2
|
Consent
of Independent Certified Public Accountant – Horwath Clark Whitehill, LLP.
(9)
|
|
|
31.1
|
Chief
Executive Officer’s Certification required by Rule 13(a)-14(a). (9)
|
|
|
31.2
|
Chief
Financial Officer’s Certification required by Rule 13(a)-14(a). (9)
|
|
|
32.1
|
Chief
Executive Officer and Chief Financial Officer Certification pursuant to 18
U.S.C. 1350, as adopted to section 906 of the Sarbanes-Oxley Act of 2002.
(9)
|
|
|
(1)
|
Incorporated
by reference to exhibit of the same number to the Registrant’s Form 10
filed on September 30,
2009.
|
|
(2)
|
Incorporated
by reference to exhibit of the same number to the Registrant’s Form 10
filed on November 12, 2009.
|
|
(3)
|
Incorporated
by reference to exhibit of the same number to the Registrant’s Form 10
filed on December 4, 2009.
|
|
(4)
|
Incorporated
by reference to Exhibit 3.1 to the Registrant’s Form 10-Q filed on January
14, 2010.
|
|
(5)
|
Incorporated
by reference to Exhibit 99.2 to the Registrant’s Form 8-K filed on January
25, 2010.
|
|
(6)
|
Incorporated
by reference Registrant’s Form 8-K filed on March 26,
2010.
|
|
(7)
|
Incorporated
by reference to Exhibit 16.1 to the Registrant’s Form 8-K filed on April
8, 2010.
|
|
(8)
|
Incorporated
by reference to Exhibit 99.1 to the Registrant’s Form 8-K filed on May 11,
2010.
|
|
(9)
|
Filed
herewith.
|
98