Attached files
| file | filename |
|---|---|
| 8-K - FORM 8-K - Beneficial Mutual Bancorp Inc | t67083_8k.htm |
Exhibit 99.1
 |
Investor
Presentation
Beneficial
Mutual Bancorp, Inc. (MHC)
NASDAQ:
BNCL
May
14, 2010
|
 |
Safe
Harbor Statement
This
presentation may contain projections and other “forward-looking
statements”
This
presentation may contain projections and other forward looking
statements
within
the meaning of the federal securities laws. These statements are not
historical
facts,
rather statements based on the current expectations of Beneficial
Mutual
Bancorp,
Inc. (the “Company”) regarding its business strategies, intended results
and
future
performance. Forward-looking statements are preceded by terms such
as
future
performance. Forward looking statements are preceded by terms such
as
“expects,”
“believes,” “anticipates,” “intends” and similar expressions.
Management’s
ability to predict results or the effect of future plans or strategies
is
inherently
uncertain. Factors that could affect actual results include interest
rate
trends
the general economic climate in the market area in which the
Company
trends,
the general economic climate in the market area in which the
Company
operates,
as well as nationwide, the Company’s ability to control costs and
expenses,
competitive
products and pricing, loan delinquency rates, changes in federal and
state
legislation
and regulation and other factors that may be described in the
Company’s
filings
with the Securities and Exchange Commission including its Annual Reports
on
filings
with the Securities and Exchange Commission, including its Annual Reports
on
Form
10-K and Quarterly Reports on Form 10-Q and other required filings.
These
factors
should be considered in evaluating the forward-looking statements and
undue
reliance
should not be placed on such statements. The Company assumes
no
obligation
to update any forward-looking statements
obligation
to update any forward looking statements.
This
presentation includes interim and unaudited financials, which are subject
to
further
review by the Company’s independent
accountants.
|
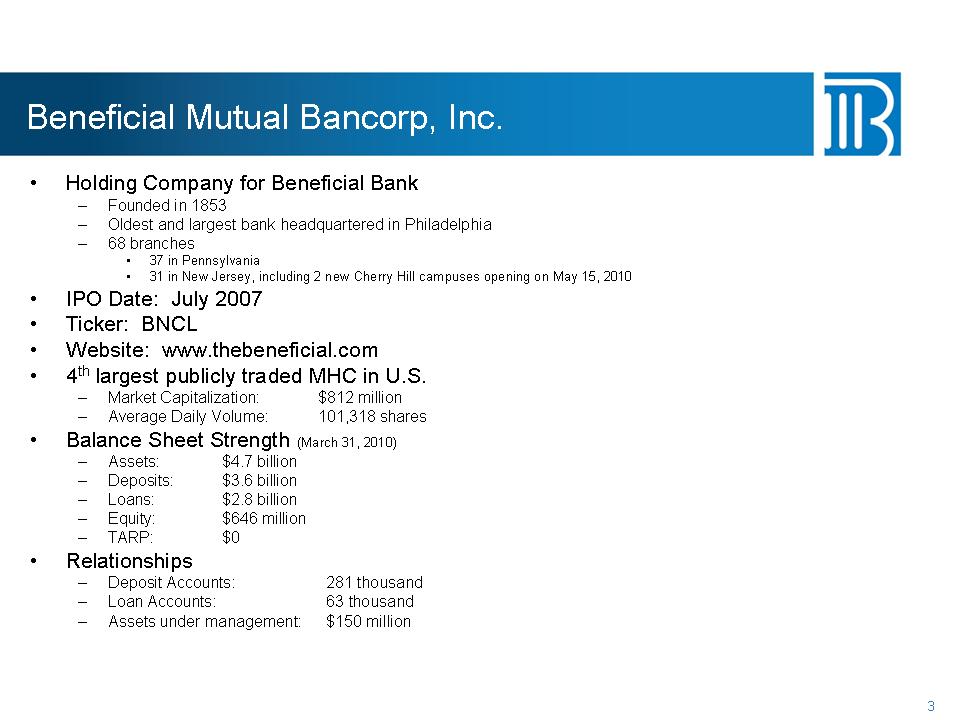 |
Beneficial
Mutual Bancorp, Inc.
•
Holding Company for Beneficial Bank
–
Founded in 1853
Founded
in 1853
–
Oldest and largest bank headquartered in Philadelphia
–
68 branches
•
37 in Pennsylvania
•
31 in New Jersey, including 2 new Cherry Hill campuses opening on May 15,
2010
•
IPO Date: Julyy 2007
•
Ticker: BNCL
•
Website: www.thebeneficial.com
•
4th largest publicly traded MHC in U.S.
–
Market Capitalization: $812 million
A
D V 101 318 101,318 shhares
Average
Dail ily Vollume:
–
–
–
•
Balance Sheet Strength (March 31, 2010)
–
Assets: $4.7 billion
–
Deposits: $3.6 billion
–
Loans: $2.8 billion
Eit
$646$646 million
Equity:
illi
–
TARP: $0
•
Relationships
–
Deposit Accounts: 281 thousand
–
Loan Accounts: 63 thousand
AAssetts
under managementt: $150 illi
d
$150 million
|
 |
Our
Philosophy
“Vacere
Comptus Verus” – Do what’s right
Education
Company
Vacere
Comptus Verus Do what s right
•
Educate our customers to do the right thing financially
Educate
our customers to do the right thing financially
•
Educate ourselves to understand the situation, goals and
needs
of our customers
Invest
in tools and resources for our customers
•
FinanceWorks
•
Small Business FinanceWorks
•
BankThanks Reward Program
•
Mobile Banking
Mobile
Banking
|
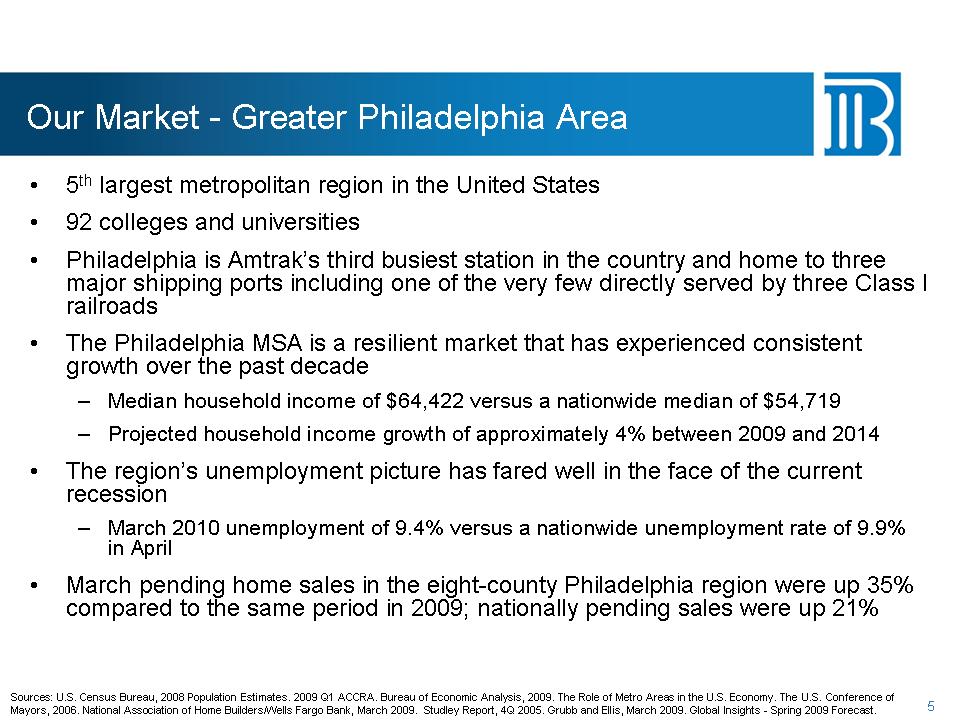 |
•5th
largest metropolitan region in the United States
Our
Market -Greater Philadelphia Area
•
The Philadelphia MSA is a resilient market that has experienced
consistent
growth
over the past decade
railroads•
92 colleges and universities
•
Philadelphia is Amtrak’s third busiest station in the country and home to
three
major
shipping ports including one of the very few directly served by three
Class I
railroads
–
Median household income of $64,422 versus a nationwide median of
$54,719
–
Projected household income growth of approximately 4% between 2009 and
2014
•
The region’s unemployment picture has fared well in the face of the
current
recession
–
March 2010 unemployment of 9.4% versus a nationwide unemployment rate of
9.9%
in
April
•
March pending home sales in the eight-county Philadelphia region were up
35%
comppared
to the same period in 2009;; nationally pendingg sales were upp
21%
p
yp
Sources:
U.S. Census Bureau, 2008 Population Estimates. 2009 Q1 ACCRA. Bureau of
Economic Analysis, 2009. The Role of Metro Areas in the U.S. Economy. The
U.S. Conference of
Mayors,
2006. National Association of Home Builders/Wells Fargo Bank, March 2009.
Studley Report, 4Q 2005. Grubb and Ellis, March 2009. Global Insights
-Spring 2009 Forecast.
|
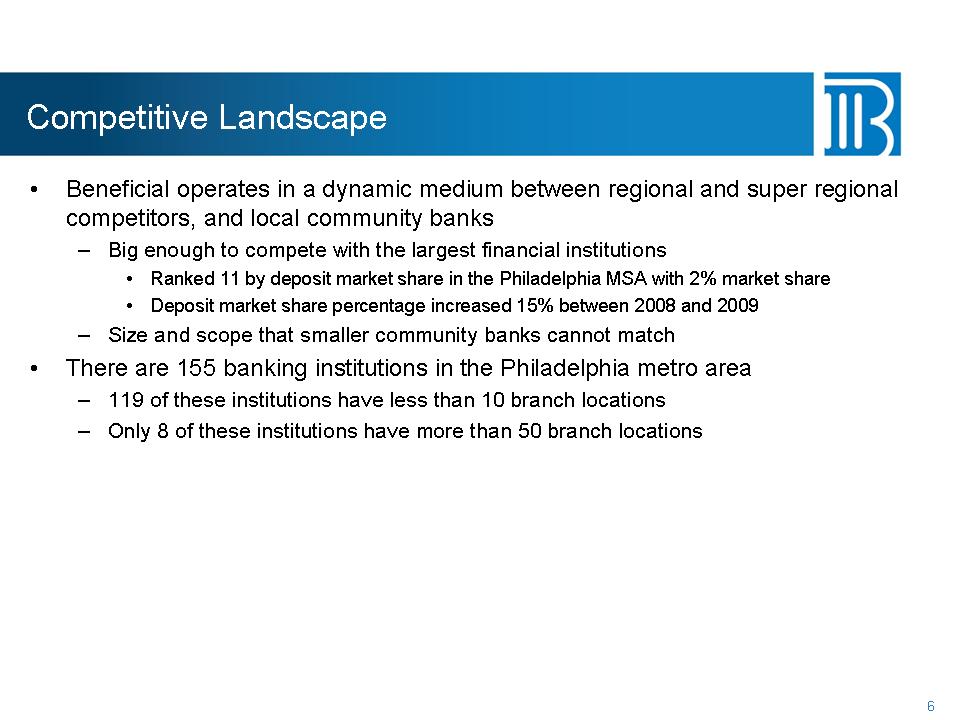 |
Competitive
Landscape
•
Beneficial operates in a dynamic medium between regional and super
regional
competitors,
and local community banks
–
Big enough to compete with the largest financial institutions
•
Ranked 11 by deposit market share in the Philadelphia MSA with 2% market
share
•
Deposit market share percentage increased 15% between 2008 and
2009
Deposit
market share percentage increased 15% between 2008 and 2009
–
Size and scope that smaller community banks cannot match
•
There are 155 banking institutions in the Philadelphia metro
area
–
119 of these institutions have less than 10 branch locations
–
Only 8 of these institutions have more than 50 branch
locations
|
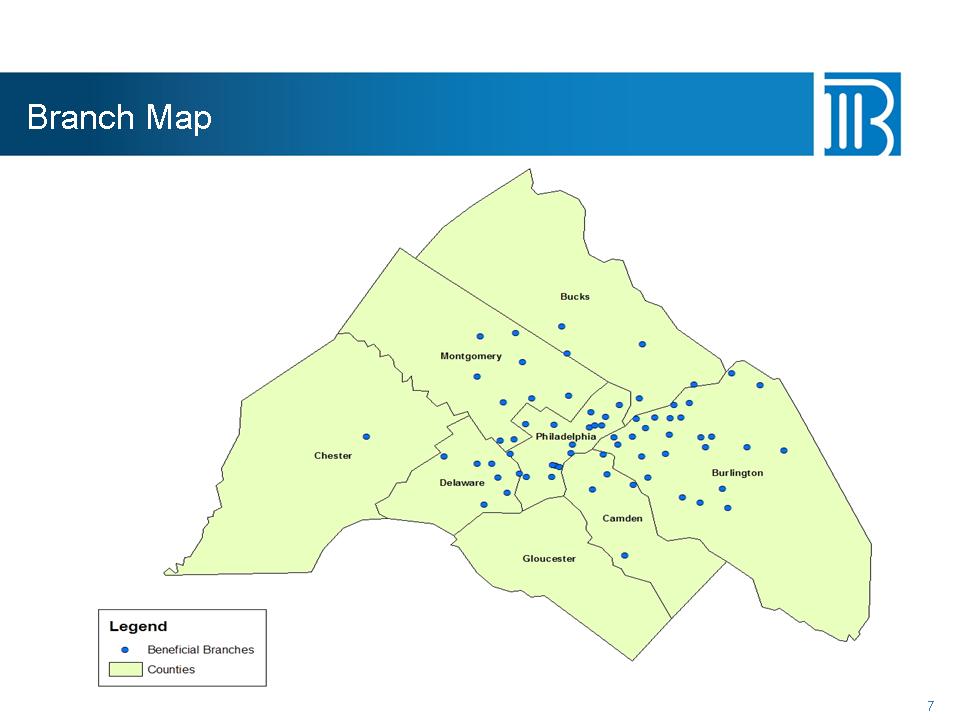 |
Branch
Map
7
|
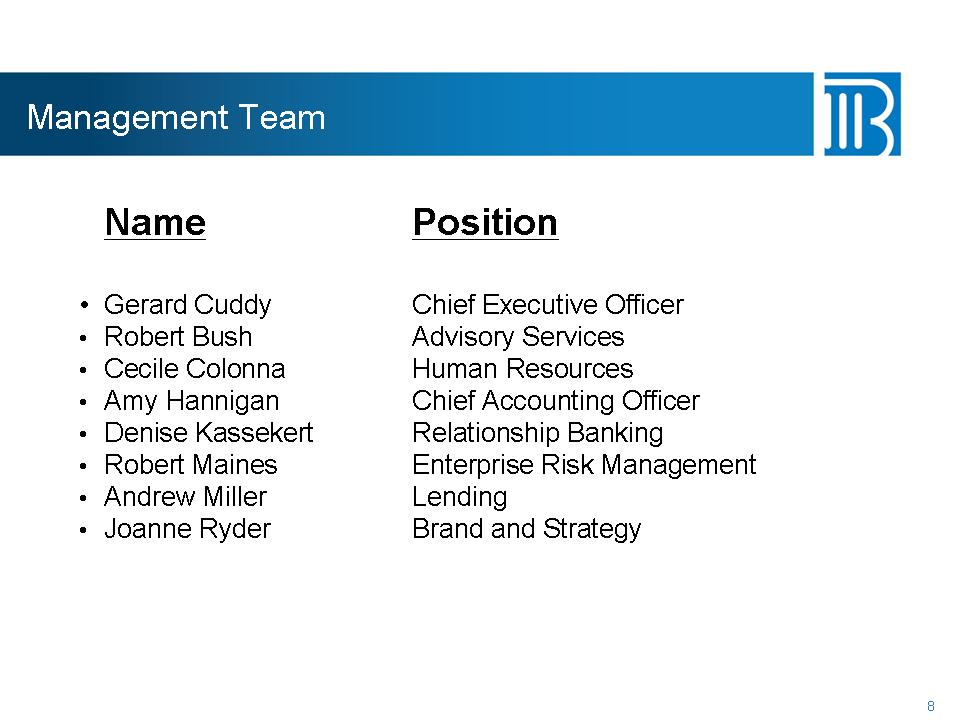 |
Management
Team
Name
Position
•
Gerard Cuddy Chief Executive Officer Gerard Cuddy Chief Executive
Officer
•
Robert Bush Advisory Services
•
Cecile Colonna Human Resources
•
Amy Hannigan Chief Accounting Officery g g
•
Denise Kassekert Relationship Banking
•
Robert Maines Enterprise Risk Management
•
Andrew Miller Lending
•
Joanne Ryder Brand and Strategy
8
|
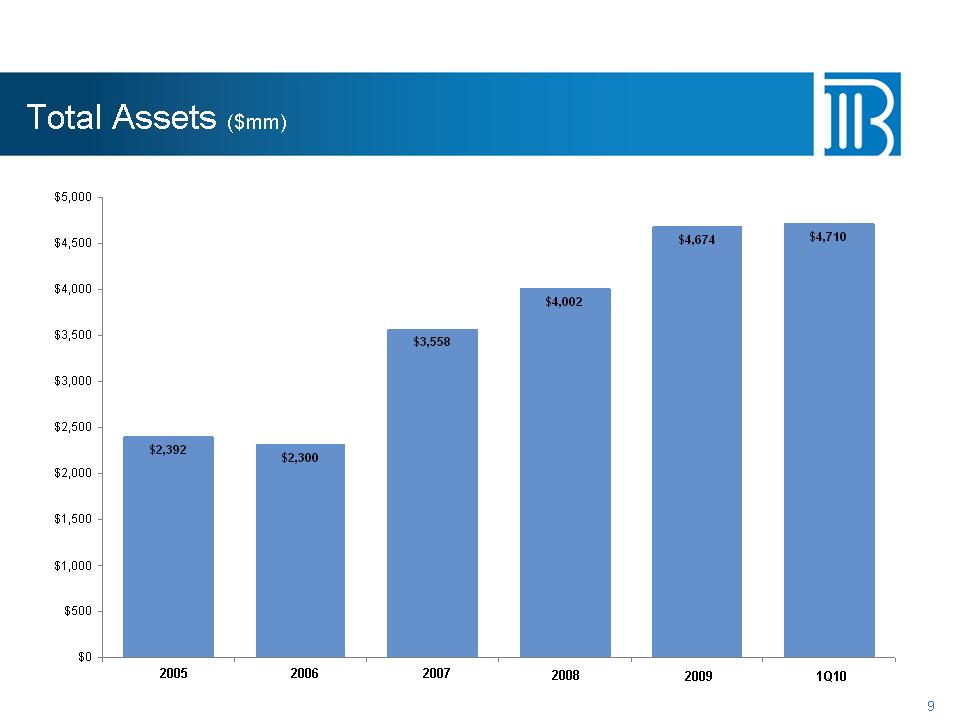 |
Total
Assets ($mm)
$5,000
$4,002
$4,674
$4,710
$4,000
$4,500
$3,558
$500
$1,000
9
$0
2005
2006 2007 2008 2009 1Q10
$2,300
$2,392
$3,000
$3,500
$2,500
$1
500
$2,000
$1,500
|
 |
Deposit
Gathering
•
Education-based sales environment
•
Enhanced bundled product offerings to grow and
strengthen
targeted relationships
strengthen
targeted relationships
•
Focused and consistent business development
activities
•
Expanded cash management services to attract
larger
commercial relationships
•
Concentration on anchoring relationships through
g
p g
cross
referrals
10
|
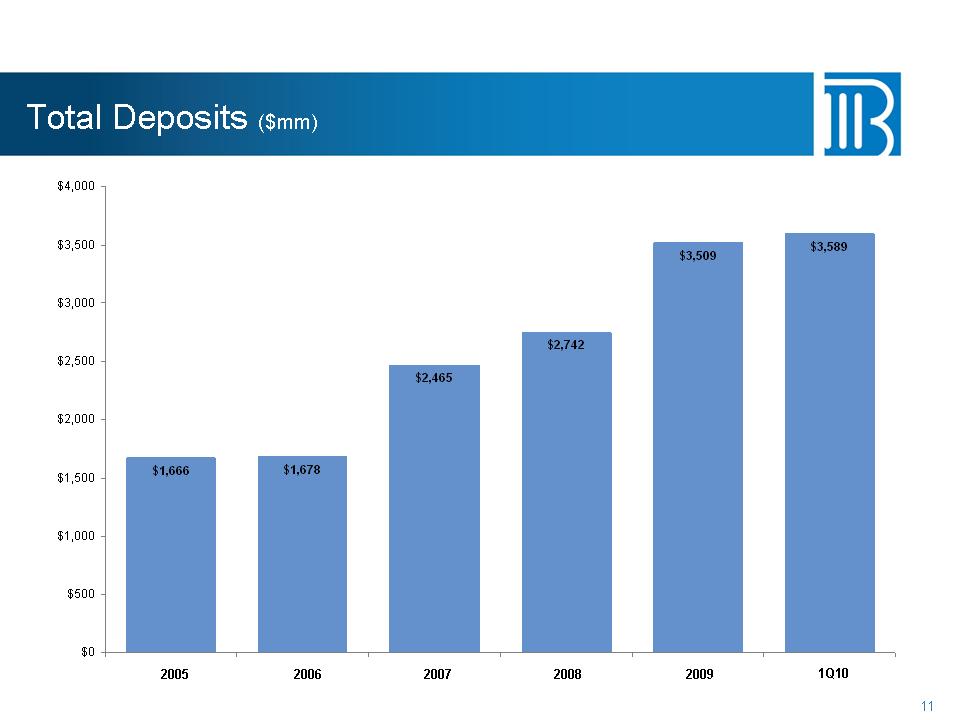 |
Total
Deposits ($mm)
$4,000
$3,509
$3,589
$3,000
$3,500
$2,742
$2,500
$1,500
$2,000
$500
$1,000
11
$0
2005
2006 2007 2008 2009 1Q10
$2,465
$1,678
$1,666
|
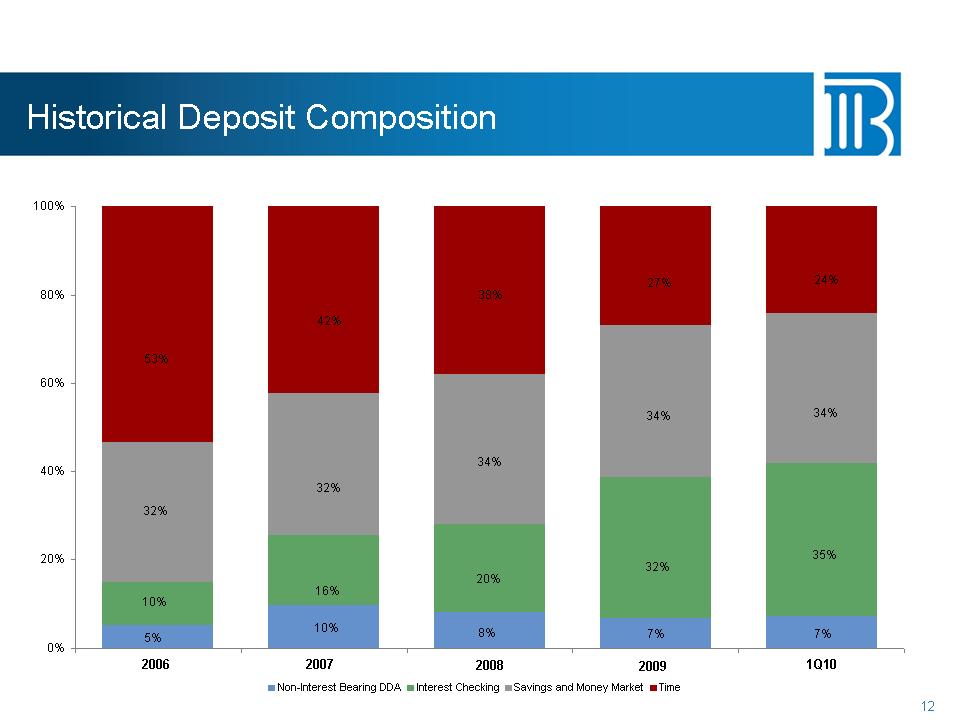 |
Historical
Deposit Composition
100%
80%
100%
38%
27%
24%
60%
53%
42%
34%
40%
32%
32%
34%
34%
34%
20%
10%
32%
16%
20%
32%
35%
12
0%
Non-Interest
Bearing DDA Interest Checking Savings and Money Market Time
2006
2007 2008 2009 1Q10
5%
10%
8% 7% 7%
|
 |
Credit
Culture
•
In market lender and local decision maker
•
In-market lender and local decision maker
•
Disciplined underwriting through all credit cycles
•
No subprime lending
•
Portfolio lender
•
Diverse portfolio
–
Commercial
–
Consumer
–
Residential
•
Proactive risk management
Proactive
risk management
•
Enhanced credit infrastructure
•
Credit officers
•
Enhanced workout capability
Enhanced
workout capability
|
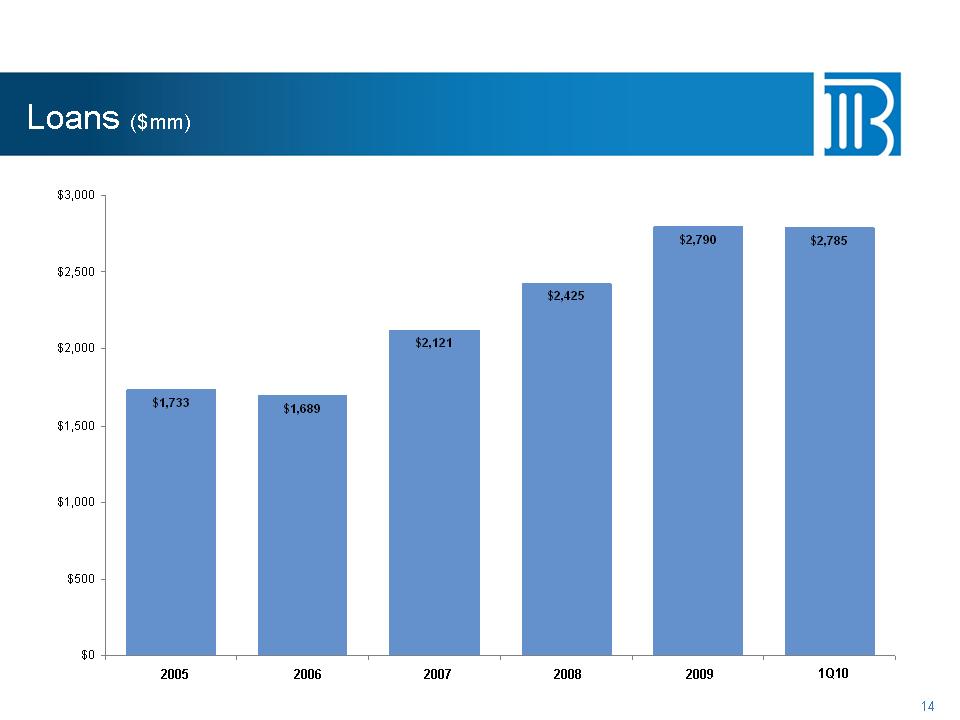 |
Loans
($mm)
$3,000
$2,425
$2,790
$2,785
$2,500
$2,121
$2,000
$1,000
$1,500
$500
14
$0
2005
2006 2007 2008 2009 1Q10
$1,689
$1,733 $1,689
|
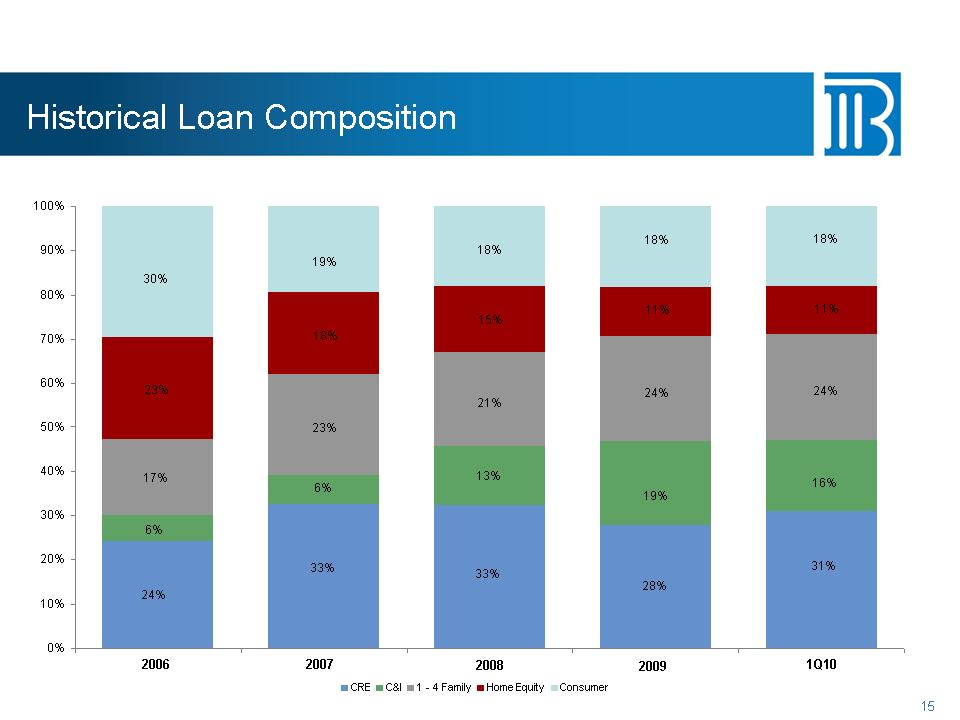 |
Historical
Loan Composition
100%
80%
90%
100%
11%
11%
30%
19%
18%
18%
18%
60%
70%
23%
18%
21%
15%
24%
11%
24%
11%
30%
40%
50%
17%
6%
23%
13%
19%
16%
10%
20%
30%
24%
6%
33%
33%
28%
31%
15
0%
CRE
C&I 1 -4 Family Home Equity Consumer
2006
2007 2008 2009 1Q10
|
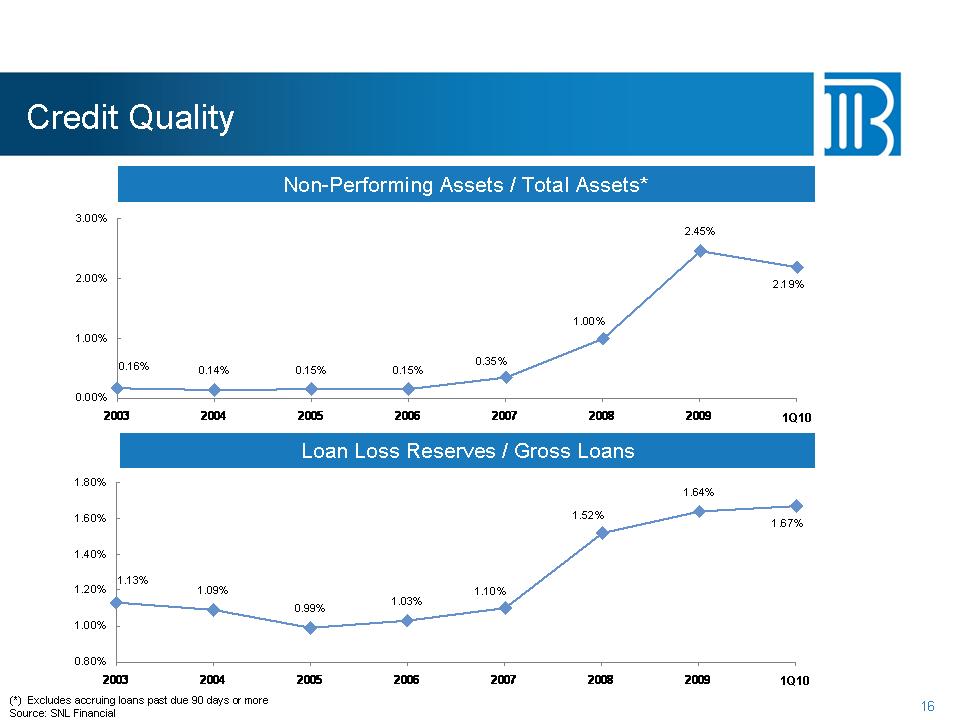 |
Credit
Quality
Non-Performing
Assets / Total Assets*
2.45%
2.19%
2.00%
3.00%
0.14%
0.15% 0.15%
1.00%
0.35%
0.16%
0.00%
1.00%
2003
2004 2005 2006 2007 2008 2009 2010
Loan
Loss Reserves / Gross Loans
2003
2004 2005 2006 2007 2008 2009 1Q10
1.64%
152%
160%
1.80%
1.09%
0.99%
1.03%
1.67%
1.52%
1.10%
1.13%
1.20%
1.40%
1.60%
16(*)
Excludes accruing loans past due 90 days or more
Source:
SNL Financial
0.80%
1.00%
2003
2004 2005 2006 2007 2008 2009 1Q10
|
 |
Beneficial
Advisors, LLC
•
Long term trusted advisor model
•
14 advisors and retirement plan specialists
•
Client centered and solution driven consultative
process
–
Life events approach
Life
events approach
•
401(k) and retirement plan initiatives
•
Open architecture investment management platform
–
Independent non-biased offerings
•
Integrated sales model designed to grow core
deposits
17
deposits
|
 |
Beneficial
Insurance Services, LLC
Long
term insurance advocate and business advisor
•
Long term insurance advocate and business advisor
model
•
$100 million in ppremium volume
•
Diverse lines of business, products and insurance
providers
–
C ilP dC l
Commercial
Property and Casualty
–
Life, Health and Employee Benefits
–
Professional Liability
–
Personal Lines for High Net Worth Individuals
•
Niche marketer with exclusive programs
•
FFormali lized cross refferrall process with ith other
sttrattegiic
d
th
areas
of the Bank
|
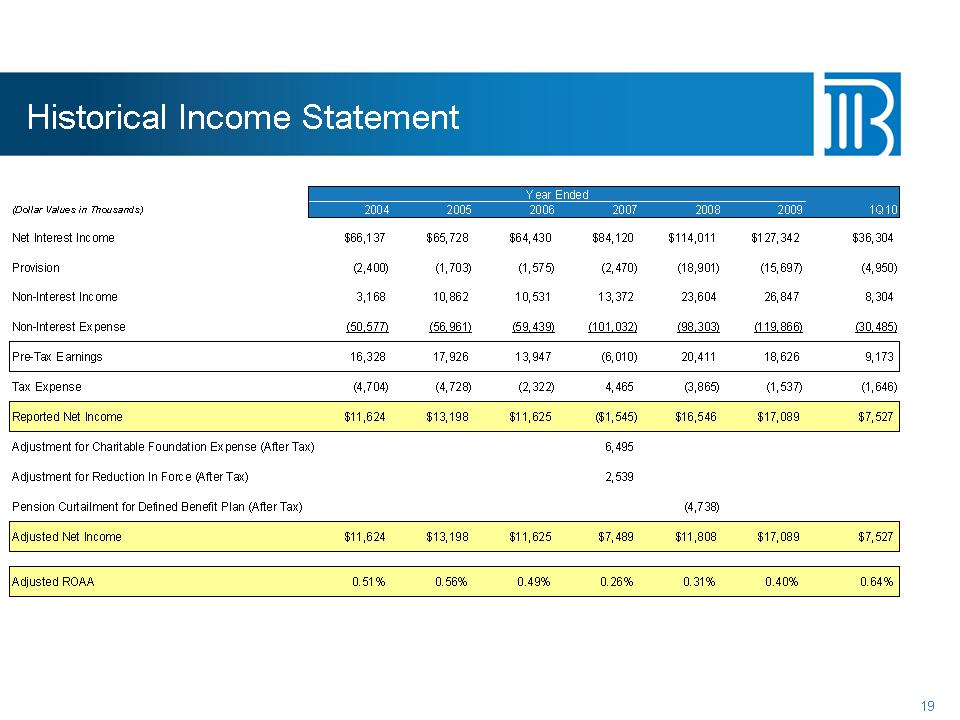 |
Historical
Income Statement
Year
Ended
(D
ll V l i Th d )(Dollar Values in Thousands) 2004 2005 2006 2007 2008 2009
1Q10
Net
Interest Income $66,137 $65,728 $64,430 $84,120 $114,011 $127,342
$36,304
Provision
(2,400) (1,703) (1,575) (2,470) (18,901) (15,697) (4,950)
Non-Interest
Income 3,168 10,862 10,531 13,372 23,604 26,847 8,304
Non-Interest
Expense (50,577) (56,961) (59,439) (101,032) (98,303) (119,866)
(30,485)
Pre-Tax
Earnings 16,328 17,926 13,947 (6,010) 20,411 18,626 9,173
Tax
Expense (4,704) (4,728) (2,322) 4,465 (3,865) (1,537) (1,646)
$
$ $ $ $ $ $Reported Net Income $11,624 $13,198 $11,625 ($1,545) $16,546
$17,089 $7,527
Adjustment
for Charitable Foundation Expense (After Tax) 6,495
Adjustment
for Reduction In Force (After Tax) 2,539
Pension
Curtailment for Defined Benefit Plan (After Tax) (4,738)
Adjusted
Net Income $11,624 $13,198 $11,625 $7,489 $11,808 $17,089
$7,527
Adjusted
ROAA 0.51% 0.56% 0.49% 0.26% 0.31% 0.40% 0.64%
19
|
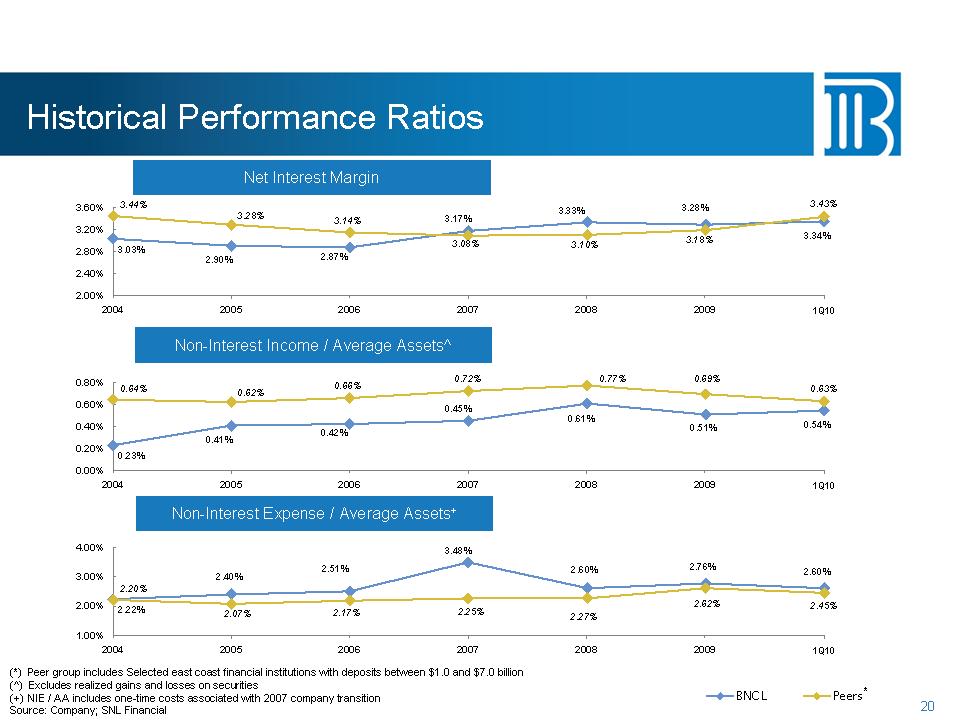 |
Historical
Performance Ratios
Net
Interest Margin
328%
3 44% 343% 360%
3.03%
2.90%
2.87%
3.33%
3.28%
3.17%
3.34%
3.08%
3.14%
3.44%
3.28%
3.10%
3.18%
3.43%
2.00%
2.40%
2.80%
3.20%
3.60%
2004
2005 2006 2007 2008 2009 20101Q10
Non-Interest
Income / Average Assets^
2004
2005 2006 2007 2008 2009 1Q10
0.45%
0.72%
0.66%
0.64% 0.62%
0.77%
0.69%
0.63%
0.60%
0.80%
Non
Interest Expense / Average Assets+
0.23%
0.41%
0.42%
0.61%
0.51%
0.45%
0.54%
0.00%
0.20%
0.40%
2004
2005 2006 2007 2008 2009 1Q10
Non-Interest
Expense / Average Assets
2.22%
2.40%
2.51%
2.60% 2.76%
3.48%
2.60%
2.25%
2.17%
2.20%
2.07%
2 27%
2.62%
2.45% 2.00%
3.00%
4.00%
20
BNCL
Peers
(*)
Peer group includes Selected east coast financial institutions with
deposits between $1.0 and $7.0 billion
(^)
Excludes realized gains and losses on securities
(+)
NIE / AA includes one-time costs associated with 2007 company
transition
Source:
Company; SNL Financial
*
2.07%
2.27%
1.00%
2004
2005 2006 2007 2008 2009 1Q10
|
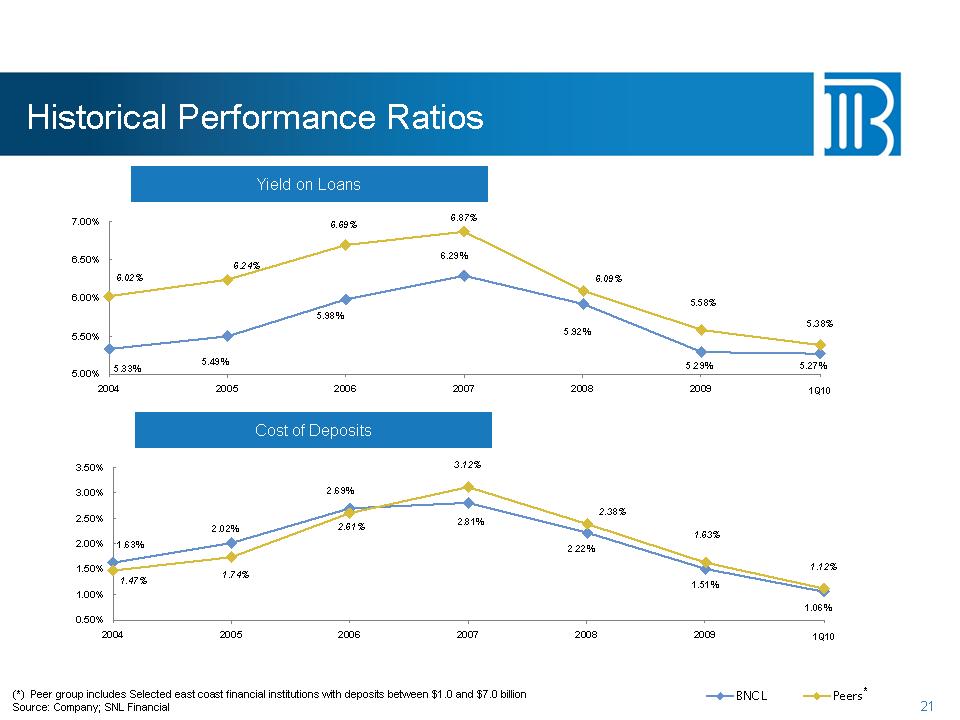 |
Historical
Performance Ratios
Yield
on Loans
6.29%
6.87%
6.69%
6.02%
6.24%
6.09%
5.58%
6.00%
6.50%
7.00%
5.33%
5.49%
5.98%
5.92%
5.29%
5.27%
5.38%
5.00%
5.50%
2004
2005 2006 2007 2008 2009 1Q10
Cost
of Deposits
2.69%
3.12%
238%
20%
3.00%
3.50%
1.63%
2.02%
2.22%
1.51%
2.81%
1.06%
2.61%
1.47%
1.74%
2.38%
1.63%
1.12%
050%
1.00%
1.50%
2.00%
2.50%
21
BNCL
Peers (*) Peer group includes Selected east coast financial institutions
with deposits between $1.0 and $7.0 billion
Source:
Company; SNL Financial
0.50%
2004
2005 2006 2007 2008 2009 1Q10
*
|
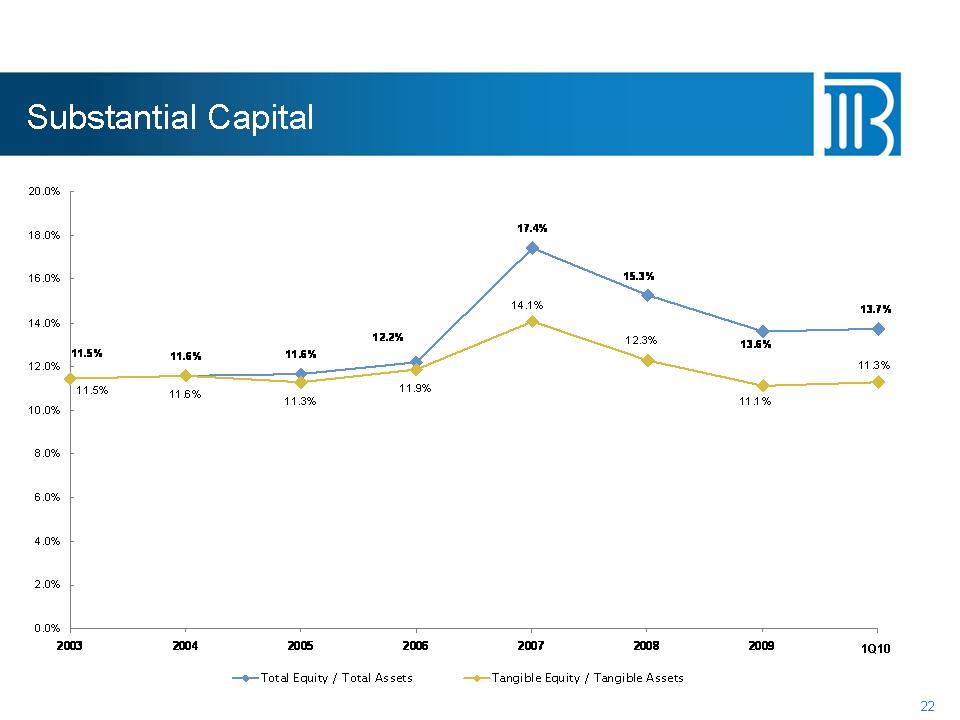 |
Substantial
Capital
20.0%
17.4%
13
7%
15.3%
14.1%
16.0%
18.0%
11.6%
11.6%
13.7%
11.6%
11.3%
11.9%
12.2%
13.6%
11.5%
11.3%
11.1%
12.3%
11.5%
10
0%
12.0%
14.0%
6.0%
8.0%
10.0%
2.0%
4.0%
22
0.0%
2003
2004 2005 2006 2007 2008 2009
Total
Equity / Total Assets Tangible Equity / Tangible Assets
1Q10
|
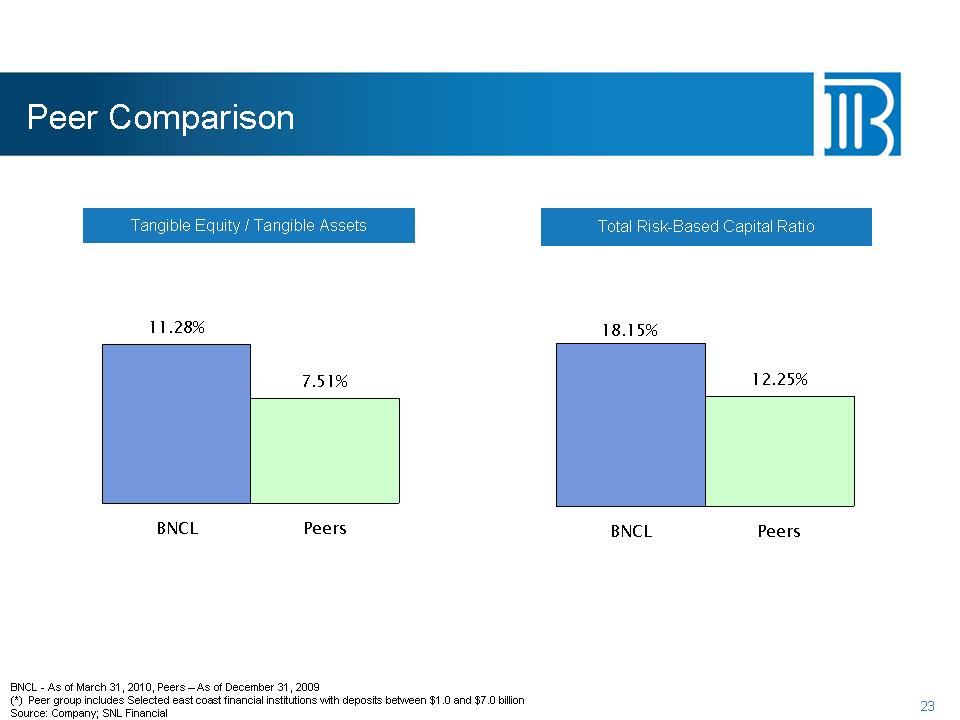 |
Peer
Comparison
Tangible
Equity / Tangible Assets Total Risk-Based Capital Ratio
11.28%
7.51%
12.25%
18.15%
BNCL
Peers BNCL Peers
23
BNCL
-As of March 31, 2010, Peers – As of December 31, 2009
(*)
Peer group includes Selected east coast financial institutions with
deposits between $1.0 and $7.0 billion
Source:
Company; SNL Financial
|
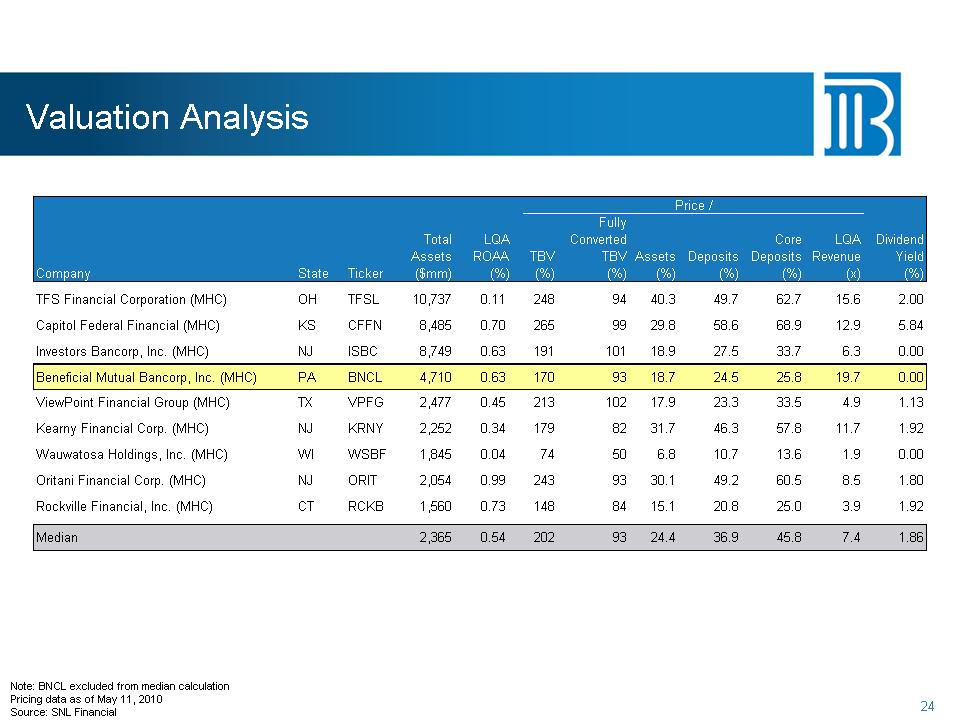 |
Valuation
Analysis
Price
/Price /
Fully
Total
LQA Converted Core LQA Dividend
Assets
ROAA TBV TBV Assets Deposits Deposits Revenue Yield
Company
State Ticker ($mm) (%) (%) (%) (%) (%) (%) (x) (%)
TFS
Financial Corporation (MHC) OH TFSL 10,737 0.11 248 94 40.3 49.7 62.7 15.6
2.00
Capitol
Federal Financial (MHC) KS CFFN 8,485 0.70 265 99 29.8 58.6 68.9 12.9
5.84
Investors
Bancorp, Inc. (MHC) NJ ISBC 8,749 0.63 191 101 18.9 27.5 33.7 6.3
0.00
Beneficial
Mutual Bancorp, Inc. (MHC) PA BNCL 4,710 0.63 170 93 18.7 24.5 25.8 19.7
0.00
ViewPoint
Financial Group (MHC) TX VPFG 2,477 0.45 213 102 17.9 23.3 33.5 4.9
1.13
Kearny
Financial Corp. (MHC) NJ KRNY 2,252 0.34 179 82 31.7 46.3 57.8 11.7
1.92
Wauwatosa
Holdings, Inc. (MHC) WI WSBF 1,845 0.04 74 50 6.8 10.7 13.6 1.9
0.00
Oritani
Financial Corp. (MHC) NJ ORIT 2,054 0.99 243 93 30.1 49.2 60.5 8.5
1.80
Rockville
Financial, Inc. (MHC) CT RCKB 1,560 0.73 148 84 15.1 20.8 25.0 3.9
1.92
Median
2,365 0.54 202 93 24.4 36.9 45.8 7.4 1.86
24
Note:
BNCL excluded from median calculation
Pricing
data as of May 11, 2010
Source:
SNL Financial
|
 |
Independent
Rankings
•
BauerFinancial, Inc. has been a source for unbiased,
independent
bank and credit union ratings since 1983
–
Beneficial continues to receive Bauer’s highest, five-star
rating
–
Beneficial has earned a Bauer recommendation rating for the
past
78
consecutive quarters
•
Bank Director is the premier magazine written for directors of Bank
Director is the premier magazine written for directors of
financial
companies and has become recognized as an
essential
source for the top decision makers in the industry
Scorecard–
The Bank Performance Scorecard is compprised of six
pperformance
categories
that measure profitability, capitalization, and assetquality
–
Beneficial was ranked 66th in the annual Bank Performance
Scorecard
|
 |
2010
Priorities
•
Education Company
–
Educating customers to do the right thing financially
•Cappital
Allocation
–
Continued fundamental organic growth
–
Opportunistic acquisitions
•
Enhanced Risk Managgement
–
Continue credit and loss prevention discipline
–
Enterprise control self-assessments
Educating
Cross•
Branch Network Opptimization Opppp ortunities
•
Relationship Banking
–
Align our customers’ needs with our products and services
•
Cross-Educating
|
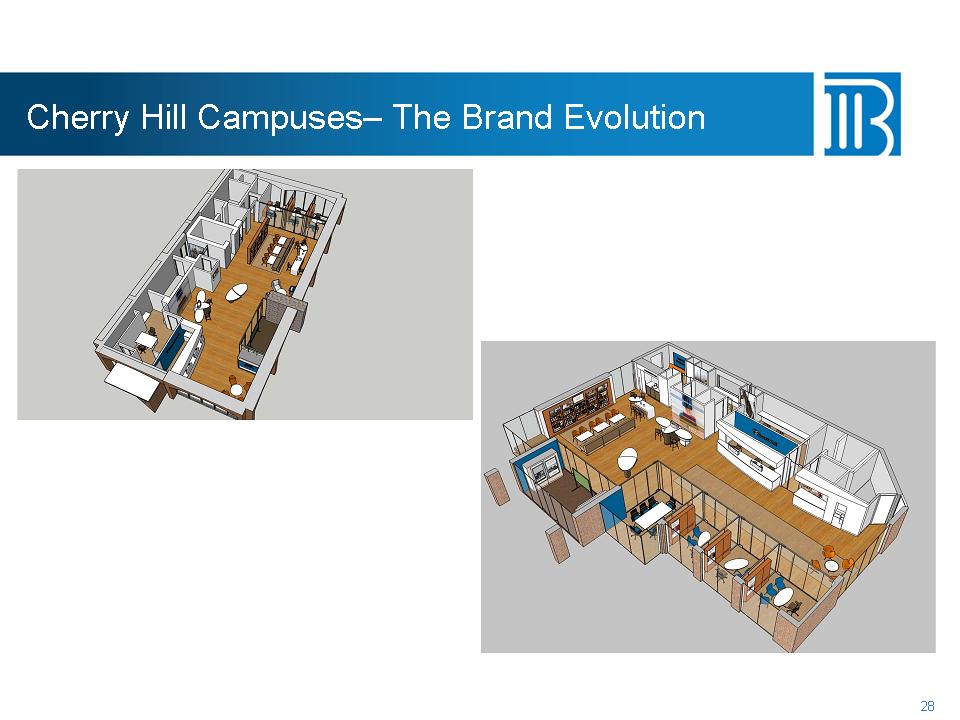 |
Cherry
Hill Campuses– The Brand Evolution
28
|
 |