Attached files
| file | filename |
|---|---|
| EX-32.1 - Lincolnway Energy, LLC | v184876_ex32-1.htm |
| EX-32.2 - Lincolnway Energy, LLC | v184876_ex32-2.htm |
| EX-31.2 - Lincolnway Energy, LLC | v184876_ex31-2.htm |
| EX-31.1 - Lincolnway Energy, LLC | v184876_ex31-1.htm |
UNITED
STATES SECURITIES AND EXCHANGE COMMISSION
Washington,
D.C. 20549
________________
FORM
10-Q
________________
(Mark
One)
|
x
|
QUARTERLY REPORT PURSUANT TO
SECTION 13 OR 15(d) OF THE SECURITIES EXCHANGE ACT OF
1934
|
For the
quarterly period ended March 31, 2010
|
|
or
|
|
o
|
TRANSITION REPORT PURSUANT TO
SECTION 13 OR 15(d) OF THE SECURITIES EXCHANGE ACT OF
1934
|
For the
transition period from ______________________ to
_______________________
|
|
Commission
File Number: 000-51764
|
|
|
____________________
|
LINCOLNWAY
ENERGY, LLC
(Exact name of
registrant as specified in its charter)
|
Iowa
|
20-1118105
|
|
(State
or other jurisdiction of incorporation or organization)
|
(I.R.S.
Employer Identification No.)
|
|
59511 W. Lincoln Highway,
Nevada, Iowa
|
50201
|
|
(Address
of principal executive offices)
|
(Zip
Code)
|
|
515-232-1010
|
|
(Registrant's
telephone number, including area
code)
|
|
N/A
|
|
(Former
name, former address and former fiscal year, if changed since last
report)
|
|
______________________
|
Indicate
by check mark whether the registrant (1) has filed all reports required to be
filed by Section 13 or 15(d) of the Securities Exchange Act of 1934 during the
preceding 12 months (or for such shorter period that the registrant was required
to file such reports), and (2) has been subject to such filing requirements for
the past 90
days. þ
Yes o No
Indicate
by check mark whether the registrant has submitted electronically and posted on
its corporate Web site, if any, every Interactive Data File required to be
submitted and posted pursuant to Rule 405 of Regulation S-T during the preceding
12 months (or for such shorter period that the registrant was required to submit
and post such files).
o Yes o No
Indicate
by check mark whether the registrant is a large accelerated filer, an
accelerated filer, a non-accelerated filer, or a smaller reporting
company. See the definitions of "large accelerated filer,"
"accelerated filer" and "smaller reporting company" in Rule 12b-2 of the
Exchange Act.
Large
accelerated filer o Accelerated
filer o
Non-accelerated
filer þ Smaller
reporting company o
Indicate
by check mark whether the registrant is a shell company (as defined in Rule
12b-2 of the Exchange Act). o Yes þ No
Indicate
the number of shares outstanding of each of the issuer's classes of common
stock, as of the latest practicable date: 42,049 membership units outstanding at
May 1, 2010.
LINCOLNWAY
ENERGY, LLC
FORM
10-Q
For
the Quarter Ended March 31, 2010
INDEX
| Part I. Financial Information |
Page
|
||
|
Item
1.
|
Unaudited
Financial Statements
|
||
|
a)
Balance Sheets
|
2
|
||
|
b)
Statements of Operations
|
4
|
||
|
c)
Statements of Cash Flows
|
6
|
||
|
d)
Notes to Unaudited Financial Statements
|
7
|
||
|
Item
2.
|
Management's
Discussion and Analysis of Financial Condition and
Results of Operations
|
15
|
|
|
|
Item
3.
|
Quantitative
and Qualitative Disclosures About Market Risk
|
28 |
|
|
Item
4.
|
Controls
and Procedures
|
31 |
| Part II. Other Information | |||
|
Item
1.
|
Legal
Proceedings
|
32 | |
|
Item
1A.
|
Risk
Factors
|
32
|
|
|
Item
2.
|
Unregistered
Sales of Equity Securities and Use of Proceeds
|
32
|
|
|
Item
3.
|
Defaults
Upon Senior Securities
|
33
|
|
|
Item
5.
|
Other
Information
|
33 | |
|
Item
6.
|
Exhibits
|
33
|
|
|
Signatures
|
|||
|
Exhibits
Filed With This Report
|
|||
|
Rule
13a-14(a) Certification of President and Chief Executive
Officer
|
E-1 | ||
|
Rule
13a-14(a) Certification of Chief Financial Officer
|
E-3 | ||
|
Section
1350 Certification of President and Chief Executive
Officer
|
E-5 | ||
|
Section
1350 Certification of Chief Financial Officer
|
E-6 | ||
PART
I - FINANCIAL INFORMATION
Item
1. Unaudited
Financial Statements.
Lincolnway
Energy, LLC
Balance
Sheets
|
March
31, 2010
|
September
30, 2009
|
|||||||
|
(Unaudited)
|
||||||||
|
ASSETS
|
||||||||
|
CURRENT
ASSETS
|
||||||||
|
Cash
and cash equivalents
|
$ | 6,436,817 | $ | 5,824,947 | ||||
|
Due
from broker
|
476,620 | 565,276 | ||||||
|
Derivative
financial instruments (Note 8)
|
639,545 | – | ||||||
|
Trade
and other accounts receivable (Note 7)
|
3,413,019 | 3,772,183 | ||||||
|
Inventories
(Note 4)
|
4,118,706 | 2,485,372 | ||||||
|
Prepaid
expenses and other
|
259,922 | 197,047 | ||||||
|
Total
current assets
|
15,344,629 | 12,844,825 | ||||||
|
PROPERTY
AND EQUIPMENT
|
||||||||
|
Land
and land improvements
|
7,580,868 | 7,580,868 | ||||||
|
Buildings
and improvements
|
1,604,305 | 1,604,305 | ||||||
|
Plant
and process equipment
|
74,886,804 | 74,853,995 | ||||||
|
Construction
in progress
|
92,412 | – | ||||||
|
Office
furniture and equipment
|
354,564 | 355,654 | ||||||
| 84,518,953 | 84,394,822 | |||||||
|
Accumulated
depreciation
|
(31,246,050 | ) | (27,101,259 | ) | ||||
| 53,272,903 | 57,293,563 | |||||||
|
OTHER
ASSETS
|
||||||||
|
Certificate
of deposit, at cost, restricted (Note 5)
|
351,000 | 351,000 | ||||||
|
Financing
costs, net of amortization of $187,712 and $166,260
|
284,250 | 305,702 | ||||||
|
Other
|
170,093 | 297,011 | ||||||
| 805,343 | 953,713 | |||||||
| $ | 69,422,875 | $ | 71,092,101 | |||||
See Notes
to Unaudited Financial Statements.
2
|
March
31, 2010
|
September
30, 2009
|
|||||||
|
(Unaudited)
|
||||||||
|
LIABILITIES
AND MEMBERS’ EQUITY
|
||||||||
|
CURRENT
LIABILITIES
|
||||||||
|
Accounts
payable
|
$ | 1,064,164 | $ | 877,216 | ||||
|
Accounts
payable, related party (Note 6)
|
442,861 | 298,533 | ||||||
|
Current
maturities of long-term debt (Note 5)
|
1,325,863 | 3,825,357 | ||||||
|
Accrued
expenses
|
1,006,476 | 948,309 | ||||||
|
Accrued
loss on purchase commitments
|
239,761 | – | ||||||
|
Derivative
financial instruments (Note 8)
|
– | 224,850 | ||||||
|
Total
current liabilities
|
4,079,125 | 6,174,265 | ||||||
|
NONCURRENT
LIABILITIES
|
||||||||
|
Long-term
debt, less current maturities (Note 5)
|
11,949,275 | 14,488,584 | ||||||
|
Other
|
450,000 | 450,000 | ||||||
|
Total
noncurrent liabilities
|
12,399,275 | 14,938,584 | ||||||
|
COMMITMENTS
AND CONTINGENCY (Notes 7 and 10)
|
||||||||
|
MEMBERS’
EQUITY
|
||||||||
|
Member
contributions, 42,049 units issued and outstanding
|
38,990,105 | 38,990,105 | ||||||
|
Retained
earnings
|
13,954,370 | 10,989,147 | ||||||
| 52,944,475 | 49,979,252 | |||||||
| $ | 69,422,875 | $ | 71,092,101 | |||||
3
Statements
of Operations
|
Three
Months Ended |
Three
Months Ended |
|||||||
|
(Unaudited)
|
||||||||
|
Revenues
(Notes 2 and 7)
|
$ | 28,876,977 | $ | 28,211,654 | ||||
|
Cost
of goods sold
|
27,200,032 | 27,827,005 | ||||||
|
Gross
profit
|
1,676,945 | 384,649 | ||||||
|
General
and administrative expenses
|
565,944 | 569,337 | ||||||
|
Operating
income (loss)
|
1,111,001 | (184,688 | ) | |||||
|
Other
income (expense):
|
||||||||
|
Interest
income
|
6,567 | 8,133 | ||||||
|
Interest
expense
|
(195,228 | ) | (263,198 | ) | ||||
|
Other
income
|
101,569 | 328,777 | ||||||
| (87,092 | ) | 73,712 | ||||||
|
Net
income (loss)
|
$ | 1,023,909 | $ | (110,976 | ) | |||
|
Weighted
average units outstanding
|
42,049 | 42,049 | ||||||
|
Net
income (loss) per unit - basic and diluted
|
$ | 24.35 | $ | (2.64 | ) | |||
See Notes
to Unaudited Financial Statements.
4
Statements
of Operations
|
Six
Months Ended |
Six
Months Ended |
|||||||
|
(Unaudited)
|
||||||||
|
Revenues
(Notes 2 and 7)
|
$ | 60,598,849 | $ | 57,573,706 | ||||
|
Cost
of goods sold
|
53,906,851 | 61,508,076 | ||||||
|
Gross
profit (loss)
|
6,691,998 | (3,934,370 | ) | |||||
|
General
and administrative expenses
|
1,309,049 | 1,224,902 | ||||||
|
Operating
income (loss)
|
5,382,949 | (5,159,272 | ) | |||||
|
Other
income (expense):
|
||||||||
|
Interest
income
|
13,960 | 22,800 | ||||||
|
Interest
expense
|
(430,805 | ) | (563,643 | ) | ||||
|
Other
income
|
101,569 | 328,777 | ||||||
| (315,276 | ) | (212,066 | ) | |||||
|
Net
income (loss)
|
$ | 5,067,673 | $ | (5,371,338 | ) | |||
|
Weighted
average units outstanding
|
42,049 | 42,049 | ||||||
|
Net
income (loss) per unit - basic and diluted
|
$ | 120.52 | $ | (127.74 | ) | |||
See Notes
to Unaudited Financial Statements.
5
Statements
of Cash Flows
|
Six
Months Ended |
Six
Months Ended |
|||||||
|
(Unaudited)
|
||||||||
|
CASH
FLOWS FROM OPERATING ACTIVITIES
|
||||||||
|
Net
income (loss)
|
$ | 5,067,673 | $ | (5,371,338 | ) | |||
|
Adjustments
to reconcile net income (loss) to net cash provided by (used
in)
|
||||||||
|
operating
activities:
|
||||||||
|
Depreciation
and amortization
|
4,167,047 | 4,175,121 | ||||||
|
Loss
on disposal of property and equipment
|
286 | 3,599 | ||||||
|
Forgiven
loan
|
– | (100,000 | ) | |||||
|
Changes
in working capital components:
|
||||||||
|
Due
from broker
|
88,656 | 3,944,270 | ||||||
|
Derivative
financial instruments
|
(864,395 | ) | (3,447,767 | ) | ||||
|
Trade
and other accounts receivable
|
359,164 | (1,268,022 | ) | |||||
|
Inventories
|
(1,633,334 | ) | 431,639 | |||||
|
Prepaid
expenses and other
|
(62,875 | ) | (102,119 | ) | ||||
|
Other
assets
|
126,918 | 168,983 | ||||||
|
Accounts
payable
|
186,948 | (1,318,784 | ) | |||||
|
Accounts
payable, related party
|
144,328 | (535,100 | ) | |||||
|
Accrued
expenses
|
58,167 | 304,521 | ||||||
|
Accrued
loss on purchase commitments
|
239,761 | (1,050,500 | ) | |||||
|
Net
cash provided by (used in) operating activities
|
7,878,344 | (4,165,497 | ) | |||||
|
CASH
FLOWS FROM INVESTING ACTIVITIES
|
||||||||
|
Purchase
of property and equipment
|
(125,221 | ) | (601,241 | ) | ||||
|
Net
cash (used in) investing activities
|
(125,221 | ) | (601,241 | ) | ||||
|
CASH
FLOWS FROM FINANCING ACTIVITIES
|
||||||||
|
Member
distributions
|
(2,102,450 | ) | – | |||||
|
Payments
on long-term borrowings
|
(5,038,803 | ) | (1,288,309 | ) | ||||
|
Net
cash (used in) financing activities
|
(7,141,253 | ) | (1,288,309 | ) | ||||
|
Net
increase (decrease) in cash and cash equivalents
|
611,870 | (6,055,047 | ) | |||||
|
CASH
AND CASH EQUIVALENTS
|
||||||||
|
Beginning
|
5,824,947 | 8,711,048 | ||||||
|
Ending
|
$ | 6,436,817 | $ | 2,656,001 | ||||
|
SUPPLEMENTAL
DISCLOSURE OF CASH FLOW
|
||||||||
|
INFORMATION,
cash paid for interest
|
$ | 445,481 | $ | 560,171 | ||||
|
SUPPLEMENTAL
DISCLOSURES OF NONCASH OPERATING,
|
||||||||
|
INVESTING
AND FINANCING ACTIVITIES
|
||||||||
|
Construction
in progress included in accounts payable
|
$ | 30,273 | $ | – | ||||
See Notes
to Unaudited Financial Statements.
6
Lincolnway
Energy, LLC
Notes
to Unaudited Financial Statements
|
Note
1.
|
Nature
of Business and Significant Accounting
Policies
|
Principal business
activity: Lincolnway Energy, LLC (the Company), located in
Nevada, Iowa, was formed in May 2004 to pool investors to build a 50 million
gallon annual production dry mill corn-based ethanol plant. The
Company began making sales on May 30, 2006 and became operational during the
quarter ended June 30, 2006.
Basis of presentation and
other information:
The
consolidated balance sheet as of September 30, 2009 was derived from the
Company’s audited balance sheet as of that date. The accompanying
financial statements as of and for the three and six months ended March 31, 2010
and 2009 are unaudited and reflect all adjustments (consisting only of normal
recurring adjustments) which are, in the opinion of management, necessary for a
fair presentation of the financial position and operating results for the
interim periods. These unaudited financial statements and notes
should be read in conjunction with the audited financial statements and notes
thereto, for the year ended September 30, 2009 contained in the Company’s Annual
Report on Form 10-K. The results of operations for the
interim periods presented are not necessarily indicative of the results for the
entire year.
Use of
estimates: The preparation of financial statements in
conformity with accounting principles generally accepted in the United States of
America requires management to make estimates and assumptions that affect the
reported amounts of assets and liabilities and disclosure of contingent assets
and liabilities at the date of the financial statements and the reported amounts
of revenues and expenses during the reporting period. Actual results
could differ from those estimates.
Income
taxes: The Company is organized as a partnership for federal
and state income tax purposes and generally does not incur income
taxes. Instead, the Company’s earnings and losses are included in the
income tax returns of the members. Therefore, no provision or
liability for federal or state income taxes has been included in these financial
statements.
Earnings per
unit: Basic and diluted earnings per unit have been computed
on the basis of the weighted average number of units outstanding during each
period presented.
Fair Value of
financial instruments: The carrying amounts of cash and cash
equivalents, derivative financial instruments, trade accounts receivable,
accounts payable and accrued expenses approximate fair value. The
carry amount of long-term debt approximates fair value because the interest
rates fluctuate with market rates or the fixed rates are based on current rates
offered to the Company for debt with similar terms and maturities.
7
Lincolnway
Energy, LLC
Notes
to Unaudited Financial Statements
|
Note
2.
|
Revenue
by product is as follows:
|
|
(Excludes
hedging activity)
|
Three
Months
|
Three
Months
|
Six
Months
|
Six
Months
|
||||||||||||
|
Ended
|
Ended
|
Ended
|
Ended
|
|||||||||||||
|
(In thousands)
|
March
31, 2010
|
March
31, 2009
|
March
31, 2010
|
March
31, 2009
|
||||||||||||
|
Ethanol
|
$ | 23,170 | $ | 22,279 | $ | 49,582 | $ | 45,519 | ||||||||
|
Distiller's
Grains
|
4,838 | 5,701 | 9,674 | 11,424 | ||||||||||||
|
Other
|
339 | 248 | 709 | 620 | ||||||||||||
|
Note
3.
|
Members’
Equity
|
The
Company was formed on May 19, 2004. It was initially capitalized by
the issuance of 1,924 membership units totaling $962,000 to the founding members
of the Company. The Company has one class of membership
units. A majority of the Board of Directors owns a membership
interest in the Company. The Company is authorized to issue up to
45,608 membership units without member approval.
Income
and losses are allocated to all members based on their pro rata ownership
interest. All unit transfers are effective the last day of the
month. Units may be issued or transferred only to persons
eligible to be members of the Company and only in compliance with the provisions
of the operating agreement.
|
Note
4.
|
Inventories
|
Inventories
consist of the following as of:
|
March
31, 2010 |
September
30, 2009 |
|||||||
|
Raw
materials, including corn, coal, chemicals and supplies
|
$ | 1,826,167 | $ | 1,503,410 | ||||
|
Work
in process
|
647,141 | 567,782 | ||||||
|
Ethanol
and distillers grains
|
1,645,398 | 414,180 | ||||||
|
Total
|
$ | 4,118,706 | $ | 2,485,372 | ||||
8
Lincolnway
Energy, LLC
Notes
to Unaudited Financial Statements
|
Note
5.
|
Long-Term
Debt
|
Long-term
debt consists of the following as of:
|
March
31, 2010
|
September
30, 2009
|
|||||||
|
Construction
term loan. (A)
|
$ | 10,250,000 | $ | 15,250,000 | ||||
|
Construction/revolving
term loan. (C)
|
– | – | ||||||
|
Note
payable to contractor, interest-only quarterly payments at
5% due through maturity
date of November 2014, secured by real |
1,216,781 | 1,216,781 | ||||||
|
Note
payable to contractor, unsecured, interest-only
quarterly payments at 4% due
through maturity date of May 2021 |
1,250,000 | 1,250,000 | ||||||
|
Note
payable to Iowa Department of Economic Development. (D)
|
197,500 | 212,500 | ||||||
|
Note
payable to Iowa Department of Transportation. (E)
|
360,857 | 384,660 | ||||||
| 13,275,138 | 18,313,941 | |||||||
|
Less
current maturities
|
(1,325,863 | ) | (3,825,357 | ) | ||||
| $ | 11,949,275 | $ | 14,488,584 | |||||
|
(A)
|
The
Company has a construction and term loan with a financial
institution. Borrowings under the term loan include a variable
interest rate based on the one-month LIBOR index rate plus
3.30%. The rate will be reset automatically without notice to
the Company, on the first “US Banking Day” of each succeeding week, and
each change shall be applicable to all outstanding balances as of that
date. The agreement requires 30 principal payments of
$1,250,000 per quarter commencing in December 2006 through March 2013. In
order to alleviate some of the interest rate risk, the Company on July 25,
2008, fixed a portion of the loan or $7,750,000 at an interest rate of
6.62%, through July 2011. Upon maturity the fixed portion of the loan will
revert back to a variable rate. The same payment amortization
schedule will apply. The agreement requires the maintenance of
certain financial and nonfinancial covenants. Borrowings
under this agreement are collateralized by substantially all of the
Company’s assets. As of March 31, 2010 the Company has made
principal payments of $28,750,000, since the inception of the
loan.
|
|
(B)
|
The
Company has a $1,100,000 subordinate note payable dated November 17, 2004
to an unrelated third party. Quarterly interest payments began
on March 31, 2007. The third party allowed the Company to
include the accrued interest of $116,781 through December 2006 into the
principal of the note. Principal is due in full at maturity on November
17, 2014.
|
9
Lincolnway
Energy, LLC
Notes
to Unaudited Financial Statements
|
(C)
|
The
Company has a $10,000,000 construction/revolving term credit facility with
a financial institution which expires on September 1,
2016. Borrowings under the credit facility agreement include a
variable interest rate based on the one-month LIBOR index rate plus
3.30%. The rate will be reset automatically without notice to
the Company, on the first “US Banking Day” of each succeeding week, and
each change shall be applicable to all outstanding balances as of that
date. Borrowings are subject to borrowing base restrictions as
defined in the agreement. The credit facility and revolving
credit agreement require the maintenance of certain financial and
nonfinancial covenants. The variable interest rate will be
based on the Borrowings under this agreement are collateralized by
substantially all of the Company’s assets. There was no balance
outstanding as of March 31,
2010.
|
On July
3, 2007 the $351,000 revolving credit agreement was cancelled. This
agreement was for the benefit of a letter of credit that was required by an
unrelated third party to lease rail cars. An amendment was made to
the lease agreement on June 19, 2007, that allowed the Company to purchase a
certificate of deposit for $351,000 in lieu of the letter of credit that is
pledged as collateral on the railcar lease. The Company has classified this
certificate of deposit as restricted cash in other assets.
|
(D)
|
The
Company also has a $300,000 loan agreement with the Iowa Department of
Economic Development (IDED). The $300,000 loan is
noninterest-bearing and due in monthly payments of $2,500 beginning
December 2006 and a final payment of $152,500 due November
2012. Borrowings under this agreement are collateralized by
substantially all of the Company’s assets and subordinate to the above
financial institution debt and construction and revolving loan/credit
agreements included in (A) and (C).
|
|
(E)
|
The
Company entered into a $500,000 loan agreement with the Iowa Department of
Transportation (IDOT) in February 2005. The proceeds were
disbursed upon submission of paid invoices. Interest at 2.11%
began accruing on January 1, 2007. Principal payments will be
due semiannually through July 2016. The loan is secured by all
rail track material constructed as part of the plan
construction. The debt is subordinate to the above $39,000,000
financial institution debt and construction and revolving loan/credit
agreements included in (A) and (C).
|
|
Note
6.
|
Related-Party
Transactions
|
The
Company has an agreement with the Heart of Iowa Coop (HOIC), a member of the
Company, to provide 100% of the requirement of corn for use in the operation of
the ethanol plant. The Company purchased corn totaling $18,202,174
and $36,535,890 for the three months and six months ended March 31, 2010,
respectively. There were corn purchases of $17,901,118 and
$38,244,555 for the three months and six months ended March 31, 2009,
respectively. As of March 31, 2010, the Company has several corn cash contracts
with HOIC amounting to approximately 1,487,681 bushels, for a commitment of
$5,111,232 and several basis contracts representing 1,950,000 bushels of
corn. The contracts mature on various dates through July
2010. The Company also has made some miscellaneous purchases from
HOIC (storage fees, fuel, and propane costs) amounting to $20,746 and
$47,386 for the three months and six months ended March 31, 2010,
respectively. There were miscellaneous purchases of $13,582 and
$36,743 for the three months and six months ended March 31, 2009, respectively.
As of March 31, 2010 the amount due to HOIC is $442,861.
The
Company is also purchasing anhydrous ammonia and propane from Prairie Land
Cooperative, a member of the Company. Total purchases for the three
months and six months ended March 31, 2010 is $1,082 and $14,437, respectively.
Purchases for the three months and six months ended March 31, 2009 is $192,759
and $516,402, respectively. As of March 31, 2010 there is no
amount due to Prairie Land Cooperative.
10
Lincolnway
Energy, LLC
Notes
to Unaudited Financial Statements
|
Note
7.
|
Commitments
and Major Customer
|
The
Company had an agreement with an unrelated entity and major customer for
marketing, selling, and distributing all of the ethanol produced by the
Company. Under this pooling arrangement, the Company paid the entity
$.01 (one cent) per gallon for each gallon of ethanol sold. For the
three and six months and ended March 31, 2010 the Company has expensed
none. Marketing expense for the three months and six months ended
March 31, 2009 is $141,492 and $273,896, respectively. Revenues with this
customer were none for the three and six months ended March 31,
2010. Revenues from this customer were $22,279,267 and $45,519,339
for the three months and six months ended March 31, 2009,
respectively. There was no trade accounts receivable due from the
customer as of March 31, 2010.
On
September 25, 2009, the Company entered into a new agreement with an unrelated
entity. The agreement became effective on October 1,
2009. The unrelated entity will be responsible for marketing and
purchasing all of the ethanol produced by the company. For the three
and six months ended March 31, 2010 the Company has expensed $171,582 and
$340,475, respectively, under this agreement for marketing
fees. Revenues with this customer were $23,169,768 and $49,582,109
for the three and six months ended March 31, 2010,
respectively. Trade accounts receivable of $2,315,776 was due from
the customer as of March 31, 2010.
The
Company has entered into an agreement with an unrelated entity for marketing,
selling and distributing the distiller’s grains. For the three months
and six months ended March 31, 2010, the Company has expensed marketing fees of
$74,037 and $147,757, respectively, under this agreement. The Company
has expensed $96,256 and $192,228 for the three months and six months ended
March 31, 2009, respectively. Revenues with this customer were
$4,837,619 and $9,673,642 for the three months and six months ended March 31,
2010, respectively. There were $5,701,286 and $11,424,384 in revenues
with this customer reported for the three months and six months ended March 31,
2009. Trade accounts receivable of $708,573 was due from the customer
as of March 31, 2010.
The
Company has an agreement with an unrelated party to provide the coal supply for
the ethanol plant. For the three months and six
months ended March 31, 2010 the Company has purchased $1,578,424 and $2,994,935,
respectively, of coal under this contract. For the three months and
six months ended March 31, 2009 is $1,491,129 and $3,022,044,
respectively.
The
Company has entered into a variable contract with a supplier of
denaturant. The variable contract is for a minimum purchase of 90,000
gallons at the Conway Opis In Line Prompt daily average plus
$.125/usg. The term of the contract is from April 1, 2010 through
April 30, 2010. The total future purchase commitment is $176,040. For
the three months and six months ended March 31, 2010, the Company purchased
$449,526 and $931,302 respectively, of denaturant. For the three
months and six months ended March 31, 2009 is $293,972 and $585,695,
respectively.
The
Company has entered into a fixed contract with a supplier of anhydrous
ammonia. The contract is for a minimum purchase of 322,010 pounds at
the rate of $.2125 per pound. The term of the contract is from March
24, 2010 through May 31, 2010. The total future purchase commitment is
$68,427. For the three months and six months ended March 31, 2010,
the Company purchased $151,309 and $286,576 respectively, of
denaturant. For the three months and six months ended March 31, 2009
is $192,759 and $516,402, respectively.
11
Lincolnway
Energy, LLC
Notes
to Unaudited Financial Statements
|
Note
8.
|
Risk
Management
|
The
Company’s activities expose it to a variety of market risks, including the
effects of changes in commodity prices. These financial exposures are
monitored and managed by the Company as an integral part of its overall risk
management program. The Company’s risk management program focuses on
the unpredictability of commodity markets and seeks to reduce the potentially
adverse effects that the volatility of these markets may have on its operating
results.
The
Company maintains a risk management strategy that uses derivative instruments to
minimize significant, unanticipated earnings fluctuations caused by market
fluctuations. The Company’s specific goal is to protect the Company
from large moves in the commodity costs.
To reduce
price risk caused by market fluctuations, the Company generally follows a policy
of using exchange-traded futures and options contracts to minimize its net
position of merchandisable agricultural commodity inventories and forward
purchases and sales contracts. Exchange traded futures and options
contracts are designated as non-hedge derivatives and are valued at market price
with changes in market price recorded in operating income through cost of goods
sold for corn derivatives and through revenue for ethanol
derivatives.
The
effects on operating income from derivative activities is as
follows:
|
Three
Months Ended |
Three
Months Ended |
Six
Months Ended |
Six
Months Ended |
|||||||||||||
|
Increase
(decrease) in revenue due to derivatives related to ethanol
sales:
|
||||||||||||||||
|
Realized
|
$ | 15,120 | $ | (17,327 | ) | $ | 15,120 | $ | 10,440 | |||||||
|
Unrealized
|
585,970 | 368 | 585,970 | – | ||||||||||||
|
Total
effect on revenue
|
$ | 601,090 | $ | (16,959 | ) | $ | 601,090 | $ | 10,440 | |||||||
|
(Increase)
decrease in cost of goods sold due to derivates related to corn
costs:
|
||||||||||||||||
|
Realized
|
$ | 248,400 | $ | 408,100 | $ | (29,775 | ) | $ | (1,306,438 | ) | ||||||
|
Unrealized
|
(555,825 | ) | (139,075 | ) | (34,350 | ) | (2,117,738 | ) | ||||||||
|
Total
effect on cost of goods sold
|
(307,425 | ) | 269,025 | (64,125 | ) | (3,424,176 | ) | |||||||||
|
Total
increase (decrease) to operating income due to
derivative
activities
|
$ | 293,665 | $ | 252,066 | $ | 536,965 | $ | (3,413,736 | ) | |||||||
Unrealized
gains and losses on forward contracts, in which delivery has not occurred, are
deemed “normal purchases and normal sales” , and therefore are not marked to
market in the Company’s financial statements but are subject to a lower of cost
or market assessment.
12
Lincolnway
Energy, LLC
Notes
to Unaudited Financial Statements
|
Note
9.
|
Fair
Value Measurements
|
Fair
value is the price that would be received to sell an asset or paid to transfer a
liability in an orderly transaction between market participants at the
measurement date. In determining fair value, the Company uses various
methods including market, income and cost approaches. Based on these
approaches, the Company often utilizes certain assumptions that market
participants would use in pricing the asset or liability, including assumptions
about risk and/or the risks inherent in the inputs to the valuation
technique. These inputs can be readily observable,
market-corroborated, or generally unobservable inputs. The Company
utilizes valuation techniques that maximize the use of observable inputs and
minimize the use of unobservable inputs. Based on the observability
of the inputs used in the valuation techniques, the Company is required to
provide the following information according to the fair value
hierarchy. The fair value hierarchy ranks the quality and reliability
of the information used to determine fair values. Financial assets
and liabilities carried at fair value will be classified and disclosed in one of
the following three categories:
|
Level
1 -
|
Valuations
for assets and liabilities traded in active markets from readily available
pricing sources for market transactions involving identical assets or
liabilities.
|
|
Level
2 -
|
Valuations
for assets and liabilities traded in less active dealer or broker
markets. Valuations are obtained from third-party pricing
services for identical or similar assets or
liabilities.
|
|
Level
3 -
|
Valuations
incorporate certain assumptions and projections in determining the fair
value assigned to such assets or
liabilities.
|
A
description of the valuation methodologies used for instruments measured at fair
value, including the general classification of such instruments pursuant to the
valuation hierarchy, is set forth below. These valuation
methodologies were applied to all of the Company’s financial assets and
financial liabilities carried at fair value.
Derivative financial
instruments: Commodity futures and exchange-traded commodity
options contracts are reported at fair value utilizing Level 1
inputs. For these contracts, the Company obtains fair value
measurements from an independent pricing service. The fair value
measurements consider observable data that may include dealer quotes and live
trading levels from the CBOT and NYMEX markets. The fair value
measurements consider observable data that may include dealer quotes and live
trading levels from the over-the-counter markets.
The
following table summarizes the financial liabilities measured at fair value on a
recurring basis as of March 31, 2010, segregated by the level of the
valuation inputs within the fair value hierarchy utilized to measure fair
value:
|
Total
|
Level
1
|
Level
2
|
Level
3
|
|||||||||||||
|
Assets,
derivative financial instruments
|
$ | 639,545 | $ | 639,545 | $ | – | $ | – | ||||||||
Certain
financial assets and financial liabilities are measured at fair value on a
nonrecurring basis; that is, the instruments are not measured at fair value on
an ongoing basis but are subject to fair value adjustments in certain
circumstances (for example, when there is evidence of
impairment). Financial assets and financial liabilities measured at
fair value on a nonrecurring basis were not significant at March 31,
2010.
13
Lincolnway
Energy, LLC
Notes
to Unaudited Financial Statements
|
Note
10.
|
Contingency
|
The
Company needs to maintain various permits to be able to maintain and continue
its operations. The permits include water and air permits from the
Iowa Department of Natural Resources. The Company has obtained these
permits, but on December 4, 2007, the Iowa Environmental Protection Commission
referred alleged environmental law violations by the Company to the Iowa
Attorney General's office for enforcement action. The referred
allegations concern wastewater releases relating to construction activities and
exceedences of iron and total suspended solid limits in the Company’s NPDES
wastewater discharge permit, and concern air permitting, emission limit
exceedences, stack testing, monitoring and reporting.
A consent
decree was filed on April 12, 2010 resolving all of the allegations and pursuant
to which the Company paid a civil penalty of $176,750.
|
Note
11.
|
Subsequent
Event
|
A
Complaint for Patent Infringement was filed against the Company and certain
other parties on May 3, 2010 by GS CleanTech Corporation. The
Complaint was filed in the United States District Court for the Northern
District of Iowa, Western Division. The Complaint alleges, in
general, that the corn oil extraction equipment and related processes used by
the Company and the other parties infringes upon one or more of the claims under
certain patents held by GS CleanTech Corporation. The Complaint seeks
injunctive relief, an award of damages with interest, and any other remedies
available under certain patent statutes or otherwise under law. The
Company is reviewing the Complaint and considering its response. The
Company is unable to determine at this time if the Complaint will have a
material adverse affect on the Company.
14
|
Item
2.
|
Management's
Discussion and Analysis of Financial Condition and Results of
Operations.
|
| Cautionary Statement on Forward Looking Statements and Industry and Market Data |
Various
discussions and statements in this Item and other sections of this quarterly
report are or contain forward looking statements that express Lincolnway
Energy's current beliefs, forecasts, projections and predictions about future
events. All statements other than statements of historical fact are
forward looking statements, and include statements with respect to financial
results and condition; anticipated trends in business, revenues, net income, net
profits or net losses; projections concerning operations, capital needs and cash
flow; investment, business, growth, expansion, acquisition and divestiture
opportunities and strategies; management's plans or intentions for the future;
competitive position or circumstances; and other forecasts, projections and
statements of expectation. Words such as "expects," "anticipates,"
"estimates," "plans," "may," "will," "contemplates," "forecasts," "future,"
"strategy," "potential," "predicts," "projects," "prospects," "possible,"
"continue," "hopes," "intends," "believes," "seeks," "should," "could,"
"thinks," "objectives" and other similar expressions or variations of those
words or those types of words help identify forward looking
statements.
Forward
looking statements involve and are subject to various material risks,
uncertainties and assumptions. Forward looking statements are
necessarily subjective and are made based on numerous and varied estimates,
projections, views, beliefs, strategies and assumptions made or existing at the
time of such statements and are not guarantees of future results or
performance. Forecasts and projections are also in all events likely
to be inaccurate, at least to some degree, and especially over long periods of
time, and in particular in a still relatively new and developing industry such
as the ethanol industry. Forecasts and projections are also currently
difficult to make with any degree of reliability or certainty given the
difficult and uncertain credit, market and other economic circumstances and
uncertainties in existence at the time of the preparation of this quarterly
report, both generally and with respect to the ethanol industry in
particular. Lincolnway Energy disclaims any obligation to update or
revise any forward looking statements based on the occurrence of future events,
the receipt of new information, or otherwise. Lincolnway Energy
cannot guarantee Lincolnway Energy's future results, performance or business
conditions, and strong or undue reliance must not be placed on any forward
looking statements.
Actual
future performance, outcomes and results may differ materially from those
suggested by or expressed in forward looking statements as a result of numerous
and varied factors, risks and uncertainties, some that are known and some that
are not, and many of which are beyond the control of Lincolnway Energy and
Lincolnway Energy's management. It is not possible to predict or
identify all of those factors, risks and uncertainties, but they include
inaccurate assumptions or predictions by management, the accuracy and
completeness of the publicly available information upon which part of Lincolnway
Energy's business strategy is based and all of the various factors, risks and
uncertainties discussed in this Item and elsewhere in this quarterly report and
in Item 1A of Lincolnway Energy's Annual Report on Form 10-K for the fiscal year
ended September 30, 2009.
15
Lincolnway
Energy may have obtained industry, market, competitive position and other data
used in this quarterly report or Lincolnway Energy's general business plan from
Lincolnway Energy's own research or internal surveys, studies conducted by other
persons and/or trade or industry associations or general publications and other
publicly available information. Lincolnway Energy attempts to utilize
third party sources of information which Lincolnway Energy believes to be
materially complete, accurate, balanced and reliable, but there is no assurance
of the accuracy, completeness or reliability of any third party
information. For example, a trade or industry association for the
ethanol industry may present information in a manner that is more favorable to
the ethanol industry than would be presented by an independent
source. Industry publications and surveys and other publicly
available information also generally state that they have obtained information
from sources believed to be reliable, but do not guarantee the accuracy and
completeness of any information.
General Overview
Lincolnway Energy is an Iowa limited
liability company that operates a dry mill, coal fired ethanol plant located in
Story County, Iowa, near Nevada, Iowa. Lincolnway Energy has been
processing corn into fuel grade ethanol and distillers' grains at the ethanol
plant since May 22, 2006. The first full month of production at full
capacity was July of 2006.
The ethanol plant has a nameplate
production capacity of 50,000,000 gallons, which, at that capacity, would also
generate approximately 136,000 tons of distillers' grains per
year. Lincolnway Energy's revenues are derived primarily from the
sale of its ethanol and distillers' grains.
Lincolnway Energy began extracting corn
oil from the syrup which is generated in the production of ethanol in April,
2008. Lincolnway Energy estimates that it will produce approximately
3,000 tons of corn oil per year. The sale of corn oil is not a
material source of revenue for Lincolnway Energy.
Lincolnway Energy's ethanol is marketed
by Green Plains Trading Group LLC, and Lincolnway Energy's distillers' grains
are marketed by Hawkeye Gold, LLC. Lincolnway Energy's corn oil is
marketed by FEC Solutions, L.L.C.
Lincolnway Energy has not captured or
marketed the carbon dioxide which is produced as part of the ethanol production
process. Lincolnway Energy, however, entered into agreements with
EPCO Carbon Dioxide Products, Inc. on April 16, 2010 pursuant to which EPCO will
construct a plant on Lincolnway Energy's site to collect the carbon dioxide
which is produced as part of the ethanol process, convert that raw carbon
dioxide into liquid carbon dioxide gas, and market the liquid carbon
dioxide. Lincolnway Energy anticipates that EPCO's plant will become
fully operational in August or September of 2010. Lincolnway Energy
does not anticipate that sales of carbon dioxide will be a material source of
revenue for Lincolnway Energy.
16
Lincolnway Energy expects to fund its
operations during the next 12 months using cash flow from continuing
operations. Lincolnway Energy also has revolving lines of credit
which are available to Lincolnway Energy.
Executive Summary
|
|
Highlights
for the six months ended March 31, 2010, are as
follows:
|
|
·
|
Total
revenues increased 5.3% or $3.0 million, compared to the 2009 comparable
period.
|
|
·
|
Total
cost of goods sold decreased 12.4%, or $7.6 million, compared to the 2009
comparable period.
|
|
·
|
Interest
expense decreased 23.6%, or $.1 million, compared to the 2009 comparable
period.
|
|
·
|
Net
income was $5.1 million, compared to net loss of $5.4 million for the 2009
period.
|
17
Results of
Operations
|
|
The following table shows the
results of operations and the percentages of revenues, cost of goods sold,
operating expenses and other items to total revenues in Lincolnway
Energy's statement of operations for the three months and six months ended
March 31, 2010 and 2009 ( dollars in
thousands):
|
|
Three Months Ended March
31,
|
Six Months Ended March
31,
|
|||||||||||||||||||||||||||||||
|
(Unaudited)
|
(Unaudited)
|
|||||||||||||||||||||||||||||||
|
Income Statement
Data
|
2010
|
2009
|
2010
|
2009
|
||||||||||||||||||||||||||||
|
Revenue
|
$ | 28,877 | 100.0 | % | $ | 28,212 | 100.0 | % | $ | 60,599 | 100.0 | % | $ | 57,574 | 100.0 | % | ||||||||||||||||
|
Cost of goods
sold
|
27,200 | 94.2 | % | 27,827 | 98.6 | % | 53,907 | 89.0 | % | 61,508 | 106.8 | % | ||||||||||||||||||||
|
Gross profit
(loss)
|
1,677 | 5.8 | % | 385 | 1.4 | % | 6,692 | 11.0 | % | (3,934 | ) | -6.8 | % | |||||||||||||||||||
|
General and administrative
expenses
|
566 | 2.0 | % | 569 | 2.0 | % | 1,309 | 2.2 | % | 1,225 | 2.1 | % | ||||||||||||||||||||
|
Operating income
(loss)
|
1,111 | 3.8 | % | (184 | ) | -0.7 | % | 5,383 | 8.9 | % | (5,159 | ) | -9.0 | % | ||||||||||||||||||
|
Other income
(expense)
|
(87 | ) | -0.3 | % | 73 | 0.3 | % | (315 | ) | -0.5 | % | (212 | ) | -0.4 | % | |||||||||||||||||
|
Net income
(loss)
|
$ | 1,024 | 3.5 | % | $ | (111 | ) | -0.4 | % | $ | 5,068 | 8.4 | % | $ | (5,371 | ) | -9.3 | % | ||||||||||||||
|
|
The following table shows other
key data for the periods
presented:
|
|
Three Months Ended March
31,
|
Six Months Ended March
31,
|
|||||||||||||||
|
(Unaudited)
|
(Unaudited)
|
|||||||||||||||
|
Operating
Data:
|
2010
|
2009
|
2010
|
2009
|
||||||||||||
|
Ethanol sold (gallons in
thousands)
|
13,727 | 14,149 | 27,238 | 27,390 | ||||||||||||
|
Average gross price of ethanol
sold
|
||||||||||||||||
|
(dollars per
gallon)
|
$ | 1.66 | $ | 1.58 | $ | 1.82 | $ | 1.66 | ||||||||
|
Dry distillers grain sold
(tons)
|
30,698 | 34,505 | 60,843 | 68,405 | ||||||||||||
|
Average dry distillers grain sales
price per ton
|
$ | 150.80 | $ | 157.66 | $ | 152.66 | $ | 159.61 | ||||||||
|
Average corn cost per
bushel
|
$ | 3.58 | $ | 3.62 | $ | 3.61 | $ | 3.88 | ||||||||
Results of Operations for the Three
Months Ended March 31, 2010 as Compared to the Three Months Ended March 31,
2009
Revenues. Revenues increased by $.7 million, or
2.4%, to $28.9 million for the three months ended March 31, 2010 from $28.2
million for the three months ended March 31, 2009. The increase in
revenue was the result of a 5.1% increase in average gross ethanol price. This
increase was offset by a decrease of 4.5% average dried distillers grain gross
price, compared to the three months ended March 31, 2009.
18
Sales from ethanol increased $.9
million, or 4.0%, to $23.2 million for the three months ended March 31, 2010
from $22.3 million for the three months ended March 31, 2009. The
average price of ethanol sold was $1.66 per gallon for the three months ended
March 31, 2010 compared to $1.58 per gallon for the three months ended March 31,
2009. Sales volume was decreased by 3% due to ethanol gallons being
carried forward to future months to obtain a higher ethanol price for the three
months ended March 31, 2010 compared to all gallons that were sold for the three
months ended March 31, 2009.
Sales from co-products decreased by $.8
million, or 14.9%, to $5.2 million for the three months ended March 31, 2010
from $6.0 million for the three months ended March 31, 2009. The
average price of dried distillers grain sold was $150.80 per ton for the three
months ended March 31, 2010, compared to $157.66 for the prior comparable
period. Dried distillers grain sales decreased by 3,807 tons, or
11.0%, for the three months ended March 31, 2010 when compared to the three
months ended March 31, 2009. Wet distillers grain sales increased by 3,844 tons,
or 46.3%, for the three months ended March 31, 2010 when compared to the three
months ended March 31, 2009. For the three months ended March 31,
2010 there were reported sales for excess syrup and corn oil of $339,211
compared to $248,060 for the three months ended March 31,
2009.
Revenues included a combined unrealized
and realized gain of $601,090 related to ethanol derivative instruments for the
three months ended March 31, 2010 compared to a combined unrealized and realized
loss of $16,959 for the three months ended March 31, 2009. As ethanol prices
fluctuate, the value of Lincolnway Energy's ethanol-related derivative
instruments are impacted, which effects Lincolnway Energy's financial
performance. Lincolnway Energy expects the volatility in these
derivative instruments to continue to have an impact on revenues due to the
timing of changes in value of derivative instruments relative to
sales. These instruments are the primary tools of Lincolnway Energy’s
risk management program for ethanol revenues.
Cost of goods
sold. Cost of
goods sold decreased by $.6 million, or 2.3%, to $27.2 million for the three
months ended March 31, 2010 from $27.8 million for the three months ended March
31, 2009. The decrease was primarily due to lower corn cost and
ethanol freight cost in the 2010 period compared to the 2009
period. Cost of goods sold major components are: corn, process
chemicals, denaturant, coal, electricity, production labor, repairs and
maintenance, freight costs and depreciation.
Corn costs decreased by $.2 million, or
.01%, to $17.8 million for the three months ended March 31, 2010 from $18.0
million for the three months ended March 31, 2009. Corn costs
represented 66% of Lincolnway Energy's cost of goods sold for the three months
ended March 31, 2010 compared to 65% for the three months ended March 31,
2009.
19
The decrease in corn costs is primarily
driven by a decrease in cash corn prices compared to the prior
period. Lincolnway Energy had a $307,425 mark to market loss
during the three months ended March 31, 2010, compared to a $269,025 gain in the
same period in 2009. Since Lincolnway Energy's derivative contracts
are mark to market each quarter, the benefits of this risk management tool can
cause corn costs to be volatile from quarter to quarter due to the timing of the
change in value of the positions relative to the cost and use of the corn
commodity being hedged.
Ethanol freight costs decreased $1.6
million, to $.3 million for the three months ended March 31, 2010 from $1.9
million for the three months ended March 31, 2009. The decrease is a result of
switching to a new ethanol marketer. The current ethanol marketer
prices a majority of the ethanol contracts at an FOB price to
Nevada. The freight is built into the price of ethanol, rather than
broken out as a separate cost. The prior ethanol marketer sold a
larger percentage of ethanol on a delivered basis and the freight cost was
separate. Denaturant costs (natural gasoline) increased $.2 million to $.5
million for the three months ended March 31, 2010 from $.3 million for the three
months ended March 31, 2009. Denaturant costs have increased
significantly from an average cost per gallon of $1.19 for the 2009 period,
compared to $1.96 for the 2010 period.
Other income and
(expense). Interest expense decreased
$.1 million to $.2 million for the three months ended March 31, 2010 from $.3
million for the three months ended March 31, 2009. Lincolnway
Energy's variable interest rate on its construction and term loan with Co-Bank
has decreased to 3.53% as of March 31, 2010 from 3.7% as of March 31,
2009. Lincolnway Energy has also reduced long term debt by $7.6
million since March 31, 2009. Other income decreased $.2 million for
the three months ended March 31, 2010 compared to the 2009 period due to a
decrease in income recognized for the Co-Bank patronage
distribution.
Results of Operations for the Six Months
Ended March 31, 2010 as Compared to the Six Months Ended March 31,
2009
Revenues. Revenues increased by $3.0 million, or
5.3%, to $60.6 million for the six months ended March 31, 2010 from $57.6
million for the six months ended March 31, 2009. The increase in
revenue was the result of an increase in ethanol price compared to the six
months ended March 31, 2009.
Sales from ethanol increased $4.1
million, or 8.9%, to $49.6 million for the six months ended March 31, 2010 from
$45.5 million for the six months ended March 31, 2009. The average
price of ethanol sold was $1.82 per gallon for the six months ended March 31,
2010 compared to $1.66 per gallon for the six months ended March 31,
2009. There was just a slight decrease in ethanol sales volume for
the six months ended March 31, 2010 when compared to the six months ended March
31, 2009.
20
Sales from co-products decreased by $1.6
million, or 13.8%, to $10.4 million for the six months ended March 31, 2010 from
$12.0 million for the six months ended March 31, 2009. The average
price of dried distillers grain sold was $152.66 per ton for the six months
ended March 31, 2010, compared to $159.61 for the 2009 comparable period. For
the six months ended March 31, 2010 there were reported sales for excess syrup
and corn oil of $708,537, compared to $568,924 for the six months ended March
31, 2009.
Revenues included a combined unrealized
and realized gain of $601,090, related to ethanol derivative instruments for the
six months ended March 31, 2010, compared to a combined unrealized and realized
gain of $10,440 for the six months ended March 31, 2009.
Cost of goods
sold. Cost of
goods sold decreased by $7.6 million, or 12.4%, to $53.9 million for the six
months ended March 31, 2010 from $61.5 million for the six months ended March
31, 2009. The decrease was primarily due to lower corn cost and
ethanol freight cost in the 2010 period compared to the 2009
period. Cost of goods sold major components are: corn, process
chemicals, denaturant, coal, electricity, production labor, repairs and
maintenance, freight costs and depreciation.
Corn costs decreased $5.3 million to
$35.6 million for the six months ended March 31, 2010 from $40.9 million for the
six months ended March 31, 2009. Corn costs represented 66% of
Lincolnway Energy's cost of goods sold for the six months ended March 31, 2010
and 2009.
The decrease in corn costs is driven by
a decrease in cash corn prices compared to the prior period and also a change in
the derivative market for the comparable periods. The corn costs for
the six months ended March 31, 2010 included a marked to market loss of $64,125
for derivatives relating to future deliveries of corn, compared to a $3.4
million marked to market loss in the same period in 2009.
Ethanol freight costs decreased $2.5
million, to $1.6 million for the six months ended March 31, 2010 from $4.1
million for the six months ended March 31, 2009. The decrease is a result of
switching to a new ethanol marketer. The current ethanol marketer
prices majority of the ethanol contracts at a FOB price to
Nevada. The freight is built into the price of ethanol, rather than
broken out as a separate cost. The prior ethanol marketer sold a
larger percentage of ethanol on a delivered basis and the freight cost was
separate. Denaturant costs (natural gasoline) increased $.2 million to $.9
million for the six months ended March 31, 2010 from $.7 million for the six
months ended March 31, 2009. Denaturant costs have increased
significantly from an average cost per gallon of $1.19 for the 2009 period,
compared to $1.96 for the 2010 period.
21
Other income and
(expense). Interest expense decreased
$.2 million to $.4 million for the six months ended March 31, 2010 from $.6
million for the six months ended March 31, 2009. Lincolnway Energy's
variable interest rate on its construction and term loan with Co-Bank has
decreased to 3.53% as of March 31, 2010 from 3.7% as of March 31,
2009. Lincolnway Energy has also reduced long term debt by $7.6
million since March 31, 2009. Other income decreased $.2 million for
the six months ended March 31, 2010 compared to the 2009 period due to an
increase in income recognized for the Co-Bank patronage
distribution.
Risks, Trends and Factors that May Affect
Future Operating Results
Corn
During
the first quarter of calendar year 2010 corn values trended
lower. The May contract marked a high of $4.35 on the first trading
day of the quarter, trading downward to a low of $3.4425 on the last day of the
quarter. Excellent yields from the recently harvested crop and
quality concerns had producers actively selling corn early and steadily through
the quarter, causing downward pressure on prices. The USDA, in its
January 12, 2010 crop report confirmed a sizeable corn crop, sending corn
futures over $.50 lower in two days trading. This set the tone for
the downtrend that occurred throughout the quarter.
The
influence of outside markets and investment money flows will continue to exert a
force on corn values moving forward in the future. A return to
recessionary activity, as was seen through the entirety of 2008, would affect
corn values through reduced capital supply and forced liquidation by
institutional investors.
The corn
supply and demand situation is best described as more than
adequate. Most recent USDA estimates show the 2009/2010 corn crop
excess supply at 1.899 billion bushels. Estimates for the new crop or
recently planted crop also have large carryover supplies
available. Many analysts show over 1.8 billion bushels carryover on
the 2010/2011 crop using a conservative yield of 161 bushels/acre.
At this
time of the year, weather is the chief risk for corn prices. Adverse
weather effecting the size of the growing corn crop could possibly lead to
market activity that would make conversion of corn to ethanol difficult. To date
this is the earliest planting pace ever encountered. With regard to
the old crop supply and the balance of the current fiscal year, quality concerns
continue to be a risk factor for Lincolnway Energy, LLC. Mycotoxin
issues since harvest have been found in pockets throughout the US. These are
toxins that occur due to weather during the growing and harvesting
season. The unseasonably wet summer was the main cause of problem
with this year’s past crop. These toxins, although under control
currently, can cause problems in the distiller’s grain feed products produced at
ethanol plants if the concentrations become high enough. Other
quality concerns with the current crop include a reduction in fermentable starch
versus the previous three years. This is due to a variety of factors
including weather, farming practices and seed varieties. A reduction
in fermentable starch can reduce the yield or total gallons of ethanol per
bushel that Lincolnway Energy, LLC is able to produce.
22
Lincolnway
Energy attempts to offset or hedge some of the risk involved with changing corn
price through the trading of futures and options on the Chicago Mercantile
Exchange (CME), as well as the purchase of physical delivery corn contracts from
suppliers. Lincolnway Energy continues to monitor and attempt to
manage risks involved with corn production in order to attempt to ensure
adequate supply and protection against rapid price increases and
declines.
Ethanol
Ethanol
prices at the CME declined rapidly through the duration of the firstt calendar
quarter 2010. The highest values were marked on Jan 4th, 2010,
the first trading day of the quarter, at $1.98. The last trading week
of the quarter marked the low at $1.53, representing a $.45 or 22% break in
values of ethanol prices. This break was fueled by an onslaught of
formerly bankrupt facilities being brought back into production through new
owners and some bankruptcy re-emergence by original owners. Simply
stated, ethanol production once again well exceeded ethanol
demand. Although the demand for corn based ethanol is constantly
moving higher an incremental march toward 15 billion gallons as mandated by the
RFS, the production output has shown a tendency over the past years to easily
exceed the existing demand base. This was the case in the first
quarter. Market forces will ultimately fix this situation, but these
interruptions in production are expected to continue as the industry matures and
certainly can represent an ongoing risk factor for the ethanol
industry.
With
ethanol trading at a $.60 to $.75 discount to gasoline futures, the economics of
blending ethanol have been profitable for the time period, especially when the
$.45 blender’s tax credit is added to the equation. However, this
brings up another potential risk factor, total gasoline usage. When
the overall usage of gasoline decreased nationally, this served as a limiting
factor to ethanol usage. This is the much talked about “blend
wall”. Ethanol is limited to 10% of total gasoline sales nationally,
excluding potential E-85 sales which are still limited by infrastructure
hurdles. With the 10% blend limitation in effect, ethanol is
approaching the blend wall at current saturation rates.
Going
forward, the $.45 tax credit is set to expire at the end of calendar year
2010. We see the expiration of this tax credit as a potential risk
for the ethanol industry. The current political atmosphere does not
guarantee that this credit will be renewed.
23
Crush
Margin
Gross
crush margin is the biggest factor affecting future financial results of
Lincolnway Energy. This margin represents the gross profit or loss of
buying a bushel of corn and converting it into gallons of marketable denatured
ethanol. All of the fundamental factors that influence the corn and
ethanol markets are ultimately expressed in the crush margin. Crush
margin declined dramatically through all of the first quarter
of the calendar year 2010. This was due to the ethanol oversupply
situation described above. Margins rapidly moved to the point of
negative profitability for many ethanol plants in an effort to remove excess
supply from the market balance. Heavy winter snowstorms also exerted
a negative influence on crush margins during this time frame. The
storms caused not only a reduction in total motor fuel usage but also caused a
logistical backlog of rail transported ethanol at many distribution
points.
Major
factors that could continue to challenge crush margins, thereby affecting future
profitability of Lincolnway Energy, include weather affecting corn production,
changes in governmental policy, and international economic changes.
ETHANOL
AND CORN PRICE COMPARISON- CRUSH MARGIN HISTORY
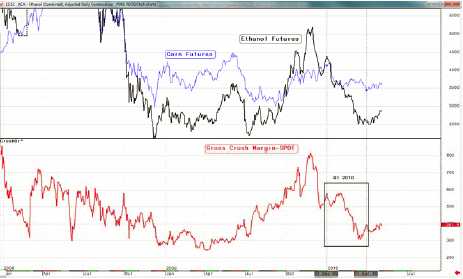
Source: Chicago Mercantile
Exchange
24
Liquidity and Capital
Resources
The following table summarizes
Lincolnway Energy's sources and uses of cash and cash equivalents from Lincolnway Energy's
unaudited statement of cash flows for the periods presented (in
thousands):
|
Six Months Ended March
31,
|
|||||||||
|
(Unaudited)
|
|||||||||
|
Cash Flow
Data:
|
2010
|
2009
|
|||||||
|
Net cash provided by (used in)
operating activities
|
$ | 7,878 | $ | (4,165) | |||||
|
Net cash used in investing
activities
|
(125 | ) | (601 ) | ||||||
|
Net cash used in financing
activities
|
(7,141 | ) | (1,288 ) | ||||||
|
Net increase (decrease) in cash
and cash equivalents
|
612 | (6,055 ) | |||||||
For the six months ended March 31,
2010, net cash provided by operating activities increased by
$12.0 million, when compared to cash provided
by operating activities for the six months ended March 31, 2009. The increase in cash provided by operating activities is primarily due to an increase in net income for the six months
ended March 31, 2010
of $10.4 million, due to the improved market conditions the ethanol industry
experienced in the
first half of fiscal year 2010 compared to 2009. Lincolnway Energy had a $1.62 million decrease in accounts receivable on March
31, 2010 compared to the prior year. This was the result of earlier receipt
of customer payments in the 2010 period compared to 2009. Lincolnway Energy also had a $1.5
million increase in accounts payable from the prior year that
increased the cash balance. These cash increases were offset by a $2.1 million increase in inventory for the six months ended
March 31, 2010 compared to the prior
period. This is
due to carrying over
finished goods inventory to future months to obtain a
higher ethanol selling
price.
Cash flows used in investing activities
reflect the impact of property and equipment acquired for the ethanol plant and
proceeds from investments. Net cash used in investing activities decreased by $.5 million for the six months ended March
31, 2010 when compared to cash used in investing
activities for the six months ended March 31, 2009. This decrease is a result of less
money spent on capital purchases for fiscal period
2010.
Cash flows from financing activities include
transactions and events whereby cash is obtained from, or paid to, depositors,
creditors or investors. Net cash used in financing activities
increased by $5.9 million for the six months ended March
31, 2010 when compared to net cash used in investing activities for
the six months ended March 31, 2009. The increase is due to an increase in member distribution
payments of $2.1 million
and an increase in payments
on long-term borrowings of
$3.8 million for the six
months ended March 31,
2010.
25
If market conditions decline in the future
quarters, Lincolnway Energy
could expect to see net losses for the third quarter of fiscal year
2010 and possibly future
quarters. Lincolnway Energy still has significant depreciation and
amortization expense;
approximately $8.3 million budgeted for fiscal year 2010, which does not require cash
expenditures. Lincolnway Energy anticipates keeping
cash balances at a low but acceptable level that will meet bank
covenants. Lincolnway Energy’s next term loan payment is due March 2011. If Lincolnway Energy does
get in a negative cash position, Lincolnway Energy has access to its $10.0
million line of credit. As of April 2010, Lincolnway Energy is in compliance
with all bank covenants related to bank financing.
Lincolnway Energy's financial position
and liquidity are, and will be, influenced by a variety of factors,
including:
|
·
|
ability to generate positive cash flows from
operations;
|
|
·
|
the level of outstanding
indebtedness and the interest we are obligated to pay;
and
|
|
·
|
capital expenditure requirements,
which consists primarily of plant improvements to improve
efficiencies.
|
Lincolnway Energy expects to have
available cash to meet its anticipated liquidity needs.
Critical Accounting Estimates and
Accounting Policies
Lincolnway Energy's financial statements
are prepared in conformity with accounting principles generally accepted in the
United States of America and follow general practices within the industries in
which Lincolnway Energy operates. Preparation of financial statements requires management to make estimates,
assumptions, and judgments that affect the amounts reported in the financial
statements and accompanying notes. These estimates, assumptions and
judgments are based on information available as of the date of the
financial statements; accordingly, as this information changes, actual results
could differ from the estimates, assumptions, and judgments reflected in the
financial statements. Certain policies inherently have a
greater reliance on the use of estimates,
assumptions, and judgments and, as such, have a greater possibility of producing
results that could be materially different than originally
reported. Management believes the following policies are both
important to the portrayal of Lincolnway Energy's financial
condition and results of operations and require subjective or complex judgments;
therefore, management considers the following to be critical accounting
policies.
26
Off-Balance Sheet
Arrangements
Lincolnway Energy currently does not
have any off-balance sheet arrangements.
Revenue Recognition
This generally occurs upon the loading
of the product. For ethanol, title passes from Lincolnway Energy at the time the product crosses the
loading flange into either a railcar or truck. For
distiller’s grains, title passes upon the loading
of distiller's grains
into trucks. For
railcar shipments, title
passes when the railcar is
filled and the marketer
receives written notice that the railcars have been loaded and is available for billing. Shipping
and handling costs incurred by Lincolnway Energy for the sale of ethanol and
distiller’s grain are included in costs of goods
sold.
Lincolnway
Energy’s ethanol is sold to Green Plains Trading Group (GPTG). The
purchase price payable to Lincolnway Energy is GPTG's contract selling price for
the ethanol in question, less various costs and a fee to GPTG. The
ethanol marketing agreement includes a minimum purchase price. Title
and all risk of loss and damage to all ethanol commences at the time the ethanol
passes across the inlet flange into rail cars or tank cars of the GPTG carrier
at the Lincolnway Energy plant.
Lincolnway Energy’s distiller’s grain production is sold to Hawkeye
Gold, LLC. Lincolnway Energy pays Hawkeye Gold, LLC a marketing fee for dried
distiller’s grains equal to the greater of 2% of
the FOB plant price for the dried distiller’s grain or a per-ton fee of $1.30 for
the dried distiller’s grain. The marketing fee
for wet distiller’s grains is the greater of 3% of the FOB plant price for the wet
distiller’s grains or a per-ton fee of $1.00 for
the wet distiller’s grains.
Lincolnway Energy’s corn oil production is sold to FEC
Solutions, LLC (FECS). For corn oil, title passes upon the loading of the corn
oil into
trucks. The
purchase price payable by FECS for each shipment of corn oil is the FOB sales
price less a marketing and technical assistance fee in an amount equal to 5% of
the FOB sales price.
Derivative
Instruments
Lincolnway Energy enters into
derivative contracts to
hedge its exposure to price risk related to forecasted corn needs and forward
corn purchase contracts. Lincolnway Energy does not typically enter
into derivative instruments other than for hedging purposes. All
derivative contracts are recognized on the March 31,
2010 balance sheet at fair market
value. Although Lincolnway Energy believes its derivative positions
are economic hedges, none has been designated as a hedge for accounting
purposes. Accordingly, any realized or unrealized gain or loss related to these derivative
instruments is recorded in the statement of operations as a component of cost of
goods sold for corn derivatives and through revenue for ethanol
derivatives.
27
|
Item
3.
|
Quantitative
and Qualitative Disclosures About Market
Risk.
|
In addition to the various risks
inherent in Lincolnway Energy's operations, Lincolnway Energy is exposed to
various market risks. The primary market risks arise as a result of
possible changes in certain commodity prices and changes in interest rates.
Commodity Price Risk
|
|
Lincolnway
Energy is exposed to market risk with respect to the price of ethanol,
which is Lincolnway Energy's principal product, and the price and
availability of corn and coal, which are the principal commodities used by
Lincolnway Energy to produce ethanol. The other primary product
of Lincolnway Energy is distiller's grains, and Lincolnway Energy is also
subject to market risk with respect to the price for distiller's
grains. The prices for ethanol, distiller's grains and corn are
volatile, and Lincolnway Energy will experience market conditions where
the prices Lincolnway Energy receives for its ethanol and distiller's
grains are declining, but the price Lincolnway Energy pays for its corn,
coal and other inputs is increasing. Lincolnway Energy's
results will therefore vary substantially over time, and include the
possibility of losses, which could be
substantial.
|
|
|
In
general, rising ethanol and distiller's grains prices result in higher
profit margins, and therefore represent favorable market
conditions. Lincolnway Energy is, however, subject to various
material risks related to its production of ethanol and distiller's grains
and the price paid for ethanol and distiller's grains. For
example, ethanol and distiller's grains prices are influenced by various
factors beyond the control of Lincolnway Energy's management, including
the supply and demand for gasoline, the availability of substitutes and
the effects of laws and
regulations.
|
|
|
In
general, rising corn prices result in lower profit margins and,
accordingly, represent unfavorable market
conditions. Lincolnway Energy will generally not be able to
pass along increased corn costs to its ethanol
customers. Lincolnway Energy is subject to various material
risks related to the availability and price of corn, many of which are
beyond the control of Lincolnway Energy. For example, the
availability and price of corn is subject to wide fluctuations due to
various unpredictable factors, including weather conditions, crop yields,
farmer planting decisions, governmental policies with respect to
agriculture, and local, regional, national and international trade, demand
and supply. If Lincolnway Energy's corn costs were to increase
$.10 per bushel from one year to the next, the impact on cost of goods
sold would be approximately $1.95 million for the year, assuming corn use
of 19.5 million bushels during the year. Lincolnway Energy used
18.8 million bushels of corn during the fiscal year ended September 30,
2009.
|
28
|
|
Lincolnway
Energy's average gross corn cost during the three and six months ended
March 31, 2010 was, respectively, approximately $3.58 and $3.61 per
bushel, compared to $3.62 and $3.88 per bushel, respectively, for the
three and six months ended March 31,
2009.
|
|
|
During
the quarter ended March 31, 2010, corn prices based on the (Chicago
Mercantile Exchange daily futures data) ranged from a low of $3.4425 per
bushel for May 2010 delivery to a high of $4.35 per bushel for
May 2010 delivery. The corn prices based on the (Chicago
Mercantile Exchange daily futures data) during the quarter ended March 31,
2009 ranged from a low of $3.4475 per bushel for May 2009 delivery to a
high of $4.39 per bushel for May 2009
delivery.
|
|
|
The
average price Lincolnway Energy received for its ethanol during the three
and six months ended March 31, 2010 was, respectively, $1.66 and $1.82 per
gallon, as compared to $1.58 and $1.66 per gallon, respectively, during
the three and six months ended March 31,
2009.
|
|
|
During
the quarter ended March 31, 2010, ethanol prices based on the (Chicago
Mercantile Exchange daily futures data) ranged from a low of $1.53 per
gallon for April 2010 delivery to a high of $1.985 per gallon for January
2010 delivery. The ethanol prices based on the (Chicago
Mercantile Exchange daily futures data) during the quarter ended March 31,
2009 ranged from a low of $1.495 per gallon for May 2009 delivery to a
high of $1.75 for May 2009
delivery.
|
|
|
Lincolnway
Energy may from time to time take various cash, futures, options or other
positions with respect to its corn needs in an attempt to minimize or
reduce Lincolnway Energy's price risks related to corn. Those
activities are, however, also subject to various material risks, including
that price movements in the cash and futures corn markets are highly
volatile and are influenced by many factors and occurrences which are
beyond the control of Lincolnway
Energy.
|
|
|
Although
Lincolnway Energy intends its futures and options positions to accomplish
an economic hedge against Lincolnway Energy's future purchases of corn or
future sales of ethanol, Lincolnway Energy has chosen not to use hedge
accounting for those positions, which would match the gain or loss on the
positions to the specific commodity purchase being
hedged. Lincolnway Energy is instead using fair value
accounting for the positions, which generally means that as the current
market price of the positions changes, the realized or unrealized gains
and losses are immediately recognized in Lincolnway Energy's costs of
goods sold in the statement of operations for corn positions or as a
component of revenue in the statement of operations for ethanol
positions. The immediate recognition of gains and losses on
those positions can cause net income to be volatile from quarter to
quarter due to the timing of the change in value of the positions relative
to the cost and use of the commodity being hedged. For example,
Lincolnway Energy's net loss on corn derivative financial instruments that
was included in its cost of goods sold for the three months ended March
31, 2010 was $307,425, as opposed to the net gain of $269,025 for the
three months ended March 31, 2009.
|
29
|
|
The
extent to which Lincolnway Energy may enter into arrangements with respect
to its ethanol or corn during the year may vary substantially from time to
time based on a number of factors, including supply and demand factors
affecting the needs of customers to purchase ethanol or suppliers to sell
Lincolnway Energy raw materials on a fixed price basis, Lincolnway
Energy's views as to future market trends, seasonable factors and the cost
of future contracts.
|
|
|
Lincolnway
Energy's cost per ton for coal under its current coal supply agreement is
subject to various fixed and periodic adjustments based on factors which
are outside of the control of Lincolnway Energy's management. The factors
include changes in certain inflation type indices, increases in
transportation costs and the quality of coal. Lincolnway
Energy's coal costs will therefore vary, and the variations could be
material. Lincolnway Energy's coal costs for the six months
ended March 31, 2010 represented approximately 6% of Lincolnway Energy's
total cost of goods sold for that period. Coal costs
represented approximately 5% of Lincolnway Energy's total cost of goods
sold for the six months ended March 31,
2009.
|
|
|
Interest
Rate Risk
|
|
|
Lincolnway
Energy has various loan agreements and promissory notes which expose
Lincolnway Energy to market risk related to changes in the interest rate
imposed under those loan agreements and promissory
notes.
|
The
interest rate under all of the loan agreements and promissory notes, other than
with respect to $2,500,000 of the loan with Co-Bank, are, however, fixed at
rates ranging from 0% to 6.62% per annum. The variable interest rate
for $2,500,000 of the Co-Bank loan is based on the one month LIBOR index rate
plus 3.3%, and was at 3.53% per annum as of March 31,
2010. Lincolnway Energy's outstanding loan amount with Co-Bank as of
March 31, 2010 was $10,250,000 As noted, $2,500,000 of that
amount accrues interest at the variable interest rate described
above. The remaining balance of the loan is fixed at 6.62% per annum
until July, 2011.
Lincolnway
Energy does not feel that a change in variable interest rates will have a
material affect on the financial performance of the company.
30
|
Item
4.
|
Controls
and Procedures.
|
|
|
Evaluation
of Disclosure Controls and
Procedures
|
|
|
Lincolnway
Energy's management, under the supervision and with
the participation of Lincolnway Energy's president
and chief executive officer and Lincolnway Energy's chief financial
officer, have evaluated the effectiveness of Lincolnway
Energy's disclosure controls and procedures (as
defined in Rule 13a-15(e) under the Securities Exchange
Act of 1934) as of the end of the period covered by this quarterly
report. Based on that evaluation, Lincolnway Energy's
president and chief executive officer and Lincolnway Energy's chief
financial officer have concluded that, as of the end of
the period covered by this quarterly report, Lincolnway Energy's
disclosure controls and procedures have been effective to provide
reasonable assurance that the information required to be disclosed
in the reports Lincolnway Energy files or submits under the
Securities Exchange Act of 1934 is (i) recorded,
processed, summarized and reported within the time
periods specified in the Securities and
Exchange Commission's rules and forms,
and (ii) accumulated and communicated to
management, including Lincolnway Energy's principal
executive and principal financial officers or persons performing such
functions, as appropriate, to allow timely decisions
regarding disclosure. Lincolnway Energy believes, however,
that a control system, no matter how well designed and operated, cannot
provide absolute assurance that the objectives of the control
system are met, and no evaluation of controls can provide
absolute assurance that all control issues and instances of
fraud, if any, within a company have been
detected.
|
|
|
No
Changes in Internal Control Over Financial
Reporting
|
|
|
No
change in Lincolnway Energy's internal control over financial reporting
occurred during the period covered by this quarterly report that has
materially affected, or is reasonably likely to materially affect,
Lincolnway Energy's internal control over financial
reporting.
|
31
|
PART
II - OTHER INFORMATION
|
|
Item
1.
|
Legal
Proceedings.
|
|
|
As
of the date of this quarterly report, Lincolnway Energy was not aware of
any material pending legal proceeding to which Lincolnway Energy was a
party or of which any of Lincolnway Energy's property was the subject,
other than ordinary routine litigation, if any, that was incidental to
Lincolnway Energy's business, except as discussed in the following
paragraph. As of the date of this quarterly report, Lincolnway
Energy was not aware that any governmental authority was contemplating any
material proceeding against Lincolnway Energy or any of Lincolnway
Energy's property.
|
|
|
A
Complaint for Patent Infringement was filed against Lincolnway Energy and
certain other parties on May 3, 2010 by GS CleanTech
Corporation. The Complaint was filed in the United States
District Court for the Northern District of Iowa, Western
Division. The Complaint alleges, in general, that the corn oil
extraction equipment and related processes used by Lincolnway Energy and
the other parties infringes upon one or more of the claims under certain
patents held by GS CleanTech Corporation. The Complaint seeks
injunctive relief, an award of damages with interest, and any other
remedies available under certain patent statutes or otherwise under law.
Lincolnway Energy is reviewing the Complaint and considering its response.
Lincolnway Energy is unable to determine at this time if the Complaint
will have a material adverse affect on Lincolnway
Energy.
|
|
Item
1A.
|
Risk
Factors.
|
|
|
There
have been no material changes from the risk factors as previously
disclosed in Lincolnway Energy's Form 10-K for the fiscal year ended
September 30, 2009 and filed with the Securities and Exchange Commission
on December 22, 2009.
|
|
|
An
investment in any membership units of Lincolnway Energy involves a high
degree of risk and is a speculative and volatile investment. An
investor could lose all or part of his or her investment in any membership
units.
|
|
Item
2.
|
Unregistered
Sales of Equity Securities and Use of
Proceeds.
|
|
|
Lincolnway
Energy did not sell any membership units during the period of January 1,
2010 through March 31, 2010.
|
|
|
None
of Lincolnway Energy's membership units were purchased by or on behalf of
Lincolnway Energy or any affiliated purchaser (as defined in Rule
10b-18(a)(3) of the Exchange Act) of Lincolnway Energy during the period
of January 1, 2010 through March 31,
2010.
|
32
|
Item
3.
|
Defaults
Upon Senior Securities.
|
|
|
There
has been no material default in the payment of principal, interest, a
sinking or purchase fund installment, or any other material default not
cured within thirty days, with respect to any indebtedness of Lincolnway
Energy exceeding 5% of the total assets of Lincolnway
Energy.
|
|
|
No
material arrearage in the payment of dividends or any other material
delinquency has occurred with respect to any class of preferred membership
units of Lincolnway Energy which is registered or which ranks prior to any
class of registered membership units of Lincolnway
Energy.
|
|
Item
5.
|
Other
Information.
|
There was
no information required to be disclosed in a report on Form 8-K during the
period of January 1, 2010 through March 31, 2010 which was not reported on a
Form 8-K.
There
were no material changes during the period of January 1, 2010 through March 31,
2010 to the procedures by which the members of Lincolnway Energy may recommend
nominees to Lincolnway Energy's board.
|
Item
6.
|
Exhibits.
|
The
following exhibits are filed as part of this quarterly
report. Exhibits previously filed are
incorporated by reference, as noted.
|
Incorporated by
Reference
|
|||||||
|
Exhibit
|
Filed
Herewith;
|
Period
|
Filing
|
||||
|
Number
|
Exhibit
Description
|
Page
Number
|
Form
|
Ending
|
Exhibit
|
Date
|
|
|
3.1
|
Articles
of Restatement
|
10-Q
|
6/30/07
|
3.1
|
8/13/07
|
||
|
3.2
|
Amended
and Restated Operating Agreement and Unit Assignment
Policy
|
10-Q
|
6/30/07
|
3.2
|
8/13/07
|
||
|
10.2
|
Master
Loan Agreement Between Lincolnway Energy, LLC and Farm Credit Services of
America
|
10
|
10.2
|
1/27/06
|
|||
|
10.3
|
Construction
and Term Loan Supplement Between Lincolnway Energy, LLC and FarmCredit
Services of America
|
10
|
10.3
|
1/27/06
|
|||
33
|
Incorporated by
Reference
|
||||||
|
Exhibit Number |
Exhibit
Description
|
Filed
Herewith; Page
Number |
Form
|
Period Ending |
Exhibit
|
Filing Date |
|
10.4
|
Construction
and Revolving Term Loan Supplement Between Lincolnway Energy, LLC and Farm
Credit Services of America
|
10
|
10.4
|
1/27/06
|
||
|
10.5
|
Loan
Agreement Between Lincolnway Energy, LLC and Iowa Department of
Transportation
|
10
|
10.5
|
1/27/06
|
||
|
10.7
|
Distiller's
Grain Marketing Agreement Between Lincolnway Energy, LLC and Hawkeye Gold,
LLC
|
10-K
|
9/30/07
|
10.7
|
12/21/07
|
|
|
*10.9
|
Coal
Supply Agreement Between Lincolnway Energy, LLC and Williams Bulk
Transfer, Inc. See Exhibit 10.9.1 for an amendment to this
agreement.
|
10
|
10.9
|
1/27/06
|
||
|
*10.9.1
|
Amendment
Number One
to
Coal Supply Agreement Between Lincolnway Energy, LLC and Williams Bulk
Transfer, Inc.
|
10-K
|
9/30/07
|
10.9.1
|
12/21/07
|
|
|
10.10
|
Loan
Agreement Between Lincolnway Energy, LLC and Iowa Department
of
Economic
Development
|
10
|
10.10
|
1/27/06
|
||
| 10.11 |
Amended
and Restated Grain Handling Agreement Between Lincolnway Energy, LLC and
Heart of Iowa Cooperative
|
10
|
10.11
|
1/27/06
|
||
| 10.13 |
Industry
Track Contract Between Lincolnway Energy, LLC and Union Pacific
Railroad
|
10-Q
|
6/30/06
|
10.13
|
8/14/06
|
|
|
*10.15
|
Ethanol
Marketing Agreement Between Lincolnway Energy, LLC and Green Plains Trade
Group LLC
|
10-K
|
9/30/09
|
10.15
|
12/22/09
|
|
|
31.1
|
Rule
13a-14(a) Certification of President and Chief Executive
Officer
|
E-1
|
||||
34
| Incorporated by Reference | ||||||
|
Exhibit
Number |
Exhibit Description |
Filed
herewith,
Page Number |
Form | Period
Ending |
Exhibit |
Filing
Date |
|
|
||||||
| 31.2 |
Rule
13a-14(a) Certification
of
Chief Financial Officer
|
E-3
|
||||
|
32.1
|
Section 1350 Certification of President and Chief Executive Officer |
E-5
|
||||
| 32.2 |
Section
1350 Certification of Chief Financial Officer
|
E-6
|
||||
|
*
|
Material
has been omitted pursuant to a request for confidential treatment and such
material has been filed separately with the Securities and Exchange
Commission.
|
[THE
REST OF THIS PAGE IS INTENTIONALLY LEFT BLANK]
35
SIGNATURES
Pursuant to the requirements of the
Securities Exchange Act of 1934, the registrant has duly caused this report to
be signed on its behalf by the undersigned thereunto duly
authorized.
| LINCOLNWAY ENERGY, LLC | |||
|
May
13, 2010
|
By:
|
/s/ Richard Brehm | |
| Name: Richard Brehm | |||
| Title: President and Chief Executive Officer | |||
| May 13, 2010 | By: | /s/ Kim Supercynski | |
| Name: Kim Supercynski | |||
| Title: Chief Financial Officer | |||
36
EXHIBIT
INDEX
Exhibits
Filed With Form 10-Q
of
Lincolnway Energy, LLC
For
the Quarter Ended March 31, 2010
|
Description of
Exhibit
|
Page
|
||
|
31.
|
Rule
13a-14(a)/15d-14(a) Certifications
|
|
|
|
|
31.1 |
Rule
13a-14(a) Certification of President and
Chief Executive
Officer
|
E-1
|
| 31.2 |
Rule
13a-14(a) Certification of Chief Financial
Officer
|
E-3
|
|
|
|
|||
|
32.
|
Section 1350 Certifications | ||
|
|
|||
|
|
32.1 |
Section
1350 Certification of President and
Chief Executive
Officer
|
E-5
|
|
|
|||
| 32.2 | Section 1350 Certification of Chief Financial Officer |
E-6
|
|
37