Attached files
Table of Contents
SECURITIES AND EXCHANGE COMMISSION
Washington, D.C. 20549
Form 10-Q
(Mark One)
| x | QUARTERLY REPORT PURSUANT TO SECTION 13 OR 15(d) OF THE SECURITIES EXCHANGE ACT OF 1934 |
For the quarterly period ended March 31, 2010
OR
| ¨ | TRANSITION REPORT PURSUANT TO SECTION 13 OR 15(d) OF THE SECURITIES EXCHANGE ACT OF 1934 |
For the transition period from to
COMMISSION FILE NUMBER NO: 0-11113
PACIFIC CAPITAL BANCORP
(Exact Name of Registrant as Specified in its Charter)
| California | 95-3673456 | |
| (State or other jurisdiction of incorporation or organization) |
(I.R.S. Employer Identification No.) |
| 1021 Anacapa Street Santa Barbara, California |
93101 | |
| (Address of principal executive offices) | (Zip Code) |
(805) 564-6405
(Registrant’s telephone number, including area code)
Not Applicable
Former name, former address and former fiscal year, if changed since last report.
Indicate by check mark whether the registrant (1) has filed all reports required to be filed by Section 13 or 15(d) of the Securities Exchange Act of 1934 during the preceding 12 months (or for such shorter period that the registrant was required to file such reports), and (2) has been subject to such filing requirements for the past 90 days. Yes x No ¨
Indicate by check mark whether the registrant has submitted electronically and posted on its corporate Web site, if any, every Interactive Data File required to be submitted and posted pursuant to Rule 405 of Regulation S-T (§232.405 of this chapter) during the preceding 12 months (or for such shorter period that the registrant was required to submit and post such files).
Yes ¨ No ¨
Indicate by check mark whether the registrant is a large accelerated filer, an accelerated filer, a non-accelerated filer or smaller reporting company. See definitions of “large accelerated filer”, “accelerated filer” and a “smaller reporting company” in Rule 12b-2 of the Exchange Act.
Large accelerated filer ¨ Accelerated filer x Non-accelerated filer ¨ Smaller reporting company ¨
(Do not check if a smaller reporting company)
Indicate by check mark whether the registrant is a shell company (as defined in Rule 12b-2 of the Exchange Act).
Yes ¨ No x
Number of shares of common stock of the registrant outstanding as of April 30, 2010: 46,863,872
Table of Contents
| 3 | ||||
| 3 | ||||
| Item 1. |
Financial Statements: |
|||
| 5 | ||||
| 6 | ||||
| 8 | ||||
| 9 | ||||
| 11 | ||||
| The financial statements included in this Quarterly Report on Form 10-Q should be read with reference to Pacific Capital Bancorp’s Annual Report on Form 10-K for the fiscal year ended December 31, 2009. |
||||
| Item 2. |
Management’s Discussion and Analysis of Financial Condition and Results of Operations |
42 | ||
| Item 3. |
59 | |||
| Item 4. |
63 | |||
| 64 | ||||
| 67 | ||||
| Item 1. |
67 | |||
| Item 1A. |
67 | |||
| Item 2. |
69 | |||
| Item 3. |
69 | |||
| Item 4. |
69 | |||
| Item 5. |
70 | |||
| Item 6. |
72 | |||
| 73 | ||||
2
Table of Contents
PART I – FINANCIAL INFORMATION
This Quarterly Report on Form 10-Q contains “forward-looking statements” within the meaning of Section 27A of the Securities Act of 1933, as amended, and Section 21E of the Securities Exchange Act of 1934, as amended. Pacific Capital Bancorp (the “Company” or “PCB”) intends such forward-looking statements to be covered by the safe harbor provisions for forward-looking statements in these provisions. All statements other than statements of historical fact are “forward-looking statements” for purposes of federal and state securities laws, including, but not limited to, statements about anticipated future operating and financial performance, financial position and liquidity, business prospects, strategic alternatives, consummation of any capital investment or recapitalization, business strategies, regulatory and competitive outlook, investment and expenditure plans, capital and financing needs and availability, acquisition and divestiture opportunities, plans and objectives of management for future operations, and other similar forecasts and statements of expectation and statements of assumptions underlying any of the foregoing. Words such as “will likely result,” “aims,” “anticipates,” “believes,” “could,” “estimates,” “expects,” “hopes,” “intends,” “may,” “plans,” “projects,” “seeks,” “should,” “will,” and variations of these words and similar expressions are intended to identify these forward-looking statements.
Forward-looking statements are based on the Company’s current expectations and assumptions regarding its business, the regulatory environment, the economy and other future conditions. Because forward-looking statements relate to the future, they are subject to inherent uncertainties, risks and changes in circumstances that are difficult to predict. The Company’s actual results may differ materially from those contemplated by the forward-looking statements. The Company cautions you therefore against relying on any of these forward-looking statements. They are neither statements of historical fact nor guarantees or assurances of future performance. Important factors that could cause actual results to differ materially from those in the forward-looking statements include, but are not limited to, the following:
| n | inability to complete the investment and recapitalization transactions contemplated by the Investment Agreement dated April 29, 2010 (the “Investment Agreement”) by and among the Company, Pacific Capital Bank, N.A. (the “Bank”) and SB Acquisition Company LLC; |
| n | inability to achieve the higher minimum capital ratios that the Bank is required to maintain pursuant to the Consent Order issued by the Office of the Comptroller of the Currency (the “OCC”) on May 11, 2010 (“Consent Order”); |
| n | the effect of other requirements of the Consent Order and the Written Agreement dated May 11, 2010 (“Written Agreement”), by and between the Company and the Federal Reserve Bank of San Francisco (“FRB”), and any further regulatory actions; |
| n | inability to continue as a going concern; |
| n | management’s ability to effectively execute the Company’s business plan; |
| n | inability to raise additional capital on acceptable terms, or at all; |
| n | inability to receive dividends from the Bank and to service debt and satisfy obligations as they become due; |
| n | costs and effects of legal and regulatory developments, including the resolution of legal proceedings or regulatory or other governmental inquiries, and the results of regulatory examinations or reviews; |
| n | changes in capital classification; |
| n | the impact of current economic conditions and the Company’s results of operations on its ability to borrow additional funds to meet its liquidity needs; |
| n | local, regional, national and international economic conditions and events and the impact they may have on the Company and its customers; |
| n | changes in the economy affecting real estate values; |
| n | inability to attract and retain deposits; |
| n | changes in the level of non-performing assets and charge-offs; |
3
Table of Contents
| n | changes in estimates of future reserve requirements based upon the periodic review thereof under relevant regulatory and accounting requirements; |
| n | changes in the financial performance and/or condition of the Bank’s borrowers; |
| n | effect of additional provision for loan losses; |
| n | long-term negative trends in the Company’s market capitalization; |
| n | continued listing of the Company’s common stock on The NASDAQ Global Select Market; |
| n | effects of any changes in trade and monetary and fiscal policies and laws, including the interest rate policies of the Federal Reserve Board; |
| n | inflation, interest rate, cost of funds, securities market and monetary fluctuations; |
| n | political instability; |
| n | acts of war or terrorism, natural disasters such as earthquakes or fires, or the effects of pandemic flu; |
| n | the timely development and acceptance of new products and services and perceived overall value of these products and services by users; |
| n | changes in consumer spending, borrowings and savings habits; |
| n | technological changes; |
| n | changes in the Company’s organization, management, compensation and benefit plans; |
| n | competitive pressures from other financial institutions; |
| n | continued consolidation in the financial services industry; |
| n | inability to maintain or increase market share and control expenses; |
| n | impact of reputational risk on such matters as business generation and retention, funding and liquidity; |
| n | rating agency downgrades; |
| n | continued volatility in the credit and equity markets and its effect on the general economy; |
| n | effect of changes in laws and regulations (including laws concerning banking, taxes and securities) with which the Company and its subsidiaries must comply; |
| n | effect of changes in accounting policies and practices, as may be adopted by the regulatory agencies, as well as the Public Company Accounting Oversight Board, the Financial Accounting Standards Board and other accounting standard setters; |
| n | other factors that are described under the heading “Risk Factors” in this Form 10-Q and in the Company’s Annual Report on Form 10-K for the year ended December 31, 2009, as amended (the “2009 Form 10-K”); and |
| n | the Company’s success at managing the risks involved in the foregoing items. |
Forward-looking statements speak only as of the date they are made, and the Company does not undertake to update forward-looking statements to reflect circumstances or events that occur after the date the forward-looking statements are made, whether as a result of new information, future developments or otherwise, except as may be required by law.
Purpose and Definition of Terms
The following document includes executive management’s (“Management”) insight of the Company’s financial condition and results of operations of PCB and its subsidiaries. Unless otherwise stated, “the Company,” “we,” “us,” and “our” refer to the consolidated entity, Pacific Capital Bancorp while “the Bank” refers to Pacific Capital Bank, N.A.
This discussion should be read in conjunction with the 2009 Form 10-K. Terms and acronyms used throughout this document are defined in the glossary on pages 64 through 67.
4
Table of Contents
Pacific Capital Bancorp and Subsidiaries
CONSOLIDATED BALANCE SHEETS
| March 31, 2010 |
December 31, | ||||||
| (unaudited) | 2009 | ||||||
| (in thousands, except per share amounts) | |||||||
| Assets: |
|||||||
| Cash and due from banks |
$ | 20,013 | $ | 45,593 | |||
| Interest-bearing demand deposits in other financial institutions |
1,109,927 | 878,823 | |||||
| Cash and cash equivalents |
1,129,940 | 924,416 | |||||
| Investment securities—trading, at fair value |
5,286 | 5,403 | |||||
| Investment securities—available-for-sale, at fair value; amortized cost of $929,000 at March 31, 2010 and $1,135,456 at December 31, 2009 |
944,539 | 1,153,687 | |||||
| Loans: |
|||||||
| Held for sale, at lower of cost or fair value |
26,629 | 19,211 | |||||
| Held for investment, net of allowance for loan loss of $283,412 at March 31, 2010 and $272,852 at December 31, 2009 |
4,603,726 | 4,893,579 | |||||
| Total loans |
4,630,355 | 4,912,790 | |||||
| Premises and equipment, net |
68,304 | 71,934 | |||||
| Goodwill and other intangible assets |
8,641 | 9,289 | |||||
| Bank owned life insurance |
93,477 | 92,743 | |||||
| Other assets |
302,765 | 296,735 | |||||
| Assets of discontinued operations |
185,812 | 75,258 | |||||
| Total assets |
$ | 7,369,119 | $ | 7,542,255 | |||
| Liabilities: |
|||||||
| Deposits: |
|||||||
| Non-interest bearing |
$ | 1,051,008 | $ | 1,076,916 | |||
| Interest-bearing |
4,366,953 | 4,296,903 | |||||
| Total deposits |
5,417,961 | 5,373,819 | |||||
| Securities sold under agreements to repurchase and Federal funds purchased |
316,808 | 322,131 | |||||
| Long-term debt and other borrowings |
1,076,951 | 1,311,828 | |||||
| Other liabilities |
92,209 | 94,616 | |||||
| Liabilities of discontinued operations |
185,812 | 75,258 | |||||
| Total liabilities |
7,089,741 | 7,177,652 | |||||
| Commitments and contingencies (Note 13) |
|||||||
| Shareholders’ equity: |
|||||||
| Preferred stock—no par value; $1,000 per share stated value; 1,000 authorized, 181 issued and outstanding |
176,958 | 176,742 | |||||
| Common stock—no par value; $0.25 per share stated value; 500,000 authorized; 46,792 shares issued and outstanding at March 31, 2010 and 46,741 at December 31, 2009 |
11,703 | 11,689 | |||||
| Surplus |
124,739 | 123,886 | |||||
| Retained (deficit)/earnings |
(45,052 | ) | 37,934 | ||||
| Accumulated other comprehensive income |
11,030 | 14,352 | |||||
| Total shareholders’ equity |
279,378 | 364,603 | |||||
| Total liabilities and shareholders’ equity |
$ | 7,369,119 | $ | 7,542,255 | |||
See the accompanying notes.
5
Table of Contents
Pacific Capital Bancorp and Subsidiaries
CONSOLIDATED STATEMENTS OF OPERATIONS (unaudited)
| Three-Months Ended March 31, | ||||||||
| 2010 | 2009 | |||||||
| (in thousands, except per share amounts) | ||||||||
| Interest income: |
||||||||
| Loans |
$ | 65,848 | $ | 78,504 | ||||
| Investment securities—trading |
64 | 2,638 | ||||||
| Investment securities—available-for-sale |
8,326 | 11,067 | ||||||
| Other |
841 | 478 | ||||||
| Total interest income |
75,079 | 92,687 | ||||||
| Interest expense: |
||||||||
| Deposits |
17,792 | 24,287 | ||||||
| Securities sold under agreements to repurchase and Federal funds purchased |
2,008 | 3,152 | ||||||
| Long-term debt and other borrowings |
11,014 | 17,447 | ||||||
| Total interest expense |
30,814 | 44,886 | ||||||
| Net interest income: |
44,265 | 47,801 | ||||||
| Provision for loan losses |
99,865 | 73,516 | ||||||
| Net interest loss after provision for loan losses |
(55,600 | ) | (25,715 | ) | ||||
| Non-interest income: |
||||||||
| Service charges and fees |
5,739 | 6,039 | ||||||
| Trust and investment advisory fees |
5,408 | 5,546 | ||||||
| Gain on securities, net |
4,511 | 2,029 | ||||||
| Other |
3,919 | 1,959 | ||||||
| Total non-interest income |
19,577 | 15,573 | ||||||
| Non-interest expense: |
||||||||
| Salaries and employee benefits |
22,078 | 29,930 | ||||||
| Occupancy expense, net |
5,803 | 6,324 | ||||||
| Other |
23,439 | 23,580 | ||||||
| Total non-interest expense |
51,320 | 59,834 | ||||||
| Loss before provision for income taxes |
(87,343 | ) | (69,976 | ) | ||||
| Provision/(benefit) for income taxes |
49 | (32,394 | ) | |||||
| Net loss from continuing operations |
(87,392 | ) | (37,582 | ) | ||||
| (Expense)/income from discontinued operations, net of tax |
(1,231 | ) | 32,070 | |||||
| Gain on sale of discontinued operations, net of tax |
8,160 | — | ||||||
| Income from discontinued operations, net |
6,929 | 32,070 | ||||||
| Net loss |
(80,463 | ) | (5,512 | ) | ||||
| Dividends and accretion on preferred stock |
2,522 | 2,412 | ||||||
| Net loss applicable to common shareholders |
$ | (82,985 | ) | $ | (7,924 | ) | ||
(continued on next page)
6
Table of Contents
Pacific Capital Bancorp and Subsidiaries
CONSOLIDATED STATEMENTS OF OPERATIONS (unaudited)
(continued from previous page)
| Three-Months Ended March 31, | ||||||||
| 2010 | 2009 | |||||||
| (in thousands, except per share amounts) | ||||||||
| Loss from continuing operations per common share: |
||||||||
| Basic |
$ | (1.87 | ) | $ | (0.81 | ) | ||
| Diluted (Note 2) |
$ | (1.87 | ) | $ | (0.81 | ) | ||
| Income from discontinued operations per common share: |
||||||||
| Basic |
$ | 0.15 | $ | 0.69 | ||||
| Diluted (Note 2) |
$ | 0.15 | $ | 0.69 | ||||
| Loss applicable to common shareholders per share: |
||||||||
| Basic |
$ | (1.77 | ) | $ | (0.17 | ) | ||
| Diluted (Note 2) |
$ | (1.77 | ) | $ | (0.17 | ) | ||
| Average number of common shares—basic |
46,760 | 46,620 | ||||||
| Average number of common shares—diluted (Note 2) |
47,260 | 47,108 | ||||||
| Dividends declared per common share |
$ | — | $ | 0.11 | ||||
See the accompanying notes.
7
Table of Contents
Pacific Capital Bancorp and Subsidiaries
CONSOLIDATED STATEMENTS OF COMPREHENSIVE LOSS (unaudited)
| Three-Months Ended | ||||||||
| March 31, | ||||||||
| 2010 | 2009 | |||||||
| (in thousands) | ||||||||
| Net loss |
$ | (80,463 | ) | $ | (5,512 | ) | ||
| Other comprehensive (loss)/ income, net: |
||||||||
| Unrealized gain on securities available-for-sale (“AFS”), net |
1,828 | 117 | ||||||
| Impairment loss on securities included in earnings, net |
— | 3 | ||||||
| Realized (gain)/loss on sale and calls of AFS securities included in earnings, net |
(4,520 | ) | 84 | |||||
| Postretirement (expense)/benefit obligation arising during period, net |
(629 | ) | 146 | |||||
| Total other comprehensive (loss)/income |
(3,321 | ) | 350 | |||||
| Comprehensive loss |
$ | (83,784 | ) | $ | (5,162 | ) | ||
The amounts reclassified out of accumulated other comprehensive income (“AOCI”) into earnings for the three month period ended March 31, 2010 and 2009 were $4.5 million of income and $147,000 of expense, respectively. There was no income tax expense associated with the $4.5 million of realized gain on the sale of available for sale (“AFS”) securities. The income tax benefit related to the amount reclassified out of AOCI for the three month period ended March 31, 2009 was $62,000.
See the accompanying notes.
8
Table of Contents
Pacific Capital Bancorp and Subsidiaries
CONSOLIDATED STATEMENTS OF CASH FLOWS (unaudited)
| Three Months Ended | ||||||||
| March 31, | ||||||||
| 2010 | 2009 | |||||||
| (in thousands) | ||||||||
| Cash flows from operating activities: |
||||||||
| Net loss from continuing operations |
$ | (87,392 | ) | $ | (37,582 | ) | ||
| Net income from discontinued operations |
6,929 | 32,070 | ||||||
| Net loss |
(80,463 | ) | (5,512 | ) | ||||
| Adjustments to reconcile net loss to net cash provided by operating activities: |
||||||||
| Provision for loan losses |
99,865 | 73,516 | ||||||
| Depreciation and amortization |
4,214 | 5,599 | ||||||
| Stock-based compensation |
882 | 882 | ||||||
| Net amortization of discounts and premiums for investment securities |
(258 | ) | (1,720 | ) | ||||
| Operating lease impairment |
1,301 | — | ||||||
| (Gains)/losses on: |
||||||||
| Sale of loans, net |
(3,955 | ) | (543 | ) | ||||
| Securities, AFS |
(4,520 | ) | 147 | |||||
| Futures |
— | 255 | ||||||
| Loss on sale of other real estate owned |
192 | — | ||||||
| Loans originated for sale and principal collections, net |
26,629 | 20,638 | ||||||
| Changes in: |
||||||||
| Other assets |
(9,273 | ) | (13,072 | ) | ||||
| Other liabilities |
(3,959 | ) | (4,749 | ) | ||||
| Trading securities, net |
117 | 8,489 | ||||||
| Servicing rights, net |
416 | 306 | ||||||
| Net cash (used)/provided by operating activities attributable to discontinued operations |
(808 | ) | 111,234 | |||||
| Net cash provided by operating activities |
30,380 | 195,470 | ||||||
| Cash flows from investing activities: |
||||||||
| Proceeds from loan sales |
33,328 | 1,182 | ||||||
| Loan originations and principal collections, net |
126,568 | (31,115 | ) | |||||
| Proceeds from sale of AFS securities |
48,636 | — | ||||||
| Principal pay downs, calls and maturities of AFS securities |
162,596 | 395,001 | ||||||
| Purchase of AFS securities |
— | (679,439 | ) | |||||
| Purchase of Federal Home Loan Bank stock |
— | (705 | ) | |||||
| Purchase of premises and equipment, net |
(271 | ) | (5,384 | ) | ||||
| Proceeds from sale of other real estate owned, net |
2,316 | — | ||||||
| Net cash provided/(used) by investing activities attributable to discontinued operations |
2,077 | (140,568 | ) | |||||
| Net cash provided/(used) by investing activities |
375,250 | (461,028 | ) | |||||
(continued on next page)
9
Table of Contents
Pacific Capital Bancorp and Subsidiaries
CONSOLIDATED STATEMENTS OF CASH FLOWS (unaudited)
(continued from previous page)
| Three Months Ended | ||||||||
| March 31, | ||||||||
| 2010 | 2009 | |||||||
| (in thousands) | ||||||||
| Cash flows from financing activities: |
||||||||
| Net increase/(decrease) in deposits |
44,142 | (265,020 | ) | |||||
| Net decrease in short-term borrowings |
(26,933 | ) | 2,544 | |||||
| Proceeds from long-term debt and other borrowings |
— | 25,000 | ||||||
| Repayment of long-term debt and other borrowings |
(216,031 | ) | (18,041 | ) | ||||
| Proceeds from stock transactions |
— | 7 | ||||||
| Cash dividends paid on common stock |
— | (5,165 | ) | |||||
| Cash dividends paid on preferred stock |
— | (2,107 | ) | |||||
| Other, net |
(15 | ) | (49 | ) | ||||
| Net cash provided/(used) by financing activities attributable to discontinued operations |
113,437 | (116,247 | ) | |||||
| Net cash used by financing activities |
(85,400 | ) | (379,078 | ) | ||||
| Net increase/(decrease) in cash and cash equivalents |
320,230 | (644,636 | ) | |||||
| Cash and cash equivalents at beginning of period |
995,522 | 1,938,521 | ||||||
| Cash and cash equivalents at end of period |
$ | 1,315,752 | $ | 1,293,885 | ||||
| Supplemental disclosure: |
||||||||
| Cash paid during the period for: |
||||||||
| Interest |
$ | 31,449 | $ | 46,731 | ||||
| Income taxes |
$ | — | $ | 50 | ||||
| Non-cash investing activity: |
||||||||
| Net transfers from loans held for investment to loans held for sale |
$ | 47,862 | $ | — | ||||
| Transfers to other real estate owned, net |
$ | 14,184 | $ | 2,811 | ||||
| Non-cash financing activity: |
||||||||
| Preferred stock dividends declared not paid |
$ | 2,522 | $ | 1,104 | ||||
See the accompanying notes.
10
Table of Contents
Pacific Capital Bancorp and Subsidiaries
NOTES TO CONSOLIDATED FINANCIAL STATEMENTS (unaudited)
1. SUMMARY OF SIGNIFICANT ACCOUNTING POLICIES
The financial statements and notes included in this Quarterly Report on Form 10-Q should be read with reference to Pacific Capital Bancorp’s Annual Report on Form 10-K for the fiscal year ended December 31, 2009.
Nature of Operations
Pacific Capital Bancorp (“the Company,” “PCB,” “we,” “us,” and “our”) is a bank holding company organized under the laws of the state of California. PCB provides a full range of commercial and consumer banking services to households, professionals, and businesses through its wholly-owned subsidiary Pacific Capital Bank, National Association (“the Bank” or “PCBNA”). These banking services include depository, lending and wealth management services. PCBNA’s lending products include commercial, consumer, commercial real estate, residential real estate and Small Business Administration (“SBA”) loans. Depository services include checking, interest-bearing checking (“NOW”), money market (“MMDA”), savings, and Certificate of Deposit (“CD”) accounts. Other services include safe deposit boxes, travelers’ checks, money orders, foreign exchange services, and cashiers checks. PCBNA offers a wide range of wealth management services through the Wealth Management segment, which in addition to a full-service trust operation, includes two registered investment advisors that are wholly-owned subsidiaries, Morton Capital Management (“MCM”) and R.E. Wacker Associates (“REWA”), and a 20% interest in Veritas Wealth Management Advisors, LLC (“Veritas”). The Wealth Management segment offers a wide range of trust and investment advisory services as well as the same loan and deposit products offered through the Community and Commercial Banking segment. PCBNA was one of the largest nationwide providers of financial services related to the electronic filing of income tax returns including the Refund Anticipation Loan (“RAL”) and Refund Transfer (“RT”) business products until January 14, 2010, when the Company sold the RAL and RT Program segment. All of the activity associated with the RAL and RT Program segment has been reclassified to discontinued operations and is discussed in Note 8 “Discontinued Operations—RAL and RT Programs” of these Consolidated Financial Statements.
PCBNA conducts its banking services under five brand names: Santa Barbara Bank & Trust (“SBB&T”), First National Bank of Central California (“FNB”), South Valley National Bank (“SVNB”), San Benito Bank (“SBB”), and First Bank of San Luis Obispo (“FBSLO”). The SBB&T offices are located in Santa Barbara, Ventura and Los Angeles counties. Banking offices are located in eight counties in the central coast of California from Los Angeles to Santa Clara.
These Consolidated Financial Statements have been prepared under the assumption that the Company is a going concern. As a result of the significant operating losses incurred by the Company and the enhanced regulatory scrutiny under which the Company and the Bank are operating, the Company’s Independent Registered Public Accounting Firm added an explanatory paragraph in their audit opinion dated March 12, 2010 issued in connection with our December 31, 2009 Consolidated Financial Statements, expressing substantial doubt regarding our ability to continue as a going concern. Management’s plans to address this uncertainty include the raising of capital pursuant to the Investment Agreement, as discussed in Note 19, “Subsequent Events” of these Consolidated Financial Statements, and the implementation of the Company’s three-year strategic and capital plan. For more information regarding the going concern opinion refer to Note 16, “Going Concern” of these Consolidated Financial Statements. In addition, on May 11, 2010, the Company entered into a Written Agreement with the FRB and the Bank entered into a Consent Order with the OCC. The detailed information regarding the Written Agreement and the Consent Order are in Note 17, “Regulatory Matters” of these Consolidated Financial Statements.
11
Table of Contents
The Consolidated Financial Statements refer to “Management” within the disclosures. The Company’s definition of Management is the executive management team of the Company and its subsidiaries.
Basis of Presentation
The accounting and reporting policies of the Company are in accordance with accounting principles generally accepted in the United States (“GAAP”) and conform to practices within the financial services industry. The accounts of the Company and its consolidated subsidiaries are included in these Consolidated Financial Statements. All significant intercompany balances and transactions have been eliminated. Certain prior year amounts have been reclassified to conform with the current year’s presentation.
The Financial Accounting Standards Board (“FASB”) established the FASB Accounting Standards Codification (“FASB ASC”), as the source of authoritative GAAP recognized by the FASB to be applied by nongovernmental entities in the preparation of financial statements. Rules and interpretive releases of the U.S. Securities and Exchange Commission (“SEC”) under authority of federal securities laws are also sources of authoritative GAAP for SEC registrants. All other non-grandfathered non-SEC accounting literature not included in the FASB ASC became non-authoritative. The FASB ASC does not change or alter existing GAAP and, therefore, the adoption of the FASB ASC did not impact the Company’s Consolidated Financial Statements.
The preparation of financial statements in accordance with GAAP requires Management to make estimates and assumptions that affect the amount of assets and liabilities as well as disclosures of contingent assets and liabilities at the date of the financial statements. Although Management believes these estimates to be reasonably accurate, actual amounts may differ. These Consolidated Financial Statements have been prepared under the assumption that the Company is a going concern, an assumption for which the Company’s Independent Registered Public Accounting Firm expressed substantial doubt in their opinion relating to the Consolidated Financial Statements of the 2009 Form 10-K.
Consolidation of Subsidiaries
PCB has six wholly-owned subsidiaries. PCBNA, a banking subsidiary, PCB Service Corporation, utilized as a trustee of deeds of trust in which PCBNA is the beneficiary and four unconsolidated subsidiaries used as business trusts in connection with issuance of trust-preferred securities as described in Note 14, “Long-term Debt and Other Borrowings” of the 2009 Form 10-K Consolidated Financials Statements.
PCBNA has three wholly-owned consolidated subsidiaries:
| n | MCM and REWA, two registered investment advisors that provide investment advisory services to individuals, foundations, retirement plans and select institutional clients. |
| n | SBBT RAL Funding Corp. which was utilized for the securitization of RALs to assist with the financing of the RAL program as described in Note 7, “RAL and RT Programs” of the 2009 Form 10-K. |
PCBNA also retains ownership in several low-income housing tax credit partnerships (“LIHTCP”) that generate tax credits. These investments historically have played a significant role in meeting the Bank’s Community Reinvestment Act (“CRA”) requirements as well as providing tax credits to reduce the Company’s taxable income. As further described in Note 14, “Fair Value of Financial Instruments,” Management determined there was an other-than-temporary impairment of these investments during the year ended December 31, 2009.
12
Table of Contents
Veritas is a registered investment advisor organized in late 2007, in which PCBNA made an initial investment of $250,000. An additional investment of $750,000 was made in late January 2008 for a total investment of $1.0 million or a 20% interest in Veritas. Veritas commenced operations in the second quarter of 2008. For the three months ended March 31, 2010 and 2009, PCBNA’s ownership in Veritas had a loss of $14,000 and $9,000, respectively. PCBNA’s share of Veritas’ income is included in the Company’s Consolidated Financial Statements using the equity method. As disclosed in Note 19, “Subsequent Events” of these Consolidated Financial Statements, the Company sold its investment in Veritas on May 5, 2010.
The Company does not have any other entities that should be considered for consolidation.
Segments
GAAP requires that the Company disclose certain information related to the performance of its business segments. Business segments are defined based on how the chief operating decision maker of the Company views the Company’s operations, allocates resources and assesses performance. Based on these guidelines, we have determined that there are two operating segments: the Community and Commercial Banking segment (“CCB”) and the Wealth Management segment. The All Other segment consists of the administrative support units and the holding company for the Bank. The factors used in determining these reportable segments are defined in Note 15, “Segments” of these Consolidated Financial Statements of this Quarterly Report on Form 10-Q (“Form 10-Q”).
SIGNIFICANT ACCOUNTING POLICIES
Except as noted below, the significant accounting policies have not changed from those described in Note 1, “Summary of Significant Accounting Policies” in the Consolidated Financial Statements of the 2009 Form 10-K.
Discontinued Operations
On January 14, 2010, the Company entered into an agreement and sold the RAL and RT Programs segment. Management determined that the sale of the RAL and RT Programs met the requirements as a discontinued operation for the Company in accordance with the accounting guidance for Impairment and Disposal of Long-Lived Assets. Accordingly, the financial results from the RAL and RT Programs were reclassified within the Company’s Consolidated Financial Statements and presented separately as discontinued operations. The information regarding the sale of the RAL and RT Programs and required disclosures for discontinued operations are disclosed in Note 8, “Discontinued Operations—RAL and RT Programs” of the these Consolidated Financial Statements.
Accounting for Transfers of Financial Assets
The Company adopted the new accounting standard for the Sales and Transfers of Financial Assets on January 1, 2010. When an asset is sold, this new accounting standard requires the seller to determine if the purchaser of the asset has a participating interest. When a portion of a financial asset is transferred, but the transferred portion does not meet the definition of a participating interest, the transaction must be reported as a secured borrowing with a pledge of collateral and the seller must continue to report the transfer as an asset on its balance sheet. Upon the completion of a transfer of a participating interest that satisfies the conditions to be accounted for as a sale, the seller must (1) allocate the previous carrying amount of the entire financial asset between the participating interests sold and any that are retained based on their relative fair values at the transfer date, (2) derecognize the participating interests sold, (3) recognize and measure at fair value servicing assets (or servicing liabilities) and any other assets obtained and liabilities incurred in the sale, and (4) recognize in earnings any gain or loss on the sale.
This new accounting standard has specifically impacted how we account for transfers of the guaranteed portion of the Company’s Small Business Administration (“SBA”) loans. The government guarantee requires the Company to refund the premium to the purchaser if the SBA loan is repaid within 90 days of the transfer. Under the new accounting guidance, the obligation to refund the premium means that the transferred guaranteed portion of the loan does not meet the definition of a “participating interest” for the 90-day period that the premium refund obligation exists. As a result, the transfer must be accounted for as a secured borrowing during the 90 period after the date of transfer. After the 90-day period, assuming the transferred guaranteed portion and the retained unguaranteed portion of the SBA loan now meet the definition of a “participating interest,” the transfer of the guaranteed portion can be accounted for as a sale if all of the other conditions for sale accounting have been met.
13
Table of Contents
2. EARNINGS PER SHARE
The following table presents a reconciliation of basic loss per share and diluted loss per share. The denominator of the diluted loss per share ratio includes the effect of dilutive securities. The securities outstanding that are potentially dilutive are employee stock options, restricted stock and common stock warrants. When the Company reports a net loss there is no dilution of income and therefore, diluted loss per common share is calculated using basic weighted average shares outstanding.
| Three-Months Ended | ||||||||
| March 31, | ||||||||
| 2010 | 2009 | |||||||
| (in thousands, except per share amounts) |
||||||||
| Net loss from continuing operations |
$ | (87,392 | ) | $ | (37,582 | ) | ||
| (Expense)/income from discontinued operations, net of tax |
(1,231 | ) | 32,070 | |||||
| Gain on sale of discontinued operations, net of tax |
8,160 | — | ||||||
| Income from discontinued operations, net |
6,929 | 32,070 | ||||||
| Net loss |
(80,463 | ) | (5,512 | ) | ||||
| Less: Dividends and accretion on preferred stock |
2,522 | 2,412 | ||||||
| Net loss applicable to common shareholders |
$ | (82,985 | ) | $ | (7,924 | ) | ||
| Basic weighted average shares outstanding |
46,760 | 46,620 | ||||||
| Dilutive effect of stock options |
500 | 488 | ||||||
| Diluted weighted average shares outstanding |
47,260 | 47,108 | ||||||
| Loss from continuing operations per common share |
||||||||
| Basic |
$ | (1.87 | ) | $ | (0.81 | ) | ||
|
Diluted(1) |
$ | (1.87 | ) | $ | (0.81 | ) | ||
| Income from discontinued operations per common share |
||||||||
| Basic |
$ | 0.15 | $ | 0.69 | ||||
|
Diluted(1) |
$ | 0.15 | $ | 0.69 | ||||
| Loss applicable to common shareholders per share |
||||||||
| Basic |
$ | (1.77 | ) | $ | (0.17 | ) | ||
|
Diluted(1) |
$ | (1.77 | ) | $ | (0.17 | ) | ||
| (1) | (Loss)/income per diluted common share for the three months ended March 31, 2010 and 2009 are calculated using basic weighted average shares outstanding. The dilutive effect of stock options and the dilutive weighted average shares outstanding presented in the table above are for disclosure purposes only. |
For the three months ended March 31, 2010 and 2009, the average outstanding unexercised stock options of 1,082,000 and 1,418,000 shares, respectively, were not included in the computation of loss per share because they were anti-dilutive. For the three months ended March 31, 2010 and 2009, 1,512,000 common stack warrants, respectively, were not included in the computation of earnings per a share because they were anti-dilutive.
14
Table of Contents
3. SECURITIES
The amortized cost and estimated fair value of available for sale securities was as follows:
| March 31, 2010 | |||||||||||||
| Amortized Cost |
Gross Unrealized Gains |
Gross Unrealized Losses |
Fair Value | ||||||||||
| (in thousands) | |||||||||||||
| Available-for-Sale: |
|||||||||||||
| U.S. Treasury obligations (1) |
$ | 11,177 | $ | 162 | $ | — | $ | 11,339 | |||||
| U.S. Agency obligations (2) |
464,832 | 3,807 | (648 | ) | 467,991 | ||||||||
| Collateralized mortgage obligations (4) |
106,052 | 2,398 | (1,408 | ) | 107,042 | ||||||||
| Mortgage-backed securities (3) |
111,638 | 8,933 | — | 120,571 | |||||||||
| Asset-backed securities |
1,962 | — | (494 | ) | 1,468 | ||||||||
| State and municipal securities |
233,339 | 7,974 | (5,185 | ) | 236,128 | ||||||||
| Total available-for-sale securities |
$ | 929,000 | $ | 23,274 | $ | (7,735 | ) | $ | 944,539 | ||||
| December 31, 2009 | |||||||||||||
| Amortized Cost |
Gross Unrealized Gains |
Gross Unrealized Losses |
Fair Value | ||||||||||
| (in thousands) | |||||||||||||
| Available-for-Sale |
|||||||||||||
| U.S. Treasury obligations (1) |
$ | 11,212 | $ | 220 | $ | — | $ | 11,432 | |||||
| U.S. Agency obligations (2) |
605,010 | 4,009 | (1,089 | ) | 607,930 | ||||||||
| Collateralized mortgage obligations (4) |
114,508 | 1,217 | (1,791 | ) | 113,934 | ||||||||
| Mortgage-backed securities (3) |
156,686 | 12,372 | — | 169,058 | |||||||||
| Asset-backed securities |
1,963 | — | (692 | ) | 1,271 | ||||||||
| State and municipal securities |
246,077 | 8,828 | (4,843 | ) | 250,062 | ||||||||
| Total available-for-sale securities |
$ | 1,135,456 | $ | 26,646 | $ | (8,415 | ) | $ | 1,153,687 | ||||
| (1) | U.S. Treasury obligations are securities that are backed by the full faith and credit of the United States government. |
| (2) | U.S. Agency obligations are general obligations that are not backed by the full faith and credit of the United States government. They consist of obligations of Government Sponsored Enterprises issued by the Federal Farm Credit Banks, Federal Home Loan Banks, and Tennessee Valley Authority. |
| (3) | Mortgage-backed securities are securitized mortgage loans that consist of obligations of Government Sponsored Enterprises which guarantee the collection of principal and interest payments. The securities primarily consist of securities issued by Federal Home Loan Mortgage Corporation (“FHLMC”) and Federal National Mortgage Association (“FNMA”). |
| (4) | Collateralized mortgage obligations (“CMOs”) are securities which pool together mortgages and separate them into short, medium, or long term positions called tranches. The CMO’s in the table above primarily consist of securities issued by Government National Mortgage Association (“GNMA”)’s and to a lesser extent, FNMA, FHLMC and private label. |
Available for Sale (“AFS”) Securities
At March 31, 2010, the Company held $944.5 million of AFS Securities, a decrease of $209.1 million since December 31, 2009. A majority of this decrease was from $143.2 million of called securities and, the sale of $48.6 million of securities during the first quarter of 2010. A gain of $4.5 million on the sale of securities was recognized for the three month period ended March 31, 2010.
15
Table of Contents
The AFS securities that are in an unrealized loss position and temporarily impaired as of March 31, 2010 and December 31, 2009 are shown in the following table:
| March 31, 2010 | |||||||||||||||||||||
| Less than 12 months | 12 months or more | Total | |||||||||||||||||||
| Fair Value | Unrealized Loss |
Fair Value | Unrealized Loss |
Fair Value | Unrealized Loss |
||||||||||||||||
| (in thousands) | |||||||||||||||||||||
| U.S. Treasury/U.S. Agencies |
$ | 139,652 | $ | (648 | ) | $ | — | $ | — | $ | 139,652 | $ | (648 | ) | |||||||
| Municipal bonds |
59,036 | (2,964 | ) | 11,054 | (2,221 | ) | 70,090 | (5,185 | ) | ||||||||||||
| Collateralized mortgage obligations |
151 | (17 | ) | 9,507 | (1,391 | ) | 9,658 | (1,408 | ) | ||||||||||||
| Asset-backed securities |
— | — | 1,468 | (494 | ) | 1,468 | (494 | ) | |||||||||||||
| Total |
$ | 198,839 | $ | (3,629 | ) | $ | 22,029 | $ | (4,106 | ) | $ | 220,868 | $ | (7,735 | ) | ||||||
| December 31, 2009 | |||||||||||||||||||||
| Less than 12 months | 12 months or more | Total | |||||||||||||||||||
| Fair Value | Unrealized Loss |
Fair Value | Unrealized Loss |
Fair Value | Unrealized Loss |
||||||||||||||||
| (in thousands) | |||||||||||||||||||||
| U.S. Treasury/U.S. Agencies |
$ | 141,013 | $ | (1,089 | ) | $ | — | $ | — | $ | 141,013 | $ | (1,089 | ) | |||||||
| Municipal bonds |
55,457 | (2,418 | ) | 11,167 | (2,425 | ) | 66,624 | (4,843 | ) | ||||||||||||
| Collateralized mortgage obligations |
30,116 | (136 | ) | 10,313 | (1,655 | ) | 40,429 | (1,791 | ) | ||||||||||||
| Asset-backed securities |
— | — | 1,271 | (692 | ) | 1,271 | (692 | ) | |||||||||||||
| Total |
$ | 226,586 | $ | (3,643 | ) | $ | 22,751 | $ | (4,772 | ) | $ | 249,337 | $ | (8,415 | ) | ||||||
The $7.7 million and $8.4 million of unrealized losses for the AFS portfolio as of March 31, 2010 and December 31, 2009, respectively, are mostly a result of market interest rate fluctuations. The fair value is based on current market prices obtained from independent sources for each security held. The issuers of these securities have not, to the Company’s knowledge, established any cause for default on these securities and the most recent ratings on all securities are investment grade except for one Asset Backed Security (“ABS”). This ABS security has a fair value of $1.5 million held in the AFS portfolio. This security has some sub-prime home equity loans as the underlying collateral. This ABS currently has a rating by Moody’s Investor Services (“Moody’s”) of Baa1. This security has a fair value as of March 31, 2010 of $1.5 million.
Management has determined that the securities which are in an unrealized loss position do not have a credit loss component that would require an impairment to be recognized. Management does not intend to sell any of the securities in a loss position nor are there any securities in a loss position that would require Management to sell them at March 31, 2010. As such, Management does not believe that there are any securities that are other-than-temporarily impaired as of March 31, 2010.
Trading Securities
At March 31, 2010, the Company held $5.3 million of trading securities compared to $5.4 million at December 31, 2009. Trading securities are recorded at fair value. This decrease was from the principal repayments from the mortgage-backed securities (“MBS”) held in the trading portfolio. The unrealized gain or loss associated with these trading securities that was recorded for the three months ended March 31, 2010 was an unrealized loss of $9,000 and for the three months ended March 31, 2009 there was an unrealized gain of $2.4 million.
16
Table of Contents
Securities by Maturity
The following table provides a summary of the scheduled maturity of the securities held by the Company at March 31, 2010 and December 31, 2009.
| March 31, 2010 | December 31, 2009 | |||||||||||
| Amortized Cost |
Estimated Fair Value |
Amortized Cost |
Estimated Fair Value | |||||||||
| (in thousands) | ||||||||||||
| Trading Securities: |
||||||||||||
| In one year or less |
$ | — | $ | — | $ | 868 | $ | 868 | ||||
| After one year through five years |
— | — | — | — | ||||||||
| After five years through ten years |
3,056 | 3,056 | — | — | ||||||||
| After ten years |
2,230 | 2,230 | 4,535 | 4,535 | ||||||||
| Total trading securities |
5,286 | 5,286 | 5,403 | 5,403 | ||||||||
| Available-for-sale: |
||||||||||||
| In one year or less |
158,691 | 157,912 | 159,001 | 158,138 | ||||||||
| After one year through five years |
489,261 | 502,718 | 657,564 | 672,384 | ||||||||
| After five years through ten years |
113,715 | 117,701 | 141,421 | 146,178 | ||||||||
| After ten years |
167,333 | 166,208 | 177,470 | 176,987 | ||||||||
| Total available-for-sale securities |
929,000 | 944,539 | 1,135,456 | 1,153,687 | ||||||||
| Total Securities |
$ | 934,286 | $ | 949,825 | $ | 1,140,859 | $ | 1,159,090 | ||||
Interest Income
Interest income for trading and AFS securities was $8.4 million and $13.7 million for the three month periods ended March 31, 2010 and 2009, respectively. Interest income from securities classified as taxable for the comparable three month periods ended March 31, 2010 and 2009 was $5.4 million and $10.0 million for the comparable periods and from securities classified as non-taxable was $3.0 million and $3.7 million.
Securities Pledged
Securities with a carrying value of approximately $671.9 million and $719.1 million at March 31, 2010 and December 31, 2009, respectively, were pledged to secure public funds, trust deposits, repurchase agreements and other borrowings as required or permitted by law.
Investment in Federal Home Loan Bank and Federal Reserve Bank Stock
The Company’s investment in stock of the Federal Home Loan Bank of San Francisco (“FHLB”) amounted to $72.9 million at March 31, 2010 and December 31, 2009. The Company’s investment in stock of the FRB amounted to $10.6 million at March 31, 2010 and December 31, 2009. The investment of FHLB and FRB stock is included in other assets of the Company’s Consolidated Balance Sheets.
FHLB did not pay dividends in three of the last six quarters. During the first quarter of 2010, the Bank received a small dividend and in April 2010, the FHLB has announced they will continue to pay a small dividend on their stock. In April 2010, the FHLB announced that they will begin to repurchase excess capital stock on May 14, 2010. Management will continue to monitor the affairs of the FHLB and evaluate its investment in this stock. The FHLB is rated AAA by Moody’s and Standard and Poor’s (“S&P”) as of March 31, 2010. No impairment has been recognized for this investment.
4. LOANS
Loans Held for Sale
At March 31, 2010, the Company had $26.6 million of loans held for sale compared to $19.2 million at December 31, 2009. At March 31, 2010, the loans held for sale consisted of $10.1 million of commercial real estate loans, $9.8 million of residential real estate loans, $3.9 million of SBA loans and $2.8 million of commercial loans. At December 31, 2009, the loans held for sale consisted of $13.4 million of residential real estate loans, $4.3 million of SBA loans and $1.5 million of commercial real estate loans.
17
Table of Contents
The composition of the Company’s loans held for investment portfolio is as follows:
| March 31, 2010 |
December 31, 2009 | |||||
| (in thousands) | ||||||
| Real estate: |
||||||
| Residential—1 to 4 family |
$ | 925,564 | $ | 971,725 | ||
| Multi-family residential |
274,786 | 275,069 | ||||
| Commercial |
1,874,139 | 1,933,533 | ||||
| Construction |
363,477 | 397,281 | ||||
| Commercial loans |
861,301 | 977,401 | ||||
| Home equity loans |
440,202 | 448,026 | ||||
| Consumer loans |
145,719 | 161,698 | ||||
| Other |
1,950 | 1,698 | ||||
| Total loans |
4,887,138 | 5,166,431 | ||||
| Allowance for loan losses |
283,412 | 272,852 | ||||
| Net loans |
$ | 4,603,726 | $ | 4,893,579 | ||
Total loans are net of deferred loan origination, commitment and extension fees and origination costs of $5.0 million as of March 31, 2010 and $5.6 million as of December 31, 2009.
Impaired Loans
The following table reflects recorded investment in impaired loans:
| March 31, 2010 |
December 31, 2009 |
|||||||
| (in thousands) | ||||||||
| Impaired loans with specific valuation allowance |
$ | 20,530 | $ | 84,616 | ||||
| Valuation allowance related to impaired loans |
(4,404 | ) | (17,544 | ) | ||||
| Impaired loans without specific valuation allowance |
303,848 | 210,115 | ||||||
| Impaired loans, net |
$ | 319,974 | $ | 277,187 | ||||
Impaired loans were $320.0 million, an increase of $42.8 million when comparing the balance at March 31, 2010 to December 31, 2009. The increase in impaired loans is primarily attributed to the increase in impaired residential real estate loans and commercial loans. At March 31, 2010 and December 31, 2009, residential real estate impaired loans were $38.0 million and $20.0 million, respectively, an increase of $18.0 million. Impaired commercial loans were $56.7 million at March 31, 2010 and $47.7 million at December 31, 2009, an increase of $9.0 million. The increase in impaired loans is due to the continued decline of economic conditions which has caused collateral values to decline.
A valuation allowance is established for an impaired loan when the fair value of the loan is less than the recorded investment. In certain cases, portions of impaired loans are charged-off to realizable value instead of holding a valuation allowance. These loans are included along with others for which the collateral value is greater than the outstanding balance in the table above as “Impaired loans without specific valuation allowance”. The valuation allowance disclosed above is included in the allowance for loan losses reported in the balance sheets as of March 31, 2010 and December 31, 2009.
18
Table of Contents
The table below reflects the average balance and interest recognized for impaired loans for the three month periods ended March 31, 2010 and 2009.
| Three-Months Ended March 31, | ||||||
| 2010 | 2009 | |||||
| (in thousands) | ||||||
| Average investment in impaired loans for the period |
$ | 309,804 | $ | 185,668 | ||
| Interest recognized during the period for impaired loans |
$ | 6,570 | $ | 4,283 | ||
Loan Sales and Transactions
During the first quarter of 2010, the Company sold commercial loans, residential real estate loans and commercial real estate loans. A detailed discussion regarding these transactions are in Note 5, “Loan Sales and Transactions” of these Consolidated Financial Statements.
Pledged Loans
At March 31, 2010 and December 31, 2009, loans secured by first trust deeds on residential and commercial real estate property with principal balances totaling $823.9 million and $891.3 million, respectively, were pledged as collateral to the FRB; and $2.35 billion and $2.48 billion, respectively, were pledged to the FHLB. The amount of loans pledged does not represent the amount of outstanding borrowings at the FRB or the FHLB. The Company pledges loans as collateral for the Company’s borrowings in accordance with the Company’s agreements with the FRB and the FHLB.
As a result of adopting the new accounting standard for the transfer of financial assets on January 1, 2010, $2.7 million of SBA loans were pledged at March 31, 2010.
Letters and Lines of Credit
The following table represents the contractual commitments for lines and letters of credit by maturity at March 31, 2010:
| March 31, 2010 | |||||||||||||||
| Total | Less than one year |
One to three years |
Three to five years |
More than five years | |||||||||||
| (in thousands) | |||||||||||||||
| Unfunded commitments |
$ | 866,731 | $ | 320,128 | $ | 116,170 | $ | 97,615 | $ | 332,818 | |||||
| Standby letters of credit and financial guarantees |
94,293 | 36,630 | 35,308 | 12,151 | 10,204 | ||||||||||
| Total |
$ | 961,024 | $ | 356,758 | $ | 151,478 | $ | 109,766 | $ | 343,022 | |||||
Fees collected for letters of credit are recognized as income ratably over the term of the facility. The Company has recorded a $275,000 liability associated with the unearned portion of the letter of credit fees for these guarantees as of March 31, 2010 compared to $295,000 at December 31, 2009.
Included in unfunded loan commitments are secured and unsecured lines of credit and loans. Letters and lines of credit are commitments to extend credit and standby letters of credit for the Bank’s customers. These commitments meet the financing needs of the Bank’s customers in the normal course of business and are commitments with “off-balance sheet” risk since the Bank has committed to issuing funds to or on behalf of customers.
The Company has exposure to credit losses from unfunded loan commitments and letters of credit. Since the funds have not been disbursed on these commitments, they are not reported as loans outstanding. Estimated loan losses related to these commitments are not included in the allowance for loan losses reported in Note 6, “Allowance for Loan Losses” of these Consolidated Financial Statements instead, they are accounted for as a separate loss contingency or reserve as a liability within other liabilities on the Company’s Balance Sheets. The reserve for the unfunded loan commitments and letters of credit was $18.1 million at March 31, 2010. Changes to this liability are adjusted through other non-interest expense and are disclosed in the table below as “Additions, net.” The increase in the reserve for off balance sheet reserve for the comparable periods is explained in Note 12, “Other Expense” of these Consolidated Financial Statements.
19
Table of Contents
The table below summarizes the activity for the reserve for off balance sheet commitments:
| Three-Months Ended March 31, | ||||||
| 2010 | 2009 | |||||
| (in thousands) | ||||||
| Beginning balance |
$ | 16,259 | $ | 8,014 | ||
| Additions, net |
1,813 | 573 | ||||
| Balance |
$ | 18,072 | $ | 8,587 | ||
5. LOAN SALES AND TRANSACTIONS
During the three months ended March 31, 2010, the Company sold commercial loans, residential real estate loans, commercial real estate loans and construction loans. A majority of the loans held by the Bank are in the CCB segment. All of the loans sold during the periods presented are from the CCB segment. A summary of the activity is discussed below.
Residential Real Estate Loans
For the three months ended March 31, 2010, and 2009, the Company sold $50.7 million and $44.3 million for a net gain on sale of $515,000 and $564,000, respectively. Of the $50.7 million and $44.3 million sold during the three month period ended March 31, 2010 and 2009, $36.3 million and $43.1 million were loans originated for sale and $14.4 million and $1.2 million were sold from the loans held for investment portfolio, respectively. The residential loans sold during the three months ended March 31, 2010 and 2009 sold with servicing rights retained were $12.2 million and $8.2 million, respectively and servicing rights of $130,000 and $79,000, respectively, were recorded.
Commercial Loans
During the three months ended March 31, 2010, we identified and sold $17.1 million of commercial loans for a net gain on sale of $3.5 million. These loans were sold with servicing released.
Commercial Real Estate and Construction Loans
In the three month period ended March 31, 2010, the Company sold $2.0 million of commercial real estate and construction loans and recognized a gain on sale of $131,000. These loans sold were sold with servicing released.
Prospective SBA Loan Sales
During the three months ended March 31, 2010, we sold $2.7 million of SBA loans but, due to the new accounting standard adopted for the transfer of financial assets on January 1, 2010, the sale of these loans will not be recognized until 90 days after the date of sale. The loans sold are reported in loans held for sale with an offsetting liability reported as a secured borrowing. The gain on the sale of the SBA loans of $305,000 will not be recognized until 90 days after the date of the sale. SBA loans have a government-guaranteed portion, and it is this portion that the Company sells into the secondary market, on a servicing retained basis. If the transfer of the guaranteed portion of an SBA loan results in a premium, the “seller” is obligated by the SBA to refund the premium to the “purchaser” if the loan is repaid within 90 days of the transfer. Due to these conditions, we are precluded from recognizing this gain until 90 days after the sale.
At the date of the filing of this Form 10-Q, Management did not identify for sale any specific loans in the Company’s held for investment portfolio.
20
Table of Contents
6. ALLOWANCE FOR LOAN LOSSES
The following summarizes the changes in the allowance for loan losses (“ALL”):
| Three-Months Ended March 31, |
||||||||
| 2010 | 2009 | |||||||
| (in thousands) | ||||||||
| Balance, beginning of period - continuing operations |
$ | 272,852 | $ | 140,908 | ||||
| Loans charged off |
(85,831 | ) | (76,075 | ) | ||||
| Recoveries on loans previously charged-off |
1,569 | 2,636 | ||||||
| Net charge-offs |
(84,262 | ) | (73,439 | ) | ||||
| Provision for loan losses |
99,865 | 73,516 | ||||||
| Adjustments from loan sales |
(5,043 | ) | — | |||||
| Balance, end of period - continuing operations |
$ | 283,412 | $ | 140,985 | ||||
The allowance for loan losses was $283.4 million at March 31, 2010, an increase of $142.4 million compared with the balance at March 31, 2009. The increase to the allowance for loan losses was directionally consistent with the recent elevated credit losses and net charge-offs experienced by the Company. In the second quarter of 2009, in recognition of the continued elevated credit losses and the continued deterioration of the general economic environment, the Company shortened the timeframe utilized for estimating the historical loss rates utilized for estimating inherent credit losses. The shortened timeframe placed more weight on the recent history of increased losses during 2009 and in the current quarter of 2010, which resulted in a substantial increase in the allowance over the prior year.
7. DEFERRED TAX ASSET AND TAX PROVISION
The Company recognizes deferred tax assets and liabilities for the future tax consequences related to differences between the financial statement carrying amounts of existing assets and liabilities and their respective tax bases, and for tax credits. When realization of deferred tax assets is questionable due to the uncertainty of future taxable income, the Company is required to establish a valuation allowance that offsets all or a portion of the deferred tax asset.
In the first quarter of 2009, the Company was able to recognize a tax benefit of $32.4 million because, at that time, we thought we would be able to release the tax benefit through a carry forward and/or a carry back of losses. In the second quarter of 2009, following a large net loss for the quarter and the uncertainty of future taxable income, the Company determined that the only tax benefits that were assured of realization were those that could be carried back against the income taxes paid for prior years. Consequently, at June 30, 2009, a valuation allowance of $114 million was established offsetting most of the net deferred tax asset. The Company recognized a tax receivable of $55.2 million for the amount that it estimated could be carried back which was not offset by the valuation allowance. At March 31, 2010, the Company’s net deferred tax asset had a full valuation allowance and a tax receivable of $56.0 million. The tax receivable is included in other assets.
For the three months ended March 31, 2010, the Company recorded $49,000 of tax expense on a pretax loss of $87.3 million. The $49,000 of tax expense is comprised of required tax payments to state tax authorities. At March 31, 2010, all of the available carry backs have been recognized.
8. DISCONTINUED OPERATIONS – RAL AND RT PROGRAMS
On January 14, 2010, the Company entered into an agreement with Santa Barbara Tax Products Group, LLC (“SBTPG”), whereby SBTPG agreed to purchase the assets of the RAL and RT Programs segment for $10.0 million. The agreement provided for, and the Company received, a payment of $5.0 million at closing and an additional $5.0 million on March 15, 2010. The agreement further stipulated that SBTPG would make an additional cash payment based on the number of RALs processed by SBTPG between January 1, 2010 and April 30, 2010. SBTPG was not able to process RALs during this period and, therefore no further payments are anticipated for the sale of the RAL and RT Programs.
21
Table of Contents
Due to the short period of time between when the agreement was signed and the purchase was finalized there was not enough time for SBTPG to set-up the operations required to process the RT checks and Automated Clearing House (“ACH”) transactions. Therefore, as part of the agreement to sell the RAL and RT Programs, the Company also entered into a transition agreement whereby the Company would process the RT activity for SBTPG for the 2010 tax season. The transition agreement also required the Company to process the invoices for the RAL and RT Programs through April 30, 2010 and retain the employees associated with the RAL and RT Programs through March 31, 2010. All funds expended for the processing of invoices and employee related costs were reimbursed by SBTPG starting on January 15, 2010. There are other minimal obligations to provide support to SBTPG through the remainder of 2010.
The Company sold the RAL and RT Program segment due to recent changes in the regulatory and legislative environments which had significantly altered the Bank’s ability to offer RALs for the 2010 tax season and the value of the segment.
At December 31, 2009, the RAL and RT Programs were reported as part of the Company’s continuing operations since the agreement was not signed until January 14, 2010. Beginning March 31, 2010, the Company reported the RAL and RT Programs as discontinued operations and all prior periods have been restated to reflect the operations from the RAL and RT Programs as discontinued operations throughout the Consolidated Financial Statements and the accompanying notes.
A summary of the items related to the gain on sale of the RAL and RT Programs is as follows:
| (in thousands) | |||
| Proceeds received from purchaser: |
$ | 10,000 | |
| Assets sold: |
|||
| Leasehold improvements |
678 | ||
| Furniture, fixtures & equipment |
1,399 | ||
| Prepaid assets |
2,110 | ||
| Total assets sold |
4,187 | ||
| Liabilities sold: |
|||
| Accrued expenses |
2,321 | ||
| Deferred rent |
164 | ||
| Total liabilities sold |
2,485 | ||
| Net assets sold: |
1,702 | ||
| Expenses incurred as part of the sale |
138 | ||
| Gain on sale |
$ | 8,160 | |
22
Table of Contents
A summary of the assets and liabilities reclassified to discontinued operations in the Company’s Consolidated Balance Sheets is as follows:
| March 31, 2010 | December 31, 2009 | |||||
| (in thousands) | ||||||
| Assets: |
||||||
| Cash and due from banks |
$ | 185,812 | $ | 71,106 | ||
| Prepaid assets |
— | 2,075 | ||||
| Furniture, fixtures & equipment |
— | 1,399 | ||||
| Leasehold improvements |
— | 678 | ||||
| Total assets |
$ | 185,812 | $ | 75,258 | ||
| Liabilities: |
||||||
| Non-interest bearing demand accounts |
$ | 185,812 | $ | 72,375 | ||
| Accrued expenses |
— | 2,834 | ||||
| Accrued interest |
— | 49 | ||||
| Total liabilities |
$ | 185,812 | $ | 75,258 | ||
The non-interest bearing demand accounts within the above liabilities consist of checks issued that have not cleared. An equal amount of cash has been shown as held for these checks. In the case of the amount for December 31, 2009, the checks were issued in 2009 and prior years. The increase in the amount from December 31, 2009 to March 31, 2010 arises from RT checks issued in 2010 net of any checks from 2009 and earlier years that cleared during the first quarter of 2010. Some portion of the amount at March 31, 2010 will clear during the remainder of 2010, but a substantial amount will need to be escheated over the next several years according to the various state laws governing unclaimed property.
23
Table of Contents
A summary of the items reclassified to discontinued operations in the Company’s Statement of Operations is as follows:
| Three-Months Ended March 31, | ||||||
| 2010 | 2009 | |||||
| (in thousands) | ||||||
| Interest income: |
||||||
| Loans |
$ | — | $ | 147,942 | ||
| Other |
— | 754 | ||||
| Total interest income |
— | 148,696 | ||||
| Interest expense: |
||||||
| Deposits |
— | 8,170 | ||||
| Securities sold under agreements to repurchase and Federal funds purchased |
— | 8 | ||||
| Long-term debt and other borrowings |
— | 207 | ||||
| Total interest expense |
— | 8,385 | ||||
| Net interest income: |
— | 140,311 | ||||
| Provision for loan losses |
— | 82,208 | ||||
| Net interest income after provision for loan losses |
— | 58,103 | ||||
| Non-interest income: |
||||||
| Gain on sale of discontinued operations |
8,160 | — | ||||
| Refund transfer fees |
— | 58,465 | ||||
| Service charges and fees |
90 | 2,032 | ||||
| Other |
— | — | ||||
| Total non-interest income |
8,250 | 60,497 | ||||
| Non-interest expense: |
||||||
| Salaries and employee benefits |
783 | 6,428 | ||||
| Occupancy expense, net |
32 | 321 | ||||
| Refund program fees |
— | 46,925 | ||||
| Other |
506 | 9,730 | ||||
| Total non-interest expense |
1,321 | 63,404 | ||||
| Income before provision for income taxes |
6,929 | 55,196 | ||||
| Provision for income taxes |
— | 23,126 | ||||
| Net income from discontinued operations |
$ | 6,929 | $ | 32,070 | ||
The income and expenses incurred for the three months ended March 31, 2010 are reflected in the income statement above and are the income and expenses incurred during the first 14 days of the year. All expenses incurred after January 14, 2010 were reimbursed by SBTPG. The reimbursements from SBTPG were recorded as a reduction of expense.
24
Table of Contents
9. LONG-TERM DEBT AND OTHER BORROWINGS
The following table is a summary of long-term debt and other borrowings:
| March 31, 2010 |
December 31, 2009 | |||||
| (in thousands) | ||||||
| Other short-term borrowings: |
||||||
| Amounts due to the Federal Reserve Bank |
$ | 4,874 | $ | 6,484 | ||
| Federal Home Loan Bank advances |
— | 20,000 | ||||
| Total short-term borrowings |
4,874 | 26,484 | ||||
| Long-term debt: |
||||||
| Federal Home Loan Bank advances |
863,462 | 1,079,493 | ||||
| Subordinated debt issued by the Bank |
121,000 | 121,000 | ||||
| Subordinated debt issued by the Company |
69,426 | 69,426 | ||||
| Total long-term debt |
1,053,888 | 1,269,919 | ||||
| Total long-term debt and other short-term borrowings |
1,058,762 | 1,296,403 | ||||
| Obligations under capital lease |
15,505 | 15,425 | ||||
| Secured borrowings - SBA loan sales |
2,684 | — | ||||
| Total long-term debt and other borrowings |
$ | 1,076,951 | $ | 1,311,828 | ||
Long-term debt and other borrowings were $1.08 billion at March 31, 2010, a decrease of $234.9 million since December 31, 2009. This decrease is from the repayment of long-term, high interest FHLB advances of $236.0 million. In order to repay these advances prior to their maturity, an $864,000 prepayment penalty was paid. The penalty incurred for the early repayment is included within other non-interest expense.
Other Short-Term Borrowings
For the three months ended March 31, 2010 interest expense on short-term borrowings was $5,000 at a weighted average rate of 0.16%. At March 31, 2009, there were no short-term borrowings or expense incurred during the three months ended March 31, 2009.
Secured Borrowings - SBA Loan Sales
As disclosed in Note 1, “Summary of Significant Accounting Policies” of these Consolidated Financial Statements, the Company adopted a new accounting standard at January 1, 2010 for the sale and transfers of financial assets which impacts the accounting for the sale of SBA loans. At March 31, 2010, the secured borrowing for the SBA loan sales was $2.7 million. For each SBA loan sold, the Company can not recognize the transaction as a sale until 90 days after the sale has occurred. During this 90 day period, the Company is required to account for the sale by setting up a liability as a secured borrowing until the sale can be recognized.
10. POSTRETIREMENT BENEFITS
As disclosed in the 2009 Form 10-K, the Company’s Compensation Committee of the Board of Directors approved the reduction in the Company’s contributions towards retiree health insurance benefits effective March 1, 2010. Specifically, the Company discontinued the Company’s contributions for retirees eligible for health insurance through Medicare, eliminated its contribution for the retiree health insurance for future retirees, and has limited its contribution to 50% of the cost of health insurance premiums for retirees not yet eligible for Medicare. These decisions combined with a reduction of the number of current employees reduced the net present value of the Company’s accumulated postretirement benefit obligation (“APBO”) for future benefits by $24.9 million at December 31, 2009. As part of the reduction in postretirement benefits, $21.5 million of the APBO remained in the Company’s other comprehensive income (“OCI”) which will be recognized in income over the next five years. The recognition into the income statement from OCI is captured in the table below.
25
Table of Contents
The following table summarizes the (income) expense recognized for postretirement benefits:
| Three-Months Ended March 31, |
||||||||
| 2010 | 2009 | |||||||
| (in thousands) | ||||||||
| Service cost |
$ | — | $ | 352 | ||||
| Interest cost |
31 | 358 | ||||||
| Expected return on plan assets |
(228 | ) | (167 | ) | ||||
| Recognition of loss on plan assets |
587 | 307 | ||||||
| Prior service cost |
(1,212 | ) | (161 | ) | ||||
| Total |
$ | (822 | ) | $ | 689 | |||
At the end of each year, the Company contracts with a third party to estimate the amount of the Company’s required liability for postretirement benefits and to forecast the postretirement benefit expense (income) for the following year. Due to the reduction in benefits, the Company has an asset for the overfunded postretirement plan. At March 31, 2010 and December 31, 2009, the asset for the postretirement benefits is $11.4 million and $11.1 million, respectively.
For a more detailed explanation of these benefits see Note 15, “Postretirement Benefits” of the Consolidated Financial Statements in the 2009 Form 10-K.
11. OTHER INCOME
The following table summarizes the significant items that are included in the other income line item of the income statement:
| Three-Months Ended March 31, |
||||||||
| 2010 | 2009 | |||||||
| (in thousands) | ||||||||
| Other Income: |
||||||||
| Gain on loan sales |
$ | 3,955 | $ | 542 | ||||
| Swap market value adjustment |
(897 | ) | 127 | |||||
| LIHTCP losses |
(950 | ) | (884 | ) | ||||
| Other |
1,811 | 2,174 | ||||||
| Total |
$ | 3,919 | $ | 1,959 | ||||
The increase in other income for the three month period ended March 31, 2010 compared to 2009 was mostly attributable to an increase in gain on loan sales. This increase was primarily from the sale of two nonperforming commercial loans which had a gain on sale of $3.5 million. This increase was reduced by the loss taken to recognize the negative market value of an interest rate swap the Bank entered into with another financial institution to match a swap the Bank had with a customer. The customer defaulted on the swap payments to the Bank causing the swap with the other institution to be unmatched. The unmatched condition requires that the market value of the swap with the third party to be recognized as a liability with the offsetting entry required to be reported as a loss on the income statement.
26
Table of Contents
12. OTHER EXPENSE
The following table summarizes the significant items that are included in the other expense line item of the income statement:
| Three-Months Ended March 31, |
||||||||
| 2010 | 2009 | |||||||
| (in thousands) | ||||||||
| Other Expense: |
||||||||
| Professional services |
$ | 4,072 | $ | 5,159 | ||||
| Regulatory assessments |
3,838 | 1,641 | ||||||
| Software expense |
3,475 | 4,193 | ||||||
| Customer deposit service and support |
1,911 | 1,958 | ||||||
| Reserve for off balance sheet commitments |
1,813 | 573 | ||||||
| Operating lease impairment |
1,301 | — | ||||||
| Furniture, fixtures and equipment, net |
1,287 | 2,417 | ||||||
| Supplies and postage |
1,115 | 1,352 | ||||||
| Telephone and data |
1,093 | 1,083 | ||||||
| Other real estate owned expense |
1,052 | 1,143 | ||||||
| FHLB advance prepayment penalties |
864 | — | ||||||
| Credit risk swap market value adjustment |
(863 | ) | (7 | ) | ||||
| Other |
2,481 | 4,068 | ||||||
| Total |
$ | 23,439 | $ | 23,580 | ||||
Other expenses for the three months ended March 31, 2010, decreased $141,000 compared with the same period a year earlier. This decrease is mostly attributable to the Company’s efforts to reduce operating expenses. This decrease was offset by increased regulatory assessments for Federal Deposit Insurance Corporation (“FDIC”) insurance premiums, reserve for off balance sheet commitments and operating lease impairments.
The increase in regulatory assessments of $2.2 million for the three month period ended March 31, 2010 compared to March 31, 2009 are from increased assessment rates for FDIC insurance premiums due to an increase in bank failures over the last year and a half.
The increase in the reserve for off balance sheet commitments from $573,000 for the three month period ended March 31, 2009 compared to $1.8 million for the same period a year later is due to increased losses in the loan portfolio. The reserve for off balance sheet commitments uses the same historical loss rates and qualitative factors as the allowance for loan loss methodology. Due to the recent elevated losses in the loan portfolio, our estimate of the inherent losses has increased requiring additional expense to be incurred to maintain the estimated reserve for off balance sheet commitments such as letter of credits and unused line of credits.
The Company has a separate reserve for the interest rate swaps it enters into with customers. The reserve is needed because while the interest rate risk from these swaps are generally managed by covering them with an offsetting interest rate swap with another financial institution, there is still credit risk should the customer default. As long as both components of the matching swaps are in place, there is no balance sheet or income impact from changes in the value of the swap. When, as discussed in Note 11, “Other Income” of these Consolidated Financial Statements above, a customer defaults, the customer swap will be written-off against this reserve and the offsetting entry will be an income statement adjustment to the swap market value.
In an effort to reduce expenses, the Company has been consolidating its premises and attempting to sublease the facilities for which we are unable to terminate the lease. Due to the current commercial real estate market having a surplus of commercial properties for rent, Management has found that in order to sublease certain properties, we need to market the subleases at rates lower than we are currently paying. The difference between our current lease rate and the expected sublease rate requires the recognition of an accrual for a disposal or exit of the leased premises. During the three months ended March 31, 2010, an analysis was prepared for all of the locations which are being marketed for sublease and a $1.3 million obligation was recognized. A quarterly review of leased premises will be prepared to determine if additional loss has occurred that requires recognition.
27
Table of Contents
13. COMMITMENTS AND CONTINGENCIES
Leasing of Premises
The Company leases the majority of its locations. Substantially all of these leases contain multiple renewal options and provisions for increases to lease payments. As of March 31, 2010, the minimum obligations under non-cancelable leases for the next five years and thereafter are shown in the table below. These amounts are not adjusted for the contractual obligations of sub-tenants owed to the Company. Sub-tenants’ lease obligations to the Company were approximately $1.7 million at March 31, 2010. Approximately 78% of these payments are due to the Company over the next three years.
The following table summarizes the contractual lease obligations at March 31, 2010:
| March 31, 2010 | ||||||||||||||||||
| Less than one year |
One to three years |
Three to five years |
More than five years |
Total | December 31, 2009 | |||||||||||||
| (in thousands) | ||||||||||||||||||
| Non-cancelable leases |
$ | 11,788 | $ | 19,939 | $ | 13,771 | $ | 28,009 | $ | 73,507 | $ | 76,961 | ||||||
| Capital leases |
748 | 1,611 | 1,946 | 38,820 | 43,125 | 43,311 | ||||||||||||
| Total |
$ | 12,536 | $ | 21,550 | $ | 15,717 | $ | 66,829 | $ | 116,632 | $ | 120,272 | ||||||
Legal Matters Update
| 1. | On September 4, 2009, an alleged shareholder of the Company filed a purported shareholder action in federal district court in Los Angeles, against the Company and all of its directors, captioned Laurence Paskowitz SEP IRA v. Pacific Capital Bancorp, et al. (United States District Court, Central District of California, Case No. CV 09-6449-ODW). The complaint alleged that the Company’s August 31, 2009 Proxy Statement, with respect to the proposal for shareholder authorization of a reverse stock split, contained certain allegedly false and misleading statements and omissions regarding certain alleged risks of the reverse stock split. The complaint asserted claims for injunctive and declaratory relief based on alleged proxy violations under the federal securities laws (Section 14(a) of the Securities Exchange Act and Rule 14a-9 there under) and under unspecified California law. The complaint also asserted a purported class action claim, on behalf of a putative class of shareholders of the Company, for monetary damages based on alleged breach of an alleged fiduciary duty of full disclosure under California law. |
On September 9, 2009, plaintiff filed an ex parte application seeking a temporary restraining order, as well as an expedited hearing on a preliminary injunction motion, to prevent the Company from conducting the planned shareholder vote on the reverse stock split proposal set for September 29, 2009. On September 11, 2009, the defendants filed an opposition to the ex parte application. On September 14, 2009 the Court denied plaintiff’s application in its entirety. The scheduled shareholder vote took place on September 29, 2009, and the reverse stock split proposal was approved.
On October 8, 2009, the defendants filed a motion to dismiss the complaint in its entirety with prejudice and without leave to amend. On October 19, 2009, plaintiff filed opposition papers, and on October 26, 2009, defendants filed reply papers. On November 6, 2009, the Court granted the Company’s motion to dismiss with leave to amend. The plaintiff declined to amend the complaint. On December 6, 2009, the Court ordered Judgment be entered dismissing the complaint with prejudice. On December 31, 2009, plaintiff filed a Notice of Appeal. The Company believes that the complaint and the claims asserted therein are without merit, and is vigorously defending itself in this matter.
| 2. | On September 8, 2009, the Company along with two of its officers were sued in a purported securities class action entitled William Jurkowitz v. Pacific Capital Bancorp, George Leis, David Porter, Sandler O’Neill & Partners LP and Sandler O’Neill Asset Management LLC, CV 09-06501 RGK (PLAx) in the United States District Court for the Central District of California. The complaint alleges violations of Sections 10(b) and 20(a) of the 1934 Exchange Act, as well as Rule 10b-5 promulgated thereunder, for a purported class period running from April 30, 2009 when the Company announced results for the first quarter of 2009, to July 30, 2009 when the Company announced results for the second quarter of 2009. The complaint alleges that the Company and the officer defendants made knowingly false statements of confidence regarding the adequacy of loan loss reserves taken in the first quarter of 2009, which plaintiffs contend were proven to be false when the Company announced second quarter results, which included an additional $117 million reserve. On October 30, 2009, the Company filed a motion to dismiss the Jurkowitz complaint. On January 28, 2010, the Court granted the Company’s motion to dismiss and denied, as moot, the |
| Plaintiff’s Motion for Appointment as Lead Counsel. The Court entered judgment dismissing the consolidated actions |
28
Table of Contents
| of Jurkowitz and Shotke (see item 3 below) on April 7, 2010. Plaintiff has until May 10, 2010, to appeal from that judgment. The Company believes that the claims asserted in the consolidated actions are without merit, and will vigorously defend itself in the event an appeal is filed. |
| 3. | The same plaintiff firms suing the Company and its officers in the Jurkowitz action subsequently filed a virtually identical lawsuit entitled Shotke v. Pacific Capital Bancorp, George Leis, David Porter, & Sandler O’Neill Partners LP, CV 09-7400 (MAN) in the same U.S. District court. On December 18, 2009, the Company filed a motion to dismiss on the same grounds as its motion to dismiss in the Jurkowitz case. On February 22, 2010, the Court granted the Company’s motion to dismiss. As discussed in item 2 above, plaintiff has until May 10, 2010 to file an appeal. |
| 4. | On October 29, 2009, a shareholder derivative suit was filed by James Clem on behalf of Pacific Capital Bancorp against CEO George Leis, Chief Financial Officer (“CFO”) Stephen Masterson, Chief Credit Officer (“CCO”) David Porter, all members of the Board of Directors of the Company and Sandler O’Neill Partners L.P. and against the Company as a nominal defendant. The lawsuit is entitled James Clem v. George S. Leis, et al. The complaint was filed in the Superior Court in Santa Barbara, Case No. CIVRS1340306. The complaint alleges breach of fiduciary duty, waste of corporate assets and unjust enrichment by the defendants. It includes allegations regarding misrepresentations concerning loan losses and allowance which are identical to those in the Jurkowitz case. The alleged damages are the costs which the Company will incur in settling or paying an adverse judgment in Jurkowitz. Essentially, for the plaintiff to prevail, the Company must have an adverse result in Jurkowitz/Shotke. |
On November 30, 2009, Marianne Monty filed a similar shareholder derivative suit against the same defendants except CCO David Porter who was not included. The lawsuit is entitled Marianne Monty v. George S. Leis, et al. This complaint was also filed in the Superior Court in Santa Barbara, Case No. CIVRS1340825. On January 5, 2010, the Court entered an order consolidating this case and the Clem case. On January 28, 2010, the Company filed a Motion to Stay the proceedings pending a final determination in the underlying federal court actions (Jurkowitz and Shotke) . Pursuant to a stipulation of the parties, the Motion to Stay was taken off calendar by order of the Court pending the Court’s ruling on motions for lead plaintiff’s counsel and lead plaintiff. The Court subsequently appointed Ms. Monty as lead plaintiff. In response to plaintiff’s statutory shareholder’s inspection demand, the Company filled a new motion to stay discovery, which motion will be heard on May 13, 2010. Plaintiff filed a motion to compel the Company to produce documents under her inspection demand, which motion will be heard on May 20, 2010.
The Company is involved in various lawsuits of a routine nature that are being handled and defended in the ordinary course of the Company’s business. Expenses are being incurred in connection with defending the Company, but in the opinion of Management, based in part on consultation with legal counsel, the resolution of these lawsuits will not have a material impact on the Company’s financial position, results of operations, or cash flows.
14. FAIR VALUE OF FINANCIAL INSTRUMENTS
The Company uses fair value measurements to record fair value adjustments to certain assets and liabilities. AFS and trading securities are recorded at fair value on a recurring basis. Additionally, the Company may be required to record other assets and liabilities at fair value on a non-recurring basis. These non-recurring fair value adjustments involve the lower of cost or market accounting and write downs resulting from impairment of assets. For these purposes, fair value is defined as the amount at which an asset (or liability) could be bought (or incurred) or sold (or settled) in a current transaction between willing parties, that is, other than in a forced or liquidation sale.
The accounting guidance for fair value establishes a framework for measuring fair value and establishes a three-level valuation hierarchy for disclosure of fair value measurement. The valuation hierarchy is based upon the transparency of inputs to the valuation of an asset or liability as of the measurement date. The three levels are defined as follows:
| Level 1: |
Observable quoted prices in active markets for identical assets and liabilities. | |
| Level 2: |
Observable quoted prices for similar assets and liabilities in active markets, quoted prices for identical or similar instruments in markets that are not active, and model-based valuation techniques for which all significant assumptions are observable in the market. | |
| Level 3: |
Model-based techniques that use at least one significant assumption not observable in the market. These unobservable assumptions reflect estimates of assumptions that market participants would use in pricing the asset or liability. Valuation techniques include use of option pricing models, discounted cash flow models and similar techniques. | |
29
Table of Contents
The following methods and assumptions were used to estimate the fair value of each class of financial instruments that are recognized at fair value on a recurring and non-recurring basis:
Securities
AFS and trading securities are recorded at fair value on a recurring basis. Where quoted prices are available in an active market for identical assets, securities are classified within level 1 of the valuation hierarchy. Such quoted prices are available for the Company’s U.S. Treasury securities. Most of the remainder of the Company’s securities are quoted using observable market information for similar assets which requires the Company to report and use level 2 pricing for them. When observable market information is not available for securities where there is limited activity or less transparency around inputs, such securities would be classified within level 3 of the valuation hierarchy. The Company does not have any securities within the level 3 hierarchy.
Impaired Loans
Impaired loans consist of loans which are secured by collateral and unsecured loans. Collateralized loans are further segregated into impaired loans with current market valuations and other valuation techniques which are excluded by the GAAP fair value measurement and disclosure requirements. The impaired loans in the tables below are loans that are collateralized and that have current market valuations, such as current appraisals.
The Company records certain loans at fair value on a non-recurring basis. When a loan is considered impaired, an allowance for a loan loss is established. The fair value measurement and disclosure requirement applies to loans measured for impairment using the practical expedients method permitted by accounting guidance for impaired loans. Impaired loans are measured at an observable market price, if available or at the fair value of the loans collateral, if the loan is collateral dependent. The fair value of the loan’s collateral is determined by appraisals or independent valuation which is then adjusted for the cost related to liquidation of the collateral. When the fair value of the loan’s collateral is based on an observable market price or current appraised value, given the current real estate markets, the appraisals may contain a wide range of values and accordingly, the Company classifies the fair value of the impaired loans as a non-recurring valuation within level 2 of the valuation hierarchy. When the Company measures impairment using anything but an observable market price or a current appraised value, the fair value measurement is not in the scope of the fair value measurement and disclosure requirements and is not included in the tables below.
Intangible Assets
The Company recorded intangible assets for identified customer deposit and relationship intangibles and other intangibles that were acquired with the acquisitions of Pacific Crest Capital Incorporated (“PCCI”), FBSLO, MCM and REWA. The value and estimated run-off of the intangibles are determined at the time of purchase based on a valuation prepared by a third party. Monthly amortization of intangibles are accounted for based on forecasted run-off of the customer deposit and relationship intangible using a discounted cash flow approach which is prepared at the time the intangibles are identified as of the date of purchase. These assets are analyzed quarterly to compare the amortization to the actual deposit and customer relationship run-off. If the actual run-off is more than the scheduled amortization a write-down of the intangible asset is recognized. As such, the Company records these assets at fair value and the adjustments are classified as non-recurring valuations within level 3 of the valuation hierarchy.
Servicing Rights
Servicing rights are carried at the lower of aggregate cost or estimated fair value. Servicing rights are subject to quarterly impairment testing. When the fair value of the servicing rights are lower than their carrying value, an impairment is recorded by establishing or increasing the amount of a valuation allowance so that the net carrying amount is equal to the fair value. The Company uses independent third parties to value the servicing rights. The valuation model takes into consideration discounted cash flows using current interest rates, and prepayment speeds for each type of the underlying asset being serviced. The Company classifies these servicing rights as non-recurring level 3 in the valuation hierarchy.
Derivatives
The Company’s swap derivatives are not listed on an exchange and are instead executed over the counter (“OTC”). As no quoted market prices exist for such instruments, the Company values these OTC derivatives primarily based on the broker pricing indications and in consideration of the risk of counterparty nonperformance. OTC interest rate swap key valuation inputs are observable interest rate and/or yield curves and do not require significant judgment, and accordingly, the swap values are classified within Level 2 of the fair value hierarchy.
30
Table of Contents
Low Income Housing Tax Credit Partnerships
At March 31, 2010 and December 31, 2009, the Company had investments in LIHTCP of $42.9 million and $43.7 million, respectively. Given the increased uncertainty of the Company’s future taxable income and the Company’s ability to utilize the tax credits from the investments in LIHTCP, during the three months ended March 31, 2010 and the year ended December 31, 2009, Management evaluated the recoverability of these investments by obtaining fair value indications through LIHTCP asset managers at March 31, 2010 and December 31, 2009. At September 30, 2009, Management determined that these investments were other-than-temporarily impaired and recognized an impairment of $8.9 million. At March 31, 2010 and December 31, 2009, no further impairment of these investments was recognized. The Company classifies the valuation of these investments in LIHTCP as a non-recurring level 2 in the fair value hierarchy.
31
Table of Contents
Assets and liabilities measured at fair value on a recurring basis at March 31, 2010 and December 31, 2009 are summarized in the following tables:
| Recurring Fair Value Measurements at Reporting | ||||||||||||
| As
of March 31, 2010 |
Quoted prices in active markets for identical assets (Level 1) |
Active markets for similar assets (Level 2) |
Unobservable inputs (Level 3) | |||||||||
| (in thousands) | ||||||||||||
| Assets: |
||||||||||||
| Trading Securities: |
||||||||||||
| Mortgage-backed securities |
$ | 5,286 | $ | — | $ | 5,286 | $ | — | ||||
| Total trading securities |
5,286 | — | 5,286 | — | ||||||||
| Available-for-Sale: |
||||||||||||
| U.S. Treasury obligations |
11,339 | 11,339 | — | — | ||||||||
| U.S. Agency obligations |
467,991 | — | 467,991 | — | ||||||||
| Collateralized mortgage obligations |
107,042 | — | 107,042 | — | ||||||||
| Mortgage-backed securities |
120,571 | — | 120,571 | — | ||||||||
| Asset-backed securities |
1,468 | — | 1,468 | — | ||||||||
| State and municipal securities |
236,128 | — | 236,128 | — | ||||||||
| Total available for sale securities |
944,539 | 11,339 | 933,200 | — | ||||||||
| Fair value swap asset |
11,020 | — | 11,020 | — | ||||||||
| Total assets at fair value |
$ | 960,845 | $ | 11,339 | $ | 949,506 | $ | — | ||||
| Liabilities: |
||||||||||||
| Fair value swap liability |
$ | 12,451 | $ | — | $ | 12,451 | $ | — | ||||
| Total liabilities at fair value |
$ | 12,451 | $ | — | $ | 12,451 | $ | — | ||||
32
Table of Contents
| Recurring Fair Value Measurements
at Reporting | ||||||||||||
| As
of December 31, 2009 |
Quoted prices in active markets for identical assets (Level 1) |
Active markets for similar assets (Level 2) |
Unobservable inputs (Level 3) | |||||||||
| (in thousands) | ||||||||||||
| Assets: |
||||||||||||
| Trading Securities: |
||||||||||||
| Mortgage-backed securities |
$ | 5,403 | $ | — | $ | 5,403 | $ | — | ||||
| Total trading securities |
5,403 | — | 5,403 | — | ||||||||
| Available-for-Sale: |
||||||||||||
| U.S. Treasury obligations |
11,432 | 11,432 | — | — | ||||||||
| U.S. Agency obligations |
607,930 | — | 607,930 | — | ||||||||
| Collateralized mortgage obligations |
113,934 | — | 113,934 | — | ||||||||
| Mortgage-backed securities |
169,058 | — | 169,058 | — | ||||||||
| Asset-backed securities |
1,271 | — | 1,271 | — | ||||||||
| State and municipal securities |
250,062 | — | 250,062 | — | ||||||||
| Total available for sale securities |
1,153,687 | 11,432 | 1,142,255 | — | ||||||||
| Fair value swap asset |
10,808 | — | 10,808 | — | ||||||||
| Total assets at fair value |
$ | 1,169,898 | $ | 11,432 | $ | 1,158,466 | $ | — | ||||
| Liabilities: |
||||||||||||
| Fair value swap liability |
$ | 12,204 | $ | — | $ | 12,204 | $ | — | ||||
| Total liabilities at fair value |
$ | 12,204 | $ | — | $ | 12,204 | $ | — | ||||
The Company may be required to measure certain assets and liabilities at fair value on a non-recurring basis in accordance with GAAP. These include assets and liabilities that are measured at the lower of cost or market that were recognized at fair value below cost at the end of the period.
Assets and liabilities measured at fair value on a non-recurring basis at March 31, 2010 and December 31, 2009 are summarized in the table below:
| Non-recurring Fair Value Measurements at Reporting | ||||||||||||
| As of March 31, 2010 |
Quoted prices in active markets for identical assets (Level 1) |
Active markets for similar assets (Level 2) |
Unobservable inputs (Level 3) | |||||||||
| (in thousands) | ||||||||||||
| Impaired loans |
$ | 155,266 | $ | — | $ | 155,266 | $ | — | ||||
| Investments in LIHTCP |
42,853 | — | 42,853 | — | ||||||||
| Intangible assets |
4,523 | — | — | 4,523 | ||||||||
| Servicing rights |
4,118 | — | — | 4,118 | ||||||||
| Total assets at fair value |
$ | 206,760 | $ | — | $ | 198,119 | $ | 8,641 | ||||
| Non-recurring Fair Value Measurements at Reporting | ||||||||||||
| As of December 31, 2009 |
Quoted prices in active markets for identical assets (Level 1) |
Active markets for similar assets (Level 2) |
Unobservable inputs (Level 3) | |||||||||
| Impaired loans |
$ | 92,551 | $ | — | $ | 92,551 | $ | — | ||||
| Investments in LIHTCP |
43,678 | — | 43,678 | — | ||||||||
| Intangible assets |
4,756 | — | — | 4,756 | ||||||||
| Servicing rights |
4,533 | — | — | 4,533 | ||||||||
| Total assets at fair value |
$ | 145,518 | $ | — | $ | 136,229 | $ | 9,289 | ||||
33
Table of Contents
There were no liabilities measured at fair value on a non-recurring basis at March 31, 2010 or December 31, 2009. In addition, there were no transfers in or out of the Company’s level 3 financial assets and liabilities during the three month period ended March 31, 2010.
The disclosure below provides the carrying value and fair value of the financial instruments which are not carried on the Company’s Consolidated Financial Statements at fair value or are carried at the lower of cost or market and not disclosed in the recurring or non-recurring fair value measurements in the tables above.
| March 31, 2010 | December 31, 2009 | |||||||||||
| Carrying Amount |
Fair Value | Carrying Amount |
Fair Value | |||||||||
| (in thousands) | ||||||||||||
| Assets: |
||||||||||||
| Cash and due from banks |
$ | 20,013 | $ | 20,013 | $ | 45,593 | $ | 45,593 | ||||
| Interest-bearing demand deposits in other financial institutions |
1,109,927 | 1,109,927 | 878,823 | 878,823 | ||||||||
| Loans held for sale |
26,629 | 27,265 | 19,211 | 19,822 | ||||||||
| Loans held for investment, net |
4,603,726 | 4,341,346 | 4,893,579 | 4,578,622 | ||||||||
| Liabilities: |
||||||||||||
| Deposits |
5,417,961 | 5,442,191 | 5,373,819 | 5,396,973 | ||||||||
| Long-term debt and other borrowings |
1,076,951 | 1,082,395 | 1,311,828 | 1,307,709 | ||||||||
| Repurchase agreements and federal funds purchased |
316,808 | 319,950 | 322,131 | 321,971 | ||||||||
The financial instruments disclosed in this note include such items as securities, loans, deposits, debt, and other instruments. Disclosure of fair values is not required for certain items such as obligations for pension and other postretirement benefits, premises and equipment, other real estate owned, prepaid expenses, and income tax assets and liabilities. Accordingly, the aggregate fair value of amounts presented in this note does not purport to represent, and should not be considered representative of, the underlying “market” or franchise value of the Company. Further, due to a variety of alternative valuation techniques and approaches permitted by the fair value measurement accounting standards as well as significant assumptions that are required to be made in the process of valuation, actual results could and do differ between various market participants. A direct comparison of the Company’s fair value information with that of other financial institutions may not be appropriate.
34
Table of Contents
The following methods and assumptions were used to estimate the fair value of each class of financial instruments:
Cash and Due from Banks
The carrying values of cash and interest-bearing demand deposits in other financial institutions are the fair value.
Loans Held for Sale
Loans held for sale are carried at the lower of cost or market. The fair value of loans held for sale is based on what secondary markets are currently offering for portfolios with similar characteristics or based on the agreed upon sale price. As such, the Company classifies the fair value of loans held for sale as a non-recurring valuation within level 2 of the fair value hierarchy. At March 31, 2010 and December 31, 2009, the Company had loans held for sale with an aggregate carrying value of $26.6 million and $19.2 million, respectively.
Loans Held for Investment, net
The current fair value of the held for investment loans reflects a discount to their carrying value. The loans held for investment were adversely affected by a significant reduction in or lack of liquidity as well as unprecedented disruptions in the financial markets since the fourth quarter of 2008. More recently, as market liquidity has begun to improve, the discount on the portfolio has decreased. The carrying value of the net loans held for investment includes the allowance for loan losses assessed for each period presented which represent’s Management’s evaluation of the loan portfolio’s inherent credit losses, and no further adjustment is made for credit losses in the preparation of the estimated fair value of the net loans held for investment. The fair value presented above is calculated based on the present value of principal and interest cash flows. Contractual principal payments are adjusted for expected prepayment of principal, where appropriate, and the discount rates used to present value the cash flows incorporate changes in interest rates as reflected in the secondary market for loans for the periods presented.
The methods used to estimate the fair value of loans are extremely sensitive to the assumptions and estimates used . While management has attempted to use assumptions and estimates that best reflect the Company’s loan portfolio and current market conditions, a greater degree of subjectivity is inherent in these values than in those determined in active markets. Accordingly, readers are cautioned in using this information for purposes of evaluating the financial condition and/or value of the Company in and of itself or in comparison with any other company.
Deposits
The fair value of demand deposits, money market accounts, and savings accounts is the amount payable on demand at March 31, 2010 and December 31, 2009. The fair value of fixed-maturity certificates of deposit is estimated by discounting the interest and principal payments using the rates currently offered for deposits of similar remaining maturities.
Long-term Debt and Other Borrowings
For FHLB advances, the fair value is estimated using rates currently quoted by the FHLB for advances of similar remaining maturities. For subordinated debt and trust preferred stock issued, the fair value is estimated by discounting the interest and principal payments using current market rates for comparable securities. For treasury tax and loan obligations, the carrying amount is a reasonable estimate of fair value.
Repurchase Agreements and Federal Funds Purchased
For Federal funds purchased, the carrying amount is a reasonable estimate of their fair value. The fair value of repurchase agreements is determined by reference to rates in the wholesale repurchase market. The rates paid to the Company’s customers are slightly lower than rates in the wholesale market and, consequently, the fair value will generally be less than the carrying amount. The fair value of the long-term repurchase agreements is determined in the same manner as the long-term debt and other borrowings, above.
35
Table of Contents
15. SEGMENTS
In January 2010, the CEO announced organizational changes that changed the structure and responsibilities of his direct reports. These organizational changes also were aligned based on how the Company’s Board of Directors has set performance goals for the CEO and his management team. Based on these changes, the Company re-defined its segments beginning January 2010 and restated the comparable periods presented in the tables below. In addition, as disclosed in Note 8 “Discontinued Operations - RAL and RT Programs” of these Consolidated Financial Statements, the RAL and RT Program’s segment was sold in January 2010.
With this redefinition, the Company has two operating business segments, Commercial and Community Banking and Wealth Management. The Other segment is not considered an operating segment, but includes all corporate administrative support departments such as human resources, legal, finance and accounting, treasury, information technology, internal audit, risk management, facilities management, marketing, executive management and the holding company. The operations and expenses reported in the Other segment can not specifically be allocated to the operating segments based on the services provided. The administrative departments which specifically support the operating segments have been identified and reported within the operating segment and due to these changes we have eliminated the allocation of overhead expenses to the operating segments.
The financial results and determination of the new operating segments were based on the major business lines of the Bank and the products and services offered to the customers of each segment, as well as how the chief operating decision maker of the Company measures performance and allocates resources. In determining the Bank’s segments, we also took into consideration our peers and how their segments were presented
A summary of the operating segments products and services and customers are below:
Commercial and Community Banking
The Commercial and Community Banking reportable segment is the aggregation of activities typically found in a bank that focuses its efforts in specific geographical communities. This reportable segment includes all lending and deposit products of the Bank. Customers include both small business and middle market companies as well as individuals in the communities which the Bank serves.
Loan products offered by the Commercial and Community Banking segment include traditional commercial and industrial and commercial real estate loans, lines of credit, letters of credit, asset-based lending, construction loans, land acquisition and development loans to small business and middle market commercial clients. Loan products offered to individual clients include residential real estate loans, home equity lines and loans, and consumer loans.
Deposit products offered by the Commercial and Community Banking segment include checking, savings, money market accounts, individual retirement accounts and certificates of deposit. Other products include foreign exchange services, treasury services and debit card services. The Commercial and Community Banking segment serves customers through traditional banking branches, loan production centers, Automated Teller Machines (“ATMS”) through customer contact call centers and online banking.
Included in the Commercial and Community Banking segment are the associated administrative departments to support their products and activities such as loan servicing, credit administration, special assets department, research, wire room, delinquency management unit, central vault operations, retail banking administration and retail and commercial lending administration departments.
Wealth Management
The Wealth Management segment includes the trust and investment advisory services division and the two registered investment advisors, MCM and REWA which are subsidiaries of the Bank. The Wealth Management segment provides investment reviews, analysis and customized portfolio management for separately managed accounts, full service brokerage, trust and fiduciary services, equity and fixed income management and real estate and specialty asset management.
36
Table of Contents
The following tables present the Company’s segment financial information based on the structure summarized above.
| Three-Months Ended March 31, 2010 | ||||||||||||||||
| Operating Segments | ||||||||||||||||
| Commercial and Community Banking |
Wealth Management |
All Other | Total | |||||||||||||
| (in thousands) | ||||||||||||||||
| Interest income |
$ | 65,848 | $ | — | $ | 9,231 | $ | 75,079 | ||||||||
| Interest expense |
14,536 | 118 | 16,160 | 30,814 | ||||||||||||
| Net interest income/ (loss) |
51,312 | (118 | ) | (6,929 | ) | 44,265 | ||||||||||
| Provision for loan losses |
99,865 | — | — | 99,865 | ||||||||||||
| Non-interest income |
9,394 | 5,437 | 4,746 | 19,577 | ||||||||||||
| Non-interest expense |
22,244 | 3,155 | 25,921 | 51,320 | ||||||||||||
| Direct (loss)/ income before tax |
(61,403 | ) | 2,164 | (28,104 | ) | (87,343 | ) | |||||||||
| Indirect (charge)/credit for funds |
(2,888 | ) | 14 | 2,874 | — | |||||||||||
| Net (loss) income before tax from continuing operations |
$ | (64,291 | ) | $ | 2,178 | $ | (25,230 | ) | $ | (87,343 | ) | |||||
| Total assets |
$ | 4,771,910 | $ | 18,488 | $ | 2,392,909 | $ | 7,183,307 | ||||||||
| Three-Months Ended March 31, 2009 | ||||||||||||||||
| Operating Segments | ||||||||||||||||
| Commercial and Community Banking |
Wealth Management |
All Other | Total | |||||||||||||
| (in thousands) | ||||||||||||||||
| Interest income |
$ | 78,503 | $ | 2 | $ | 14,182 | $ | 92,687 | ||||||||
| Interest expense |
20,982 | 223 | 23,681 | 44,886 | ||||||||||||
| Net interest income/ (loss) |
57,521 | (221 | ) | (9,499 | ) | 47,801 | ||||||||||
| Provision for loan losses |
73,516 | — | — | 73,516 | ||||||||||||
| Non-interest income |
7,751 | 5,629 | 2,193 | 15,573 | ||||||||||||
| Non-interest expense |
24,924 | 4,087 | 30,823 | 59,834 | ||||||||||||
| Direct (loss)/ income before tax |
(33,168 | ) | 1,321 | (38,129 | ) | (69,976 | ) | |||||||||
| Indirect (charge)/credit for funds |
(5,470 | ) | (5 | ) | 5,475 | — | ||||||||||
| Net (loss) income before tax from continuing operations |
$ | (38,638 | ) | $ | 1,316 | $ | (32,654 | ) | $ | (69,976 | ) | |||||
| Total assets |
$ | 5,791,326 | $ | 30,088 | $ | 2,386,811 | $ | 8,208,225 | ||||||||
As referenced in Note 1, “Summary of Significant Accounting Policies” of these Consolidated Financial Statements certain amounts in the tables above have been reclassified so that the periods presented are comparable.
Indirect credit (charge) for funds
The indirect charge for funds is a calculation based on the estimated funding costs for the originating of loans or purchasing of assets multiplied by the estimated cost of funds by the net assets of the segment. The indirect credit for funds is calculated by determining if the segment is a net fund provider (i.e. collector of deposits or borrower of funds through borrowings) and multiplying the net liabilities by the cost of funds.
37
Table of Contents
16. GOING CONCERN
These Consolidated Financial Statements have been prepared under the assumption that the Company is a going concern. As a result of the significant operating losses incurred by the Company and the enhanced regulatory scrutiny under which the Company and the Bank are operating, the Company’s Independent Registered Public Accounting Firm added an explanatory paragraph in their audit opinion dated March 12, 2010 issued in connection with our December 31, 2009 consolidated financial statements, expressing substantial doubt regarding our ability to continue as a going concern. Management’s plans to address this uncertainty include the raising of capital pursuant to the Investment Agreement, as discussed in Note 19, “Subsequent Events” of these Consolidated Financial Statements, and the implementation of the Company’s three-year strategic and capital plan. Key components of this plan include the following:
| n | Improve asset quality through a combination of efforts to reduce the current concentration of classified assets, manage credit risk exposures in the existing loan portfolio, and tighten credit underwriting standards; |
| n | Review the Bank’s entire loan portfolio to identify loans that are good candidates for sale. During the three months ended March 31, 2010, the Company sold approximately $69.8 million of loans; |
| n | Curtail commercial real estate lending business pending a reduction in the Bank’s risk profile and significant improvement in market conditions; |
| n | Limit asset growth, as the Company focuses on improving asset quality and implementing necessary efficiency and risk management initiatives in the Bank; |
| n | Maintain prudent levels of liquidity; |
| n | Improve earnings; |
| n | Strengthen oversight by Management and Board of Directors; |
| n | Comply with applicable laws and regulations, including, to the maximum possible extent, regulatory capital requirements and the requirements of regulatory enforcement actions; and |
| n | Improve operating efficiencies through automation of key systems, process integration, and elimination of redundancies. |
There can be no assurance that any of these efforts will be successful, and if the Company were to be unsuccessful, its ongoing viability would be in doubt.
17. REGULATORY MATTERS
On May 11, 2010, the Company entered into the Written Agreement with the FRB. The Written Agreement restricts the payment of dividends by the Company, as well as the taking of dividends or any other payment representing a reduction in capital from the Bank, without the prior approval of the FRB. The Written Agreement further requires that the Company not incur, increase, or guarantee any debt, repurchase or redeem any shares of its stock, or pay any interest or principal on subordinated debt or trust preferred securities, in each case without the prior approval of the FRB. The Written Agreement also requires the Company to develop a capital plan for the Company within 90 days, which capital plan shall address, among other things, the Company’s current and future capital requirements, including compliance with the minimum capital ratios, the adequacy of the capital, the source and timing of additional funds, and procedures to notify the FRB no more than 30 days after the end of any quarter in which the Company’s consolidated capital ratios or the Bank’s capital ratios fall below the required minimums. The Company is also required to submit a cash flow projection for the remainder of 2010 to the FRB within 60 days. The Company will also be required to provide notice to the FRB regarding the appointment of any new director or senior executive officer. Finally, the board of directors of the Company is required to submit written progress reports to the FRB within 30 days after the end of each calendar quarter.
38
Table of Contents
Also on May 11, 2010, in cooperation with and at the request of the OCC and pursuant to a Stipulation and Consent to the Issuance of a Consent Order, the Bank voluntarily consented to the issuance of the Consent Order. Under the Consent Order, the Bank agreed, among other things, to the following:
| n | to establish a compliance committee to monitor and coordinate compliance with the Consent Order; |
| n | to develop and implement a three-year strategic plan for the Bank, which shall, among other things, establish objectives for the Bank’s overall risk profile, earnings performance, growth, balance sheet mix, off-balance sheet activities, liability structure, capital adequacy, reduction in the volume of nonperforming assets, product line development, and market segments that the Bank intends to promote or develop, together with strategies to achieve those objectives; |
| n | to achieve and maintain thereafter a total capital at least equal to 12% of risk-weighted assets and Tier 1 capital at least equal to 9% of adjusted total assets (the “Minimum Capital Ratios”) by September 8, 2010; |
| n | to develop and implement a three-year capital plan for the Bank (the “Capital Plan”) that is acceptable to the OCC, which shall, among other things, include specific plans for maintaining adequate capital, a discussion of the sources and timing of capital, as well as contingency plans for alternative sources of capital; |
| n | if the Bank fails to submit an acceptable Capital Plan to the OCC, fails to implement or adhere to a Capital Plan that is acceptable to the OCC, or fails to achieve and maintain the Minimum Capital Ratios by September 8, 2010, to submit to the OCC, upon direction of the OCC in its sole discretion, a disposition plan that shall detail the proposal of the board of directors of the Bank to sell, merge or liquidate the Bank (the “Disposition Plan”), which Disposition Plan must be adopted and implemented by the board of directors of the Bank immediately upon direction of the OCC; |
| n | to not pay a dividend or make a capital distribution without the prior written consent of the OCC; |
| n | to ensure that the Bank has competent management in place on a full-time basis in all executive officer positions to carry out the Bank’s policies, ensure compliance with the Consent Order, ensure compliance with applicable laws, rules and regulations, and manage the day-to-day operations of the Bank in a safe and sound manner; |
| n | to develop and implement a written credit policy and a commercial real estate concentration management program; |
| n | to obtain current and complete credit information and collateral documentation on all loans lacking such information and documentation, and to maintain a list of any credit exceptions and collateral exceptions that have not been corrected within 60 days; |
| n | to develop and implement a written consumer mortgage credit risk program, a retail mortgage loan collections program, a retail mortgage loan loss recognition program, a commercial credit risk ratings program, and an independent loan review program; |
| n | to develop and implement a program to determine whether a loan is impaired and for measuring the amount of the impairment to ensure that the Bank maintains an adequate Allowance for Loan and Lease Losses, consistent with Financial Accounting Standards 114; |
| n | to implement a program for the maintenance of an adequate Allowance for Loan and Lease Losses; |
39
Table of Contents
| n | to develop and implement a program to protect the Bank’s interest in those assets criticized in the more recent and any subsequent Report of Examinations, by any internal or external loan review, or in any list provided to management by the National Bank Examiners during any examination as “doubtful,” substandard,” or “special mention;” |
| n | to adopt and implement an action plan to manage each parcel of Other Real Estate Owned; and |
| n | to take action to maintain adequate sources of stable funding and to review the Bank’s liquidity on a monthly basis. |
Any material failure to comply with the provisions of the Written Agreement or Consent Order could result in additional enforcement actions by the FRB and the OCC, respectively. Possible enforcement actions against the Company and the Bank could include the issuance of additional orders that could be judicially enforced, the issuance of directives to enter into a strategic transaction, whether by merger or otherwise, with a third party, the appointment of a conservator or receiver for the Bank, the termination of insurance of deposits, and the enforcement of such actions through injunctions or restraining orders. If these events occur, the Company would likely suffer a complete loss of the value of its ownership interest in the Bank, and the Company subsequently may be exposed to significant claims by its shareholders as well as the FDIC and OCC. While the Company and the Bank intend to take such actions as may be necessary to comply with the requirements of the Written Agreement and the Consent Order, there can be no assurance that the Company will be able to comply fully with the provisions of the Written Agreement or that the Bank will be able to comply fully with the provisions of the Consent Order, that compliance with the Written Agreement and the Consent Order will not be more time consuming or more expensive than anticipated, that compliance with the Written Agreement and the Consent Order will enable the Company and the Bank to resume profitable operations, or that efforts to comply with the Written Agreement and the Consent Order will not have adverse effects on the operations and financial condition of the Company or the Bank.
18. CREDIT RATINGS
The Company’s liquidity is also impacted by the credit ratings assigned to the Company and the Bank by third party rating agencies. On December 24, 2009, Moody’s downgraded the credit ratings of the Company from Caa1 to C and the long term deposits of the Bank from B1 to B3 with the financial strength rating being under review for a possible downgrade. On December 24, 2009, DBRS downgraded their credit ratings for the Company from B to CCC and the deposits and senior debt of the Bank from BB to B with all ratings remaining under review with negative implications. On February 1, 2010, DBRS downgraded the credit ratings for the Company from CCC to CC and the senior debt of the Bank from B to CCC (high). On March 15, 2010, Moody’s downgraded the credit ratings of the Bank from E+ to E, long-term deposits from B3 to Caa1 and long-term other senior obligations from Caa3 to C. On April 29, 2010, following the announcement of the execution of the Investment Agreement, Moody’s placed the long-term ratings of the Company and the Bank on review for possible upgrade. On April 30, 2010, DBRS placed all ratings under review with negative implications.
These lower credit ratings, and any further ratings downgrades, could make it more difficult for the Company to access the capital markets going forward, as the cost to borrow or raise debt or equity capital could become more expensive. The impact of these downgrades puts further pressure on the Company’s stock price, access to capital, and impedes its access to various liquidity sources. Although the cost of PCBNA’s primary funding sources (deposits and FHLB borrowings) is not influenced directly by PCB and PCBNA credit ratings, no assurance can be given that PCBNA’s credit rating will not have any impact on its access to deposits and FHLB borrowings. Long-term debt ratings also factor into the calculation of deposit insurance premiums, and a reduction in PCBNA’s ratings would increase premiums and expense.
19. SUBSEQUENT EVENTS
Investment Agreement and Recapitalization
On April 29, 2010, the Company and the Bank entered into the Investment Agreement with SB Acquisition Company, LLC, a wholly-owned subsidiary of Ford Financial Fund, L.P. (“Ford”), pursuant to which Ford will invest, subject to certain conditions, an aggregate of $500 million in cash in the Company through direct purchases of newly issued shares of common stock at a purchase price of $0.20 per share, and newly created shares of Convertible Preferred Stock at a
40
Table of Contents
purchase price of $1,000 per share (the “Investment”). Pursuant to the terms of the Investment Agreement, at the closing of the Investment (the “Closing”) the Company will issue: 225,000,000 shares of common stock and 455,000 shares of Convertible Preferred Stock. Each share of Convertible Preferred Stock will mandatorily convert into 5,000 shares of common stock (subject to customary anti-dilution adjustments) following shareholder approval, after the Closing, of an amendment to the Company’s Articles of Incorporation to increase the number of authorized shares of common stock to permit the full issuance of all of the common stock in connection with that conversion.
The Closing is subject to a variety of closing conditions, including, among others, the receipt of certain required governmental and regulatory approvals and the Company’s receipt of approval from the NASDAQ Stock Market to issue the Securities in reliance on the shareholder approval exemption set forth in NASDAQ Rule 5635(f). The Closing is also conditioned on completion by the Company and the Bank of a recapitalization (“Recapitalization”) involving: (i) the Company’s $67,330,000 aggregate principal amount of capital securities (“Trust Preferred Securities”); (ii) the Bank’s $121,000,000 aggregate principal amount of subordinated debt instruments (“Bank Sub Debt”); and (iii) the Company’s Series B Fixed Rate Cumulative Perpetual Preferred Stock, aggregate liquidation preference $180,634,000 (“Series B Preferred Stock”), and related warrant to purchase shares of common stock, both issued to the United Stated Department of the Treasury (the “Treasury”). For this condition to be satisfied, (i) all Series B Preferred Stock and the related warrant must be exchanged for common equity in an amount equal to twenty percent (20%) of the aggregate face value of the Series B Preferred Stock and the amount of accrued but unpaid dividends on the Series B Preferred Stock, with common stock valued at $0.20 per share for this purpose, and (ii) an amount not less than seventy percent (70%) of the combined aggregate principal amount of all series of the Trust Preferred Securities and all series of the Bank Sub Debt must be exchanged for cash in an amount equal to twenty percent (20%) of the face value of the Trust Preferred Securities and thirty percent (30%) of the face value of the Bank Sub Debt, respectively.
For more information regarding the Investment and the Recapitalization, see “Management’s Discussion and Analysis of Financial Condition and Results of Operations—Recent Events.”
Sale of Veritas
On May 5, 2010, an agreement to sell the Bank’s ownership in Veritas Wealth Management Advisors, LLC, a registered investment advisor was completed. The Bank’s investment of $1.0 million or 20% ownership in Vertitas was sold for $100,000. The final accounting for the loss on sale of this investment has not been completed at the date of this Form 10-Q.
41
Table of Contents
| ITEM 2. | MANAGEMENT’S DISCUSSION AND ANALYSIS OF FINANCIAL CONDITION AND RESULTS OF OPERATIONS |
This discussion is designed to provide insight into Management’s assessment of significant trends related to Pacific Capital Bancorp’s consolidated financial condition, results of operations, liquidity, capital resources, and interest rate sensitivity. This Quarterly Report on Form 10-Q should be read in conjunction with the 2009 Form 10-K and the unaudited interim consolidated financial statements and notes hereto and financial information appearing throughout this report.
OVERVIEW AND HIGHLIGHTS
Net loss for the first quarter of 2010 was $83.0 million or ($1.77) applicable per share to common shareholders, compared with net loss of $7.9 million, or ($0.17) applicable per share to common stockholders, reported for the first quarter of 2009. Net loss from continuing operations was $87.4 million in the first quarter of 2010 compared with a net loss of $37.6 million in the first quarter of 2009. For both years, the differences between the net loss applicable to common shareholders and the net loss from continuing operations is the operating results from the discontinued operations and the accrual of dividends for the preferred stock issued to the Treasury pursuant to the Troubled Asset Relief Program Capital Purchase Program and the accretion of cost of the warrants issued with the preferred stock.
The significant factors impacting the Company’s net loss for the first quarter of 2010 compared to the first quarter of 2009 were:
| n | Provision for loan losses for continuing operations was $99.9 million for the first quarter of 2010 compared to $73.5 million for the same period a year ago. This provision reflects increased charge-offs experienced in the Bank’s loan portfolio during the comparable periods as well as growth in nonperforming assets. |
| n | The sale of the RAL and RT Programs in January 2010. The gain on sale of the RAL and RT Programs and the financial impact of these programs for the periods presented has been reclassified into discontinued operations. |
| n | An increase in interest-bearing demand deposits in other financial institutions to maintain a strong liquidity position. |
| n | An increase in non-interest income from the sale of securities and loans and a decrease in non-interest expense from the Company’s initiatives to reduce expenses. |
The impact to the Company from these items will be discussed in more detail throughout the analysis sections of the Management Discussion and Analysis (“MD&A”) section of this Form 10-Q.
RECENT DEVELOPMENTS
Investment Agreement and Recapitalization
On April 29, 2010, the Company and the Bank entered into the Investment Agreement with Ford, pursuant to which Ford will invest, subject to certain conditions, an aggregate of $500 million in cash in the Company through direct purchases of newly issued shares of common stock at a purchase price of $0.20 per share, and newly created shares of Convertible Preferred Stock at a purchase price of $1,000 per share. Pursuant to the terms of the Investment Agreement, at the Closing, the Company will issue: 225,000,000 shares of common stock and 455,000 shares of Convertible Preferred Stock. Each share of Convertible Preferred Stock will mandatorily convert into 5,000 shares of common stock (subject to customary anti-dilution adjustments) following shareholder approval, after the Closing, of an amendment to the Company’s Articles of Incorporation to increase the number of authorized shares of common stock to permit the full issuance of all of the common stock in connection with that conversion.
42
Table of Contents
The Closing is subject to a variety of closing conditions, including, among others, the receipt of certain required governmental and regulatory approvals and the Company’s receipt of approval from the NASDAQ Stock Market to issue the Securities in reliance on the shareholder approval exemption set forth in NASDAQ Rule 5635(f). The Closing is also conditioned on completion by the Company and the Bank of the Recapitalization, which will involve: (i) the Company’s $67,330,000 aggregate principal amount of Trust Preferred Securities; (ii) the Bank’s $121,000,000 aggregate principal amount of Bank Sub Debt; and (iii) the Series B Preferred Stock and related warrant to purchase shares of common stock, both issued to the Treasury. For this condition to be satisfied, (i) all Series B Preferred Stock and the related warrant must be exchanged for common equity in an amount equal to twenty percent (20%) of the aggregate face value of the Series B Preferred Stock and the amount of accrued but unpaid dividends on the Series B Preferred Stock, with common stock valued at $0.20 per share for this purpose, and (ii) an amount not less than seventy percent (70%) of the combined aggregate principal amount of all series of the Trust Preferred Securities and all series of the Bank Sub Debt must be exchanged for cash in an amount equal to twenty percent (20%) of the face value of the Trust Preferred Securities and thirty percent (30%) of the face value of the Bank Sub Debt, respectively.
The Investment Agreement contains covenants of the Company and the Bank to conduct their respective businesses in the ordinary course until the Investment is completed and covenants of the Company and Bank not to take certain actions during such period. Each of the Company and the Bank has agreed not to solicit any inquiries, proposals or offers with respect to (i) a merger, joint venture, partnership, consolidation, dissolution, liquidation, tender offer, recapitalization, reorganization, rights offering, share exchange, business combination or similar transaction involving the Company or the Bank, (ii) any acquisition of ten percent (10%) or more of the total voting power of any class of equity securities of the Company or the Bank or (iii) any acquisition of ten percent (10%) or more of the consolidated total assets of the Company (an “Acquisition Proposal”). Further, the Company cannot make or authorize any statement, recommendation or solicitation in support of any Acquisition Proposal; participate in any discussions or negotiations relating to any Acquisition Proposal; or otherwise knowingly facilitate any effort to make an Acquisition Proposal.
The Investment Agreement provides that prior to the Closing, the Company and the Bank must take all requisite corporate action to increase the size of the Company’s and the Bank’s respective Boards of Directors by two directors, and that two representatives of Ford, Gerald J. Ford and Carl B. Webb, will be appointed to the Board of Directors of the Company and the Bank effective as of the Closing.
The Investment Agreement also provides that after the Closing, the Company will commence a rights offering whereby shareholders of record as of the close of business on the trading day immediately preceding the Closing date (“Legacy Holders”) would receive a non-transferable right to purchase common stock at a purchase price equal to $0.20 per share. A maximum of twenty percent (20%) of the pro-forma fully diluted common equity will be available for purchase by Legacy Holders in the rights offering, proportionally to each Legacy Holder’s ownership in the Company.
The Investment Agreement may be terminated in the event that the Closing does not occur on or before October 26, 2010; however, we cannot assure you that the Investment and the Recapitalization will close in the near term or at all. Both the Investment and the Recapitalization will be conditioned upon each other and other closing conditions.
43
Table of Contents
Regulatory Agreements
On May 11, 2010, the Company entered into the Written Agreement with the FRB. The Written Agreement restricts the payment of dividends by the Company, as well as the taking of dividends or any other payment representing a reduction in capital from the Bank, without the prior approval of the FRB. The Written Agreement further requires that the Company not incur, increase, or guarantee any debt, repurchase or redeem any shares of its stock, or pay any interest or principal on subordinated debt or trust preferred securities, in each case without the prior approval of the FRB. The Written Agreement also requires the Company to develop a capital plan for the Company within 90 days, which capital plan shall address, among other things, the Company’s current and future capital requirements, including compliance with the minimum capital ratios, the adequacy of the capital, the source and timing of additional funds, and procedures to notify the FRB no more than 30 days after the end of any quarter in which the Company’s consolidated capital ratios or the Bank’s capital ratios fall below the required minimums. The Company is also required to submit a cash flow projection for the remainder of 2010 to the FRB within 60 days. The Company will also be required to provide notice to the FRB regarding the appointment of any new director or senior executive officer. Finally, the board of directors of the Company is required to submit written progress reports to the FRB within 30 days after the end of each calendar quarter.
Also on May 11, 2010, in cooperation with and at the request of the OCC and pursuant to a Stipulation and Consent to the Issuance of a Consent Order, the Bank voluntarily consented to the issuance of the Consent Order. Under the Consent Order, the Bank agreed, among other things, to the following:
| n | to establish a compliance committee to monitor and coordinate compliance with the Consent Order; |
| n | to develop and implement a three-year strategic plan for the Bank, which shall, among other things, establish objectives for the Bank’s overall risk profile, earnings performance, growth, balance sheet mix, off-balance sheet activities, liability structure, capital adequacy, reduction in the volume of nonperforming assets, product line development, and market segments that the Bank intends to promote or develop, together with strategies to achieve those objectives; |
| n | to achieve and maintain thereafter a total capital at least equal to 12% of risk-weighted assets and Tier 1 capital at least equal to 9% of adjusted total assets (the “Minimum Capital Ratios”) by September 8, 2010; |
| n | to develop and implement a three-year capital plan for the Bank (the “Capital Plan”) that is acceptable to the OCC, which shall, among other things, include specific plans for maintaining adequate capital, a discussion of the sources and timing of capital, as well as contingency plans for alternative sources of capital; |
| n | if the Bank fails to submit an acceptable Capital Plan to the OCC, fails to implement or adhere to a Capital Plan that is acceptable to the OCC, or fails to achieve and maintain the Minimum Capital Ratios by September 8, 2010, to submit to the OCC, upon direction of the OCC in its sole discretion, a disposition plan that shall detail the proposal of the board of directors of the Bank to sell, merge or liquidate the Bank (the “Disposition Plan”), which Disposition Plan must be adopted and implemented by the board of directors of the Bank immediately upon direction of the OCC; |
| n | to not pay a dividend or make a capital distribution without the prior written consent of the OCC; |
| n | to ensure that the Bank has competent management in place on a full-time basis in all executive officer positions to carry out the Bank’s policies, ensure compliance with the Consent Order, ensure compliance with applicable laws, rules and regulations, and manage the day-to-day operations of the Bank in a safe and sound manner; |
| n | to develop and implement a written credit policy and a commercial real estate concentration management program; |
| n | to obtain current and complete credit information and collateral documentation on all loans lacking such information and documentation, and to maintain a list of any credit exceptions and collateral exceptions that have not been corrected within 60 days; |
| n | to develop and implement a written consumer mortgage credit risk program, a retail mortgage loan collections program, a retail mortgage loan loss recognition program, a commercial credit risk ratings program, and an independent loan review program; |
44
Table of Contents
| n | to develop and implement a program to determine whether a loan is impaired and for measuring the amount of the impairment to ensure that the Bank maintains an adequate Allowance for Loan and Lease Losses, consistent with Financial Accounting Standards 114; |
| n | to implement a program for the maintenance of an adequate Allowance for Loan and Lease Losses; |
| n | to develop and implement a program to protect the Bank’s interest in those assets criticized in the more recent and any subsequent Report of Examinations, by any internal or external loan review, or in any list provided to management by the National Bank Examiners during any examination as “doubtful,” substandard,” or “special mention;” |
| n | to adopt and implement an action plan to manage each parcel of Other Real Estate Owned; and |
| n | to take action to maintain adequate sources of stable funding and to review the Bank’s liquidity on a monthly basis. |
Any material failure to comply with the provisions of the Written Agreement or Consent Order could result in additional enforcement actions by the FRB and the OCC, respectively. Possible enforcement actions against the Company and the Bank could include the issuance of additional orders that could be judicially enforced, the issuance of directives to enter into a strategic transaction, whether by merger or otherwise, with a third party, the appointment of a conservator or receiver for the Bank, the termination of insurance of deposits, and the enforcement of such actions through injunctions or restraining orders. If these events occur, the Company would likely suffer a complete loss of the value of its ownership interest in the Bank, and the Company subsequently may be exposed to significant claims by its shareholders as well as the FDIC and OCC. While the Company and the Bank intend to take such actions as may be necessary to comply with the requirements of the Written Agreement and the Consent Order, there can be no assurance that the Company will be able to comply fully with the provisions of the Written Agreement or that the Bank will be able to comply fully with the provisions of the Consent Order, that compliance with the Written Agreement and the Consent Order will not be more time consuming or more expensive than anticipated, that compliance with the Written Agreement and the Consent Order will enable the Company and the Bank to resume profitable operations, or that efforts to comply with the Written Agreement and the Consent Order will not have adverse effects on the operations and financial condition of the Company or the Bank.
BUSINESS
PCB is a bank holding company. All references to the “Company”, “us”, “we”, “our” apply to PCB and its subsidiaries on a consolidated basis. The Company’s organizational structure and description of services are discussed in Item 1, “Business” and in Note 1, “Summary of Significant Accounting Policies” of the 2009 Form 10-K and should be read in conjunction with this Form 10-Q. In the 2009 Form 10-K, Item 1A, “Risk Factors” section, there are several risk factors outlined on page 15 through 27 which should be taken into consideration while reviewing this Form 10-Q. Terms and acronyms used throughout this document are defined in the glossary on pages 64 through 67.
Segments
In January 2010, the CEO announced organizational changes that changed the structure and responsibilities of his direct reports. These organizational changes also were aligned based on how the Company’s Board of Directors has set performance goals for the CEO and his management team. Based on these changes, the Company re-defined its segments beginning January 2010 and restated the comparable periods presented within the Form 10-Q. In addition, as disclosed in Note 8, “Discontinued Operations - RAL and RT Programs” of these Consolidated Financial Statements the RAL and RT Program’s segment was sold in January 2010.
The Company’s businesses as viewed by Management are organized as described in Note 15, “Segments” of the Consolidated Financial Statements in this Form 10-Q. The operating segments for PCB are CBB and Wealth Management. The administrative functions for the Bank and the Holding Company are not considered part of the operating activities of the Company and for financial reporting purposes the unallocated activity is reported in the “All Other” segment.
45
Table of Contents
SIGNIFICANT ACCOUNTING POLICIES
The Company’s significant accounting policies are disclosed in this Form 10-Q in Note 1, “Summary of Significant Accounting Polices” and should be read in conjunction with the Company’s 2009 Form 10-K’s Note 1, “Summary of Significant Accounting Policies” on pages 103-118. This Form 10-Q is considered an update to the 2009 Form 10-K and, only material changes to the Company’s significant accounting policies are disclosed in this Form 10-Q.
Management believes that a number of the significant accounting policies are essential to the understanding of the Company’s financial condition and results of operation because they involve estimates, judgment, or are otherwise less subject to precise measurement. The quality of these estimates materially impacts those results. The Critical Accounting Policies used in the preparation of the Company’s Consolidated Financial Statements include allowance for loan losses, accounting for income taxes, goodwill and the accounting for the RAL and RT Program’s activities. These significant accounting policies are discussed in the “Critical Accounting Polices” section of the 2009 Form 10-K’s MD&A on pages 77-81 which should be read in conjunction with this Form 10-Q. While Management believes these estimates and assumptions to be reasonably accurate, actual results may differ. The RAL and RT Programs were sold in January 2010, and are reported as discontinued operations. Prior period financial information has been restated to present continuing operations which exclude the activity and financial impact of the RAL and RT Programs.
RESULTS OF OPERATIONS
INTEREST INCOME
The following table presents a summary of interest income for the three month periods ended March 31, 2010 and 2009:
| Three-Months
Ended March 31, | |||||||||||
| Change | |||||||||||
| 2010 | 2009 | $ | % | ||||||||
| (dollars in thousands) | |||||||||||
| Interest income: |
|||||||||||
| Loans: |
|||||||||||
| Commercial loans |
$ | 10,243 | $ | 13,022 | $ | (2,779) | (21.3%) | ||||
| Consumer loans |
7,284 | 8,015 | (731) | (9.1%) | |||||||
| Real estate loans - commercial |
35,046 | 41,249 | (6,203) | (15.0%) | |||||||
| Real estate loans - residential |
13,260 | 16,195 | (2,935) | (18.1%) | |||||||
| Other loans |
15 | 23 | (8) | (34.8%) | |||||||
| Total |
65,848 | 78,504 | (12,656) | (16.1%) | |||||||
| Investment securities—trading |
64 | 2,638 | (2,574) | (97.6%) | |||||||
| Investment securities—available-for-sale: |
|||||||||||
| U.S. treasury securities |
82 | 166 | (84) | (50.6%) | |||||||
| U.S. agencies |
2,677 | 4,373 | (1,696) | (38.8%) | |||||||
| Asset-backed securities |
34 | 34 | — | — | |||||||
| CMO’s and MBS |
2,532 | 2,750 | (218) | (7.9%) | |||||||
| State and municipal securities |
3,001 | 3,744 | (743) | (19.8%) | |||||||
| Total |
8,326 | 11,067 | (2,741) | (24.8%) | |||||||
| Interest on deposits in other banks |
841 | 477 | 364 | 76.3% | |||||||
| Federal funds sold and securities purchased under agreements to resell |
— | 1 | (1) | (100.0%) | |||||||
| Total interest income |
$ | 75,079 | $ | 92,687 | $ | (17,608) | (19.0%) | ||||
Interest income for the first quarter of 2010 decreased by $17.6 million or 19.0% compared to the first quarter of 2009 primarily due to a decline in interest income from loans of $12.7 million or 16.1%. In addition, interest income from securities held in the trading and available for sale portfolios decreased by $5.3 million for the comparable three month periods ended March 31, 2010 and 2009.
46
Table of Contents
Interest income on loans declined primarily due to the $666 million decrease in the average loan balance. The primary cause of this decrease in loan balances was due to loan sales as discussed in Note 5, “Loan Sales and Transactions” of the Consolidated Financial Statements of this Form 10-Q. An additional reason for the decrease in interest from loans is the growth in nonperforming assets which were $467.3 million at March 31, 2010 compared to $271.1 million at March 31, 2009. The Company is not accruing interest on these loans.
Interest income from securities decreased as a result of selling a majority of the trading securities during the third quarter of 2009 and from sales of securities from the AFS portfolio during the last two quarters. During the first quarter of 2010, $35.1 million of MBS securities and $9.1 million of other types of securities from the AFS securities portfolio were sold and $138.9 million of U.S. Agency AFS securities were called, reducing the balance of AFS securities held. A $4.5 million gain on sale of securities sold during the first quarter of 2010 was realized. At the same time, the interest rate for some of the adjustable rate securities has adjusted lower due to the decrease in long term interest rates.
INTEREST EXPENSE
The following table presents a summary of interest expense for the three month periods ended March 31, 2010 and 2009:
| Three-Months
Ended March 31, | ||||||||||||
| Change | ||||||||||||
| 2010 | 2009 | $ | % | |||||||||
| (dollars in thousands) | ||||||||||||
| Interest expense: |
||||||||||||
| Deposits: |
||||||||||||
| NOW accounts |
$ | 731 | $ | 2,376 | $ | (1,645 | ) | (69.2%) | ||||
| Money market deposit accounts |
603 | 1,989 | (1,386 | ) | (69.7%) | |||||||
| Savings deposits |
537 | 884 | (347 | ) | (39.2%) | |||||||
| Time certificates of deposit |
15,921 | 19,038 | (3,117 | ) | (16.4%) | |||||||
| Total |
17,792 | 24,287 | (6,495 | ) | (26.7%) | |||||||
| Securities sold under agreements to repurchase and federal funds purchased |
2,008 | 3,152 | (1,144 | ) | (36.3%) | |||||||
| Long-term debt and other borrowings: |
||||||||||||
| FHLB advances |
10,746 | 17,077 | (6,331 | ) | (37.1%) | |||||||
| Other borrowings |
268 | 370 | (102 | ) | (27.4%) | |||||||
| Total |
11,014 | 17,447 | (6,433 | ) | (36.9%) | |||||||
| Total interest expense |
$ | 30,814 | $ | 44,886 | $ | (14,072 | ) | (31.3%) | ||||
Interest expense for the first quarter of 2010 decreased by $14.1 million or 31.3% compared to the first quarter of 2009. The decreases related to both deposits and to long term debt and other borrowings. The decrease in interest expense for deposits was mostly attributable to the decrease in interest rates paid on time certificates or CDs as maturing higher rate and promotional CDs have been replaced with lower price balances. The decrease in interest expense for long term debt and other borrowings was mostly attributable to the decrease in average balance of $367.9 million when comparing the three month periods ended March 31, 2010 to March 31, 2009 as the Company prepaid higher interest rate FHLB advances in both the second quarter of 2009 and the first quarter of 2010.
47
Table of Contents
NET INTEREST MARGIN
The following tables present net interest margin for the comparable three month periods:
| For the Three-Months Ended March 31, | ||||||||||||||||||
| 2010 | 2009 | |||||||||||||||||
| Average Balance |
Income | Rate | Average Balance |
Income | Rate | |||||||||||||
| (dollars in thousands) | ||||||||||||||||||
| Assets: |
||||||||||||||||||
| Interest-bearing demand deposits in other financial institutions |
$ | 728,386 | $ | 841 | 0.47 | % | $ | 629,321 | $ | 477 | 0.31 | % | ||||||
| Federal funds sold |
— | — | — | 1,333 | 1 | 0.30 | % | |||||||||||
| Total money market instruments |
728,386 | 841 | 0.47 | % | 630,654 | 478 | 0.31 | % | ||||||||||
| Securities: (1) |
||||||||||||||||||
| Taxable |
826,051 | 5,389 | 2.65 | % | 1,063,367 | 9,961 | 3.80 | % | ||||||||||
| Non-taxable (3) |
242,711 | 3,001 | 5.01 | % | 298,931 | 3,744 | 5.08 | % | ||||||||||
| Total securities |
1,068,762 | 8,390 | 3.19 | % | 1,362,298 | 13,705 | 4.08 | % | ||||||||||
| Loans: (2) |
||||||||||||||||||
| Commercial |
948,211 | 10,243 | 4.38 | % | 1,141,881 | 13,022 | 4.63 | % | ||||||||||
| Real estate-commercial |
2,581,446 | 35,046 | 5.43 | % | 2,862,005 | 41,249 | 5.77 | % | ||||||||||
| Real estate-residential 1-4 family |
966,440 | 13,275 | 5.49 | % | 1,110,879 | 16,218 | 5.84 | % | ||||||||||
| Consumer |
598,461 | 7,284 | 4.94 | % | 645,815 | 8,015 | 5.03 | % | ||||||||||
| Total loans, net |
5,094,558 | 65,848 | 5.19 | % | 5,760,580 | 78,504 | 5.47 | % | ||||||||||
| Total interest-earning assets |
6,891,706 | 75,079 | 4.38 | % | 7,753,532 | 92,687 | 4.81 | % | ||||||||||
| Market value adjustment |
20,750 | 30,917 | ||||||||||||||||
| Total assets from discontinued operations |
399,327 | 1,753,266 | ||||||||||||||||
| Non-interest-earning assets |
414,349 | 805,133 | ||||||||||||||||
| Total assets |
$ | 7,726,132 | $ | 10,342,848 | ||||||||||||||
| Liabilities and shareholders’ equity: |
||||||||||||||||||
| Interest-bearing deposits: |
||||||||||||||||||
| Savings and interest-bearing transaction accounts |
$ | 1,578,827 | 1,871 | 0.48 | % | $ | 2,029,103 | 5,249 | 1.05 | % | ||||||||
| Time certificates of deposit |
2,762,011 | 15,921 | 2.34 | % | 2,838,794 | 19,038 | 2.72 | % | ||||||||||
| Total interest-bearing deposits |
4,340,838 | 17,792 | 1.66 | % | 4,867,897 | 24,287 | 2.02 | % | ||||||||||
| Borrowed funds: |
||||||||||||||||||
| Securities sold under agreements to repurchase and Federal funds purchased |
318,500 | 2,008 | 2.56 | % | 342,699 | 3,152 | 3.73 | % | ||||||||||
| Other borrowings |
1,165,832 | 11,014 | 3.83 | % | 1,521,253 | 17,447 | 4.65 | % | ||||||||||
| Total borrowed funds |
1,484,332 | 13,022 | 3.56 | % | 1,863,952 | 20,599 | 4.48 | % | ||||||||||
| Total interest-bearing liabilities |
5,825,170 | 30,814 | 2.14 | % | 6,731,849 | 44,886 | 2.70 | % | ||||||||||
| Non-interest-bearing demand deposits |
1,033,618 | 907,248 | ||||||||||||||||
| Other liabilities |
102,429 | 119,576 | ||||||||||||||||
| Total liabilities from discontinued operations |
399,327 | 1,753,266 | ||||||||||||||||
| Shareholders’ equity |
365,588 | 830,909 | ||||||||||||||||
| Total liabilities and shareholders’ equity |
$ | 7,726,132 | $ | 10,342,848 | ||||||||||||||
| Net interest income/margin |
$ | 44,265 | 2.60 | % | $ | 47,801 | 2.50 | % | ||||||||||
| (1) | Average securities balances are based on amortized historical cost. The adjustment for the fair value is reported as “Market Value Adjustment.” |
| (2) | Nonaccrual loans are included in loan balances. Interest income includes related fee income. |
| (3) | Because of the Company’s tax position, the yield on tax exempt investments are not reported on a tax equivalent basis. |
48
Table of Contents
NET INTEREST MARGIN – RATE AND VOLUME VARIANCE ANALYSIS
| Three-Months
Ended March 31, 2010 vs. March 31, 2009 |
||||||||||||
| Change due to | ||||||||||||
| Rate | Volume | Total Change | ||||||||||
| (in thousands) | ||||||||||||
| Assets: |
||||||||||||
| Interest-bearing demand deposits in other financial institutions |
$ | 279 | $ | 85 | $ | 364 | ||||||
| Federal funds sold |
— | (1 | ) | (1 | ) | |||||||
| Total money market instruments |
279 | 84 | 363 | |||||||||
| Securities: |
||||||||||||
| Taxable |
(2,631 | ) | (1,941 | ) | (4,572 | ) | ||||||
| Non-taxable |
(51 | ) | (692 | ) | (743 | ) | ||||||
| Total securities |
(2,682 | ) | (2,633 | ) | (5,315 | ) | ||||||
| Loans: |
||||||||||||
| Commercial |
(671 | ) | (2,108 | ) | (2,779 | ) | ||||||
| Real estate—commercial |
(2,329 | ) | (3,874 | ) | (6,203 | ) | ||||||
| Real estate—residential 1-4 family |
(928 | ) | (2,015 | ) | (2,943 | ) | ||||||
| Consumer |
(143 | ) | (588 | ) | (731 | ) | ||||||
| Total loans, net |
(4,071 | ) | (8,585 | ) | (12,656 | ) | ||||||
| Total interest-earning assets |
(6,474 | ) | (11,134 | ) | (17,608 | ) | ||||||
| Liabilities: |
||||||||||||
| Interest-bearing deposits: |
||||||||||||
| Savings and interest-bearing transaction accounts |
(2,398 | ) | (980 | ) | (3,378 | ) | ||||||
| Time certificates of deposit |
(2,611 | ) | (506 | ) | (3,117 | ) | ||||||
| Total interest-bearing deposits |
(5,009 | ) | (1,486 | ) | (6,495 | ) | ||||||
| Borrowed funds: |
||||||||||||
| Securities sold under agreements to repurchase and Federal funds purchased |
(934 | ) | (210 | ) | (1,144 | ) | ||||||
| Other borrowings |
(2,767 | ) | (3,666 | ) | (6,433 | ) | ||||||
| Total borrowed funds |
(3,701 | ) | (3,876 | ) | (7,577 | ) | ||||||
| Total interest-bearing liabilities |
(8,710 | ) | (5,362 | ) | (14,072 | ) | ||||||
| Net interest income |
$ | 2,236 | $ | (5,772 | ) | $ | (3,536 | ) | ||||
While net interest income declined $3.5 million for the first quarter of 2010 compared to the first quarter of 2009, the net interest margin for the three months ended March 31, 2010 increased by 10 basis points to 2.60% from 2.50% for the three months ended March 31, 2009. This occurred because the rate of decrease in net interest income, 7.4% was less than the rate of decrease in earning assets over the last 12 months, 11.1%.
PROVISION FOR LOAN LOSSES
Each quarter, Management determines an estimate of the amount of allowance for loan losses adequate to provide for losses inherent in the Bank’s loan portfolios. The provision for loan losses is determined by the net change in the allowance for loan losses. For a detailed discussion of the calculation of allowance for loan losses, refer to the “Significant Accounting Policies” discussion in Note 1, “Summary of Significant Accounting Policies” in the 2009 Form 10-K and in the MD&A allowance for loan loss discussion of the 2009 Form 10-K and this Form 10-Q beginning on page 52.
Provision for loan losses was $99.9 million for the three month period ended March 31, 2010 compared to $73.5 million for the three month period ended March 31, 2009, an increase of $26.4 million. The increase in the provision for loan losses for the first quarter of 2010 is reflective of the increased net charge offs experienced during the quarter and Management’s judgment that collateral values are not yet recovering and unemployment remains high in California. Net charge-offs were $84.3 million for the quarter compared to $73.4 million in the first quarter of 2009 and $33.2 million in the fourth quarter of 2009. There has also been an increase in nonperforming assets of $30.3 million since December 31, 2009.
49
Table of Contents
In June 2009, we also changed the methodology for estimating the allowance for loan losses needed by decreasing the look-back period over which loan loss information is aggregated to compute an estimate of future losses. This decrease gives more weight to the recent quarters in which loan loss experience has been greater.
NON-INTEREST INCOME
Non-interest income primarily consists of fee income received from servicing deposit relationships, trust and investment advisory fees, realized gains on sale of investment securities and loans and losses on the trading portfolio and gains and losses on the sale or disposal of assets.
The table below summarizes the changes in non-interest income for the comparable quarters:
| Three-Months
Ended March 31, |
|||||||||||||
| Change | |||||||||||||
| 2010 | 2009 | $ | % | ||||||||||
| (dollars in thousands) | |||||||||||||
| Non-interest income: |
|||||||||||||
| Service charges and fees |
$ | 5,739 | $ | 6,039 | $ | (300 | ) | (5.0 | %) | ||||
| Trust and investment advisory fees |
5,408 | 5,546 | (138 | ) | (2.5 | %) | |||||||
| Gain on securities, net |
4,511 | 2,029 | 2,482 | 122.3 | % | ||||||||
| Other |
3,919 | 1,959 | 1,960 | 100.1 | % | ||||||||
| Total non-interest income |
$ | 19,577 | $ | 15,573 | $ | 4,004 | 25.7 | % | |||||
Total non-interest income was $19.6 million for the three months ended March 31, 2010 compared to $15.6 million for the same period in 2009, an increase of $4.0 million or 25.7%. This increase was mostly due to the sale of AFS securities and loans, the latter included within “Other.” As disclosed in the interest income section above, we sold $44.2 million of securities and $69.8 million of loans during the three months ended March 31, 2010. The sale of securities increased the net gain on sale of securities for the comparable period by $2.5 million. The gain on sale of loans was $4.0 million compared to $542,000 for the three month periods ended March 31, 2010 and 2009, respectively. The increase from the gain on sale of loans for the comparable periods of $3.4 million was offset by an unrealized loss of $897,000 during the three months ended March 31, 2010. The unrealized loss from an unmatched customer swap is due to a customer default on a swap with the Bank which caused the corresponding swap between the Bank and a third party to no longer be matched. When this occurs, the market value of the swap is required to be accounted for within the income statement . Additional information regarding this swap is in Note 11, “Other Income” of the Consolidated Financial Statements.
NON-INTEREST EXPENSE
The following table summarizes the changes in non-interest expenses for the comparable quarters:
| Three-Months
Ended March 31, |
|||||||||||||
| Change | |||||||||||||
| 2010 | 2009 | $ | % | ||||||||||
| (dollars in thousands) | |||||||||||||
| Non-interest expense: |
|||||||||||||
| Salaries and employee benefits |
$ | 22,078 | $ | 29,930 | $ | (7,852 | ) | (26.2 | %) | ||||
| Occupancy expense, net |
5,803 | 6,324 | (521 | ) | (8.2 | %) | |||||||
| Other |
23,439 | 23,580 | (141 | ) | (0.6 | %) | |||||||
| Total non-interest expense |
$ | 51,320 | $ | 59,834 | $ | (8,514 | ) | (14.2 | %) | ||||
The Company’s non-interest expenses decreased by $8.5 million for the first quarter of 2010 compared to the first quarter of 2009. The majority of this decrease is from the reduction in salaries and employee benefit expenses which decreased by $7.9 million. The decrease in salary expense is primarily from the reduction in the number of employees due to the layoff of employees over the last twelve months which decreased expenses for the comparable quarters by $5.5 million . The decrease in salary and employee benefits was also attributable to the reduction in benefits provided to the Company’s employees. These reductions consist of a restriction on retiree health insurance coverage, a decrease in the
50
Table of Contents
proportion of the employee’s health insurance benefits contributed by the Company, and the suspension of the 401k employer match beginning on March 1, 2010. The largest of these was the reduction in the benefits provided to retiree health insurance as disclosed in Note 15, “Postretirement Benefits” of the 2009 Form 10-K and in Note 10, “Postretirement Benefits” of the Consolidated Financial Statements of this Form 10-Q.
Other decreases in non-interest expense were net occupancy expenses and other non-interest expense which decreased by $662,000 when comparing the three months ended March 31, 2010 to 2009. The decrease in net occupancy expense is due to the consolidation and vacating premises to assist with reducing the Company’s expenses. Since December 31, 2009, we have vacated and/or consolidated 5 locations.
The benefit of this premises consolidation was offset during the three months ended March 31, 2010 by the recognition of an impairment charge of $1.3 million for five operating leases. The impairment charge, as discussed in Note 12, “Other Expenses” of the Consolidated Financial Statements, relates to the expected sub-lease income being less than the Company’s continued lease obligation on these locations. Several other items contributing to the decrease in other expense are disclosed in Note 12, “Other Expenses” of the Consolidated Financial Statements
Management continues to assess the occupancy needs of the Company and, is in the process of negotiating the vacating of the Company’s executive offices in downtown Santa Barbara. We expect to relocate the employees occupying the executive offices into other offices in the downtown Santa Barbara area by the end of June 2010. In April 2010, we consolidated two branch locations in Buellton and Vandenberg into nearby branches.
PROVISION FOR INCOME TAXES
For the three months ended March 31, 2010, the Company recorded $49,000 of tax expense on a pretax loss of $87.3 million compared to $32.4 million of tax benefit on a pretax loss of $70.0 million for the three months ended March 31, 2009. This $32.4 million increase in tax expense is discussed in Note 7, “Deferred Tax Asset and Tax Provision” of the Consolidated Financial Statements of this Form 10-Q.
DISCONTINUED OPERATIONS
On January 14, 2010, the Company entered into an agreement with SBTPG, whereby SBTPG agreed to purchase the assets of the RAL and RT Programs segment for $10.0 million. The agreement provided for, and the Company received, a payment of $5.0 million at closing and an additional $5.0 million on March 15, 2010. The agreement further stipulated that SBTPG would make an additional cash payment based on the number of RALs processed by SBTPG between January 1, 2010 and April 30, 2010. SBTPG was not able to process RALs during this period and therefore no further payments are anticipated for the sale of the RAL and RT Programs.
The Company sold the RAL and RT Program segment due to recent changes in the regulatory and legislative environments which had significantly altered the Bank’s ability to offer RALs for the 2010 tax season and the value of the segment.
At December 31, 2009, the RAL and RT Programs were reported as part of the Company’s continuing operations since the agreement was not signed until January 14, 2010. Beginning March 31, 2010, the Company reported the RAL and RT Programs as discontinued operations and all prior periods have been restated to reflect the operations from the RAL and RT Programs as discontinued operations. For a summary of the gain on sale and summarized financial statements for the RAL and RT Programs segment refer to Note 8, “Discontinued Operations – RAL and RT Programs” of the Consolidated Financial Statements.
BALANCE SHEET ANALYSIS
CASH AND CASH EQUIVALENTS
The Company’s cash and cash equivalents were $1.13 billion at March 31, 2010, an increase of $205.5 million or 22.2% since December 31, 2009. This increase is mostly attributed to Management retaining excess liquidity to ensure we have the funds required to meet our customer’s needs.
51
Table of Contents
SECURITIES
Available for Sale Securities
At March 31, 2010, the Company held $944.5 million of AFS Securities, a decrease of $209.1 million since December 31, 2009. A majority of this decrease is due to the sale of $44.2 million of MBS and municipal securities and $138.9 million of U.S. Agency securities being called by the issuers during the first quarter of 2010. A gain on the sale of securities of $4.5 million was realized during the three months ended March 31, 2010.
LOAN PORTFOLIO
Loans Held for Sale
Loans held for sale at March 31, 2010 were $26.6 million, an increase of $7.4 million, or 38.6% since December 31, 2009. This increase is mostly due to an increase in commercial real estate loans held for sale which increased by $8.6 million since December 31, 2009. Included in the $26.6 million of loans held for sale are $10.1 million of commercial real estate loans, $9.8 million of residential real estate loans, $3.9 million of SBA loans and $2.8 million of commercial loans . Generally, all residential real estate loans that are originated are included in loans held for sale because the Bank has been trying to reduce the balance sheet to meet the elevated capital ratios required by the OCC while still maintaining customer relationships within the communities we operate in.
Loans Held for Investment
The following table summarizes loans held for investment (“HFI”):
| March 31, | December 31, | Change | |||||||||
| 2010 | 2009 | $ | % | ||||||||
| (dollars in thousands) | |||||||||||
| Real estate: |
|||||||||||
| Residential—1 to 4 family |
$ | 925,564 | $ | 971,725 | $ | (46,161) | (4.8%) | ||||
| Multi-family residential |
274,786 | 275,069 | (283) | (0.1%) | |||||||
| Commercial |
1,874,139 | 1,933,533 | (59,394) | (3.1%) | |||||||
| Construction |
363,477 | 397,281 | (33,804) | (8.5%) | |||||||
| Commercial loans |
861,301 | 977,401 | (116,100) | (11.9%) | |||||||
| Home equity loans |
440,202 | 448,026 | (7,824) | (1.7%) | |||||||
| Consumer loans |
145,719 | 161,698 | (15,979) | (9.9%) | |||||||
| Other |
1,950 | 1,698 | 252 | 14.8% | |||||||
| Total |
$ | 4,887,138 | $ | 5,166,431 | $ | (279,293) | (5.4%) | ||||
Total HFI loans decreased by $279.3 million or 5.4% since December 31, 2009 compared to March 31, 2010. The decrease in loans is mostly due to the lower number of new loans being originated while current loans continue to pay down. In addition, we sold $33.5 million of loans and had net charge-offs of $84.3 million of loans during the first quarter of 2010. The largest decrease in loans is from the commercial loan and commercial real estate loan portfolios. During the first quarter of 2010, $35.9 million of commercial loans and $23.6 million of commercial real estate loans were charged-off and $17.1 million of commercial loans and $1.6 million of commercial real estate loans were sold. The remaining decrease in loans was due to maturing or repaid loans and the reclassification of loans held for sale.
ALLOWANCE FOR LOAN LOSSES
Total ALL was $283.4 million at March 31, 2010, an increase of $10.6 million since December 31, 2009. Management increased the estimate of losses inherent in the loan portfolios because of the increase in nonperforming loans to $416.4 million from $397.8 million at December 31, 2009 and the increase in the amount of net charge-offs in the first quarter. A discussion of nonperforming loans is explained in the section below. The increase in ALL improves the ratio of ALL to total loans to 5.80% at March 31, 2010 from 5.28% at December 31, 2009. The ratio of ALL to total loans has increased during the first quarter of 2010 due to the $279.3 million decrease in the loan portfolio balance while the ALL increased by $10.6 million.
52
Table of Contents
In the second quarter of 2009, in recognition of the continued elevated credit losses and the continued deterioration of the general economic environment, the Company reduced the number of quarters of historical loss rates utilized for estimating future credit losses to the most recent six quarters. This change in methodology is further discussed in our 2009 Form 10-K on pages 58 - 60 and should be read in conjunction with this Form 10-Q. The shortened timeframe in calculating the historical loss rates places more weight on the recent history of increased loan losses during 2009 and in the current quarter of 2010, which resulted in a substantial increase in the allowance over the last 18 months.
A summary of the net charge-offs by loan type by quarter is as follows:
| 2010 | 2009 | |||||||||||||||
| March 31, | December 31, | September 30, | June 30, | March 31, | ||||||||||||
| (in thousands) | ||||||||||||||||
| Real estate | ||||||||||||||||
| Residential—1 to 4 family |
$ | 3,637 | $ | 2,011 | $ | 4,115 | $ | 4,915 | $ | 1,046 | ||||||
| Commercial (1) |
23,555 | 2,400 | (304 | ) | 8,312 | 1,714 | ||||||||||
| Construction |
16,208 | 11,698 | 13,345 | 30,125 | 38,066 | |||||||||||
| Commercial loans |
35,900 | 12,977 | 12,405 | 26,987 | 28,117 | |||||||||||
| Home equity loans |
4,006 | 3,303 | 3,821 | 5,664 | 4,178 | |||||||||||
| Consumer loans (2) |
956 | 836 | 1,723 | 1,052 | 318 | |||||||||||
| Net charge-offs relating to continuing operations |
$ | 84,262 | $ | 33,225 | $ | 35,105 | $ | 77,055 | $ | 73,439 | ||||||
| (1) | Commercial real estate loans include multi-family residential real estate loans |
| (2) | Consumer loans include other loans |
Included in the net charge-offs are the declines in collateral values for non-performing loans which are secured by real estate in accordance with the accounting guidance for impaired loans. During the first quarter of 2010, some of the impaired loans which had been utilizing a discounted cash flow approach in the valuation of impairment in past periods were re-assessed using the underlying collateral values due to the reliance on the collateral for repayment of the loan. This change in methodology increased charge-offs by approximately $14.0 million. In addition, during the first quarter, Management established “A/B” note structures for a number of loans in which a note is restructured into performing and nonperforming portions. The nonperforming portion, or “B” note, is charged-off. The “A” portion remains classified as nonperforming until consistent payment performance has been demonstrated after which it may be reclassified to performing. These restructurings caused additional charge-offs of $18.0 million during the first quarter of 2010. Another factor which impacted the increased charge-offs during the first quarter of 2010 was the charge-off of a large customer relationship which had approximately $10.0 million of unsecured commercial loans with us.
Management continues to view the economy as high risk and remains extremely cautious as it manages the loan portfolio through this economic cycle by maintaining elevated levels of the qualitative factors within the ALL model. During the first three months of 2010, the commercial real estate loan portfolio began to experience higher levels of net charge-offs due to collateral value declines and we have increased the ALL for this weakening portfolio. Despite some investor optimism for the economy to rebound in 2010, we expect there will be ongoing weakness in our loan portfolios due to continued high unemployment and cautious consumer and business spending.
53
Table of Contents
NONPERFORMING ASSETS
The table below summarizes the Company’s non-performing assets and loan quality ratios.
| March 31, 2010 |
December 31, 2009 |
March 31, 2009 | |||||||
| (dollars in thousands) | |||||||||
| Nonaccrual loans: |
|||||||||
| Real estate: |
|||||||||
| Residential—1 to 4 family |
$ | 34,233 | $ | 30,964 | $ | 29,957 | |||
| Commercial (1) |
66,490 | 71,401 | 20,022 | ||||||
| Construction |
127,473 | 104,719 | 121,579 | ||||||
| Commercial loans |
58,069 | 77,548 | 45,349 | ||||||
| Home equity loans |
6,866 | 6,082 | 6,800 | ||||||
| Consumer loans (2) |
478 | 401 | 730 | ||||||
| Total nonaccrual loans |
293,609 | 291,115 | 224,437 | ||||||
| Loans past due 90 days or more on accrual status |
8,831 | 17,532 | 1,855 | ||||||
| Troubled debt restructured loans: |
|||||||||
| Real estate: |
|||||||||
| Residential—1 to 4 family |
26,347 | 16,588 | 3,957 | ||||||
| Commercial (1) |
40,785 | 36,476 | 7,547 | ||||||
| Construction |
1,242 | 19,024 | — | ||||||
| Commercial loans |
43,605 | 16,231 | 23,353 | ||||||
| Home equity loans |
1,667 | 604 | — | ||||||
| Consumer loans (2) |
297 | 206 | — | ||||||
| Total troubled debt restructured loans |
113,943 | 89,129 | 34,857 | ||||||
| Total nonperforming loans |
416,383 | 397,776 | 261,149 | ||||||
| Foreclosed collateral (OREO): |
|||||||||
| Real estate: |
|||||||||
| Residential—1 to 4 family |
7,523 | 6,438 | 1,578 | ||||||
| Commercial (1) |
21,062 | 13,280 | 5,194 | ||||||
| Construction |
20,343 | 18,375 | 2,185 | ||||||
| Commercial loans |
1,302 | 1,047 | 542 | ||||||
| Home equity loans |
709 | 123 | 412 | ||||||
| Total foreclosed collateral |
50,939 | 39,263 | 9,911 | ||||||
| Total nonperforming assets |
$ | 467,322 | $ | 437,039 | $ | 271,060 | |||
| Allowance for loan losses – continuing operations |
$ | 283,412 | $ | 272,852 | $ | 140,985 | |||
| COMPANY RATIOS – continuing operations: |
|||||||||
| Coverage ratio of allowance for loan losses to total loans |
5.80% | 5.28% | 2.48% | ||||||
| Coverage ratio of allowance for loan losses to nonperforming loans |
68.07% | 68.59% | 53.99% | ||||||
| Ratio of nonperforming loans to total loans |
8.52% | 7.70% | 4.59% | ||||||
| Ratio of nonperforming assets to total assets |
6.51% | 5.85% | 3.30% | ||||||
| Ratio of allowance for loan losses to potential problem loans and nonperforming loans |
27.00% | 27.23% | 21.43% | ||||||
| (1) | Commercial real estate loans include multi-family residential real estate loans |
| (2) | Consumer loans include other loans |
54
Table of Contents
Total non-performing loans increased to $416.4 million at March 31, 2010 from $397.8 million at December 31, 2009, an increase of $18.6 million. This increase is mostly attributable to an increase in trouble debt restructured (“TDR”) loans of $24.8 million offset by a decrease in loans past due for 90 days or more on accrual status of $8.7 million. The increase in TDR loans was impacted by large increases in TDRs for commercial loans and residential real estate loans while there was a large decreases in construction loan TDRs. The increase in TDR loans is from a few large commercial loans and an increased number of residential real estate loans which are being restructured to enable borrowers to remain in their homes and repay their loans with terms that decrease their monthly payments.
Foreclosed collateral or other real estate owned (“OREO”) are also included in nonperforming assets, and there was a net increase in these properties of $11.7 million since December 31, 2009.
A summary of the OREO activity for the three months ended March 31, 2010 and March 31, 2009 is as follows:
| Three months ended March 31, | ||||||
| 2010 | 2009 | |||||
| (in thousands) | ||||||
| Beginning balance |
$ | 39,263 | $ | 7,100 | ||
| Additions |
14,505 | 3,481 | ||||
| Sales |
(2,508) | — | ||||
| Valuation allowance |
(321) | (670) | ||||
| Ending balance |
$ | 50,939 | $ | 9,911 | ||
Included in the additions of $14.5 million of OREO during the three months ended March 31, 2010 are $8.2 million of commercial real estate loans, $3.3 million of residential real estate loans and $2.1 million of construction and land loans. During the first quarter of 2010, there were five OREO properties sold for a total of $2.5 million. Of the properties sold, three of the properties were residential real estate which accounted for $2.0 million of the sales during the quarter. The remaining sales of OREO during the first quarter of 2010 were one commercial real estate property and one construction and land loan.
DEPOSITS
The following table summarizes the deposits.
| March
31, 2010 |
December
31, 2009 |
Change | |||||||||
| $ | % | ||||||||||
| (dollars in thousands) | |||||||||||
| Non-interest-bearing deposits |
$ | 1,051,008 | $ | 1,076,916 | $ | (25,908) | -2.4% | ||||
| Interest-bearing deposits: |
|||||||||||
| NOW accounts |
963,770 | 938,336 | 25,434 | 2.7% | |||||||
| Money market deposit accounts |
268,153 | 287,271 | (19,118) | -6.7% | |||||||
| Other savings deposits |
372,132 | 353,712 | 18,420 | 5.2% | |||||||
| Time certificates of $100,000 or more |
1,519,982 | 1,494,203 | 25,779 | 1.7% | |||||||
| Other time deposits |
1,242,916 | 1,223,381 | 19,535 | 1.6% | |||||||
| Total deposits – continuing operations |
$ | 5,417,961 | $ | 5,373,819 | $ | 44,142 | 0.8% | ||||
The Company’s deposits increased by $44.1 million since December 31, 2009 when comparing the balance at March 31, 2010. Despite the losses recognized over the last six quarters, the Company has managed to maintain its deposit levels through incentives provided to branch personnel to retain deposits and by offering some deposit promotions for certain new customer deposits. The incentives and promotions have been part of normal business operations to assist with retaining deposits over the last year, and as indicated by the decrease in salaries and the lower average rate for deposits compared to the same quarter of 2009, the costs in the first quarter of 2010 have been relatively minimal.
LONG-TERM DEBT AND OTHER BORROWINGS
Long-term debt and other borrowings were $1.08 billion at March 31, 2010, a decrease of $234.9 million, or 17.9% since December 31, 2009. This decrease is from the repayment of long-term, high interest FHLB advances of $236.0 million. In order to repay these advances prior to their maturity, an $864,000 prepayment penalty was paid. This penalty is included within other non-interest expense.
55
Table of Contents
CAPITAL RESOURCES
Capital Adequacy Standards
The Company and PCBNA are subject to various regulatory capital requirements administered by the Federal banking agencies. Failure to meet minimum capital requirements as specified by the regulatory framework for prompt corrective action could cause the regulators to initiate certain mandatory or discretionary actions that, if undertaken, could have a direct material effect on the Company’s financial statements. For additional information regarding the Company’s capital refer to Note 19, “Shareholders’ Equity” and Note 20, “Regulatory Capital Requirements” of the Consolidated Financial Statements of the 2009 Form 10-K.
The Company’s and PCBNA’s risk based capital ratios as of March 31, 2010 and December 31, 2009 were as follows:
| Total Capital |
Tier 1 Capital |
Risk Weighted Assets |
Tangible Average Assets |
Total Capital Ratio |
Tier 1 Capital Ratio |
Tier 1 Leverage Ratio | ||||||||||||
| (dollars in thousands) | ||||||||||||||||||
| March 31, 2010 |
||||||||||||||||||
| PCB (consolidated) |
$ | 461,809 | $ | 330,741 | $ | 4,790,842 | $ | 7,704,645 | 9.6% | 6.9% | 4.3% | |||||||
| PCBNA |
483,581 | 352,866 | 4,762,203 | 7,709,969 | 10.2% | 7.4% | 4.6% | |||||||||||
| December 31, 2009 |
||||||||||||||||||
| PCB (consolidated) |
$ | 549,363 | $ | 412,372 | $ | 5,282,952 | $ | 7,716,187 | 10.4% | 7.8% | 5.3% | |||||||
| PCBNA |
561,674 | 425,032 | 5,254,687 | 7,720,560 | 10.7% | 8.1% | 5.5% | |||||||||||
| Minimum capital ratios required by the Consent Order |
12.0% | N/A | 9.0% | |||||||||||||||
| Well-capitalized ratios |
10.0% | 6.0% | 5.0% | |||||||||||||||
| Adequately capital ratios |
8.0% | 4.0% | 4.0% | |||||||||||||||
The minimum capital ratios required to be considered “well capitalized” and “adequately capitalized” under generally applicable regulatory guidelines are included in the table above. As of March 31, 2010, the Company did not meet the minimum level for the Tier 1 leverage ratio and the total risk-based capital ratio required to be considered “well capitalized” under generally applicable regulatory guidelines. PCBNA did not meet the minimum level for the Tier 1 leverage ratio required to be considered “well capitalized”.
In addition, the Consent Order requires that the Bank achieve and thereafter maintain a minimum Tier 1 leverage ratio of 9% and a minimum total risk based capital ratio of 12% by September 8, 2010. If the Bank fails to meet and maintain the higher minimum capital ratios specified in the Consent Order, the Consent Order requires that the Bank submit to the OCC, upon direction of the OCC in its sole discretion, a disposition plan that shall detail the proposal of the board of directors of the Bank to sell, merge or liquidate the Bank, which plan must be adopted and implemented by the board of directors of the Bank immediately upon direction of the OCC. In the event the Bank is required to be sold, merged or liquidated in accordance with such a plan, the Company would likely suffer a complete loss of the value of its ownership interest in the Bank, and the Company subsequently may be exposed to significant claims by its shareholders as well as the FDIC and OCC.
Risk-weighted assets are computed by applying a weighting factor from 0% to 100% to the carrying amount of the assets as reported in the balance sheet and to a portion of off-balance sheet items such as loan commitments and letters of credit. The definitions and weighting factors are all contained in the regulations. However, the capital amounts and classifications are also subject to qualitative judgments by the regulators about components, risk weightings, and other factors.
Additional Capital
The Company must raise additional capital to meet the higher minimum capital levels that PCBNA is obligated to maintain under the Consent Order. As indicated in “Management’s Discussion and Analysis of Financial Condition and Results of Operations—Recent Events,” the Company has entered into the Investment Agreement, pursuant to which Ford will invest, subject to certain conditions, an aggregate of $500 million in cash in the Company through direct purchases of common stock and Convertible Preferred Stock. Should the Investment not be consummated, it is expected that the Company’s capital levels will decline further and it will need to raise more capital to satisfy its regulatory capital requirements. The Company’s ability to raise additional capital depends on conditions in the capital markets, which are outside the Company’s control, and on the Company’s financial performance. Accordingly, the Company cannot be
56
Table of Contents
certain of its ability to raise additional capital on acceptable terms, or at all. If the Company cannot raise additional capital, its results of operations and financial condition could be materially and adversely affected, and it may be subject to further supervisory action. See “Risk Factors—Regulatory Risk” and “Risk Factors—Minimum Capital Ratios.” In addition, if the Company were to raise additional capital through the issuance of additional shares, its stock price could be adversely affected, depending on the terms of any shares it were to issue.
Dividends from the Bank
The principal source of funds from which the Company services its debt and pays its obligations and dividends is the receipt of dividends from the Bank. The availability of dividends from the Bank is limited by various statutes and regulations. As a result Consent Order and Written Agreement, both OCC and FRB approval are required before the Bank can pay dividends to the Company. With the Bank unable to pay dividends to the Company, the Company in turn is not able to service its debt or pay dividends on its outstanding equity securities. It is possible that the Company might also not be able to meet other payment obligations, which would adversely affect its business, financial condition, results of operations and prospects.
Deferral of Interest on Trust Preferred Securities and Suspension of Cash Dividends on Series B Preferred Stock
In the second quarter of 2009, the Company elected to defer regularly scheduled interest payments on its outstanding $69.4 million of junior subordinated notes relating to its trust preferred securities and to suspend cash dividend payments on its Series B Preferred Stock. During the deferral period, interest will continue to accrue on the junior subordinated notes at the stated coupon rate, including the deferred interest, and the Company may not, among other things and with limited exceptions, pay cash dividends on or repurchase its common stock or preferred stock nor make any payment on outstanding debt obligations that rank equally with or are junior to the junior subordinated notes. At March 31, 2010, the Company has accrued but not paid $2.1 million of interest expense for the junior subordinated notes. As a result of the Company’s deferral of interest on the junior subordinated notes, it is likely that the Company will not be able to raise funds through the offering of debt securities until the Company becomes current on those obligations or those obligations are restructured. This deferral may also adversely affect the Company’s ability to obtain debt financing on commercially reasonable terms, or at all. As a result, the Company will likely have greater difficulty in obtaining financing and, thus, will have fewer sources to enhance its capital and liquidity position. In addition, if the Company defers interest payments on the junior subordinated notes for more than 20 consecutive quarters, the Company would be in default under the governing agreements for such notes and the amount due under such agreements would be immediately due and payable.
During the deferral period, cash dividends on the Series B Preferred Stock will accrue and compound on each subsequent payment date, and the Company may not, among other things and with limited exceptions, pay cash dividends on or repurchase its common stock or preferred stock that ranks equally with or is junior to the Series B Preferred Stock. At March 31, 2010, the Company has accrued and unpaid preferred stock dividends of $10.4 million. If the Company misses six quarterly dividend payments on the Series B Preferred Stock, whether or not consecutive, the Treasury will have the right to appoint two directors to the Company’s board of directors until all accrued but unpaid dividends have been paid.
Dividends on Common Stock
In the second quarter of 2009, the Board of Directors elected to suspend the payment of cash dividends on its common stock to preserve capital and liquidity. As a result of the Written Agreement, FRB approval will be required before the Company can resume paying cash dividends on its common stock.
LIQUIDITY
Liquidity is the ability to effectively raise funds on a timely basis to meet cash needs of the Bank’s customers and the Company, whether it be to handle fluctuations in deposits, to provide for customers’ credit needs, or to take advantage of investment opportunities as they are presented in the market place.
57
Table of Contents
The Company’s objective, managed through the Company’s Asset and Liability Committee (“ALCO”), is to ensure adequate liquidity at all times by maintaining adequate liquid assets, the ability to raise deposits and liabilities, and having access to additional funds via the capital markets.
Throughout 2009 and in 2010, maintaining liquidity has been a major focus of the Bank as traditional sources of liquidity were no longer available or significantly changed. As a risk management measure to compensate for this and other potential funding and liquidity changes in the future, Management developed and expanded its use of a twelve month rolling cash position analysis so that changes in liquidity sources and related needs could be identified and addressed well in advance of any issues or shortfalls. At this time, no shortfalls have been identified for the foreseeable future, though results could change depending on industry conditions related to the credit markets and the Company’s own financial condition.
Liquidity Management
The Company manages the adequacy of its liquidity by monitoring and managing its immediate liquidity, intermediate liquidity, and long term liquidity. ALCO monitors and sets policy and related targets to ensure the Company maintains adequate liquidity. The monitoring of liquidity is done over the various time horizons, to avoid over dependence on volatile sources of funding and to provide a diversified set of funding sources. These targets are modified during certain periods to accommodate any liquidity risks the Company may encounter.
Short-term liquidity is the ability to raise funds on an overnight basis. Sources of short-term liquidity include, but are not limited to, Federal funds, FHLB short-term advances, the Federal Reserve Bank Discount Window and repurchase agreements.
Intermediate liquidity is the ability to raise funds during the next few months to meet cash obligations over those next few months. Sources of intermediate liquidity include maturities or sales of securities, term repurchase agreements, brokered CDs and term advances from the FHLB.
Long-term liquidity is the ability to raise funds over the entire planning horizon to meet cash needs anticipated due to strategic balance sheet changes. Long-term liquidity sources include: initiating special programs to increase core deposits in expanded market areas; reducing the size of securities portfolios; taking long-term advances with the FHLB; securitizing or selling loans; and accessing capital markets for the issuance of debt or equity.
Federal funds purchased and overnight repos are used to balance short-term mismatches between cash inflows from deposits, loan repayments, and maturing securities and cash outflows to fund loans, purchase securities and deposit withdrawals.
At March 31, 2010, the Bank had a total facility amount of $1.23 billion at the FHLB and unused borrowing capacity of $324.5 million and $510.6 million of unused borrowing capacity with the FRB. These facilities are not unrestricted commitments, and given the current financial condition of the Bank, Management expects that additional restrictions are likely to be imposed that may limit their use. It is the anticipation of such restrictions that has led the Company to maintain a larger than normal amount of liquid assets on hand.
At March 31, 2010, the Bank had a total of $388.6 million of brokered CDs and $334.0 of Certificate of Deposit Account Registry Service (“CDARs”) CDs. Since that date, Management has taken steps to strengthen the Bank’s liquidity position by purchasing additional brokered CDs and, borrowing additional cash through the lines of credit at the FHLB. These steps have provided additional cash to meet the requirements of the Bank’s customers, to continue to fund loans and, have additional cash on hand for future use. As a result of the capital requirements in the Consent Order and the failure of the Bank at March 31, 2010 to meet the minimum ratios required to be classified as “well capitalized” under generally applicable regulatory guidelines, however, the Bank might not be able to use brokered deposits as a source of funds. A “well capitalized” institution may accept brokered deposits without restriction. An “adequately capitalized” institution must obtain a waiver from the FDIC in order to accept, renew or roll over brokered deposits. In addition, certain interest-rate limits apply to the financial institution’s brokered and solicited deposits. Although an institution could seek permission from the FDIC to accept brokered deposits if it were no longer deemed to be “well capitalized,” the FDIC may deny permission, or may permit the institution to accept fewer brokered deposits than the level considered desirable. If the Bank’s level of deposits were to be reduced, either by the lack of a full brokered deposit waiver or by the interest rate limits on brokered or solicited deposits, Management anticipates that the Bank would reduce its assets and, most likely, curtail its lending activities. Other possible consequences of no longer being deemed to be a “well capitalized” institution include the potential for increases in borrowing costs and terms from the FHLB and other financial institutions and increases in FDIC insurance premiums. Such changes could have a material adverse effect on the Company’s results of operations, financial condition and business.
58
Table of Contents
Liquidity Ratio
As of March 31, 2010, liquid assets, consisting of cash and cash equivalents, unpledged investment securities from the trading and AFS portfolios and loans held for sale, totaled $1.43 billion. The Company’s liquidity ratio, which is the ratio of liquid assets divided by short-term liabilities consisting of demand deposits, repurchase agreements and federal funds purchased, was 46.9% compared to 46.5% at December 31, 2009.
Deferral of Interest on Trust Preferred Securities and Suspension of Cash Dividends on Common Stock and Series B Preferred Stock
As discussed above in the section titled Capital Resources, the Company has elected to defer regularly scheduled interest payments on its outstanding $69.4 million of junior subordinated notes relating to its trust preferred securities and to suspend cash dividend payments on its outstanding common stock and preferred stock.
Credit Ratings
The Company’s liquidity is also impacted by the credit ratings assigned to the Company and the Bank by third party rating agencies. On December 24, 2009, Moody’s downgraded the credit ratings of the Company from Caa1 to C and the long term deposits of the Bank from B1 to B3 with the financial strength rating being under review for a possible downgrade. On December 24, 2009, DBRS downgraded their credit ratings for the Company from B to CCC and the deposits and senior debt of the Bank from BB to B with all ratings remaining under review with negative implications. On February 1, 2010, DBRS downgraded the credit ratings for the Company from CCC to CC and the senior debt of the Bank from B to CCC (high). On March 15, 2010, Moody’s downgraded the credit ratings of the Bank from E+ to E, long-term deposits from B3 to Caa1 and long-term other senior obligations from Caa3 to C. On April 29, 2010, following the announcement of the execution of the Investment Agreement, Moody’s placed the long-term ratings of the Company and the Bank on review for possible upgrade. On April 30, 2010, DBRS placed all ratings under review with negative implications.
These lower credit ratings, and any further ratings downgrades, could make it more difficult for the Company to access the capital markets going forward, as the cost to borrow or raise debt or equity capital could become more expensive. The impact of these downgrades puts further pressure on the Company’s stock price, access to capital, and impedes its access to various liquidity sources. Although the cost of PCBNA’s primary funding sources (deposits and FHLB borrowings) is not influenced directly by PCB and PCBNA credit ratings, no assurance can be given that PCBNA’s credit rating will not have any impact on its access to deposits and FHLB borrowings. Long-term debt ratings also factor into the calculation of deposit insurance premiums, and a reduction in PCBNA’s ratings would increase premiums and expense.
Regulatory Restrictions
PCB is the parent company and sole owner of the Bank, and dividends from the Bank constitute the principal source of income to PCB. However, there are various statutory and regulatory limitations and restrictions on the amount of dividends, if any, that may be paid by the Bank to PCB. For a general discussion on such limitations and restrictions, refer to “Regulation and Supervision, Dividends and Other Transfer of Funds” on page 85 of the 2009 Form 10-K. As a result of the Consent Order, the Bank is required to provide notice and obtain the non-objection of the OCC prior to declaring dividends to PCB. In addition, as a result of the Written Agreement, PCB is required to provide notice and obtain the prior approval of the FRB prior to receiving dividends from the Bank. Any objection by the OCC or FRB to the payment of a proposed dividend from the Bank to PCB could adversely affect PCB’s liquidity. In addition, as a result of the Written Agreement, PCB is required to provide notice and obtain the prior approval of the FRB prior to incurring, increasing or guaranteeing any debt, and prior to making any payments on its outstanding $69.4 million of junior subordinated notes relating to its trust preferred securities. If PCB is unable to make payments on any junior subordinated notes for more than 20 consecutive quarters, PCB would be in default under the governing agreements for such notes and the amounts due under such agreements would be immediately due and payable.
| ITEM 3. | QUANTITATIVE AND QUALITATIVE DISCLOSURES ABOUT MARKET RISK |
The Company cannot operate risk-free and make a profit. Instead, the process of risk definition and assessment allows the Company to select the appropriate level of risk for the anticipated level of reward and then decide on the steps necessary to manage this risk. The key risk factors affecting the Company’s business are addressed in Item 1A, Risk Factors starting on page 15 of the 2009 Form 10-K.
59
Table of Contents
Global capital markets continue to be adversely affected by different economic conditions and the resulting disruption has been particularly acute in the financial sector. The cost and availability of funds may be adversely affected by illiquid credit markets and the demand for the Company’s products and services may decline as the Company’s borrowers and customers experience the continued impact of an economic slowdown and recession. In addition, the severity and duration of these adverse conditions is unknown and may exacerbate the Company’s exposure to credit risk and adversely affect the ability of even more borrowers to perform under the terms of their lending arrangements with the Company. Accordingly the U.S. and international markets and economy may adversely affect the Company’s liquidity, financial condition, results of operations and profitability.
Changes in interest rates can potentially have a significant impact on earnings for a financial institution. The following section of this document will discuss how changes in interest rates impact the Company’s earnings as well as the impact interest rates have on interest income and the value of the Company’s equity.
RATE SENSITIVITY
Economic Value of Equity Simulations and Net Interest Income
The results of the asset liability model indicate how much of the Company’s net interest income and economic value of equity are “at risk” (deviation from the base case) from 2% shocks. This exercise is valuable in identifying risk exposures and in comparing the Company’s interest rate risk profile relative to other financial intermediaries and to its own profile in prior periods.
The economic value of equity (“EVE”) interest rate shock report for March 31, 2010 and 2009 is as follows:
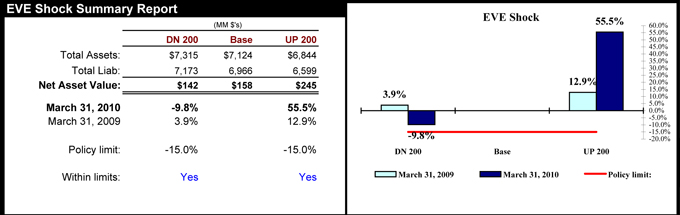
EVE Summary
Assuming the entire yield curve was to instantaneously increase 200 basis points, the Company’s projected EVE at March 31, 2010 would increase by approximately 55.5% from the base. At March 31, 2009 in the up 200 basis point scenario, the Company’s EVE was projected to increase by approximately 13.0% from the base projection. In the down 200 basis point interest rate scenario, there is an assumption that the yield curve instantaneously decreases 200 basis points where possible. When points on the yield curve are currently less than 2 percent, the yield curve is assigned a floor of zero. Using this methodology and assuming the entire yield curve shifts down 200 basis points, the projected EVE at March 31, 2010 is forecasted to decrease by approximately 9.8% from the base. At March 31, 2009, in the down 200 basis point scenario, the Company’s EVE was projected to increase by approximately 3.9% from the base projection.
60
Table of Contents
The net interest income (“NII”) interest rate shock report for the three month periods ended March 31, 2010 and 2009 is as follows:

NII Summary
Assuming the entire yield curve was to instantaneously increase 200 basis points, the projected net interest income for the next twelve periods beginning April 1, 2010 would increase by approximately 26.4% from the base projection. At March 31, 2009 in the up 200 basis point scenario, the Company’s projected net interest income for the twelve month period beginning April 1, 2009 would have increased by approximately 18.4% from the base projection. The rates down 200 basis points scenario assumes the yield curve instantaneously decreases 200 basis points where possible. When the yield curve is less than 2 percent, the yield curve is assigned a floor of zero. Using this methodology and assuming the entire yield curve shifts down 200 basis points, the Company’s projected net interest income for the twelve month period beginning April 1, 2010 would decrease by approximately 14.5%. At March 31, 2009, in the down 200 basis point scenario, the Company’s projected net interest income for the twelve month period beginning April 1, 2009 was projected to decrease by approximately 4.7% from the base projection.
The following have contributed to the change between March 31, 2009 and March 31, 2010 in the responsiveness of the EVE and NII to changes in interest rates:
| n | Elimination of Goodwill; |
| n | increase in allowance for loan loss; |
| n | credit risk premium embedded in effective discount rates. |
The first two items increase the responsiveness of the EVE to changes in interest rates because they eliminate or offset to a larger degree a portion of the Company’s assets that are unresponsive to changes in interest rates. The increased responsiveness from these items is mostly due to the reduction of the denominator (equity) in the EVE calculation as opposed to net asset value change from base.
The responsiveness has also been increased due to relative changes in the duration and changes in the proportion of assets and liabilities that have fixed and variable terms. In general, compared with the balance sheet composition at March 31, 2009: (1) the Company’s assets have a shorter duration and there is a larger proportion of variable rate assets both of which resulted from the sale of loans and securities; (2) the Company’s fixed rate liabilities have a longer duration while the variable rate liabilities have a shorter duration; (3) fixed rate liabilities represent a higher proportion of total liabilities; and (4) the lower interest rate environment lessens the amount of liabilities that can reprice the full 200 basis points in the down 200 scenario.
61
Table of Contents
Because of the extra responsiveness to changes in rates, the projected decrease in the NII points scenario falls outside the Policy limit that specifies that no more than a 10% decrease should result from an immediate drop of 200 basis points in the yield curve. As noted above, some of this extra responsiveness, and therefore this policy exception, is due to the lower net interest income, i.e., the same dollar decline in net interest income represents a larger percentage of a smaller base net interest income amount. Secondly, in this extraordinarily low interest rate environment the likelihood of a significant further decline in interest rates is very low, much less a decline of 200 basis points. Management has considered the risk of this position and is monitoring it, but does not believe that immediate corrective action is required.
Among the assumptions that have been included in the model are those that address optionality.
| n | The option customers have to prepay their loans or the decay rate of non-maturing deposits; |
| n | the option issuers of some of the securities held by the Company have to prepay or call their debt; |
| n | the option of the Company to prepay or call certain types of its debt; |
| n | the option of the Company to reprice its administered deposits; and |
| n | improved incorporation of loan features, including imbedded caps and floors, reset features and other aspects of loan terms and conditions. |
Simulation estimates depend on, and will change with, the size and mix of the actual and projected balance sheet at the time of each simulation. Management is unaware of any material limitations such that results would not reflect the net interest risk exposures of the Company. Various shortcomings are inherent in both the EVE and NII sensitivity analyses. Certain assumptions may not reflect the manner in which actual yields and costs respond to market changes. Similarly, prepayment estimates and similar assumptions are subjective in nature, involve uncertainties and, therefore, cannot be determined with precision. Changes in market interest rates may also affect the Company’s operating environment and operating strategies as well as those of the Company’s competitors. In addition, certain adjustable rate assets have limitations on the magnitude of rate changes over specified periods of time. Accordingly, although the Company’s NII sensitivity analyses may provide an indication of the Company’s interest rate risk exposure, such analyses are not intended to and do not provide a precise forecast of the effect of changes in market interest rates on the Company’s net interest income and the Company’s actual results will differ. There are no material positions, instruments or transactions that are not included in the modeling or included instruments that have special features that are not included.
62
Table of Contents
| ITEM 4. | CONTROLS AND PROCEDURES |
Evaluation of disclosure controls and procedures
Under the supervision and with the participation of our Management, including our Chief Executive Officer and Interim Chief Financial Officer, we conducted an evaluation of our disclosure controls and procedures, as such term is defined under Rules 13a-15(e) and 15d-15(e) under the Securities Exchange Act of 1934 (the “Exchange Act”). Based on this evaluation, our Chief Executive Officer and Interim Chief Financial Officer concluded that, as of the end of the period covered by this report and as a result of the material weakness in our internal controls described below; our disclosure controls and procedures were not effective as of March 31, 2010.
A material weakness is a deficiency, or a combination of deficiencies, in internal control over financial reporting, such that there is a reasonable possibility that a material misstatement of the Company’s annual or interim financial statements will not be prevented or detected on a timely basis. A material weakness was determined to exist as of March 31, 2010 by Management when additional commercial credit-related accounting entries were identified after the Company had publicly reported its unaudited interim financial results for the quarter. These entries had a net impact of $3.1 million in additional loss for the quarter and will result in a restatement of the March 31, 2010 Call Report filed with the FDIC. Management had previously identified certain control deficiencies in the Bank’s credit administration, over the commercial lending activities, including timely identification of charge-offs and loan risk grading accuracy, and documentation of troubled debt restructurings as of December 31, 2009 and concluded such deficiencies, in the aggregate, represented significant deficiencies in internal control over financial reporting. Management concluded the late recording of the material adjustment as of March 31, 2010 and the restatement of the March 31, 2010 Call Report provided evidence that these credit administration related deficiencies, in the aggregate, should be categorized as a material weakness in internal control as of March 31, 2010.
Management is working to remediate deficiencies in our credit controls over commercial lending activities. Programs addressing risk rating accuracy for both performing and problem asset management are being implemented. The programs include new controls and revisions to existing policies, procedures and reports, to assure timely and accurate loan grading. Additionally, line unit personnel have been directed to increase the frequency of financial statement reviews and risk rating analysis. Loan officer and loan manager accountability and reporting have been enhanced to focus on risk rating accuracy. Management is expanding its loan review and oversight program to increase the number and dollar amount of loans reviewed and to review problem loans more frequently to assess and test the accuracy and timeliness of commercial loan risk ratings. These controls need seasoning to ensure they are designed effectively and testing to be performed to ensure they are operating effectively.
Changes in internal control over financial reporting
With the exception of the item described above, there were no other changes in our internal control over financial reporting during the quarter ended March 31, 2010 that have materially affected, or are reasonably likely to materially affect, our internal control over financial reporting. Management believes that these deficiencies can be remediated prior to December 31, 2010.
63
Table of Contents
64
Table of Contents
65
Table of Contents
66
Table of Contents
| ITEM 1. | LEGAL PROCEEDINGS |
Information regarding legal proceedings is incorporated by reference from Note 13, “Commitments and Contingencies” to the Consolidated Financial Statements of this Form 10-Q.
| ITEM 1A. | RISK FACTORS |
The 2009 Form 10-K includes detailed disclosure about the risks faced by the Company’s business. Such risks have not materially changed since December 31, 2009, except as described below:
Regulatory Risk
On May 11, 2010, the Company entered into the Written Agreement with the FRB and the Bank entered into the Consent Order with the OCC. See “Management’s Discussion and Analysis of Financial Condition and Results of Operations—Recent Events” for a detailed discussion of the terms and conditions of the Written Agreement and the Consent Order. Any material failure to comply with the provisions of the Written Agreement or Consent Order could result in additional enforcement actions by the FRB and the OCC, respectively. Possible enforcement actions against the Company and the Bank could include the issuance of additional orders that could be judicially enforced, the issuance of directives to enter into a strategic transaction, whether by merger or otherwise, with a third party, the appointment of a conservator or receiver for the Bank, the termination of insurance of deposits, and the enforcement of such actions through injunctions or restraining orders. If these events occur, the Company would likely suffer a complete loss of the value of its ownership interest in the Bank, and the Company subsequently may be exposed to significant claims by its shareholders as well as the FDIC and OCC.
While the Company and the Bank intend to take such actions as may be necessary to comply with the requirements of the Written Agreement and the Consent Order, there can be no assurance that the Company will be able to comply fully with the provisions of the Written Agreement or that the Bank will be able to comply fully with the provisions of the Consent Order, that compliance with the Written Agreement and the Consent Order will not be more time consuming or more expensive than anticipated, that compliance with the Written Agreement and the Consent Order will enable the Company and the Bank to resume profitable operations, or that efforts to comply with the Written Agreement and the Consent Order will not have adverse effects on the operations and financial condition of the Company or the Bank.
Minimum Capital Ratios
Under the terms of the Consent Order, the Bank must achieve and thereafter maintain a minimum Tier 1 leverage ratio of 9% and a minimum total risk based capital ratio of 12% by September 8, 2010. As of March 31, 2010, the Bank’s Tier 1 leverage ratio was 4.6% and the Bank’s total risk based capital ratio was 10.1%. If the Bank fails to meet and maintain the higher minimum capital ratios specified in the Consent Order, the Consent Order requires that the Bank submit to the OCC, upon direction of the OCC in its sole discretion, a disposition plan that shall detail the proposal of the board of directors of the Bank to sell, merge or liquidate the Bank, which plan must be adopted and implemented by the board of directors of the Bank immediately upon direction of the OCC. In the event the Bank is required to be sold, merged or liquidated in accordance with such a plan, the Company would likely suffer a complete loss of the value of its ownership interest in the Bank, and the Company subsequently may be exposed to significant claims by its shareholders as well as the FDIC and OCC.
Change in Capital Classification
As a result of the capital requirements in the Consent Order and the failure of the Bank at March 31, 2010 to meet the minimum ratios required to be classified as “well capitalized” under generally applicable regulatory guidelines, the Bank might not be able to use brokered deposits as a source of funds. A “well capitalized” institution may accept brokered
67
Table of Contents
deposits without restriction. An “adequately capitalized” institution must obtain a waiver from the FDIC in order to accept, renew or roll over brokered deposits. In addition, certain interest-rate limits apply to the financial institution’s brokered and solicited deposits. Although an institution could seek permission from the FDIC to accept brokered deposits if it were no longer considered to be “well capitalized,” the FDIC may deny permission, or may permit the institution to accept fewer brokered deposits than the level considered desirable. If the Bank’s level of deposits were to be reduced, either by the lack of a full brokered deposit waiver or by the interest rate limits on brokered or solicited deposits, Management anticipates that the Bank would reduce its assets and, most likely, curtail its lending activities. Other possible consequences of no longer being deemed to be a “well capitalized” institution include the potential for increases in borrowing costs and terms from the FHLB and other financial institutions and increases in FDIC insurance premiums. Such changes could have a material adverse effect on the Company’s results of operations, financial condition and business.
Investment and Recapitalization Subject to Conditions
The Investment contemplated by the Investment Agreement is subject to numerous conditions, many of which are outside of our control and might not be fulfilled. Both the Investment and the Recapitalization will be conditioned upon each other and other closing conditions. See “Management’s Discussion and Analysis of Financial Condition and Results of Operations—Recent Events” for a detailed discussion of the terms and conditions of the Investment and the Recapitalization. The Investment Agreement may be terminated in the event that the closing does not occur on or before October 26, 2010; however, we cannot assure you that the Investment and the Recapitalization will close in the near term or at all. If we fail to consummate the Investment and the Recapitalization or otherwise fail to raise sufficient capital, our ability to continue as a going concern would be in doubt and we may file for bankruptcy and/or the Bank may be closed by the OCC and placed into FDIC receivership. Even if we were to consummate the Investment and the Recapitalization, we may need to raise additional capital and there can be no assurance that we would be able to do so in the amounts required and in a timely manner, or at all. Failure to raise sufficient capital could subject us to further regulatory restrictions or penalties.
Dilution Resulting from Investment and Recapitalization
The Investment and the Recapitalization will involve the issuance of a substantial number of shares of our common stock and other securities convertible into common stock. If the Investment and the Recapitalization are completed, current shareholders will have no more than a minimal stake in the Company. As a result of the sale of such a large number of shares of our equity securities, the market price of our common stock could decline.
Even after the completion of the Investment and the Recapitalization, we may decide to raise additional funds through public or private debt or equity financings for a number of reasons, including in response to regulatory or other requirements to meet our liquidity and capital needs, to finance our operations and business strategy or for other reasons. If we raise funds by issuing equity securities or instruments that are convertible into equity securities, the percentage ownership of our existing shareholders will further be reduced, the new equity securities may have rights, preferences and privileges superior to those of our common stock, and the market of our common stock could decline.
Continued Regulatory Scrutiny
Even if we complete the Investment and the Recapitalization, we cannot assure you whether or when the Written Agreement and the Consent Order will be lifted or terminated. Even if they are lifted or terminated in whole or in part, we may still be subject to supervisory enforcement actions that restrict our activities. For additional information, see “Risk Factors—Regulatory Risk.”
Controlling Shareholder
Upon completion of the Investment and Recapitalization, and before accounting for any issuance of stock pursuant to the rights offering, it is expected that Ford will own approximately 91% of our outstanding common stock on an as-converted basis, and will have two representatives on our board of directors. Accordingly, Ford will have a controlling influence over the election of directors to our board and over corporate policy, including decisions to enter into mergers or other extraordinary transactions. In pursuing its economic interests, Ford may make decisions with respect to fundamental corporate transactions which may be different than the decisions of other shareholders.
68
Table of Contents
NASDAQ Corporate Governance Requirements
Our common stock is currently listed on The NASDAQ Global Select Market. NASDAQ generally requires a majority of directors to be independent and requires independent director oversight over the nominating and executive compensation functions. However, under the rules applicable to NASDAQ, if another company owns more than 50% of the voting power of a listed company, that company is considered a “controlled company” and exempt from rules relating to independence of the board of directors and the compensation and nominating committees. If the Investment is completed, we will be a controlled company because Ford will beneficially own more than 50% of our outstanding voting stock. Accordingly, we would be exempt from certain corporate governance requirements and our shareholders may not have all the protections that these rules are intended to provide.
Alternative Proposals
Until such time as the transactions contemplated by the Investment Agreement are consummated or the Investment Agreement is terminated, the Company and the Bank are prohibited from initiating, soliciting, facilitating or encouraging any inquiries or proposals that may lead to a proposal or offer with respect to a merger or other business combination involving the Company or the Bank or the purchase of 10% or more of the total voting power of any class of equity securities of the Company of the Bank or 10% or more of the consolidated total assets of the Company or the Bank with any person other than Ford. In addition, the Company has agreed to pay a termination fee of $20,000,000 to Ford under certain specified circumstances. These provisions could discourage other companies or individuals from trying to acquire or invest in the Company or the Bank even though those other companies or individuals might be willing to offer greater value to the Company’s shareholders than Ford has agreed to pay in the Investment.
Material Weakness in Internal Control Over Financial Reporting
We have identified a material weakness in our internal control over financial reporting as of March 31, 2010. Under applicable standards, a material weakness is a deficiency, or combination of deficiencies, in internal control over financial reporting such that there is a reasonable possibility that a material misstatement of the registrant’s annual or interim financial statements will not be prevented or detected on a timely basis. A discussion of the material weakness identified can be found in “Controls and Procedures,” together with our remediation plan. If we are unable to remediate the identified material weakness or otherwise fail to achieve and maintain an effective system of internal controls over financial reporting, we may be unable to accurately report our financial results, prevent or detect fraud, or provide timely and reliable financial information, which could have a material adverse effect on our business, results of operations or financial condition. Although we believe that the consolidated financial statements included in such periodic reports present fairly, in all material respects, our financial position, results of operations and cash flow for the periods presented in conformity with GAAP, and we are taking the remedial steps described in such reports with respect to the identified material weakness, we cannot assure you that additional material weaknesses in our internal control over financial reporting will not be identified in the future.
| ITEM 2. | UNREGISTERED SALES OF EQUITY SECURITIES AND USE OF PROCEEDS |
None.
| ITEM 3. | DEFAULTS UPON SENIOR SECURITIES |
The Company’s Board of Directors has not declared a dividend on the Company’s Series B Fixed Rate Cumulative Perpetual Preferred Stock since the first quarter of 2009. As of March 31, 2010, unpaid cumulative dividends on the Series B Fixed Rate Cumulative Perpetual Preferred Stock was $10.4 million.
| ITEM 4. | RESERVED |
69
Table of Contents
| ITEM 5. | OTHER INFORMATION |
On May 11, 2010, the Company entered into the Written Agreement with the FRB. The Written Agreement restricts the payment of dividends by the Company, as well as the taking of dividends or any other payment representing a reduction in capital from the Bank, without the prior approval of the FRB. The Written Agreement further requires that the Company not incur, increase, or guarantee any debt, repurchase or redeem any shares of its stock, or pay any interest or principal on subordinated debt or trust preferred securities, in each case without the prior approval of the FRB. The Written Agreement also requires the Company to develop a capital plan for the Company within 90 days, which capital plan shall address, among other things, the Company’s current and future capital requirements, including compliance with the minimum capital ratios, the adequacy of the capital, the source and timing of additional funds, and procedures to notify the FRB no more than 30 days after the end of any quarter in which the Company’s consolidated capital ratios or the Bank’s capital ratios fall below the required minimums. The Company is also required to submit a cash flow projection for the remainder of 2010 to the FRB within 60 days. The Company will also be required to provide notice to the FRB regarding the appointment of any new director or senior executive officer. Finally, the board of directors of the Company is required to submit written progress reports to the FRB within 30 days after the end of each calendar quarter.
Also on May 11, 2010, in cooperation with and at the request of the OCC and pursuant to a Stipulation and Consent to the Issuance of a Consent Order, the Bank voluntarily consented to the issuance of the Consent Order. Under the Consent Order, the Bank agreed, among other things, to the following:
| n | to establish a compliance committee to monitor and coordinate compliance with the Consent Order; |
| n | to develop and implement a three-year strategic plan for the Bank, which shall, among other things, establish objectives for the Bank’s overall risk profile, earnings performance, growth, balance sheet mix, off-balance sheet activities, liability structure, capital adequacy, reduction in the volume of nonperforming assets, product line development, and market segments that the Bank intends to promote or develop, together with strategies to achieve those objectives; |
| n | to achieve and maintain thereafter a total capital at least equal to 12% of risk-weighted assets and Tier 1 capital at least equal to 9% of adjusted total assets (the “Minimum Capital Ratios”) by September 8, 2010; |
| n | to develop and implement a three-year capital plan for the Bank (the “Capital Plan”) that is acceptable to the OCC, which shall, among other things, include specific plans for maintaining adequate capital, a discussion of the sources and timing of capital, as well as contingency plans for alternative sources of capital; |
| n | if the Bank fails to submit an acceptable Capital Plan to the OCC, fails to implement or adhere to a Capital Plan that is acceptable to the OCC, or fails to achieve and maintain the Minimum Capital Ratios by September 8, 2010, to submit to the OCC, upon direction of the OCC in its sole discretion, a disposition plan that shall detail the proposal of the board of directors of the Bank to sell, merge or liquidate the Bank (the “Disposition Plan”), which Disposition Plan must be adopted and implemented by the board of directors of the Bank immediately upon direction of the OCC; |
70
Table of Contents
| n | to not pay a dividend or make a capital distribution without the prior written consent of the OCC; |
| n | to ensure that the Bank has competent management in place on a full-time basis in all executive officer positions to carry out the Bank’s policies, ensure compliance with the Consent Order, ensure compliance with applicable laws, rules and regulations, and manage the day-to-day operations of the Bank in a safe and sound manner; |
| n | to develop and implement a written credit policy and a commercial real estate concentration management program; |
| n | to obtain current and complete credit information and collateral documentation on all loans lacking such information and documentation, and to maintain a list of any credit exceptions and collateral exceptions that have not been corrected within 60 days; |
| n | to develop and implement a written consumer mortgage credit risk program, a retail mortgage loan collections program, a retail mortgage loan loss recognition program, a commercial credit risk ratings program, and an independent loan review program; |
| n | to develop and implement a program to determine whether a loan is impaired and for measuring the amount of the impairment to ensure that the Bank maintains an adequate Allowance for Loan and Lease Losses, consistent with Financial Accounting Standards 114; |
| n | to implement a program for the maintenance of an adequate Allowance for Loan and Lease Losses; |
| n | to develop and implement a program to protect the Bank’s interest in those assets criticized in the more recent and any subsequent Report of Examinations, by any internal or external loan review, or in any list provided to management by the National Bank Examiners during any examination as “doubtful,” substandard,” or “special mention;” |
| n | to adopt and implement an action plan to manage each parcel of Other Real Estate Owned; and |
| n | to take action to maintain adequate sources of stable funding and to review the Bank’s liquidity on a monthly basis. |
Any material failure to comply with the provisions of the Written Agreement or Consent Order could result in enforcement actions by the FRB and the OCC, respectively. Possible enforcement actions against the Company and the Bank could include the issuance of additional orders that could be judicially enforced, the issuance of directives to enter into a strategic transaction, whether by merger or otherwise, with a third party, the appointment of a conservator or receiver for the Bank, the termination of insurance of deposits, and the enforcement of such actions through injunctions or restraining orders. If these events occur, the Company would likely suffer a complete loss of the value of its ownership interest in the Bank, and the Company subsequently may be exposed to significant claims by its shareholders as well as the FDIC and OCC. While the Company and the Bank intend to take such actions as may be necessary to comply with the requirements of the Written Agreement and the Consent Order, there can be no assurance that the Company will be able to comply fully with the provisions of the Written Agreement or that the Bank will be able to comply fully with the provisions of the Consent Order, that compliance with the Written Agreement and the Consent Order will not be more time consuming or more expensive than anticipated, or that compliance with the Written Agreement and the Consent Order will enable the Company and the Bank to resume profitable operations, or that efforts to comply with the Written Agreement and the Consent Order will not have adverse effects on the operations and financial condition of the Company or the Bank.
The foregoing description of the Written Agreement and the Consent Order is qualified in its entirety by reference thereto, a copy of which is attached to this Quarterly Report on Form 10-Q as Exhibit 10.4 and Exhibit 10.5, respectively, and incorporated herein by reference. Also, the Stipulation and Consent to the Consent Order is attached to this Quarterly Report on Form 10-Q as Exhibit 10.6 and is incorporated herein by reference.
71
Table of Contents
| ITEM 6. | EXHIBITS |
| Exhibit |
Description | |||
| 10.1 | Purchase and Sale Agreement dated January 14, 2010, by and among Pacific Capital Bank, N.A., Pacific Capital Bancorp and Santa Barbara Tax Products Group, LLC (1) | |||
| 10.2 | Business Transition Agreement dated January 14, 2010, by and between Pacific Capital Bank, N.A. and Santa Barbara Tax Products Group, LLC (2) | |||
| 10.3 | Employment Agreement dated March 11, 2010, by and among Pacific Capital Bank, N.A., Pacific Capital Bancorp and George S. Leis (3) x | |||
| 10.4 | Written Agreement dated May 11, 2010, by and between Pacific Capital Bancorp and the Federal Reserve Bank of San Francisco * | |||
| 10.5 | Consent Order dated May 11, 2010, issued by the Comptroller of the Currency in the matter of Pacific Capital Bank, National Association * | |||
| 10.6 | Stipulation and Consent to the Issuance of a Consent Order dated May 10, 2010, by and between the Comptroller of the Currency and Pacific Capital Bank, National Association * | |||
| 31. | Certifications pursuant to Section 302 of Sarbanes-Oxley Act of 2002 | |||
| 31.1 | Certification of George S. Leis * | |||
| 31.2 | Certification of Donald Lafler * | |||
| 32. | Certification pursuant to Section 906 of Sarbanes-Oxley Act of 2002 | |||
| 32.1 | Certification of George S. Leis and Donald Lafler * | |||
Shareholders may obtain a copy of any exhibit by writing to:
Carol Zepke, Corporate Secretary
Pacific Capital Bancorp
P.O. Box 60839
Santa Barbara, CA 93160
| * | Filed herewith. |
| x | Indicates management contract or compensatory plan or arrangement |
The Exhibits listed below are incorporated by reference from the specified filing.
| (1) | Filed as Exhibit 10.1 to the Current Report on Form 8-K of Pacific Capital Bancorp filed January 15, 2010. |
| (2) | Filed as Exhibit 10.2 to the Current Report on Form 8-K of Pacific Capital Bancorp filed January 15, 2010. |
| (3) | Filed as Exhibit 10.1 to the Current Report on Form 8-K of Pacific Capital Bancorp filed March 17, 2010. |
72
Table of Contents
Pursuant to the requirements of the Securities Exchange Act of 1934, the Company has duly caused this report to be signed on its behalf by the undersigned thereunto duly authorized:
PACIFIC CAPITAL BANCORP
| /s/ George S. Leis |
May 12, 2010 | |||||
| George S. Leis President and Chief Executive Officer |
||||||
| /s/ Donald Lafler |
May 12, 2010 | |||||
| Donald Lafler Interim Chief Financial Officer |
||||||
73