Attached files
| file | filename |
|---|---|
| 8-K - 8-K - Six Flags Entertainment Corp | a10-7701_18k.htm |
Exhibit 99.1
|
|
Disclaimer Cautionary Statement Regarding Forward-Looking Information: This Presentation may contain “forward-looking statements” within the meaning of the U.S. Private Securities Litigation Reform Act of 1995. Forward-looking statements can be identified by words such as “anticipates,” “intends,” “plans,” “seeks,” “believes,” “estimates,” “expects” and similar references to future periods. Examples of forward-looking statements include, but are not limited to, statements we make regarding the potential restructuring of the Company’s debt and equity securities, the Company's continued viability, the Company's operations and results of operations, the Company's shareholders, and the Company's customers. Forward-looking statements are based on our current expectations and assumptions regarding the Company's business, the economy and other future conditions. Because forward-looking statements relate to the future, by their nature, they are subject to inherent uncertainties, risks and changes in circumstances that are difficult to predict, including, among others, the Company's ability to successfully consummate the proposed restructuring, the Company's financial condition upon the consummation of any restructuring and the Company's success in implementing the Company's business strategy. The Company’s actual results may differ materially from those contemplated by the forward-looking statements. We caution you therefore that you should not rely on any of these forward-looking statements as statements of historical fact or as guarantees or assurances of future performance. Important factors that could cause actual results to differ materially from those in the forward-looking statements include regional, national or global political, economic, business, competitive, market and regulatory conditions and include the following: factors impacting attendance, such as local conditions, contagious diseases, such as swine flu, events, disturbances and terrorist activities; accidents occurring at the Company's parks; adverse weather conditions; competition with other theme parks and other entertainment alternatives; changes in consumer spending patterns; credit market and general economic conditions; pending, threatened or future legal proceedings; and the other factors that are described in “Risk Factors” in the Company's filings and submissions with the U.S. Securities and Exchange Commission (“SEC”), including the Company's most recent Annual Report on Form 10-K for the year ended December 31, 2009 filed with the SEC on March 5, 2010. Any forward-looking statement made by us in this Presentation speaks only as of the date of this Presentation. Factors or events that could cause the Company's actual results to differ may emerge from time to time, and it is not possible for us to predict all of them. Neither Houlihan Lokey nor the Company undertakes any obligation to publicly update any forward-looking statement, whether as a result of new information, future developments or otherwise. THE PROJECTIONS WERE NOT PREPARED WITH A VIEW TOWARD PUBLIC DISCLOSURE OR COMPLIANCE WITH PRACTICES RECOGNIZED TO BE IN ACCORDANCE WITH THE GENERALLY ACCEPTED ACCOUNTING PRINCIPLES, PUBLISHED GUIDELINES OF THE SECURITIES AND EXCHANGE COMMISSION, THE RULES AND REGULATIONS PROMULGATED BY THE SECURITIES AND EXCHANGE COMMISSION REGARDING PROJECTIONS OR THE GUIDELINES ESTABLISHED BY THE AMERICAN INSTITUTE OF CERTIFIED PUBLIC ACCOUNTANTS REGARDING PROJECTIONS OR FORECASTS. FURTHERMORE, THE PROJECTIONS HAVE NOT BEEN AUDITED OR REVIEWED BY INDEPENDENT CERTIFIED ACCOUNTANTS. |
|
|
Disclaimer Non-GAAP Financial Measures The Company uses “Adjusted EBITDA”, “Modified EBITDA” and “Free Cash Flow” to assess the operating results and effectiveness of its business. These terms presented in this Presentation are supplemental measures of performance that are not required by, or recognized as being in accordance with, United States generally accepted accounting principles (“GAAP”). The Company believes that Adjusted EBITDA, Modified EBITDA and Free Cash Flow provide useful information to investors regarding its operating performance and its capacity to incur and service debt and fund capital expenditures. The Company believes that Adjusted EBITDA, Modified EBITDA and Free Cash Flow are used by many investors, analysts and rating agencies as a measure of performance. Adjusted EBITDA, Modified EBITDA and Free Cash Flow are not defined by GAAP and should not be considered in isolation or as alternatives to net income (loss), net income (loss) attributable to Six Flags, Inc., net cash provided by (used in) operating, investing and financing activities or any other financial data prepared in accordance with GAAP or as an indicator of its operating performance. Adjusted EBITDA, Modified EBITDA and Free Cash Flow as defined in this Presentation may differ from similarly titled measures presented by other companies. This information should be read in conjunction with the consolidated statements of operations and statements of cash flows contained in the Company’s Consolidated Financial Statements, which are included in its filings with the SEC, including its most recent Annual Report on Form 10-K for the year ended December 31, 2009. Adjusted EBITDA is defined as net income (loss) attributable to Six Flags, Inc. before cumulative effect of changes in accounting principles, discontinued operations, income tax expense (benefit), other expense, early repurchase of debt (formerly an extraordinary loss), equity in operations of partnerships, net income (loss) attributable to non controlling interests, interest expense (net), amortization, depreciation, stock-based compensation, gain (loss) on disposal of assets, interests of third parties in the Adjusted EBITDA of four parks that are less than wholly owned (consisting of Six Flags Over Georgia, Six Flags Over Texas, Six Flags White Water Atlanta, and Six Flags Discovery Kingdom (formerly Six Flags Marine World, the minority interest in which we purchased in July 2007), plus the Company’s interest in the Adjusted EBITDA of Six Flags Great Escape Lodge & Indoor Waterpark (“HWP”) and dick clark productions, inc (“dcp”). Modified EBITDA is defined as Adjusted EBITDA plus the interests of third parties in the Adjusted EBITDA of the four parks that are less than wholly owned less the Company's interest in the Adjusted EBITDA of Six Flags Great Escape Lodge & Indoor Waterpark and dcp. Free Cash Flow is defined as Adjusted EBITDA excluding (i) cash interest expense (net) and debt issuance costs, dividends and taxes paid in cash and (ii) capital expenditures, net of property insurance recoveries. In the analyses included herein, Modified EBITDA, Adjusted EBITDA and Free Cash Flow all exclude the costs of the change in corporate management that occurred in December 2005 (approximately $13.9 million recognized as expense in 2006). Cash Operating Expenses are operating expenses excluding depreciation, amortization, deferred and non-cash stock-based compensation, and gain/loss on disposal of assets. Adjusted EBITDA, Modified EBITDA and Free Cash Flow have important limitations as analytical tools and you should not consider them in isolation or as substitutes for analysis of the Company’s results as reported under GAAP. For example, Adjusted EBITDA: excludes certain tax payments that may represent a reduction in cash available; does not reflect any cash capital expenditure requirements for assets being depreciated and amortized that may have to be replaced in the future does not reflect significant interest expense, or cash requirements necessary to service interest or principal payments on the Company’s debts. Additionally, Adjusted EBITDA, Modified EBITDA and Free Cash Flow do not reflect changes in or cash requirements for working capital. Certain of these items can represent a reduction of cash that could be used for other corporate purposes. Because of these limitations investors should rely primarily on the Company’s GAAP results and use Adjusted EBITDA, Modified EBITDA and Free Cash Flow only as supplemental information. See Page 60 of Exhibit 99.1 of the Company’s Current Report on Form 8-K filed with the SEC on January 7, 2010 for a reconciliation of Modified EBITDA, Adjusted EBITDA and Free Cash Flow with net income (loss) attributable to Six Flags, Inc. |
|
|
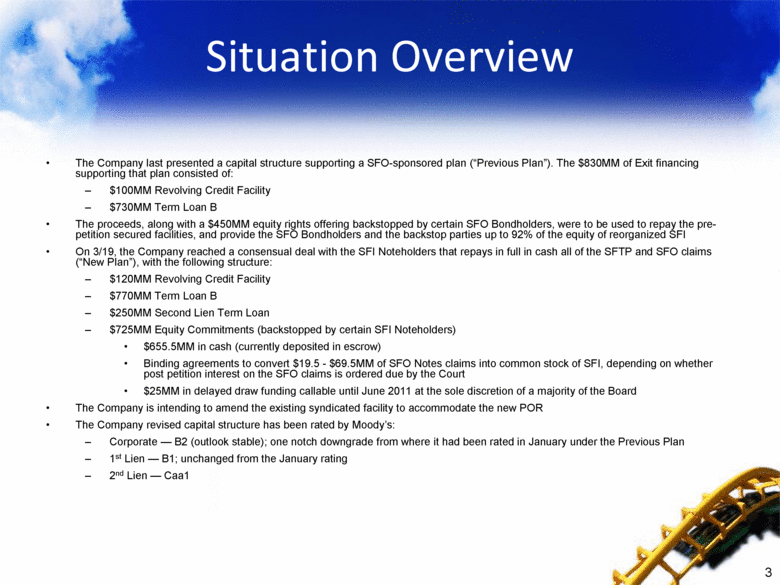
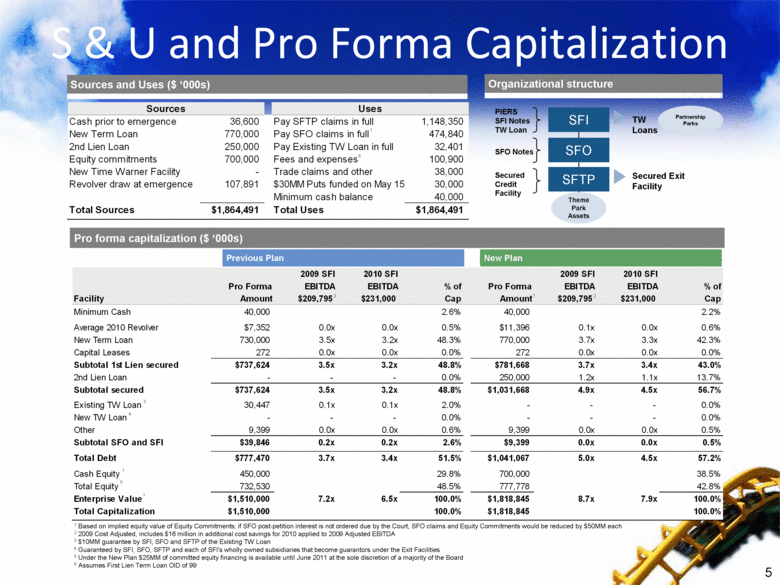
Situation Overview The Company last presented a capital structure supporting a SFO-sponsored plan (“Previous Plan”). The $830MM of Exit financing supporting that plan consisted of: $100MM Revolving Credit Facility $730MM Term Loan B The proceeds, along with a $450MM equity rights offering backstopped by certain SFO Bondholders, were to be used to repay the pre-petition secured facilities, and provide the SFO Bondholders and the backstop parties up to 92% of the equity of reorganized SFI On 3/19, the Company reached a consensual deal with the SFI Noteholders that repays in full in cash all of the SFTP and SFO claims (“New Plan”), with the following structure: $120MM Revolving Credit Facility $770MM Term Loan B $250MM Second Lien Term Loan $725MM Equity Commitments (backstopped by certain SFI Noteholders) $655.5MM in cash (currently deposited in escrow) Binding agreements to convert $19.5 - $69.5MM of SFO Notes claims into common stock of SFI, depending on whether post petition interest on the SFO claims is ordered due by the Court $25MM in delayed draw funding callable until June 2011 at the sole discretion of a majority of the Board The Company is intending to amend the existing syndicated facility to accommodate the new POR The Company revised capital structure has been rated by Moody’s: Corporate — B2 (outlook stable); one notch downgrade from where it had been rated in January under the Previous Plan 1st Lien — B1; unchanged from the January rating 2nd Lien — Caa1 |
|
|
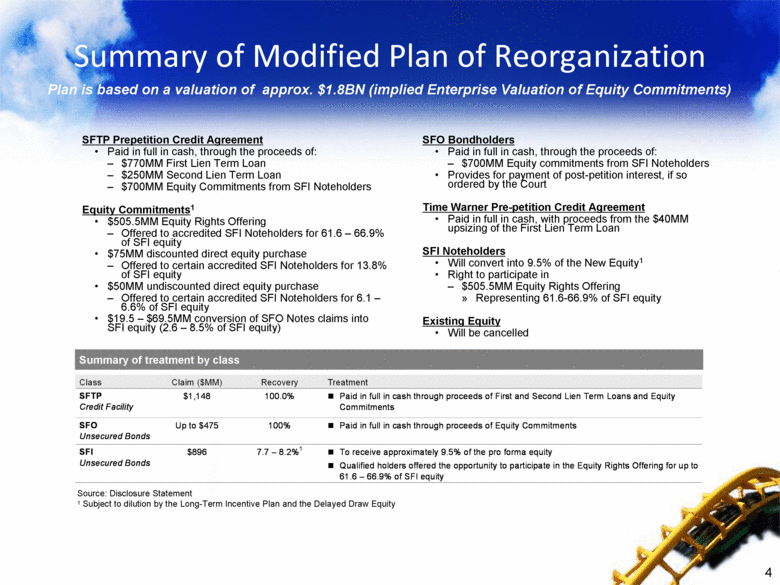
Summary of Modified Plan of Reorganization Summary of treatment by class Source: Disclosure Statement 1 Subject to dilution by the Long-Term Incentive Plan and the Delayed Draw Equity SFTP Prepetition Credit Agreement Paid in full in cash, through the proceeds of: $770MM First Lien Term Loan $250MM Second Lien Term Loan $700MM Equity Commitments from SFI Noteholders Equity Commitments1 $505.5MM Equity Rights Offering Offered to accredited SFI Noteholders for 61.6 – 66.9% of SFI equity $75MM discounted direct equity purchase Offered to certain accredited SFI Noteholders for 13.8% of SFI equity $50MM undiscounted direct equity purchase Offered to certain accredited SFI Noteholders for 6.1 – 6.6% of SFI equity $19.5 – $69.5MM conversion of SFO Notes claims into SFI equity (2.6 – 8.5% of SFI equity) SFO Bondholders Paid in full in cash, through the proceeds of: $700MM Equity commitments from SFI Noteholders Provides for payment of post-petition interest, if so ordered by the Court Time Warner Pre-petition Credit Agreement Paid in full in cash, with proceeds from the $40MM upsizing of the First Lien Term Loan SFI Noteholders Will convert into 9.5% of the New Equity1 Right to participate in $505.5MM Equity Rights Offering Representing 61.6-66.9% of SFI equity Existing Equity Will be cancelled Plan is based on a valuation of approx. $1.8BN (implied Enterprise Valuation of Equity Commitments) Class Claim ($MM) Recovery Treatment SFTP Credit Facility $1,148 100.0% Paid in full in cash through proceeds of First and Second Lien Term Loans and Equity Commitments SFO Unsecured Bonds Up to $475 100% Paid in full in cash through proceeds of Equity Commitments SFI Unsecured Bonds $896 7.7 – 8.2%1 To receive approximately 9.5% of the pro forma equity Qualified holders offered the opportunity to participate in the Equity Rights Offering for up to 61.6 – 66.9% of SFI equity |
|
|
Pro forma capitalization ($ ‘000s) New Plan Previous Plan S & U and Pro Forma Capitalization SFI SFO SFTP Theme Park Assets PIERS SFI Notes TW Loan SFO Notes Secured Credit Facility TW Loans Secured Exit Facility Partnership Parks Sources and Uses ($ ‘000s) Organizational structure 1 Based on implied equity value of Equity Commitments; if SFO post-petition interest is not ordered due by the Court, SFO claims and Equity Commitments would be reduced by $50MM each 2 2009 Cost Adjusted, includes $16 million in additional cost savings for 2010 applied to 2009 Adjusted EBITDA 3 $10MM guarantee by SFI, SFO and SFTP of the Existing TW Loan 4 Guaranteed by SFI, SFO, SFTP and each of SFI's wholly owned subsidiaries that become guarantors under the Exit Facilities 5 Under the New Plan $25MM of committed equity financing is available until June 2011 at the sole discretion of a majority of the Board 6 Assumes First Lien Term Loan OID of 99 1 1 3 4 2 2 5 1 1 6 2009 SFI 2010 SFI 2009 SFI 2010 SFI Pro Forma EBITDA EBITDA % of Pro Forma EBITDA EBITDA % of Facility Amount $209,795 $231,000 Cap Amount $209,795 $231,000 Cap Minimum Cash 40,000 2.6% 40,000 2.2% Average 2010 Revolver $7,352 0.0x 0.0x 0.5% $11,396 0.1x 0.0x 0.6% New Term Loan 730,000 3.5x 3.2x 48.3% 770,000 3.7x 3.3x 42.3% Capital Leases 272 0.0x 0.0x 0.0% 272 0.0x 0.0x 0.0% Subtotal 1st Lien secured $737,624 3.5x 3.2x 48.8% $781,668 3.7x 3.4x 43.0% 2nd Lien Loan - - - 0.0% 250,000 1.2x 1.1x 13.7% Subtotal secured $737,624 3.5x 3.2x 48.8% $1,031,668 4.9x 4.5x 56.7% Existing TW Loan 30,447 0.1x 0.1x 2.0% - - - 0.0% New TW Loan - - - 0.0% - - - 0.0% Other 9,399 0.0x 0.0x 0.6% 9,399 0.0x 0.0x 0.5% Subtotal SFO and SFI $39,846 0.2x 0.2x 2.6% $9,399 0.0x 0.0x 0.5% - - - - Total Debt $777,470 3.7x 3.4x 51.5% $1,041,067 5.0x 4.5x 57.2% Cash Equity 450,000 29.8% 700,000 38.5% Total Equity 732,530 48.5% 777,778 42.8% Enterprise Value $1,510,000 7.2x 6.5x 100.0% $1,818,845 8.7x 7.9x 100.0% Total Capitalization $1,510,000 100.0% $1,818,845 100.0% Sources Uses Cash prior to emergence 36,600 Pay SFTP claims in full 1,148,350 New Term Loan 770,000 Pay SFO claims in full 474,840 2nd Lien Loan 250,000 Pay Existing TW Loan in full 32,401 Equity commitments 700,000 Fees and expenses 100,900 New Time Warner Facility - Trade claims and other 38,000 Revolver draw at emergence 107,891 $30MM Puts funded on May 15 30,000 Minimum cash balance 40,000 Total Sources $1,864,491 Total Uses $1,864,491 |
|
|
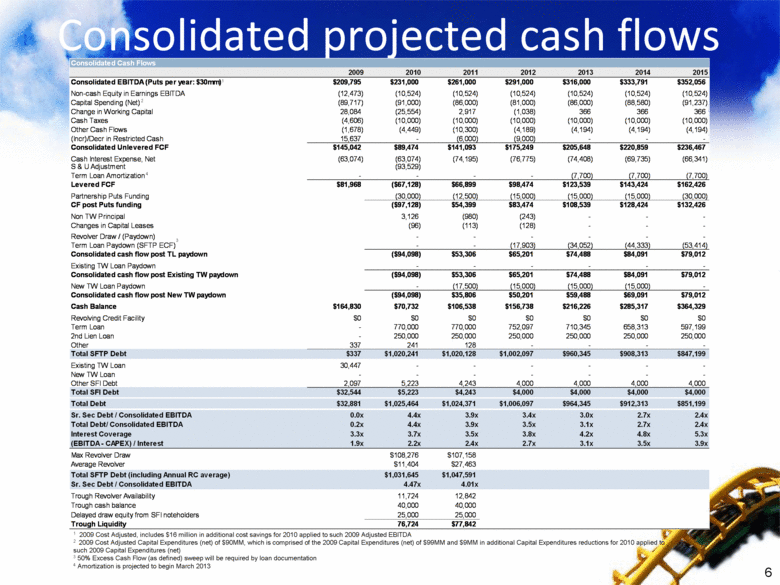
Consolidated projected cash flows 1 2 3 4 1 2009 Cost Adjusted, includes $16 million in additional cost savings for 2010 applied to such 2009 Adjusted EBITDA 2 2009 Cost Adjusted Capital Expenditures (net) of $90MM, which is comprised of the 2009 Capital Expenditures (net) of $99MM and $9MM in additional Capital Expenditures reductions for 2010 applied to such 2009 Capital Expenditures (net) 3 50% Excess Cash Flow (as defined) sweep will be required by loan documentation 4 Amortization is projected to begin March 2013 Consolidated Cash Flows 2009 2010 2011 2012 2013 2014 2015 Consolidated EBITDA (Puts per year: $30mm) $209,795 $231,000 $261,000 $291,000 $316,000 $333,791 $352,056 Non-cash Equity in Earnings EBITDA (12,473) (10,524) (10,524) (10,524) (10,524) (10,524) (10,524) Capital Spending (Net) (89,717) (91,000) (86,000) (81,000) (86,000) (88,580) (91,237) Change in Working Capital 28,084 (25,554) 2,917 (1,038) 366 366 366 Cash Taxes (4,606) (10,000) (10,000) (10,000) (10,000) (10,000) (10,000) Other Cash Flows (1,678) (4,449) (10,300) (4,189) (4,194) (4,194) (4,194) (Incr)/Decr in Restricted Cash 15,637 - (6,000) (9,000) - - - Consolidated Unlevered FCF $145,042 $89,474 $141,093 $175,249 $205,648 $220,859 $236,467 Cash Interest Expense, Net (63,074) (63,074) (74,195) (76,775) (74,408) (69,735) (66,341) S & U Adjustment (93,529) Term Loan Amortization - - - - (7,700) (7,700) (7,700) Levered FCF $81,968 ($67,128) $66,899 $98,474 $123,539 $143,424 $162,426 Partnership Puts Funding (30,000) (12,500) (15,000) (15,000) (15,000) (30,000) CF post Puts funding ($97,128) $54,399 $83,474 $108,539 $128,424 $132,426 Non TW Principal 3,126 (980) (243) - - - Changes in Capital Leases (96) (113) (128) - - - Revolver Draw / (Paydown) - - - - - - Term Loan Paydown (SFTP ECF) - - (17,903) (34,052) (44,333) (53,414) Consolidated cash flow post TL paydown ($94,098) $53,306 $65,201 $74,488 $84,091 $79,012 Existing TW Loan Paydown - - - - - - Consolidated cash flow post Existing TW paydown ($94,098) $53,306 $65,201 $74,488 $84,091 $79,012 New TW Loan Paydown - (17,500) (15,000) (15,000) (15,000) - Consolidated cash flow post New TW paydown ($94,098) $35,806 $50,201 $59,488 $69,091 $79,012 Cash Balance $164,830 $70,732 $106,538 $156,738 $216,226 $285,317 $364,329 Revolving Credit Facility $0 $0 $0 $0 $0 $0 $0 Term Loan - 770,000 770,000 752,097 710,345 658,313 597,199 2nd Lien Loan - 250,000 250,000 250,000 250,000 250,000 250,000 Other 337 241 128 - - - - Total SFTP Debt $337 $1,020,241 $1,020,128 $1,002,097 $960,345 $908,313 $847,199 Existing TW Loan 30,447 - - - - - - New TW Loan - - - - - - - Other SFI Debt 2,097 5,223 4,243 4,000 4,000 4,000 4,000 Total SFI Debt $32,544 $5,223 $4,243 $4,000 $4,000 $4,000 $4,000 Total Debt $32,881 $1,025,464 $1,024,371 $1,006,097 $964,345 $912,313 $851,199 Sr. Sec Debt / Consolidated EBITDA 0.0x 4.4x 3.9x 3.4x 3.0x 2.7x 2.4x Total Debt/ Consolidated EBITDA 0.2x 4.4x 3.9x 3.5x 3.1x 2.7x 2.4x Interest Coverage 3.3x 3.7x 3.5x 3.8x 4.2x 4.8x 5.3x (EBITDA - CAPEX) / Interest 1.9x 2.2x 2.4x 2.7x 3.1x 3.5x 3.9x Max Revolver Draw $108,276 $107,158 Average Revolver $11,404 $27,463 Total SFTP Debt (including Annual RC average) $1,031,645 $1,047,591 Sr. Sec Debt / Consolidated EBITDA 4.47x 4.01x Trough Revolver Availability 11,724 12,842 Trough cash balance 40,000 40,000 Delayed draw equity from SFI noteholders 25,000 25,000 Trough Liquidity 76,724 $77,842 |
|
|
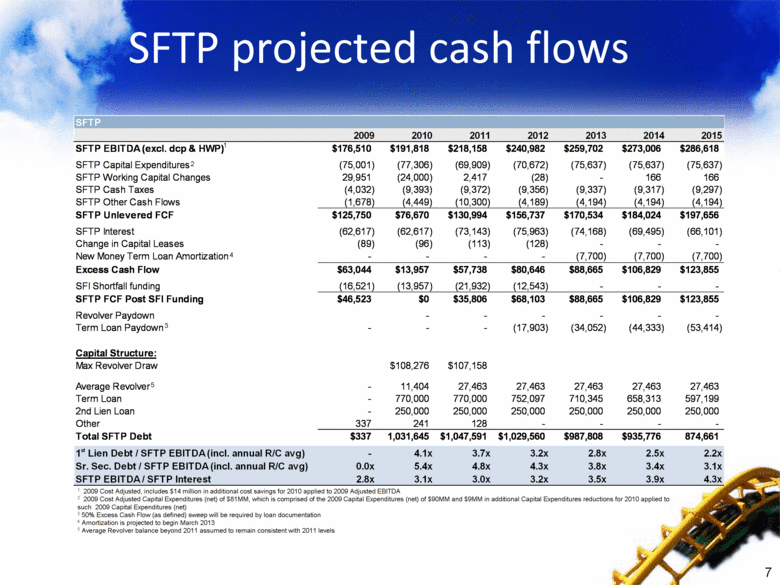
SFTP projected cash flows 1 2009 Cost Adjusted, includes $14 million in additional cost savings for 2010 applied to 2009 Adjusted EBITDA 2 2009 Cost Adjusted Capital Expenditures (net) of $81MM, which is comprised of the 2009 Capital Expenditures (net) of $90MM and $9MM in additional Capital Expenditures reductions for 2010 applied to such 2009 Capital Expenditures (net) 3 50% Excess Cash Flow (as defined) sweep will be required by loan documentation 4 Amortization is projected to begin March 2013 5 Average Revolver balance beyond 2011 assumed to remain consistent with 2011 levels 1 2 3 4 5 SFTP 2009 2010 2011 2012 2013 2014 2015 SFTP EBITDA (excl. dcp & HWP) $176,510 $191,818 $218,158 $240,982 $259,702 $273,006 $286,618 SFTP Capital Expenditures (75,001) (77,306) (69,909) (70,672) (75,637) (75,637) (75,637) SFTP Working Capital Changes 29,951 (24,000) 2,417 (28) - 166 166 SFTP Cash Taxes (4,032) (9,393) (9,372) (9,356) (9,337) (9,317) (9,297) SFTP Other Cash Flows (1,678) (4,449) (10,300) (4,189) (4,194) (4,194) (4,194) SFTP Unlevered FCF $125,750 $76,670 $130,994 $156,737 $170,534 $184,024 $197,656 SFTP Interest (62,617) (62,617) (73,143) (75,963) (74,168) (69,495) (66,101) Change in Capital Leases (89) (96) (113) (128) - - - New Money Term Loan Amortization - - - - (7,700) (7,700) (7,700) Excess Cash Flow $63,044 $13,957 $57,738 $80,646 $88,665 $106,829 $123,855 SFI Shortfall funding (16,521) (13,957) (21,932) (12,543) - - - SFTP FCF Post SFI Funding $46,523 $0 $35,806 $68,103 $88,665 $106,829 $123,855 Revolver Paydown - - - - - - Term Loan Paydown - - - (17,903) (34,052) (44,333) (53,414) Capital Structure: Max Revolver Draw $108,276 $107,158 Average Revolver - 11,404 27,463 27,463 27,463 27,463 27,463 Term Loan - 770,000 770,000 752,097 710,345 658,313 597,199 2nd Lien Loan - 250,000 250,000 250,000 250,000 250,000 250,000 Other 337 241 128 - - - - Total SFTP Debt $337 1,031,645 $1,047,591 $1,029,560 $987,808 $935,776 874,661 1 st Lien Debt / SFTP EBITDA (incl. annual R/C avg) - 4.1x 3.7x 3.2x 2.8x 2.5x 2.2x Sr. Sec. Debt / SFTP EBITDA (incl. annual R/C avg) 0.0x 5.4x 4.8x 4.3x 3.8x 3.4x 3.1x SFTP EBITDA / SFTP Interest 2.8x 3.1x 3.0x 3.2x 3.5x 3.9x 4.3x |
|
|
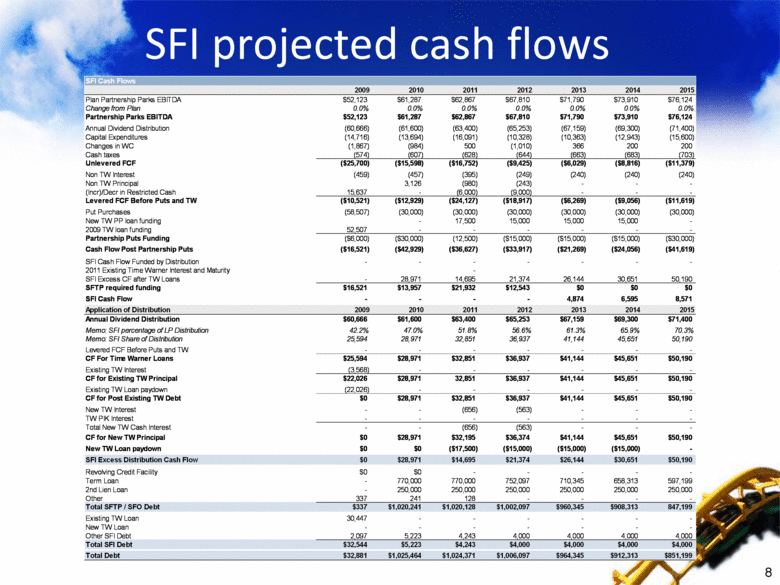
SFI projected cash flows SFI Cash Flows 2009 2010 2011 2012 2013 2014 2015 Plan Partnership Parks EBITDA $52,123 $61,287 $62,867 $67,810 $71,790 $73,910 $76,124 Change from Plan 0.0% 0.0% 0.0% 0.0% 0.0% 0.0% 0.0% Partnership Parks EBITDA $52,123 $61,287 $62,867 $67,810 $71,790 $73,910 $76,124 Annual Dividend Distribution (60,666) (61,600) (63,400) (65,253) (67,159) (69,300) (71,400) Capital Expenditures (14,716) (13,694) (16,091) (10,328) (10,363) (12,943) (15,600) Changes in WC (1,867) (984) 500 (1,010) 366 200 200 Cash taxes (574) (607) (628) (644) (663) (683) (703) Unlevered FCF ($25,700) ($15,598) ($16,752) ($9,425) ($6,029) ($8,816) ($11,379) Non TW Interest (459) (457) (395) (249) (240) (240) (240) Non TW Principal 3,126 (980) (243) - - - (Incr)/Decr in Restricted Cash 15,637 - (6,000) (9,000) - - - Levered FCF Before Puts and TW ($10,521) ($12,929) ($24,127) ($18,917) ($6,269) ($9,056) ($11,619) Put Purchases (58,507) (30,000) (30,000) (30,000) (30,000) (30,000) (30,000) New TW PP loan funding - 17,500 15,000 15,000 15,000 - 2009 TW loan funding 52,507 - - - - - - Partnership Puts Funding ($6,000) ($30,000) (12,500) ($15,000) ($15,000) ($15,000) ($30,000) Cash Flow Post Partnership Puts ($16,521) ($42,929) ($36,627) ($33,917) ($21,269) ($24,056) ($41,619) SFI Cash Flow Funded by Distribution - - - - - - - 2011 Existing Time Warner Interest and Maturity - SFI Excess CF after TW Loans - 28,971 14,695 21,374 26,144 30,651 50,190 SFTP required funding $16,521 $13,957 $21,932 $12,543 $0 $0 $0 SFI Cash Flow - - - - 4,874 6,595 8,571 Application of Distribution 2009 2010 2011 2012 2013 2014 2015 Annual Dividend Distribution $60,666 $61,600 $63,400 $65,253 $67,159 $69,300 $71,400 Memo: SFI percentage of LP Distribution 42.2% 47.0% 51.8% 56.6% 61.3% 65.9% 70.3% Memo: SFI Share of Distribution 25,594 28,971 32,851 36,937 41,144 45,651 50,190 Levered FCF Before Puts and TW - - - - - - - CF For Time Warner Loans $25,594 $28,971 $32,851 $36,937 $41,144 $45,651 $50,190 Existing TW Interest (3,568) - - - - - - CF for Existing TW Principal $22,026 $28,971 32,851 $36,937 $41,144 $45,651 $50,190 Existing TW Loan paydown (22,026) - - - - - - CF for Post Existing TW Debt $0 $28,971 $32,851 $36,937 $41,144 $45,651 $50,190 New TW Interest - - (656) (563) - - - TW PIK Interest - - - - - - - Total New TW Cash Interest - - (656) (563) - - - CF for New TW Principal $0 $28,971 $32,195 $36,374 $41,144 $45,651 $50,190 New TW Loan paydown $0 $0 ($17,500) ($15,000) ($15,000) ($15,000) - SFI Excess Distribution Cash Flow $0 $28,971 $14,695 $21,374 $26,144 $30,651 $50,190 Revolving Credit Facility $0 $0 - - - - - Term Loan - 770,000 770,000 752,097 710,345 658,313 597,199 2nd Lien Loan - 250,000 250,000 250,000 250,000 250,000 250,000 Other 337 241 128 - - - - Total SFTP / SFO Debt $337 $1,020,241 $1,020,128 $1,002,097 $960,345 $908,313 847,199 Existing TW Loan 30,447 - - - - - - New TW Loan - - - - - - - Other SFI Debt 2,097 5,223 4,243 4,000 4,000 4,000 4,000 Total SFI Debt $32,544 $5,223 $4,243 $4,000 $4,000 $4,000 $4,000 Total Debt $32,881 $1,025,464 $1,024,371 $1,006,097 $964,345 $912,313 $851,199 |
|
|
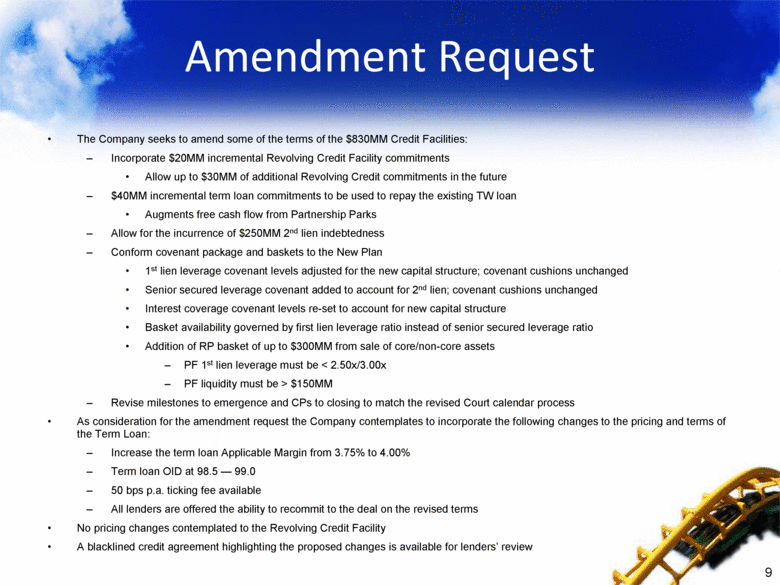
Amendment Request The Company seeks to amend some of the terms of the $830MM Credit Facilities: Incorporate $20MM incremental Revolving Credit Facility commitments Allow up to $30MM of additional Revolving Credit commitments in the future $40MM incremental term loan commitments to be used to repay the existing TW loan Augments free cash flow from Partnership Parks Allow for the incurrence of $250MM 2nd lien indebtedness Conform covenant package and baskets to the New Plan 1st lien leverage covenant levels adjusted for the new capital structure; covenant cushions unchanged Senior secured leverage covenant added to account for 2nd lien; covenant cushions unchanged Interest coverage covenant levels re-set to account for new capital structure Basket availability governed by first lien leverage ratio instead of senior secured leverage ratio Addition of RP basket of up to $300MM from sale of core/non-core assets PF 1st lien leverage must be < 2.50x/3.00x PF liquidity must be > $150MM Revise milestones to emergence and CPs to closing to match the revised Court calendar process As consideration for the amendment request the Company contemplates to incorporate the following changes to the pricing and terms of the Term Loan: Increase the term loan Applicable Margin from 3.75% to 4.00% Term loan OID at 98.5 — 99.0 50 bps p.a. ticking fee available All lenders are offered the ability to recommit to the deal on the revised terms No pricing changes contemplated to the Revolving Credit Facility A blacklined credit agreement highlighting the proposed changes is available for lenders’ review |
|
|
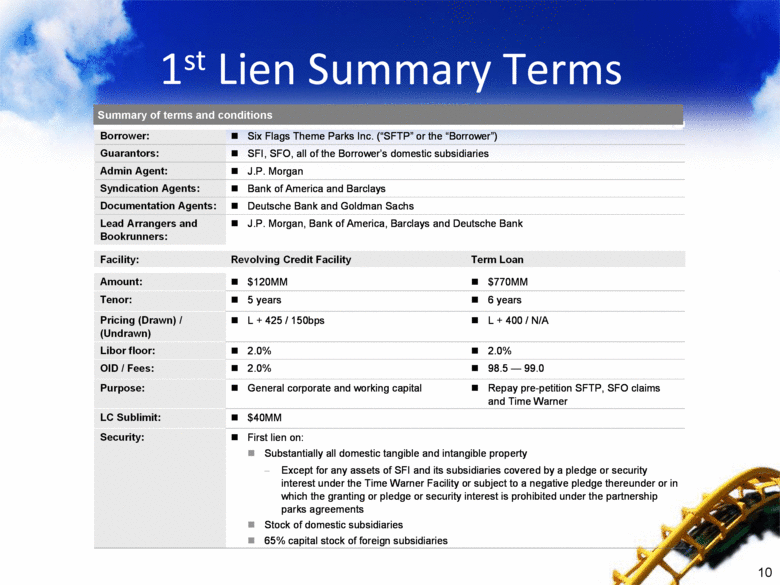
1st Lien Summary Terms Summary of terms and conditions Borrower: Six Flags Theme Parks Inc. (“SFTP” or the “Borrower”) Guarantors: SFI, SFO, all of the Borrower’s domestic subsidiaries Admin Agent: J.P. Morgan Syndication Agents: Bank of America and Barclays Documentation Agents: Deutsche Bank and Goldman Sachs Lead Arrangers and Bookrunners: J.P. Morgan, Bank of America, Barclays and Deutsche Bank Facility: Revolving Credit Facility Term Loan Amount: $120MM $770MM Tenor: 5 years 6 years Pricing (Drawn) / (Undrawn) L + 425 / 150bps L + 400 / N/A Libor floor: 2.0% 2.0% OID / Fees: 2.0% 98.5 — 99.0 Purpose: General corporate and working capital Repay pre-petition SFTP, SFO claims and Time Warner LC Sublimit: $40MM Security: First lien on: Substantially all domestic tangible and intangible property Except for any assets of SFI and its subsidiaries covered by a pledge or security interest under the Time Warner Facility or subject to a negative pledge thereunder or in which the granting or pledge or security interest is prohibited under the partnership parks agreements Stock of domestic subsidiaries 65% capital stock of foreign subsidiaries |
|
|
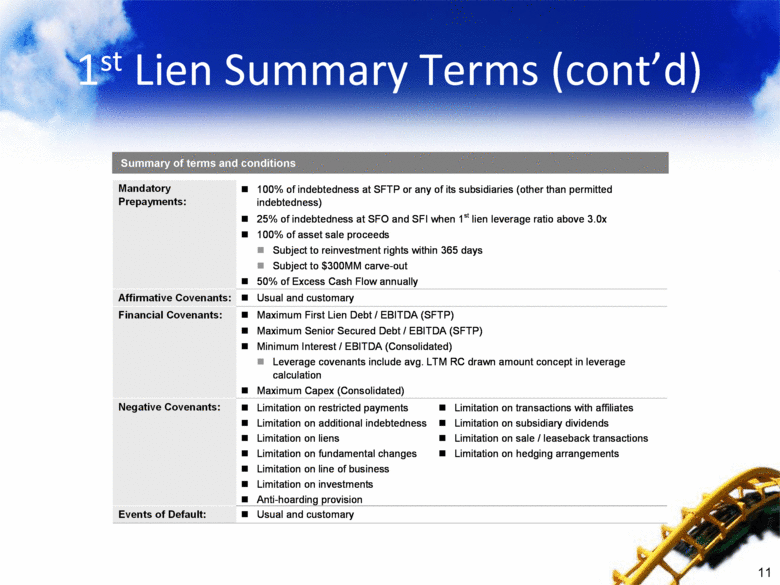
1st Lien Summary Terms (cont’d) Summary of terms and conditions Mandatory Prepayments: 100% of indebtedness at SFTP or any of its subsidiaries (other than permitted indebtedness) 25% of indebtedness at SFO and SFI when 1st lien leverage ratio above 3.0x 100% of asset sale proceeds Subject to reinvestment rights within 365 days Subject to $300MM carve-out 50% of Excess Cash Flow annually Affirmative Covenants: Usual and customary Financial Covenants: Maximum First Lien Debt / EBITDA (SFTP) Maximum Senior Secured Debt / EBITDA (SFTP) Minimum Interest / EBITDA (Consolidated) Leverage covenants include avg. LTM RC drawn amount concept in leverage calculation Maximum Capex (Consolidated) Negative Covenants: Limitation on restricted payments Limitation on additional indebtedness Limitation on liens Limitation on fundamental changes Limitation on line of business Limitation on investments Anti-hoarding provision Limitation on transactions with affiliates Limitation on subsidiary dividends Limitation on sale / leaseback transactions Limitation on hedging arrangements Events of Default: Usual and customary |
|
|
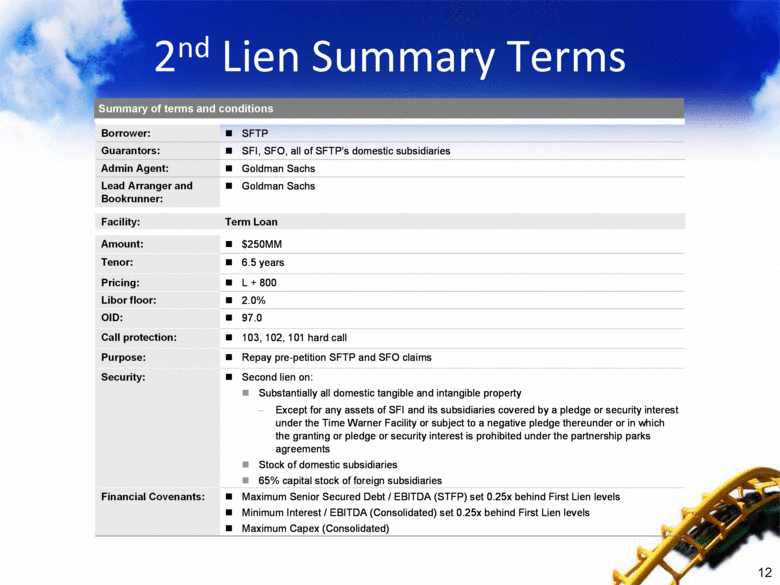
2nd Lien Summary Terms Summary of terms and conditions Borrower: SFTP Guarantors: SFI, SFO, all of SFTP’s domestic subsidiaries Admin Agent: Goldman Sachs Lead Arranger and Bookrunner: Goldman Sachs Facility: Term Loan Amount: $250MM Tenor: 6.5 years Pricing: L + 800 Libor floor: 2.0% OID: 97.0 Call protection: 103, 102, 101 hard call Purpose: Repay pre-petition SFTP and SFO claims Security: Second lien on: Substantially all domestic tangible and intangible property Except for any assets of SFI and its subsidiaries covered by a pledge or security interest under the Time Warner Facility or subject to a negative pledge thereunder or in which the granting or pledge or security interest is prohibited under the partnership parks agreements Stock of domestic subsidiaries 65% capital stock of foreign subsidiaries Financial Covenants: Maximum Senior Secured Debt / EBITDA (STFP) set 0.25x behind First Lien levels Minimum Interest / EBITDA (Consolidated) set 0.25x behind First Lien levels Maximum Capex (Consolidated) |
|
|
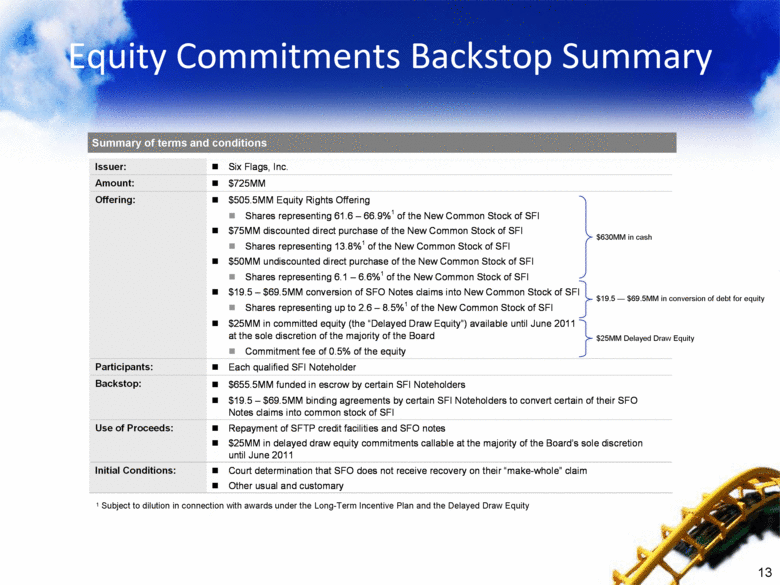
Equity Commitments Backstop Summary Summary of terms and conditions 1 Subject to dilution in connection with awards under the Long-Term Incentive Plan and the Delayed Draw Equity $630MM in cash $19.5 — $69.5MM in conversion of debt for equity $25MM Delayed Draw Equity Issuer: Six Flags, Inc. Amount: $725MM Offering: $505.5MM Equity Rights Offering Shares representing 61.6 – 66.9%1 of the New Common Stock of SFI $75MM discounted direct purchase of the New Common Stock of SFI Shares representing 13.8%1 of the New Common Stock of SFI $50MM undiscounted direct purchase of the New Common Stock of SFI Shares representing 6.1 – 6.6%1 of the New Common Stock of SFI $19.5 – $69.5MM conversion of SFO Notes claims into New Common Stock of SFI Shares representing up to 2.6 – 8.5%1 of the New Common Stock of SFI $25MM in committed equity (the “Delayed Draw Equity”) available until June 2011 at the sole discretion of the majority of the Board Commitment fee of 0.5% of the equity Participants: Each qualified SFI Noteholder Backstop: $655.5MM funded in escrow by certain SFI Noteholders $19.5 – $69.5MM binding agreements by certain SFI Noteholders to convert certain of their SFO Notes claims into common stock of SFI Use of Proceeds: Repayment of SFTP credit facilities and SFO notes $25MM in delayed draw equity commitments callable at the majority of the Board’s sole discretion until June 2011 Initial Conditions: Court determination that SFO does not receive recovery on their “make-whole” claim Other usual and customary |

