Attached files
| file | filename |
|---|---|
| 8-K - FORM 8-K - HARDINGE INC | a2197949z8-k.htm |
Exhibit 99.1
|
|
Investor Presentation April 2010 |
|
|
Forward-Looking Statements This presentation contains forward-looking statements (within the meaning of Section 27A of the Securities Act of 1933, as amended and Section 21E of the Securities Exchange Act of 1934, as amended). Such statements are based upon management’s current expectations that involve risks and uncertainties. Any statements that are not statements of historical fact or that are about future events may be deemed to be forward-looking statements. For example, words such as “may”, “will”, “should”, “estimates”, “predicts”, “potential”, “continue”, “strategy”, “believes”, “anticipates”, “plans”, “expects”, “intends” and similar expressions are intended to identify forward-looking statements. The Company’s actual results or outcomes and the timing of certain events may differ significantly from those discussed in any forward-looking statements. The following factors are among those that could cause actual results to differ materially from the forward-looking statements, which involve risks and uncertainties, and that should be considered in evaluating any such statement: fluctuations in the machine tool business cycles, changes in general economic conditions in the U.S. or internationally, the mix of products sold and the profit margins thereon, the relative success of the Company’s entry into new product and geographic markets, the Company’s ability to manage its operating costs, actions taken by customers such as order cancellations or reduced bookings by customers or distributors, competitor’s actions such as price discounting or new product introductions, governmental regulations and environmental matters, changes in the availability of cost of materials and supplies, the implementation of new technologies and currency fluctuations. The Company undertakes no obligation to publicly update any forward-looking statement, whether as a result of new information, future events, or otherwise. Hardinge notes that forward-looking statements made in connection with a tender offer are not subject to the safe harbors created by the Private Securities Litigation Reform Act of 1995. Hardinge is not waiving any other defenses that may be available under applicable law. i |
|
|
Table of Contents Management 1 Executive Summary 3 About Hardinge 5 Actions Taken to Drive Long-Term Value 18 The Industry Recovery Ahead 26 Looking Forward 30 Appendix 34 ii |
|
|
Management 1 |

|
|
Management Richard Simons President & Chief Executive Officer Edward Gaio Vice President & Chief Financial Officer 2 |
|
|
Executive Summary 3 |

|
|
Executive Summary Hardinge represents one of the global leaders in the machine tool industry, providing its highly respected products to customers in a broad variety of end markets Management believes that the Company is poised to reap the benefits of its streamlined operating structure as the machine tool industry recovers – More effective distribution channels – Discontinuation of U.S. machine parts manufacturing – Elimination of unprofitable product lines and a focus on higher-end product engineering Romi commenced a tender offer on March 30, 2010 to acquire all outstanding shares of Hardinge for $8.00 per share in cash After careful consideration, the Board (by unanimous vote at a meeting held on April 2, 2010) concluded that the offer is grossly inadequate, opportunistic and not in the best interests of Hardinge and its shareholders 4 |
|
|
About Hardinge 5 |

|
|
Global designer, manufacturer and distributor of high precision computer controlled metal-cutting turning machines, grinding machines, vertical machining centers and accessories related to those machines – High precision equipment that produces parts within the highest tolerances Well-known brands and deep industry expertise make Hardinge a highly respected participant in the machine tool sector – 120-year track record of success Manufacturing and/or sales offices located in the U.S., Switzerland, Taiwan, China, England and Germany 2009 Orders by Region 2009 Product Manufacturing Breakdown by Region Hardinge At A Glance 6 |
|
|
Investment Highlights Investment Highlights Comprehensive Product And Service Offering With Market Leading Brands Globally Balanced Sales And Manufacturing Platform Track Record of Successful Strategic Acquisitions And Alliances Loyal Customer Base Serving Blue Chip Companies In A Wide Range Of End Markets Highly Experienced Management Team Hardinge is well positioned to take advantage of the machine tool industry recovery 7 |
|
|
Comprehensive Product And Service Offering With Market Leading Brands Supplier of Choice for Customers Throughout the World Premier Brands and Product Performance Supports customer’s entire high precision, material-cutting needs Focuses on small to medium sized work-pieces . Fulfills precision and accuracy requirements for complex applications and hard to machine materials Hardinge maintains some of the best, most respected brand names in the industry . Customers are consistently loyal due to higher performance capabilities and longer lived products. Brands include: Global Distribution Platform Replacement Parts and Accessories Provide Consistent Order Flow Turnkey Customer Solutions Part process development / engineering Complete, fully automated systems offered worldwide Parts for installed base of thousands of Hardinge, Kellenberger, Tschudin, Hauser, Jones & Shipman, and Bridgeport machines Reduces the impact of the cyclical nature of machine tool orders Accounts for approximately 25% of overall sales Aligned with premier, well-capitalized distribution partners in the U.S. and Europe Direct sales force supported by 10 offices in China 8 |
|
|
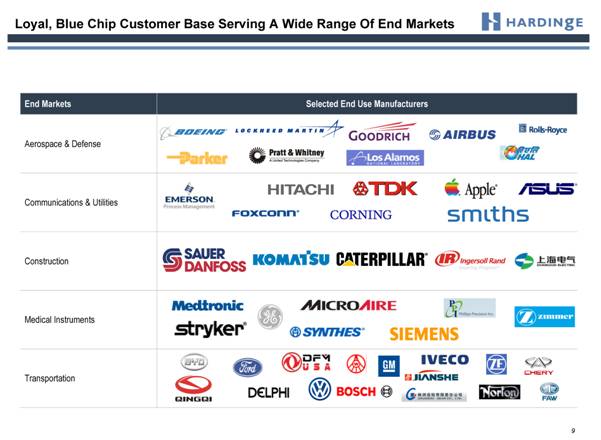
Loyal, Blue Chip Customer Base Serving A Wide Range Of End Markets End Markets Selected End Use Manufacturers Aerospace & Defense Communications & Utilities Construction Medical Instruments Transportation 9 |
|
|
Aerospace & Defense Steering components Nozzles Turbine blades 10 |
|
|
Medical Instruments Implants Prosthetics Surgical instruments Medical equipment components 11 |
|
|
Transportation Bearing races Gear shafts Bearing seats Steering components 12 |
|
|
Hydraulics Pistons and valves Control pistons Pump seals Hydraulic motors 13 |
|
|
Mold and Die Molds Plastic injection molding Dies 14 |
|
|
Globally Balanced Sales And Manufacturing Platform Leicester, England Elmira, New York Shanghai, China Chengdu, China St. Gallen, Switzerland Nantou, Taiwan Biel, Switzerland Direct Sales Offices Headquarters Manufacturing (pictured above) Xian, China Krefeld, Germany Chongqing, China Beijing, China Guangzhou, China Shenyang, China Shandong, China Xiamen, China Key Distribution Offices 15 |
|
|
Track Record Of Successful Strategic Acquisitions And Alliances Acquisition / Alliance Year Rationale / Benefit Jones and Shipman 2010 Expands European-based grinding business. Products also help expand Asian market presence Gosiger Inc., Hartwig Inc. and the Morris Group 2009 Executed significant sales distribution alliance Bridgeport Knee-Mills – U.S. 2002 Acquired manufacturing / distribution of Bridgeport knee-mills in U.S. Taiwan 2005 1999 Acquired minority interest in JV Established JV in Taiwan – Greenfield manufacturing site Bridgeport International – U.K. 2004 Acquired worldwide milling products and strong brand name China 2004 2001 1996 Expanded local Chinese manufacturing capability Established Hardinge Shanghai - provided local manufacturing in China Established Hardinge China - created direct foothold in China market Hauser Tripet Tschudin / Switzerland 2000 Expanded grinding presence L. Kellenberger & Co. / Switzerland 1995 Acquired company to enter grinding business 16 |
|
|
Name Position Relevant Machine Tool Industry Experience Industrial Experience Richard Simons Chief Executive Officer & President 26 Years 31 Years Edward Gaio Chief Financial Officer & Vice President 3 Years 33 Years Douglas Tifft Senior Vice President of Administration 32 Years 32 Years James Langa Vice President of Global Engineering Quality & Strategic Sourcing 3 Years 30 Years Jürg Kellenberger President of Grinding Technology Group 26 Years 36 Years Paul Ling Vice President, Asian Supply Plants 22 Years 22 Years Highly Experienced Management Team Total machine tool industry experience in excess of 100 years 17 |
|
|
Actions Taken to Drive Long-Term Value 18 |
|
|
Actions Taken to Drive Long-Term Value Initiatives taken to date have generated annual fixed cost savings of approximately $30 million for Hardinge As a result of changes in strategic direction, Hardinge undertook several initiatives in 2008 and 2009 that have significantly improved the Company’s operating cost structure, working capital levels and business model. These initiatives include: Streamlined distribution channels Focused direct sales and distribution channel partners for the top 15 key geographic markets and a few key developing markets (BRIC countries) Realigned U.S. distribution structure Consolidated European sales and distribution organizations Discontinued machine parts manufacturing in the U.S. facility Eliminated several unprofitable product lines and focused on new product engineering for higher-end products 19 |
|
|
Actions Taken to Drive Long-Term Value Simplified distribution channels Focused direct sales and distribution channel partners for the key geographic markets in machine tool consumption and a few key developing markets (BRIC countries) where almost 90% of the Company’s sales occur Deemphasized 22 countries where cost to support exceeded benefits derived (1) Source: Metalworking Insiders ’ Report, Gardner Publications, February 23, 2010 (2) Source: Oxford Economics Autumn 2009 Global Machine Tool Outlook report Key Geographic Market Ranking Among Top Machine Tool Consuming Countries (1) Consumption 2009 ($ millions) (1) Change in 2009 (1) Ranking of Hardinge Orders – 2009 Oxford Economics Forecast 2010 (2) Oxford Economics Forecast 2011 (2 ) China 1 19,400 0% 1 +4% +20% Germany 2 5,451 -41% 3 -25% +23% U.S. 3 3,370 -51% 2 -10% +32% Italy 5 2,741 -45% 10-19% +18% Brazil 7 2,547 0% 15 -10% +16% India 8 1,156 -34% 6 +8% +26% France 9 1,133 -36% 11 -18% +13% Mexico 10 1,006 -35% 13 -7% +28% Switzerland 11 866 -45% 5 -20% +14% Taiwan 12 847 -66% 8 +9% +21% Canada 13 720 -38% 9 -8% +26% Russia 14 692 -45% 19 -12% +28% United Kingdom 19 398 -49% 4 -18% +20% Netherlands 20 348 -34% 7 N/A N/A Czech Republic 22 338 -62% 23 -14% 19% Thailand N/A N/A N/A 14 -7% 22% 20 |
|
|
Actions Taken to Drive Long-Term Value Simplified distribution channels Changed the distribution structure in the U.S. – signed three premier distributors, Gosiger, Hartwig and the Morris Group, that will have exclusive sales and support responsibility for the Company’s products for the majority of the U.S. Replaced 20 distributors, 50 direct sales and service people with 5 distributors New distributors are technically and financially strong Gosiger Morris Hartwig Arizona CNC Hegman 21 |
|
|
Actions Taken to Drive Long-Term Value Simplified distribution channels Consolidated European sales and distribution organizations from six facilities to three Will move from four machine stocking locations to one Hardinge European Super Precision Technology Center, Krefeld, Germany 22 |
|
|
Actions Taken to Drive Long-Term Value Discontinued machine parts manufacturing in the U.S. facility Reduced machine division manufacturing employment by almost three fourths (from 229 people to 62) Focused U.S. manufacturing on design and assembly, production of critical components and workholding manufacturing Decommissioned 80 pieces of equipment The cost of manufacturing machine parts in the U.S. under the then existing business model has been a drag on earnings for several years 23 |
|
|
Actions Taken to Drive Long-Term Value These actions resulted in a reduction in annual fixed cost of: Cost of Sales – $10 million Selling, General and Administrative Costs – $20 million 2010 SG&A forecasted at $14 million per quarter Significantly reduced breakeven point in the U.S. operations 24 |
|
|
Actions Taken to Drive Long-Term Value Cash & Cash Equivalents (as of December 31) Total Debt (as of December 31) YOY% Change YOY% Change 15.2% 33.7% 1.1% (82.1%) Pension Underfunded Status (as of December 31) YOY% Change 903.2% (57.2%) Source: Company public filings Company has proactively managed its balance sheet and today maintains a net cash position of $19.6 million Hardinge’s underfunded status for its pension plans has improved significantly ($Millions) 25 |
|
|
The Industry Recovery Ahead 26 |
|
|
According to industry analysts, industrial production is a good leading indicator of machine tool unit sales Year-over-year industrial production increases are expected from 2010-2012 in all of the geographical markets that Hardinge serves Based on the below charts, 2009 was clearly the trough year for global industrial production Year-Over-Year % Change in China Year-Over-Year % Change in Germany Year-Over-Year % Change in Italy Year-Over-Year % Change in Switzerland Year-Over-Year % Change in the U.K. Year-Over-Year % Change in the U.S. Source: Oxford Economics Autumn 2009 Global Machine Tool Outlook Report Industrial Production Year-Over Year % Growth/Decline by Geography 27 |
|
|
Expected Recovery In Global Machine Tool Market Machine tool consumption across the world is expected to rebound strongly in 2011 and 2012, pointing to a sharp potential recovery in Hardinge’s operating results Past recoveries have shown similar strong patterns (YOY Growth / Decline %) - Americas (YOY Growth / Decline %) - Europe (YOY Growth / Decline %) - Asia Source: Oxford Economics Autumn 2009 Global Machine Tool Outlook report and Company financials 28 |
|
|
Update on Q1 2010 Performance Preliminary sales estimate for Q1 2010 of approximately $42 million At the low end of previous guidance of $42 - $45 million due to industry wide computer control supply shortages in Asia and logistical delays in customer run-offs SG&A expenses (excluding costs of takeover defense and advisory costs) of approximately $14 million At the high end of $13 - $14 million previous guidance due to one-time costs of transition to new distributors Strong orders in Q1 2010 of $58 million Up sequentially and year over year by 14% and 177%, respectively China driving strong results Accessory sales increasing in U.S., indicating stronger manufacturing environment Acquisition of Jones & Shipman announced Manufacturer of cylindrical and surface grinding machines Annual sales of approximately $9 million Based on strong order rate in Q1 2010, Q2 2010 sales estimated at $49 - $52 million 29 |
|
|
Looking Forward 30 |

|
|
Actions To Be Taken By Company Strong Brand Names Continue new product development Invest in partnerships, joint ventures and acquisitions to add brands in grinding, turning, milling and workholding Use existing brand names to open doors in BRIC countries Global Manufacturing Footprint Expand manufacturing capacity in Taiwan and China Enhance manufacturing capability in Switzerland Operational Excellence initiatives in workholding, repair parts and machine assembly in U.S. Significant Opportunity in China Expand China sales and service organization to cover developing industry in inland cities Expand manufacturing capacity to meet local content requirements Develop turning, milling and grinding products targeted at specific needs of China customers Hardinge is taking steps to ensure the Company generates long-term value for shareholders Value Added Product Lines Continue to produce high precision, long lasting, durable and stable machines that are highly valued by customers 31 |
|
|
Significant Long-Term Value Opportunity For Shareholders Actions Taken During 2008 and 2009 to Reduce Costs Strong Brand Names Significant Upside During Any Recovery Value Added Product Lines Global Manufacturing Footprint Gross Margins Exceeding 30% Lower SG&A as Percentage of Sales Reduced Working Capital Needs Significant Opportunity in China Strong recovery forecasted for the machine tool industry in 2011 and 2012, estimated at 20%+ per year Based on its key long-term value drivers and actions taken during 2008 and 2009 to reduce costs, Hardinge is positioned to outperform any market improvement Company believes 1% – 2% incremental EBITDA margin improvement, as compared with prior recovery periods, is attainable at higher sales volumes Key Long-Term Value Drivers 32 |
|
|
Reasons for Board Recommendation The Board’s reasons for its position (described in more detail in the Schedule 14D-9 filed by the Company with the SEC) include the Board’s belief that: Hardinge is well-positioned to emerge strongly from the current economic downturn and to benefit significantly as the machine tool industry recovers The offer is grossly inadequate and opportunistic The offer values Hardinge at a price significantly below historical valuations and current trading levels Romi’s offer is highly conditional and coercive to shareholders After careful consideration, the Board (by unanimous vote at a meeting held on April 2, 2010) concluded that the Romi $8.00 offer is grossly inadequate, opportunistic and not in the best interests of Hardinge and its shareholders 33 |
|
|
Appendix 34 |
|
|
Historical Stock Price Performance Five-Year Stock Price Performance Historical Trading Price Current Price (4/1/10) $ 9.03 1-Year Average 5.55 3-Year Average 13.69 5-Year Average 14.59 35 |