Attached files
| file | filename |
|---|---|
| 8-K - 8-K - OVERSTOCK.COM, INC | a10-7674_28k.htm |
| EX-99.1 - EX-99.1 - OVERSTOCK.COM, INC | a10-7674_2ex99d1.htm |
Exhibit 99.2
|
|
Overstock.com, Inc. Fiscal Year and Q4 2009 Financial Results Presentation April 5, 2010 |
|
|
2 The information presented herein may contain forward-looking statements. Our actual results may vary materially from those described in the forward-looking statements for a wide variety of reasons, including changes in economic conditions, changes in consumer spending levels or purchasing patterns, changes to our anticipated levels or timing of expenditures, operational difficulties, including any difficulties relating to our infrastructure or inventory management or to the third parties on which we depend for a variety of services including product fulfillment and delivery, difficulties with credit card or other types of fraud, difficulties with new product or services offerings we may make, including our recent entries into automotive, real estate and international sales efforts, and adverse developments in legal proceedings. Further, worldwide economic issues may increase financing costs and decrease the availability of financing for an extended period of time, and may have unpredictable effects on our business. Additional important factors that could cause results to differ from those expressed in, or implied by, any forward-looking statements are described in our periodic filings with the SEC, including our Report on Form 10-K for the year ended December 31, 2009 which we filed with the SEC on March 31, 2010 and subsequent filings. We undertake no obligation to update or revise any forward-looking statements. The following information includes non-GAAP financial measures. Our investor relations website, located at http://investors.overstock.com, includes a presentation of the most directly comparable financial measures calculated and presented in accordance with GAAP, as well as a reconciliation of the differences between the non-GAAP financial measures with the most comparable financial measures presented in accordance with GAAP. Safe Harbor |
|
|
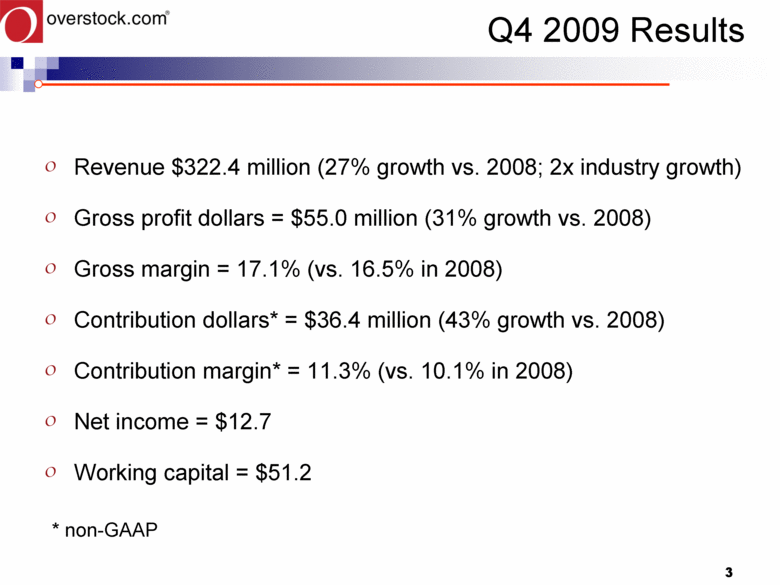
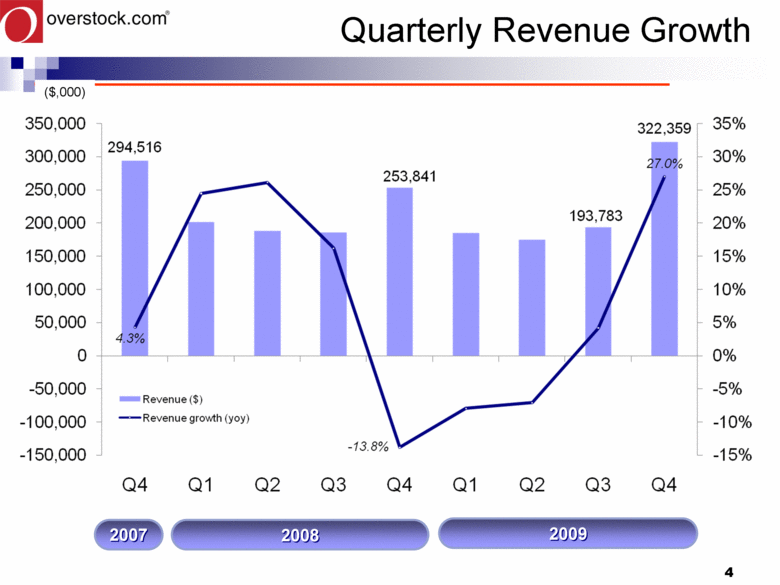
3 Q4 2009 Results Revenue $322.4 million (27% growth vs. 2008; 2x industry growth) Gross profit dollars = $55.0 million (31% growth vs. 2008) Gross margin = 17.1% (vs. 16.5% in 2008) Contribution dollars* = $36.4 million (43% growth vs. 2008) Contribution margin* = 11.3% (vs. 10.1% in 2008) Net income = $12.7 Working capital = $51.2 * non-GAAP |
|
|
4 Quarterly Revenue Growth 2007 2008 ($,000) 2009 |
|
|
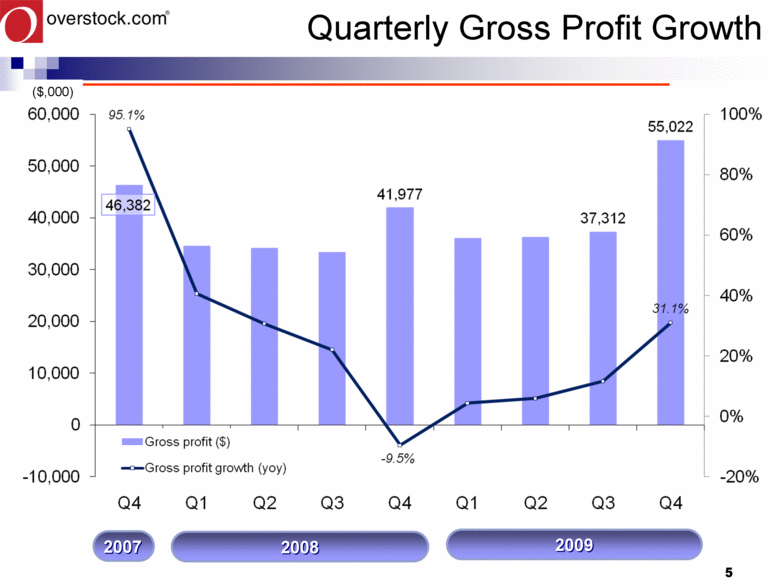
5 Quarterly Gross Profit Growth 2007 2008 ($,000) 2009 60,000 50,000 40,000 30,000 20,000 10,000 0 -10,000 Q4 Q1 Q2 Q3 Q4 Q1 Q2 Q3 Q4 100% 80% 60% 40% 20% 0% -20% 95.1% 46,382 41,977 37,312 55,022 31.1% Gross profit ($) Gross profit growth (yoy) |
|
|
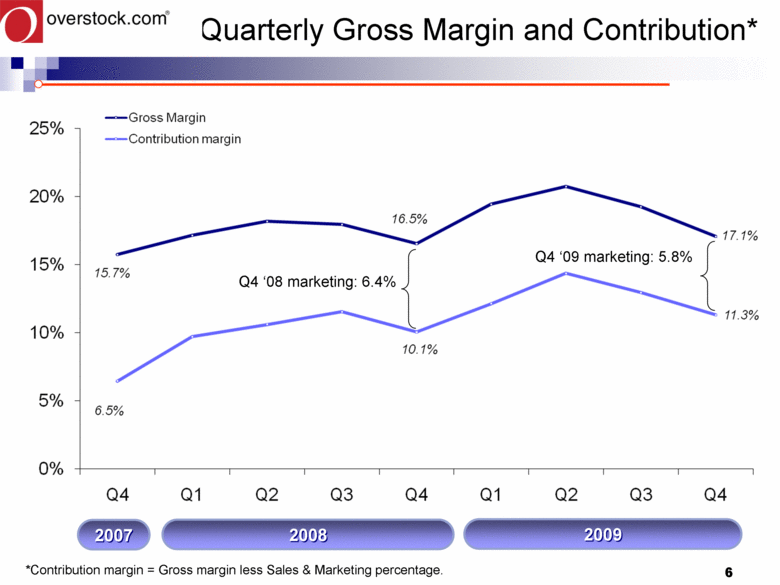
6 Quarterly Gross Margin and Contribution* *Contribution margin = Gross margin less Sales & Marketing percentage. Q4 ‘09 marketing: 5.8% 2008 2007 2009 Q4 ‘08 marketing: 6.4% |
|
|
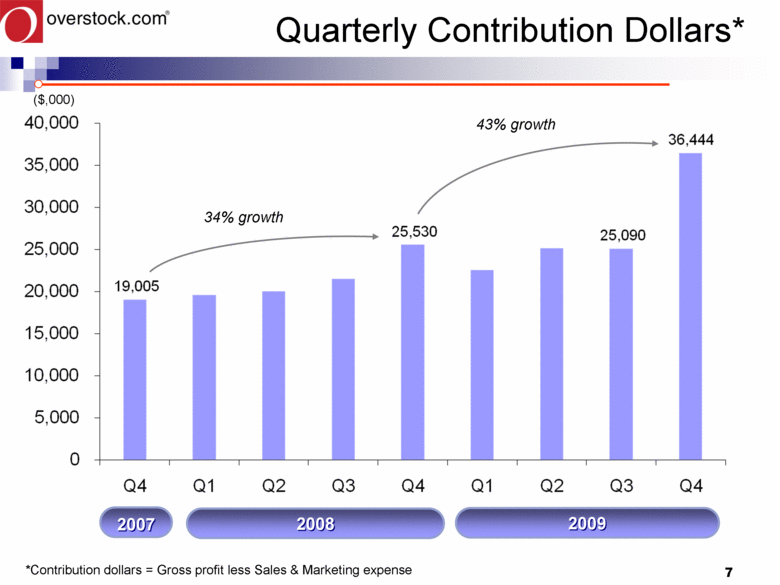
7 Quarterly Contribution Dollars* ($,000) 2008 2007 *Contribution dollars = Gross profit less Sales & Marketing expense 43% growth 34% growth 2009 |
|
|
8 ($,000) 2008 2007 Cash Flow From Operations (TTM) 2009 |

|
|
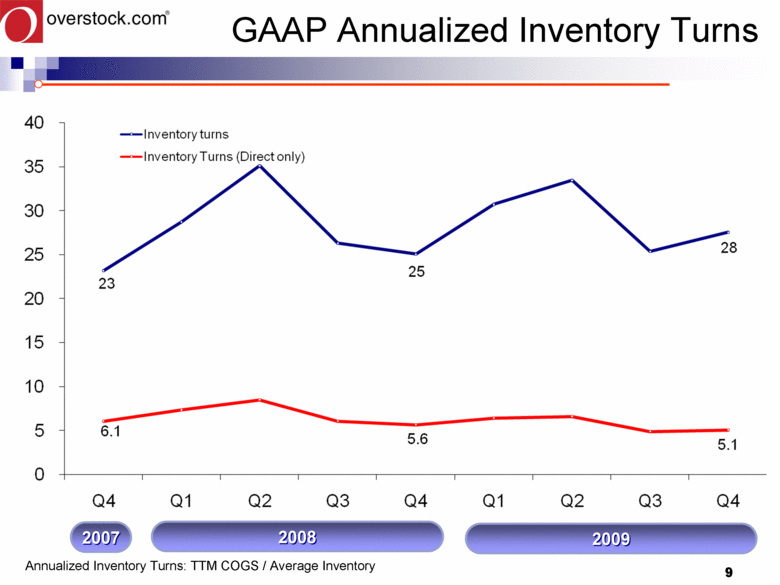
9 GAAP Annualized Inventory Turns Annualized Inventory Turns: TTM COGS / Average Inventory 2008 2007 2009 |
|
|
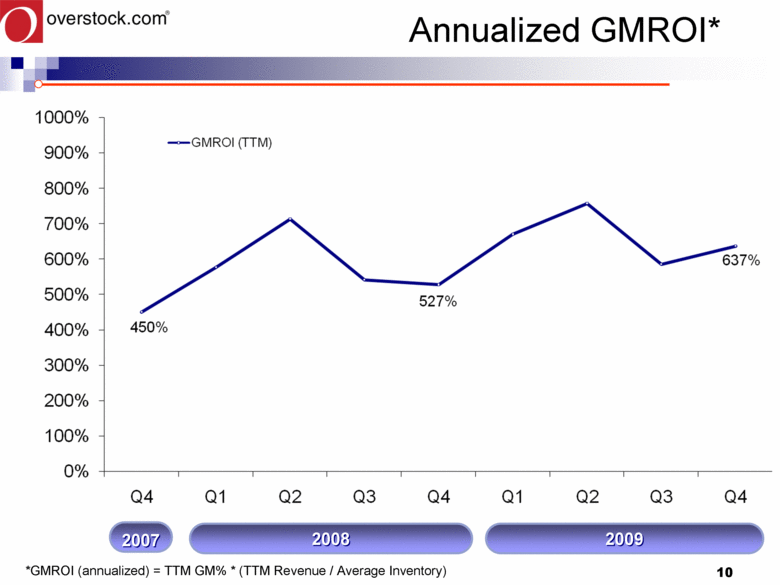
10 Annualized GMROI* *GMROI (annualized) = TTM GM% * (TTM Revenue / Average Inventory) 2008 2007 2009 |
|
|
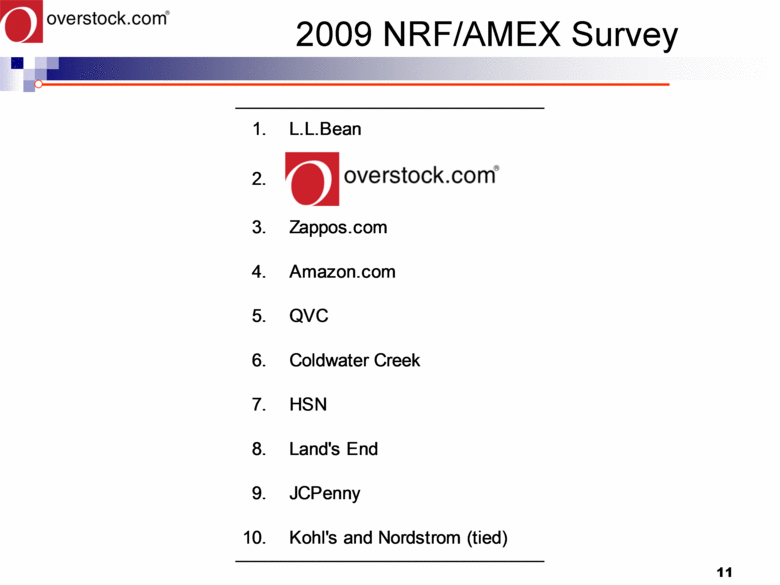
11 2009 NRF/AMEX Survey Kohl's and 1. L.L. Bean 2. overstock.com 3. Zappos.com 4. Amazon.com 5. QVC 6. Coldwater Creek 7. HSN 8. Land’s End 9. JCPenny 10. Nordstrom (tied) |
|
|
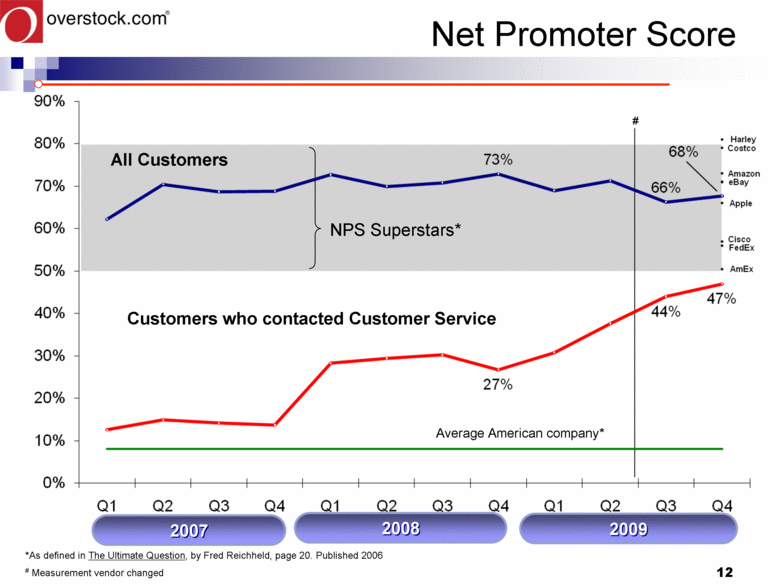
12 Net Promoter Score 2007 2009 All Customers Customers who contacted Customer Service NPS Superstars* *As defined in The Ultimate Question, by Fred Reichheld, page 20. Published 2006 # Measurement vendor changed 2008 Average American company* # |
|
|
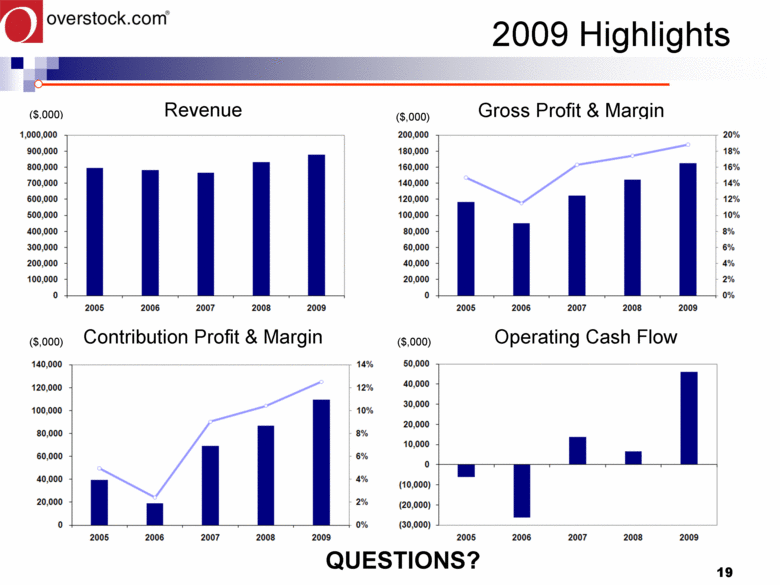
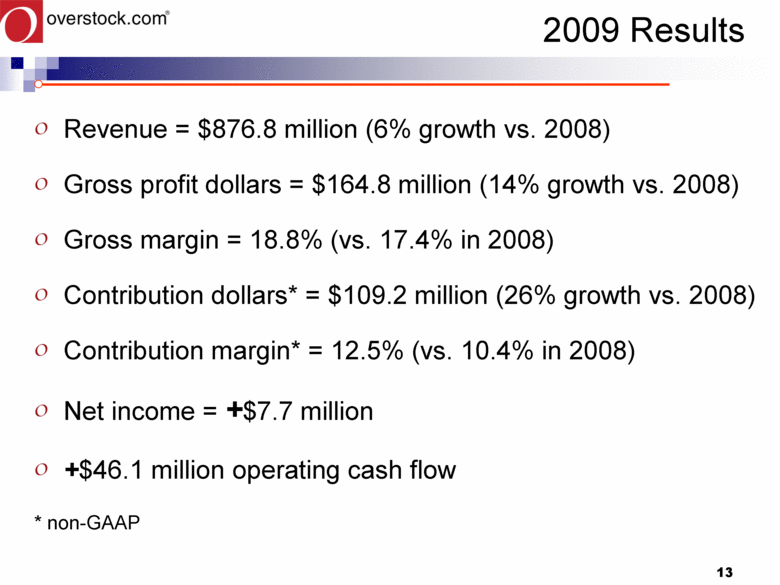
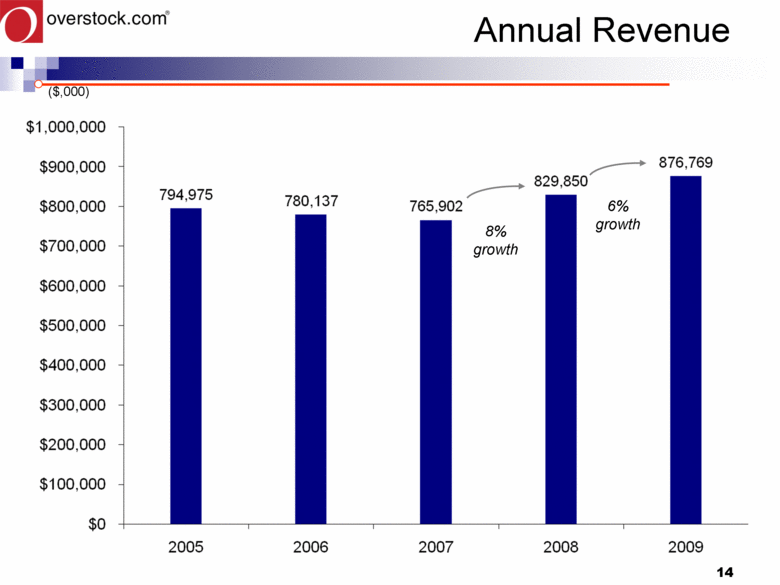
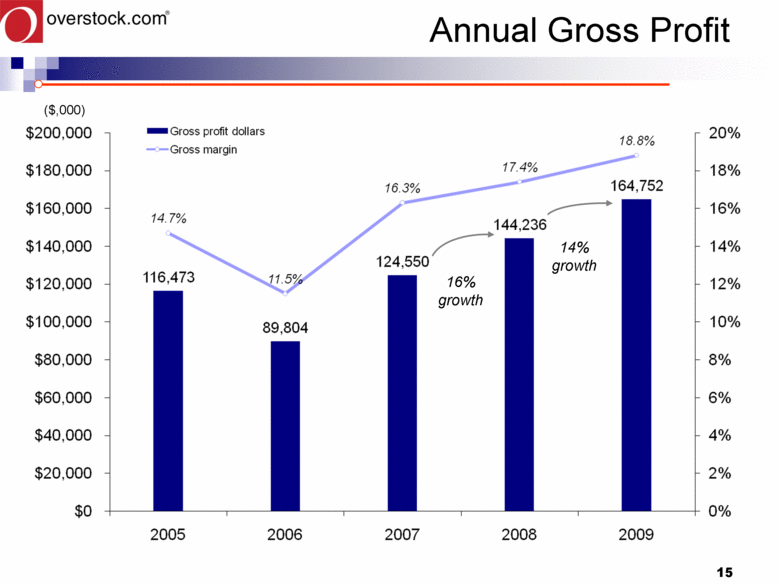
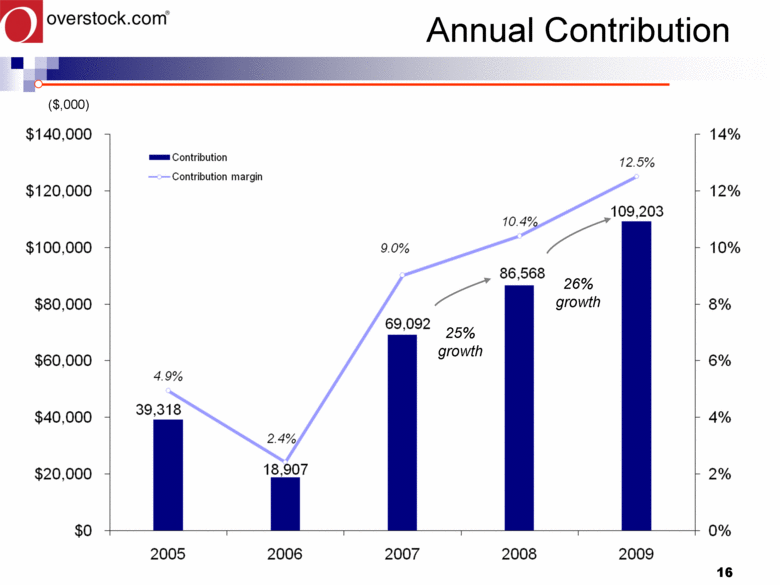
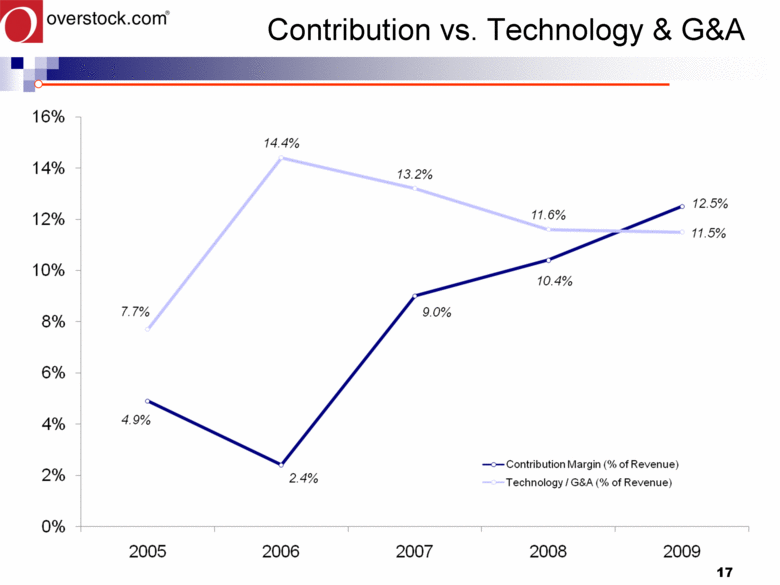
13 2009 Results Revenue = $876.8 million (6% growth vs. 2008) Gross profit dollars = $164.8 million (14% growth vs. 2008) Gross margin = 18.8% (vs. 17.4% in 2008) Contribution dollars* = $109.2 million (26% growth vs. 2008) Contribution margin* = 12.5% (vs. 10.4% in 2008) Net income = +$7.7 million +$46.1 million operating cash flow * non-GAAP |
|
|
14 Annual Revenue ($,000) 6% growth 8% growth |
|
|
15 Annual Gross Profit ($,000) 14% growth 16% growth |
|
|
16 Annual Contribution ($,000) 26% growth 25% growth |
|
|
17 Contribution vs. Technology & G&A |
|
|
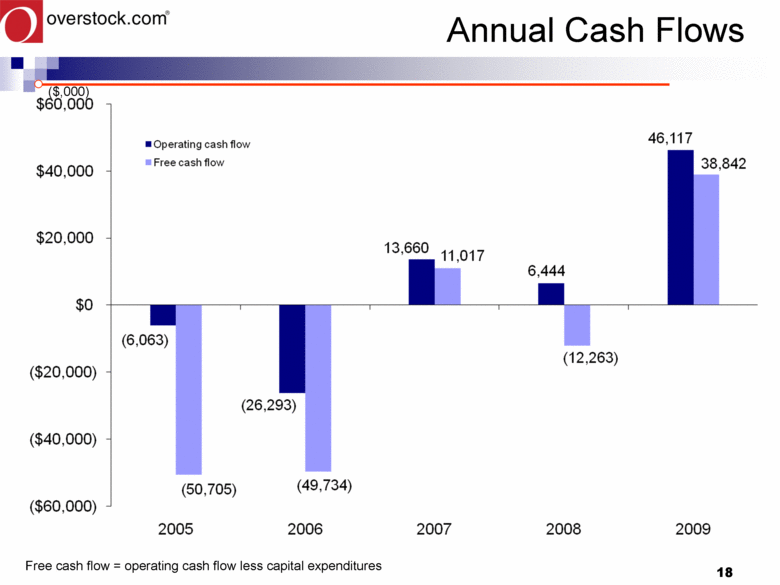
18 Annual Cash Flows Free cash flow = operating cash flow less capital expenditures ($,000) |
|
|
19 2009 Highlights Revenue Gross Profit & Margin Contribution Profit & Margin ($,000) Operating Cash Flow QUESTIONS? ($,000) ($,000) ($,000) |