Attached files
| file | filename |
|---|---|
| EX-32.2 - EXHIBIT 32.2 - OVERSTOCK.COM, INC | ostk-20171231xexx322.htm |
| EX-32.1 - EXHIBIT 32.1 - OVERSTOCK.COM, INC | ostk-20171231xexx321.htm |
| EX-31.2 - EXHIBIT 31.2 - OVERSTOCK.COM, INC | ostk-20171231xexx312.htm |
| EX-31.1 - EXHIBIT 31.1 - OVERSTOCK.COM, INC | ostk-20171231xexx311.htm |
| EX-23 - EXHIBIT 23 - OVERSTOCK.COM, INC | ostk-20171231xexx23.htm |
| EX-21 - EXHIBIT 21 - OVERSTOCK.COM, INC | ostk-20171231xexx21.htm |
| EX-10.25 - EXHIBIT 10.25 - OVERSTOCK.COM, INC | ostk-20171231xexx1025.htm |
| EX-10.24 - EXHIBIT 10.24 - OVERSTOCK.COM, INC | ostk-20171231xexx1024.htm |
| EX-10.16(A) - EXHIBIT 10.16(A) - OVERSTOCK.COM, INC | ostk-20171231xexx1016a.htm |
UNITED STATES
SECURITIES AND EXCHANGE COMMISSION
Washington, D.C. 20549
FORM 10-K
(Mark One)
ý | ANNUAL REPORT PURSUANT TO SECTION 13 OR 15(d) OF THE SECURITIES EXCHANGE ACT OF 1934 |
For the fiscal year ended December 31, 2017
Or | |
o | TRANSITION REPORT PURSUANT TO SECTION 13 OR 15(d) OF THE SECURITIES EXCHANGE ACT OF 1934 |
For the transition period from to
Commission file number: 000-49799

OVERSTOCK.COM, INC.
(Exact name of registrant as specified in its charter)
Delaware | 87-0634302 | |
(State or other jurisdiction of incorporation or organization) | (I.R.S. Employer Identification Number) | |
799 West Coliseum Way, Midvale, UT | 84047 | |
(Address of principal executive offices) | (Zip code) | |
(801) 947-3100 | ||
(Registrant's telephone number, including area code) | ||
Securities registered pursuant to Section 12(b) of the Act: | ||
Title of Each Class | Name of Each Exchange on Which Registered | |
Common Stock, $0.0001 par value | Nasdaq Global Market | |
Securities registered pursuant to Section 12(g) of the Act: None
Indicate by check mark if the registrant is a well-known seasoned issuer, as defined in Rule 405 of the Securities Act. Yes ý No o
Indicate by check mark if the registrant is not required to file reports pursuant to Section 13 or Section 15(d) of the Act. Yes o No ý
Indicate by check mark whether the registrant (1) has filed all reports required to be filed by Section 13 or 15(d) of the Securities Exchange Act of 1934 during the preceding 12 months (or for such shorter period that the registrant was required to file such reports), (2) has been subject to such filing requirements for the past 90 days. Yes ý No o
Indicate by check mark whether the registrant has submitted electronically and posted on its corporate Web site, if any, every Interactive Data File required to be submitted and posted pursuant to Rule 405 of Regulation S-T (§232.405 of this chapter) during the preceding 12 months (or for such shorter period that the registrant was required to submit and post such files). Yes ý No o
Indicate by check mark if disclosure of delinquent filers pursuant to Item 405 of Regulation S-K is not contained herein, and will not be contained, to the best of Registrant's knowledge, in definitive proxy or information statements incorporated by reference in Part III of this Form 10-K, or any amendment to this Form 10-K. o
Indicate by check mark whether the registrant is a large accelerated filer, an accelerated filer, a non-accelerated filer, a smaller reporting company, or an emerging growth company. See the definitions of "large accelerated filer," "accelerated filer," "smaller reporting company" and "emerging growth company" in Rule 12b-2 of the Exchange Act.
Large accelerated filer o | Accelerated filer x | |
Non-accelerated filer o (Do not check if a smaller reporting company) | Smaller reporting company o | |
Emerging growth company o | ||
Indicate by check mark whether the registrant is a shell company (as defined in Rule 12b-2 of the act). Yes o No ý
The aggregate market value of voting and non-voting common equity held by non-affiliates of the registrant as of the last business day of the registrant's most recently completed second quarter (June 30, 2017), was approximately $249.6 million based upon the last sales price reported by Nasdaq. For purposes of this disclosure, shares of Common Stock held by officers and directors and by others who may be deemed to be affiliates of the registrant have been included. The exclusion of such shares is not intended to, and shall not, constitute a determination as to which persons or entities may be affiliates as that term is defined in the federal securities laws.
There were 28,802,734 shares of the Registrant's common stock, par value $0.0001, outstanding on March 8, 2018.
DOCUMENTS INCORPORATED BY REFERENCE
Certain information required by Part III of Form 10-K is incorporated by reference to the Registrant's proxy statement for the 2018 Annual Stockholders Meeting, which will be filed with the Securities and Exchange Commission within 120 days after the end of the fiscal year to which this Report relates.
TABLE OF CONTENTS
Part I | ||
Item 1. | ||
Item 1A. | ||
Item 1B. | ||
Item 2. | ||
Item 3. | ||
Item 4. | ||
Part II | ||
Item 5. | ||
Item 6. | ||
Item 7. | ||
Item 7A. | ||
Item 8. | ||
Item 9. | ||
Item 9A. | ||
Item 9B. | ||
Part III | ||
Item 10. | ||
Item 11. | ||
Item 12. | ||
Item 13. | ||
Item 14. | ||
Part IV | ||
Item 15. | ||
Item 16. | ||
O, Overstock.com, O.com, O.co, Club O, Main Street Revolution, and Worldstock are registered trademarks of Overstock.com, Inc. Porch & Den and FinanceHub are also trademarks of Overstock.com, Inc. Other service marks, trademarks and trade names referred to in this Annual Report on Form 10-K are the property of their respective owners.
In this Report on Form 10-K, references to our "retail” business and to our "e-commerce" business are used interchangeably and have the same meaning.
2
SPECIAL CAUTIONARY NOTE REGARDING FORWARD-LOOKING STATEMENTS
This Report on Form 10-K and the documents incorporated herein by reference, as well as our other public documents and statements our officers and representatives may make from time to time, contain forward-looking statements within the meaning of Section 27A of the Securities Act of 1933, as amended, and Section 21E of the Securities Exchange Act of 1934, as amended. These statements are therefore entitled to the protection of the safe harbor provisions of these laws. These forward-looking statements involve risks and uncertainties, and relate to future events or our future financial or operating performance. The forward-looking statements include all statements other than statements of historical fact, including, without limitation, all statements regarding:
• | our estimates of our financial results for the quarter ending March 31, 2018; |
• | our strategies and plans for our e-commerce business and our Medici businesses, including our tZERO initiatives; |
• | our plans to increase our branding and marketing expenditures significantly; |
• | the possibility that we will pursue or attempt to pursue a strategic alternative that could change our business dramatically, including the possibility and potential effects of a sale of our e-commerce business, as well as the possibility that we will determine not to pursue any strategic alternative at all in the foreseeable future; |
• | our expectation that if we sell our e-commerce business for cash and retain some or all of the after-tax proceeds of the sale, we would return a significant portion of the after-tax proceeds to our stockholders within 12 months after any such sale, by means of a stock repurchase program, dividend, one or more issuer tender offers or other means to our stockholders; |
• | our discussion of the potential effects on our financial results of the new accounting standards that became effective for us January 1, 2018 relating to revenue recognition; |
• | our discussion of the effects on us of the recent Tax Cuts and Jobs Act, including the effects on our deferred tax assets; |
• | our expectations regarding the costs, benefits and risks of Medici Ventures' efforts to develop blockchain applications and tZERO's efforts to develop financial technology ("fintech") applications, including applications using blockchain technology, and including our expectations regarding the costs, benefits and risks of the operations of our majority-owned subsidiary tZERO; |
• | all statements regarding the plans of our majority-owned subsidiary tZERO or of our subsidiary Medici Ventures; |
• | our expectations regarding the costs, benefits and risks of tZERO's ownership of SpeedRoute and PRO Securities, each of which is a registered broker dealer; |
• | our expectations regarding the costs, benefits and risks of having less than wholly owned subsidiaries, including our indirect 80% owned subsidiary tZERO and our currently wholly owned subsidiary Medici Ventures, which has issued stock options to employees and consequently may not be wholly owned in the future; |
• | our discussion of the security token offering currently being conducted by our majority-owned subsidiary tZERO, including the possibility that the proceeds of the security token offering might be treated as income to us for federal income tax purposes, which would increase our income tax expense, and might be treated as a liability rather than equity for accounting purposes, which would reduce tZERO's net book value compared to equity treatment, and the possibility that the security token offering will not raise a significant amount of funds or might not be completed at all; |
• | our expectations regarding the costs, benefits and risks of our efforts and plans to advertise or offer financial product and services offerings on our website, including our plans to advertise discount stock brokerage trading services, and our expectations regarding the costs, benefits and risks of other additional businesses, innovations and projects that we or our subsidiaries may engage in, offer or advertise in the near future; |
• | our expectations regarding Medici Ventures' recent purchase of a 50% interest in DeSoto Inc., a newly-formed public benefit corporation formed for the purpose of carrying out our collaboration with economist Hernando de Soto; |
• | our discussion of our efforts to adapt to the changes that Google has made to its natural search engine algorithms and additional changes Google may make; |
• | our beliefs regarding our ability to attract and retain customers in a cost-efficient manner; |
• | the anticipated effectiveness of or potential improvements in our marketing; |
• | our future operating and financial results, including any projections of revenue, profits or losses, contribution, technology expense, general and administrative expense, cash flow, capital expenditures or other financial measures or amounts or non-GAAP financial measures or amounts or anticipated changes in any of them; |
• | our beliefs and expectations regarding the adequacy of our facilities, including leased and third-party operated warehouse facilities, as well as the possibility that we may add distribution centers or other distribution facilities to our distribution system or our expectations regarding the results of any such additions; |
• | our expectations that we can comply with the requirements of our term loan agreement and related agreements, and that we can repay all amounts outstanding under the loan agreement without significant adverse effects on our business; |
3
• | our future capital requirements and our ability to satisfy our capital needs; |
• | the adequacy of our liquidity and our ability, if any, to increase our liquidity or capital resources through traditional capital raising or tZERO's security token offering; |
• | any possibility that we may purchase tZERO Security Tokens from our majority-owned subsidiary tZERO; |
• | any possibility that tZERO may repay any or all of the amounts we have advanced to tZERO, or that we may accept tZERO Security Tokens to be issued by tZERO in satisfaction of any or all of such amounts; |
• | tZERO's plans, including without limitation its plans to develop its Token Trading System; |
• | our plans and expectations regarding the costs, benefits, and risks of attempting to develop technology applications including applications using or relating to blockchain technology and our plans to commercialize any of these potential applications; |
• | our ability to retire or refinance the debt we have or incur in the future; |
• | the competition we currently face and anticipate; |
• | the effects of current and future government regulation; |
• | our expectations for our international sales efforts and the anticipated results of our international operations; |
• | our efforts to provide multi-channel fulfillment services; |
• | our plans for further changes to our business; |
• | our beliefs regarding current or future litigation or regulatory actions; |
• | our beliefs and expectations regarding existing and future tax laws and related laws and the application of those laws to our business including the results of tax assessments we receive periodically; |
• | our beliefs regarding the adequacy of our insurance coverage; |
• | our beliefs regarding the adequacy and anticipated functionality of our infrastructure, including our backup facilities and beliefs regarding the adequacy of our disaster planning and our ability to recover from a disaster or other interruption of our ability to operate our Website; |
• | our beliefs regarding our cybersecurity efforts and measures and our efforts to prevent data breaches and the costs we will incur in our ongoing efforts to avoid interruptions to our product offerings and other business processes from cyber-attacks and from data breaches; |
• | our ability to maintain or improve upon customer service levels that we and our customers consider acceptable; |
• | our beliefs regarding the adequacy of our order processing systems and our fulfillment and distribution capabilities; |
• | our expectations regarding the costs and benefits of modifying our marketing efforts to deemphasize coupons; |
• | our belief that we and our partners will be able to maintain inventory levels at appropriate levels despite the seasonal nature of our business and the rapid changes we encounter in customer demand for various products; |
• | our expectations regarding our emphasis on home and garden product offerings; |
• | our belief that we can successfully offer and sell a constantly changing mix of products and services; and |
• | our other statements about the anticipated benefits and risks of our business and plans. |
Further, in some cases, you can identify forward-looking statements by terminology such as may, will, could, should, likely, expect, plan, seek, intend, anticipate, project, believe, estimate, predict, potential, goal, strategy, future or continue, the negative of such terms or other comparable terminology. These statements are only predictions. Actual events or results may differ materially from those contemplated by our forward-looking statements for a variety of reasons, including among others:
• | any changes we may make to our business as a result of our current ongoing review of potential strategic alternatives, which could involve a sale of our e-commerce business, a sale of, or business combination involving, Overstock in its entirety, a management-led buyout, and/or additional equity or debt financings; |
• | the possibility that we may sell our e-commerce business for cash and retain some or all of the after-tax proceeds of the sale for use in our blockchain initiatives, which would result in our stockholders owning equity interests in a publicly-held corporation seeking to develop entirely new businesses and revenue streams, without the benefits of our current e-commerce business and the approximately $1.7 billion it generates in annual net revenues; |
• | the potentially substantial corporate level income tax expense we could incur if we were to sell our e-commerce business in a taxable transaction; |
• | the possibility that a sale of our e-commerce business would leave us without the revenues generated by the e-commerce business but with most if not all of the expenses of operating a publicly-held corporation regardless of the sale of the e-commerce business; |
• | the possibility that our well-publicized review of potential strategic alternatives may distract our management and other employees, may cause members of our management and/or other key employees to seek employment elsewhere, and may have adverse effects on our business and financial results; |
• | the technical, operational, financial, regulatory, legal, reputational, marketing and other obstacles we would face in trying to create a profitable business with significant revenues from our blockchain initiatives; |
4
• | the potential effects on our financial results of the new accounting standards that became effective on January 1, 2018, including new standards relating to revenue recognition, which could require us to present our revenues on a net rather than gross basis, which would not affect our future profits or losses, but would cause us to report substantially lower revenues in the future; |
• | the possibility that the recent Tax Cuts and Jobs Act will have adverse effects on us in addition to those we have already identified; |
• | the possibility that the proceeds of the security token offering currently being conducted by tZERO might be treated as income to us for federal income tax purposes; |
• | the possibility that the proceeds of the security token offering currently being conducted by our majority-owned subsidiary tZERO might be treated as a liability rather than equity for accounting purposes, which would reduce tZERO's net book value compared to equity treatment; |
• | the possibility that the security token offering currently being conducted by tZERO could result in claims against tZERO and/or us; |
• | the possibility that we will increase our sales and marketing activities substantially, which could have an adverse effect on our near-term financial results; |
• | the costs of, and any difficulties we may encounter with, the implementation of our growth strategies for our e-commerce business, including our plans to invest more heavily in sales and marketing activities, new distribution facilities, our technology platforms, our Club O rewards program and our private label strategy; |
• | the cost and availability of online and traditional advertising, and the results of our various brand building and marketing campaigns; |
• | difficulties we have encountered and continue to encounter with changes that Google has made to its natural search engine algorithms, which have periodically resulted in lower rankings of our products and may continue to do so, and future changes that Google and other search engine companies may make to their natural search engine algorithms, which may have similar effects on us; |
• | increasing competition, including competition from well-established competitors including Amazon.com, competition from competitors based in China or in other relatively low-cost jurisdictions, competition from well‑funded companies willing to incur substantial losses in order to build market share, and from others including competitors with business models that include delivery capabilities that we cannot currently match and may not be able to match in the foreseeable future; |
• | difficulties we may encounter in connection with our efforts to offer services to our customers outside of our retail e-commerce business, including the credit, insurance, discount brokerage trading services and automated investment advisory services we advertise; |
• | difficulties, including expense and any operational or regulatory issues we may encounter in connection with tZERO or its subsidiaries, including its two registered broker-dealers, SpeedRoute and PRO Securities; |
• | technical, operational, regulatory or other difficulties we may encounter with our Medici or tZERO blockchain and financial technology initiatives, including any difficulties we may have marketing any products or services tZERO may offer, whether due to lack of market size or acceptance or as a result of competition from any of the numerous competitors seeking to develop competing technologies or systems or as a result of patents that may be granted to other companies or persons, and losses we may continue to incur in connection with our Medici and tZERO blockchain and financial technology initiatives; |
• | the difficulties tZERO will face in attempting to market its DLR Software, and the possibility that we and/or tZERO have overestimated the demand for, and/or the size of the intended market for the DLR Software or may face regulatory issues relevant to the DLR Software; |
• | the difficulties tZERO will face in attempting to generate revenues from blockchain-based applications of any nature; |
• | Medici Ventures' current business model of providing the services of its developers at Medici Ventures' cost to companies in which Medici Ventures owns an interest; |
• | difficulties we may have with the assets or interests in other companies that we or our subsidiaries Medici Ventures or tZERO may have made or may make in the future, including any impairment we may recognize with respect to assets or businesses that we, Medici Ventures or tZERO have acquired or may acquire, including with respect to our interests in companies that are in startup or development stages; |
• | any liability or expense we may incur as a result of our interests in other companies, whether as a result of regulatory issues or otherwise; |
• | any downturn in the U.S. housing industry or other changes in U.S. and global economic conditions or U.S. consumer spending; |
• | the imposition of tariffs or occurrence of other factors that increase the price of importing into the U.S. the types of merchandise we sell in our e-commerce business; |
• | our failure to maintain our existing relationships with our fulfillment partners or build new relationships with fulfillment partners on acceptable terms; |
5
• | our failure to maintain optimal levels of product quality, quantity and assortment or to attract sufficient consumer interest in our product offerings; |
• | any claims we may face regarding the quality, safety or labelling of the products we offer; |
• | modifications we may make to our business model from time to time, including aspects relating to our product mix and the mix of direct/partner sourcing of the products we offer, and difficulties we may encounter as a result of our efforts to change various aspects of our business model frequently and rapidly; |
• | the mix of products purchased by our customers and changes to that mix; |
• | any claims we may face regarding cyber security issues or data breaches or difficulties we encounter regarding Internet or other infrastructure or communications impairment problems or the costs of preventing or responding to any such problems; |
• | any problems with or affecting our payment card processors, including cyber-attacks, Internet or other infrastructure or communications impairment or other events that could interrupt the normal operation of the payment card processors or any difficulties we may have maintaining compliance with the rules of the payment card processors; |
• | any substantial decrease in our liquidity, whether as a result of our repayment of our term loan, as a result of our business operations, or as a result of litigation or other claims against us, and the possibility that we will be unable to obtain financing or any other source of liquidity adequate to enable us to continue our operations; |
• | problems with or affecting the facility where substantially all of our computer and communications hardware is located or other problems that result in the unavailability of our Website or reduced performance of our transaction systems; |
• | the extent to which we may owe income or sales taxes or may be required to collect sales taxes or report sales or to modify our business model in order to avoid being required to collect sales taxes or report sales or avoid the application of other types of taxes, and any liabilities that may ultimately be imposed upon us for not having collected sales tax in jurisdictions in which we have not done so; |
• | the possibility that the United States Supreme Court may overturn the sales and use tax physical presence nexus requirement previously upheld by the Supreme Court in 1992 in Quill v. North Dakota; |
• | any losses or issues we may encounter as a consequence of accepting or holding bitcoin or other cryptocurrencies, whether as a result of regulatory, tax or other legal issues, technological issues, value fluctuations, lack of widespread adoption of bitcoin or other cryptocurrencies as an acceptable medium of exchange or otherwise; |
• | difficulties we may have in responding to technological changes; |
• | losses we may incur due to fraud or our inability to prevent or limit fraud; |
• | claims or other problems we may encounter as a result of the listing or sale on our Website of pirated, counterfeit or illegal items; |
• | difficulties we may have financing our operations or our expansion with either internally generated funds or external sources of financing; |
• | any failure by us to maintain compliance with the requirements of our current loan agreement or any future loan agreement or related agreements; |
• | any environmental liabilities we may incur relating to the real estate one of our wholly owned subsidiaries purchased for our corporate headquarters; |
• | any failure of any of our product or service offerings outside of our main shopping Website offerings to provide the benefits we expect from them; |
• | any difficulties we may encounter as a result of our reliance on numerous third parties that we do not control for the performance of critical functions material to our business; |
• | any difficulties we may encounter in connection with the rapid shift of e-commerce and online payments to mobile and multi-channel commerce and payments; |
• | our inability to increase market share or revenue in accordance with our plans; |
• | difficulties with the management of our growth and any periods in which we fail to grow in accordance with our plans; |
• | difficulties we may encounter in connection with our efforts to emphasize our home and garden product offerings and to brand ourselves as a home and garden shopping destination, including the risk that our sales of home and garden product offerings could decrease substantially as a result of a significant downturn in some or all of the U.S. housing market; |
• | fluctuations in our operating results; |
• | difficulties we may encounter in connection with our efforts to expand internationally, including claims we may face and liabilities we may incur in connection with those efforts; |
• | adverse results in legal proceedings, investigations or other claims; |
• | any difficulties we may have optimizing our warehouse operations; |
• | the risks of inventory management and seasonality, particularly with inventory subject to rapid price declines; |
6
• | any decrease in the rate of growth of e-commerce, particularly in home goods, and the occurrence of any event that would adversely affect e-commerce or discourage or prevent consumers from shopping online or via mobile apps; |
• | the possibility that we will suffer adverse consequences as a result of one or more of the related party transactions we have entered into or other related party transactions that we may enter into in the future; and |
• | the other risks described in this report or in our other public filings. |
In evaluating all forward-looking statements, you should specifically consider the risks outlined above and in this Report, especially under the headings "Risk Factors," "Legal Proceedings," and "Management's Discussion and Analysis of Financial Condition and Results of Operations." These factors may cause our actual results to differ materially from those contemplated by any forward-looking statement. Although we believe that our expectations reflected in the forward-looking statements are reasonable, we cannot guarantee or offer any assurance of future results, levels of activity, performance or achievements or other future events.
Our forward-looking statements contained in this report speak only as of the date of this report and, except as required by law, we undertake no obligation to update forward-looking statements to reflect events or circumstances occurring after the date of this report or any changes in our expectations or any change in any events, conditions or circumstances on which any of our forward-looking statements are based.
7
PART I
ITEM 1. BUSINESS
The following description of our business contains forward-looking statements relating to future events or our future financial or operating performance that involve risks and uncertainties, as set forth above under "Special Note Regarding Forward-Looking Statements." Our actual results could differ materially from those anticipated in these forward-looking statements as a result of certain factors described in this Annual Report on Form 10-K, including those set forth above in the Special Cautionary Note Regarding Forward-Looking Statements or in Section 1A under the heading "Risk Factors" or elsewhere in this Annual Report on Form 10-K.
Introduction
We are an online retailer and advancer of blockchain technology. Through our online retail business, we offer a broad range of price-competitive products, including furniture, home decor, bedding and bath, housewares, jewelry and watches, among other products. We sell our products and services through our Internet websites located at www.overstock.com, www.o.co and www.o.biz (referred to collectively as the "Website"). Although our three websites are located at different domain addresses, the technology and equipment and processes supporting the Website and the process of order fulfillment described herein are the same for all three websites.
In late 2014, we began working on initiatives to develop and advance blockchain technology, which we refer to collectively as Medici. As part of our Medici initiatives, we have formed a wholly-owned subsidiary Medici Ventures, Inc. ("Medici Ventures") and acquired a majority interest in a financial technology company and two related registered broker dealers which are owned by our majority-owned subsidiary tØ.com, Inc. ("tZERO"). Medici Ventures has also purchased interests in several blockchain technology companies. In 2015, we were the first public company to issue a private security using blockchain technology and in December 2016, as a demonstration of our technology, we issued publicly traded blockchain preferred shares of Overstock.com, Inc.
Our company, based near Salt Lake City, Utah, was founded in 1997. We launched our initial website in March 1999 and were re-incorporated in Delaware in 2002. As used herein, "Overstock," "Overstock.com,", "O.co," "we," "our" and similar terms include Overstock.com, Inc. and our majority-owned subsidiaries, unless the context indicates otherwise.
Industry Overview
We estimate, based on 2017 estimates from eMarketer, Home Furnishing Stores and Digital Commerce Report (2017), estimates from other publicly available reports, and our own analysis, that e-commerce sales of home goods in the United States market totaled approximately $36 billion for the year ended December 31, 2017, and that they are expected to grow approximately 16% during 2018. We believe that our products are in approximately 40 million homes in the United States, or approximately one-third of all United States households. We believe that the furniture and home goods market, which is highly fragmented and has traditionally been served by brick and mortar stores, will continue transitioning to online sales, particularly as Millennial consumers (defined as those aged 20-36), who are generally comfortable shopping online, start families and move into new homes. The percentage of Millennials who bought furniture online in 2016 has been estimated at 47%, which is nearly double the next closest generational group (26% for Gen X).
Our Retail Business
Our retail business constitutes the vast majority of our business and, through December 31, 2017, generated nearly all of our net revenues. In our retail business, our goal is to provide goods to furnish and accessorize "dream homes" for our target customers—consumers who seek quality, stylish merchandise at bargain prices. At December 31, 2017, we offered 2.8 million products (6.0 million SKUs), of which over 99% were in-line products (products in active production). At December 31, 2017, we were offering three private label brands - Porch & Den, Carson Carrington and OSleep - and had more than 1,000 private label products available on our Website and intend to add additional private label brands, including home products brands, using our strength in home products to help build our private label brands. We regularly change our product assortment to meet the evolving preferences of our customers and current trends. Our products include, among others, furniture, home décor including rugs, bedding and bath, home improvement and kitchen items, and, to a lesser extent, jewelry and watches. We compete primarily based on:
8
• | Quality customer experience with an emphasis on price, value, and a wide assortment of products delivered in a personalized format with the convenience of our mobile app, and with the benefits of our award-winning customer care; |
• | Proprietary technologies which we believe help us provide our customers with a quality shopping experience; |
• | Logistics capabilities tailored to the furniture and home goods category and developed over our many years of e-commerce experience; |
• | Long-term mutually beneficial relationships with our partners, which currently number approximately 4,100; and |
• | Our Club O Loyalty Program, which we believe increases customer engagement and retention. |
We have organized our retail business (sales of product offered through the Shopping Section of our Website) into two principal segments – a "direct" business and a "partner" business. For 2017, approximately 95% of our net sales were from transactions in which we fulfilled orders from manufacturers, distributors and other suppliers ("partners") selling on our website, who we generally direct to ship goods sold from their own warehouses, while we generally handle returns and customer service (our "partner" business). The remaining 5% of our net sales came from direct sales of our own inventory shipped from our warehouse, including some customer returns of partner products (our "direct" business). We provide our partners with access to a large customer base and convenient services for order fulfillment, customer service, returns handling, and other services. Our team of customer service representatives assists customers by telephone, instant online chat and e-mail. We also derive revenue from other businesses advertising products or services on our Website. Our sales are primarily to customers located in the United States. During the years ended December 31, 2017, 2016 and 2015 no single customer accounted for more than 1% of our total net revenue.
Retail direct business
Our retail direct business includes sales made to individual consumers and businesses from our owned inventory which are fulfilled primarily from our warehouse in Salt Lake City, Utah. Our warehouses primarily fulfill orders from our retail direct business. Our warehouses generally ship between 2,000 and 5,000 packages per day and up to approximately 6,000 packages per day during peak periods.
Retail partner business
In our retail partner business, we sell merchandise from our partners primarily through our Website. We are the primary obligor for the majority of these sales transactions and we record revenue from the majority of these sales transactions on a gross basis. We generally have the ability to set pricing and source merchandise from our partners based on our discretion. Our use of the term "partner" does not mean that we have formed any legal partnerships with any of our partners. We currently have relationships with approximately 4,100 third parties who supply the vast majority of products on our Website. These partners generally perform the same fulfillment operations as our warehouses, such as order picking and shipping. We retain the right to re-direct and control the products during shipment and we handle returns and customer service related to substantially all orders placed through our Website. Revenue generated from sales on our Shopping site from both the direct and partner businesses is recorded net of returns, coupons and other discounts.
Both direct and partner revenues are seasonal, with revenues historically being the highest in the fourth quarter, which ends December 31, reflecting higher consumer holiday spending. We anticipate this will continue for the foreseeable future. To the extent possible we maintain supplier relationships, and seek new supplier relationships, for both our direct and partner businesses, and also use our working capital, to ensure a continuous allotment of product offerings for our customers. Because some (less than 1%) of our product offerings are closeout merchandise, some of our suppliers cannot supply products to us on a continuous basis.
Generally, we require authorization from credit card or other payment vendors whose services we offer to our customers (such as PayPal) or verification of receipt of payment, before we ship products to consumers or business purchasers. From time to time we grant credit to our business purchasers with normal credit terms (typically 30 days). For sales in our partner business, we generally receive payments from our customers before our payments to our suppliers are due.
Growth Strategies for Our E-Commerce Business
Our growth strategies for our e-commerce business include:
Invest in branding and marketing - We believe that some of our direct competitors spend significantly higher percentages of their revenue on marketing than we do, and that we need to increase our branding and marketing expenditures in order to increase our market share in the e-commerce home goods market and educate consumers about our current position as
9
an online retailer offering a wide assortment of quality home goods and other products at low prices and with a high level of customer service.
Invest in distribution facilities - We want to invest in additional distribution facilities to speed shipping and improve our customer service. We offer third party logistics services to our partners. Partners participating in this program store products in one or more of our warehouses, which benefits our customers and us by providing a more predictable supply of inventory and a better customer experience, and we believe that by adding additional distribution facilities we can improve our customers' shopping experience.
Expand investment in technology platforms - We have invested for years in building platforms that automate vendor management, product pricing, website personalization and search relevance. We want to make additional investments in automation, technology and engineering resources because we believe they can improve our customers' shopping experience.
Expand Club O rewards program to enhance customer loyalty - We believe that membership in our Club O rewards program increases customer engagement. We want to make additional investments in the program, primarily to increase member benefits and to develop additional personalization programs. We believe that these changes will increase the attractiveness of the program to customers.
Accelerate private label strategy - We launched our private label initiative in the third quarter of 2017. Our strategy is to add private label home products brands, using our strength in home products to help build our private label brands. We have developed and are currently offering 17 private label brands and have more than 7,500 products available on our Website. We believe that private label brands can generate significant brand equity and customer loyalty.
We believe that we have operated for years with relatively limited capital compared to some of our competitors. Based on filings by public companies, we believe that many of our competitors, including Amazon, Groupon, Wayfair, and Zulily, have operated with more capital than we have. Although our 2017 results were substantially worse, from 2012 through 2016 inclusive we were profitable and had year-over-year increases in our total net revenue. With the exception of 2011, our annual GAAP operating margin from 2009 through 2016 was approximately 1%. We also believe that our customer acquisition costs are substantially lower than Wayfair's. We calculate our 2017 customer acquisition cost at $50, which is less than 70% of the "illustrative customer acquisition cost" of $73 Wayfair presented in its Q4 2017 earnings presentation. We believe that these results demonstrate that we still have the ability to operate our retail business at a profit in the future, but we also believe that in the current intensely competitive battle for market share in the home goods e-commerce market, we need to build market share and need to increase our expenditures substantially to do so.
Our ability to pursue some or all of these plans, and the extent to which we would be able to pursue some or all of them, will depend on the resources we have available, and may require significantly more capital than we currently have. See Item 7 of Part II, "Management's Discussion and Analysis of Financial Condition and Results of Operations"—"Liquidity and Capital Resources."
Medici Business Initiatives
Our Medici business initiatives seek to leverage the security, transparency and immutability of cryptographically protected, distributed ledgers, such as blockchains, and are focused on solving important problems, including financial transaction issues, particularly in the area of securities settlement. Our wholly-owned subsidiary, Medici Ventures, conducts its primary business through its majority-owned subsidiary tZERO, which includes a financial technology company and two related registered broker dealers. Medici Ventures also holds interests in several technology companies whose focuses include commercial blockchain applications, digital currency solutions, compliance, identity, voting, and land. Our Medici business initiatives are described in more detail below under "Medici."
As described further in Item 15 of Part IV, "Financial Statements"—Note 21. Business Segments, contained in the "Notes to Consolidated Financial Statements" of this Annual Report on Form 10-K, we determined our segments based on how we manage our business, which, in our view, consists primarily of our Retail and Medici businesses. As described above, our Retail business consists of our Direct and Partner reportable segments. We use gross profit as the measure to determine our reportable segments because there is not discrete financial information available below gross profit for our Direct and Partner segments. As a result, our Medici business is not significant as compared to our Direct and Partner segments and is included in Other. Our Other segment consists of Medici.
Other Offerings
10
We offer additional products or services that may complement our primary offerings, but are not significant to our revenues. These include:
• | Worldstock Fair Trade, a store within our Website that offers handcrafted products made by artisans all over the world to help improve the lives of people in emerging economies; |
• | Supplier Oasis, a single integration point through which our partners can manage their products, inventory and sales channels, and also obtain multi-channel fulfillment services through our distribution network; |
• | Our international business where we offer products to customers outside the United States using third party logistics providers; |
• | Cars by Overstock, a portal within our Website where our customers can search millions of new, used and certified pre-owned cars from dealers and private parties – all in one place with convenient financing and warranty options; |
• | FinanceHub, a portal within our Website where our customers can shop for loans, credit cards, and insurance, and can now also access links to automated financial advisory services and discounted stock brokerage services; and |
• | Pet Adoptions, a free service and portal within our Website that leverages our technology to display pets available for adoption from shelters across the United States. |
Manufacturer, Supplier and Distribution Relationships
Generally, our manufacturers, distributors, or other suppliers regularly communicate to us the quantity of products that are held in reserve for us. Although our contracts grant us actionable rights to such products, our contracts do not guarantee the availability of those products for a set duration. Our manufacturer, distributors, and supplier relationships are based on historical experience with manufacturers, distributors, and other suppliers and do not obligate or entitle us to receive merchandise on a long-term or short-term basis. Our manufacturer, distributor, and supplier relationships are generally non-exclusive and we retain the right to select and change our suppliers at our discretion. In our direct business, we purchase the products from manufacturers, distributors, or other suppliers using standard purchase orders. Generally, manufacturers, distributors, and suppliers do not control the terms under which products are sold through our Website.
Products
Our Website Shopping section is organized into product and service lines or featured categories, including: Furniture, Rugs, Decor, Bed & Bath, Home Improvement, Kitchen, Outdoor, Jewelry, Watches, Women, Men, Kids & Baby, Worldstock Fair Trade, Cars by Overstock, FinanceHub, and Pet Adoptions. We frequently reorganize our departments and/or categories to better reflect our current product offerings.
For the years ended December 31, 2017, 2016 and 2015, the percentages of sales contributed by similar classes of products were as follows:
Product Lines | 2017 | 2016 | 2015 | ||||||
Home and garden(1) | |||||||||
Furniture | 35 | % | 34 | % | 33 | % | |||
Home decor | 25 | % | 22 | % | 19 | % | |||
Other | 21 | % | 23 | % | 25 | % | |||
Total home and garden | 81 | % | 79 | % | 77 | % | |||
Jewelry, watches, clothing and accessories | 9 | % | 10 | % | 11 | % | |||
Electronics and computers | 2 | % | 3 | % | 3 | % | |||
Other | 8 | % | 8 | % | 9 | % | |||
Total | 100 | % | 100 | % | 100 | % | |||
(1) Home and garden includes furniture, home decor, garden and patio, kitchen and dining, bedding, home improvement, housewares and other related products.
Sales and Marketing
We use a variety of methods to target our retail consumer audience, including online campaigns, such as advertising through keywords, product listing ads, display ads, search engines, affiliate marketing programs, social coupon websites, portals, banners, e-mail, direct mail, and viral and social media campaigns. We also do brand advertising through television, radio, print ads, and event sponsorships.
11
Customer Service
We are committed to providing superior customer service. We staff our customer service department with dedicated in-house and outsourced professionals who respond to phone, instant online chat, and e-mail inquiries on products, ordering, shipping status, returns, and other areas of customer inquiry.
Technology
We use our internally developed Website and a combination of proprietary technologies and commercially available licensed technologies and solutions to support our retail operations. We use the services of multiple telecommunications companies to obtain connectivity to the Internet. Currently, our primary computer infrastructure is located in a data center in Utah. We also have other data centers which we use for backups, redundancy, development, testing, disaster recovery, and corporate systems infrastructure.
Competition
Internet retail is intensely competitive and has relatively low barriers to entry. We believe that competition in this industry is based predominantly on:
• | price; |
• | product quality and assortment; |
• | shopping convenience; |
• | website organization and load speed; |
• | order processing and fulfillment; |
• | order delivery time; |
• | customer service; |
• | website functionality on mobile devices; |
• | brand recognition; and |
• | brand reputation. |
We compete with other online retailers, traditional retailers, and liquidation "brokers" which may specifically adopt our methods and target our customers. We currently or potentially compete with a variety of companies that can be divided into several broad categories:
• | online discount general retailers; |
• | online private sale sites; |
• | online specialty retailers; |
• | liquidation e-tailers; |
• | traditional general merchandise and specialty retailers and liquidators, many of which have a significant online presence; and |
• | online retailers who are developing significant "brick and mortar" capabilities. |
Many of our current and potential competitors have greater brand recognition, longer operating histories, larger customer bases, and significantly greater financial, marketing, and other resources than we do. Further, any of them may enter into strategic or commercial relationships with larger, more established and well-financed companies, including exclusive distribution arrangements with our vendors or service suppliers that could deny us access to key products or needed services, or acquisitions of our suppliers or service providers, having the same effect. Many of them do or could devote greater resources to marketing and promotional campaigns and devote substantially more resources to their website and systems development than we do. Many have supply chain operations that decrease product shipping times to their customers, have options for in-store product pick-up, allow in-store returns, or offer other delivery and returns options that we do not have. New technologies, the continued enhancement of existing technologies, developments in related areas such as same-day product deliveries, and the development of proprietary delivery systems increase competitive pressures on us. Based on filings by public companies, we believe that many of our competitors, including Amazon, Groupon, Wayfair, and Zulily, have operated with more capital and have more financial flexibility to invest in growth than we have. Although we believe that our 2017 customer acquisition costs of approximately $50 were less than 70% of the "illustrative customer acquisition cost" of $73 Wayfair presented in its Q4 2017 earnings presentation, other competitors of ours may have lower customer acquisition costs than we do. We believe that our results from 2012 through 2016 demonstrate that we can operate our retail business at a profit, but we also believe that in the current intensely competitive battle for market share in the home goods e-commerce market, we need to build market share and
12
need to increase our expenditures substantially to do so. We cannot ensure that we will be able to compete successfully against current or future competitors or address increased competitive pressures (see Item 1A—"Risk Factors").
Seasonality
Our retail business is affected by seasonality because of the holiday season, which historically has resulted in higher sales volume during our fourth quarter, which ends December 31. We recognized 26.2%, 29.2%, and 29.0% of our annual revenue during the fourth quarter of 2017, 2016, and 2015, respectively.
Financial Information about Business Segments and Geographic Areas
See Item 15 of Part IV, "Financial Statements"—Note 21. Business Segments for information regarding our business segments and geographical areas.
Intellectual Property and Trade Secrets
We regard our domain names and other intellectual property as critical to our success. Included in our intellectual property is some of the financial technology we have developed as part of our Medici initiatives. We rely on a combination of laws and contractual restrictions with our employees, customers, suppliers, affiliates, and others to establish and protect our proprietary rights, including the law pertaining to trade secrets. Despite these precautions, it may be possible for a third party to copy or otherwise obtain and use our intellectual property or trade secrets without authorization. In addition, we cannot ensure that others will not independently develop similar intellectual property. Although we have registered and are pursuing the registration of our key trademarks in the United States and some other countries, some of our trade names may not be eligible to receive registered trademark protection. In addition, effective trademark protection may not be available or we may not seek protection in every country in which we market or sell our products and services, including in the United States. Additionally, our efforts to protect our trade secrets may not succeed.
Third parties have in the past recruited and may in the future recruit our employees who have had access to our proprietary technologies, processes and operations. These recruiting efforts expose us to the risk that such employees and those hiring them will misappropriate and exploit our intellectual property and trade secrets.
Medici
Medici Overview
In late 2014, we began working on initiatives to develop and advance blockchain technologies. We pursue these initiatives through our wholly-owned subsidiary, Medici Ventures and Medici Ventures' majority-owned subsidiary tZERO. These initiatives remain in the start-up phase, and neither Medici Ventures nor tZERO has generated any significant revenues from any blockchain-based technology or application of blockchain technology. We have spent a total of approximately $107 million over the last three years in our Medici business as of the end of February 28, 2018, with most of that being spent in our majority-owned subsidiary tZERO.
A blockchain is a cryptographically secured, distributed infrastructure, or network, which may be accessed and in some cases maintained by each member of the network. Medici Ventures' strategy is to develop and advance blockchain technology to broaden access to capital, financial markets and other applications, and allow individuals to connect directly without intermediaries. Medici Ventures has a team of approximately 30 software engineers, developers and other technologists, approximately half of whom work in blockchain development and deployment, and approximately half of whom work in enterprise level software development and deployment. Medici Ventures utilizes those software engineers, developers and other technologists in tZERO's projects. Medici Ventures has also purchased relatively small strategic interests in blockchain-related businesses, particularly in businesses where Medici Ventures believes it can strategically deploy its software engineers, developers or other technologists to support those businesses as appropriate. These include PeerNova, Bitt, IdentityMind, Factom, SettleMint, Ripio, Spera, Symbiont, Voatz and Bitsy, whose focuses include commercial blockchain applications, capital markets applications, digital currency, money and banking applications, compliance, personal identity, voting, and property and land applications. Most of these interests are small, both in dollar terms and in the percentage interests that Medici Ventures owns, but Medici Ventures takes an active role in the companies to the extent its resources permit it and the respective companies desire to have Medici Ventures do so. Medici Ventures' primary business is its approximately 80% interest in tZERO, which, as described below, is a financial technology company pursuing potential financial applications for blockchain technologies. See "tZERO" below and "Risk Factors—Risks Relating to Our Medici Business." Medici recently acquired a 50% interest in DeSoto Inc., which is a public benefit corporation formed to carry out our collaboration with economist Hernando de
13
Soto. DeSoto intends to build systems using blockchain, social media, artificial intelligence, and mobile apps to help develop more effective records of ownership in developing countries. DeSoto does not currently have a specific plan to generate revenues or profits, and does not expect to generate revenues or profits in the foreseeable future. See "Risk Factors—Risks Relating to Our Company - Our 50% subsidiary DeSoto, Inc. is a public benefit corporation."
All of the companies in which Medici Ventures holds strategic interests are startup businesses, businesses in the development stage or businesses with a short operating history. See "Risk Factors—Risks Relating to Our Medici Business."
tZERO
Medici Ventures' majority-owned subsidiary tZERO is a financial technology company pursuing potential financial applications of blockchain technologies as well as non-blockchain businesses. tZERO is currently involved in, among other things, the following:
• | Non-blockchain services - SpeedRoute and PRO Securities. tZERO owns two registered broker-dealers, SpeedRoute, LLC ("SpeedRoute") and PRO Securities, L.L.C. ("PRO Securities"). SpeedRoute is an electronic, agency‑only Financial Industry Regulatory Authority, Inc. ("FINRA")-registered broker-dealer that provides connectivity for its customers to U.S. equity exchanges as well as off-exchange sources of liquidity such as dark pools. All of SpeedRoute's customers are registered broker-dealers. SpeedRoute does not hold, own or sell securities. PRO Securities is a FINRA-registered broker-dealer that owns and operates the PRO Securities alternative trading system (the "PRO Securities ATS"), which has filed a Form ATS with the Securities and Exchange Commission ("SEC") notifying the SEC of its activities as an alternative trading system, or ATS. An ATS is exempted from the definition of an "exchange" under Section 3(a)(1) of the Securities Exchange Act of 1934, as amended (the "Exchange Act") if it complies with Regulation ATS, which includes, among other things, the requirement to register as a broker-dealer and file a Form ATS with the SEC to provide notice of the ATS's operations. Although Section 3(a)(1) provides the definition of an exchange, Exchange Act Rule 3b-16(a) provides a functional test to assess whether a trading system meets this definition—an entity or organization that (1) brings together the orders for securities of multiple buyers and sellers; and (2) uses established, non-discretionary methods (whether by providing a trading facility or by setting rules) under which such orders interact with each other, and the buyers and sellers entering such orders agree to the terms of the trade. A system that meets the criteria of Rule 3b-16(a), and is not excluded under Rule 3b-16(b), must register as a national securities exchange pursuant to Sections 5 and 6 of the Exchange Act or operate pursuant to an appropriate exemption. A frequently used exemption, which is relied upon by the PRO Securities ATS, is the exemption in Rule 3a1-1(a)(2) that exempts an ATS that complies with Regulation ATS. As a result, provided that it complies with the requirements of Regulation ATS, the PRO Securities ATS is not subject to the registration requirement of Section 5 of the Exchange Act. The PRO Securities ATS is a closed system available only to its broker dealer subscribers. PRO Securities does not accept orders from non-broker dealers, nor does it hold, own or sell securities. |
• | Non-blockchain services - Automated Investment Advisory Services. tZERO recently purchased 65.8% of the membership units of ES Capital Advisors, LLC ("ES Capital"), a registered investment advisor under the Investment Advisers Act of 1940. tZERO now operates the ES Capital business under the name tZERO Advisors and offers automated investment advisory services through our website's FinanceHub. |
• | Non-blockchain services - StockCross Financial Services, Inc. On January 31, 2018, tZERO purchased a 24% interest in StockCross Financial Services, Inc. ("StockCross"), an affiliate of Siebert Financial Corp. ("Siebert"), and an interest in Siebert, for $12 million. As of the date of this Report, tZERO holds approximately 5.1% of Siebert's outstanding common stock. tZERO believes that StockCross, a self-clearing brokerage firm, will be an important part of a network of financial firms that tZERO intends to assemble. |
• | Non-blockchain services - Agreement with Muriel Siebert & Co. On December 31, 2017, tZERO, SpeedRoute and Muriel Siebert & Co. Inc. ("Muriel Siebert") entered into an agreement pursuant to which Muriel Siebert is now advertising discounted online trading of U.S. equity securities on Overstock's website. |
• | Non-blockchain services - Acquisition of Majority Interest in Verify Investor, LLC. On February 12, 2018, tZERO purchased 81.0% of Verify Investor, LLC, an accredited investor verification company, for $12.0 million in cash. |
• | Non-blockchain services - Weeden Prime Services- Letter of Intent. On February 6, 2018, tZERO entered into a Letter of Intent (the "WPS LOI") with Weeden Prime Services, LLC ("WPS"), a U.S. registered broker-dealer. The WPS LOI contemplates that tZERO will acquire 51% of the outstanding membership interests of WPS for $11.0 |
14
million in cash with a subsequent purchase, prior to the first anniversary of the initial purchase, of an additional 30% of the aggregate membership interests of WPS for an additional $7.0 million in cash. Following the subsequent purchase, the Company will own 81% of the then-outstanding membership units of WPS. The WPS LOI contemplates that the existing members of WPS shall retain certain minority investor rights, including with respect to representation on the board of managers of WPS (proportionate to ownership) and customary drag-along and tag-along rights and anti-dilution protections. The WPS LOI also contemplates that at any time following the first anniversary of the second closing, tZERO may, with 60-days' written notice, acquire all (but not less than all) of the outstanding membership units of WPS not then owned by tZERO at fair market value. tZERO expects the transaction to close during the third quarter of 2018, subject to the execution of definitive documentation, any applicable regulatory approvals and customary closing conditions.
• | Other Potential Acquisitions. tZERO continues to identify, evaluate and pursue various opportunities for strategic acquisitions or purchases of interests to add to the services and expertise it offers its customers. tZERO's management exercises substantial discretion in identifying appropriate strategic transactions and negotiating the terms of such transactions. Management's determinations are based on numerous financial, strategic and operational assumptions, and there can be no assurance that such assumptions will prove to be true. Moreover, such strategic transactions may fail to produce the benefits expected at the time of tZERO's acquisitions or purchases of interests. |
• | Blockchain Services - Planned Token Trading System. In connection with Overstock’s 2016 SEC-registered offering of Blockchain Voting Series A Preferred Stock (the “Series A Preferred”), tZERO developed a suite of software and technologies referred to as the tZERO Issuance and Trading Platform (the “Series A Software Platform”). The Series A Shares trade exclusively on the PRO Securities ATS, which utilizes the Series A Software Platform. tZERO currently intends to leverage its experience and expertise from developing and maintaining the Series A Software Platform to develop a trading platform that is capable of trading the tZERO Security Tokens and other tokens or coins that are determined to be securities for purposes of U.S. securities laws (the "Token Trading System"). tZERO currently does not anticipate that the Series A Software Platform will be deployed in connection with the tZERO Security Tokens in the same manner as it is currently deployed by the PRO Securities ATS. As of the date of this Report, tZERO remains in the preliminary stages of the development of such a securities Token Trading System. The Token Trading System may be developed as an additional functionality of the PRO Securities ATS, as a functionality of another U.S. alternative trading system or a U.S. exchange that tZERO operates or designates, as a functionality of a non-U.S. trading system or a non-U.S. exchange that tZERO may operate or designate, or any other format, wherever situated. The Token Trading System may never be developed, and, even if it is developed, may, for a variety of technological, legal and regulatory reasons, never become operational. See "Risk Factors—Risks Relating to Our tZERO Initiatives—tZERO has a limited operating history, which makes it hard to evaluate its ability to generate revenue through operations, and at the date of this filing, tZERO has not generated revenue from any commercially available blockchain-based application," "tZERO expects to develop a new trading platform for the tZERO Security Tokens it plans to issue in connection with its security token offering and for use by other companies that issue tokens treated as securities, but is only in the preliminary stages of development of the new trading platform," "Technology on which tZERO relies for its operations, including the technology underlying the Series A Software Platform tZERO created in 2016 for trading Overstock's Blockchain Voting Series A Preferred shares, may not function properly," and "Strategic purchases of interests and acquisitions tZERO may make may detract from the capital that tZERO could otherwise deploy to improve its business or to develop the Token Trading System." |
• | Blockchain Services - Digital Locate Receipts ("DLR") software. tZERO anticipates that its first commercially available blockchain-based product will be "digital locate receipt" software (the "DLR Software"). The DLR Software is currently in customer production testing, which is being conducted by StockCross, and tZERO has not yet entered into any commercial licenses with any licensees. The DLR Software is intended to help broker-dealer licensees with stock inventory to both load and manage their inventory in order to assist short sellers of public securities in establishing that they have located available shares in the U.S. public securities market prior to effecting short sales. The DLR Software is intended to enable licensees to create a blockchain-based record of the shares that the licensee has made available for "locates" using customizable DLR Software functionality and of the daily purchases of the right to "locate" specifically identified shares for purposes of compliance with regulatory requirements. The broker-dealer licensees of DLR Software are the parties responsible for ensuring that locates issued using the DLR Software comply with all applicable regulations, and the commercial viability of the DLR Software is dependent on the ability of broker-dealer licensees to establish locates using the DLR Software as an effective means of satisfying regulatory obligations in connection with effecting short sales. See "Risk |
15
Factors—Risks Relating to Our tZERO Initiatives—tZERO has a limited operating history, which makes it hard to evaluate its ability to generate revenue through operations, and at the date of this filing, tZERO has not generated revenue from any commercially available blockchain-based application," and "—tZERO may not successfully develop, launch, market or sell its DLR Software."
Other Matters regarding tZERO
On September 27, 2017, tZERO announced a joint venture (JV) with RenGen LLC ("RenGen") and the Argon Group ("Argon") to launch an alternative trading system for the trading of tokens issued in initial coin offerings, or ICOs. Subsequent to this announcement, the parties determined to no longer pursue the development of an alternative trading system. Although the parties are no longer pursuing the development of an alternative trading system, tZERO and RenGen are in the process of re-evaluating a potential JV project, including with respect to consultancy services that the Company and RenGen may decide to provide by means of the JV project. tZERO expects that the re-envisioned JV project, if implemented, will be implemented by the Company and RenGen.
On January 16, 2018, tZERO announced its intent to provide advisory services to WENN Digital ("WENN") in connection with its previously announced KodakCoin Security Token (the "KodakCoin") offering which was initially expected to launch in the first quarter of 2018. To date, tZERO has not provided advisory services to WENN with respect to KodakCoin, and there can be no assurance that tZERO will do so. tZERO expects that the advisory services contemplated in its agreement with WENN will focus on post-ICO matters. Consequently, tZERO has not contributed to, nor reviewed, the contents of the KodakCoin Offering Memorandum or White Paper. As previously announced, the tZERO letter of intent with WENN contemplated KodakCoin being the first third-party security token to launch on tZERO’s Token Trading System, if and when it becomes operational. tZERO can provide no assurances regarding KodakCoin or the KodakCoin ICO.
On December 18, 2017, tZERO launched a $250 million offering (the "security token offering") of the right to acquire, if issued by tZERO in the future, tZERO Preferred Equity Tokens (the "tZERO Security Token") through a Simple Agreement for Future Equity ("SAFE"). The security token offering is expected to run through May 14, 2018 but may be extended or shortened. There can be no assurance as to whether, in what amount or on what terms the security token offering will be completed. See "Risk Factors—Risks Relating to Our tZERO Initiatives—Risks Related to the Ongoing Security Token Offering by tZERO," and "Risks Related to Blockchain Technology." This Annual Report on Form 10-K is not an offering document for the security token offering and does not constitute an offer of, or a solicitation of an offer to buy, any of the securities being offered by tZERO in the security token offering. Any offer of any of the securities being offered by tZERO in the security token offering is made only by the confidential private placement memorandum distributed by tZERO initially dated December 18, 2017, as amended, supplemented and/or restated from time to time (the "Security Token Offering Memorandum"). The Security Token Offering Memorandum is not a part of this Annual Report on Form 10-K and is not incorporated by reference into this Annual Report on Form 10-K. We may purchase up to $30 million of tZERO Security Tokens in the security token offering and/or elect to receive tZERO Security Tokens in exchange for the cancellation of all or a portion of tZERO’s outstanding notes and accumulated interest owed to us; however, we have not yet made a decision regarding the foregoing transactions, and there can be no assurance as to whether or not we will elect to pursue either or both possibilities. If we participate in the security token offering, we will do so at the $10 per tZERO Security Token offering price and will be entitled to the same rights pursuant to our tZERO Security Tokens as third party holders.
To date, tZERO has focused on developing its non-blockchain and blockchain businesses and exploring opportunities for novel applications of blockchain technology. As a result of its early stage of development, tZERO has not yet generated revenue from any commercially available blockchain-based applications. See "Risk Factors—Risks Relating to Our tZERO Initiatives."
Potential Strategic Initiatives
We have engaged Guggenheim Securities, LLC to help us identify and evaluate certain strategic initiatives. We are considering a range of potential transactions, including a sale of our e-commerce business and additional equity or debt financings. Our Board of Directors continually discusses a variety of potential strategic and financial options and other changes to our business, but has not made any determination to undertake any strategic transaction, and may not do so in the foreseeable future or at all.
A sale of our e-commerce business for cash would be subject to the approval of our stockholders in accordance with Delaware law. Subject to approval of the stockholders, if we sell our e-commerce business for cash, we may retain some or all of the after-tax proceeds of the sale for use in our blockchain initiatives. Although we currently expect to return a significant portion of the after-tax proceeds to our stockholders within 12 months following the closing of any such sale, by means of a
16
stock repurchase program, dividend, one or more issuer tender offers to our stockholders and/or other methods, any such decisions will depend on our operating results, strategies, business prospects and general economic and market conditions existing at the time. There can be no assurance that we will engage in a stock repurchase program, dividend, issuer tender offer or otherwise distribute proceeds to stockholders by any other means in a timely manner or at all. The market price of our common stock could decrease substantially. See "Risk Factors—Risks Relating to Our Current Review of Strategic Initiatives—We are exploring strategic initiatives, and decisions we may make could have material adverse effects on our business and the market price of our common stock," "If we sell our e-commerce business, our revenues will decrease substantially, we will need to develop new businesses and sources of revenue, and our business, financial results and prospects may be materially adversely affected," "The price of our common stock has increased substantially recently. If we determine not to sell our Company or our e-commerce business or make other fundamental changes to our business, the price of our common stock may decrease significantly," "If we sell our e-commerce business in order to focus on our blockchain initiatives and related efforts, risks relating to our Medici businesses, including our tZERO initiatives, that may be immaterial to us now would likely each become a material risk to us," and "If we sell our e-commerce business, the Compensation Committee of our Board of Directors may accelerate the vesting, in whole or in part, of some or all outstanding restricted stock units under our Equity Incentive Plan."
Legal and Regulatory Matters
From time to time, we receive claims and become subject to regulatory investigations or actions, consumer protection, employment, intellectual property, and other commercial litigation related to the conduct of our business. We also prosecute lawsuits to enforce our legal rights. Such litigation is costly and time consuming and can divert our management and key personnel from our business operations. The uncertainty of litigation increases these risks. In connection with such litigation, we may be subject to significant damages, associated costs, or equitable remedies relating to the operation of our business and the sale of products on our Website. Any such litigation may materially harm our business, prospects, results of operations, financial condition, or cash flows.
These matters and other types of claims could result in legal expenses, fines, adverse judgments or settlements and increase the cost of doing business. They could also require us to change our business practices in expensive and significant ways. In addition, litigation could result in interpretations of the law that may limit our current or future business, require us to change our business practices, or otherwise increase our costs.
Additional litigation may be necessary in the future to enforce our intellectual property rights, to protect our trade secrets, or to determine the validity and scope of the proprietary rights of others. Any litigation, regardless of outcome or merit, could result in substantial costs and diversion of management and technical resources, any of which could materially harm our business.
For further information, see (see Item 1A—"Risk Factors") and the information set forth under Item 15 of Part IV, "Financial Statements"—Note 12. Commitments and Contingencies, Legal proceedings and contingencies, contained in the "Notes to Consolidated Financial Statements" of this Annual Report on Form 10-K.
Government Regulation
Our main business is subject to general business regulations and laws, as well as regulations and laws specifically governing the Internet, e-commerce, and other services. Existing and future laws and regulations may result in increasing expense and may impede our growth. These regulations and laws may cover taxation, privacy, data protection, pricing, content, copyrights, distribution, mobile communications, electronic device certification, electronic waste, energy consumption, environmental regulation, electronic contracts and other communications, competition, consumer protection, information reporting requirements, the design and operation of websites, and the characteristics and quality of products and services. New state tax regulations in states where we do not now collect state and local taxes may subject us to the obligation to collect and remit state and local taxes, or subject us to additional state and local sales and income taxes, or to requirements intended to assist states with their tax collection efforts. New legislation or regulations, the application of laws and regulations from jurisdictions whose laws do not currently apply to our business or the application of existing laws and regulations to the Internet and commercial online services could result in significant additional taxes on our business. These taxes or tax collection obligations could have an adverse effect on us. Further, there is a possibility that we may be subject to significant fines or other payments for any past failures to comply with these requirements. In addition, it is not clear how existing laws governing issues such as property ownership, libel, and personal privacy apply to the Internet, e-commerce and digital content. Laws and regulations may diminish the demand for our products and services and increase our cost of doing business. Certain of our services are subject to federal and state consumer protection laws, including laws protecting the privacy of consumer information and regulations prohibiting unfair and deceptive trade practices. In particular, under federal and state financial
17
privacy laws and regulations, we must provide notice to consumers of our policies on sharing non-public information with third parties, advance notice of any changes to our policies and, with limited exceptions, we must give consumers the right to prevent sharing of their non-public personal information with unaffiliated third parties. Further, the growth and demand for online commerce could result in more stringent consumer protection laws that could impose additional compliance burdens on us. These consumer protection laws could result in substantial compliance costs.
In addition, our broker dealers are subject to additional extensive regulatory requirements under federal and state laws and regulations and self-regulatory organization ("SRO") rules. Broker dealers are subject to regulation, examination and disciplinary action by the SEC, FINRA and state securities regulators, as well as other governmental authorities and SROs with which they are registered or licensed or of which they are members. See Item 1A—"Risk Factors—Risks Relating to Our Medici Business" and "Risks Relating to Our tZERO Initiatives."
Our efforts to expand our sales outside of the U.S. expose us to additional U.S. and foreign laws and regulations, including but not limited to, laws and regulations relating to taxation, business licensing or certification requirements, advertising practices, online services, the use of cryptocurrency, the importation of specified or proscribed items, importation quotas, consumer protection, intellectual property rights, consumer and data protection, privacy, encryption, restrictions on pricing or discounts, and the U.S. Foreign Corrupt Practices Act and other applicable U.S. and foreign laws prohibiting corrupt payments to government officials and other third parties. Our interest in Bitt Inc. also may expose us to additional laws and regulations relating to money transmitters and money services businesses. See Item 1A—"Risk Factors—Our ownership interest in Bitt Inc. may expose us to additional risks."
Employees
At December 31, 2017, we had approximately 1,800 full-time employees. We seasonally increase our workforce during our fourth quarter to handle increased workload in both our warehouse and customer service operations. We have never had a work stoppage and none of our employees are represented by a labor union. We consider our employee relationships to be good. Competition for qualified personnel in our industry is intense, particularly for software engineers and other technical staff.
Executive Officers of the Registrant
The following persons were executive officers of Overstock as of March 8, 2018:
Executive Officers | Age | Position | ||
Patrick M. Byrne | 55 | Chief Executive Officer and Director | ||
Saum Noursalehi | 38 | President, Retail and Director | ||
Jonathan E. Johnson III | 52 | President, Medici Ventures and Director | ||
Amit Goyal | 39 | Senior Vice President, Software Engineering | ||
Robert P. Hughes | 58 | Senior Vice President, Finance and Risk Management | ||
Vidya R. Jwala | 45 | Senior Vice President, Demand Fulfillment | ||
John Paul "J.P." Knab | 38 | Senior Vice President, Marketing | ||
Carter P. Lee | 48 | Senior Vice President, Technology and People Care | ||
Seth A. Moore | 35 | Senior Vice President, Strategy and Chief of Staff to the CEO | ||
Brian L. Popelka | 51 | Senior Vice President, Customer and Partner Care | ||
Vikram R. Raghavan | 36 | Senior Vice President, Product Development | ||
Dr. Patrick M. Byrne has served as our Chief Executive Officer (principal executive officer) and as a Director since 1999, and as Chairman of the Board of Directors from 2001 through 2005 and 2006 through 2014. Dr. Byrne has also served as the Chief Executive Officer of tZERO, a subsidiary of Overstock.com, since July 2015 and also has served as Co-chairman of the Board of Directors for tZERO since October 2017. Dr. Byrne founded Overstock in 1999. From 1994 to the present, Dr. Byrne has served as a Manager of the Haverford Group, an investment company and an affiliate of Overstock. Dr. Byrne holds a bachelor's degree in Chinese studies from Dartmouth College, a master's degree from Cambridge University as a Marshall Scholar, and a doctorate in philosophy from Stanford University.
Mr. Saum Noursalehi has served as our President of Retail since August 2016 and as a Director since May 2017. Mr. Noursalehi joined Overstock in 2005 and previously served as Chief Revenue Officer and Senior Vice President, Vice President
18
of OLabs, Vice President of Product Development, and held roles in website, mobile and search engine optimization. Mr. Noursalehi holds a bachelor's degree in Computer Science from the University of Utah.
Mr. Jonathan E. Johnson III has served as President of Medici Ventures since August 2016 and as a Director since 2013. Mr. Johnson also served as our Chairman of the Board of Directors from 2014 through 2017. Mr. Johnson joined Overstock in 2002 and previously served as our President, Senior Vice President, and General Counsel. Mr. Johnson holds a bachelor's degree in Japanese from Brigham Young University and received his law degree from the J. Reuben Clark, Jr. Law School at Brigham Young University.
Mr. Amit Goyal was appointed as our Senior Vice President of Software Engineering in February 2017. Mr. Goyal joined Overstock in 2006 and previously served as Vice President of Product Development, Senior Director of Software Development, and Software Development Lead. Mr. Goyal holds a bachelor's degree in Engineering from Punjab Technical University.
Mr. Robert P. Hughes (principal financial and accounting officer) has served as our Senior Vice President, Finance and Risk Management since 2013. Mr. Hughes joined Overstock in 2008 and previously served as Vice President and Controller. Mr. Hughes holds a bachelor's degree in Business Administration with an emphasis in Accounting and Finance from the University of California Berkeley, Haas School of Business, and is a certified public accountant (CA - inactive status).
Mr. Vidya R. Jwala has served as our Senior Vice President of Demand Fulfillment since joining Overstock in August 2016. Prior to joining Overstock, Mr. Jwala served as Vice President, Merchandising / Operations at Walmart from 2009 to 2016 and previously held similar roles at Tractor Supply Company, Lowe's, and Jo-Ann Stores. Mr. Jwala holds a master's degree in Industrial and Systems Engineering from Virginia Polytechnic Institute and State University.
Mr. John Paul "J.P." Knab has served as our Senior Vice President of Marketing since March 2016, having returned to Overstock after serving for one-year as the Senior Vice President of Marketing, Merchandising and Business Development for U.S. Water Filters in St. Paul, Minnesota. Mr. Knab originally joined Overstock in 2005 and previously served as our Vice President of Marketing and held other roles including Director of Merchandising and Director of Analytics. Mr. Knab holds an MBA with a Marketing emphasis and a bachelor's degree in Finance from Brigham Young University.
Mr. Carter P. Lee has served as our Senior Vice President of Technology and People Care since 2015. Mr. Lee joined Overstock in Overstock in 2001 and previously served as Vice President of Technology Operations and held other roles including Director of Internal Systems. Prior to joining Overstock, Mr. Lee was a Systems Engineer for Hospice of the Valley and Vice President of Technology for Motherboard Discount Center in Phoenix, AZ.
Mr. Seth A. Moore was appointed as our Senior Vice President of Analytics in February 2017 and later appointed as Senior Vice President of Strategy in December 2017, and as Chief of Staff to the CEO in October 2017. Mr. Moore joined Overstock in 2006 and previously served as Vice President of OLabs, Vice President of Analytics, and Vice President of Website Marketing. Mr. Moore holds a bachelor's degree in Political Science from Brigham Young University.
Mr. Brian L. Popelka has served as a Senior Vice President of Customer and Partner Care since 2013. Mr. Popelka joined Overstock in 2002 and previously served as Vice President of Customer Care, Director of Books, Media, Movies and Games Department, and Manager of the Business-to-Business Department. Mr. Popelka holds a bachelor's degree in Journalism, Broadcasting, Film and History from the University of Nebraska.
Mr. Vikram R. Raghavan was appointed as our Senior Vice President of Product Development in February 2017. Mr. Raghavan previously served as Vice President of Product Development, Vice President of Marketing since returning to Overstock in 2015. Mr. Raghavan originally joined Overstock in 2008 and held roles including Senior Director of Marketing. From 2011 through 2015 Mr. Raghavan served as the co-founder of Rental Roost, an online apartment listing service whose assets were recently acquired by Overstock. Mr. Raghavan holds an MBA with a Finance and Marketing emphasis from Temple University.
None of our officers has an employment agreement or any specific term of office.
Available Information
Our Annual Report on Form 10-K, Quarterly Reports on Form 10-Q, Current Reports on Form 8-K and other reports filed or furnished pursuant to Section 13(a) or 15(d) of the Securities Exchange Act of 1934, as amended, are available free of charge through the Investor Relations section of our main website, www.overstock.com, as soon as reasonably practicable after
19
we electronically file such material with, or furnish it to, the Securities and Exchange Commission. Our Internet Website and the information contained therein or connected thereto are not a part of or incorporated into this Annual Report on Form 10-K.
20
ITEM 1A. RISK FACTORS
Please consider the following risk factors carefully. If any one or more of the following risks were to occur, it could have a material adverse effect on our business, prospects, financial condition and results of operations, and the market price of our securities could decrease significantly. Statements below to the effect that an event could or would harm our business (or have an adverse effect on our business or similar statements) mean that the event could or would have a material adverse effect on our business, prospects, financial condition and results of operations, which in turn could or would have a material adverse effect on the market price of our securities. Many of the risks we face involve more than one type of risk. Consequently, you should read all of the risk factors below carefully, including the risk factors under the caption "Risks Related Primarily to our Common Stock and Other Securities" before making any decision to acquire or hold our common stock or preferred stock. Virtually all of the risks of holding our common stock are also risks for holding our Series A Preferred Stock and our Series B Preferred Stock.
Holders of, and potential investors in, our Series A Preferred Stock should also read "Additional Risks Related Primarily to our Series A Preferred Stock," and "Additional Risks Related to our Series A Preferred Stock and our Series B Preferred Stock," below.
Holders of, and potential investors in, our Series B Preferred Stock should also read "Additional Risks Related to our Series A Preferred Stock and our Series B Preferred Stock," below.
Persons who are party to a Simple Agreement for Future Equity ("SAFE") with tZERO, or who are considering becoming party to a SAFE with tZERO, and persons who are potential investors in tZERO Security Tokens to be issued by tZERO, should also read "Risks Related to the Ongoing Security Token Offering by tZERO" below.
Any investment in our securities involves a high degree of risk. Investors should consider carefully the risks and uncertainties described below, and all other information in this Form 10-K and in any reports we file with the SEC after we file this Form 10-K, before deciding whether to purchase or hold our securities. Additional risks and uncertainties not currently known to us or that we currently deem immaterial may also become important factors that may harm our business. The occurrence of any of the risks described in this Form 10-K could harm our business. The trading price of our securities could decline due to any of these risks and uncertainties, and investors may lose part or all of their investment.
Risks Relating to Our Company
We have a history of significant losses. If we do not maintain profitability, our financial results and business could be harmed, and our stock price could suffer.
We have a history of losses, and we may incur operating and net losses in the foreseeable future. At December 31, 2017 our accumulated deficit was $254.7 million. We need to generate significant revenues to be profitable, and we may not be able to do so. In addition to our net loss for the year ended December 31, 2017, we incurred interim net losses during 2015 and 2016, and we may be unable to achieve or maintain profitability in the future. If our revenues grow more slowly than we anticipate or decline, or if our expenses exceed our expectations, our financial results would be harmed and our business, prospects, financial condition and results of operations could fall below the expectations of our partners and other companies with which we do business, as well as public market analysts and investors. The occurrence of any of the foregoing could have a material adverse effect on our financial results and business.
Currently effective changes in accounting standards governing our financial reporting could have a material adverse effect on our future net revenues beginning with the quarter ending March 31, 2018.
The Financial Accounting Standards Board (FASB), which sets accounting standards for U.S. public companies, has issued new standards relating to revenue recognition, which became effective on January 1, 2018, and which will apply to our interim financial statements for the quarter ending March 31, 2018. We are in the process of analyzing the new standards and their application to our processes, accounting, financial reporting presentation, disclosures, and controls. We have not reached definitive conclusions about the effects of the new standards on our future financial reporting, but have identified gross versus net revenue recognition, the timing of revenue recognition (when goods are shipped by a supplier versus when the goods are received by the purchaser), and the allocation of performance obligation related to the loyalty program (standalone selling price consideration) as potentially significant issues in our analysis. Of these issues, the gross versus net revenue recognition issue is the most significant. We generate substantially all of our revenues in our retail partner business, in which we sell merchandise primarily through our Website that we fulfill through manufacturers, distributors, and other suppliers. Under previous FASB standards, we recognized revenue from the majority of these sales transactions on a gross basis. We have not reached a definite
21
conclusion, but we believe we will continue to recognize revenue from the majority of our retail business on a gross basis. If our adoption of the new standards requires us to recognize these revenues on a net basis, our future revenue will be substantially less than it was under the previous standards despite having no impact on gross profits. This could have a material adverse effect on the market price of our common stock.
The impact of the Tax Cuts and Jobs Act on our current and future financial results, including impact of deferred tax assets and the one-time transition tax on unremitted foreign earnings, is uncertain.
The Tax Cuts and Jobs Act ("TCJA"), which was enacted on December 22, 2017, will have a significant effect on our domestic and international tax positions. The new law lowers the corporate tax rate from 35% to 21% for tax years beginning in 2018, transitions U.S international taxation from a worldwide tax system to a territorial system, and includes a one-time transition tax on the mandatory deemed repatriation of cumulative foreign earnings as of December 31, 2017. The TCJA also eliminates or limits numerous other deductions and tax benefits, and significantly changes international tax rules. As of December 31, 2017, we have not completed our accounting for the tax effects of the TCJA. During the quarter, we recorded a net charge of $25.3 million based on reasonable estimates for those tax effects. Although the tax rate reduction is known, our analysis may also be affected by other analyses related to the TCJA, including, but not limited to, our calculation of the mandatory deemed repatriation of cumulative foreign earnings and the state tax effect of adjustments made to federal temporary differences, which are uncertain at this time. The net charge is subject to revisions as we complete our analysis of the TCJA, collect and prepare necessary data, and interpret any additional guidance issued by the U.S. Treasury Department, Internal Revenue Service ("IRS"), FASB, and other standard-setting and regulatory bodies. Adjustments may materially impact our provision for income taxes and effective tax rate in the period in which the adjustments are made. Given the complexity of the TCJA and the significant changes to prior tax law, its impact and effect on us is uncertain.
We have significant deferred tax assets, and we may not be able to realize these assets in the future.
We have established a valuation allowance for our net deferred tax assets, primarily due to realized losses and uncertainty regarding our future taxable income. Determining whether a valuation allowance for deferred tax assets is appropriate requires significant judgment and an evaluation of all positive and negative evidence. At each reporting period, we assess the need for, or the sufficiency of, a valuation allowance against deferred tax assets. We intend to maintain a valuation allowance on our net deferred tax assets until there is sufficient evidence to support the reversal of all or some portion of these allowances.
If we sell our e-commerce business for cash, we would incur a substantial corporate level income tax liability.
If we sell our e-commerce business for cash in a transaction taxable to the Company, the corporate level income tax liability to the Company would depend in part on the sales price but would be substantial. Any net operating losses and credits we have that might be used to reduce the income tax liability to the Company would be unlikely to reduce the tax liability by a significant amount.
If we sell our e-commerce business for cash, we may not make any immediate distribution of the after-tax proceeds to stockholders.
A sale of our e-commerce business for cash would be subject to the approval of our stockholders in accordance with Delaware law. Subject to approval of the stockholders, if we sell our e-commerce business for cash, we may retain some or all of the after-tax proceeds of the sale for use in our blockchain initiatives. Although we currently expect to return a significant portion of the after-tax proceeds to our stockholders within 12 months following the closing of any such sale, by means of a stock repurchase program, dividend, one or more issuer tender offers to our stockholders and/or other methods, any such decisions will depend on our operating results, strategies, business prospects and general economic and market conditions existing at the time. There can be no assurance that we will engage in a stock repurchase program, dividend, issuer tender offer or otherwise distribute or return proceeds to stockholders by any other means in a timely manner or at all. The market price of our common stock could decrease substantially.
We may incur substantial federal income tax expense as a result of the security token offering being conducted by tZERO.
Our majority-owned subsidiary tZERO launched a security token offering (the "security token offering") of up to $250 million (subject to increase or decrease) of tZERO Security Tokens on December 18, 2017. In the security token offering, tZERO is offering purchasers the right to acquire, if issued by tZERO in the future, tZERO Security Tokens. The security token offering, which has recently been extended to May 14, 2018 (subject to further extension or earlier termination), is ongoing, and there can be no assurance as to whether, at what amount, or on what terms the security token offering will be completed.
22
Although we believe that the sale of the tZERO Security Tokens should be treated as a sale of equity for tax purposes, if the proceeds were treated as income to us for federal income tax purposes, we would have a substantial federal income tax expense as a result of the security token offering.
If we fail to accurately forecast our expenses and revenues, our business may be harmed.
The rapidly evolving nature of our industry generally and the constantly evolving nature of our business in particular make forecasting our operating results difficult. We periodically implement large, complex and expensive infrastructure upgrades in order to increase our ability to handle larger volumes of sales and to develop or increase our ability to perform a variety of analytical procedures relating to our business. We are continuing to upgrade and further expand these and other components of our infrastructure. As a result of expenditures on our infrastructure and headquarters, our ability to reduce our expenditures is and will be limited, and any significant shortfall in the revenues for which we have built and are continuing to build our business could have a material adverse effect on our financial results and business.
Changes in assumptions, estimates and judgments by management related to complex accounting matters could affect our financial results significantly.
The rules governing our financial reporting require our management to make many subjective assumptions, estimates and judgments about revenue recognition, accounting for income taxes, and accounting for intangible assets other than goodwill in a business combination. Changes in any of these assumptions, estimates or judgments could change our reported or expected financial performance significantly, and could have a material adverse effect on our financial results and business.
Our income tax provisions and the amounts we reserve for tax contingencies are estimates and are subject to variations and adjustments, and our risk of substantially increased federal income tax liability is substantially increased by the strategic alternatives we are considering. The amounts we ultimately pay may exceed the amounts estimated or accrued.
Our quarterly tax provision and our quarterly estimate of our annual effective tax rate are subject to significant variations due to several factors. These include variability in accurately predicting our pre-tax and taxable income and loss and the mix of jurisdictions to which they relate, relative changes of expenses or losses for which tax benefits are not recognized, changes in how we do business, fluctuations in our stock price, and changes in law, regulations, and administrative practices. Additionally, our effective tax rate can be more or less volatile based on the amount of pre-tax income. For example, the impact of discrete items and non-deductible expenses on our effective tax rate is greater when our pre-tax income is relatively low. We are subject to audits by a number of tax authorities. The timing of the resolution of income, sales and other tax examinations is highly uncertain, and the amounts ultimately paid, if any, upon resolution of the issues raised by the taxing authorities may differ from the amounts we have accrued. It is possible that within the next 12 months we will receive additional assessments by various tax authorities or reach resolution of tax examinations in one or more jurisdictions. These assessments or settlements may result in changes to our contingencies related to positions on prior years' tax filings and may result in increases to amounts we have accrued. The volatility of our quarterly tax provision, the resolution of matters related to our tax contingencies, and establishment of or increases to any such accruals could have a material adverse effect on our financial results and business. The strategic alternatives we are currently considering increase these risks and the risks that we will incur substantially increased federal income tax liabilities.
A subsidiary of ours owns the land on which we built our headquarters, and we may incur environmental expense and liabilities under the environmental indemnity agreements we entered into in connection with our current credit facility or our prior credit facility.
In 2014, our wholly-owned subsidiary O.com Land, LLC purchased land near Salt Lake City, Utah on which we have built our new headquarters. The land is part of the Midvale SLAG Superfund Site ("Site"), a former Comprehensive Environmental Response, Compensation and Liability Act ("CERCLA") superfund site. O.com Land, LLC is required to follow certain requirements of CERCLA and the consent decree governing remediation of the Site, and its failure to do so could expose us to material environmental liabilities. Further, in connection with the credit facilities we entered into with U.S. Bank and with PCL L.L.C., we entered into broad environmental indemnity agreements relating to the property. Any such environmental liabilities, and any liabilities under any environmental indemnity agreement, could be material and could have a material adverse effect on our financial results and business.
23
We have incurred substantial indebtedness to an affiliate of our Chief Executive Officer which we are contractually obligated to repay under various circumstances, and we may be unable to obtain a new credit facility on favorable terms or at all.
On November 6, 2017, we borrowed $40.0 million under a term loan agreement with PCL L.L.C., a Utah limited liability company ("PCL"). PCL is directly or indirectly wholly owned by John Byrne, who is the brother of our chief executive officer Patrick Byrne, and Dorothy Byrne, who is the mother of Patrick Byrne and John Byrne. We are contractually obligated to repay the PCL loan in full under various circumstances. Alternative financing may not be available to us on favorable terms, or at all. If we are required to repay the PCL loan and are unable to obtain a new credit facility on favorable terms or at all, we would have no immediate access to borrowed funds, which could have a material adverse effect on our ability to take advantage of opportunities requiring more cash than we then have on hand or to respond to unexpected cash requirements or other liquidity issues that we may face from time to time. Our inability to generate sufficient cash flow from operations or obtain additional funds or alternative financing on acceptable terms could have a material adverse effect on our financial results and business. Further, any other indebtedness we may incur may increase our business risks, including our vulnerability to industry downturns and competitive pressures.
The terms of our term loan agreement include unusual repayment and default triggers.
Our loan agreement with PCL and the deed of trust and other agreements relating to the loan agreement include unusual mandatory repayment and default provisions. In addition to more customary provisions regarding mandatory prepayments and defaults, each of the following would (i) require mandatory prepayment, (ii) violate the covenants in the loan documents, and/or (iii) constitute an event of default under the loan agreement or related agreements:
• | Overstock changes ownership, merges with or acquires another entity or changes its name; |
• | Overstock or Overstock's wholly-owned subsidiary O.Com Land fails to meet all federal, state and local municipality regulations relating to the operations of their respective businesses; |
• | Overstock effectuates a material change in its or any of its affiliates' capital structure; |
• | Overstock engages in any business activities substantially different from those in which it was engaged on November 6, 2017; |
• | the decision making and control of Overstock and/or O.Com Land change in any material respect after November 6, 2017; |
• | any diminution in Patrick Byrne's ownership of Overstock occurs; |
• | any loss of management control of Overstock by Patrick Byrne occurs; |
• | the manager of O.Com Land withdraws as such; |
• | Overstock, or any of its affiliates, materially change its/their ownership and/or equity structure after November 6, 2017; and |
• | O.Com Land defaults under any agreement in favor of another creditor that may materially affect O.Com Land's ability to perform its obligations under the PCL loan documents. |
These default provisions include matters over which we have no control, and other matters over which neither we nor our Chief Executive Officer Patrick Byrne has any control. Further, some of the provisions are ambiguous. If we default and are unable to cure the default or obtain a waiver, we would be required to repay the full amount then outstanding under the loan agreement, which would have a material adverse effect on our liquidity and financial results and business. In addition, upon a default in payment or the performance of any covenant or condition under the loan documents, the interest rate would increase to 18% per annum, which would make it more difficult to pay amounts due under the loan and could have a material adverse effect on our financial results and business.
Our obligations under our term loan agreement are secured by our corporate headquarters and the related land, fixtures and certain personal property related to our headquarters.
Our term loan from PCL is structured as a real estate loan, and our obligations under the loan agreement and related agreements are secured by our corporate headquarters and the related land, fixtures and certain personal property related to our headquarters. If we default and PCL forecloses on our assets we would have to enter into a new lease of the headquarters with a new owner and replace essential equipment, if possible, or relocate our headquarters, and the default and foreclosure would have a material adverse effect on our financial results and business.
24
Changes in management roles and responsibilities, the loss of key personnel, particularly technical personnel, or any inability to attract and retain additional personnel could affect our ability to successfully grow our business.
Our performance is substantially dependent on the continued services and on the performance of our senior management and other key personnel. Our performance also depends on our ability to retain and motivate our officers and key employees. Changes in the roles and responsibilities of members of management or the loss of the services of any of our executive officers or other key employees for any reason could harm our business. Members of senior management or key employees may need to take a leave of absence for medical or other reasons. In 2013 our Chief Executive Officer and then Chairman of the Board, Dr. Patrick Byrne, took a two-month leave of absence for medical reasons, and in 2016 he took a three-month leave of absence for medical reasons. We do not have employment agreements with any of our key personnel and we do not maintain "key person" life insurance policies. Our future success also depends on our ability to identify, attract, hire, train, retain and motivate other highly-skilled technical, managerial, editorial, merchandising, marketing and customer service personnel. For example, the platform and trading system that may be developed by tZERO, including the technology and intellectual property that may be developed in connection with the project, is expected to be developed primarily by a small number of key employees of tZERO and its affiliates. Competition for such personnel, particularly technical personnel including high-end data engineers, experts in rapidly developing fields including artificial intelligence and machine learning, and other technical experts, is intense. Our failure to attract and retain the necessary personnel could have a material adverse effect on our financial results and business. In addition, certain changes in our relationship with Dr. Patrick Byrne could result in a default under and/or early mandatory pre-payment obligation of our $40 million loan. See "-The terms of our term loan agreement include unusual repayment and default triggers" above.
Acquisitions we have made and may make will increase costs and regulatory and integration risks.
From time to time we have acquired, and may in the future acquire, other businesses or the assets of other businesses. Integrating an acquired business or its assets involves a number of risks and financial, managerial and operational challenges. We have incurred significant expenses in connection with acquisitions we have made in the past, and expect to incur additional expenses in connection with those acquisitions or in connection with other acquisitions we may make in the future. Our profitability has been and may continue to be adversely affected by such acquisitions. Further, acquisitions may also create a need for additional accounting, tax, compliance, documentation, risk management and internal control procedures, and may require us to hire additional personnel to implement, perform and/or monitor such procedures. To the extent our procedures are not adequate to appropriately implement, perform and/or monitor all necessary procedures relating to any new or expanded business, we could be exposed to a material loss or regulatory sanction. The occurrence of any of the foregoing could have a material adverse effect on our financial results and business.
We are subject to the risk of possibly becoming an investment company under the Investment Company Act.
The Investment Company Act regulates certain companies that invest in, hold or trade securities. As a result of a portion of our assets consisting of minority investment positions, we are subject to the risk of inadvertently becoming an investment company. Because registration under the Investment Company Act would make it impractical for us to operate our business, we need to avoid becoming subject to the registration requirements of the Investment Company Act. To do so, we intend to monitor the value of our investments and structure transactions to avoid the registration requirements of the Investment Company Act. As a result, we may structure transactions in a less advantageous manner than if we did not have Investment Company Act concerns, or we may avoid otherwise economically desirable transactions due to those concerns. In addition, events beyond our control, including significant appreciation or depreciation in the value of certain of our holdings or adverse developments with respect to our ownership of certain of our subsidiaries, could result in us inadvertently becoming an investment company. If it were established that we were an investment company, there would be a risk, among other material adverse consequences, that we could become subject to monetary penalties or injunctive relief, or both, in an action brought by the SEC, that we would be unable to enforce contracts with third parties or that third parties could seek to obtain rescission of transactions with us undertaken during the period it was established that we were an unregistered investment company. If it were established that the Company were an investment company, this would have a material adverse effect on our business and financial operations and our ability to continue as a going concern.
We are routinely involved in substantial litigation.
From time to time we receive claims and become subject to lawsuits involving consumer protection, employment, intellectual property and other matters related to the conduct and operation of our business and the sale of products on our Website, including claims by regulators and by customers. In addition, we have in the past been and in the future may be, involved in substantial litigation. We are currently a named defendant in litigation now in the United States Supreme Court regarding the constitutionality of certain state tax laws. See "- Risks Relating to Our E-commerce Business -The United States
25
Supreme Court has granted certiorari in a case seeking to overturn Quill" below. Litigation can be costly and time consuming and could divert management and key personnel from our regular business operations. An unfavorable resolution of any substantial litigation matter could have a material adverse effect on our financial results and business.
We may be accused of infringing intellectual property rights of third parties.
We have been and expect we will continue to be subject to claims that we have infringed the intellectual property rights of others, by offering allegedly infringing products or otherwise. We have contested and expect to continue to contest claims we consider unfounded rather than settling such claims, even when we expect the costs of contesting the claims to exceed the cost of settlement. Any claims may result in significant expenditure of our financial and managerial resources, and may result in us making significant damages or settlement payments or changes to our business. We could be prohibited from using software or business processes, or required to obtain licenses from third parties, which could be expensive or unavailable. Any such difficulties could have a material adverse effect on our financial results and business.
We may be unable to protect our proprietary technology and to obtain trademark protection for our marks.
Our success depends to a significant degree upon the protection of our software and other proprietary intellectual property rights. We may be unable to protect it, in the United States or elsewhere, which could have a material adverse effect on our business. Further, we may not be able to secure protection for our service marks or trademarks in the United States or elsewhere as we expand internationally. Our competitors might adopt product or service marks similar to our marks, or might try to prevent us from using our marks. Any claim by another party against us or customer confusion related to our trademarks, or our failure to obtain trademark registration, could have a material adverse effect on our financial results and business.
We engage in related party transactions, which could result in conflicts of interest involving our management.
We have engaged in the past, and continue to engage, in related party transactions with members of our management, including with Patrick Byrne, our Chief Executive Officer and a director, and Saum Noursalehi, our President, Retail, and their affiliates. In November 2017, our subsidiary O.com Land, borrowed $40 million from PCL, an entity owned by the brother and mother of Dr. Byrne. We guaranteed the loan and secured it by pledging our corporate headquarters, the land on which it is located and certain fixtures and personal property related to the property. In connection with the loan, O.com Land entered into an environmental indemnity agreement in favor of PCL. The loan is subject to mandatory prepayment under various circumstances, including our consummation of any significant financing. Dr. Byrne is also a party to our Memorandum of Understanding ("MOU") with Hernando de Soto and personally plans to pay $14 million to help launch the project contemplated by the MOU, and to receive a 17% ownership interest in DeSoto, Inc., 50% of the common stock of which is to be owned by Medici Ventures. Dr. Byrne is expected to serve as Co-chairman and Chief Executive Officer of DeSoto. In addition, we are party to a software licensing agreement with SiteHelix Inc., an entity majority-owned by our President, Retail and Board member Saum Noursalehi, pursuant to which we have made payments to SiteHelix totaling approximately $31,000 during the two years ended December 31, 2017. In February 2018, we also purchased the assets of Rental Roost and Houserie, companies in which our Senior Vice President Vikram Raghavan is a shareholder, for a combined purchase price of $600,000, and in January 2018, Medici Ventures purchased an interest in Bitsy, Inc., a startup company founded and one-third owned by Medici Ventures' chief operating officer and general counsel, for $1 million. We have policies and procedures in connection with entering into related party transactions, including a requirement for audit committee approval, which were followed in connection with the foregoing transactions. However, related party transactions may present conflicts of interest and could result in disadvantages to our company, which could materially and adversely affect us.
Our ownership of less than 100% of tZERO and other subsidiaries may cause conflicts of interest.
At December 31, 2017, our wholly-owned subsidiary Medici Ventures owned 81%, and it currently owns approximately 80%, of the outstanding common stock of tZERO, and tZERO employees, former employees and others own the balance of the shares. Medici Ventures has issued employee stock options that may result in our owning less than 100% of Medici Ventures in the future, which would also reduce our effective interest in tZERO. The boards of directors of tZERO and Medici Ventures must consider the interests of all of their stockholders, and the interests of the individual stockholders may differ from our interests. Any significant divergence between our interests and the interests of other stockholders, who are also likely to be employees, of our majority owned subsidiaries, could result in disagreements regarding business matters and could have an adverse effect on employee morale and on our business.
Our 50% subsidiary DeSoto, Inc. is a public benefit corporation.
26
Our subsidiary Medici Ventures has formed DeSoto, Inc. as a public benefit corporation under Delaware law. Directors of traditional corporations, including Overstock and Medici Ventures, are required to make decisions they believe to be in the best interests of their stockholders. The directors of DeSoto are required by Delaware law to manage DeSoto in a manner that balances (1) DeSoto's stockholders' pecuniary interests, (2) the best interests of those materially affected by DeSoto's conduct, and (3) DeSoto's public benefit purpose, which is to promote full financial inclusion, economic advancement, and enfranchisement of individuals, by creating systems using blockchain and other technologies that help individuals prove rightful ownership of assets, capitalize their assets, and establish a formal identity. As a result, DeSoto may not have the same focus on profitability that Overstock and Medici Ventures have, and the duties of the officers and directors of DeSoto, some of whom also are or will be officers and/or directors of Overstock and/or Medici Ventures, may conflict with the duties of the officers and directors of Medici Ventures and Overstock. Even in the absence of common directors, conflicts of interest may arise. In addition, DeSoto does not currently have a specific plan to generate revenues or profits, and does not expect to generate revenues or profits for the foreseeable future, and we may need to provide additional capital to DeSoto.
We and tZERO have each recently received notice that the staff of the SEC's Division of Enforcement is conducting an investigation and has requested information regarding the tZERO security token offering.
In February 2018, the Division of Enforcement of the SEC informed tZERO and subsequently informed us that it is conducting an investigation and requested that we and our affiliates, including Medici Ventures and tZERO voluntarily provide certain information and documents related to tZERO and the tZERO security token offering in connection with its investigation. We are in the process of responding to these document requests and intend to cooperate fully with the SEC in connection with its investigation, which will require the time and attention of tZERO and our personnel, and may have an adverse effect on our ability to focus attention on our businesses and our ability to raise capital. In addition, the investigation could result in a delay of the tZERO security token offering, negative publicity for tZERO or us, and may have a material adverse effect on us or on the current and future business ventures of tzero.
Risks Relating to Our Current Review of Strategic Initiatives
We are exploring strategic initiatives, and decisions we may make could have material adverse effects on our business and the market price of our common stock.
We are currently exploring certain strategic initiatives, and decisions we make could change our business fundamentally and increase the risks and uncertainties of our business substantially. We are considering a range of potential transactions, including a sale of our e-commerce business, a sale of, or business combination involving, our entire Company, and additional equity or debt financings. There can be no assurance that we will pursue or consummate any strategic transaction or, if consummated, that any such transaction will ultimately be favorable to the Company and its stockholders. Any such transaction could materially adversely affect our business and financial results. In addition, our exploration of strategic and financing options has required and will continue to require significant time and attention by our management, and the incurrence of significant expenses. Further, our efforts to keep investors informed about our consideration of strategic alternatives may result in distraction among our employees and may adversely affect our business.
If we sell our e-commerce business, our revenues will decrease substantially, we will need to develop new businesses and sources of revenue, and our business, financial results and prospects may be materially adversely affected.
If we sell our e-commerce business in order to focus on our efforts on our Medici initiatives, our revenues would decrease to an insignificant amount. Our e-commerce business is a relatively mature and predictable business compared to our Medici initiatives, which have a short history, minimal revenues, significant expenses, significant losses and significant uncertainties, and conduct business in a new and rapidly changing industry. We would continue to bear most of the expenses we currently bear as a publicly held company, but would have to build a new business and develop new sources of revenue based on our blockchain initiatives, and there is no assurance that we would be able to do so or, even if we could do so, that our new business could become profitable.
The price of our common stock has increased substantially recently. If we determine not to sell our Company or our e-commerce business or make other fundamental changes to our business, the price of our common stock may decrease significantly.
The trading prices of our common stock have increased substantially recently. In the third quarter of 2017, our common stock traded at a low of $14.30; in the fourth quarter of 2017 it traded at a high of $82.70. To the extent that the stock price increases resulted from our disclosures about our exploration of strategic alternatives, any decision or announcement of
27
any decision we may make not to pursue any such strategic alternatives, or to pursue a strategic alternative at a price less than what is anticipated by the market, could cause the market price of our common stock to decrease significantly.
If we sell our e-commerce business in order to focus on our blockchain initiatives and related efforts, risks relating to our Medici businesses, including our tZERO initiatives, that may be immaterial to us now would likely each become a material risk to us.
If we sell our e-commerce business in order to focus on our blockchain initiatives and related efforts, we would immediately become a much smaller company than we are now. Consequently, risks relating to our Medici businesses, including our tZERO initiatives, which may currently be immaterial to us, would in all likelihood each become material risks to us. See "-Risks Relating to Our Medici Business," and "-Risks Relating to Our tZERO Initiatives" below.
If we sell our e-commerce business, the Compensation Committee of our Board of Directors may accelerate the vesting, in whole or in part, of some or all outstanding restricted stock units under our Equity Incentive Plan.
If we sell our e-commerce business, the Compensation Committee of our Board of Directors may accelerate the vesting, in whole or in part, of some or all outstanding restricted stock units ("RSUs") under our 2005 Equity Incentive Plan, which would result in an increase in the number of shares outstanding, and would dilute stockholders' ownership of our company. Any such determination would be subject to the discretion of the Compensation Committee and such factors as the Compensation Committee might then deem relevant.
Risks Relating to Our E-commerce Business
Our business depends on the Internet, our infrastructure and transaction-processing systems.
We are completely dependent on our infrastructure and on the availability, reliability and security of the Internet and related systems. Substantially all of our computer and communications hardware is located at a single Overstock-owned and -operated facility. Our systems and operations are vulnerable to damage or interruption from fire, flood, power loss, telecommunications failure, terrorist attacks, cyber-attacks, acts of war, break-ins, earthquake and similar events. Our back-up facility is not adequate to support sales at a high level. Our servers and applications are vulnerable to malware, physical or electronic break-ins and other disruptions, the occurrence of any of which could lead to interruptions, delays, loss of critical data or the inability to accept and fulfill customer orders. Any system interruption that results in the unavailability of our Website or our mobile app or reduced performance of our transaction systems could interrupt or substantially reduce our ability to conduct our business. We have experienced periodic systems interruptions due to server failure, application failure, power failure and intentional cyber-attacks in the past, and may experience additional interruptions or failures in the future. Any failure or impairment of our infrastructure or of the availability of the Internet or related systems could have a material adverse effect on our financial results and business.
We rely upon paid and unpaid natural search engines including Google to rank our product offerings, and our financial results may suffer if we are unable to regain our prior rankings in natural searches.
We rely on paid and unpaid natural search engines to attract consumer interest in our product offerings. Google’s search engine is dominant in our business, and has historically been a significant source of traffic to our website, much of it at essentially no incremental cost to us. If the changes we believe Google made in 2017 prevent us from regaining our prior rankings in Google’s natural search engine, we will have to utilize more expensive marketing channels or otherwise compensate for the loss of some of the natural search traffic, and if we are unable to do so, our financial results may suffer and the changes may have a material adverse effect on our business.
The search engines, including Google, Bing, and Yahoo! may continue to change their ranking algorithms, which may further adversely affect our product offerings in paid and/or unpaid searches, and we may at times be subject to ranking penalties if the operators of search engines believe we are not in compliance with their guidelines.
Potential and existing customers use search engines provided by search engine companies, including, but not limited to, Google, Bing, and Yahoo!, which use algorithms and other devices to provide users a natural ranked listing of relevant Internet sites matching a user's search criteria and specifications. Search engine companies change their natural search engine algorithms periodically, and our ranking in natural searches may be adversely affected by those changes, as has occurred from time to time, and which, we believe, occurred again during 2017, reducing our revenue compared to the year ended December 31, 2016, and leading us to pursue revenue growth in other more expensive marketing channels. Search engine companies may
28
also determine that we are not in compliance with their guidelines from time to time, as has occurred in the past, and they may penalize us in their search algorithms as a result.
Some shoppers may not utilize the search engines at all, and we may be unable to reach some of those shoppers.
Large marketplace websites and sites which aggregate marketplace sellers with a large product selection are becoming increasingly popular, and we may not be able to place our products on these sites to take advantage of their internal search platforms. Further, some shoppers may begin their searches at a competitor's website, and may not utilize traditional search engines at all. Our inability to place products on or access these sites may have a material adverse effect on our business.
We are subject to cyber security risks and risks of data loss or other security breaches.
Our business involves the storage and transmission of users' proprietary information, and security breaches could expose us to a risk of loss or misuse of this information, and to resulting claims, fines, and litigation. We have been subjected to a variety of cyber-attacks, which have increased in number and variety over time. We believe our systems are probed by potential hackers virtually 24/7, and we expect the problem will continue to grow worse over time. Cyber-attacks may target us, our customers, our suppliers, banks, credit card processors, delivery services, e-commerce in general or the communication infrastructure on which we depend. Any compromise of our security could result in a violation of applicable privacy and other laws, significant legal and financial exposure, damage to our reputation, and a loss of confidence in our security measures, any of which could have a material adverse effect on our financial results and business. Moreover, any insurance coverage we may carry may be inadequate to cover the expenses and other potential financial exposure we could face as a result of a cyber-attack or data breach.
Our dependence on payment card payments increases our risks.
Most of our customers use credit or other payment cards to pay for their purchases. Under payment card rules and our contracts with our card processors, if we experience a breach of payment card information or fail to follow payment card industry security standards, we could incur significant fines, higher transaction costs or lose our ability to give customers the option of using payment cards. If we were unable to accept payment cards, it would have a material adverse effect on our financial results and business.
Tariffs or other measures that increase the effective price of products we or our suppliers or fulfillment partners import into the United States could have a material adverse effect on our business.
We and many of our suppliers and fulfillment partners source a large percentage of the products we offer on our Website from China and other countries. If the United States imposes tariffs or other measures that directly or indirectly increase the price of products we or they import and that we offer on our Website, the increased prices could have a material adverse effect on our financial results and business.
We face intense competition and may not be able to compete successfully against existing or future competitors.
The online retail market is evolving rapidly and intensely competitive. Barriers to entry are minimal, and current and new competitors can launch new websites at a relatively low cost. We currently compete with numerous competitors, including:
• | online retailers with or without discount departments, including Amazon.com, AliExpress (part of the Alibaba Group), eBay, and Rakuten.com (formerly Buy.com); |
• | online specialty retailers such as Blue Nile, Bluefly, Houzz, Jet.com, Wayfair, Zappos.com, and Zulily; |
• | private sale sites such as Groupon, Living Social and Rue La La; |
• | furniture specialists including Ashley Furniture, Bob's Discount Furniture, Havertys, Raymour & Flanigan and Rooms To Go; |
• | traditional general merchandise and specialty retailers and liquidators including Barnes and Noble, Bed, Bath & Beyond, Best Buy, Costco, Crate and Barrel, Ethan Allen, Gilt, Home Depot, HomeGoods, Hudson's Bay Company, IKEA, J.C. Penney Company, Kirkland's, Kohl's, Lands' End, Lowe's, Macy's, Nordstrom, Pier 1 Imports, Pottery Barn, Restoration Hardware, Ross Stores, Saks Fifth Avenue, Sears, T.J. Maxx, Target, Wal-Mart and Williams-Sonoma, all of which also have an online presence; and |
• | liquidation e-tailers such as SmartBargains. |
We expect that existing and future traditional manufacturers and retailers will continue to add or improve their e-commerce offerings, and that our existing and future e-commerce competitors, including Amazon, will continue to increase
29
their offerings and delivery capabilities. Many of our competitors specialize in one or more of the areas in which we offer products. For example, our furniture offerings compete with more than 100 online retail furniture websites, in addition to many more traditional furniture retail specialists. Some of our competitors run at net losses to gain market share in the online retail market. Competition from Amazon and from other competitors, many of whom have longer operating histories, larger customer bases, greater brand recognition, greater access to capital and significantly greater financial, marketing and other resources than we do, affect us and could have a material adverse effect on our financial results and business.
Our competitors may directly increase our marketing costs and also may cause us to decrease certain types of marketing.
In addition to competing with us for customers, suppliers, and employees, our competitors may directly increase our operating costs, by driving up the cost of various forms of online advertising, as has happened recently, or otherwise. We may elect to decrease our use of sponsored search or other forms of marketing from time to time in order to decrease our costs, which may have a material adverse effect on our financial results and business. We may also elect to spend additional amounts on sponsored search or other forms of marketing from time to time in order to increase traffic to our Website, or to take other actions to increase traffic and/or conversion, and the additional expenditures may have a material adverse effect on our financial results and business.
Our business depends on effective marketing, including marketing via email and social networking messaging, and we intend to increase our spending on marketing and branding, which may adversely affect our financial results.
We depend on effective marketing and high customer traffic. We depend on email to promote our site and offerings and to generate a substantial portion of our revenue. If a significant portion of our target customers no longer utilize email, or if we are unable to effectively and economically deliver email to our potential customers, whether for legal, regulatory or other reasons, it would have a material adverse effect on our business. We also rely on social networking messaging services for marketing purposes, and anything that limits our ability or our customers' ability or desire to utilize social networking services could have a material adverse effect on our business. If we are unable to develop, implement and maintain effective and efficient cost-effective advertising and marketing programs, it would have a material adverse effect on our financial results and business. Further, as part of our growth strategies, we intend to increase our spending on marketing and branding initiatives significantly, which may adversely affect our financial results. There is no assurance that any increase in our marketing or branding expenditures will result in increased market shares or will ultimately have a positive effect on our financial results.
If one or more states successfully asserts that we should collect sales or other taxes on the sale of our merchandise or the merchandise of third parties that we offer for sale on our Website, or that we should pay commercial activity taxes, our business could be harmed.
We generally do not collect sales or other similar taxes on sales of goods into states where we have no duty to do so under federal court decisions construing applicable constitutional law. If any jurisdiction where we do not or did not collect sales or other taxes successfully asserts that we should do so or should have done so, or should otherwise have collected or paid other types of taxes, it could have a material adverse effect on our business. Several states have enacted laws requiring remote vendors to notify resident purchasers in those states of their obligation to pay a use tax on their purchases and, in some instances, to report untaxed purchases to the state tax authorities. Other states have enacted legislation to require retailers without a physical presence in the state to collect and remit state sales taxes if they engage in any activity in connection with the selling, leasing or delivery of tangible personal property or taxable services within the state. In the past we have terminated affiliate marketing websites as a result of efforts by certain states to require us to collect sales taxes based on the presence of our third-party Internet advertising affiliates in those states, and we may do so again, which may have material adverse effect on our financial results and business. Additionally, states may seek to apply economic pressure by enacting similar or new laws, or revising their existing tax positions, to force or encourage remote retailers to collect and remit sales tax. Such laws could harm our business by imposing notice burdens upon us, by requiring transaction notices that would adversely affect sales, or by discouraging customer purchases by requiring detailed purchase reporting. The occurrence of any of the foregoing could have a material adverse effect on our financial results and business.
The United States Supreme Court has granted certiorari in a case seeking to overturn Quill, which if overturned may adversely affect us.
On January 12, 2018, the U.S. Supreme Court granted certiorari in a case in which South Dakota seeks to have a statute imposing economic nexus standards on us and other remote sellers like us upheld by the Supreme Court. We are a named defendant in the case. In its petition for certiorari, South Dakota has asked the Supreme Court to overturn the sales and use tax physical presence nexus requirement previously upheld by the Supreme Court in 1992 in Quill v. North Dakota. We believe that approximately a dozen other states have enacted laws similar or somewhat similar to South Dakota's measures. If
30
the Supreme Court overturns Quill, we could face significant additional requirements to collect sales and use taxes in a number of states, and the requirements could have a material adverse effect on our financial results and business.
Economic factors, including our increasing exposure to the U.S. housing industry, may adversely affect us.
Economic conditions, particularly any weakness in the United States housing market, may adversely affect our financial performance. Over the last few years, the percentage of our sales from home and garden products has increased substantially. We believe that our sales of home and garden products are affected by the strength of the U.S. housing industry, and that downturns in the U.S. housing industry could have a material adverse effect on our financial results and business.
Decreases in discretionary consumer spending may have an adverse effect on us.
A substantial portion of the products and services we offer are products or services that consumers may view as discretionary items rather than necessities. As a result, our results of operations are sensitive to changes in macro-economic conditions that impact consumer spending, including discretionary spending. Difficult macro-economic conditions, particularly high levels of unemployment or underemployment, also impact our customers' ability to obtain consumer credit. Other factors, including consumer confidence, employment levels, interest rates, tax rates, consumer debt levels, and fuel and energy costs could reduce consumer spending or change consumer purchasing habits. Slowdowns in the U.S. or global economy, or an uncertain economic outlook, could materially adversely affect consumer spending habits and could have a material adverse effect on our financial results and business.
We are attempting to expand our international business, which could adversely affect us.
We sell products in international markets, and are attempting to expand into some of these markets. International sales and transactions, and our efforts to expand them, are subject to inherent risks and challenges that could adversely affect us, including:
• | the need to develop new supplier and manufacturer relationships; |
• | the need to comply with additional U.S. and foreign laws and regulations; |
• | changes in international laws, regulatory requirements, taxes and tariffs; |
• | our limited experience with different local cultures and standards; |
• | geopolitical events, such as war and terrorist attacks; |
• | the risk that the products we offer may not appeal to customers in international markets; and |
• | the additional resources and management attention required for such expansion. |
Penalties for non-compliance with laws applicable to international business and trade, including the U.S. Foreign Corrupt Practices Act, could have a material adverse effect on our business. Foreign data protection, privacy and other laws and regulations are different and often more restrictive than those in the United States. Compliance with such laws and regulations will result in additional costs and may necessitate changes to our business practices, which may adversely affect our business. To the extent that we make purchases or sales denominated in foreign currencies, we would have foreign currency risks, which could have a material adverse effect on our financial results and business.
We face risks related to automating our process for onboarding new products.
We are in the process of automating portions of our new product onboarding process that we previously performed manually. As we do so, there is a risk that inappropriate content or products we prohibit may not be properly identified by our new systems and may appear on our Website until we identify and remove them. The appearance of any such products or content on our Website could violate applicable laws or regulations, result in damage to our brand and/or result in claims, fines or penalties, and could have a material adverse effect on our business.
We face risks relating to our inventory and returns.
In our direct business, we sell merchandise that we have purchased and hold in inventory. In addition, subject to our returns policies, we accept returns of products sold through our partners as well as products we sell in our direct business, and we have the risk of reselling the returned products. We assume the risks of inventory damage, theft and obsolescence, as well as risks of price erosion for these products, and we sometimes sell merchandise at a loss. Our risk of losses in our direct business is especially significant because much of the merchandise we sell is subject to seasonal trends, fashion trends, rapid technological change, obsolescence and price erosion, and because we sometimes make large purchases of particular types of
31
inventory. Difficulties we may experience with our inventory or returns could have a material adverse effect on our financial results and business.
If we do not successfully optimize and operate our warehouse, distribution centers and customer service operations, our business could be harmed.
We have expanded, contracted and otherwise modified our warehouse, distribution centers and customer service operations from time to time in the past, and expect that we will continue to do so. We also contract with third parties to operate warehouses and distribution centers, receive returns and process orders. If we or our third-party providers do not successfully optimize and operate our warehouse, distribution centers and customer service operations, it could significantly limit our ability to meet customer demand, customer shipping or return time expectations, or result in excessive costs and expenses for the size of our business. Because it is difficult to predict demand, we may not be able to manage our facilities in an optimal way, which may result in excess or insufficient inventory or warehousing capacity. We may also fail to staff our fulfillment and customer service centers at optimal levels. Our failure to manage our warehouse operations, distribution centers or our fulfillment and customer service centers optimally could adversely affect our financial results and customer experience, and could have a material adverse effect on our financial results and business.
We depend on a large number of other companies to perform functions critical to our ability to deliver products and services to our customers.
We depend on a large number of other companies, including a large number of independent fulfillment partners whose products we offer for sale on our Website, to perform functions critical to our ability to deliver products and services to our customers. We depend on our fulfillment partners to perform a number of traditional retail operations such as maintaining inventory, preparing merchandise for shipment to our customers and delivering purchased merchandise on a timely basis. We also depend on the delivery services that we and they utilize. Difficulties with any of our significant fulfillment partners or with any of the delivery services, regardless of the reason, could have a material adverse effect on our financial results and business.
Risks associated with the suppliers from whom we or our fulfillment partners source products and risks regarding the safety, labelling, content or quality of those products could adversely affect our financial performance.
We depend on our and our fulfillment partners' ability to supply products in a timely and efficient manner. We rely on suppliers' representations of product safety, content and quality. We also rely on our suppliers and partners to ensure proper labelling of products. Issues or concerns regarding product safety, labelling, content or quality could result in consumer or governmental claims and could adversely affect our financial results and business. Any indemnity agreement we may have with a supplier or partner of a product may be inadequate or inapplicable, and any insurance coverage we may carry may be inadequate. Even unsuccessful claims could result in the expenditure of funds and management time and could have a negative impact on our business. The occurrence of any of the foregoing could have a material adverse effect on our financial results and business.
Each of our offerings faces specialized competition and involves regulatory risks.
We offer a variety of services and product offerings, including specialized services and product offerings, such as advertising related to automobiles and for various types of loans, credit cards and insurance offerings, as well as food products. Each of these is subject to substantial regulation and competition. For example, many states and other jurisdictions, including Utah, where we are located, have regulations governing the conduct of automobile sellers and public advertising for automobile sales. We have no ability to know whether the information the automobile advertisers or other advertisers provide is correct. More generally, we have no ability to ensure that our partners or others with whom we do business will comply with all laws and regulations applicable to them and their transactions. Any negative publicity we receive regarding any allegations of unlawful or deceptive conduct may damage our reputation, our ability to attract new customers to our main shopping site, and our brand name generally. The occurrence of any of the foregoing could have a material adverse effect on our financial results and business.
Our decision to accept and hold cryptocurrency, such as bitcoin, may subject us to exchange risk and additional tax and regulatory requirements.
In January 2014, we began accepting bitcoin as a form of payment for purchases on our website, and we now accept approximately 50 different cryptocurrencies. Neither bitcoin nor any of the other cryptocurrencies that we accept are considered legal tender or backed by any government, and bitcoin and other cryptocurrencies have experienced price volatility, technological glitches and various law enforcement and regulatory interventions. In September 2014, we began accepting
32
bitcoin internationally. The use of cryptocurrency such as bitcoin has been prohibited or effectively prohibited in some countries. If we fail to comply with regulations or prohibitions applicable to us, we could face regulatory or other enforcement actions and potential fines and other consequences. Our Board of Directors has authorized us to hold, in bitcoin, up to 50% of our sales revenues paid for by customers in bitcoin. From time to time we hold bitcoin and other cryptocurrencies directly, and we have exchange rate risk on the amounts we hold as well as the risks that regulatory or other developments may adversely affect the value of the cryptocurrencies we hold. At December 31, 2017, we held cryptocurrencies with a carrying value of $1.5 million. We may choose not to hedge or may be unable to fully hedge our exposure to cryptocurrencies and may at times be unable to convert cryptocurrencies to U.S. dollars. We could suffer significant monetary losses if the cryptocurrencies that we hold decline in value. If any regulatory authority asserts that we require a license or other regulatory approval to conduct business or own an interest in other businesses involving cryptocurrencies, it could have a material adverse effect on our financial results and business.
We have an evolving business model, which increases the complexity of our business.
Our business model has evolved in the past and continues to do so. In prior years we added additional types of services and product offerings and in some cases we modified or discontinued those offerings, and in some cases have re-launched offerings we had previously terminated. We intend to continue to try to offer additional types of products or services, and we do not know whether any of them will be successful. From time to time we have also modified aspects of our business model relating to our product mix and the mix of direct/partner sourcing of the products we offer. The additions and modifications to our business have increased the complexity of our business and impacted our management, personnel, operations, systems, technical performance, financial resources, and internal financial control and reporting functions. Future additions to or modifications of our business are likely to have similar effects. Further, any new business or website we launch that is not favorably received by consumers could damage our reputation or our brand. The occurrence of any of the foregoing could have a material adverse effect on our financial results and business.
The seasonality of our business places increased strain on our operations.
A disproportionate amount of our sales normally occur during our fourth quarter. If we, or our partners, do not stock or are otherwise unable to source products sufficient to meet customer demand, our business would be adversely affected. We may experience an increase in our net shipping cost due to complimentary upgrades and the expense of shipments necessary to ensure timely delivery for the holiday season. In addition, we may be unable to adequately staff our fulfillment and customer service centers during peak periods, and delivery services and other fulfillment companies and customer service providers may be unable to meet the seasonal demand. The occurrence of any of the foregoing, or the occurrence of a disappointing fourth quarter for any reason, could have a material adverse effect on our financial results and business.
Existing or future government regulation could harm our business.
We are subject to regulation at the federal, state, local and international levels, including regulation relating to privacy, security, retention, transfer and use of personal user information and telemarketing laws. Increasing regulation may increase the cost of our business and may further restrict our marketing efforts. Our expanding business model may trigger additional regulatory scrutiny. Existing laws, including those governing advertising, product labeling, product content requirements and product safety, may cause us to incur expenses. We may be subject to claims related to personal injury, death, environmental or property damage. We are periodically required to participate in product recalls. We may incur expense in connection with any of the foregoing or other matters or actions which may not be covered by any liability insurance we may carry. These current and future laws and regulations could have a material adverse effect on our financial results and business.
Mobile commerce is becoming increasingly significant to us.
Mobile commerce within our iOS and Android apps is becoming increasingly significant to us. Customers who shop on mobile devices may behave differently from our other customers. If we fail to successfully develop app-specific features or if we fail to keep up with mobile technology and adapt to the changing mobile landscape, it could have a material adverse effect on our business.
Changes we are making to Club O or our loss of Club O Gold members could adversely affect us.
We are planning changes to our Club O offerings in order to enhance the value of Club O to our customers and the value of our Club O customers to us. However, any changes risk alienating or confusing some customers. Because our Club O Gold members tend to be particularly valuable customers, a loss of a significant number of them would have an adverse effect
33
on us. Further, if we fail to successfully implement the changes we are planning or otherwise fail to develop and market our Club O offerings, it could have a material adverse effect on our business.
Our insurance coverage and indemnity rights may not adequately protect us against loss.
The types, coverage, or the amounts of any insurance coverage we may carry from time to time may not be adequate to compensate us for any losses we may actually incur in the operation of our business. Further, any insurance we may desire to purchase may not be available to us on terms we find acceptable or at all. We are not indemnified by all of our suppliers, and any indemnification rights we may have may not be enforceable or adequate to cover actual losses we may incur as a result of our sales of their products. Actual losses for which we are not insured or indemnified, or which exceed our insurance coverage or the capacity of our indemnitors or our ability to enforce our indemnity agreements, could have a material adverse effect on our business.
We are partially self-insured with respect to our employees' health insurance. If the actual costs of these claims exceed the amounts we have reserved for them, we would incur additional expense.
Beginning January 1, 2017, we are partially self-insured with respect to our employees' health insurance, except to the extent of stop-loss coverage that limits our losses both on a per employee basis and an aggregate basis. The actual costs of our employees' health insurance claims could exceed our estimates of those costs for a number of reasons, including more claims or larger claims than we expect, and increases in the costs of healthcare generally. If the actual cost of our employees' health insurance claims and related expenses exceeds the amounts we have accrued, we may be required to record additional charges for these claims and/or to establish additional reserves, which could have a material adverse effect on our financial results and business.
Risks Relating to Our Medici Business
The businesses that we are pursuing through our Medici initiatives are novel and subject to technical, operational, financial, regulatory, legal, reputational and marketing risks.
In August 2015, we acquired the assets and business of a financial technology ("fintech") company and in January 2016, we acquired two registered broker-dealers (our "broker-dealer subsidiaries") that were affiliated with the fintech company. We have limited experience with the operation of fintech companies or of broker-dealers. In December 2016, we issued publicly-traded securities traded exclusively on a registered alternative trading system operated by one of our majority-owned broker-dealer subsidiaries, the ownership of which is tracked on a blockchain. Our majority-owned subsidiary tZERO is working on other potential financial applications of blockchain technology, including the potential development of a trading platform for digital "tokens" or "coins" treated as securities. See "- Risks Relating to Our tZERO Initiatives" below. These are areas in which we do not have substantial experience, and which are subject to the risks of new and novel businesses, including technical, operational, financial, regulatory, legal and reputational risks, as well as the risk that we may be unable to market, license or sell our technology successfully or profitably. The occurrence of any such risks could have a material adverse effect on our financial results and business.
We may be required to write off amounts relating to our interests in startup businesses.
At December 31, 2017, Medici Ventures held minority interests totaling approximately $12 million in several companies that are in the startup or development stages. These interests are inherently risky because the markets for the technologies or products these companies are developing are typically in the early stages and may never materialize. Additionally, since these interests are in companies that are in the early startup or development stages, even if their technology or products are viable, they may not be able to obtain the capital or resources necessary to successfully bring their technology or products to market. Furthermore, we have no assurance that the technology or products of our investees would be successful, even if they were brought to market. We have in the past and may in the future write off additional amounts related to these interests. Any such write-offs could be material, and could have a material adverse effect on our financial results and business.
Our ownership interest in Bitt Inc. may expose us to additional risks.
In 2016, Medici acquired an equity interest in Bitt, Inc., a startup company based in Barbados, which is pursuing a variety of digital currency transfer and payment businesses in the Caribbean. Virtually every state in the U.S. regulates money transmitters and money services businesses. In some states the licensing requirements and regulations expressly cover companies engaged in digital currency activities; in other states it is not clear whether or how the existing laws and regulations apply to digital currency activities. Further, U.S. federal law requires registration of most such businesses with the Financial
34
Crimes Enforcement Network ("FinCEN"). These licenses and registrations subject companies to various anti-money laundering, know-your-customer, record-keeping, reporting and capital and bonding requirements, limitations on the investment of customer funds, and inspection by state and federal regulatory agencies. Under U.S. federal law, it is a crime for a person, entity or business that is required to be registered with FinCEN or licensed in any state to fail to do so. Further, under U.S. federal law, anyone who owns all or part of an unlicensed money transmitting business may be subject to civil and criminal penalties. Bitt has represented to us that it has not taken any action that could subject it to registration with FinCEN or to the licensing requirements in any state and has agreed that it will not do so until it has become properly licensed in all required states and registered with FinCEN. However, if Bitt makes an error, even inadvertently, we could be subject to potential civil and criminal penalties. Any such penalties, or even the allegation of criminal or other illegal activities, could have a material adverse effect on us and on our financial results and business.
Our ownership interest in Bitsy Inc. may expose us to additional risks.
In January 2018, Medici purchased an interest in Bitsy, Inc., a U.S.-based startup company founded and one-third owned by Medici's chief operating officer and general counsel, for $1 million. Bitsy plans to build a regulatory-compliant bridge between the U.S. Dollar and cryptocurrencies, and also hopes to be able to offer our customers the ability to purchase crypto currencies on or through our website. Much like the businesses Bitt is pursuing as described above, various aspects of the business that Bitsy plans to engage in are heavily regulated. Virtually every state in the U.S. regulates money transmitters and money services businesses. In some states the licensing requirements and regulations expressly cover companies engaged in digital currency activities; in other states it is not clear whether or how the existing laws and regulations apply to digital currency activities. These licenses and registrations subject companies to various anti-money laundering, know-your-customer, record-keeping, reporting and capital and bonding requirements, limitations on the investment of customer funds, and inspection by state and federal regulatory agencies. Bitsy has confirmed to us that it intends to register with FinCEN and to obtain all licenses it is required to obtain. Under U.S. federal law, it is a crime for a person, entity or business that is required to be registered with FinCEN or licensed in any state to fail to do so. Further, under U.S. federal law, anyone who owns all or part of an unlicensed money transmitting business may be subject to civil and criminal penalties.
If we do not keep pace with technological changes, it may impair our ability to market, license or sell the products and services developed as part of our Medici initiatives.
The market for products and services based on blockchain technology is characterized by rapid technological change, frequent product and service innovation and evolving industry standards. The success of our Medici initiatives depends on several factors, including the timely completion, introduction and market acceptance of such products and services. Failure in this regard may significantly impair our competitiveness and financial results. In addition, we may need to continuously modify and enhance our offerings to keep pace with changes in Internet-related hardware, software, communication, browser and database technologies. We may not be successful in either developing these modifications and enhancements or in bringing them to market in a timely fashion. Furthermore, uncertainties about the timing and nature of new network platforms or technologies, or modifications to existing platforms or technologies, could increase our research and development expenses. Any failure of products and services to keep pace with technological changes or operate effectively with future network platforms and technologies could reduce the demand for our products and services. The occurrence of any of the foregoing could have a material adverse effect on our financial results and business.
The blockchain related products and services that we are developing as part of our Medici initiatives have the potential to be used in ways we do not intend, including for criminal or other illegal activities.
Blockchain related products and services, in particular cryptocurrencies, have the potential to be used for financial crimes or other illegal activities. Because the Medici initiatives are novel there are uncertainties regarding any legal and regulatory requirements for preventing blockchain related products and services from being put to such uses, and there are uncertainties regarding the liabilities and risks to the Company if we are unable to prevent such uses. Even if we comply with all laws and regulations regarding financial and blockchain related products and services, we have no ability to ensure that our customers, partners or others to whom we license or sell our products and services comply with all laws and regulations applicable to them and their transactions. Any negative publicity we receive regarding any allegations of unlawful uses of our Medici initiatives could damage our reputation. More generally, any negative publicity regarding unlawful uses of blockchain technology in the marketplace could reduce the demand for our products and services. The occurrence of any of the foregoing could have a material adverse effect on our financial results and business.
35
Risks Relating to Our tZERO Initiatives
Risks Related to tZERO's Business
tZERO has a limited operating history, which makes it hard to evaluate its ability to generate revenue through operations, and at the date of this filing, tZERO has not generated revenue from any commercially available blockchain-based application.
tZERO was formed in 2014 to develop blockchain and financial technology as part of Overstock's Medici initiatives. tZERO's limited operating history makes it difficult to evaluate its current business and future prospects. tZERO has encountered, and will continue to encounter, risks and difficulties frequently experienced by growing companies in rapidly developing and changing industries, including challenges in forecasting accuracy, determining appropriate uses of its limited resources, gaining market acceptance, managing a complex regulatory landscape and developing new products. tZERO's current operating model may require changes in order for it to scale its operations efficiently. Investors in our common stock should consider tZERO's business and prospects in light of the risks and difficulties it faces as an early-stage company focused on developing products in the field of financial technology. To date, tZERO has focused on developing its business and exploring opportunities for novel applications of blockchain technology. As a result of its early stage of development, tZERO has not generated revenue from any commercially available blockchain-based applications. tZERO has generated limited revenue and has accumulated losses since its inception. As such, tZERO's has historically been dependent upon continued financial support from us, which we have provided but are under no obligation to continue to do so.
tZERO may not successfully develop, launch, market, or sell its DLR Software.
tZERO anticipates that its first commercially available blockchain-based product will be DLR Software. The DLR Software is currently in customer production testing, which is being conducted by StockCross, and tZERO has not yet entered into any commercial licenses with any licensees. The DLR Software is intended to help broker-dealer licensees with stock inventory to both load and manage their inventory in order to assist short sellers of public securities in establishing that they have located available shares in the U.S. public securities market prior to effecting short sales. The DLR Software is intended to enable licensees to create a blockchain-based record of the shares that the licensee has made available for "locates" using customizable DLR Software functionality and of the daily purchases of the right to "locate" specifically identified shares for purposes of compliance with regulatory requirements. Although tZERO believes that the DLR Software provides broker-dealers with a better solution than the system currently in use for identifying "locates," the existing system is firmly entrenched and is controlled by firms with substantially greater resources than tZERO or Overstock. tZERO may not successfully develop, launch, market or sell its DLR Software.
The commercial viability of the DLR Software is dependent on the ability of broker-dealer licensees to offer the DLR Software as an effective means of satisfying the regulatory obligations of those effecting short sales. Regulation SHO under the Exchange Act ("Regulation SHO"), as interpreted and implemented by the SEC, is the principal regulation governing short sales. In preliminary discussions with regulators regarding the application of DLR Software, certain members of the SEC Staff (the "Staff") have expressed concerns regarding whether locates issued utilizing the DLR Software would provide customers of broker-dealer licensees with a valid locate for purposes of Regulation SHO unless certain conditions were satisfied by the issuing broker-dealers. The broker-dealer licensees of DLR Software, as the parties issuing locates for purposes of Regulation SHO, will be responsible for ensuring that locates issued using the DLR Software comply with all applicable regulations and satisfy the requirements of Regulation SHO. In the event that compliance with regulatory obligations in utilizing DLR Software proves too burdensome to broker-dealer licensees, the DLR Software may not gain market acceptance among broker-dealers.
In addition, the SEC and other regulatory and self-regulatory authorities may in the future adopt additional rules and regulations, adopt new or modified interpretations of existing regulations, or take other actions, that may impact those engaging in short selling activity or adversely affect the ability of short-selling customers of broker-dealer licensees to rely on locates generated by the DLR Software in effect at the time. Any governmental or regulatory action that restricts the ability of investors to effect short sales, or to do so in reliance on locates generated by the tZERO DLR Software, could adversely affect the commercial viability of the DLR Software.
Moreover, tZERO will need to devote significant resources to license sales and marketing efforts in order to convince broker-dealers that licensing the DLR Software will increase their revenues from their stock lending operations and to persuade large pension funds and other entities that hold large amounts of publicly traded securities that providing inventory supply to broker-dealers utilizing the DLR Software will provide access to additional revenue opportunities. tZERO will need to build a sales and marketing function and staff to effectively market the DLR Software. tZERO may be unable to do so, and any sales and marketing function and staff it builds may be unable to successfully market the DLR Software. Further, tZERO may have
36
overestimated the size of the pension crisis and the potential market for the DLR Software, the potential demand for the DLR Software, and the possibility that it will be able to market the DLR Software to potential licensees.
Once the DLR Software is released for commercial licensing, tZERO may need to make changes to the specifications of the DLR Software for any number of reasons. In the event that tZERO is unable to develop the DLR Software in a way that realizes those specifications, it is possible that the DLR Software may never generate significant revenue or become profitable for tZERO. Furthermore, despite good faith efforts to develop and complete the launch of the DLR Software and subsequently to maintain it, it is still possible that the DLR Software will experience malfunctions or otherwise fail to be adequately developed or maintained, which may negatively impact sales and marketing efforts. There can be no assurance that the DLR Software will ever generate significant revenue or become profitable for tZERO.
tZERO expects to develop a new trading platform for the tZERO Security Tokens it plans to issue in connection with its security token offering and for use by other companies that issue tokens treated as securities, but is only in the preliminary stages of development of the new trading platform.
tZERO intends to develop a new Token Trading System - a trading platform that is capable of trading the tZERO Security Tokens and other tokens or coins that are determined to be securities for purposes of U.S. securities laws. At the date of this filing, tZERO is only in the preliminary stages of development of the Token Trading System. The development of the Token Trading System implicates complex technological considerations and raises numerous legal and regulatory issues that will need to be addressed-likely, in consultation with tZERO's broker‑dealer subsidiaries' regulators. As a result of these technological, legal and regulatory considerations, the Token Trading System may never be developed and, if developed, may, for a variety of technological, legal and regulatory reasons, never become operational. tZERO expects the Token Trading System to be its second blockchain-based product. If tZERO is unable to successfully develop the new Token Trading System, tZERO's business plans would be materially adversely affected. See "Risks Related to the Development of the Token Trading System" below.
tZERO intends to offer advisory services to companies considering or pursuing initial coin offerings, but has not yet been engaged to do so.
tZERO intends to offer advisory services to companies considering or pursuing initial coin offerings. To date, tZERO has not been engaged to provide advisory services to any other company considering or pursuing an initial coin offering, and there can be no assurance that tZERO will be engaged to provide any such services in the future or that any such services, if provided, will be profitable. If tZERO is engaged to provide any such services, tZERO could face claims from any dissatisfied clients and could incur liabilities in rendering any such services, any of which could also damage our reputation and adversely affect other parts of our business.
tZERO's advisory services subject it to additional risks.
On January 31, 2018, tZERO purchased 65.8% of the membership units of ES Capital Advisors, LLC, a registered investment advisor under the Investment Advisers Act of 1940. Through ES Capital, tZERO provides automated investment advisory services-sometimes referred to as robo-advisory services through the Overstock.com website’s FinanceHub. The risks associated with these investment advisory activities include those arising from possible conflicts of interest, unsuitable investment recommendations, inadequate due diligence, inadequate disclosure and fraud. Realization of these risks could lead to liability for client losses, regulatory fines, civil penalties and harm to tZERO’s and our reputation and business. tZERO's membership interest in ES Capital is subject to drag-along rights in connection with certain strategic transactions approved by the manager of ES Capital. tZERO now operates the ES Capital business under the name tZERO Advisors and offers automated investment advisory services through our website's FinanceHub. On March 6, 2018 the SEC's Boston Regional Office notified tZERO Advisors that it is conducting an examination of tZERO Advisors.
PRO Securities and SpeedRoute, two subsidiaries of tZERO that currently generate substantially all of tZERO's revenues, are registered broker-dealers and are subject to extensive regulation.
Broker-dealers are subject to extensive regulatory requirements under federal and state laws and regulations and self-regulatory organization SRO rules. PRO Securities and SpeedRoute are registered with the SEC as broker‑dealers under the Exchange Act and in the states in which they conduct securities business and are members of the Financial Industry Regulatory Authority ("FINRA"). In addition, PRO Securities owns and operates the PRO Securities ATS, which has filed a Form ATS with the SEC notifying the SEC of its activities as an alternative trading system. PRO Securities and SpeedRoute are subject to regulation, examination and disciplinary action by the SEC, FINRA and state securities regulators, as well as other governmental authorities and SROs with which they are registered or licensed or of which they are a member. On February 22,
37
2018, the SEC’s New York Regional Office notified PRO Securities that it is conducting an examination of PRO Securities. PRO Securities and SpeedRoute currently generate substantially all of tZERO's revenues. Any failure of PRO Securities or SpeedRoute to comply with all applicable rules and regulations could have a material adverse effect on tZERO's operations and financial condition and a material adverse effect on us.
PRO Securities is involved in ongoing discussions with regulatory authorities.
PRO Securities has been and remains involved in ongoing discussions with regulatory authorities about the operation of the PRO Securities ATS utilizing the Series A Software Platform and various matters relating to the regulated entities involved. While many of the discussions have been relatively informal, PRO Securities has also received and responded to multiple inquiries from regulators, including FINRA and the SEC. In an unrelated matter, PRO Securities and SpeedRoute are named in a FINRA investigatory matter in which FINRA has conducted on the record interviews of two senior officers of SpeedRoute and PRO Securities, who are also senior officers of tZERO. Any failure of PRO Securities to satisfy FINRA, the SEC, or any other regulatory authority that PRO Securities is in compliance with all applicable rules and regulations could have a material adverse effect on tZERO's operations and financial condition and a material adverse effect on us.
SpeedRoute is involved in ongoing discussions with regulatory authorities.
SpeedRoute has been and remains involved in ongoing discussions with regulatory authorities about a number of matters. SpeedRoute continues to have discussions with FINRA about several matters, including a matter related to potential violations of FINRA rules relating to Order Audit Trail System reporting and trading practice matters and has received document requests from FINRA in connection with certain ongoing matters. SpeedRoute has received and responded to inquiries from FINRA and the SEC. In addition, in December 2017, SpeedRoute received a letter from FINRA stating that the Department of Enforcement at FINRA has received a referral from the staff of FINRA's Department of Market Regulation relating to rules applicable to supervision and required supervisory procedures for review of certain potential trading activity, such as pre-arranged trades or wash trades. Further, in an unrelated matter, SpeedRoute and PRO Securities are also named in a FINRA investigatory matter in which FINRA has conducted on the record interviews of two senior officers of SpeedRoute and PRO Securities, who are also senior officers of tZERO. Any failure of SpeedRoute to satisfy FINRA, the SEC or any other regulatory authority that SpeedRoute is in compliance with all applicable rules and regulations could have a material adverse effect on tZERO's operations and financial condition and a material adverse effect on us.
Technology on which tZERO relies for its operations, including the technology underlying the Series A Software Platform tZERO created in 2016 for trading Overstock's Blockchain Voting Series A Preferred shares, may not function properly.
The technology on which tZERO relies, including the technology underlying the Series A Software Platform tZERO created in 2016 for trading Overstock's Blockchain Voting Series A Preferred shares, may not function properly, which would have a material adverse effect on tZERO's plans, operations and financial condition. Although the Series A Software Platform has worked for the Series A shares, trading in the Series A shares has been extremely limited, with only 10 trades having taken place from December 15, 2016 to the date of this filing, and consequently the Series A Software Platform system has not been tested with significant trading volume. Although tZERO is only in the preliminary stages of development of the Token Trading System, tZERO intends to utilize certain aspects of the technology employed by the existing tZERO software platform. tZERO intends to build a new trading platform for the trading of tokens treated as securities, as described in this filing, but if the technology does not work as anticipated, or if technology that works for the existing tZERO software platform does not work for the Token Trading System, there may be no alternative available. The importance of the technology to tZERO's operations means that any problems in its functionality would have a direct materially adverse effect on tZERO's plans and expectations for revenues from blockchain applications. The technology may malfunction because of internal problems or as a result of cyber-attacks or external security breaches. Any such technological problems would have a material adverse effect on tZERO's prospects.
Acquisitions tZERO has made and may make will increase costs and regulatory and integration risks.
From time to time tZERO has purchased interests in or acquired other businesses or the assets of other businesses, and may do so again in the future. Integrating an acquired business or its assets involves a number of risks and financial, managerial and operational challenges. tZERO may incur significant expenses in connection with purchases or acquisitions it has made in the past or may make in the future. Further, acquisitions may also create a need for additional accounting, tax, compliance, documentation, risk management and internal control procedures, and may require tZERO to hire additional personnel to implement, perform and/or monitor such procedures. To the extent tZERO's procedures are not adequate to appropriately implement, perform and/or monitor all necessary procedures relating to any new or expanded business, we could be exposed to
38
a material loss or regulatory sanction. The occurrence of any of the foregoing could have a material adverse effect on our financial results and business.
Strategic purchases of interests and acquisitions tZERO may make may detract from the capital that tZERO could otherwise deploy to improve its business or to develop the Token Trading System.
tZERO is pursuing several potential strategic acquisitions of interests in companies relevant to the network tZERO is trying to build that we believe will promote the long-term growth objectives of tZERO. Nevertheless, any capital used to finance such strategic acquisitions would detract from the capital available for tZERO to deploy in operating its existing businesses and developing the Token Trading System. Since the commencement of the security token offering through February 28, 2018, tZERO has utilized approximately $28.2 million towards the acquisition of equity interest in other entities, excluding amounts that may become due in connection with the transactions contemplated by the WPS LOI or any transactions described under "Business—Medici—tZERO—Other Potential Acquisitions." In addition, the successful completion of these transactions and, in some cases, integration of acquired businesses with tZERO, would require substantial attention of management, which may detract from the time and attention of management that is devoted to tZERO's existing projects, including development of the Token Trading System.
Risks Related to the Ongoing Security Token Offering by tZERO
tZERO is conducting a security token offering. There can be no assurance that the tZERO Security Tokens will ever be issued, and any significant difficulties tZERO may experience with the offering could result in claims against us.
tZERO launched the security token offering on December 18, 2017. The security token offering is expected to run through May 14, 2018, but may be extended or shortened. In the security token offering, tZERO is offering the right to acquire, if issued by tZERO in the future, tZERO Security Tokens. tZERO will use its commercially reasonable efforts to develop and issue the tZERO Security Tokens, but there is no assurance that it will do so. tZERO may issue up to $250 million of tZERO Security Tokens, subject to increase. Any significant difficulties tZERO may experience with the security token offering or the development of the tZERO Security Tokens could result in claims against tZERO and us and could have a material adverse effect on the holders of our common stock.
The tax and accounting consequences to us of the security token offering are uncertain, and could have a material adverse effect on us.
The tax and accounting consequences to us of the security token offering tZERO is currently conducting are uncertain. Although we believe that the sale of the tZERO Security Tokens in the security token offering should be treated as a sale of equity for tax purposes, if the proceeds were treated as income to us for federal income tax purposes, we would have substantial federal income tax expense as a result of the security token offering. tZERO is offering up to $250 million of tZERO Security Tokens in the security token offering, subject to increase. In addition, the accounting consequences are uncertain, and there is a possibility that the proceeds of the security token offering might be treated as a liability rather than equity for accounting purposes, which would reduce tZERO's net book value compared to equity treatment.
If tZERO Security Tokens are issued, tZERO intends, subject to various limitations, to pay a percentage of its gross profits as dividends to holders of the tZERO Security Tokens, which would reduce the amount that tZERO might otherwise have been able to pay to us.
If tZERO issues tZERO Security Tokens, tZERO intends, subject to various limitations, to pay quarterly dividends of up to 10% of tZERO's consolidated gross profit, if any, to the tZERO Security Token holders. Any such dividend payments to holders of tZERO Security Tokens would reduce the amount, if any, that tZERO would otherwise have had available for other uses, including use in its business and debt and dividend payments to us as the indirect owner of tZERO common stock.
tZERO's security token offering may not be consummated.
At present, the net proceeds of the security token offering are expected to be used for (i) the repayment of amounts payable to the Company, (ii) strategic equity acquisitions of interests in companies relevant to the network tZERO is trying to build; (iii) the future development of the tZERO Security Tokens and the Token Trading System, (iv) the development of functional utility features for the tZERO Security Tokens, (v) general corporate purposes, which may include capital expenditures, acquisitions, debt repayments, cybersecurity upgrades, augmenting technology, infrastructure and personnel, development of products and services, and short term investments, among other things and (vi) lobbying law makers and regulatory authorities for the purpose of bringing about changes to laws and regulations related to blockchain technologies,
39
particularly in regards to securities tokens, and (vii) offering, legal and accounting expenses associated with the security token offering. The failure by tZERO's management to apply these funds effectively could have a material adverse effect on tZERO. If the security token offering is not consummated or does not result in substantial proceeds, it could have a material adverse effect on tZERO's ability to fund these objectives and carry out its business plan. If the security token offering is not consummated, tZERO would have to reduce its planned expenditures and/or would require substantial additional funding from us or other sources in order to carry out its business plan. If this were to occur and if tZERO were unable to obtain adequate funding from other sources, we would be required to make decisions about which businesses and projects to fund, and might be required to decrease or eliminate expenditures that we and/or tZERO believe would have been advisable.
We may purchase up to $30 million of tZERO Security Tokens in the security token offering and/or may elect to accept tZERO Security Tokens in payment of some or all of tZERO's indebtedness to us, which would subject us to the risks of holding tZERO Security Tokens and the risk that we would be unable to sell the tZERO Security Tokens.
We may purchase up to $30 million of tZERO Security Tokens in the security token offering and/or may elect to accept tZERO Security Tokens in payment of some or all of tZERO's indebtedness to us. To the extent that we do so, we would be subject to all of the risks of holding the tZERO Security Tokens, including the risk that we would be unable to publicly sell any of the tZERO Security Tokens unless tZERO registers our sale for us under the Securities Act of 1933, as amended. If we purchase any of the tZERO Security Tokens or elect to accept tZERO Security Tokens in payment of some or all of tZERO's indebtedness to us, we would require a registration rights agreement providing us the right to require tZERO to register our sale, whether or not we then controlled tZERO, but there can be no assurance that tZERO would be able to do so.
The securities issued or to be issued by tZERO may be subject to registration under the Exchange Act if tZERO has assets above $10 million and more than 2,000 purchasers participate in the security token offering, which would increase tZERO's costs significantly and require substantial attention from tZERO's management.
Companies with total assets above $10 million and more than 2,000 holders of record of their equity securities, or 500 holders of record of its equity securities who are not accredited investors, at the end of their fiscal year must register that class of equity securities with the SEC under the Exchange Act. tZERO could trigger this requirement as a result of the security token offering and be required to register the tZERO Security Tokens with the SEC under the Exchange Act, which would be a laborious and expensive process. Furthermore, if such registration takes place, tZERO would have materially higher compliance and reporting costs going forward.
Risks Related to the Development of the Token Trading System
tZERO is only in the preliminary stages of development of the Token Trading System and may not successfully develop, market and launch any Token Trading System.
tZERO views the development of the Token Trading System as a key commercial milestone. However, tZERO is only in the preliminary stages of development of the Token Trading System, and the Token Trading System may never be developed.
In addition, the development of the Token Trading System would require significant capital funding, expertise of tZERO's management and time and effort in order to be successful. tZERO may have to make changes to the specifications of the Token Trading System for any number of reasons or tZERO may be unable to develop the Token Trading System in a way that realizes those specifications or any form of a functioning network. It is possible that the tZERO Security Tokens and the Token Trading System may not ever be released and there may never be an operational tZERO Security Token or the launch of the Token Trading System may never occur. The Token Trading System, if successfully developed and maintained, may not meet investor expectations at the time of purchase of tZERO Security Tokens—for example, there can be no assurance that the Token Trading System will provide less expensive or more efficient trading than is possible on currently available trading platforms for traditional securities. Furthermore, despite good faith efforts to develop and complete the launch of the Token Trading System and subsequently to maintain the Token Trading System, it is still possible that the Token Trading System will experience malfunctions or otherwise fail to be adequately developed or maintained, which may negatively impact the Token Trading System and Tokens.
tZERO may, but is not obligated to, use the proceeds of the security token offering to make significant expenditures to develop and launch a viable Token Trading System and subsequently to build a fulsome network upon which users can realize utility and value. tZERO may not have or may not be able to obtain the technical skills, expertise, or regulatory approvals needed to successfully develop the Token Trading System and progress it to a successful launch. tZERO does not anticipate that the Series A Trading Platform will be deployed in connection with the Token Trading System in the same manner as is currently deployed by the PRO Securities. While tZERO has sought to retain and continue to competitively recruit experts, there may,
40
from time to time, be a general scarcity of management, technical, scientific, research and marketing personnel with appropriate training to develop and maintain the Token Trading System. In addition, there are significant legal and regulatory considerations that will need to be addressed in order to develop and maintain the Token Trading System, and addressing such considerations will require significant time and resources. There can be no assurance that tZERO will be able to develop a Token Trading System that achieves tZERO's goals and satisfies the complex regulatory requirements applicable to SEC-registered exchanges and/or permitted alternative trading systems. If tZERO is not successful in its efforts to develop a Token Trading System that is compliant with all regulatory and legal requirements and to demonstrate to users the utility and value of the Token Trading System, it may be impermissible to launch the Token Trading System or there may not be sufficient demand for the Tokens for the launch of the Token Trading System to be commercially viable and tZERO's business would be materially adversely affected, which could have a material adverse effect on us.
Regulatory authorities may never permit the Token Trading System to become operational.
Assuming that tZERO is able to develop a Token Trading System, numerous regulatory authorities, including FINRA and the SEC, would need to permit the Token Trading System to become operational. If FINRA, the SEC or any other regulatory authority objected to the Token Trading System or to aspects of the Token Trading System, such regulatory authorities could prevent the Token Trading System from ever becoming operational. The regulatory landscape that tZERO needs to navigate in order to achieve an operational Token Trading System is complex, and tZERO may never be able to do so successfully. Any such regulatory issues would have a material adverse impact on tZERO’s business.
The Token Trading System may not be widely adopted and may have limited users.
It is possible that the Token Trading System, if developed, will not be used by a large number of issuers, broker-dealers or holders of security tokens or that there will be limited public interest in the creation and development of the Token Trading System. In addition, legal and regulatory developments could render the Token Trading System obsolete or impermissible. Such a lack of use or interest could negatively impact the development of the Token Trading System and the business and financial position of tZERO and have a material adverse effect on us.
Alternative networks may be established that compete with or are more widely used than the Token Trading System.
It is possible that alternative networks could be established that utilize the same or similar protocols as those underlying the Token Trading System or that facilitate services that are materially similar to the Token Trading System's services. The Token Trading System may face competition from any such alternative networks, which could negatively impact the Token Trading System and the tZERO Security Tokens and have a material adverse effect on tZERO and on us.
The Token Trading System, the tokens on that system and any blockchain on which tZERO's products and/or securities may rely may be the target of malicious cyber-attacks or may contain exploitable flaws in its underlying code, which may result in security breaches and the loss or theft of tokens that may trade on the Token Trading System. If such attacks occur or security is compromised, this could expose us to liability and reputational harm and could seriously curtail the utilization of tokens and cause a decline in the market price of the tokens on that system, and could result in claims against tZERO or us.
If the Token Trading System is developed, its structural foundation, the software applications and other interfaces or applications upon which it relies or that will be built upon the Token Trading System are unproven, and there can be no assurances that the Token Trading System and the creating, transfer or storage of the tokens on that system will be uninterrupted or fully secure, which may result in impermissible transfers, a complete loss of users’ tokens on that system or an unwillingness of users to access, adopt and utilize tZERO Security Tokens and/or the Token Trading System. Further, the tokens on the Token Trading System and the Token Trading System (and any technology, including blockchain technology, on which they rely) may also be the target of malicious attacks seeking to identify and exploit weaknesses in the software, the tokens on that system or the Token Trading System which may result in the loss or theft of tokens on that system. For example, if tZERO and the tokens on the Token Trading System and/or Token Trading System are subject to unknown and known security attacks (such as double-spend attacks, 51% attacks, or other malicious attacks), this may materially and adversely affect the Token Trading System, and tZERO's business would be materially adversely affected, which could have a material adverse effect on us.
Some market participants may oppose the development of distributed ledger or blockchain‑based systems like those central to tZERO's commercial mission, which could adversely affect tZERO.
Many participants in the system currently used for trading public securities in the United States may oppose the development of capital markets systems and processes that utilize distributed ledger and blockchain-based systems. The market participants who may oppose such a system may include entities with significantly greater resources, including financial
41
resources and political influence, than tZERO or we have. The ability of tZERO to operate and achieve its commercial goals could be adversely affected by any actions of any such market participants that result in additional regulatory requirements or other activities that make it more difficult for tZERO to operate could adversely affect tZERO's ability to achieve its commercial goals, which could have a material adverse effect on us.
Risks Related to Blockchain Technology
The regulatory regime governing blockchain technologies, cryptocurrencies, digital assets, the Series A Software Platform and offerings of digital assets is uncertain, and new regulations or policies may materially adversely affect the development and the value of such cryptocurrencies and assets.
Regulation of digital assets, like the tZERO Security Tokens, cryptocurrencies, blockchain technologies, cryptocurrency exchanges and the tZERO Platform, is currently undeveloped and likely to rapidly evolve as government agencies take greater interest in them. Regulation also varies significantly among international, federal, state and local jurisdictions and is subject to significant uncertainty. Various legislative and executive bodies in the United States and in other countries may in the future adopt laws, regulations, or guidance, or take other actions, which may severely impact the permissibility of tokens generally and the technology behind them or the means of transaction or in transferring them. Failure by tZERO to comply with any laws, rules and regulations, some of which may not exist yet or are subject to interpretation and may be subject to change, could result in a variety of adverse consequences, including civil penalties and fines.
Cryptocurrency networks, distributed ledger technologies, and coin and token offerings also face an uncertain regulatory landscape in many foreign jurisdictions such as the European Union, China and Russia. Various foreign jurisdictions may, in the near future, adopt laws, regulations or directives that may conflict with those of the United States or may directly and negatively impact tZERO's business. The effect of any future regulatory change is impossible to predict, but such change could be substantial and materially adverse to tZERO's business.
The further development and acceptance of blockchain networks, which are part of a new and rapidly changing industry,
are subject to a variety of factors that are difficult to evaluate. The slowing or stopping of the development or acceptance of blockchain networks and blockchain assets would have a material adverse effect on tZERO's business plans and could have a material adverse effect on us.
The growth of the blockchain industry in general, as well as the blockchain networks on which the tZERO Security Tokens will rely, is subject to a high degree of uncertainty. The factors affecting the further development of the cryptocurrency and cryptosecurity industry, as well as blockchain networks, include, without limitation:
• | worldwide growth in the adoption and use of cryptocurrencies, cryptosecurities, and other blockchain technologies; |
• | government and quasi-government regulation of cryptocurrencies, cryptosecurities, and other blockchain assets and their use, or restrictions on or regulation of access to and operation of blockchain networks or similar systems; |
• | the maintenance and development of the open-source software protocol of cryptocurrency or cryptosecurities networks; |
• | changes in consumer demographics and public tastes and preferences; |
• | the availability and popularity of other forms or methods of buying and selling goods and services, or trading assets including new means of using government-backed currencies or existing networks; |
• | general economic conditions and the regulatory environment relating to cryptocurrencies and cryptosecurities; and |
• | a decline in the popularity or acceptance of cryptocurrencies or other blockchain‑based tokens. |
The cryptocurrency and cryptosecurities industries as a whole have been characterized by rapid changes and innovations and are constantly evolving. Although it has experienced significant growth in recent years, the slowing or stopping of the development, general acceptance and adoption and usage of blockchain networks and blockchain assets may materially adversely affect tZERO's business plans.
The prices of digital assets are extremely volatile. Fluctuations in the price of digital assets could materially and adversely affect tZERO's business.
The prices of cryptocurrencies, such as Bitcoin and Ether, and other digital assets have historically been subject to dramatic fluctuations and are highly volatile. A decrease in the price of a single digital asset may cause volatility in the entire digital asset and security token industry. For example, a security breach that affects purchaser or user confidence in Bitcoin or
42
Ether may affect the industry as a whole. This volatility may adversely affect interest in and demand for the Token Trading System, which would materially adversely affect tZERO's business.
tZERO's business is subject to complex and evolving U.S. and foreign laws and regulations regarding privacy, technology, data protection, and other matters. Many of these laws and regulations are subject to change and uncertain interpretation, and could result in claims, changes to tZERO's business practices, increased cost of operations or otherwise harm tZERO's business.
tZERO is subject to a variety of laws and regulations in the United States and abroad that involve matters central to its business, including user privacy, blockchain technology, broker-dealer, data protection and intellectual property, among others. Foreign data protection, privacy, broker-dealer and other laws and regulations are often more restrictive than those in the United States. These U.S. federal and state and foreign laws and regulations are constantly evolving and can be subject to significant change. In addition, the application and interpretation of these laws and regulations are often uncertain, particularly in the new and rapidly evolving industry in which tZERO operates.
tZERO has adopted policies and procedures designed to comply with these laws. The growth of its business and its expansion outside of the United States may increase the potential of violating these laws or its internal policies and procedures. The risk of tZERO's being found in violation of these or other laws and regulations is further increased by the fact that many of them have not been fully interpreted by the regulatory authorities or the courts, and are open to a variety of interpretations. Any action brought against tZERO for violation of these or other laws or regulations, even if tZERO successfully defends against it, could cause tZERO to incur significant legal expenses and divert its management's attention from the operation of its business. If tZERO's operations are found to be in violation of any of these laws and regulations, tZERO may be subject to any applicable penalty associated with the violation, including civil and criminal penalties, damages and fines, tZERO could be required to refund payments received by it, and it could be required to curtail or cease its operations. Any of the foregoing consequences could seriously harm tZERO's business and its financial results. These existing and proposed laws and regulations can be costly to comply with and can delay or impede the development of new products, result in negative publicity, increase tZERO's operating costs, require significant management time and attention, and subject tZERO to claims or other remedies, including fines or demands that tZERO modifies or ceases existing business practices.
The popularity of cryptocurrencies and cryptosecurities offerings may decrease in the future, which could have a material adverse effect on the cryptocurrency and cryptosecurities industry and tZERO's operations and financial condition.
tZERO was founded to develop and commercialize financial technology based on the use of digital assets, digital securities (or cryptosecurities) and blockchain technology. In recent years, cryptocurrencies and cryptosecurities have become more widely accepted among investors and financial institutions, but have been also faced increasingly complex legal and regulatory challenges and, to date, have not benefited from widespread adoption by governments, central banks or established financial institutions. However, any significant decrease in the acceptance or popularity of cryptocurrency or cryptosecurity offerings may have a material adverse effect on tZERO's operations and financial condition and a material adverse effect on us.
tZERO relies on certain major customers of SpeedRoute and PRO Securities, making it vulnerable to changes in the business and financial condition of, or demand for its services by, such customers.
tZERO relies on certain major customers of SpeedRoute and PRO Securities, making it vulnerable to changes in the business and financial condition of, or demand for its services by, such customers. During the year ended December 31, 2017, tZERO recognized revenue from three customers of SpeedRoute and PRO Securities totaling 20%, 18% and 11% of tZERO's revenues. During the year ended December 31, 2016, tZERO recognized revenue from three customers of SpeedRoute and PRO Securities totaling 22%, 16% and 15% of tZERO's revenues. tZERO's income and ability to meet its financial obligations could also be adversely affected in the event of bankruptcy, insolvency or significant downturn in the business of one of these customers.
A violation of privacy or data protection laws could have a material adverse effect on tZERO and the value of the tZERO Security Tokens.
tZERO and certain of its subsidiaries and advisors are subject to applicable privacy and data protection laws and regulations. Any violations of laws and regulations relating to the safeguarding of private information could subject tZERO or any of them to fines, penalties or other regulatory actions, as well as to civil actions by affected parties. Any such violations could adversely affect the ability of tZERO to operate the Token Trading System, which could have a material adverse effect on tZERO's operations and financial condition and a material adverse effect on us.
43
tZERO and its subsidiaries are, and the Token Trading System, if developed, and the blockchain technology to be utilized by such Token Trading System will be, subject to cyber-attacks, security risks and risks of security breaches. The nature of the tZERO Security Tokens may lead to an increased risk of fraud or cyber-attack.
tZERO and its subsidiaries are, and the Token Trading System, if developed, and the blockchain technology to be utilized by such Token Trading System will be, subject to cyber-attacks, security risks and risks of security breaches. An attack on any of them or a breach of security of any of them could result in a loss of private data, unauthorized trades, and an interruption of trading for an extended period of time. Any such attack or breach could adversely affect the ability of tZERO to effectively operate the Token Trading System, which could have a material adverse effect on tZERO's operations and financial condition.
Such an attack may also damage tZERO's reputation and any breach of data security that exposes or compromises the security of any of the private digital keys used to authorize or validate transaction orders, or that enables any unauthorized person to generate any of the private digital keys, could result in unauthorized trades. The Series A Software Platform and any Token Trading System developed in the future has been and will be, as applicable, developed by key technology employees of tZERO and its affiliates, and their operation and further development depend on the continued availability of those key employees.
The Series A Software Platform, and any Token Trading System that may be developed in the future, including technology and intellectual property involved in their creation and operation, has been or will be, as applicable, developed primarily by a small number of key technology employees of tZERO and its affiliates. The loss of the services of any of those key employees could have a material adverse effect on the ability of tZERO to develop, operate or maintain the Series A Software Platform or the Token Trading System. If tZERO were to lose the services of any such key employees, it could be difficult or impossible to replace them, and the loss of any of them could have a material adverse effect on tZERO's operations and financial condition.
The occurrence of any of the foregoing could result in claims against tZERO and us and could have a material adverse effect on us and the holders of our securities.
The development and operation of tZERO's business, including the Series A Software Platform and any Token Trading System that may be developed in the future requires, will likely require, technology and intellectual property rights.
The ability of tZERO to develop and operate the Series A Software Platform and any Token Trading System that may be developed in the future may depend on technology and intellectual property rights that tZERO may license from unaffiliated third parties. If for any reason tZERO were to fail to comply with its obligations under the applicable license agreement, or were unable to provide or were to fail to provide the technology and intellectual property that the Series A Software Platform or any future Token Trading System requires, they would be unable to operate, which would have a material adverse effect on tZERO's operations and financial condition and could have a material adverse effect on us.
tZERO may face substantial competition from a number of known and unknown competitors as well as the risk that one or more of them may obtain patents covering technology critical to the operation of the Series A Software Platform or any future Token Trading System.
We believe that a number of organizations are or may be working to develop trading systems utilizing distributed ledger or blockchain technologies or other novel technologies that may be competitive with tZERO's own technology. Some or all of such organizations may have substantially greater technological expertise, experience with distributed ledger technologies and/or financial resources than tZERO or Overstock has, and many of them appear to be attempting to patent technologies that may be competitive with or similar to the technology tZERO has developed. tZERO does not have access to detailed information about the technologies these organizations and/or their respective purchasers may be attempting to patent. If one or more other persons, companies or organizations obtains a valid patent covering technology critical to the Series A Software Platform or any future Token Trading System, tZERO and the other entities that need the relevant technology in order to enable the Series A Software Platform or Token Trading System to operate as intended might be unable or unwilling to license the technology, and it could become impossible for the Series A Software Platform or Token Trading System to operate, which could have a material adverse effect on tZERO's operations and financial condition and a material adverse effect on us.
44
Risks Related to Our Common Stock and Other Securities
The trading prices of our common stock and preferred shares have increased substantially recently. If blockchain technology development or acceptance slows or stops, or if the trading prices of cryptocurrency decrease, the trading prices of our securities may decrease dramatically. If we determine not to sell our Company or our e-commerce business or make other fundamental changes to our business, the trading prices of our securities may decrease significantly. The trading prices of our securities may also decrease significantly if we determine to take any such actions.
The trading prices of our common stock and preferred shares have increased substantially recently. In the third quarter of 2017 our common stock traded at a low of $14.30; in the fourth quarter of 2017 it traded at a high of $82.70. We believe that our securities prices have been, and may continue to be, significantly impacted by perceptions regarding the business prospects of our Medici business and blockchain technology generally. To the extent that our blockchain initiatives do not succeed, or the development or acceptance of blockchain networks, blockchain assets or blockchain applications slows or stops, our securities prices could decrease significantly. See "Risks Relating to Our tZERO Initiatives—Risks Related to Blockchain Technology" for risks associated with the development of blockchain networks. The trading price of our common stock may fluctuate as a direct reflection of the trading prices of Bitcoin and other cryptocurrencies, which may cause significant volatility and declines in our stock price. In addition, to the extent that our securities price increases resulted from our disclosures about our exploration of strategic initiatives, any decision or announcement of a decision we may make not to pursue any such strategic initiatives could cause the trading prices of our securities to decrease significantly. The trading prices of our securities could also decrease significantly if we make or announce any decision to go forward with or pursue any such strategic initiatives.
We do not intend to pay dividends on our common stock and you may lose the entire amount of your investment in our common stock.
We have never declared or paid any cash dividends on our common stock and do not intend to pay dividends on our common stock for the foreseeable future. We intend to invest our future earnings, if any, to fund our growth. Therefore, holders of our common stock will not receive any funds without selling their shares. You may not receive a positive return on your investment, and you may lose your entire investment.
Sales by our significant stockholders could have an adverse effect on the market price of common stock and preferred stock.
A small number of our stockholders own a significant percentage of our common stock. Our Chief Executive Officer Patrick Byrne is the beneficial owner of approximately 23.0% of our outstanding shares. Various trusts related to his mother Dorothy Byrne are the beneficial owners of an additional aggregate of approximately 5.5% of our stock. Sales by Dr. Byrne or any of such trusts could have a material adverse effect on the market prices of our common stock and preferred stock. In addition, the transfer of ownership of a significant portion of our outstanding shares within a three-year period could adversely affect our ability to use our net operating losses to offset future taxable net income. Any of the foregoing could have a material adverse effect on the holders of our common stock and holders of our preferred stock.
Our quarterly operating results are volatile and may adversely affect the market prices of our common stock and preferred stock, and you may lose all or a part of your investment.
We have experienced and expect to continue to experience significant fluctuations in our operating results in part because of seasonal fluctuations in traditional retail patterns. Our gross revenues have historically been significantly lower in the first and second calendar quarters than in the fourth quarter of the prior year due primarily to increased shopping activity during the fourth quarter holiday season. Further, we generally increase our inventories substantially in anticipation of holiday season shopping activity, which has a negative effect on our cash flow. As a result of the fourth quarter holiday season shopping, we also typically have unusually large payments due to our fulfillment partners in the first calendar quarter. Our revenues and operating results have varied in the past and may continue to vary significantly from quarter to quarter due to a number of other factors, many of which are outside our control. In addition to seasonal effects and the other risk factors described in this report, factors that have caused and/or could cause our quarterly operating results to fluctuate and in turn affect the market prices of our common stock and preferred stock include:
• | increases in the cost of advertising and changes in our sales and marketing expenditures; |
• | expenses we incur in our Medici development efforts; |
• | our inability to retain existing customers or encourage repeat purchases; |
• | the extent to which our existing and future marketing campaigns are successful; |
• | price competition, particularly in the costs of marketing as well as in product pricing; |
• | the amount and timing of operating costs and capital expenditures; |
45
• | the amount and timing of our purchases of inventory; |
• | our inability to manage distribution operations or provide adequate levels of customer service; |
• | increases in the cost of fuel, transportation or distribution; |
• | our inability to implement technology changes or integrate operations and technologies from acquisitions or other business combinations; |
• | our efforts to offer new lines of products and services; and |
• | our inability to attract users to our website. |
Any of the foregoing could have a material adverse effect on our financial results and business and our ability to raise capital, and could have a material adverse effect on the holders of our common stock and of our preferred stock.
Our outstanding preferred stock could adversely affect the holders of our common stock in some circumstances.
We have two series of preferred stock outstanding. The preferred stock could adversely affect the holders of our common stock in some circumstances. The preferred stock generally votes with the common stock, with holders of the preferred stock having one vote for each share held. As of December 31, 2017, the 681,259 outstanding shares of preferred stock constituted approximately 2.4% of the total number of shares of the preferred stock and the common stock, taken together. The preferred stock ranks senior to the common stock with respect to dividends, is entitled to an annual cash dividend of $0.16 per share in preference to any dividend on the common stock, and is generally entitled to participate in any dividends we pay on the common stock. The preferred stock ranks equally with the common stock upon our liquidation, winding up or dissolution. Generally, in a business combination, each share of the preferred stock would be treated as a share of common stock. Any of the foregoing could have a material adverse effect on the holders of the common stock.
We may issue additional preferred stock without further stockholder approval, for purposes of a stockholder rights plan or for other purposes, and any such preferred stock could entitle the holders to rights superior to those of the holders of our common stock.
Our amended and restated certificate of incorporation authorizes our board to designate and issue preferred stock on such terms as may be approved by the board without further stockholder approval. Our board could do so in connection with the adoption of a stockholder rights plan or for other reasons. Preferred stock could be issued with rights, preferences and privileges superior to those of our common stock. In addition, the issuance of preferred stock could have the effect of making an acquisition of our Company more difficult or costly. We currently have 1,000,000 authorized shares of preferred stock undesignated as to series, and we could cause shares currently designated as to series but not outstanding to become undesignated and available for issuance as a series of preferred stock to be designated in the future.
Our Board of Directors or the compensation committee could accelerate the vesting of outstanding restricted stock units upon a sale of the Company or otherwise, which could result in an increase in the number of shares outstanding.
The compensation committee of our board has granted and expects to grant additional restricted stock units ("RSUs") to certain of our employees and directors. Upon vesting, we issue one share of common stock for every RSU held. The board or the compensation committee could determine to accelerate the vesting of RSUs in the event of a sale of our company or otherwise, which would result in an increase in the number of shares outstanding, and would dilute stockholders' ownership of our company. Although the number of RSUs outstanding changes frequently, if all RSUs outstanding were vested as of December 31, 2017, the RSUs would convert into approximately 540,000 shares of our common stock, or approximately 2.0% of the number of shares of common stock currently outstanding.
We generally have not received significant coverage by securities analysts, and the lack of coverage may adversely affect our share price and trading volume.
We generally have not received significant coverage by securities analysts, and the lack of coverage may adversely affect our share price and trading volume. The lack of coverage may cause our share price or trading volume to be lower than they might be if more analysts covered us.
Anti-takeover provisions contained in our amended and restated certificate of incorporation and amended and restated bylaws, as well as provisions of Delaware law, could impair a takeover attempt.
Our amended and restated certificate of incorporation, amended and restated bylaws and Delaware law contain provisions which could have the effect of rendering more difficult, delaying, or preventing an acquisition deemed undesirable
46
by our Board of Directors. Among other things, our amended and restated certificate of incorporation and amended and restated bylaws include provisions:
• | authorizing "blank check" preferred stock, which could be issued by our Board of Directors without stockholder approval and may contain voting, liquidation, dividend and other rights superior to our common stock; |
• | limiting the liability of, and providing indemnification to, our directors and officers; |
• | limiting the ability of our stockholders to call and bring business before special meetings; |
• | providing that our Board of Directors is classified into three classes of directors with staggered three-year terms; |
• | only permitting the Board of Directors to fix the number of directors and to fill vacancies; |
• | prohibiting cumulative voting in the election of directors; |
• | prohibit stockholder action by written consent, which requires all stockholder actions to be taken at a meeting of our stockholders; |
• | requiring advance notice of stockholder proposals for business to be conducted at meetings of our stockholders and for nominations of candidates for election to our Board of Directors; |
• | controlling the procedures for the conduct and scheduling of Board of Directors and stockholder meetings; and |
• | designating a state court located in the State of Delaware as the sole and exclusive forum for specified matters. |
These provisions, alone or together, could delay or prevent hostile takeovers and changes in control or changes in our management.
As a Delaware corporation, we are also subject to provisions of Delaware law, including Section 203 of the Delaware General Corporation law, which prevents certain stockholders holding more than 15% of our outstanding common stock from engaging in certain business combinations without approval of the holders of at least two-thirds of our outstanding common stock not held by such 15% or greater stockholder.
Any provision of our amended and restated certificate of incorporation, amended and restated bylaws or Delaware law that has the effect of delaying, preventing or deterring a change in control could limit the opportunity for our stockholders to receive a premium for their shares of our common stock or other securities and could also affect the price that some investors are willing to pay for our common stock or other securities.
Additional Risks Related Primarily to our Series A Preferred Stock
Our Series A Preferred and the tZERO Platform are substantially different from other securities traded in the U.S. public markets, and are subject to a variety of unusual restrictions and material risks.
Our Series A Preferred can trade only on a registered alternative trading system (the "PRO Securities ATS") operated by our indirect majority-owned subsidiary PRO Securities LLC ("PRO Securities") utilizing technology known as the tZERO Issuance and Trading Platform (the "tZERO Platform"). Trades of the Series A Preferred settle on the trade date. The Series A Preferred is not and will not be listed on any securities exchange or any other market of any kind. The Series A Preferred is extraordinarily illiquid. Only ten trades in the Series A Preferred have taken place since we issued the Series A Preferred in December 2016. Shares of Series A Preferred can be held only in an online brokerage account with Keystone Capital Corporation ("Keystone") and cannot be held in any other account or manner, and only certain persons and entities may purchase Series A Preferred. As a result of these and other matters, the market for the Series A Preferred is likely to remain extraordinarily illiquid and it may be impossible to sell any shares of the Series A Preferred.
The technology on which the tZERO Platform depends has been developed by our majority-owned subsidiary, tZERO, and is licensed by its subsidiary, PRO Securities, and the Series A Preferred depends on both tZERO and on PRO Securities, neither of which has substantial resources.
tZERO is a majority-owned subsidiary of ours and owns 100% of the equity interest in PRO Securities. tZERO licenses the tZERO Platform to PRO Securities, and PRO Securities operates the PRO Securities ATS. tZERO also licenses the tZERO Platform to the Company for the Company's use in connection with the Series A Preferred. Neither tZERO nor PRO Securities has substantial resources. PRO Securities had net capital of approximately $24,175 at December 31, 2017. Neither tZERO nor PRO Securities has any legally binding commitment from any person, including the Company, to contribute additional capital or to make any loan to either of them. If any one or more of the Company, tZERO or PRO Securities were unable to fund its operations in the future, or if any one or more of them were to become the subject of a bankruptcy or other insolvency proceeding, PRO Securities might be unable to continue to operate the tZERO Platform, and the Series A Preferred could be materially adversely affected. In any such event, holders of our capital stock, including the Series A Preferred, could lose their entire investment in our capital stock, including all amounts invested in the Series A Preferred.
47
Accounts for the Series A Preferred are held directly in the customer's name, rather than in "street name," and the complete trading history of each digital wallet is available to the general public and it may be possible for members of the public to determine the identity of the holders of wallets.
Each investor in the Series A Preferred is required to open an online brokerage account in his, her or its name with Keystone. Investors cannot hold their Series A Preferred in "street name." The Series A Preferred shares are directly recorded on our stockholder books and records maintained by Computershare Trust Company, N.A. ("Computershare"). The tZERO Platform makes trade data publicly available shortly after each trade. Although the trade data that the tZERO Platform makes publicly available is anonymous, the publicly available information includes the digital wallet address (the location where records of transactions and balances involving the series A Preferred are stored) of each holder transacting in Series A Preferred, and the entire trading history of each digital wallet (including the number of securities traded by each digital wallet, the price of each trade and the balance of the securities held in each digital wallet). As a result, the trading history of each digital wallet is available to the general public. In addition, because all holders of the Series A Preferred are holders of record, all of them are subject to the risk of loss of their anonymity.
The Series A Preferred and any development of a trading market for the Series A Preferred depends on both Keystone and its clearing broker, ETC.
The Series A Preferred depends on the continuing business operations of both Keystone and Electronic Transaction Clearing, Inc. ("ETC"). Keystone is the only broker dealer authorized to provide the accounts required to acquire, hold and trade shares of Series A Preferred, and ETC is the clearing broker for Keystone with respect to the Series A Preferred. Any failure of either Keystone or ETC to continue operating its business in the ordinary course or to satisfactorily perform their respective obligations could make it impossible to trade Series A Preferred for an extended period of time.
A violation of privacy or data protection laws could have a material adverse effect on PRO Securities, tZERO or other entities, the tZERO Platform and the Series A Preferred.
PRO Securities, tZERO and other entities relevant to the operation of the PRO Securities ATS utilizing the tZERO Platform, including Keystone, ETC and Computershare, are subject to applicable privacy and data protection laws and regulations. Any violations of laws and regulations relating to the safeguarding of private information could subject us or any of them to fines, penalties or other regulatory actions, as well as to civil actions by affected parties. Any such violations could adversely affect the ability of PRO Securities to operate the PRO Securities ATS or to use the tZERO Platform, either of which could have a material adverse effect on holders' ability to trade Series A Preferred.
PRO Securities, tZERO, the PRO Securities ATS, the tZERO Platform and the other entities relevant to the operation of the PRO Securities ATS are subject to cyber-attacks, security risks and risks of security breaches.
PRO Securities, tZERO, the PRO Securities ATS, the tZERO Platform and the other entities relevant to the operation of the PRO Securities ATS utilizing the tZERO Platform, including Keystone, ETC and Computershare, are all subject to cyber-attacks, security risks and risks of security breaches. An attack on any of them or a breach of security of any of them could result in a loss of private data, unauthorized trades, and an interruption of trading for an extended period of time. Any such attack or breach could adversely affect the ability of PRO Securities to operate the PRO Securities ATS or to utilize the tZERO Platform, or both, any of which could have a material adverse effect on holders' ability to trade the Series A Preferred. Any breach of data security that compromises the security of any of the private digital keys used to authorize or validate transaction orders, or that enables any unauthorized person to generate any of the private digital keys, could result in unauthorized trades and would have a material adverse effect on the Series A Preferred. Because trades on the PRO Securities ATS utilizing the tZERO Platform settle on the trade date, it could be impossible to correct unauthorized trades.
In the event of the insolvency of Keystone or ETC, the Securities Investor Protection Corporation would be unable to cause the return of shares of Series A Preferred until a substitute for Keystone or ETC, as applicable, was in place.
The Securities Investor Protection Corporation ("SIPC") oversees the liquidation of member broker dealers that close when the broker dealer is bankrupt or in financial trouble, and customer assets are missing. In a liquidation under the Securities Investor Protection Act, SIPC and a court-appointed trustee typically work to return customers' securities and cash. Within limits, SIPC expedites the return of missing customer property by protecting each customer up to $500,000 for securities and cash (including a $250,000 limit for cash only). If Keystone or ETC were to become insolvent, the structure of the trading system for the Series A Preferred could cause delays in the return of Series A Preferred until a substitute for Keystone or ETC, as applicable, was in place, which could have a material adverse effect on holders of Series A Preferred.
48
Certain transactions involving the Series A Preferred will require manual intervention, which could result in errors, and it impossible to correct trading errors of any nature, in the Series A Preferred, regardless of the source of the error.
All ordinary course Series A Preferred purchase and sale transactions initiated by purchasers and sellers through their Keystone accounts are executed on the PRO Securities ATS utilizing the automated processes of the tZERO Platform, without separate manual intervention by any of the relevant parties. Extraordinary transactions, however, may require manual intervention, which would be initiated by employees of ETC through the tZERO Platform. In any situation involving manual intervention, there is a risk of human error. The same-day settlement of trades on the PRO Securities ATS utilizing the tZERO Platform also means that any error, regardless of the source of the error, may be impossible to correct, which could have a material adverse effect on holders of Series A Preferred.
Trading in the Series A Preferred depends on the operation and functionality of the PRO Securities ATS, on tZERO's proprietary tZERO Platform and on the Proprietary Ledger.
The Series A Preferred trades exclusively on the PRO Securities ATS utilizing the tZERO Platform. The ATS is operated and maintained by PRO Securities, and the tZERO Platform is maintained by tZERO. Each of PRO Securities and tZERO is a direct or indirect majority-owned subsidiary of the Company, and neither of them has substantial resources. If the PRO Securities ATS or the tZERO Platform were to fail to operate as intended for any reason, trading in the Series A Preferred could be impossible until the failure was corrected and full functionality of the affected system or systems were restored and tested. Further, if the Proprietary Ledger were to fail to operate as intended, or were to become unavailable to us in its current form and functionality for any reason, the tZERO Platform might be unable to publish trade data or to provide trade data to ETC and to the transfer agent. Any of the foregoing could have a material adverse effect on our ability to execute or settle trades of Series A Preferred, to maintain accurate records of the ownership of the Series A Preferred and to comply with our obligations relating to records of the ownership of the Series A Preferred and a material adverse effect on the holders of the Series A Preferred.
The Series A Preferred depends on Computershare as the transfer agent for the Series A Preferred.
Computershare serves as the transfer agent for both the Series A Preferred and the Series B Preferred. If Computershare were unable or unwilling for any reason to serve as the transfer agent for the Series A Preferred, trading in the Series A Preferred would be impossible unless we were able to locate another transfer agent able and willing to serve as a replacement transfer agent for the Series A Preferred. We estimate that a transition from Computershare to a replacement transfer agent would take approximately three months; however, any such transition could take longer, during which time it would be impossible to trade in the Series A Preferred, which would have a material adverse effect on the holders of the Series A Preferred.
The tZERO Platform relies on technology and intellectual property rights licensed from tZERO to PRO Securities.
The ability of PRO Securities to operate the PRO Securities ATS utilizing the tZERO Platform depends on technology and intellectual property rights that PRO Securities licenses from our majority-owned subsidiary tZERO. Keystone, ETC and Computershare, in the performance of their respective obligations, also depend on the technology and intellectual property rights that they license (or have licensed on their behalf) from tZERO. tZERO has filed both provisional and non-provisional patent applications covering numerous aspects of the technology relating to the tZERO Platform, none of which have been granted. We believe that a number of organizations are or may be working to develop trading systems utilizing distributed ledger or blockchain technologies that may be competitive with the tZERO Platform. Some or all of such organizations and/or their respective investors have substantially greater resources than tZERO or we have, and many or all of them may be attempting to patent technologies that may be competitive with or similar to the technology tZERO has developed. If third parties obtain patents covering any or all of the technology relating to the tZERO Platform, or if the rights of tZERO to the technology or intellectual property necessary for the operation of the tZERO Platform were otherwise invalidated or limited, or if tZERO were to fail to comply with its obligations under the applicable license agreement, or for any other reason were unable to provide the technology and intellectual property that PRO Securities requires, PRO Securities would be unable to operate the PRO Securities ATS utilizing the tZERO Platform, which would have a material adverse effect on the holders of the Series A Preferred.
The potential application of U.S. laws regarding traditional investment securities to the Series A Preferred is unclear.
The commercial law regarding traditional investment securities in the United States is well-developed. Article 8 of the Uniform Commercial Code as adopted in most states, including Delaware, provides a set of rules that governs common aspects
49
of securities transfers and related matters. Because of the differences between the Series A Preferred and traditional investment securities, there is a risk that issues that might easily be resolved by existing law if traditional securities were involved may not be easily resolved for the Series A Preferred. The occurrence of any such issue or dispute could have a material adverse effect on the holders of Series A Preferred.
The potential application of U.S. laws regarding virtual currencies and money transmission to PRO Securities' use of the Bitcoin blockchain is unclear.
Existing state and federal laws applicable to various activities of persons exchanging or otherwise using virtual currencies, in some cases expressly including Bitcoin, impose prohibitions and require licensing or registration requirements and impose substantive regulations on such persons. Many more states impose licensing and substantive regulation on persons engaging in various activities relating to money transmission, some of which do or may apply to the transmission of virtual currencies such as Bitcoin. The failure to be properly licensed and registered if required under any of these state or federal laws can be a criminal offense. The tZERO Platform uses the Bitcoin blockchain for the purpose of enabling members of the public to confirm that the public copies of the Proprietary Ledger have not been altered. None of the parties involved in the operation of the tZERO Platform is licensed under the virtual currency or money transmission regulations of any state in the United States or registered with the Financial Crimes Enforcement Network ("FinCEN") of the U.S. Department of the Treasury. Although we do not believe that the operation of the tZERO Platform requires such licensing or registration, if any regulatory authority were to assert otherwise, it could have a material adverse effect on the ability of the parties involved in the operation of the tZERO Platform to publish Series A Preferred trade data to the Bitcoin blockchain, which could have a material adverse effect on the holders of the Series A Preferred.
The potential application of foreign laws to the tZERO Platform is unclear.
Any person opening an account with Keystone will be required to represent that doing so and acquiring shares of Series A Preferred will not cause a violation of any law, rule or regulation of any jurisdiction outside of the United States and will not subject us or PRO Securities or the tZERO Platform to regulation by any authority in any jurisdiction outside of the United States. We also limit purchasers of Series A Preferred to certain U.S. residents, entities and trusts. If we became subject to any law, rule or regulation of any jurisdiction outside of the United States, it could have a material adverse effect on the ability of PRO Securities to operate the tZERO Platform and on the Series A Preferred, which would have a material adverse effect on the holders of the Series A Preferred.
Regulatory or factual developments may adversely affect the tZERO Platform.
Neither PRO Securities nor tZERO is registered as a transfer agent under the Exchange Act. If PRO Securities or tZERO were required to register as a transfer agent, the process would be expensive and one or both entities might be unable to do so. Further, future regulatory developments could otherwise affect the tZERO Platform or the ability of PRO Securities to operate the tZERO Platform. To the extent that any current or future regulatory requirements adversely affect the ability of PRO Securities to operate the tZERO Platform or its ability to utilize the Bitcoin blockchain, such regulatory requirements would have a material adverse effect on the holders of the Series A Preferred.
Holders of Series A Preferred are at risk of fee and commission increases by Keystone.
At present the tZERO Platform does not allow more than a single broker dealer to provide access to the system. The lack of an alternative broker dealer to provide access to the tZERO Platform may subject customers to the risk of fee and commission increases by Keystone. Keystone has agreed to limits on the fees and commissions it will charge to customers who trade shares of the Series A Preferred; however, if PRO Securities and tZERO agree to amend the relevant agreements to permit increases to those limits, or if such agreements or the provisions regarding such matters were ineffective for any reason, it could have a material adverse effect on holders of the Series A Preferred.
We have the right to convert the outstanding shares of Series A Preferred into shares of Series B Preferred at any time, even if the Series B Preferred is trading for substantially less than the Series A Preferred, and the terms of the Series B Preferred could be amended after the issuance of the Series B Preferred without the consent of the holders of the Series A Preferred.
We have the right to cause the conversion of all outstanding shares of Series A Preferred into shares of Series B Preferred at any time. If we were to do so at a time when the Series B Preferred were trading at a price lower than the trading price of the Series A Preferred, holders of Series A Preferred would likely experience an immediate and potentially material decrease in the market value of the Series A Preferred they hold and of the Series B Preferred they would receive upon the conversion. Investors should not purchase shares of Series A Preferred unless they are willing to hold shares of Series B
50
Preferred in lieu of shares of Series A Preferred. In addition, the terms of the Series B Preferred may be amended at any time without the consent of the holders of the Series A Preferred. Consequently, holders of Series A Preferred are subject to the risk that their shares could be converted into shares of Series B Preferred having terms different from those of the Series B Preferred at the date of its issuance or at the date of a holder's acquisition of Series A Preferred. Any such amendment of the Series B Preferred could have a material adverse effect on holders of Series A Preferred.
The restrictions on the tax reporting of holder's cost basis in shares of Series A Preferred will not allow normal tax planning in the sale of shares of Series A Preferred, and may result in disadvantageous tax consequences to a seller of Series A Preferred.
Taxpayers must report gains and losses on sales of securities, and related cost basis information when they file their income tax returns. Brokers, including Keystone, also have a requirement to report sales information to the IRS. Holders of most securities typically can elect one of several methods permitted by the IRS for their reporting of their cost basis in securities. However, only one method of cost basis reporting (the first-in, first-out, or FIFO, method) is available for the Series A Preferred. Sellers of Series A Preferred will not be able to elect any method other than FIFO to report their sales information to the IRS. As a result, sellers of Series A Preferred may be required to pay more tax on their sales or to pay taxes earlier than might have been required if other methods of cost basis reporting had been available, which could have a material adverse effect on the holders of Series A Preferred.
Additional Risks Related to our Series A Preferred Stock and our Series B Preferred Stock
We do not intend to issue any additional shares of either Series A Preferred or Series B Preferred, which is expected to continue to result in very limited trading in each series.
Although we have the right to convert the outstanding shares of Series A Preferred into Series B Preferred, we do not intend to issue any additional shares of Series A Preferred or any additional shares of Series B Preferred. Consequently, we expect trading of the Series A Preferred and the Series B Preferred to be limited to the shares we issued in the rights offering. As a result, trading in the Series A Preferred and the Series B Preferred may be very limited.
We do not expect there to be any market makers to develop a trading market in the Series A Preferred, and there is only one market maker in the Series B Preferred.
Most securities that are publicly traded in the United States have one or more broker dealers acting as "market makers" for the security. A market maker is a firm that stands ready to buy and sell the security on a regular and continuous basis at publicly quoted prices. Currently, to our knowledge, there is only one market maker in the Series B Preferred. Further, we do not believe that the Series A Preferred will ever have any market makers. We expect the lack of market makers to continue to contribute to a lack of liquidity in the Series A Preferred and in the Series B Preferred, which could have a material adverse effect on holders' ability to trade either of them.
Rule 144 will not be available for resales of "restricted shares" of Series A Preferred, and Rule 144 volume limitations on resales of Series B Preferred would be very low.
Persons, including non-affiliates of a public company such as the Company, who acquire shares directly or indirectly from the public company, or from an affiliate of the public company, in a transaction or chain of transactions not involving any public offering, or otherwise as described in Rule 144, acquire "restricted shares" for purposes of Rule 144. Although Rule 144 permits public sales of "restricted shares" subject to certain conditions, we do not expect Rule 144 ever to be available for any sales of Series A Preferred, and the sale of any such shares may be difficult or impossible. Further, because of the limited number of shares of Series B Preferred outstanding, the volume limitations of Rule 144 may severely limit sales of Series B Preferred under Rule 144.
We will have an economic incentive to repurchase Series A Preferred and Series B Preferred at prices below the redemption price, and our doing so could cause the trading prices of Series A Preferred and Series B Preferred, as applicable, to decrease further.
Subject to applicable laws and regulations regarding issuer repurchases of their capital stock, we could repurchase shares of the Series A Preferred or Series B Preferred. If we repurchase any shares, we would do so only at or below the prices at which we could redeem shares. Because our right to redeem the Series A Preferred and the Series B Preferred will be at prices that will vary with the price of our common stock as well as the prices of the Series A Preferred and the Series B Preferred, respectively, and in any case would be no less than the Subscription Price, we will have an economic incentive to
51
repurchase the shares at their trading prices from time to time if those prices are lower than the prices at which we would be entitled to redeem the shares. If we repurchase (or redeem) shares of either Series A Preferred or Series B Preferred, the trading market for the shares would become less liquid, which could cause the trading prices to decrease further, giving us an economic incentive to repurchase additional shares. The occurrence of the foregoing could have a material adverse effect on holders of Series A Preferred, the holders of Series B Preferred, or both.
A share of Series A Preferred and/or Series B Preferred may have a substantially lower market value than a share of our common stock.
The trading prices of the Series A Preferred and the Series B Preferred may be substantially lower than the trading price of our common stock at any time. The market for the Series B Preferred is expected to have substantially less liquidity than the market for our common stock, which is traded on the Nasdaq Global Market, and the market for the Series A Preferred has been and is expected to remain even more limited. The Series B Preferred trades in the over-the-counter market rather than on any securities exchange, and the Series A Preferred trades exclusively on the PRO Securities ATS utilizing the tZERO Platform, which is a closed trading platform. Consequently, the trading prices of the Series A Preferred and the Series B Preferred may both be substantially lower than the trading price of our common stock, which could have a material adverse effect on holders of Series A Preferred and holders of Series B Preferred.
Holders of Series A Preferred and/or Series B Preferred have no rights with respect to our common stock, but they may be adversely affected by certain events or changes made with respect to our common stock.
Holders of our Series A Preferred and our Series B Preferred have no rights with respect to our common stock, and no right to convert their Series A Preferred or Series B Preferred into shares of common stock or to exchange their Series A Preferred or Series B Preferred for shares of common stock, except that such holders have the right to vote with the common stock (together with the holders of the other series of Preferred Stock) on any matter submitted to a vote of the holders of the common stock, the right to receive payments upon liquidation with the holders of the common stock (together with the holders of the other series of Preferred Stock) and the right to receive dividends (together with the holders of the other series of Preferred Stock) in preference to the holders of the common stock and to participate in cash dividends, if any, paid on the common stock. Holders of Preferred Stock do not have other rights of the holders of the common stock, including the right to respond to common stock tender offers, if any, and their investment in the Series A Preferred and/or the Series B Preferred may be materially negatively affected by any such event. Holders' lack of any such rights, or the occurrence of any such event, could have a material adverse effect on holders of Series A Preferred and holders of Series B Preferred.
Voting rights of holders of Preferred Stock generally will be limited to voting together with the holders of the common stock as a single class, and the holders of the Series A Preferred and the holders of the Series B Preferred collectively will have only a small percentage of the voting power on any matter submitted to the holders of the common stock and the Series A Preferred and Series B Preferred, voting together as a single class.
Voting rights of holders of Preferred Stock generally will be limited to voting together with the holders of the common stock as a single class. Neither the holders of the Series A Preferred nor the holders of the Series B Preferred have any right by themselves, either together or as separate classes, to elect any members of our Board of Directors. As of December 31, 2017, the 681,259 shares of Preferred Stock outstanding represented approximately 2.4% of the combined voting power of the Series A Preferred, the Series B Preferred and the common stock, voting together as a single class. If an amendment requiring stockholder approval is proposed to our Amended and Restated Certificate of Incorporation or our Amended and Restated Bylaws, the holders of the Series A Preferred and the holders of the Series B Preferred will vote together with the holders of the common stock as a single class, but neither the holders of the Series A Preferred nor the holders of the Series B Preferred will be entitled to a class vote on the amendment, unless the proposed amendment would adversely affect the special rights, preferences, privileges and voting powers of the Series A Preferred or Series B Preferred, respectively. Holders' limited voting rights and any of the foregoing events could have a material adverse effect on holders of Series A Preferred and holders of Series B.
The Series A Preferred and the Series B Preferred rank junior to all of our and our subsidiaries' liabilities, as well as the capital stock of our subsidiaries held by third parties, in the event of a bankruptcy, liquidation or winding up of our or our subsidiaries' business.
In the event of our bankruptcy, liquidation or winding up, our assets will be available to make payments to holders of Series A Preferred and to holders of Series B Preferred only after all of our liabilities have been paid, and neither the Series A Preferred nor the Series B Preferred will have any preference over the common stock in the event of our bankruptcy, liquidation or winding up. In addition, the Series A Preferred and Series B Preferred will rank structurally junior to all existing and future
52
liabilities of our subsidiaries, as well as the capital stock of our subsidiaries held by third parties, including employees holding shares of our majority-owned subsidiary tZERO and employees holding shares of any other direct or indirect subsidiary of ours, whether now existing or created in the future. Any bankruptcy, liquidation or winding up of the Company or any of its wholly or partially owned subsidiaries would have a material adverse effect on holders of Series A Preferred and holders of Series B Preferred.
Our obligation to pay dividends on the Series A Preferred or on the Series B Preferred is limited, and our ability to pay dividends on the Series A Preferred and on the Series B Preferred may be limited.
Our obligation to pay preferential dividends on the Series A Preferred and the Series B Preferred is subject to our Board of Directors declaring such dividend payments. Further, although we will be contractually restricted from paying a dividend on the common stock unless we have paid preferential cumulative 1.0% annual dividends on the Series A Preferred and the Series B Preferred, we have never paid a dividend on the common stock and we have no current intent to do so. Consequently, our failure to pay preferential dividends on the Series A Preferred and on the Series B Preferred might have no legal effect on us at all, although it could adversely affect the trading prices of the Series A Preferred and of the Series B Preferred. Further, our payment of any dividends will be subject to contractual and legal restrictions and other factors the board deems relevant. Moreover, agreements governing any future indebtedness of ours may further limit our ability to pay dividends on our capital stock, including the Series A Preferred and the Series B Preferred. In addition, our ability to pay dividends is limited by applicable law. Any of the foregoing could have a material adverse effect on the holders of the Series A Preferred and the holders of the Series B Preferred.
Purchasers of the Series A Preferred and of the Series B Preferred may be adversely affected by our issuance of any subsequent series of preferred stock.
Neither the terms of the Series A Preferred nor the terms of the Series B Preferred restrict our ability to issue one or more additional new series of preferred stock, any or all of which may rank equally with or have preferences over the Series A Preferred and the Series B Preferred as to dividend payments, voting rights, rights upon liquidation or other types of rights. We will have no obligation to consider the specific interests of the holders of Series A Preferred or the specific interests of the holders of Series B Preferred in creating any such new series of preferred stock or engaging in any such offering or transaction. Our creation of any such new series of preferred stock or our engaging in any such offering or transaction could have a material adverse effect on the holders of Series A Preferred and the holders of Series B Preferred.
It is uncertain whether the IRS will treat the Series A Preferred and Series B Preferred as common stock or preferred stock for U.S. federal income tax purposes.
We intend to treat the Series A Preferred and Series B Preferred as common stock for U.S. federal income tax purposes. Nevertheless, it is unclear whether the IRS will treat the Series A Preferred and Series B Preferred as common stock for U.S. federal income tax purposes. If the IRS were not to treat either the Series A Preferred or the Series B Preferred as common stock for U.S. federal income tax purposes, it could have a material adverse effect on the holders of Series A Preferred and the holders of Series B Preferred.
ITEM 1B. UNRESOLVED STAFF COMMENTS
None.
ITEM 2. PROPERTIES
As of December 31, 2017, we operated the following facilities in our direct and partner business segments, unless otherwise indicated:
Corporate office space
• | We own approximately 236,000 square feet of office space in Midvale, Utah, which consists of our corporate headquarters, and which is primarily used for our direct and partner business segments, with a small amount of space used by our Medici business. |
• | We lease approximately 12,000 square feet of additional office space in the United States for tZERO's main office. |
Warehouse, fulfillment and customer service space
53
• | We lease approximately 1.1 million square feet in the United States for warehouse, fulfillment, customer service, and other operations. |
Data centers
• | We lease approximately 3,300 square feet in the United States for various data centers. |
ITEM 3. LEGAL PROCEEDINGS
The information set forth under Item 15 of Part IV, "Financial Statements—Note 12. Commitments and Contingencies, subheading Legal Proceedings," contained in the "Notes to Consolidated Financial Statements" of this Annual Report on Form 10-K is incorporated by reference in answer to this Item.
ITEM 4. MINE SAFETY DISCLOSURES
Not applicable.
54
PART II
ITEM 5. MARKET FOR REGISTRANT'S COMMON EQUITY, RELATED STOCKHOLDER MATTERS AND ISSUER PURCHASES OF EQUITY SECURITIES
Market information
Our common stock is traded on the Nasdaq Global Market under the symbol "OSTK." The following table sets forth, for the periods indicated, the high and low sale prices per share for our common stock as reported by Nasdaq.
Common Stock Price | ||||||
High | Low | |||||
Year Ended December 31, 2016 | ||||||
First Quarter | 15.65 | 10.03 | ||||
Second Quarter | 17.93 | 13.79 | ||||
Third Quarter | 17.36 | 14.31 | ||||
Fourth Quarter | 19.70 | 13.05 | ||||
Year Ended December 31, 2017 | ||||||
First Quarter | 20.50 | 15.60 | ||||
Second Quarter | 18.15 | 13.75 | ||||
Third Quarter | 32.25 | 14.30 | ||||
Fourth Quarter | 82.70 | 27.58 | ||||
Stock Performance Graph
The stock performance graph is included in Part III, Item 12.
Securities Authorized for Issuance under Equity Compensation Plans
Disclosure relating to our equity compensation plans will be incorporated by reference into Part III, Item 12 from our Proxy Statement for the 2018 annual meeting of stockholders.
Holders
As of March 8, 2018, there were 118 holders of record of our common stock. Many of our shares of common stock are held by brokers and other institutions on behalf of the beneficial owners.
Dividends
We have never declared or paid any cash dividends on our common stock. We currently intend to retain any earnings for future growth and do not anticipate paying any cash dividends on our common stock in the foreseeable future. Any future determination to pay dividends on our common stock will be at the discretion of our Board of Directors and will depend on our results of operations, financial conditions, contractual and legal restrictions and other factors the Board of Directors deems relevant.
In December 2016, we issued a total of 695,898 shares of our preferred stock (the "Preferred Stock"), of which 681,259 shares remained outstanding at December 31, 2017. The Preferred Stock ranks senior to our common stock with respect to dividends. Holders of the Preferred Stock are entitled to an annual cash dividend of $0.16 per share (1.0% of the subscription price), in preference to any dividend payment to the holders of the common stock, out of funds legally available for payment of dividends and subject to declaration by our Board of Directors. Holders of the Preferred Stock are also entitled to participate in any cash dividends we pay to the holders of the common stock and are also entitled to participate in non-cash dividends we pay to holders of the common stock, subject to potentially different treatment if we effect a stock dividend, stock split or combination of the common stock. There are no arrearages in cumulative preferred dividends. We declared and paid a cash dividend of $0.16 per share on our preferred stock during 2017.
55
Recent sales of unregistered securities
None.
Issuer purchases of equity securities
We had no purchases made by us or on our behalf or any "affiliated purchaser" as defined in Rule 10b-18(a)(3) under the Securities Exchange Act of 1934, as amended, of shares of our common stock during the fourth quarter of 2017.
Preferred Stock
In December 2016, we issued 695,898 shares of our preferred stock, consisting of 126,565 shares of our Blockchain Voting Series A Preferred Stock (the "Series A Preferred") and 569,333 shares of our Voting Series B Preferred Stock (the "Series B Preferred" and together with the Series A Preferred, the "Preferred Stock"). Neither the Series A Preferred Stock nor the Series B Preferred Stock is registered under the Securities Exchange Act of 1934, as amended. The Series A Preferred are digital securities that trade exclusively on a registered alternative trading system ("ATS") operated by our majority-owned subsidiary, PRO Securities, LLC (the "PRO Securities ATS"), utilizing software technology known as the tZERO® Issuance and Trading Platform (the "tZERO Platform"). Keystone Capital Corporation ("Keystone") is the sole broker-dealer authorized to provide investors with access to the Series A Preferred through the PRO Securities ATS utilizing the tZERO Platform. The Series B Preferred are non-digital securities that trade in the over-the-counter market and are quoted on the OTCQX market operated by OTC Markets Group.
Except as required by law, the Preferred Stock vote with the common stock on all matters. Holders of the Preferred Stock have one vote for each share held. As of December 31, 2017, the 681,259 shares of Preferred Stock constituted approximately 2.4% of the total number of shares of the Preferred Stock and the common stock, taken together. The Preferred Stock ranks senior to the common stock with respect to dividends. Holders of the Preferred Stock will be entitled to an annual cash dividend equal to 1.0% of the subscription price for the Preferred Stock, rounded to the nearest $0.01, in preference to any dividend payment to the holders of the common stock, out of funds legally available for payment of dividends and subject to declaration by our Board of Directors. Holders of the Preferred Stock are also entitled to participate in any cash dividends we pay to the holders of the common stock and are also entitled to participate in non-cash dividends we pay to holders of the common stock, subject to different treatment if we effect a stock dividend, stock split or combination of the common stock. The Preferred Stock ranks on a parity with the common stock with respect to rights upon the liquidation, winding up or dissolution of the Company. If we are party to any merger or consolidation in which our common stock is changed into or exchanged for stock or other securities of any other person (or the Company) or cash or any other property (or a right to receive the foregoing), we will use all commercially reasonable efforts to cause each outstanding share of the Preferred Stock to be treated as if such share were an additional outstanding share of common stock in connection with any such transaction.
Stock based compensation
Stock options
Our Board of Directors adopted the 2005 Equity Incentive Plan and it was most recently amended and restated and re-approved by the stockholders on May 3, 2012 (as so amended and restated, the "Plan"). Under the Plan, the Board of Directors may issue incentive stock options to our employees and directors and non-qualified stock options to consultants, as well as restricted stock units and other types of equity awards of the Company. Options granted under the Plan generally expire at the end of ten years and vest in accordance with a vesting schedule determined by our Board of Directors, usually over four years from the grant date. We did not grant any options during the years ended December 31, 2017, 2016 and 2015. At December 31, 2017, no options were outstanding under the Plan, and 2.0 million shares of stock remained available for future grants under the Plan.
The following is a summary of stock option activity (amounts in thousands, except per share data):
56
2017 | 2016 | 2015 | |||||||||||||||||||
Shares | Weighted Average Exercise Price | Shares | Weighted Average Exercise Price | Shares | Weighted Average Exercise Price | ||||||||||||||||
Outstanding—beginning of year | 156 | $ | 17.33 | 204 | $ | 17.27 | 224 | $ | 17.27 | ||||||||||||
Exercised | (39 | ) | 16.90 | (42 | ) | 17.08 | (16 | ) | 16.94 | ||||||||||||
Expired/Forfeited | (117 | ) | 17.48 | (6 | ) | 17.08 | (4 | ) | 18.26 | ||||||||||||
Outstanding—end of year | — | $ | — | 156 | $ | 17.33 | 204 | $ | 17.27 | ||||||||||||
Options exercisable at year-end | — | $ | — | 156 | $ | 17.33 | 204 | $ | 17.27 | ||||||||||||
Stock options vest over four years at 28% at the end of the first year and 2% each month thereafter. The most recent stock options were granted in May 2008 and have fully vested. There was no stock based compensation related to stock options recorded during the years ended December 31, 2017, 2016 and 2015.
Restricted stock units activity
During the years ended December 31, 2017, 2016 and 2015, we granted 310,000, 541,000 and 239,000 restricted stock units, respectively, under the Plan. The cost of restricted stock units is determined using the fair value of our common stock on the date of the grant and compensation expense is either recognized on a straight-line basis over the vesting schedule or on an accelerated schedule when vesting of restricted stock awards exceeds a straight-line basis. The weighted average grant date fair value of restricted stock units granted during the years ended December 31, 2017, 2016 and 2015 was $17.75, $14.52 and $24.60, respectively.
The following is a summary of restricted stock unit activity (amounts in thousands, except per share data):
2017 | 2016 | 2015 | |||||||||||||||||||
Units | Weighted Average Grant Date Fair Value | Units | Weighted Average Grant Date Fair Value | Units | Weighted Average Grant Date Fair Value | ||||||||||||||||
Outstanding—beginning of year | 560 | $ | 17.46 | 349 | $ | 24.80 | 578 | $ | 16.70 | ||||||||||||
Granted at fair value | 310 | 17.75 | 541 | 14.52 | 239 | 24.60 | |||||||||||||||
Vested | (212 | ) | 19.58 | (219 | ) | 22.57 | (377 | ) | 12.34 | ||||||||||||
Forfeited | (118 | ) | 16.21 | (111 | ) | 16.52 | (91 | ) | 24.35 | ||||||||||||
Outstanding—end of year | 540 | $ | 17.05 | 560 | $ | 17.46 | 349 | $ | 24.80 | ||||||||||||
Restricted stock units granted in 2017, 2016 and 2015 vest over three years at 33.3% at the end of each of the first, second and third year. Each restricted stock unit represents the right to one share of common stock upon vesting. During the years ended December 31, 2017, 2016 and 2015, we recorded stock based compensation expense related to restricted stock units of $4.1 million, $4.9 million and $3.5 million, respectively.
57
ITEM 6. SELECTED FINANCIAL DATA
The selected consolidated financial data presented below should be read in conjunction with the consolidated financial statements of Overstock.com, Inc. and related footnotes included elsewhere in this Annual Report on Form 10-K and the discussion under Item 7—"Management's Discussion and Analysis of Financial Condition and Results of Operations." The selected consolidated financial data has been derived from our audited consolidated financial statements included elsewhere in this Annual Report on Form 10-K. The historical financial and operating information may not be indicative of our future performance. The following discussion and analysis also should be read in conjunction with the disclosures in Item 1. “Business” under “Our Retail Business,” “Medici,” and “Potential Strategic Initiatives,” as well as the risk factors described in Item 1A. “Risk Factors.”
Year ended December 31, | ||||||||||||||||||||
2017 | 2016 | 2015 | 2014 | 2013 (1) | ||||||||||||||||
(in thousands, except per share data) | ||||||||||||||||||||
Consolidated Statement of Operations Data: | ||||||||||||||||||||
Revenue, net | ||||||||||||||||||||
Direct | $ | 83,052 | $ | 101,578 | $ | 137,783 | $ | 147,460 | $ | 156,032 | ||||||||||
Partner and other | 1,661,704 | 1,698,385 | 1,520,055 | 1,349,643 | 1,148,185 | |||||||||||||||
Total net revenue | 1,744,756 | 1,799,963 | 1,657,838 | 1,497,103 | 1,304,217 | |||||||||||||||
Cost of goods sold | ||||||||||||||||||||
Direct | 80,585 | 96,271 | 128,077 | 129,253 | 136,282 | |||||||||||||||
Partner and other | 1,323,620 | 1,372,343 | 1,225,107 | 1,088,791 | 920,275 | |||||||||||||||
Total cost of goods sold | 1,404,205 | 1,468,614 | 1,353,184 | 1,218,044 | 1,056,557 | |||||||||||||||
Gross profit | 340,551 | 331,349 | 304,654 | 279,059 | 247,660 | |||||||||||||||
Operating expenses: | ||||||||||||||||||||
Sales and marketing | 180,589 | 147,896 | 124,468 | 109,461 | 91,609 | |||||||||||||||
Technology | 115,878 | 106,760 | 98,533 | 86,258 | 71,788 | |||||||||||||||
General and administrative | 90,718 | 89,298 | 82,187 | 71,777 | 68,169 | |||||||||||||||
Litigation settlement | — | (19,520 | ) | — | — | — | ||||||||||||||
Restructuring (2) | — | — | — | (360 | ) | (471 | ) | |||||||||||||
Total operating expenses | 387,185 | 324,434 | 305,188 | 267,136 | 231,095 | |||||||||||||||
Operating income (loss) | (46,634 | ) | 6,915 | (534 | ) | 11,923 | 16,565 | |||||||||||||
Interest income | 659 | 326 | 155 | 152 | 127 | |||||||||||||||
Interest expense | (2,937 | ) | (877 | ) | (140 | ) | (39 | ) | (113 | ) | ||||||||||
Other income (expense), net | 1,178 | 14,181 | 3,634 | 1,169 | (235 | ) | ||||||||||||||
Income (loss) before income taxes | (47,734 | ) | 20,545 | 3,115 | 13,205 | 16,344 | ||||||||||||||
Provision (benefit) for income taxes | 64,188 | 9,297 | 1,895 | 4,404 | (68,034 | ) | ||||||||||||||
Consolidated net income (loss) | $ | (111,922 | ) | $ | 11,248 | $ | 1,220 | $ | 8,801 | $ | 84,378 | |||||||||
Less: Net loss attributable to noncontrolling interests | (2,044 | ) | (1,274 | ) | (1,226 | ) | (53 | ) | — | |||||||||||
Net income (loss) attributable to stockholders of Overstock.com, Inc. | $ | (109,878 | ) | $ | 12,522 | $ | 2,446 | $ | 8,854 | $ | 84,378 | |||||||||
Net income (loss) per common share—basic: | ||||||||||||||||||||
Net income (loss) attributable to common shares—basic | $ | (4.28 | ) | $ | 0.49 | $ | 0.10 | $ | 0.37 | $ | 3.56 | |||||||||
Weighted average common shares outstanding—basic | 25,044 | 25,342 | 24,612 | 23,999 | 23,714 | |||||||||||||||
Net income (loss) per common share—diluted: | ||||||||||||||||||||
Net income (loss) attributable to common shares—diluted | $ | (4.28 | ) | $ | 0.49 | $ | 0.10 | $ | 0.36 | $ | 3.47 | |||||||||
Weighted average common shares outstanding—diluted | 25,044 | 25,426 | 24,703 | 24,317 | 24,294 | |||||||||||||||
See the footnotes beneath the balance sheet data on the following page.
58
As of December 31, | ||||||||||||||||||||
2017 | 2016 | 2015 | 2014 | 2013 (1) | ||||||||||||||||
(in thousands) | ||||||||||||||||||||
Balance Sheet Data: | ||||||||||||||||||||
Cash and cash equivalents | $ | 203,215 | $ | 183,098 | $ | 170,262 | $ | 181,641 | $ | 148,665 | ||||||||||
Restricted cash | 455 | 430 | 430 | 580 | 1,580 | |||||||||||||||
Working capital | 50,534 | (4,843 | ) | (10,308 | ) | 15,260 | 25,425 | |||||||||||||
Total assets | 433,815 | 485,076 | 428,389 | 376,865 | 315,636 | |||||||||||||||
Total liabilities | 261,692 | 312,116 | 279,028 | 247,645 | 196,876 | |||||||||||||||
Stockholders' equity | 172,123 | 172,960 | 149,361 | 129,220 | 118,760 | |||||||||||||||
(1) Our consolidated financial statements for the year ended December 31, 2013 include an immaterial revision to current and long-term deferred tax assets and our provision (benefit) for income taxes in the fourth quarter of 2013. The effect of the revision was to reduce current and long-term deferred tax assets by $284,000 and $3.8 million, respectively, with an offsetting increase of $4.1 million to our provision (benefit) for income taxes in 2013. We evaluated these changes in accordance with Staff Accounting Bulletin No. 99, Materiality ("SAB 99"), and Staff Accounting Bulletin No. 108, Considering the Effects of Prior Year Misstatements when Quantifying Misstatements in Current Year Financial Statements ("SAB 108"), and determined that the revisions are not material to the prior period.
(2) During the fourth quarter of 2006, we commenced implementation of a facilities consolidation and restructuring program designed to reduce the overall expense structure in an effort to improve future operating performance.
Redeemable preferred stock
In December 2016, we issued 695,898 shares of our preferred stock, consisting of 126,565 shares of our Blockchain Voting Series A Preferred Stock (the "Series A Preferred") and 569,333 shares of our Voting Series B Preferred Stock (the "Series B Preferred" and together with the Series A Preferred, the "Preferred Stock"). There were 681,259 shares of our Preferred Stock outstanding at December 31, 2017.
Holders of the Series A Preferred and Series B Preferred do not have any right to convert or exchange such shares for shares of our common stock or any other security, however, at our sole discretion, we may convert the Series A Preferred shares into Series B Preferred shares at any time on a one-to-one basis. Until the third anniversary of the Original Issuance Date, we may redeem, at our discretion, either or both the Series A and Series B Preferred shares for an amount equal to the highest of the following: (1) the subscription price plus any accrued but unpaid dividends, (2) 105% of the average trading price of our common stock during a five-trading-day period and (3) 105% of the average trading price of the series of preferred shares during the same five-day-trading period. In the event of any liquidation, any amount available for distribution to stockholders after payment of all liabilities will be distributed proportionately, with each share of Series A Preferred and each share of Series B Preferred being treated as though it were a share of our common stock.
ITEM 7. MANAGEMENT'S DISCUSSION AND ANALYSIS OF FINANCIAL CONDITION AND RESULTS OF OPERATIONS
The following discussion and analysis contains forward-looking statement relating to future events or our future financial or operating performance that involve risks and uncertainties, as set forth above under "Special Cautionary Note Regarding Forward-Looking Statements." Our actual results could differ materially from those anticipated in these forward-looking statements as a result of certain factors described in this Annual Report on Form 10-K, including those set forth above under "Special Cautionary Note Regarding Forward-Looking Statements" or in Item 1A under the heading "Risk Factors" or elsewhere in this Annual Report on Form 10-K. In addition, our future results may be significantly different from our historical results. The following discussion and analysis also should be read in conjunction with the disclosures in Item 1. “Business” under “Our Retail Business,” “Medici,” and “Potential Strategic Initiatives,” as well as the risk factors described in Item 1A. “Risk Factors.”
Introduction
We are an online retailer and advancer of blockchain technology. Through our online retail business, we offer a broad range of price-competitive products, including furniture, home decor, bedding and bath, housewares, jewelry and watches,
59
among other products. We sell our products and services through our Internet websites located at www.overstock.com, www.o.co and www.o.biz (referred to collectively as the "Website"). Although our three websites are located at different domain addresses, the technology and equipment and processes supporting the Website and the process of order fulfillment described herein are the same for all three websites.
In late 2014, we began working on initiatives to develop and advance blockchain technology, which we refer to collectively as Medici. As part of our Medici initiatives, we have formed a wholly-owned subsidiary Medici Ventures, Inc. ("Medici Ventures") and acquired a majority interest in a financial technology company and two related registered broker dealers which are owned by our majority-owned subsidiary tØ.com, Inc. ("tZERO"). Medici Ventures has also purchased interests in several blockchain technology companies. In 2015, we were the first public company to issue a private security using blockchain technology and in December 2016, as a demonstration of our technology, we issued publicly traded blockchain preferred shares of Overstock.com, Inc.
We have engaged Guggenheim Securities, LLC to help us identify and evaluate certain strategic initiatives. We are considering a range of potential transactions, including a sale of our e-commerce business and additional equity or debt financings. Our Board continually discusses a variety of potential strategic and financial options and other changes to our business, but has not made any determination to undertake any strategic transaction, and may not do so in the foreseeable future or at all. See Item 1 of Part I, "Business—Potential Strategic Initiatives," and Item 1A, "Risk Factors—Risks Relating to Our Current Review of Strategic Initiatives."
Our company, based near Salt Lake City, Utah, was founded in 1997. We launched our initial website in March 1999 and were re-incorporated in Delaware in 2002. As used herein, "Overstock," "Overstock.com,", "O.co," "we," "our" and similar terms include Overstock.com, Inc. and our majority-owned subsidiaries, unless the context indicates otherwise.
Our Retail Business
Our retail business constitutes the vast majority of our business and, through December 31, 2017, generated nearly all of our net revenues. In our retail business, our goal is to provide goods to furnish and accessorize "dream homes" for our target customers—consumers who seek quality, stylish merchandise at bargain prices. At December 31, 2017, we offered 2.8 million products (6.0 million SKUs), of which over 99% were in-line products (products in active production). At December 31, 2017, we were offering three private label brands - Porch & Den, Carson Carrington and OSleep - and had more than 1,000 private label products available on our Website and intend to add additional private label brands, including home products brands, using our strength in home products to help build our private label brands. We regularly change our product assortment to meet the evolving preferences of our customers and current trends. Our products include, among others, furniture, home décor including rugs, bedding and bath, home improvement and kitchen items, and, to a lesser extent, jewelry and watches. We compete primarily based on:
• | Quality customer experience with an emphasis on price, value, and a wide assortment of products delivered in a personalized format with the convenience of our mobile app, and with the benefits of our award-winning customer care; |
• | Proprietary technologies which we believe help us provide our customers with a quality shopping experience; |
• | Logistics capabilities tailored to the furniture and home goods category and developed over our many years of e-commerce experience; |
• | Long-term mutually beneficial relationships with our partners, which currently number approximately 4,100; and |
• | Our Club O Loyalty Program, which we believe increases customer engagement and retention. |
We have organized our retail business (sales of product offered through the Shopping Section of our Website) into two principal segments – a "direct" business and a "partner" business. For 2017, approximately 95% of our net sales were from transactions in which we fulfilled orders from manufacturers, distributors and other suppliers ("partners") selling on our website, who we generally direct to ship goods sold from their own warehouses, while we generally handle returns and customer service (our "partner" business). The remaining 5% of our net sales came from direct sales of our own inventory shipped from our warehouse, including some customer returns of partner products (our "direct" business). We provide our partners with access to a large customer base and convenient services for order fulfillment, customer service, returns handling, and other services. Our team of customer service representatives assists customers by telephone, instant online chat and e-mail. We also derive revenue from other businesses advertising products or services on our Website. Our sales are primarily to customers located in the United States. During the years ended December 31, 2017, 2016 and 2015 no single customer accounted for more than 1% of our total net revenue.
Retail direct business
60
Our retail direct business includes sales made to individual consumers and businesses from our owned inventory which are fulfilled primarily from our warehouse in Salt Lake City, Utah. Our warehouses primarily fulfill orders from our retail direct business. Our warehouses generally ship between 2,000 and 5,000 packages per day and up to approximately 6,000 packages per day during peak periods.
Retail partner business
In our retail partner business, we sell merchandise from our partners primarily through our Website. We are the primary obligor for the majority of these sales transactions and we record revenue from the majority of these sales transactions on a gross basis. We generally have the ability to set pricing and source merchandise from our partners based on our discretion. Our use of the term "partner" does not mean that we have formed any legal partnerships with any of our partners. We currently have relationships with approximately 4,100 third parties who supply the vast majority of products on our Website. These partners generally perform the same fulfillment operations as our warehouses, such as order picking and shipping. We retain the right to re-direct and control the products during shipment and we handle returns and customer service related to substantially all orders placed through our Website. Revenue generated from sales on our Shopping site from both the direct and partner businesses is recorded net of returns, coupons and other discounts.
Both direct and partner revenues are seasonal, with revenues historically being the highest in the fourth quarter, which ends December 31, reflecting higher consumer holiday spending. We anticipate this will continue for the foreseeable future. To the extent possible we maintain supplier relationships, and seek new supplier relationships, for both our direct and partner businesses, and also use our working capital, to ensure a continuous allotment of product offerings for our customers. Because some (less than 1%) of our product offerings are closeout merchandise, some of our suppliers cannot supply products to us on a continuous basis.
Generally, we require authorization from credit card or other payment vendors whose services we offer to our customers (such as PayPal) or verification of receipt of payment, before we ship products to consumers or business purchasers. From time to time we grant credit to our business purchasers with normal credit terms (typically 30 days). For sales in our partner business, we generally receive payments from our customers before our payments to our suppliers are due.
Growth Strategies for Our E-Commerce Business
We believe that some of our direct competitors spend significantly higher percentages of their revenue on marketing than we do, and that we need to increase our branding and marketing expenditures in order to increase our market share in the e-commerce home goods market and educate consumers about our current position as an online retailer offering a wide assortment of quality home goods and other products at low prices and with a high level of customer service. We have developed and implemented marketing and branding initiatives to address this, and believe that additional marketing and branding efforts will have significant long-term positive results. However, a significant increase in our branding and marketing expenditures or other expenses would be likely to adversely affect our short-term results.
We also want to invest in additional distribution facilities to speed shipping and improve our customer service; in additional automation, technology and engineering resources because we believe they can improve our customers' shopping experience and increase our sales; in our Club O rewards program, primarily to increase member benefits and to develop additional personalization programs; and in expansion of our private label initiative because we believe that private label brands can generate significant brand equity and customer loyalty. However, our ability to pursue some or all of these plans, and the extent to which we would be able to pursue some or all of them, will depend on the resources we have available, and may require significantly more capital than we currently have. See "Liquidity and Capital Resources."
Medici Business Initiatives
Our Medici business initiatives seek to leverage the security, transparency and immutability of cryptographically protected, distributed ledgers, such as blockchains, and are focused on solving important problems, including financial transaction issues, particularly in the area of securities settlement. Our wholly-owned subsidiary, Medici Ventures, conducts its primary business through its majority-owned subsidiary tZERO, which includes a financial technology company and two related registered broker dealers. Medici Ventures also holds interests in several technology companies whose focuses include commercial blockchain applications, digital currency solutions, compliance, identity, voting, and land.
As described further in Item 15 of Part IV, "Financial Statements"—Note 21. Business Segments, contained in the "Notes to Consolidated Financial Statements" of this Annual Report on Form 10-K, we determined our segments based on how
61
we manage our business, which, in our view, consists primarily of our Retail and Medici businesses. As described above, our Retail business consists of our Direct and Partner reportable segments. We use gross profit as the measure to determine our reportable segments because there is not discrete financial information available below gross profit for our Direct and Partner segments. As a result, our Medici business is not significant as compared to our Direct and Partner segments and is included in Other. Our Other segment consists of Medici.
Other Offerings
We offer additional products or services that may complement our primary offerings, but are not significant to our revenues. These include:
• | Worldstock Fair Trade, a store within our Website that offers handcrafted products made by artisans all over the world to help improve the lives of people in emerging economies; |
• | Supplier Oasis, a single integration point through which our partners can manage their products, inventory and sales channels, and also obtain multi-channel fulfillment services through our distribution network; |
• | Our international business where we offer products to customers outside the United States using third party logistics providers; |
• | Cars by Overstock, a portal within our Website where our customers can search millions of new, used and certified pre-owned cars from dealers and private parties – all in one place with convenient financing and warranty options; |
• | FinanceHub, a portal within our Website where our customers can shop for loans, credit cards, and insurance, and can now also access links to automated financial advisory services and discounted stock brokerage services; and |
• | Pet Adoptions, a free service and portal within our Website that leverages our technology to display pets available for adoption from shelters across the United States. |
Critical Accounting Policies and Estimates
The preparation of financial statements in conformity with U.S. generally accepted accounting principles ("GAAP") requires estimates and assumptions that affect the reported amounts of assets and liabilities, revenues and expenses, and related disclosures of contingent assets and liabilities in the consolidated financial statements and accompanying notes. The Securities and Exchange Commission ("SEC") has defined a company's critical accounting policies as the ones that are most important to the portrayal of the company's financial condition and results of operations, and which require the company to make its most difficult and subjective judgments, often as a result of the need to make estimates of matters that are inherently uncertain. Based on this definition, we have identified the critical accounting policies, estimates and judgments addressed below. We also have other key accounting policies, which involve the use of estimates, judgments, and assumptions that are significant to understanding our results. For additional information, see Item 15 of Part IV, "Financial Statements"—Note 2. Accounting Policies. Although we believe that our estimates, assumptions, and judgments are reasonable, they are based upon information presently available. Actual results may differ significantly from these estimates. Our critical accounting policies are as follows:
• | revenue recognition; |
• | accounting for income taxes; and |
• | accounting for intangible assets other than goodwill in business combination. |
Revenue recognition
We derive our revenue primarily from retail merchandise sales on our Website.
Revenue is recognized when the following revenue recognition criteria are met: (1) persuasive evidence of an arrangement exists; (2) delivery has occurred or the service has been provided; (3) the selling price or fee revenue earned is fixed or determinable; and (4) collection of the resulting receivable is reasonably assured. Revenue related to merchandise sales is recognized upon delivery to our customers. As we ship high volumes of packages through multiple carriers, it is not practical for us to track the actual delivery date of each shipment. Therefore, we use estimates to determine which shipments are delivered and, therefore, recognized as revenue at the end of the period. Our delivery date estimates are based on average shipping transit times, which are calculated using the following factors: (i) the type of shipping carrier (as carriers have different in-transit times); (ii) the fulfillment source (either our warehouses, those warehouses we control, or those of our partners); (iii) the delivery destination; and (iv) actual transit time experience, which shows that delivery date is typically one to eight business days from the date of shipment. We review and update our estimates on a quarterly basis based on our actual transit time experience. However, actual shipping times may differ from our estimates.
62
We evaluate the criteria outlined in ASC Topic 605-45, Principal Agent Considerations, in determining whether it is appropriate to record the gross amount of product sales and related costs or the net amount earned as commissions. When we are the primary obligor in a transaction, are subject to inventory risk, have latitude in establishing prices and selecting suppliers, or have several but not all of these indicators, revenue is recorded gross. If we are not the primary obligor in the transaction and amounts earned are determined using a fixed percentage, revenue is recorded on a net basis. Currently, the majority of both direct revenue and partner revenue is recorded on a gross basis, as we are the primary obligor. We present revenue net of sales taxes. We periodically provide incentive offers to our customers to encourage purchases. Such offers include current discount offers, such as percentage discounts off current purchases and other similar offers, which, when used by customers, are treated as a reduction of revenue.
The following table shows the effect that hypothetical changes in the estimate of average shipping transit times would have had on the reported amount of revenue and income before taxes for the year ended December 31, 2017 (in thousands):
Year Ended December 31, 2017 | ||||||||
Change in the Estimate of Average Transit Times (Days) | Increase (Decrease) Revenue | Increase (Decrease) Income Before Tax | ||||||
2 | $ | (10,986 | ) | $ | (1,164 | ) | ||
1 | $ | (7,540 | ) | $ | (796 | ) | ||
As reported | As reported | As reported | ||||||
(1) | $ | 5,918 | $ | 635 | ||||
(2) | $ | 10,874 | $ | 1,160 | ||||
The Financial Accounting Standards Board (FASB), which sets accounting standards for U.S. public companies, has issued new standards relating to revenue recognition, which became effective on January 1, 2018, and which will apply to our interim financial statements for the quarter ending March 31, 2018. We are in the process of analyzing the new standards and their application to our processes, accounting, financial reporting presentation, disclosures, and controls. Under previous FASB standards, we recognized revenue from the majority of these sales transactions on a gross basis. We have not reached a definite conclusion, but we believe we will continue to recognize revenue from the majority of our retail business on a gross basis. If our adoption of the new standards requires us to recognize these revenues on a net basis, our future revenue will be substantially less than it was under the previous standards despite having no impact on gross profits. This could have a material adverse effect on the market price of our common stock.
Accounting for income taxes
We are subject to taxation from federal, state and international jurisdictions. A significant amount of judgment is involved in preparing our provision for income taxes and the calculation of resulting deferred tax assets and liabilities.
We account for income taxes in accordance with ASC Topic 740, Income Taxes ("ASC 740"), which requires the asset and liability method of accounting for income taxes. Under this method, deferred tax assets and liabilities are recognized for the expected future tax consequences of temporary differences between tax and financial reporting. Deferred tax assets and liabilities are measured using the currently enacted tax rates that apply to taxable income in effect for the years in which those tax assets are expected to be realized or settled. The effect of a change in tax rates on deferred tax assets and liabilities is recognized in income in the period that includes the enactment date.
Tax laws and regulations themselves are subject to change as a result of changes in fiscal policy, changes in legislation, the evolution of regulations, and court rulings. On December 22, 2017, the President signed into law Public Law No. 115-97, commonly referred to as the Tax Cuts and Jobs Act ("TCJA"), following its passage by the United States Congress. The TCJA will make significant changes to U.S. federal income tax laws, mostly effective for tax years beginning after December 31, 2017. Among many other changes, the new law lowers the corporate tax rate from 35% to 21% for tax years beginning in 2018, transitions U.S international taxation from a worldwide tax system to a territorial system, and includes a one-time transition tax on the mandatory deemed repatriation of cumulative foreign earnings as of December 31, 2017. Staff Accounting Bulletin No. 118 ("SAB 118") was issued to address the application of US GAAP in situations when a registrant does not have the necessary information available, prepared, or analyzed (including computations) in reasonable detail to complete the accounting for certain income tax effects of the TCJA. As of the date of this filing, we have not completed our accounting for the tax effects of the TCJA. In accordance with SAB 118, we have calculated our best estimate of the impact of the TCJA in our year end income tax provision in accordance with our understanding of the law and guidance available as of the date of this filing and as a result
63
have recorded $25.3 million as additional income tax expense in the fourth quarter of 2017. The amount related to the remeasurement of certain deferred tax assets and liabilities, based on the rates at which they are expected to reverse in the future, was $25.2 million. Although the tax rate reduction is known, our analysis may also be affected by other analyses related to the TCJA, including, but not limited to, our calculation of the mandatory deemed repatriation of cumulative foreign earnings and the state tax effect of adjustments made to federal temporary differences, which are uncertain at this time. The provisional amount related to the one-time transition tax on the mandatory deemed repatriation of cumulative foreign earnings was $41,000. The net charge is subject to revisions as we complete our analysis of the TCJA, collect and prepare necessary data, and interpret any additional guidance issued by the U.S. Treasury Department, Internal Revenue Service ("IRS"), FASB, and other standard-setting and regulatory bodies. Any subsequent adjustment to these amounts will be recorded to tax expense in the quarter when the analysis is complete. Our accounting for the tax effects of the TCJA will be completed during the measurement period, which should not extend beyond one year from the enactment date.
The TCJA includes a provision to tax global intangible low-taxed income ("GILTI") of foreign subsidiaries in excess of a deemed return on tangible assets of foreign corporations beginning in 2018. Under GAAP, we can make an accounting policy election to either treat taxes due on the GILTI inclusion as a current period expense, or factor such amounts into our measurement of deferred taxes. Due to the complexity of the new GILTI tax rules, we are continuing to evaluate this provision of the TCJA and the application of GAAP and we have not yet elected an accounting policy.
We assess available positive and negative evidence to estimate whether we will generate sufficient future taxable income to use our existing deferred tax assets. We have no carryback ability and do not expect significant future reversals of taxable temporary differences to recover our existing deferred tax assets, therefore we must rely on future taxable income, including tax planning strategies, to support their realizability. We have concluded based on all available evidence that it is more likely than not that our deferred tax assets as of December 31, 2017 will not be realized in the future. Therefore, it is appropriate to record a valuation allowance against our deferred tax assets, net of deferred tax liabilities related to assets with a definite reversal period. In reaching these conclusions we considered, among other things, three significant pieces of negative evidence that occurred during the quarter ended December 31, 2017. First, a significant piece of objective negative evidence evaluated was the cumulative loss incurred over the three-year period ended December 31, 2017. We expect the trends that contributed to the loss to continue. Such objective evidence limits the ability to consider other subjective evidence, such as projections for future taxable income, if any. Second, during the quarter ended December 31, 2017, forecasts for future years were significantly revised. We are projecting significant pretax operating losses over the next several years and it is uncertain when we will return to profitability. While forecasts of future years are a more subjective piece of evidence, these forecasted losses in the near-term are further negative evidence that we will not have sufficient future taxable income to use our existing deferred tax assets. Third, we have certain tax planning strategies that we intended to implement to accelerate taxable income into earlier periods in order to utilize loss carryforwards and tax credits prior to expiration. While these tax planning strategies previously would have been sufficient to utilize most of our deferred tax assets in periods of low pretax income, these tax planning strategies will not be sufficient to utilize deferred tax assets in periods where we generate significant pretax losses, such as our current year operating results or our newly revised projections for future years. Additionally, one of our tax planning strategies was significantly impacted and reduced in application due to the TCJA, enacted on December 22, 2017. Therefore, we no longer have prudent and feasible tax planning strategies to support the realizability of deferred tax assets. We intend to continue maintaining a valuation allowance on our net deferred tax assets until there is sufficient evidence to support the reversal of all or some portion of these allowances. The amount of the deferred tax asset considered realizable could be adjusted if objective negative evidence in the form of cumulative losses is no longer present and additional weight may be given to subjective evidence such as long-term projections for growth.
ASC 740 clarifies the accounting for uncertainty in income taxes recognized in an enterprise's financial statements in accordance with GAAP. ASC 740 prescribes a recognition threshold and measurement attribute for the financial statement recognition and measurement of a tax position taken or expected to be taken in a tax return. This statement also provides guidance on de-recognition, classification, interest and penalties, accounting in interim periods, and disclosure.
The calculation of our tax liabilities is subject to legal and factual interpretation, judgment, and uncertainty in a multitude of jurisdictions. This includes addressing uncertainties in the application of complex tax regulations. We recognize liabilities for uncertain tax positions in the U.S. and other tax jurisdictions based on recognition and measurement criteria prescribed by ASC 740. We record an amount as an estimate of probable additional income tax liability at the largest amount that we determine is more likely than not, based upon the technical merits of the position, to be sustained upon audit by the relevant tax authority. The liabilities are periodically reviewed for their adequacy and appropriateness. Changes to our assumptions could cause us to find a revision of estimates appropriate. Such a change in measurement would result in the recognition of a tax benefit or an additional charge to the tax provision.
64
We are currently under audit in Ireland for the 2016 tax year. The IRS concluded an audit of our 2015 federal income tax return in 2017 with no changes to the return. Tax periods within the statutory period of limitations not previously audited are potentially open for examination by the tax authorities. Potential liabilities associated with these years will be resolved when an event occurs to warrant closure, primarily through the completion of audits by the tax jurisdictions and/or the expiration of the statutes of limitation. To the extent audits or other events result in a material adjustment to the accrued estimates, the effect would be recognized during the period of the event. We believe that an appropriate estimated liability has been established for potential exposures.
Our uncertain tax positions related to state income taxes represent a cash settlement contingency and are recorded as a liability in our consolidated balance sheets. To the extent interest and penalties would be assessed by taxing authorities on any underpayment of income taxes, such amounts are accrued and classified as a component of income tax expense on our consolidated statements of income and comprehensive income. Realization of the unrecognized tax benefits results in a favorable impact to the effective tax rate.
Accounting for intangible assets other than goodwill in business combination
Intangible assets other than goodwill acquired as part of a business combination are capitalized at their acquisition-date fair value. We amortize intangible assets other than goodwill over their estimated useful lives unless such lives are indefinite. Intangible assets other than goodwill are amortized using the straight-line method of amortization over their useful lives, with the exception of certain intangibles (such as acquired technology, customer relationships, and trade names) which are amortized using an accelerated method of amortization based on cash flows. These assets are reviewed for impairment whenever events or changes in circumstances indicate that their carrying amount may not be recoverable.
The following table details the identifiable intangible assets acquired at their fair value and remaining useful lives as of December 31, 2017 (amounts in thousands):
Intangible Assets | Fair Value | Weighted Average Useful Life (years) | |||
Technology and developed software | $ | 13,600 | 2.92 | ||
Customer relationships | 1,900 | — | |||
Trade names | 300 | 5.93 | |||
Other | 200 | ||||
Total acquired intangible assets as of the acquisition date | 16,000 | ||||
Less: accumulated amortization of acquired intangible assets | (9,228 | ) | |||
Total acquired intangible assets, net | $ | 6,772 | |||
Recently issued accounting standards
For information about recent accounting pronouncements, see Item 15 of Part IV, "Financial Statements"—Note 2. Accounting Policies.
Preliminary Estimates for the Quarter ending March 31, 2018
We have determined to switch to a growth strategy in our ecommerce business, which we believe will lead to higher revenue growth, but also incur significant losses in the process. In pursuit of this growth strategy, in Q1 2018 we have increased our sales and marketing expenditures substantially to increase revenue growth and to test new marketing initiatives. Largely as a result of this new strategy, we expect to incur a total pre-tax loss of approximately $50 million in Q1 2018 ($35 million ecommerce, $15 million Medici).
Our estimated results for the quarter ended March 31, 2018 are preliminary and subject to substantial uncertainty and numerous risks including those outlined in Item 1A of Part I, "Risk Factors". We caution you that our estimates are forward-looking statements and are not guarantees of future performance or outcomes and that actual results may differ materially.
Comparison of Years Ended December 31, 2017 and 2016
Executive Commentary
65
This executive commentary is intended to provide investors with a view of our business through the eyes of our management. As an executive commentary, it necessarily focuses on selected aspects of our business. This executive commentary is intended as a supplement to, but not a substitute for, the more detailed discussion of our business included elsewhere herein. Investors are cautioned to read our entire "Management's Discussion and Analysis of Financial Condition and Results of Operations," as well as our interim and audited financial statements, and the discussion of our business and risk factors and other information included elsewhere or incorporated in this report. This executive commentary includes forward-looking statements, and investors are cautioned to read "Special Cautionary Note Regarding Forward-Looking Statements."
Our $111.9 million consolidated net loss in 2017 was the result primarily of our $46.6 million operating loss in 2017 and our $64.2 million income tax expense in 2017. The operating loss was caused primarily by changes that Google made in its natural search engine algorithms and an increasingly competitive digital marketing landscape. The income tax expense included $25.3 million of expense caused by the enactment in late December 2017 of the TCJA and $59.0 million of expense caused by our establishment of a valuation allowance against our net deferred tax assets at December 31, 2017. These matters are discussed in more detail below.
Revenues in 2017 decreased 3% compared to 2016. Beginning in mid-2017 and continuing in the fourth quarter of 2017, we experienced difficulties which we believe were due in part to changes that Google, Inc. ("Google") has made in its natural search engine algorithms. It has taken us longer to analyze and to seek to adapt to the 2017 algorithm adjustments than it took us to respond to Google's changes in previous years. We have reorganized a large number of resources around addressing this challenge, as well as seeking to prevent it from occurring again. We have implemented a variety of innovations and technical improvements in this area and expect to continue to do so. However, we cannot offer any assurance that we will be able to fully adapt to the 2017 algorithm adjustments or will be able to rely in the future on natural search results as we have in the past. This decrease to revenue was partially offset by efforts to increase revenue in other marketing channels such as sponsored search and email.
Gross profit in 2017 increased 3% compared to 2016 primarily as a result of increased gross margin. Gross margin increased to 19.5% in 2017 compared to 18.4% in 2016. The increase in gross margin was primarily due to a continued shift in sales mix into higher margin home and garden products and an increase in marketplace sales (which we recognize on a net basis), partially offset by increased promotional activities, including coupons and site sales due to our driving a higher proportion of our sales using such promotions.
Sales and marketing expenses as a percentage of revenue increased from 8.2% to 10.4% in 2017 as compared to 2016, primarily due to increased spending in the sponsored search and display ads on social media marketing channels, due in part to our seeking to increase revenue in these channels to partially offset the effects of the Google algorithm changes described above.
While we work to adapt to Google's changes, we have increased our emphasis on other marketing channels, such as sponsored search, which has generated revenue growth but with higher associated marketing expenses than natural search. We expect this trend to continue while we work to adapt to these changes.
We are also experiencing an increasingly competitive digital marketing landscape. We have competitors who are spending significant amounts on advertising bidding up the cost of certain marketing channels, such as paid keywords. While we may not choose to match their levels of spending, this has increased our marketing costs in recent quarters. We expect this trend to continue. However, we do have a number of important digital marketing initiatives that we are testing and implementing that we believe will improve our competitive position in this area.
As a result of these factors, our contribution decreased 19% in 2017 compared to 2016 (see Non-GAAP Financial Measures below for a reconciliation of Contribution to Gross Profit). Contribution margin was 9.3% in 2017 compared to 11.1% in 2016.
We believe that to build market share in the e-commerce home goods market, we will need to significantly increase our marketing and branding expenditures, which we expect would lead to increased revenues but also lead to future net losses in the near-term.
Technology expenses in 2017 increased $9.1 million compared to 2016 primarily due to an increase in staff related costs of $4.9 million, and an increase in technology licenses and maintenance costs of $4.0 million.
66
General and administrative expenses in 2017 increased $1.4 million compared to 2016, primarily due to an increase in staff related costs of $4.9 million, partially offset by a decrease in legal fees of $3.0 million, and a decrease in bad debt expense of $1.1 million.
Our provision for income taxes totaled $64.2 million and $9.3 million for 2017 and 2016, respectively. The increase in 2017 expense compared to 2016 is primarily attributable to our decision to establish a valuation allowance against our net deferred tax assets, as well as the impact of the TCJA. On December 22, 2017, the President signed into law the TCJA. Among many other changes, the new law lowers the corporate tax rate from 35% to 21% for tax years beginning in 2018. Therefore, we re-valued our deferred tax assets in 2017 due to the federal rate reduction, which resulted in an increase in our 2017 income tax expense of $25.3 million. Additionally, each quarter we assess available positive and negative evidence to estimate whether we will generate sufficient future taxable income to use our existing deferred tax assets. Due to losses incurred in 2017 and the potential for future losses, we have recorded a valuation allowance on our deferred tax assets, net of deferred tax liabilities, which further increased our 2017 income tax expense by $59.0 million.
We continue to seek opportunities for growth, in our retail business and through our Medici blockchain and financial technology initiatives and through other means. As a result of these initiatives, we will continue to incur additional expenses and may purchase interests in, or make acquisitions of, other technologies or businesses. We anticipate that our initiatives may cause us to incur losses in the foreseeable future. These losses, additional expenses, acquisitions or purchases may be material, and, coupled with existing marketing expense trends, our plans to increase our marketing and branding expenditures, and strategic changes in our retail business, may lead to increased consolidated losses in some periods, and to reduced liquidity. Additionally, we may recognize additional impairment charges from our ownership interest in other entities.
The balance of our Management's Discussion and Analysis of Financial Condition and Results of Operations provides further information about the matters discussed above and other important matters affecting our business.
67
Results of Operations
The following table sets forth our results of operations expressed as a percentage of total net revenue for the years ended December 31, 2017, 2016 and 2015:
Year ended December 31 | |||||||||
2017 | 2016 | 2015 | |||||||
(as a percentage of total revenue) | |||||||||
Revenue, net | |||||||||
Direct | 4.8 | % | 5.6 | % | 8.3 | % | |||
Partner and other | 95.2 | 94.4 | 91.7 | ||||||
Total net revenue | 100.0 | 100.0 | 100.0 | ||||||
Cost of goods sold | |||||||||
Direct | 4.6 | 5.3 | 7.7 | ||||||
Partner and other | 75.9 | 76.2 | 73.9 | ||||||
Total cost of goods sold | 80.5 | 81.5 | 81.6 | ||||||
Gross profit | 19.5 | 18.4 | 18.4 | ||||||
Operating expenses: | |||||||||
Sales and marketing | 10.4 | 8.2 | 7.5 | ||||||
Technology | 6.6 | 5.9 | 5.9 | ||||||
General and administrative | 5.2 | 5.0 | 5.0 | ||||||
Litigation settlement | — | (1.1 | ) | — | |||||
Total operating expenses | 22.2 | 18.0 | 18.4 | ||||||
Operating income | (2.7 | ) | 0.4 | — | |||||
Interest income | — | — | — | ||||||
Interest expense | (0.2 | ) | — | — | |||||
Other income, net | 0.1 | 0.8 | 0.2 | ||||||
Income before income taxes | (2.8 | ) | 1.2 | 0.2 | |||||
Provision for income taxes | 3.7 | 0.5 | 0.1 | ||||||
Consolidated net income | (6.5 | )% | 0.7 | % | 0.1 | % | |||
Revenue
The following table reflects our net revenue for the years ended December 31, 2017 and 2016 (in thousands):
Year ended December 31, | |||||||||||||||
2017 | 2016 | $ Change | % Change | ||||||||||||
Revenue, net | |||||||||||||||
Direct | $ | 83,052 | $ | 101,578 | $ | (18,526 | ) | (18.2 | )% | ||||||
Partner and other | 1,661,704 | 1,698,385 | (36,681 | ) | (2.2 | )% | |||||||||
Total revenue, net | $ | 1,744,756 | $ | 1,799,963 | $ | (55,207 | ) | (3.1 | )% | ||||||
The decrease in total net revenue for the year ended December 31, 2017, as compared to the same period in 2016, was due in part to changes that we believe Google has made in its natural search engine algorithms. In addition, we had an increase in product sales for which we record only our commission as revenue, and an increase in promotional activities, including coupons and site sales due to our driving a higher proportion of our sales using such promotions.
The decrease in direct revenue for the year ended December 31, 2017, as compared to the same period in 2016, was due in part to the changes that Google has made in its natural search engine algorithms. The decrease to revenue can also be explained by a decrease in sales of direct home and garden, clothing, and jewelry products, and increased promotional activities, including coupons and site sales due to our driving a higher proportion of our sales using such promotions. These were partially offset by
68
deferring a lower number of orders taken but not delivered due to decreased direct revenue, and a decrease in Club O Rewards earned due to discontinuing rewards on the Club O Silver program in Q4 2016.
The decrease in partner revenue for the year ended December 31, 2017, as compared to the same period in 2016, was due in part to the changes that Google has made in its natural search engine algorithms. The decrease to revenue can also be explained by an increase in product sales for which we record only our commission as revenue, and an increase in promotional activities, including coupons and site sales due to our driving a higher proportion of our sales using such promotions. We also had a decrease in sales in categories on which we placed a reduced emphasis, which was partially offset by an increase in sales of home and garden products which we have emphasized.
We continue to seek increased participation in our Club O loyalty program, including, in certain instances, by increasing Club O Rewards to our Club O members in lieu of coupons we offer to all customers. For additional information regarding our Club O loyalty program see Item 15 of Part IV, "Financial Statements"—Note 2. Accounting Policies, Club O loyalty program.
The shift of business from direct to partner (or vice versa) is an economic result based on the economics of each particular product offering at the time and we generally do not have particular goals for an "appropriate" mix or percentage for the size of either. Although we have experienced a trend from direct revenue to partner revenue in recent years, we believe that the mix of the business between direct and partner remains consistent with our strategic objectives for our business model in the current economic environment and we do not currently foresee any material shifts in this trend.
The products and product lines we offer, and their respective percentages of our revenue, are based on many factors including customer demand, our marketing efforts, promotional pricing, joint-marketing offered by our suppliers, the types of inventory we are able to obtain and the number of SKUs we offer. These factors change frequently and can affect the mix of the product lines we sell. We have experienced a trend toward our home and garden category in recent years and we have recently focused our marketing and branding efforts towards our home and garden product line. We are also working to increase the number of SKUs we offer. While we do not currently expect any material shifts in our product line mix, the relative amounts of the product lines we sell, and the revenue we earn from those product lines, is generally an economic result of the factors described above, which may change from time to time.
International sales were less than 3% of total net revenues for 2017 and 2016.
Gross profit and gross margin
Our overall gross margins fluctuate based on our sales volume mix between our direct business and partner business; changes in supplier cost and / or sales price, including competitive pricing; inventory management decisions within the direct business; sales coupons and promotions; product mix of sales; and operational and fulfillment costs.
The following table reflects our net revenues, cost of goods sold and gross profit for the years ended December 31, 2017 and 2016 (in thousands):
Year ended December 31, | |||||||||||||||
2017 | 2016 | $ Change | % Change | ||||||||||||
Revenue, net | |||||||||||||||
Direct | $ | 83,052 | $ | 101,578 | $ | (18,526 | ) | (18.2 | )% | ||||||
Partner and other | 1,661,704 | 1,698,385 | (36,681 | ) | (2.2 | )% | |||||||||
Total net revenue | 1,744,756 | 1,799,963 | (55,207 | ) | (3.1 | )% | |||||||||
Cost of goods sold | |||||||||||||||
Direct | 80,585 | 96,271 | (15,686 | ) | (16.3 | )% | |||||||||
Partner and other | 1,323,620 | 1,372,343 | (48,723 | ) | (3.7 | )% | |||||||||
Total cost of goods sold | 1,404,205 | 1,468,614 | (64,409 | ) | (4.4 | )% | |||||||||
Gross Profit | |||||||||||||||
Direct | 2,467 | 5,307 | (2,840 | ) | (53.5 | )% | |||||||||
Partner and other | 338,084 | 326,042 | 12,042 | 3.7 | % | ||||||||||
Total gross profit | $ | 340,551 | $ | 331,349 | $ | 9,202 | 2.8 | % | |||||||
69
Gross margins for the past eight quarterly periods and years ending December 31, 2017 and 2016 were:
Q1 2017 | Q2 2017 | Q3 2017 | Q4 2017 | FY 2017 | |||||||||||
Direct | 8.2 | % | 4.3 | % | 0.3 | % | (2.3 | )% | 3.0 | % | |||||
Partner and other | 20.8 | % | 20.3 | % | 20.7 | % | 19.7 | % | 20.3 | % | |||||
Combined | 20.1 | % | 19.5 | % | 19.7 | % | 18.8 | % | 19.5 | % | |||||
Q1 2016 | Q2 2016 | Q3 2016 | Q4 2016 | FY 2016 | |||||||||||
Direct | 4.7 | % | 6.2 | % | 2.8 | % | 7.3 | % | 5.2 | % | |||||
Partner and other | 19.7 | % | 19.0 | % | 19.1 | % | 19.2 | % | 19.2 | % | |||||
Combined | 18.7 | % | 18.2 | % | 18.2 | % | 18.6 | % | 18.4 | % | |||||
Gross profit for the year ended December 31, 2017 increased 3% compared to the same period in 2016 primarily as a result of increased gross margin. Gross margin increased to 19.5% for the year ended December 31, 2017 compared to 18.4% for the same period in 2016. This increase in gross margin was primarily due to a continued shift in sales mix into higher margin home and garden products and an increase in marketplace sales (which we recognize on a net basis), partially offset by increased promotional activities, including coupons and site sales due to our driving a higher proportion of our sales using such promotions.
The 225 basis point decrease in direct gross margin for the year ended December 31, 2017, as compared to the same period in 2016, was primarily due to increased promotional activities, including coupons and site sales due to our driving a higher proportion of our sales using such promotions, and increased freight costs primarily in the fourth quarter, partially offset by a shift in sales mix into higher margin home and garden products.
The 115 basis point increase in partner gross margin for the year ended December 31, 2017, as compared to the same period in 2016 was primarily due to a continued shift in sales mix into higher margin home and garden products, partially offset by increased promotional activities, including coupons and site sales due to our driving a higher proportion of our sales using such promotions.
Cost of goods sold includes stock-based compensation expense of $183,000 and $266,000 for the years ended December 31, 2017 and 2016, respectively.
Fulfillment costs
Fulfillment costs include all warehousing costs, including fixed overhead and variable handling costs (excluding packaging costs), as well as credit card fees and customer service costs, all of which we include as costs in calculating gross margin. We believe that some companies in our industry, including some of our competitors, account for fulfillment costs within operating expenses, and therefore exclude fulfillment costs from gross margin. As a result, our gross margin may not be directly comparable to others in our industry.
The following table has been included to provide investors additional information regarding our classification of fulfillment costs, gross profit and margin, thus enabling investors to better compare our gross margin with others in our industry (in thousands):
Year ended December 31, | ||||||||||||
2017 | 2016 | |||||||||||
Total revenue, net | $ | 1,744,756 | 100% | $ | 1,799,963 | 100% | ||||||
Cost of goods sold | ||||||||||||
Product costs and other cost of goods sold | 1,328,749 | 76.2% | 1,391,736 | 77.3% | ||||||||
Fulfillment and related costs | 75,456 | 4.3% | 76,878 | 4.3% | ||||||||
Total cost of goods sold | 1,404,205 | 80.5% | 1,468,614 | 81.6% | ||||||||
Gross profit | $ | 340,551 | 19.5% | $ | 331,349 | 18.4% | ||||||
Fulfillment costs as a percentage of sales may vary due to several factors, such as our ability to manage costs at our warehouses, significant changes in the number of units received and fulfilled, the extent to which we use third party fulfillment services and warehouses, and our ability to effectively manage customer service costs and credit card fees. Fulfillment and related costs remained relatively flat during the year ended December 31, 2017 as compared to 2016.
70
See Gross profit and gross margin above for additional discussion.
Operating expenses
Sales and marketing expenses
We use a variety of methods to target our consumer audience, including online campaigns, such as advertising through keywords, product listing ads, display ads, search engines, affiliate marketing programs, social coupon websites, portals, banners, e-mail, direct mail and viral and social media campaigns. We also do brand advertising through television, radio, print ads, and event sponsorships.
The following table reflects our sales and marketing expenses for the years ended December 31, 2017 and 2016 (in thousands):
Year ended December 31, | |||||||||||||||
2017 | 2016 | $ Change | % Change | ||||||||||||
Sales and marketing expenses | $ | 180,589 | $ | 147,896 | $ | 32,693 | 22.1 | % | |||||||
Sales and marketing expenses as a percent of net revenues | 10.4 | % | 8.2 | % | |||||||||||
The 220 basis point increase in sales and marketing expenses as a percentage of revenue for the year ended December 31, 2017, as compared to the same period in 2016, was primarily due to increased spending in sponsored search and display ads on social media, and television marketing channels, and increased staff related costs.
While we work to adapt to Google's changes in its natural search engine algorithms as noted above, we have increased our emphasis on other marketing channels, such as sponsored search, which has generated revenue growth but with higher associated marketing expenses than natural search. We expect this trend to continue while we work to adapt to these changes.
We are also experiencing an increasingly competitive digital marketing landscape. We have competitors who are spending significant amounts on advertising bidding up the cost of certain marketing channels, such as paid keywords. While we may not choose to match their levels of spending, this has increased our marketing costs in recent quarters. We expect this trend to continue. However, we do have a number of important digital marketing initiatives that we are testing and implementing that we believe will improve our competitive position in this area.
Sales and marketing expenses include stock-based compensation expense of $415,000 and $249,000 for the years ended December 31, 2017 and 2016, respectively.
We do not include costs associated with our discounted shipping and other promotions, such as coupons in sales and marketing expense. Rather, we account for them as a reduction of revenue and therefore affect sales and gross margin. We consider discounted shipping and other promotions, such as our policy of free shipping on orders over $45, as an effective marketing tool, and intend to continue to offer them as we deem appropriate as part of our overall marketing plan.
Technology expenses
We seek to invest efficiently in technology, including web services, customer support solutions, website search, expansion of new and existing product categories, and in technology to enhance the customer experience, improve our process efficiency and support and expand our logistics infrastructure. We may increase our technology expenses to support these initiatives and these increases may be material.
The frequency and variety of cyber-attacks on our Website, our corporate systems, and on third parties we use to support our technology continue to increase. The impact of these attacks, their costs, and the costs we incur to protect ourselves against future attacks have not been material. However, we consider the threat from cyber-attacks to be serious and will continue to incur costs related to protecting ourselves against them.
The following table reflects our technology expenses for the years ended December 31, 2017 and 2016 (in thousands):
71
Year ended December 31, | |||||||||||||||
2017 | 2016 | $ Change | % Change | ||||||||||||
Technology expenses | $ | 115,878 | $ | 106,760 | $ | 9,118 | 8.5 | % | |||||||
Technology expenses as a percent of net revenues | 6.6 | % | 5.9 | % | |||||||||||
The $9.1 million increase in technology costs for the year ended December 31, 2017, as compared to the same period in 2016, was primarily due to an increase in staff related costs of $4.9 million, and an increase in technology licenses and maintenance of $4.0 million.
Technology expenses include stock-based compensation expense of $649,000 and $777,000 for the years ended December 31, 2017 and 2016, respectively.
General and administrative expenses
The following table reflects our general and administrative expenses ("G&A") for the years ended December 31, 2017 and 2016 (in thousands):
Year ended December 31, | |||||||||||||||
2017 | 2016 | $ Change | % Change | ||||||||||||
General and administrative expenses | $ | 90,718 | $ | 89,298 | $ | 1,420 | 1.6 | % | |||||||
General and administrative expenses as a percent of net revenues | 5.2 | % | 5.0 | % | |||||||||||
The $1.4 million increase in general and administrative expenses ("G&A") for the year ended December 31, 2017, as compared to the same period in 2016, was primarily due to an increase in staff related costs of $4.9 million, partially offset by a decrease in legal fees of $3.0 million, and a decrease in bad debt expense of $1.1 million.
G&A expenses include stock-based compensation expense of approximately $2.8 million and $3.6 million for the years ended December 31, 2017 and 2016, respectively.
We continue to seek opportunities for growth, in our retail business and through our Medici blockchain and financial technology initiatives and through other means. As a result of these initiatives, we will continue to incur additional expenses and may purchase interests in, or make acquisitions of, other technologies or businesses. We anticipate that our initiatives may cause us to incur losses in the foreseeable future. These losses, additional expenses, acquisitions or purchases may be material, and, coupled with existing marketing expense trends, our plans to increase our marketing and branding expenditures, and strategic changes in our retail business, may lead to increased consolidated losses in some periods, and to reduced liquidity. Additionally, we may recognize additional impairment charges from our ownership interest in other entities.
Litigation settlement
In Q1 2016, we entered into a settlement agreement in our prime broker litigation which concluded the litigation in its entirety and we recognized settlement proceeds of $19.5 million. Related costs associated with the litigation and settlement of approximately $1.0 million were included in G&A expenses during Q1 2016.
72
Depreciation and amortization expense
Depreciation expense is classified within the corresponding operating expense categories in the consolidated statements of operations as follows (in thousands):
Year ended December 31, | ||||||||
2017 | 2016 | |||||||
Cost of goods sold - direct | $ | 307 | $ | 310 | ||||
Technology | 24,604 | 25,693 | ||||||
Sales and marketing | — | 124 | ||||||
General and administrative | 3,937 | 1,156 | ||||||
Total depreciation, including internal-use software and website development | $ | 28,848 | $ | 27,283 | ||||
Amortization of intangible assets other than goodwill is classified within the corresponding operating expense categories in the consolidated statements of operations as follows (in thousands):
Year ended December 31, | ||||||||
2017 | 2016 | |||||||
Technology | $ | 3,620 | $ | 2,904 | ||||
Sales and marketing | 83 | 1,008 | ||||||
General and administrative | 296 | 56 | ||||||
Total amortization | $ | 3,999 | $ | 3,968 | ||||
Non-operating income (expense)
Interest expense
Total interest expense increased $2.1 million, from $877,000 for the year ended December 31, 2016 to $2.9 million for the year ended December 31, 2017. The increase in interest expense is primarily due to no longer capitalizing interest on our headquarters loan due to construction completion.
Other income, net
Other income, net for the year ended December 31, 2017 was $1.2 million as compared to $14.2 million in 2016. The decrease is primarily due to a decrease in Club O Rewards breakage of $14.2 million due to discontinuing our Club O Silver rewards program in Q4 2016, an increase in impairment charges of $2.6 million related to cost method investments, and an increase in debt extinguishment costs of $2.5 million. These decreases were partially offset by an increase in realized gains on sales of cryptocurrencies and precious metals of $6.6 million.
Income taxes
Our effective tax rate for the years ended December 31, 2017 and 2016 was (134.5)% and 45.3%, respectively. Our effective tax rate is affected by recurring items such as research tax credits and non-recurring items such as changes in valuation allowances. It is also affected to a lesser extent by tax rates in foreign jurisdictions and the relative amount of income we earn in those jurisdictions, which we expect to be fairly consistent in the near term. The decrease in the 2017 effective tax rate relative to the 2016 effective tax rate is primarily attributable to our decision to establish a valuation allowance against our deferred tax assets, net of deferred tax liabilities, as well as the impact of the TCJA. In our decision to establish a valuation allowance, we concluded that the negative evidence outweighed the positive evidence and that it was not more likely than not that all our federal and state deferred tax assets will be realized (see Item 15 of Part IV, "Financial Statements"—Note 18. Income Taxes, contained in the "Notes to Consolidated Financial Statements" of this Annual Report on Form 10-K).
We have indefinitely reinvested foreign earnings of $1.3 million at December 31, 2017. The TCJA includes a mandatory deemed repatriation of cumulative foreign earnings for the year ended December 31, 2017, for which we accrued provisional tax expense. However, we would still need to accrue and pay various other taxes on this amount if repatriated. We are currently analyzing our global working capital and cash requirements and the potential tax liabilities attributable to a
73
repatriation, including calculating any excess of the amount for financial reporting over the tax basis in our foreign subsidiaries, but we have yet to determine whether we plan to change our prior assertion and repatriate earnings. Accordingly, we have not recorded any deferred taxes attributable to our investments in our foreign subsidiaries. We will record the tax effects of any change in our prior assertion in the period that we complete our analysis and are able to make a reasonable estimate, and disclose any unrecognized deferred tax liability for temporary differences related to our foreign investments, if practicable, in the period that we are first able to make a reasonable estimate, no later than December 2018.
Seasonality
Based upon our historical experience, revenue typically increases during the fourth quarter because of the holiday retail season and gross margin decreases due to increased sales of certain lower margin products, such as electronics. Revenue typically decreases in the following quarter(s), as shown in the table below. The actual quarterly results for each quarter could differ materially depending upon consumer preferences, availability of product and competition, among other risks and uncertainties. Accordingly, there can be no assurances that seasonal variations will not materially affect our results of operations in the future.
The following table reflects our total net revenues for each of the quarters in 2017, 2016 and 2015 (in thousands):
First Quarter | Second Quarter | Third Quarter | Fourth Quarter | |||||||||||||
2017 | $ | 432,435 | $ | 432,024 | $ | 424,007 | $ | 456,290 | ||||||||
2016 | $ | 413,677 | $ | 418,540 | $ | 441,564 | $ | 526,182 | ||||||||
2015 | $ | 398,344 | $ | 388,013 | $ | 391,211 | $ | 480,270 | ||||||||
Comparison of Years Ended December 31, 2016 and 2015
Executive Commentary
This executive commentary is intended to provide investors with a view of our business through the eyes of our management. As an executive commentary, it necessarily focuses on selected aspects of our business. This executive commentary is intended as a supplement to, but not a substitute for, the more detailed discussion of our business included elsewhere herein. Investors are cautioned to read our entire "Management's Discussion and Analysis of Financial Condition and Results of Operations," as well as our interim and audited financial statements, and the discussion of our business and risk factors and other information included elsewhere or incorporated in this report. This executive commentary includes forward-looking statements, and investors are cautioned to read "Special Cautionary Note Regarding Forward-Looking Statements."
Revenues in 2016 increased 9% compared to 2015. The growth in revenue was primarily due to a 6% increase in average order size, coupled with a 4% increase in orders. These increases were partially offset by increased promotional activities, including coupons and site sales (which we recognize as a reduction of revenue) due to our driving a higher proportion of our sales using such promotions. Our average order size has increased in recent years due primarily to a sales mix shift into home and garden products. We are uncertain how long this trend will continue.
Gross profit in 2016 increased 9% compared to 2015 primarily as a result of revenue growth. Gross margin was flat at 18.4% in 2016 compared to 2015. Gross margin increased due to a continued shift in sales mix into higher margin home and garden products, but that increase was offset by increased promotional activities.
Sales and marketing expenses as a percentage of revenue increased from 7.5% to 8.2% during 2016 as compared to 2015, primarily due to increased spending in the sponsored search marketing channels and increased staff related costs.
As a result of these factors, our Contribution increased 8% in 2016 compared to 2015 (see Non-GAAP Financial Measures below for a reconciliation of Contribution to Gross Profit). Contribution margin was 11.1% in 2016 compared to 11.2% in 2015.
Technology expenses in 2016 increased $8.2 million compared to 2015, primarily due to an increase in depreciation of $5.9 million, an increase in staff-related costs of $2.5 million, and an increase of $1.6 million in technology licenses and maintenance. These increases were partially offset by a $1.3 million decrease in outside consulting services.
74
General and administrative expenses in 2016 increased $7.1 million compared to 2015, primarily due to an increase of $7.6 million in staff related costs and $1.1 million in bad debt expense for accounts receivable due from a marketplace in which we also have a minority interest. These increases were partially offset by a $1.9 million decrease in legal fees and a $1.3 million decrease in consulting and outside services.
During Q3 2016, we recognized an impairment charge of $2.9 million in Other income, net related to an international marketplace company in which we hold a minority interest that has historically been recorded at cost.
In Q1 2016, we entered into a settlement agreement in our prime broker litigation which concluded the litigation in its entirety and we recognized settlement proceeds of $19.5 million. Related costs associated with the litigation and settlement of approximately $1.0 million were included in G&A expenses during Q1 2016.
In December 2016, as a demonstration of the platform and technology developed by our majority-owned subsidiary tØ.com, Inc., we issued publicly traded preferred shares of Overstock.com, Inc. for proceeds of $7.6 million, net of offering costs. Additionally, as part of our Medici initiatives to develop this technology, in Q1 2016, we completed the acquisition of two registered broker-dealers. In 2015 we acquired a related financial technology company.
The balance of our Management's Discussion and Analysis of Financial Condition and Results of Operations provides further information about the matters discussed above and other important matters affecting our business.
75
Results of Operations
The following table sets forth our results of operations expressed as a percentage of total net revenue for the years ended December 31, 2016, 2015 and 2014:
Year ended December 31 | |||||||||
2016 | 2015 | 2014 | |||||||
(as a percentage of total revenue) | |||||||||
Revenue, net | |||||||||
Direct | 5.6 | % | 8.3 | % | 9.8 | % | |||
Partner and other | 94.4 | 91.7 | 90.2 | ||||||
Total net revenue | 100.0 | 100.0 | 100.0 | ||||||
Cost of goods sold | |||||||||
Direct | 5.3 | 7.7 | 8.6 | ||||||
Partner and other | 76.2 | 73.9 | 72.7 | ||||||
Total cost of goods sold | 81.5 | 81.6 | 81.3 | ||||||
Gross profit | 18.4 | 18.4 | 18.7 | ||||||
Operating expenses: | |||||||||
Sales and marketing | 8.2 | 7.5 | 7.3 | ||||||
Technology | 5.9 | 5.9 | 5.8 | ||||||
General and administrative | 5.0 | 5.0 | 4.8 | ||||||
Litigation settlement | (1.1 | ) | — | — | |||||
Total operating expenses | 18.0 | 18.4 | 17.9 | ||||||
Operating income | 0.4 | — | 0.8 | ||||||
Interest income | — | — | — | ||||||
Interest expense | — | — | — | ||||||
Other income, net | 0.8 | 0.2 | 0.1 | ||||||
Income before income taxes | 1.2 | 0.2 | 0.9 | ||||||
Provision for income taxes | 0.5 | 0.1 | 0.3 | ||||||
Consolidated net income | 0.7 | % | 0.1 | % | 0.6 | % | |||
Revenue
The following table reflects our net revenue for the years ended December 31, 2016 and 2015 (in thousands):
Year ended December 31, | |||||||||||||||
2016 | 2015 | $ Change | % Change | ||||||||||||
Revenue, net | |||||||||||||||
Direct | $ | 101,578 | $ | 137,783 | $ | (36,205 | ) | (26.3 | )% | ||||||
Partner and other | 1,698,385 | 1,520,055 | 178,330 | 11.7 | % | ||||||||||
Total revenue, net | $ | 1,799,963 | $ | 1,657,838 | $ | 142,125 | 8.6 | % | |||||||
The primary reason for increased total net revenue for the year ended December 31, 2016, as compared to the same period in 2015, was a 6% increase in average order size, coupled with a 4% increase in orders. These increases were partially offset by increased promotional activities, including coupons and site sales (which we recognize as a reduction of revenue) due to our driving a higher proportion of our sales using such promotions. Our average order size has increased in recent years due primarily to a sales mix shift into home and garden products. We are uncertain how long this trend will continue.
The primary reason for decreased direct revenue for the year ended December 31, 2016, as compared to the same period in 2015, was a decrease in sales of home and garden products (primarily due to a shift from our direct segment to our partner segment) in addition to increased promotional activities, including coupons and site sales (which we recognize as a reduction of
76
revenue) due to our driving a higher proportion of our sales using such promotions. Also, the percentage of revenue we defer from orders taken but not delivered was higher due to the timing of year end.
The increase in partner revenue for the year ended December 31, 2016, as compared to the same period in 2015, was primarily due to an increase in sales of home and garden products. This increase was partially offset by increased promotional activities, including coupons and site sales (which we recognize as a reduction of revenue) due to our driving a higher proportion of our sales using such promotions.
Since mid-2015 through the first half of 2016, we experienced some slowing of our overall revenue growth, which we believe was due in part to changes that Google made in its natural search engine algorithms. While we worked to adapt to Google's changes, we increased our emphasis on other marketing channels, such as sponsored search, which generated revenue growth but with higher associated marketing expenses than natural search.
We continue to seek increased participation in our Club O loyalty program, including, in certain instances, by increasing Club O Rewards to our Club O members in lieu of coupons we offer to all customers. For additional information regarding our Club O loyalty program see Item 15 of Part IV, "Financial Statements"—Note 2. Accounting Policies, Club O loyalty program.
The shift of business from direct to partner (or vice versa) is an economic result based on the economics of each particular product offering at the time and we generally do not have particular goals for an "appropriate" mix or percentage for the size of either. Although we have experienced a trend from direct revenue to partner revenue in recent years, we believe that the mix of the business between direct and partner remains consistent with our strategic objectives for our business model in the current economic environment and we do not currently foresee any material shifts in this trend.
The products and product lines we offer, and their respective percentages of our revenue, are based on many factors including customer demand, our marketing efforts, promotional pricing, joint-marketing offered by our suppliers, the types of inventory we are able to obtain and the number of SKUs we offer. These factors change frequently and can affect the mix of the product lines we sell. We have experienced a trend toward our home and garden category in recent years and we have recently focused our marketing and branding efforts towards our home and garden product line. We are also working to increase the number of SKUs we offer. While we do not currently expect any material shifts in our product line mix, the relative amounts of the product lines we sell, and the revenue we earn from those product lines, is generally an economic result of the factors described above, which may change from time to time.
International sales were less than 2% of total net revenues for 2016 and 2015.
Gross profit and gross margin
Our overall gross margins fluctuate based on our sales volume mix between our direct business and partner business; changes in supplier cost and / or sales price, including competitive pricing; inventory management decisions within the direct business; sales coupons and promotions; product mix of sales; and operational and fulfillment costs.
77
The following table reflects our net revenues, cost of goods sold and gross profit for the years ended December 31, 2016 and 2015 (in thousands):
Year ended December 31, | |||||||||||||||
2016 | 2015 | $ Change | % Change | ||||||||||||
Revenue, net | |||||||||||||||
Direct | $ | 101,578 | $ | 137,783 | $ | (36,205 | ) | (26.3 | )% | ||||||
Partner and other | 1,698,385 | 1,520,055 | 178,330 | 11.7 | % | ||||||||||
Total net revenue | 1,799,963 | 1,657,838 | 142,125 | 8.6 | % | ||||||||||
Cost of goods sold | |||||||||||||||
Direct | 96,271 | 128,077 | (31,806 | ) | (24.8 | )% | |||||||||
Partner and other | 1,372,343 | 1,225,107 | 147,236 | 12.0 | % | ||||||||||
Total cost of goods sold | 1,468,614 | 1,353,184 | 115,430 | 8.5 | % | ||||||||||
Gross Profit | |||||||||||||||
Direct | 5,307 | 9,706 | (4,399 | ) | (45.3 | )% | |||||||||
Partner and other | 326,042 | 294,948 | 31,094 | 10.5 | % | ||||||||||
Total gross profit | $ | 331,349 | $ | 304,654 | $ | 26,695 | 8.8 | % | |||||||
Gross margins for the past eight quarterly periods and years ending December 31, 2016 and 2015 were:
Q1 2016 | Q2 2016 | Q3 2016 | Q4 2016 | FY 2016 | |||||||||||
Direct | 4.7 | % | 6.2 | % | 2.8 | % | 7.3 | % | 5.2 | % | |||||
Partner and other | 19.7 | % | 19.0 | % | 19.1 | % | 19.2 | % | 19.2 | % | |||||
Combined | 18.7 | % | 18.2 | % | 18.2 | % | 18.6 | % | 18.4 | % | |||||
Q1 2015 | Q2 2015 | Q3 2015 | Q4 2015 | FY 2015 | |||||||||||
Direct | 10.0 | % | 9.3 | % | 4.9 | % | 3.8 | % | 7.0 | % | |||||
Partner and other | 19.8 | % | 19.9 | % | 19.8 | % | 18.3 | % | 19.4 | % | |||||
Combined | 18.9 | % | 19.0 | % | 18.5 | % | 17.3 | % | 18.4 | % | |||||
Gross profit in 2016 increased 9% compared to 2015 primarily as a result of revenue growth. Gross margin was flat at 18.4% in 2016 compared to 2015. Gross margin increased due to a continued shift in sales mix into higher margin home and garden products, but that increase was offset by increased promotional activities, including coupons and site sales (which we recognize as a reduction of revenue) due to our driving a higher proportion of our sales using such promotions.
The 182 basis point decrease in direct gross margin for the year ended December 31, 2016, as compared to the same period in 2015, was primarily due to increased promotional activities, including coupons and site sales (which we recognize as a reduction of revenue) due to our driving a higher proportion of our sales using such promotions, and increased warehousing costs as a percentage of revenue due to lower revenue, partially offset by a shift in sales mix into higher margin products.
The 21 basis point decrease in partner gross margin for the year ended December 31, 2016, as compared to the same period in 2015 was primarily due to increased promotional activities, including coupons and site sales (which we recognize as a reduction of revenue) due to our driving a higher proportion of our sales using such promotions, partially offset by a continued shift in sales mix into higher margin home and garden products.
Cost of goods sold includes stock-based compensation expense of $266,000 and $179,000 for the years ended December 31, 2016 and 2015, respectively.
Fulfillment costs
Fulfillment costs include all warehousing costs, including fixed overhead and variable handling costs (excluding packaging costs), as well as credit card fees and customer service costs, all of which we include as costs in calculating gross margin. We believe that some companies in our industry, including some of our competitors, account for fulfillment costs within operating expenses, and therefore exclude fulfillment costs from gross margin. As a result, our gross margin may not be directly comparable to others in our industry.
78
The following table has been included to provide investors additional information regarding our classification of fulfillment costs, gross profit and margin, thus enabling investors to better compare our gross margin with others in our industry (in thousands):
Year ended December 31, | ||||||||||||
2016 | 2015 | |||||||||||
Total revenue, net | $ | 1,799,963 | 100% | $ | 1,657,838 | 100% | ||||||
Cost of goods sold | ||||||||||||
Product costs and other cost of goods sold | 1,391,736 | 77.3% | 1,279,766 | 77.2% | ||||||||
Fulfillment and related costs | 76,878 | 4.3% | 73,418 | 4.4% | ||||||||
Total cost of goods sold | 1,468,614 | 81.6% | 1,353,184 | 81.6% | ||||||||
Gross profit | $ | 331,349 | 18.4% | $ | 304,654 | 18.4% | ||||||
Fulfillment costs as a percentage of sales may vary due to several factors, such as our ability to manage costs at our warehouses, significant changes in the number of units received and fulfilled, the extent to which we use third party fulfillment services and warehouses, and our ability to effectively manage customer service costs and credit card fees. Fulfillment and related costs remained relatively flat during the year ended December 31, 2016 as compared to 2015.
See Gross profit and gross margin above for additional discussion.
Operating expenses
Sales and marketing expenses
We use a variety of methods to target our consumer audience, including online campaigns, such as advertising through keywords, product listing ads, display ads, search engines, affiliate marketing programs, social coupon websites, portals, banners, e-mail, direct mail and viral and social media campaigns. We also do brand advertising through television, radio, print ads, and event sponsorships.
The following table reflects our sales and marketing expenses for the years ended December 31, 2016 and 2015 (in thousands):
Year ended December 31, | |||||||||||||||
2016 | 2015 | $ Change | % Change | ||||||||||||
Sales and marketing expenses | $ | 147,896 | $ | 124,468 | $ | 23,428 | 18.8 | % | |||||||
Sales and marketing expenses as a percent of net revenues | 8.2 | % | 7.5 | % | |||||||||||
The 71 basis point increase in sales and marketing expenses as a percentage of revenue for the year ended December 31, 2016, as compared to the same period in 2015, was primarily due to increased spending in the sponsored search marketing channels and increased staff related costs.
Sales and marketing expenses include stock-based compensation expense of $249,000 and $217,000 for the years ended December 31, 2016 and 2015, respectively.
Costs associated with our discounted shipping and other promotions, such as coupons, are not included in marketing expense. Rather, they are accounted for as a reduction of revenue and therefore affect sales and gross margin. We consider discounted shipping and other promotions, such as our policy of free shipping on orders over $45, as an effective marketing tool, and intend to continue to offer them as we deem appropriate as part of our overall marketing plan.
We constantly evaluate where we spend our sales and marketing dollars and have experienced a trend of increasing costs to acquire customers. From time to time, our competitors may bid up the cost of certain marketing channels, such as paid keywords. At such times, we may reduce the amounts we spend in those marketing channels, which may lead to decreased visitors to our site for a time. For example, during Q4 2016 and Q4 2015, the number of unique visitors to our site decreased by approximately 2% and 8%, respectively, as compared to the prior years, in part we believe as a result of such changes.
79
Technology expenses
We seek to invest efficiently in technology, including web services, customer support solutions, website search, expansion of new and existing product categories, and in technology to enhance the customer experience, improve our process efficiency and support and expand our logistics infrastructure. We may increase our technology expenses to support these initiatives and these increases may be material.
The frequency and variety of cyber-attacks on our Website, our corporate systems, and on third parties that we use to support our technology continue to increase, including an attack that took place in October 2016 which interrupted traffic for several major websites in the United States. The impact of these attacks, their costs, and the costs we incur to protect ourselves against future attacks have not been material. However, we consider the threat from cyber-attacks to be serious and will continue to incur costs related to protecting ourselves against them.
The following table reflects our technology expenses for the years ended December 31, 2016 and 2015 (in thousands):
Year ended December 31, | |||||||||||||||
2016 | 2015 | $ Change | % Change | ||||||||||||
Technology expenses | $ | 106,760 | $ | 98,533 | $ | 8,227 | 8.3 | % | |||||||
Technology expenses as a percent of net revenues | 5.9 | % | 5.9 | % | |||||||||||
The $8.2 million increase in technology costs for the year ended December 31, 2016, as compared to the same period in 2015, was primarily due to an increase in depreciation and amortization of $5.9 million, an increase in staff-related costs of $2.5 million (net employee and contractor change), and an increase of $1.6 million in technology licenses and maintenance. These increases were partially offset by a $1.3 million decrease in outside consulting services.
Technology expenses include stock-based compensation expense of $777,000 and $646,000 for the years ended December 31, 2016 and 2015, respectively.
General and administrative expenses
The following table reflects our general and administrative expenses ("G&A") for the years ended December 31, 2016 and 2015 (in thousands):
Year ended December 31, | |||||||||||||||
2016 | 2015 | $ Change | % Change | ||||||||||||
General and administrative expenses | $ | 89,298 | $ | 82,187 | $ | 7,111 | 8.7 | % | |||||||
General and administrative expenses as a percent of net revenues | 5.0 | % | 5.0 | % | |||||||||||
The $7.1 million increase in general and administrative expenses ("G&A") for the year ended December 31, 2016, as compared to the same period in 2015, was primarily due to an increase of $7.6 million in staff related costs and $1.1 million in bad debt expense for accounts receivable due from a marketplace in which also we have a minority interest. These increases were partially offset by a $1.9 million decrease in legal fees and a $1.3 million decrease in consulting and outside services.
G&A expenses include stock-based compensation expense of approximately $3.6 million and $2.5 million for the years ended December 31, 2016 and 2015, respectively.
During 2016, our Medici-related subsidiaries incurred a pre-tax loss of approximately $11.8 million, which includes $4.4 million of amortization and depreciation expense. During 2015, our Medici-related subsidiaries incurred a pre-tax loss of approximately $7.0 million, which includes $1.5 million of amortization and depreciation expense.
Litigation settlement
In Q1 2016, we entered into a settlement agreement in our prime broker litigation which concluded the litigation in its entirety and we recognized settlement proceeds of $19.5 million. Related costs associated with the litigation and settlement of approximately $1.0 million were included in G&A expenses during Q1 2016.
80
Depreciation and amortization expense
Depreciation expense is classified within the corresponding operating expense categories in the consolidated statements of operations as follows (in thousands):
Year ended December 31, | ||||||||
2016 | 2015 | |||||||
Cost of goods sold - direct | $ | 310 | $ | 283 | ||||
Technology | 25,693 | 22,126 | ||||||
Sales and marketing | 124 | — | ||||||
General and administrative | 1,156 | 1,107 | ||||||
Total depreciation, including internal-use software and website development | $ | 27,283 | $ | 23,516 | ||||
Amortization of intangible assets other than goodwill is classified within the corresponding operating expense categories in the consolidated statements of operations as follows (in thousands):
Year ended December 31, | ||||||||
2016 | 2015 | |||||||
Technology | $ | 2,904 | $ | 605 | ||||
Sales and marketing | 1,008 | 531 | ||||||
General and administrative | 56 | 445 | ||||||
Total amortization | $ | 3,968 | $ | 1,581 | ||||
Non-operating income (expense)
Interest expense
Total interest expense increased $737,000, or 526%, from $140,000 in 2015 to $877,000 in 2016. The increase in interest expense is primarily due to no longer capitalizing interest on our headquarters loan due to construction completion.
Other income (expense), net
Other income, net for the year ended December 31, 2016 was $14.2 million as compared to $3.6 million in 2015. The increase is primarily due to increased Club O Rewards breakage of $10.9 million due to growth in the Club O Rewards program, particularly our Club O Silver program, a $1.2 million decrease in unrealized losses on our precious metals (no losses incurred in 2016), and an $850,000 decrease in costs related to cryptobond transactions (none incurred in 2016). These increases were partially offset by an impairment charge of $2.9 million related to a company in which we hold a minority interest that has historically been recorded at cost.
Beginning in 2015, we enrolled a significant number of members in Club O Silver, a newly introduced Club O membership tier for customers who agree to receive promotional emails. Club O Silver members earned Club O Rewards on qualifying purchases that expire after 90 days from a qualifying purchase. We discontinued Club O Silver in October 2016, and as a result we do not expect further Club O Silver rewards breakage in the future.
Income taxes
Our effective tax rate for the years ended December 31, 2016 and 2015 was 45.3% and 60.8%, respectively. Our effective tax rate is affected by recurring items such as research tax credits and non-recurring items such as changes in valuation allowances. It is also affected to a lesser extent by tax rates in foreign jurisdictions and the relative amount of income we earn in those jurisdictions, which we expect to be fairly consistent in the near term. The decrease in the 2016 effective tax rate relative to the 2015 effective tax rate is primarily attributable to our increased pre-tax income in 2016 over 2015 and increased ownership of our majority-owned subsidiary, tZERO. Prior to Q3 2015, we owned 75.1% of tZERO. Tax losses incurred while holding less than 80% of the business cannot offset our consolidated taxable income and are fully valued. The operating losses that tZERO incurred after we increased our ownership during Q3 2015 did not require a valuation allowance since the subsidiary now qualified for tax consolidation. The decrease in the effective tax rate was partially offset by an increase in our
81
valuation allowance for capital losses due to an impairment loss on a minority interest in an international marketplace and share-based compensation tax deficiencies due to a decline in our stock price. We expect volatility in our tax rate in future periods due to share-based compensation deductions that will result from our adoption of ASU No. 2016-09, Compensation—Stock Compensation (Topic 718): Improvements to Employee Share-Based Payment Accounting.
We had indefinitely reinvested foreign earnings of $421,000 at December 31, 2016. We would need to accrue and pay U.S. income tax on this amount if repatriated. At the time, we did not intend to repatriate these earnings.
Seasonality
Based upon our historical experience, revenue typically increases during the fourth quarter because of the holiday retail season and gross margin decreases due to increased sales of certain lower margin products, such as electronics. Revenue typically decreases in the following quarter(s), as shown in the table below. The actual quarterly results for each quarter could differ materially depending upon consumer preferences, availability of product and competition, among other risks and uncertainties. Accordingly, there can be no assurances that seasonal variations will not materially affect our results of operations in the future.
The following table reflects our total net revenues for each of the quarters in 2016, 2015 and 2014 (in thousands):
First Quarter | Second Quarter | Third Quarter | Fourth Quarter | |||||||||||||
2016 | $ | 413,677 | $ | 418,540 | $ | 441,564 | $ | 526,182 | ||||||||
2015 | $ | 398,344 | $ | 388,013 | $ | 391,211 | $ | 480,270 | ||||||||
2014 | $ | 341,207 | $ | 332,545 | $ | 352,991 | $ | 470,360 | ||||||||
Liquidity and Capital Resources
Overview
Although we believe that our cash and cash equivalents currently on hand and expected cash flows from future operations will be sufficient to continue operations for at least the next twelve months, we also believe that we will need to raise additional capital and/or obtain significant additional debt financing to be able to fully pursue our plans for increasing market share in our retail business while also funding the needs of our Medici initiatives.
We believe that some of our direct competitors spend significantly higher percentages of their revenue on marketing than we do, and that we need to increase our branding and marketing expenditures in order to increase our market share in the e-commerce home goods market and educate consumers about our current position as an online retailer offering a wide assortment of quality home goods and other products at low prices and with a high level of customer service. We have developed and implemented marketing and branding initiatives to address this, and believe that additional marketing and branding efforts will have significant long-term positive results. However, a significant increase in our branding and marketing expenditures or other expenses would be likely to adversely affect our short-term results.
We also want to invest in additional distribution facilities to speed shipping and improve our customer service; in additional automation, technology and engineering resources because we believe they can improve our customers' shopping experience and increase our sales; in our Club O rewards program, primarily to increase member benefits and to develop additional personalization programs; and in expansion of our private label initiative because we believe that private label brands can generate significant brand equity and customer loyalty. See Item 1 of Part I, "Business"—"Our Retail Business"—"Growth Strategies for Our E-Commerce Business."
Our Medici initiatives also require substantial funding. Medici Ventures and its majority-owned subsidiary, tZERO, continue to identify, evaluate and pursue various opportunities for strategic acquisitions or purchases of interests to add to the services and expertise they offer their customers. See Item 1 of Part I, "Business"—Medici for information regarding our recent and planned strategic acquisitions or purchases of interests.
Our ability to pursue some or all of these plans, and the extent to which we would be able to pursue some or all of them, will depend on the resources we have available, and will require significantly more capital than we currently have.
Current sources of liquidity
82
We believe that our cash and cash equivalents currently on hand and expected cash flows from future operations will be sufficient to continue operations for at least the next twelve months. Our failure to generate sufficient revenues or profits or to obtain additional financing or raise additional capital could have a material adverse effect on our operations and on our ability to achieve our business objectives. Any projections of future cash needs and cash flows are subject to substantial uncertainty.
In November 2017, we entered into a $40.0 million loan agreement with PCL L.L.C., an entity directly or indirectly wholly owned by the mother and brother of our Chief Executive Officer, Dr. Patrick Byrne. For additional information, see Borrowings—PCL loan below.
In November 2017, we issued two warrants to purchase the company's common stock in privately negotiated transactions for an aggregate purchase price of $6.5 million. In December 2017, one warrant was exercised and we issued common shares of Overstock.com, Inc. for proceeds of $100.0 million before expenses. On January 17, 2018, the other warrant was exercised in full and proceeds of $50.6 million were received.
In December 2017, tZERO launched an offering (the "security token offering") of the right to acquire, if issued by tZERO in the future, tZERO Preferred Equity Tokens (the "tZERO Security Token") through a Simple Agreement for Future Equity ("SAFE"). The security token offering is expected to run through May 14, 2018 but may be extended or shortened and is subject to withdrawal rights under certain circumstances. As of March 14, 2018, tZERO has received $91.4 million in proceeds, net of requested withdrawals.
Our principal sources of liquidity are cash flows generated from operations, and our existing cash and cash equivalents. At December 31, 2017, we had cash and cash equivalents of $203.2 million.
Cash flow information is as follows (in thousands):
Year ended December 31, | ||||||||
2017 | 2016 | |||||||
Cash provided by (used in): | ||||||||
Operating activities | $ | (35,321 | ) | $ | 39,564 | |||
Investing activities | (17,960 | ) | (79,447 | ) | ||||
Financing activities | 73,398 | 52,719 | ||||||
Free cash flow
"Free Cash Flow" (a non-GAAP measure) for the years ended December 31, 2017 and 2016, was $(58.9) million and $(32.7) million, respectively. See Non-GAAP Financial Measures below for a reconciliation of Free Cash Flow to net cash provided by (used in) operating activities.
Cash flows from operating activities
For the years ended December 31, 2017 and 2016, our operating activities resulted in net cash outflow of $35.3 million and net cash inflow of $39.6 million, respectively.
Cash received from customers generally corresponds to our net revenues as our customers primarily use credit cards to buy from us causing our receivables from these sales transactions to settle quickly. We have payment terms with our partners that generally extend beyond the amount of time necessary to collect proceeds from our customers. As a result, following our typically seasonally strong fourth quarter sales, at December 31 of each year, our cash, cash equivalents and accounts payable balances normally reach their highest level (other than as a result of cash flows provided by or used in investing and financing activities). However, our accounts payable balance normally declines during the first three months following year-end, which normally results in a decline in our cash and cash equivalents balances from the year-end balance. The seasonality of our business normally causes payables and accruals to grow significantly in the fourth quarter, and then decrease in the first quarter when they are typically paid.
The $35.3 million of net cash used in operating activities during the year ended December 31, 2017 was primarily from a consolidated net loss of $111.9 million, and a decrease in accounts payable of $21.0 million. These were partially offset
83
by non-cash deferred income taxes of $65.2 million, and depreciation of $28.8 million. The change in accounts payable was primarily due to lower sales volume in December 2017 compared to the same period in 2016. We recorded a significant amount of deferred income taxes in 2017 attributable to our decision to establish a valuation allowance against our deferred tax assets, net of deferred tax liabilities, as well as the impact of the TCJA. Depreciation expense incurred is primarily due to depreciation of web development projects and our new corporate headquarters.
The $39.6 million of net cash provided by operating activities during the year ended December 31, 2016 was primarily from non-cash depreciation of $27.3 million, an increase in accrued expenses of $16.9 million, and consolidated net income of $11.2 million. These were offset by a decrease in accounts payable of $18.8 million. Depreciation expense incurred is primarily due to the depreciation of web development projects and our new corporate headquarters which was completed in Q3 2016. The change in accounts payable was primarily due to timing of payments to suppliers. In 2016, some holiday sales occurred earlier than in 2015 (including sales on Black Friday and Cyber Monday) which resulted in earlier payments to our suppliers resulting in lower operating cash flow than in 2015. Changes in accrued liabilities were also due to timing of invoice approval.
Cash flows from investing activities
For the year ended December 31, 2017, investing activities resulted in net cash outflows of $18.0 million, primarily from expenditures for fixed assets of $23.6 million, equity method investments of $3.0 million, and cost method investments of $2.2 million, offset by proceeds from sale of precious metals of $11.9 million.
For the year ended December 31, 2016, investing activities resulted in net cash outflows of $79.4 million, primarily from expenditures for fixed assets of $72.3 million, cost method investments of $4.8 million and disbursements for loans made of $3.7 million.
Cash flows from financing activities
For the years ended December 31, 2017 and 2016, financing activities resulted in net cash inflows of $73.4 million and $52.7 million, respectively.
The $73.4 million provided by financing activities during the year ended December 31, 2017 resulted primarily from $100.0 million of proceeds from exercise of a stock warrant, $40.0 million of proceeds from our PCL term loan, offset by $45.8 million of repayments on our U.S. Bank term loan, $15.3 million of repayments on lease finance obligations with U.S. Bank and $11.2 million of purchases of treasury stock.
The $52.7 million provided by financing activities during the year ended December 31, 2016 resulted primarily from $36.3 million of proceeds from our U.S. Bank term loan, $11.4 million of proceeds from lease finance obligations with U.S. Bank and $7.6 million of proceeds, net of offering costs, from our preferred stock offering in Q4 2016, partially offset by $1.9 million for payments on finance obligations.
Contractual Obligations and Commitments
The following table summarizes our contractual obligations as of December 31, 2017 and the effect such obligations and commitments are expected to have on our liquidity and cash flow in future periods (in thousands):
Payments Due by Period | ||||||||||||||||||||||||||||
Contractual Obligations | 2018 | 2019 | 2020 | 2021 | 2022 | Thereafter | Total | |||||||||||||||||||||
PCL term loan payments | $ | 3,200 | $ | 41,052 | $ | — | $ | — | $ | — | $ | — | $ | 44,252 | ||||||||||||||
Operating leases | 6,962 | 6,733 | 4,292 | 4,335 | 4,439 | 16,356 | 43,117 | |||||||||||||||||||||
Purchase obligations | 5,487 | — | — | — | — | — | 5,487 | |||||||||||||||||||||
Technology services | 1,369 | 1,901 | 1,584 | — | — | — | 4,854 | |||||||||||||||||||||
Total contractual cash obligations | $ | 17,018 | $ | 49,686 | $ | 5,876 | $ | 4,335 | $ | 4,439 | $ | 16,356 | $ | 97,710 | ||||||||||||||
PCL term loan payments
We are party to a financing agreement related to our corporate headquarters (see Borrowings below). The amounts presented reflect our related principal and interest payments.
84
Operating leases
From time to time we enter into operating leases for facilities and equipment for use in our operations.
Purchase obligations
The amount of purchase obligations shown above is based on assumptions regarding the legal enforceability against us of inventory purchase orders we had outstanding at December 31, 2017. Under different assumptions regarding our rights to cancel our purchase orders or different assumptions regarding the enforceability of the purchase orders under applicable law, the amount of purchase obligations shown in the table above would be less.
Technology services
From time to time we enter into long-term contractual agreements for technology services and capital leases for equipment included in such service agreements.
Tax contingencies
We are involved in various tax matters, the outcomes of which are uncertain. As of December 31, 2017 and 2016, tax contingencies were $1.7 million and $1.5 million, respectively, which are included in our reconciliation of unrecognized tax benefits (see Item 15 of Part IV, "Financial Statements"—Note 18. Income Taxes, contained in the "Notes to Consolidated Financial Statements" of this Annual Report on Form 10-K). We expect the total amount of tax contingencies to increase in the future. In addition, changes in state, federal, and foreign tax laws may increase our tax contingencies. The timing of the resolution of income tax contingencies is highly uncertain, and the amounts ultimately paid, if any, upon resolution of issues raised by the taxing authorities may differ from the amounts accrued. It is reasonably possible that within the next 12 months we will receive additional assessments by various tax authorities. These assessments may or may not result in changes to our contingencies related to positions on prior years' tax filings.
Borrowings
PCL L.L.C. term loan agreement
On November 6, 2017, we entered into a loan agreement with PCL L.L.C., an entity directly or indirectly wholly owned by the mother and brother of our Chief Executive Officer, Dr. Patrick Byrne. The agreement provides for a $40.0 million term loan (the "PCL Loan") which carries an annual interest rate of 8.0% and a default rate of 18.0%. The PCL Loan is for a term of 18 months, subject to mandatory prepayment under certain circumstances, and is prepayable at our election at any time without penalty or premium. Interest only is due monthly.
The principal amount and any then unpaid interest will be due and payable on May 1, 2019 subject to mandatory prepayment in the event of a sale or encumbrance of the headquarters building or a change of ownership of Overstock or the occurrence of certain other events, including material changes to Overstock's business, the loss of management control of Overstock by Dr. Patrick Byrne and other events. The PCL Loan is secured by our corporate headquarters and the related land, fixtures and certain related personal property. We incurred insignificant debt issuance costs with the new loan agreement. The $40.0 million proceeds from this loan together with our cash resources were used to repay the remaining outstanding balances and terminate the U.S. Bank Term Loan, Revolving Loan, Master Lease Agreement, and associated derivative instruments.
At December 31, 2017, our outstanding balance on the PCL Loan was $40.0 million. Amounts outstanding under the Term Loan are presented net of discount and issuance costs in our consolidated balance sheets.
U.S. Bank letters of credit
At December 31, 2017 and 2016, letters of credit totaling $355,000, were issued on our behalf collateralized by compensating cash balances held at U.S. Bank, which are included in Restricted cash in the accompanying consolidated balance sheets.
U.S. Bank commercial purchasing card agreement
85
We have a commercial purchasing card (the "Purchasing Card") agreement with U.S. Bank. We use the Purchasing Card for business purpose purchasing and must pay it in full each month. At December 31, 2017, $822,000 was outstanding and $4.2 million was available under the Purchasing Card. At December 31, 2016, $811,000 was outstanding and $4.2 million was available under the Purchasing Card.
Other Factors that May Affect Future Results
We believe that our cash and cash equivalents currently on hand and expected cash flows from future operations will be sufficient to continue operations for at least the next twelve months. Any projections of future cash needs and cash flows are subject to substantial uncertainty. See Item 1A of Part I, "Risk Factors."
We periodically evaluate opportunities to repurchase our equity securities, obtain credit facilities, or issue additional debt or equity securities. In addition, we may, from time to time, consider the investment in, or acquisition of, complementary businesses, products, services, or technologies, any of which might affect our liquidity requirements or cause us to issue additional debt or equity securities. There can be no assurance that financing arrangements will be available in amounts or on terms acceptable to us, if at all. Our future results may be significantly different from our historical results for several other reasons as well, including the possibility discussed in this Annual Report on Form 10-K that we may sell our retail business, which would have a dramatic effect on our future results. Other reasons that our future results may be significantly different from our historical results include the potential effects on us of the accounting and tax changes discussed in this Annual Report on Form 10-K, the security token offering being conducted by our majority-owned subsidiary tZERO, and other reasons described in Item 1. “Business” under “Our Retail Business,” “Medici,” and “Potential Strategic Initiatives,” as well as the risk factors described in Item 1A. “Risk Factors.”
Any investment in our securities involves a high degree of risk. Investors should consider carefully the risks and uncertainties described in this Form 10-K, including the risks described in Item 1A of Part I, "Risk Factors", and all other information in this Form 10-K and in our other filings with the SEC including those we file after we file this Form 10-K, before deciding whether to purchase or hold our securities. Additional risks and uncertainties not currently known to us or that we currently deem immaterial may also become important factors that may harm our business. The occurrence of any of the risks described under "Risk Factors" in this report could harm our business. The trading price of our securities could decline due to any of these risks and uncertainties, and investors may lose part or all of their investment.
Off-Balance Sheet Arrangements
We do not have any off-balance sheet arrangements that have or are reasonably likely to have a current or future effect on our financial condition, changes in financial condition, revenues or expenses, results of operations, liquidity, capital expenditures or capital resources that would be material to investors.
Non-GAAP Financial Measures
Regulation G, Conditions for Use of Non-GAAP Financial Measures, and other SEC regulations regulate the disclosure of certain non-GAAP financial information.
Contribution and contribution margin
Contribution and contribution margin (non-GAAP financial measures - which we reconcile to "Gross Profit" in our consolidated statement of operations) consist of gross profit less sales and marketing expense plus Club O Rewards and gift card breakage and reflects an additional way of viewing our results. Contribution margin is contribution as a percentage of total net revenue. We believe contribution and contribution margin provide management and users of the financial statements information about our ability to cover our operating costs, such as technology and general and administrative expenses, while reflecting the selling costs we incurred to generate our revenues and adding back the reductions in revenue that we recognized for Club O Rewards that have subsequently expired and for gift cards whose redemption is remote. Contribution and contribution margin are used in addition to and in conjunction with results presented in accordance with GAAP and should not be relied upon to the exclusion of GAAP financial measures. The material limitation associated with the use of contribution is that it is an incomplete measure of profitability as it does not include all operating expenses or all non-operating income and expenses. Management compensates for these limitations when using this measure by looking at other GAAP measures, such as operating income and net income. You should review our financial statements and publicly-filed reports in their entirety and not rely on any single financial measure. For additional information regarding our segment reporting, see Item 15 of Part IV,
86
"Financial Statements"—Note 21. Business Segments, contained in the "Notes to Consolidated Financial Statements" of this Annual Report on Form 10-K.
Our calculation of our consolidated contribution and contribution margin is set forth below (in thousands):
Year ended December 31, | ||||||||||||
2017 | 2016 | 2015 | ||||||||||
Total net revenue | $ | 1,744,756 | $ | 1,799,963 | $ | 1,657,838 | ||||||
Cost of goods sold | 1,404,205 | 1,468,614 | 1,353,184 | |||||||||
Gross profit | 340,551 | 331,349 | 304,654 | |||||||||
Less: Sales and marketing expense | 180,589 | 147,896 | 124,468 | |||||||||
Plus: Club O Rewards and gift card breakage (included in Other income, net) | 2,742 | 16,808 | 5,911 | |||||||||
Contribution | $ | 162,704 | $ | 200,261 | $ | 186,097 | ||||||
Contribution margin | 9.3 | % | 11.1 | % | 11.2 | % | ||||||
Our calculation of our contribution and contribution margin by Retail Total (which consists of Direct and Partner) and Other (which consists of Medici) is set forth below (in thousands):
Year ended, December 31 | |||||||||||||||||
Direct | Partner | Retail Total (Direct and Partner) | Other | Consolidated | |||||||||||||
2017 | |||||||||||||||||
Total net revenue | $ | 83,052 | $ | 1,645,052 | $ | 1,728,104 | $ | 16,652 | $ | 1,744,756 | |||||||
Cost of goods sold | 80,585 | 1,311,973 | 1,392,558 | 11,647 | 1,404,205 | ||||||||||||
Gross profit | $ | 2,467 | $ | 333,079 | $ | 335,546 | $ | 5,005 | $ | 340,551 | |||||||
Less: Sales and marketing expense | 179,549 | 1,040 | 180,589 | ||||||||||||||
Plus: Club O Rewards and gift card breakage (included in Other income, net) | 2,742 | — | 2,742 | ||||||||||||||
Contribution | $ | 158,739 | $ | 3,965 | $ | 162,704 | |||||||||||
Contribution margin | 9.2 | % | 23.8 | % | 9.3 | % | |||||||||||
2016 | |||||||||||||||||
Total net revenue | $ | 101,578 | $ | 1,683,204 | $ | 1,784,782 | $ | 15,181 | $ | 1,799,963 | |||||||
Cost of goods sold | 96,271 | 1,362,140 | 1,458,411 | 10,203 | 1,468,614 | ||||||||||||
Gross profit | $ | 5,307 | $ | 321,064 | $ | 326,371 | $ | 4,978 | $ | 331,349 | |||||||
Less: Sales and marketing expense | 147,368 | 528 | 147,896 | ||||||||||||||
Plus: Club O Rewards and gift card breakage (included in Other income, net) | 16,808 | — | 16,808 | ||||||||||||||
Contribution | $ | 195,811 | $ | 4,450 | $ | 200,261 | |||||||||||
Contribution margin | 11.0 | % | 29.3 | % | 11.1 | % | |||||||||||
2015 | |||||||||||||||||
Total net revenue | $ | 137,783 | $ | 1,518,125 | $ | 1,655,908 | $ | 1,930 | $ | 1,657,838 | |||||||
Cost of goods sold | 128,077 | 1,225,107 | 1,353,184 | — | 1,353,184 | ||||||||||||
Gross profit | $ | 9,706 | $ | 293,018 | $ | 302,724 | $ | 1,930 | $ | 304,654 | |||||||
Less: Sales and marketing expense | 124,218 | 250 | 124,468 | ||||||||||||||
Plus: Club O Rewards and gift card breakage (included in Other income, net) | 5,911 | — | 5,911 | ||||||||||||||
Contribution | $ | 184,417 | $ | 1,680 | $ | 186,097 | |||||||||||
Contribution margin | 11.1 | % | 87.0 | % | 11.2 | % | |||||||||||
87
For additional information regarding our segment reporting, see Item 15 of Part IV, "Financial Statements"—Note 21. Business Segments, contained in the "Notes to Consolidated Financial Statements" of this Annual Report on Form 10-K.
Free cash flow
Free cash flow (a non-GAAP financial measure) reflects an additional way of viewing our cash flows and liquidity that, when viewed with our GAAP results, provides a more complete understanding of factors and trends affecting our cash flows and liquidity. Free cash flow, which we reconcile below to "Net cash provided by (used in) operating activities," the nearest GAAP financial measure, is net cash provided by operating activities reduced by "Expenditures for fixed assets, including internal-use software and website development." We believe that net cash provided by operating activities is an important measure, since it includes both the cash impact of the continuing operations of the business and changes in the balance sheet that impact cash. We believe free cash flow is a useful measure to evaluate our business since purchases of fixed assets are a necessary component of ongoing operations and free cash flow measures the amount of cash we have available for mandatory debt service and financing obligations, changes in our capital structure, and future investments after purchases of fixed assets. Free cash flow measures have limitations as they omit certain components of the overall consolidated statement of cash flows and do not represent the residual cash flow available for discretionary expenditures. Free cash flow should not be considered a substitute for net income or cash flow data prepared in accordance with GAAP and may not be comparable to similarly titled measures used by other companies. Therefore, we believe it is important to view free cash flow as a complement to our entire consolidated statements of cash flows as reconciled below (in thousands):
Year ended December 31, | ||||||||||||
2017 | 2016 | 2015 | ||||||||||
Net cash provided by operating activities | $ | (35,321 | ) | $ | 39,564 | $ | 54,516 | |||||
Expenditures for fixed assets, including internal-use software and website development | (23,586 | ) | (72,281 | ) | (59,513 | ) | ||||||
Free cash flow | $ | (58,907 | ) | $ | (32,717 | ) | $ | (4,997 | ) | |||
ITEM 7A. QUANTITATIVE AND QUALITATIVE DISCLOSURES ABOUT MARKET RISK
We do not use derivative financial instruments, except, prior to November 6, 2017, for the interest rate swaps on our U.S. Bank term loan, and we have no foreign exchange contracts. Our financial instruments consist of cash and cash equivalents, trade accounts and contracts receivable, accounts payable and long-term obligations. We consider highly-liquid instruments with a remaining maturity of 90 days or less at the date of purchase to be cash equivalents.
Our exposure to market risk for changes in interest rates relates primarily to our short-term investments and short-term obligations; thus, fluctuations in interest rates would not have a material impact on the fair value of these securities. However, the fair values of our investments may be subject to fluctuations due to volatility of the stock market in general, investment-specific circumstances, and changes in general economic conditions.
At December 31, 2017, we had $203.2 million in cash and cash equivalents. Hypothetically, an increase or decrease in interest rates of one hundred basis points would have an estimated impact of $2.0 million on our earnings or loss, or the cash flows of these instruments.
At December 31, 2017, letters of credit totaling $355,000 were outstanding under our credit facilities. Hypothetically, an increase or decrease in interest rates of one hundred basis points would have an estimated impact of $4,000 on our earnings or loss if the letters of credit were fully drawn.
At December 31, 2017, we had cryptocurrency-denominated assets totaling $1.5 million. Hypothetically, an increase or decrease in the market value of one hundred basis points would have an estimated impact of $15,000 on our earnings or loss, or the recorded value of these instruments. Reported earnings resulting from increases in the market value of cryptocurrency would be limited to their historical cost.
At December 31, 2017, we did not hold any precious metals.
ITEM 8. FINANCIAL STATEMENTS AND SUPPLEMENTARY DATA
88
The financial statements and supplementary data required by this item are included in Part IV, Item 15 of this Annual Report on Form 10-K.
ITEM 9. CHANGES IN AND DISAGREEMENTS WITH ACCOUNTANTS ON ACCOUNTING AND FINANCIAL DISCLOSURE
None.
ITEM 9A. CONTROLS AND PROCEDURES
(a) Disclosure Controls and Procedures
We maintain disclosure controls and procedures, as such term is defined in Rules 13a-15(e) and 15d-15(e) of the Securities Exchange Act of 1934, as amended (the "Exchange Act"). The term disclosure controls and procedures means controls and other procedures of an issuer that are designed to ensure that information required to be disclosed by the issuer in the reports that it files or submits under the Exchange Act is recorded, processed, summarized and reported, within the time periods specified in the Commission's rules and forms.
Disclosure controls and procedures include, without limitation, controls and procedures designed to ensure that information required to be disclosed by an issuer in the reports that it files or submits under the Exchange Act is accumulated and communicated to the issuer's management, including its principal executive and principal financial officers, or persons performing similar functions, as appropriate to allow timely decisions regarding required disclosure.
Evaluation of Disclosure Controls and Procedures
We carried out an evaluation required by the Exchange Act under the supervision and with the participation of our principal executive officer and principal financial officer, of the effectiveness of the design and operation of our disclosure controls and procedures, as defined in Rule 13a-15(e) of the Exchange Act, as of the end of the period covered by this report. Based on this evaluation, our principal executive officer and principal financial officer concluded that our disclosure controls and procedures were effective to provide reasonable assurance that information required to be disclosed by us in the reports that we file or submit under the Exchange Act is recorded, processed, summarized and reported within the time periods specified in the SEC's rules and forms and to provide reasonable assurance that such information is accumulated and communicated to our management, including our principal executive officer and principal financial officer, as appropriate to allow timely decisions regarding required disclosure.
Our disclosure controls and procedures are designed to provide reasonable assurance of achieving their objectives as specified above. Management does not expect, however, that our disclosure controls and procedures will prevent or detect all error and fraud. Any control system, no matter how well designed and operated, is based upon certain assumptions and can provide only reasonable, not absolute, assurance that its objectives will be met. Further, no evaluation of controls can provide absolute assurance that misstatements due to error or fraud will not occur or that all control issues and instances of fraud, if any, within the Company have been detected.
(b) Management's Report on Internal Control over Financial Reporting
Management of the Company is responsible for establishing and maintaining adequate internal control over financial reporting as defined in Rules 13a-15(f) and 15d-15(f) under the Exchange Act.
Internal control over financial reporting is a process designed to provide reasonable assurance regarding the reliability of financial reporting and the preparation of financial statements for external purposes in accordance with generally accepted accounting principles. Because of its inherent limitations, internal control over financial reporting may not prevent or detect misstatements. Also, projections of any evaluation of effectiveness of internal control over financial reporting to future periods are subject to the risk that controls may become inadequate because of changes in conditions, or that the degree of compliance with the policies or procedures may deteriorate.
Management has assessed the effectiveness of our internal control over financial reporting as of December 31, 2017. In making our assessment of the effectiveness of internal control over financial reporting, management used the criteria set forth in Internal Control-Integrated Framework (2013) issued by the Committee of Sponsoring Organizations of the Treadway Commission ("COSO"). Based on this assessment, management has concluded that, as of December 31, 2017, our internal control over financial reporting was effective.
89
Our internal control over financial reporting is designed to provide reasonable assurance of achieving its objectives as specified above. Management does not expect, however, that our internal control over financial reporting will prevent or detect all error and fraud. Any control system, no matter how well designed and operated, is based upon certain assumptions and can provide only reasonable, not absolute, assurance that its objectives will be met. Further, no evaluation of controls can provide absolute assurance that misstatements due to error or fraud will not occur or that all control issues and instances of fraud, if any, within the Company have been detected.
The effectiveness of our internal control over financial reporting as of December 31, 2017 has been audited by KPMG LLP, an independent registered public accounting firm, as stated in their report which is in Item 9A(c).
90
(c) Independent Registered Public Accounting Firm's Report on Internal Control Over Financial Reporting
Report of Independent Registered Public Accounting Firm
To the Stockholders and Board of Directors
Overstock.com, Inc.:
Opinion on Internal Control Over Financial Reporting
We have audited Overstock.com, Inc. and subsidiaries' (the Company) internal control over financial reporting as of December 31, 2017, based on criteria established in Internal Control—Integrated Framework (2013) issued by the Committee of Sponsoring Organizations of the Treadway Commission. In our opinion, the Company maintained, in all material respects, effective internal control over financial reporting as of December 31, 2017, based on criteria established in Internal Control—Integrated Framework (2013) issued by the Committee of Sponsoring Organizations of the Treadway Commission.
We also have audited, in accordance with the standards of the Public Company Accounting Oversight Board (United States) (PCAOB), the consolidated balance sheets of the Company as of December 31, 2017 and 2016, the related consolidated statements of operations, comprehensive income (loss), changes in stockholders' equity, and cash flows for each of the years in the three-year period ended December 31, 2017, and the related notes and financial statement schedule II (collectively, the consolidated financial statements), and our report dated March 15, 2018 expressed an unqualified opinion on those consolidated financial statements.
Basis for Opinion
The Company's management is responsible for maintaining effective internal control over financial reporting and for its assessment of the effectiveness of internal control over financial reporting, included in the accompanying Management's Report on Internal Control over Financial Reporting. Our responsibility is to express an opinion on the Company's internal control over financial reporting based on our audit. We are a public accounting firm registered with the PCAOB and are required to be independent with respect to the Company in accordance with the U.S. federal securities laws and the applicable rules and regulations of the Securities and Exchange Commission and the PCAOB.
We conducted our audit in accordance with the standards of the PCAOB. Those standards require that we plan and perform the audit to obtain reasonable assurance about whether effective internal control over financial reporting was maintained in all material respects. Our audit of internal control over financial reporting included obtaining an understanding of internal control over financial reporting, assessing the risk that a material weakness exists, and testing and evaluating the design and operating effectiveness of internal control based on the assessed risk. Our audit also included performing such other procedures as we considered necessary in the circumstances. We believe that our audit provides a reasonable basis for our opinion.
Definition and Limitations of Internal Control Over Financial Reporting
A company's internal control over financial reporting is a process designed to provide reasonable assurance regarding the reliability of financial reporting and the preparation of financial statements for external purposes in accordance with generally accepted accounting principles. A company's internal control over financial reporting includes those policies and procedures that (1) pertain to the maintenance of records that, in reasonable detail, accurately and fairly reflect the transactions and dispositions of the assets of the company; (2) provide reasonable assurance that transactions are recorded as necessary to permit preparation of financial statements in accordance with generally accepted accounting principles, and that receipts and expenditures of the company are being made only in accordance with authorizations of management and directors of the company; and (3) provide reasonable assurance regarding prevention or timely detection of unauthorized acquisition, use, or disposition of the company’s assets that could have a material effect on the financial statements.
Because of its inherent limitations, internal control over financial reporting may not prevent or detect misstatements. Also, projections of any evaluation of effectiveness to future periods are subject to the risk that controls may become inadequate because of changes in conditions, or that the degree of compliance with the policies or procedures may deteriorate.
/s/ KPMG LLP
Salt Lake City, Utah
March 15, 2018
91
(d) Changes in Internal Control Over Financial Reporting
During the fiscal quarter ended December 31, 2017, there has not occurred any change in our internal control over financial reporting that has materially affected, or is reasonably likely to materially affect, our internal control over financial reporting.
ITEM 9B. OTHER INFORMATION
On December 24, 2017, our majority-owned subsidiary tZERO adopted a 2017 Equity Incentive Plan, a copy of which is filed as an exhibit to this Annual Report on Form 10-K.
92
PART III
ITEM 10. DIRECTORS, EXECUTIVE OFFICERS AND CORPORATE GOVERNANCE
Information regarding our Executive Officers required by Item 10 of Part III is set forth in Item 1 of Part I under "Business—Executive Officers of the Registrant." Information required by Item 10 of Part III regarding our Board of Directors and any material changes to the process by which security holders may recommend nominees to the Board of Directors will be included in our definitive proxy statement for our 2018 annual meeting of stockholders, and is incorporated herein by reference. Information relating to compliance with Section 16(a) of the 1934 Act will be set forth in our definitive proxy statement for our 2018 annual meeting of stockholders and is incorporated herein by reference.
We have adopted a Code of Business Conduct and Ethics ("Code"), which applies to all employees of the Company, including our principal executive officer, principal financial officer, and principal accounting officer. We intend to disclose any amendments to the Code and any waivers granted to our principal executive officer, principal financial officer or principal accounting officer or other persons to the extent required by applicable rules or regulations in the Investor Relations section of our Website, www.overstock.com. We will provide a copy of the Code to any person without any charge upon request in writing addressed to Overstock.com. Attn: Investor Relations, 799 West Coliseum Way, Midvale, UT 84047.
ITEM 11. EXECUTIVE COMPENSATION
The information required by this Item is incorporated by reference to our definitive proxy statement for the 2018 annual meeting of stockholders.
ITEM 12. SECURITY OWNERSHIP OF CERTAIN BENEFICIAL OWNERS AND MANAGEMENT AND RELATED STOCKHOLDER MATTERS
Except as set forth herein, the information required by this Item is incorporated by reference to our definitive proxy statement for the 2018 annual meeting of stockholders.
The following graph compares the total cumulative stockholder return, on our common stock with the total cumulative return of the NASDAQ Market Index—U.S. ("NASDAQ Market Index") and the Morningstar Specialty Retail Index ("Morningstar Group Index") during the period commencing on January 1, 2013 through December 31, 2017. The graph assumes a $100 investment at the beginning of the period in our common stock, the NASDAQ Market Index and the Morningstar Group Index, and the reinvestment of any dividends. Historic stock price performance is not necessarily indicative of future stock price performance.
93
COMPARISON OF YEAR CUMULATIVE TOTAL RETURN
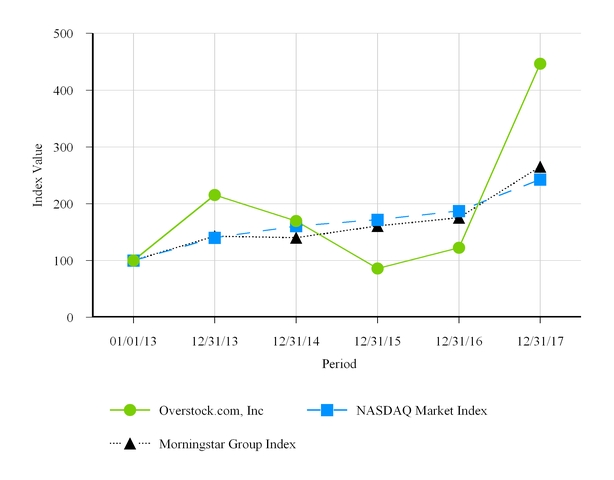
ITEM 13. CERTAIN RELATIONSHIPS AND RELATED TRANSACTIONS, AND DIRECTOR INDEPENDENCE
The information required by this Item is incorporated by reference to our definitive proxy statement for the 2018 annual meeting of stockholders.
ITEM 14. PRINCIPAL ACCOUNTING FEES AND SERVICES
The information required by this Item is incorporated by reference to our definitive proxy statement for the 2018 annual meeting of stockholders.
94
PART IV
ITEM 15. EXHIBITS, FINANCIAL STATEMENT SCHEDULES
1. Financial Statements
INDEX TO CONSOLIDATED FINANCIAL STATEMENTS
Report of Independent Registered Public Accounting Firm | |
Consolidated Balance Sheets | |
Consolidated Statements of Operations | |
Consolidated Statements of Comprehensive Income (Loss) | |
Consolidated Statements of Changes in Stockholders' Equity | |
Consolidated Statements of Cash Flows | |
Notes to Consolidated Financial Statements | |
Schedule II Valuation and Qualifying Accounts | |
2. Financial Statement Schedule
Schedule II Valuation and Qualifying Accounts listed in (1) above is included herein. Schedules other than those listed above have been omitted as they are either not required, not applicable, or the information has otherwise been shown in the consolidated financial statements or notes thereto.
3. Exhibits
Exhibits | ||
2.1 | ||
2.2 | ||
2.3 | ||
2.4 | ||
3.1 | ||
3.2 | ||
3.3 | ||
3.4 | ||
95
Exhibits | ||
4.1 | ||
4.2 | ||
4.3 | ||
4.4 | Form of Participating Affiliate Agreement (included in Exhibit 4.3) | |
4.5 | ||
4.6 | ||
4.7 | Certificate of Designation for Blockchain Voting Series A Preferred Stock (see Exhibit 3.3) | |
4.8 | Certificate of Designation for Voting Series B Preferred Stock (see Exhibit 3.4) | |
4.9 | Form of Warrant issued to Passport Special Opportunities Master Fund, L.P. dated November 8, 2017 (included in Exhibit 10.22) | |
4.10 | ||
4.11 | Form of Warrant issued to Quantum Partners LP dated November 8, 2017 (included in Exhibit 10.23) | |
4.12 | ||
10.1 | ||
10.2 | ||
10.3 | ||
10.4 | ||
10.5 | ||
10.6 | ||
96
Exhibits | ||
10.7 | ||
10.8 | ||
10.9 | ||
10.10 | ||
10.11 | ||
10.12 | ||
10.13 | ||
10.14 | ||
10.15 | ||
10.16 | ||
*10.16(a) | ||
10.17 | ||
10.18(a) | ||
10.19(a) | ||
10.20 | ||
10.21 | ||
10.22 | ||
10.23 | ||
97
Exhibits | ||
*10.24 | ||
*10.25 | ||
*21 | ||
*23 | ||
24 | Powers of Attorney (see signature page) | |
*31.1 | ||
*31.2 | ||
*32.1 | ||
*32.2 | ||
101 | Attached as Exhibit 101 to this report are the following documents formatted in XBRL (Extensible Business Reporting Language): (i) Consolidated Balance Sheets at December 31, 2017 and 2016; (ii) Consolidated Statements of Income for the years ended December 31, 2017, 2016, and 2015; (iii) Consolidated Statements of Comprehensive Income for the years ended December 31, 2017, 2016, and 2015; (iv) Consolidated Statements of Changes in Stockholder's Equity for the years ended December 31, 2017, 2016, and 2015; (v) Consolidated Statements of Cash Flows for the years ended December 31, 2017, 2016, and 2015; and (vi) Notes to Consolidated Financial Statements | |
___________________________________________
(a) | Management contract or compensatory plan or arrangement. |
* Filed herewith.
** Schedules have been omitted pursuant to Item 601(b)(2) of Regulation S-K. A copy of any omitted schedule will be furnished supplementally to the Securities and Exchange Commission upon request.
ITEM 16. FORM 10-K SUMMARY
Not applicable.
98
SIGNATURES
Pursuant to the requirements of Section 13 or 15(d) of the Securities Exchange Act of 1934, the registrant has duly caused this report to be signed on its behalf by the undersigned, thereunto duly authorized, on March 15, 2018.
OVERSTOCK.COM, INC. | ||||
By: | /s/ PATRICK M. BYRNE Patrick M. Byrne Chief Executive Officer (Principal Executive Officer) | |||
________________________________________________________________________________________________________________________
Pursuant to the requirements of the Securities Exchange Act of 1934, as amended, this report has been signed below by the following persons on behalf of the registrant and in the capacities and on the dates indicated.
POWER OF ATTORNEY
KNOW ALL PERSONS BY THESE PRESENTS, that each person whose signature appears below constitutes and appoints each of Patrick M. Byrne and Robert P. Hughes, his or her attorneys-in-fact, each with the power of substitution, for him or her in any and all capacities, to sign any amendments to this Annual Report on Form 10-K and to file the same, with exhibits thereto and other documents in connection therewith, with the Securities and Exchange Commission, hereby ratifying and conforming all that said attorney-in-fact, or his or their substitute or substitutes, may do or cause to be done by virtue hereof.
Signature | Title | Date | ||
/s/ PATRICK M. BYRNE Patrick M. Byrne | Chief Executive Officer and Director (Principal Executive Officer) | March 15, 2018 | ||
/s/ ALLISON H. ABRAHAM Allison H. Abraham | Chairwoman of the Board | March 15, 2018 | ||
/s/ ROBERT P. HUGHES Robert P. Hughes | Senior Vice President, Finance and Risk Management (Principal Financial Officer and Principal Accounting Officer) | March 15, 2018 | ||
/s/ SAUM NOURSALEHI Saum Noursalehi | President, Retail and Director | March 15, 2018 | ||
/s/ JONATHAN E. JOHNSON III Jonathan E. Johnson III | President, Medici Ventures and Director | March 15, 2018 | ||
/s/ BARCLAY F. CORBUS Barclay F. Corbus | Director | March 15, 2018 | ||
/s/ KIRTHI KALYANAM Kirthi Kalyanam | Director | March 15, 2018 | ||
/s/ JOSEPH J. TABACCO, JR. Joseph J. Tabacco, Jr. | Director | March 15, 2018 | ||
99
Report of Independent Registered Public Accounting Firm
To the Stockholders and Board of Directors
Overstock.com, Inc.:
Opinion on the Consolidated Financial Statements
We have audited the accompanying consolidated balance sheets of Overstock.com, Inc. and subsidiaries (the Company) as of December 31, 2017 and 2016, and the related consolidated statements of operations, comprehensive income (loss), changes in stockholders' equity, and cash flows for each of the years in the three-year period ended December 31, 2017, and the related notes and financial statement schedule II (collectively the consolidated financial statements). In our opinion, the consolidated financial statements present fairly, in all material respects, the financial position of the Company as of December 31, 2017 and 2016, and the results of its operations and its cash flows for each of the years in the three-year period ended December 31, 2017, in conformity with U.S generally accepted accounting principles.
We also have audited, in accordance with the standards of the Public Company Accounting Oversight Board (United States) (PCAOB), the Company's internal control over financial reporting as of December 31, 2017, based on criteria established in Internal Control—Integrated Framework (2013) issued by the Committee of Sponsoring Organizations of the Treadway Commission, and our report dated March 15, 2018 expressed an unqualified opinion on the effectiveness of the Company's internal control over financial reporting.
Basis for Opinion
These consolidated financial statements are the responsibility of the Company's management. Our responsibility is to express an opinion on these consolidated financial statements based on our audits. We are a public accounting firm registered with the PCAOB and are required to be independent with respect to the Company in accordance with the U.S. federal securities laws and the applicable rules and regulations of the Securities and Exchange Commission and the PCAOB.
We conducted our audits in accordance with the standards of the PCAOB. Those standards require that we plan and perform the audit to obtain reasonable assurance about whether the consolidated financial statements are free of material misstatement, whether due to error or fraud. Our audits included performing procedures to assess the risks of material misstatement of the consolidated financial statements, whether due to error or fraud, and performing procedures that respond to those risks. Such procedures included examining, on a test basis, evidence regarding the amounts and disclosures in the consolidated financial statements. Our audits also included evaluating the accounting principles used and significant estimates made by management, as well as evaluating the overall presentation of the consolidated financial statements. We believe that our audits provide a reasonable basis for our opinion.
We have served as the Company's auditor since 2009.
/s/ KPMG LLP
Salt Lake City, Utah
March 15, 2018
100
Overstock.com, Inc.
Consolidated Balance Sheets
(in thousands)
December 31, 2017 | December 31, 2016 | ||||||
Assets | |||||||
Current assets: | |||||||
Cash and cash equivalents | $ | 203,215 | $ | 183,098 | |||
Restricted cash | 455 | 430 | |||||
Accounts receivable, net | 30,080 | 28,142 | |||||
Inventories, net | 13,703 | 18,937 | |||||
Prepaid inventories, net | 1,625 | 2,112 | |||||
Prepaids and other current assets | 16,119 | 11,654 | |||||
Total current assets | 265,197 | 244,373 | |||||
Fixed assets, net | 129,343 | 134,552 | |||||
Precious metals | — | 9,946 | |||||
Deferred tax assets, net | — | 56,266 | |||||
Intangible assets, net | 7,337 | 10,913 | |||||
Goodwill | 14,698 | 14,698 | |||||
Other long-term assets, net | 17,240 | 14,328 | |||||
Total assets | $ | 433,815 | $ | 485,076 | |||
Liabilities and Stockholders' Equity | |||||||
Current liabilities: | |||||||
Accounts payable | $ | 85,406 | $ | 106,337 | |||
Accrued liabilities | 82,611 | 96,216 | |||||
Deferred revenue | 46,468 | 41,780 | |||||
Finance obligations, current | — | 3,256 | |||||
Other current liabilities, net | 178 | 1,627 | |||||
Total current liabilities | 214,663 | 249,216 | |||||
Long-term debt, net | — | 44,179 | |||||
Long-term debt, net - related party | 39,909 | — | |||||
Finance obligations, non-current | — | 11,831 | |||||
Other long-term liabilities | 7,120 | 6,890 | |||||
Total liabilities | 261,692 | 312,116 | |||||
Commitments and contingencies (Note 12) | |||||||
Stockholders' equity: | |||||||
Preferred stock, $0.0001 par value, authorized shares - 5,000 | |||||||
Series A, issued and outstanding - 127 and 127 | — | — | |||||
Series B, issued and outstanding - 555 and 569 | — | — | |||||
Common stock, $0.0001 par value | |||||||
Authorized shares - 100,000 | |||||||
Issued shares - 30,632 and 27,895 | |||||||
Outstanding shares - 27,497 and 25,432 | 3 | 3 | |||||
Additional paid-in capital | 494,732 | 383,348 | |||||
Accumulated deficit | (254,692 | ) | (153,898 | ) | |||
Accumulated other comprehensive loss | (599 | ) | (1,540 | ) | |||
Treasury stock: | |||||||
Shares at cost - 3,135 and 2,463 | (63,816 | ) | (52,587 | ) | |||
Equity attributable to stockholders of Overstock.com, Inc. | 175,628 | 175,326 | |||||
Equity attributable to noncontrolling interests | (3,505 | ) | (2,366 | ) | |||
Total stockholders' equity | 172,123 | 172,960 | |||||
Total liabilities and stockholders' equity | $ | 433,815 | $ | 485,076 | |||
See accompanying notes to consolidated financial statements.
101
Overstock.com, Inc.
Consolidated Statements of Operations
(in thousands, except per share data)
Year ended December 31, | |||||||||||
2017 | 2016 | 2015 | |||||||||
Revenue, net | |||||||||||
Direct | $ | 83,052 | $ | 101,578 | $ | 137,783 | |||||
Partner and other | 1,661,704 | 1,698,385 | 1,520,055 | ||||||||
Total net revenue | 1,744,756 | 1,799,963 | 1,657,838 | ||||||||
Cost of goods sold | |||||||||||
Direct(1) | 80,585 | 96,271 | 128,077 | ||||||||
Partner and other | 1,323,620 | 1,372,343 | 1,225,107 | ||||||||
Total cost of goods sold | 1,404,205 | 1,468,614 | 1,353,184 | ||||||||
Gross profit | 340,551 | 331,349 | 304,654 | ||||||||
Operating expenses: | |||||||||||
Sales and marketing(1) | 180,589 | 147,896 | 124,468 | ||||||||
Technology(1) | 115,878 | 106,760 | 98,533 | ||||||||
General and administrative(1) | 90,718 | 89,298 | 82,187 | ||||||||
Litigation settlement | — | (19,520 | ) | — | |||||||
Total operating expenses | 387,185 | 324,434 | 305,188 | ||||||||
Operating income (loss) | (46,634 | ) | 6,915 | (534 | ) | ||||||
Interest income | 659 | 326 | 155 | ||||||||
Interest expense | (2,937 | ) | (877 | ) | (140 | ) | |||||
Other income, net | 1,178 | 14,181 | 3,634 | ||||||||
Income (loss) before income taxes | (47,734 | ) | 20,545 | 3,115 | |||||||
Provision for income taxes | 64,188 | 9,297 | 1,895 | ||||||||
Consolidated net income (loss) | $ | (111,922 | ) | $ | 11,248 | $ | 1,220 | ||||
Less: Net loss attributable to noncontrolling interests | (2,044 | ) | (1,274 | ) | (1,226 | ) | |||||
Net income (loss) attributable to stockholders of Overstock.com, Inc. | $ | (109,878 | ) | $ | 12,522 | $ | 2,446 | ||||
Net income (loss) per common share—basic: | |||||||||||
Net income (loss) attributable to common shares—basic | $ | (4.28 | ) | $ | 0.49 | $ | 0.10 | ||||
Weighted average common shares outstanding—basic | 25,044 | 25,342 | 24,612 | ||||||||
Net income (loss) per common share—diluted: | |||||||||||
Net income (loss) attributable to common shares—diluted | $ | (4.28 | ) | $ | 0.49 | $ | 0.10 | ||||
Weighted average common shares outstanding—diluted | 25,044 | 25,426 | 24,703 | ||||||||
____________________________________________________________
(1) Includes stock-based compensation as follows (Note 15): | |||||||||||
Cost of goods sold — direct | $ | 183 | $ | 266 | $ | 179 | |||||
Sales and marketing | 415 | 249 | 217 | ||||||||
Technology | 649 | 777 | 646 | ||||||||
General and administrative | 2,830 | 3,599 | 2,484 | ||||||||
Total | $ | 4,077 | $ | 4,891 | $ | 3,526 | |||||
See accompanying notes to consolidated financial statements.
102
Overstock.com, Inc.
Consolidated Statements of Comprehensive Income (Loss)
(in thousands)
Year ended December 31, | |||||||||||
2017 | 2016 | 2015 | |||||||||
Consolidated net income (loss) | $ | (111,922 | ) | $ | 11,248 | $ | 1,220 | ||||
Other comprehensive income (loss): | |||||||||||
Unrealized gain (loss) on cash flow hedges, net of benefit (expense) for taxes of $(689), $(211), and $513 | 941 | (110 | ) | (809 | ) | ||||||
Other comprehensive income (loss) | 941 | (110 | ) | (809 | ) | ||||||
Comprehensive income (loss) | $ | (110,981 | ) | $ | 11,138 | $ | 411 | ||||
Less: Comprehensive loss attributable to noncontrolling interests | (2,044 | ) | (1,274 | ) | (1,226 | ) | |||||
Comprehensive income (loss) attributable to stockholders of Overstock.com, Inc. | $ | (108,937 | ) | $ | 12,412 | $ | 1,637 | ||||
See accompanying notes to consolidated financial statements.
103
Overstock.com, Inc.
Consolidated Statements of Changes in Stockholders' Equity
(in thousands, except per share data)
Year ended December 31, | |||||||||||
2017 | 2016 | 2015 | |||||||||
Equity attributable to stockholders of Overstock.com, Inc. | |||||||||||
Number of common shares issued | |||||||||||
Balance at beginning of year | 27,895 | 27,634 | 27,241 | ||||||||
Common stock issued upon vesting of restricted stock | 212 | 219 | 377 | ||||||||
Exercise of stock options | 39 | 42 | 16 | ||||||||
Exercise of stock warrants | 2,472 | — | — | ||||||||
Other | 14 | — | — | ||||||||
Balance at end of year | 30,632 | 27,895 | 27,634 | ||||||||
Number of treasury stock shares | |||||||||||
Balance at beginning of year | 2,463 | 2,400 | 3,204 | ||||||||
Issuance of treasury stock | — | — | (908 | ) | |||||||
Purchases of treasury stock | 672 | 63 | 104 | ||||||||
Balance at end of year | 3,135 | 2,463 | 2,400 | ||||||||
Total number of outstanding shares | 27,497 | 25,432 | 25,234 | ||||||||
Common stock | $ | 3 | $ | 3 | $ | 3 | |||||
Number of Series A preferred shares issued and outstanding | |||||||||||
Balance at beginning of year | 127 | — | — | ||||||||
Rights offering | — | 127 | — | ||||||||
Balance at end of year | 127 | 127 | — | ||||||||
Number of Series B preferred shares issued and outstanding | |||||||||||
Balance at beginning of year | 569 | — | — | ||||||||
Rights offering | — | 569 | — | ||||||||
Other | (14 | ) | — | — | |||||||
Balance at end of year | 555 | 569 | — | ||||||||
Preferred stock | $ | — | $ | — | $ | — | |||||
Additional paid-in capital | |||||||||||
Balance at beginning of year | $ | 383,348 | $ | 370,047 | $ | 366,252 | |||||
Stock-based compensation to employees and directors | 4,077 | 4,891 | 3,526 | ||||||||
Exercise of stock options | 664 | 819 | 269 | ||||||||
Exercise of stock warrants | 100,000 | — | — | ||||||||
Issuance of stock warrants | 6,462 | — | — | ||||||||
Rights offering | — | 7,591 | — | ||||||||
Other | 181 | — | — | ||||||||
Balance at end of year | $ | 494,732 | $ | 383,348 | $ | 370,047 | |||||
Accumulated deficit | |||||||||||
Balance at beginning of year | $ | (153,898 | ) | $ | (166,420 | ) | $ | (153,864 | ) | ||
Cumulative effect of change in accounting principle | 9,374 | — | — | ||||||||
Net income (loss) attributable to stockholders of Overstock.com, Inc. | (109,878 | ) | 12,522 | 2,446 | |||||||
Deficiency in cost of treasury stock issued | — | — | (15,002 | ) | |||||||
Declaration of preferred dividends | (109 | ) | — | — | |||||||
Other | (181 | ) | — | — | |||||||
Balance at end of year | $ | (254,692 | ) | $ | (153,898 | ) | $ | (166,420 | ) | ||
Accumulated other comprehensive loss | |||||||||||
Balance at beginning of year | $ | (1,540 | ) | $ | (1,430 | ) | $ | (621 | ) | ||
Net other comprehensive income (loss) | 941 | (110 | ) | (809 | ) | ||||||
Balance at end of year | $ | (599 | ) | $ | (1,540 | ) | $ | (1,430 | ) | ||
Treasury stock | |||||||||||
Balance at beginning of year | $ | (52,587 | ) | $ | (51,747 | ) | $ | (82,531 | ) | ||
Issuance of treasury stock | — | — | 33,151 | ||||||||
Purchases of treasury stock | (11,229 | ) | (840 | ) | (2,367 | ) | |||||
Balance at end of year | (63,816 | ) | (52,587 | ) | (51,747 | ) | |||||
Total equity attributable to stockholders of Overstock.com, Inc. | $ | 175,628 | $ | 175,326 | $ | 150,453 | |||||
Equity attributable to noncontrolling interests | |||||||||||
Balance at beginning of year | $ | (2,366 | ) | $ | (1,092 | ) | $ | (18 | ) | ||
Net loss attributable to noncontrolling interests | (2,044 | ) | (1,274 | ) | (1,226 | ) | |||||
Paid-in capital attributable to noncontrolling interests | 905 | — | 152 | ||||||||
Total equity attributable to noncontrolling interests | $ | (3,505 | ) | $ | (2,366 | ) | $ | (1,092 | ) | ||
Total stockholders' equity | $ | 172,123 | $ | 172,960 | $ | 149,361 | |||||
See accompanying notes to consolidated financial statements.
104
Overstock.com, Inc.
Consolidated Statements of Cash Flows
(in thousands)
Year ended December 31, | |||||||||||
2017 | 2016 | 2015 | |||||||||
Cash flows from operating activities: | |||||||||||
Consolidated net income (loss) | $ | (111,922 | ) | $ | 11,248 | $ | 1,220 | ||||
Adjustments to reconcile net income (loss) to net cash provided by (used in) operating activities: | |||||||||||
Depreciation of fixed assets | 28,848 | 27,283 | 23,516 | ||||||||
Amortization of intangible assets | 3,999 | 3,968 | 1,581 | ||||||||
Stock-based compensation to employees and directors | 4,077 | 4,891 | 3,526 | ||||||||
Deferred income taxes, net | 65,199 | 7,719 | 1,483 | ||||||||
(Gain) loss on investment in precious metals | (1,971 | ) | (201 | ) | 1,183 | ||||||
Gain on sale of cryptocurrencies | (1,995 | ) | — | — | |||||||
Impairment of cost method investments | 5,487 | 2,850 | — | ||||||||
Ineffective portion of loss on cash flow hedge | — | — | 124 | ||||||||
Early extinguishment costs of long term debts | 2,464 | — | — | ||||||||
Termination costs of cryptobond financing | — | — | 850 | ||||||||
Other | 876 | 356 | 182 | ||||||||
Changes in operating assets and liabilities, net of acquisitions: | |||||||||||
Restricted cash | (100 | ) | — | — | |||||||
Accounts receivable, net | (1,938 | ) | (10,006 | ) | 3,463 | ||||||
Inventories, net | 5,234 | 1,105 | 6,166 | ||||||||
Prepaid inventories, net | 487 | (801 | ) | 1,903 | |||||||
Prepaids and other current assets | (3,286 | ) | 2,389 | (1,338 | ) | ||||||
Other long-term assets, net | (2,307 | ) | (786 | ) | 66 | ||||||
Accounts payable | (20,995 | ) | (18,823 | ) | 10,482 | ||||||
Accrued liabilities | (12,311 | ) | 16,936 | (4,153 | ) | ||||||
Deferred revenue | 4,688 | (9,164 | ) | 2,493 | |||||||
Other long-term liabilities | 145 | 600 | 1,769 | ||||||||
Net cash provided by (used in) operating activities | (35,321 | ) | 39,564 | 54,516 | |||||||
Cash flows from investing activities: | |||||||||||
Proceeds from sale of precious metals | 11,917 | 1,610 | — | ||||||||
Investment in precious metals | — | (1,633 | ) | — | |||||||
Equity method investments | (3,000 | ) | — | (152 | ) | ||||||
Disbursements for note receivable | (750 | ) | (3,668 | ) | (5,000 | ) | |||||
Cost method investments | (2,188 | ) | (4,750 | ) | (7,000 | ) | |||||
Acquisitions of businesses, net of cash acquired | — | 1,248 | (10,601 | ) | |||||||
Expenditures for fixed assets, including internal-use software and website development | (23,586 | ) | (72,281 | ) | (59,513 | ) | |||||
Other | (353 | ) | 27 | (165 | ) | ||||||
Net cash used in investing activities | (17,960 | ) | (79,447 | ) | (82,431 | ) | |||||
Cash flows from financing activities: | |||||||||||
Payments on capital lease obligations | (83 | ) | — | (362 | ) | ||||||
Paydown on direct financing arrangement | — | (54 | ) | (308 | ) | ||||||
Payments on finance obligations | (15,316 | ) | (1,906 | ) | (104 | ) | |||||
Payments on interest swap | (1,535 | ) | (563 | ) | (57 | ) | |||||
Proceeds from finance obligations | — | 11,399 | 5,698 | ||||||||
Proceeds from short-term debt | — | — | 5,500 | ||||||||
Payments on short-term debt | — | — | (750 | ) | |||||||
Payments on long-term debt | (45,766 | ) | — | — | |||||||
Proceeds from long-term debt | 40,000 | 36,273 | 9,488 | ||||||||
Payments of preferred dividends | (109 | ) | — | — | |||||||
Change in restricted cash | 75 | — | 150 | ||||||||
Proceeds from issuance of stock warrants | 6,462 | — | — | ||||||||
Proceeds from exercise of stock options | 664 | 819 | 269 | ||||||||
Proceeds from rights offering, net of offering costs | — | 7,591 | — | ||||||||
Proceeds from exercise of stock warrants | 100,000 | — | — | ||||||||
Proceeds from security token offering | 905 | — | — | ||||||||
Purchase of treasury stock | (11,229 | ) | (840 | ) | (2,367 | ) | |||||
Payment of debt issuance costs | (670 | ) | — | (621 | ) | ||||||
Net cash provided by financing activities | 73,398 | 52,719 | 16,536 | ||||||||
Net increase (decrease) in cash and cash equivalents | 20,117 | 12,836 | (11,379 | ) | |||||||
Cash and cash equivalents, beginning of year | 183,098 | 170,262 | 181,641 | ||||||||
Cash and cash equivalents, end of year | $ | 203,215 | $ | 183,098 | $ | 170,262 | |||||
Continued on the following page
Overstock.com, Inc.
Consolidated Statements of Cash Flows
(Continued)
(in thousands)
Year ended December 31, | |||||||||||
2017 | 2016 | 2015 | |||||||||
Supplemental disclosures of cash flow information: | |||||||||||
Cash paid during the period: | |||||||||||
Interest paid | $ | 2,940 | $ | 1,269 | $ | 224 | |||||
Taxes paid | 487 | 1,338 | 273 | ||||||||
Non-cash investing and financing activities: | |||||||||||
Fixed assets, including internal-use software and website development, costs financed through accounts payable and accrued liabilities | $ | 989 | $ | 2,219 | $ | 6,290 | |||||
Equipment acquired under capital lease obligations | 1,421 | — | 362 | ||||||||
Capitalized interest cost | — | 105 | 157 | ||||||||
Acquisition of businesses through stock issuance | — | — | 18,149 | ||||||||
Change in value of cash flow hedge | (1,738 | ) | (659 | ) | 1,265 | ||||||
Note receivable converted to cost method investment | 1,368 | 2,850 | — | ||||||||
See accompanying notes to consolidated financial statements.
105
Overstock.com, Inc.
Notes to Consolidated Financial Statements
1. BASIS OF PRESENTATION
Business and organization
As used herein, "Overstock," "Overstock.com," "O.co," "we," "our" and similar terms include Overstock.com, Inc. and our majority-owned subsidiaries, unless the context indicates otherwise. We were formed on May 5, 1997 as D2-Discounts Direct, a limited liability company. On December 30, 1998, we were reorganized as a C Corporation in the State of Utah and reincorporated in Delaware in May 2002. On October 25, 1999, we changed our name to Overstock.com, Inc.
We are an online retailer and advancer of blockchain technology. Through our online retail business, we offer a broad range of price-competitive products, including furniture, home decor, bedding and bath, housewares, jewelry and watches, among other products. We sell our products and services through our Internet websites located at www.overstock.com, www.o.co and www.o.biz (referred to collectively as the "Website"). Although our three websites are located at different domain addresses, the technology and equipment and processes supporting the Website and the process of order fulfillment described herein are the same for all three websites.
In late 2014, we began working on initiatives to develop and advance blockchain technology, which we refer to collectively as Medici. As part of our Medici initiatives, we have formed a wholly-owned subsidiary Medici Ventures, Inc. ("Medici Ventures") and acquired a majority interest in a financial technology company and two related registered broker dealers which we have rolled into our majority-owned subsidiary tØ.com, Inc. ("tZERO"). Medici Ventures has also purchased minority interests in several blockchain technology companies. In 2015, we were the first public company to issue a private security using blockchain technology and in December 2016, as a demonstration of our technology, we issued publicly traded blockchain preferred shares of Overstock.com, Inc.
We have engaged Guggenheim Securities, LLC to help us identify and evaluate certain strategic initiatives. We are considering a range of potential transactions, including a sale of our e-commerce business and additional equity or debt financings. Our Board continually discusses a variety of potential strategic and financial options and other changes to our business, but has not made any determination to undertake any strategic transaction, and may not do so in the foreseeable future or at all.
Basis of presentation
We have prepared the accompanying consolidated financial statements pursuant to generally accepted accounting principles in the United States ("GAAP"). Preparing financial statements requires us to make estimates and assumptions that affect the amounts that are reported in the consolidated financial statements and accompanying disclosures. Although these estimates are based on our best knowledge of current events and actions that we may undertake in the future, our actual results may be different from our estimates. The results of operations presented herein are not necessarily indicative of our results for any future period.
For purposes of comparability, we reclassified certain immaterial amounts in the prior periods presented to conform with the current year presentation. We also retrospectively applied certain accounting standard updates as discussed in Note 2—Accounting Policies, Recently adopted accounting standards.
2. ACCOUNTING POLICIES
Principles of consolidation
The accompanying consolidated financial statements include our accounts and the accounts of our wholly-owned and majority-owned subsidiaries. All intercompany account balances and transactions have been eliminated in consolidation.
Use of estimates
The preparation of financial statements in conformity with generally accepted accounting principles requires estimates and assumptions that affect the reported amounts of assets and liabilities, revenues and expenses, and related disclosures of
106
contingent liabilities in the consolidated financial statements and accompanying notes. Estimates are used for, but not limited to, investment valuation, receivables valuation, valuation of derivative financial instruments, revenue recognition, sales returns, incentive discount offers, inventory valuation, depreciable lives of fixed assets and internally-developed software, goodwill valuation, intangible asset valuation, cost method and equity method investment valuation, income taxes, stock-based compensation, performance-based compensation, self-funded health insurance liabilities and contingencies. Actual results could differ materially from these estimates.
Cash equivalents
We classify all highly liquid instruments, including instruments with a remaining maturity of three months or less at the time of purchase, as cash equivalents. Cash equivalents were $25.5 million and $75.2 million at December 31, 2017 and 2016, respectively.
Restricted cash
We consider cash that is legally restricted and cash that is held as compensating balances for letter of credit arrangements and self-funded health insurance as restricted cash.
Fair value of financial instruments
We account for our assets and liabilities using a hierarchy of valuation techniques based on whether the inputs to those valuation techniques are observable or unobservable. Observable inputs reflect market data obtained from independent sources, while unobservable inputs reflect our market assumptions. These two types of inputs have created the fair-value hierarchy below. This hierarchy requires us to minimize the use of unobservable inputs and to use observable market data, if available, when determining fair value.
• | Level 1—Quoted prices for identical instruments in active markets; |
• | Level 2—Quoted prices for similar instruments in active markets, quoted prices for identical or similar instruments in markets that are not active, and model-derived valuations in which all significant inputs and significant value drivers are observable in active markets; and |
• | Level 3—Valuations derived from valuation techniques in which one or more significant inputs or significant value drivers are unobservable. |
Under GAAP, certain assets and liabilities are required to be recorded at fair value on a recurring basis. Our assets and liabilities that are adjusted to fair value on a recurring basis are investments in money market mutual funds, trading securities, derivative instruments, and deferred compensation liabilities.
The fair values of our investments in money market mutual funds, trading securities, and deferred compensation liabilities are determined using quoted market prices from daily exchange traded markets on the closing price as of the balance sheet date and are classified as Level 1.
The fair values of our derivative instruments are determined using standard valuation models. The significant inputs used in these models are readily available in public markets, or can be derived from observable market transactions, and therefore have been classified as Level 2. Inputs used in these standard valuation models for derivative instruments include the applicable forward rates, interest rates and discount rates. Included in the fair value of derivative instruments is an adjustment for nonperformance risk. The adjustment for nonperformance risk did not have a significant impact on the estimated fair value of our derivative instruments. For additional disclosures related to our derivative instruments, see Derivative financial instruments below.
The following tables summarize our assets and liabilities measured at fair value on a recurring basis using the following levels of inputs as of December 31, 2017 and 2016, as indicated (in thousands):
107
Fair Value Measurements at December 31, 2017: | |||||||||||||||
Total | Level 1 | Level 2 | Level 3 | ||||||||||||
Assets: | |||||||||||||||
Cash equivalents - Money market mutual funds | $ | 25,455 | $ | 25,455 | $ | — | $ | — | |||||||
Trading securities held in a "rabbi trust" (1) | 74 | 74 | — | — | |||||||||||
Total assets | $ | 25,529 | $ | 25,529 | $ | — | $ | — | |||||||
Liabilities: | |||||||||||||||
Deferred compensation accrual "rabbi trust" (3) | $ | 92 | $ | 92 | $ | — | $ | — | |||||||
Total liabilities | $ | 92 | $ | 92 | $ | — | $ | — | |||||||
Fair Value Measurements at December 31, 2016: | |||||||||||||||
Total | Level 1 | Level 2 | Level 3 | ||||||||||||
Assets: | |||||||||||||||
Cash equivalents - Money market mutual funds | $ | 75,177 | $ | 75,177 | $ | — | $ | — | |||||||
Trading securities held in a "rabbi trust" (1) | 58 | 58 | — | — | |||||||||||
Total assets | $ | 75,235 | $ | 75,235 | $ | — | $ | — | |||||||
Liabilities: | |||||||||||||||
Derivatives (2) | $ | 1,816 | $ | — | $ | 1,816 | $ | — | |||||||
Deferred compensation accrual "rabbi trust" (3) | 61 | 61 | — | — | |||||||||||
Total liabilities | $ | 1,877 | $ | 61 | $ | 1,816 | $ | — | |||||||
___________________________________________
(1) | — Trading securities held in a rabbi trust are included in Prepaids and other current assets and Other long-term assets, net in the consolidated balance sheets. |
(2) | — Derivative financial instruments were included in Other current liabilities, net and Other long-term liabilities in the consolidated balance sheets. |
(3) | — Non-qualified deferred compensation in a rabbi trust is included in Accrued liabilities and Other long-term liabilities in the consolidated balance sheets. |
Our other financial instruments, including cash, restricted cash, accounts receivable, accounts payable, accrued liabilities, finance obligations and debt are carried at cost, which approximates their fair value.
Accounts receivable
Accounts receivable consist primarily of trade amounts due from customers in the United States and from uncleared credit card transactions at period end. Accounts receivable are recorded at invoiced amounts and do not bear interest.
Allowance for doubtful accounts
From time to time, we grant credit to some of our business customers on normal credit terms (typically 30 days). We maintain an allowance for doubtful accounts receivable based upon our business customers' financial condition and payment history, and our historical collection experience and expected collectability of accounts receivable. The allowance for doubtful accounts receivable was $1.3 million and $2.0 million at December 31, 2017 and 2016, respectively.
Concentration of credit risk
At December 31, 2017 and 2016, two banks held the majority of our cash and cash equivalents. We do not believe that, as a result of this concentration, we are subject to any unusual financial risk beyond the normal risk associated with commercial banking relationships.
Financial instruments that potentially subject us to significant concentrations of credit risk consist primarily of cash equivalents and receivables. We invest our cash primarily in money market securities which are uninsured.
Inventories, net
108
Inventories, net include merchandise purchased for resale which are accounted for using a standard costing system which approximates the first-in-first-out ("FIFO") method of accounting and are valued at the lower of cost and net realizable value. We write down our inventory for damage or estimated obsolescence and to lower of cost and net realizable value based upon assumptions about future demand, market conditions, and fulfillment costs. If actual market conditions are less favorable than those projected by management, additional inventory write-downs may be required. Once established, the original cost of the inventory less the related inventory allowance represents the new cost basis of such products. Reversal of the allowance is recognized only when the related inventory has been sold or scrapped.
Prepaid inventories, net
Prepaid inventories, net represent inventories paid for in advance of receipt.
Prepaids and other current assets
Prepaids and other current assets represent expenses paid prior to receipt of the related goods or services, including advertising, license fees, maintenance, packaging, insurance, and other miscellaneous costs.
Fixed assets, net
Fixed assets, net include assets such as our corporate headquarters, land improvements, building machinery and equipment, furniture and equipment, technology infrastructure, internal-use software, website development and leasehold improvements which are recorded at cost and depreciated using the straight-line method over the estimated useful lives of the related assets or the term of the related capital lease, whichever is shorter, as follows:
Life (years) | |
Building | 40 |
Land improvements | 20 |
Building machinery and equipment | 15-20 |
Furniture and equipment | 5-7 |
Computer hardware | 3-4 |
Computer software | 2-4 |
Leasehold improvements are amortized over the shorter of the term of the related leases or estimated useful lives.
Included in fixed assets is the capitalized cost of internal-use software and website development, including software used to upgrade and enhance our Website and processes supporting our business. We capitalize costs incurred during the application development stage of internal-use software and amortize these costs over the estimated useful life of two to three years. Costs incurred related to design or maintenance of internal-use software are expensed as incurred.
During the years ended December 31, 2017, 2016, and 2015, we capitalized $9.6 million, $15.9 million, and $18.1 million, respectively, of costs associated with internal-use software and website development, both developed internally and acquired externally. Depreciation of internal-use software and website development for the years ended December 31, 2017, 2016, and 2015 was $15.9 million, $17.1 million, and $14.4 million, respectively.
Depreciation expense is classified within the corresponding operating expense categories in the consolidated statements of operations as follows (in thousands):
Year ended December 31, | |||||||||||
2017 | 2016 | 2015 | |||||||||
Cost of goods sold - direct | $ | 307 | $ | 310 | $ | 283 | |||||
Technology | 24,604 | 25,693 | 22,126 | ||||||||
Sales and marketing | — | 124 | — | ||||||||
General and administrative | 3,937 | 1,156 | 1,107 | ||||||||
Total depreciation, including internal-use software and website development | $ | 28,848 | $ | 27,283 | $ | 23,516 | |||||
109
Upon sale or retirement of assets, cost and related accumulated depreciation and amortization are removed from the balance sheet and the resulting gain or loss is reflected in the consolidated statements of operations.
Cost method investments
At December 31, 2017, we held minority interests (less than 20%) in seven privately held entities, which include PeerNova, Factom, Ripio, SettleMint, IdentityMind, Symbiont, and View. Our interest in these entities are recognized as cost method investments included in Other long-term assets, net in our consolidated balance sheets. Earnings from these cost method investments are recognized to the extent of dividends received, and we recognize subsequent impairments to the investment if they are other-than-temporary. We review our cost method investments individually for impairment by evaluating if events or circumstances have occurred that may have a significant adverse effect on their fair value. If such events or circumstances have occurred, we estimate the fair value of the investment and determine if any decline in the fair value of the investment below its carrying value is other-than-temporary. In such cases, the estimated fair value of the investment is determined using unobservable inputs including assumptions by the investee's management including quantitative information such as lower valuations in recently completed or proposed financings. These inputs are classified as Level 3. See Fair value of financial instruments above. Because several of our investees are in the early startup or development stages, these entities are subject to potential changes in cash flows, valuation, and inability to attract new investors which may be necessary for the liquidity needed to support their operations.
The carrying amount of our cost method investments was approximately $6.5 million and $11.8 million at December 31, 2017 and 2016, respectively. We recognized $5.5 million, $2.9 million and $0 impairment loss on these investments during the years ended December 31, 2017, 2016 and 2015, respectively. These impairment losses were recorded in Other income, net in the consolidated statements of operations.
Equity method investments
At December 31, 2017, we held minority interests in three privately held entities, which include Bitt, Spera and Voatz. We can exercise significant influence, but not control, over the investees. Based on the nature of one of our investments, we have a variable interest. However, because we do not have power to direct the investee's activities and we are not the investee's primary beneficiary, we therefore do not consolidate the investee in our financial statements.
Our interests in these entities are recognized as equity method investments included in Other long-term assets, net in our consolidated balance sheets. We initially accounted for our interest in Bitt as a cost method investment. During the year ended December 31, 2017, we acquired additional representation on the Board of Directors of Bitt, which gave us an ability to exercise significant influence but not control over the investee.
The carrying value of our equity method investments exceeded the amount of underlying equity in net assets of the investees and the difference was primarily related to goodwill and the fair value of intangible assets. The difference related to intangible assets is amortized over their estimated useful lives. We record our proportionate share of the net income or loss of the investee in Other income, net in the consolidated statements of operations with corresponding adjustments to the carrying value of the investment.
At December 31, 2017, the carrying amount of our equity method investments was approximately $6.5 million, and the difference between the carrying value and the amount of underlying equity in net assets of each investee was not significant. Our proportionate share of the net income or loss of our equity method investees for the year ended December 31, 2017 was not significant. We held no equity method investments during the years ended December 31, 2016 and 2015.
Noncontrolling interests
tZERO is a majority-owned subsidiary of Overstock, which develops blockchain and fintech technology as part of our Medici blockchain and fintech technology initiatives. During 2016, tZERO completed the acquisition of a financial technology firm and two registered broker dealers, each of which was under common control with the firm from which the financial technology assets were purchased. The former owners of that firm hold noncontrolling interests in tZERO. These transactions are described further in Note 3—Acquisitions, Goodwill, and Acquired Intangible Assets. The proceeds for the acquisitions were financed by tZERO through a note payable to Overstock that bears interest at a rate that approximates the Federal Funds Rate. tZERO is included in our consolidated financial statements. Intercompany transactions have been eliminated and the amounts of contributions and gains or losses that are attributable to the noncontrolling interests are disclosed in our consolidated financial statements.
110
On December 18, 2017, tZERO launched an offering (the "security token offering") of the right to acquire, if issued by us in the future, tZERO Preferred Equity Tokens (the "tZERO Security Token") through a Simple Agreement for Future Equity ("SAFE"). The security token offering is expected to run through May 14, 2018 but may be extended or shortened. At December 31, 2017, the SAFE qualified as an equity classified financial instrument issued by tZERO. At December 31, 2017, proceeds from the security token offering totaling $905,000 were classified as a component of noncontrolling interest within our consolidated financial statements.
Leases
We account for lease agreements as either operating or capital leases depending on certain defined criteria. In certain of our lease agreements, we receive rent holidays and other incentives. We recognize lease costs on a straight-line basis without regard to deferred payment terms, such as rent holidays, that defer the commencement date of required payments. Additionally, tenant improvement allowances are amortized as a reduction in rent expense over the term of the lease. Leasehold improvements are capitalized at cost and amortized over the lesser of their expected useful life or the life of the lease, without assuming renewal features, if any, are exercised.
Treasury stock
We account for treasury stock under the cost method and include treasury stock as a component of stockholders' equity.
Precious metals
We historically held precious metals consisting of gold and silver, which we fully sold during the year ended December 31, 2017. We stored our precious metals at an off-site secure facility. Because these assets consisted of actual precious metals, rather than financial instruments, we accounted for them as an investment initially recorded at cost (including transaction fees) and then adjusted to the lower of cost or market based on an average unit cost. On an interim basis, we recognized decreases in the value of these assets caused by market declines. Subsequent increases in the value of these assets through market price recoveries during the same fiscal year were recognized in the later interim period, but would not exceed the total previously recognized decreases in value during the same year. Such unrealized gains or losses resulting from changes in the value of these assets were recorded in Other income, net in our consolidated statements of operations. There were no unrealized gains or losses on precious metals during the years ended December 31, 2017 and 2016. Unrealized losses on precious metals were $1.2 million during the year ended December 31, 2015.
Gains and losses realized upon sale of precious metals are also recorded in Other income, net in our consolidated statements of operations. Realized gains on sales of precious metals were $2.0 million and $201,000, and $0 for the years ended December 31, 2017, 2016 and 2015.
Goodwill
Goodwill represents the excess of the purchase price paid over the fair value of the net assets acquired in business combinations. Goodwill is not amortized but is tested for impairment at least annually. When evaluating whether goodwill is impaired, we make a qualitative assessment to determine if it is more likely than not that the fair value of a reporting unit is less than its carrying amount. If the qualitative assessment determines that it is more likely than not that its fair value is less than its carrying amount, we compare the fair value of the reporting unit to which the goodwill is assigned to its carrying amount. If the carrying amount exceeds its fair value, then the amount of the impairment loss must be measured. The impairment loss, if any, is calculated by comparing the implied fair value of the goodwill to its carrying amount. In calculating the implied fair value of goodwill, the fair value of the reporting unit is allocated to the other assets and liabilities within the reporting unit based on estimated fair value. The excess of the fair value of a reporting unit over the amount allocated to its other assets and liabilities is the implied fair value of goodwill. An impairment loss is recognized when the carrying amount of goodwill exceeds its implied fair value.
We test for impairment of goodwill annually or when we deem that a triggering event has occurred. There were no impairments to goodwill recorded during the years ended December 31, 2017, 2016 and 2015.
Intangible assets other than goodwill
We capitalize and amortize intangible assets other than goodwill over their estimated useful lives unless such lives are indefinite. Intangible assets other than goodwill acquired separately from third-parties are capitalized at cost while such assets
111
acquired as part of a business combination are capitalized at their acquisition-date fair value. Intangible assets other than goodwill are amortized using the straight-line method of amortization over their useful lives, with the exception of certain intangibles (such as acquired technology, customer relationships, and trade names) which are amortized using an accelerated method of amortization based on cash flows. These assets are reviewed for impairment whenever events or changes in circumstances indicate that their carrying amount may not be recoverable as described below under Impairment of long-lived assets.
Intangible assets, net consist of the following (in thousands):
December 31, | |||||||
2017 | 2016 | ||||||
Acquired intangible assets | $ | 16,000 | $ | 16,000 | |||
Intangible assets, other (1) | 1,779 | 1,356 | |||||
17,779 | 17,356 | ||||||
Less: accumulated amortization of intangible assets | (10,442 | ) | (6,443 | ) | |||
Total intangible assets, net | $ | 7,337 | $ | 10,913 | |||
___________________________________________
(1) — At December 31, 2017, the weighted average remaining useful life for intangible assets, other, excluding fully amortized intangible assets, was 2.72 years.
Amortization of intangible assets other than goodwill is classified within the corresponding operating expense categories in the consolidated statements of operations as follows (in thousands):
Year ended December 31, | |||||||||||
2017 | 2016 | 2015 | |||||||||
Technology | $ | 3,620 | $ | 2,904 | $ | 605 | |||||
Sales and marketing | 83 | 1,008 | 531 | ||||||||
General and administrative | 296 | 56 | 445 | ||||||||
Total amortization | $ | 3,999 | $ | 3,968 | $ | 1,581 | |||||
Estimated amortization expense for the next five years is: $3.0 million in 2018, $2.1 million in 2019, $1.3 million in 2020, $915,000 in 2021, $20,000 in 2022 and $29,000 thereafter.
Impairment of long-lived assets
We review property and equipment and other long-lived assets, including intangible assets other than goodwill, for impairment whenever events or changes in circumstances indicate that the carrying amount of an asset group may not be recoverable. Recoverability is measured by comparison of the assets' carrying amount to future undiscounted net cash flows the asset group is expected to generate. Cash flow forecasts are based on trends of historical performance and management's estimate of future performance, giving consideration to existing and anticipated competitive and economic conditions. If such asset group is considered to be impaired, the impairment to be recognized is measured by the amount by which the carrying amount of the assets exceeds their fair values. There were no impairments to long-lived assets recorded during the years ended December 31, 2017, 2016 and 2015.
Cryptocurrencies
We hold cryptocurrency-denominated assets ("cryptocurrencies") such as bitcoin and we include them in Prepaids and other current assets in our consolidated balance sheets. Our cryptocurrencies were $1.5 million and $307,000 at December 31, 2017 and 2016, respectively, and are recorded at the lower of cost or market based on an average unit cost.
On an interim basis, we recognize decreases in the value of these assets caused by market declines. Subsequent increases in the value of these assets through market price recoveries during the same fiscal year are recognized in the later interim period, but may not exceed the total previously recognized decreases in value during the same year. Such unrealized gains or losses resulting from changes in the value of our cryptocurrencies are recorded in Other income, net in our consolidated statements of operations. There were no significant unrealized gains or losses on cryptocurrencies for the years ended December 31, 2017, 2016 and 2015.
112
Gains and losses realized upon sale of cryptocurrencies are also recorded in Other income, net in our consolidated statements of operations. We occasionally use our cryptocurrencies to purchase other cryptocurrencies. Gains and losses realized with these non-cash transactions are also recorded in Other income, net in our consolidated statements of operations and are also presented as an adjustment to reconcile net income (loss) to net cash provided by (used in) operating activities in our consolidated statement of cash flows. Realized gains on sale of cryptocurrencies were $4.8 million (including $2.0 million of non-cash gains) during the year ended December 31, 2017. There were no realized gains or losses on sale of cryptocurrencies during the years ended December 31, 2016 and 2015.
Other long-term assets, net
Other long-term assets, net consist primarily of cost method investments, related convertible notes, equity method investments, and long-term prepaid expenses. See Cost method investments and Equity method investments above.
Derivative financial instruments
In 2014, we entered into a loan agreement in connection with the construction of our new corporate headquarters. We began borrowing under the facility in October 2015. Because amounts borrowed on the loan carried a variable LIBOR-based interest rate, we were affected by changes in certain market conditions. These changes in market conditions could adversely impact our financial performance, and as such, we used derivatives as a risk management tool to mitigate the potential impact of these changes. We did not enter into derivatives for speculative or trading purposes. The primary market risk we managed through the use of derivative instruments was interest rate risk on the amounts we had borrowed under the loan agreement relating to our new headquarters. To manage that risk, we used interest rate swap agreements. An interest rate swap agreement is a contract between two parties to exchange cash flows based on underlying notional amounts and indices. Our interest rate swaps entitled us to pay amounts based on a fixed rate in exchange for receipt of amounts based on variable rates over the term of the related loan agreement.
Our derivatives are carried at fair value in our consolidated balance sheets in Other current liabilities, net and Other long-term liabilities on a gross basis. The accounting for gains and losses that result from changes in the fair values of derivative instruments depends on whether the derivatives have been designated and qualify as hedging instruments under GAAP. Our derivatives were designated and qualified as cash flow hedges. We formally designated and documented, at inception, the financial instruments as hedges of specific underlying exposures, the risk management objectives, and the strategy for undertaking the hedging transactions. In addition, we formally assess, both at the inception and at least quarterly thereafter, whether the financial instruments used in hedging transactions are effective at offsetting changes in the cash flows of the related underlying exposures. To the extent that the hedges are effective, the changes in fair values of our cash flow hedges are recorded in Accumulated other comprehensive income (loss) in the consolidated statements of changes in stockholders' equity. Any ineffective portion is immediately recognized into earnings. The variable-rate interest on the borrowing for our new corporate headquarters was capitalized during the construction period. The amounts in Accumulated other comprehensive loss related to the cash flow hedge of the variability of the interest that was capitalized is reclassified into earnings over the depreciable life of the asset.
In November 2017, we repaid the outstanding balance of the underlying loans (see Note 11—Borrowings). As a result, we terminated the derivative instruments. We reclassified $941,000 unrealized loss on cash flow hedges, net of tax benefits from Accumulated other comprehensive loss into earnings, and recognized a $1.4 million loss on early extinguishment of debt recorded in Other income, net in our consolidated statements of operations for the year ended December 31, 2017. The construction period capitalized variable-rate interest from our cash flow hedge included in Accumulated other comprehensive loss at December 31, 2017 was $599,000 and will be reclassified into earnings over the depreciable life of the building. For the years ended December 31, 2017 and 2016, the amount of capitalized variable-rate interest in Accumulated other comprehensive income (loss) that has been reclassified into earnings was not material and the amounts at December 31, 2017 that we will reclassify into earnings within the next 12 months is not expected to be material.
Revenue recognition
We derive our revenue primarily from retail merchandise sales on our Website. We also earn revenue from advertising on our Website and from other sources. We have organized our retail operations into two principal reporting segments based on the primary source of revenue: direct revenue and partner and other revenue (see Note 21—Business Segments).
Revenue is recognized when the following revenue recognition criteria are met: (1) persuasive evidence of an arrangement exists; (2) delivery has occurred or the service has been provided; (3) the selling price or fee revenue earned is
113
fixed or determinable; and (4) collection of the resulting receivable is reasonably assured. Revenue related to merchandise sales is recognized upon delivery to our customers. As we ship high volumes of packages through multiple carriers, it is not practical for us to track the actual delivery date of each shipment. Therefore, we use estimates to determine which shipments are delivered and, therefore, recognized as revenue at the end of the period. Our delivery date estimates are based on average shipping transit times, which are calculated using the following factors: (i) the type of shipping carrier (as carriers have different in-transit times); (ii) the fulfillment source (either our warehouses, those warehouses we control, or those of our partners); (iii) the delivery destination; and (iv) actual transit time experience, which shows that delivery date is typically one to eight business days from the date of shipment. We review and update our estimates on a quarterly basis based on our actual transit time experience. However, actual shipping times may differ from our estimates.
We evaluate the criteria outlined in ASC Topic 605-45, Principal Agent Considerations, in determining whether it is appropriate to record the gross amount of product sales and related costs or the net amount earned as commissions. When we are the primary obligor in a transaction, are subject to inventory risk, have latitude in establishing prices and selecting suppliers, or have several but not all of these indicators, revenue is recorded gross. If we are not the primary obligor in the transaction and amounts earned are determined using a fixed percentage, revenue is recorded on a net basis. Currently, the majority of both direct revenue and partner revenue is recorded on a gross basis, as we are the primary obligor. We present revenue net of sales taxes. We periodically provide incentive offers to our customers to encourage purchases. Such offers include current discount offers, such as percentage discounts off current purchases and other similar offers, which, when used by customers, are treated as a reduction of revenue.
We evaluate the revenue recognition criteria above for our broker dealer subsidiaries (see Note 20—Broker Dealers) and we recognize securities transactions (and the related commission revenue) on a trade date and gross basis.
Based upon our historical experience, direct and partner revenues typically increase during the fourth quarter because of the holiday retail season and decrease in the following quarter(s).
Direct revenue
Direct revenue is derived from merchandise sales of our owned inventory to individual consumers and businesses. Direct revenue comes from merchandise sales that occur primarily through our Website, but may also occur through offline and other channels.
Partner and other revenue
Partner and other revenue is derived primarily from merchandise sales of inventory sourced through our partners which are generally shipped directly to our consumers and businesses. Partner and other revenue comes from merchandise sales that occur primarily through our Website, but may also occur through offline and other channels, including through our broker-dealer subsidiaries in our Other segment.
Club O loyalty program
We have a customer loyalty program called Club O Gold for which we sell annual memberships. For Club O Gold memberships, we record membership fees as deferred revenue and we recognize revenue ratably over the membership period. The Club O Gold loyalty program allows members to earn Club O Reward dollars for qualifying purchases made on our Website. We also have a co-branded credit card program (see Co-branded credit card program below for more information). Co-branded cardholders are also Club O Gold members and earn additional reward dollars for purchases made on our Website, and from other merchants.
Earned Club O Reward dollars may be redeemed on future purchases made through our Website. We recognize revenue for Club O Reward dollars when customers redeem their reward dollars as part of a purchase on our Website. We account for these transactions as multiple element arrangements and allocate revenue to the elements using their relative fair values. We include the value of reward dollars earned in deferred revenue and we record it as a reduction of revenue at the time the reward dollars are earned. Club O Gold membership reward dollars expire 90 days after the customer's Club O Gold membership expires. When Club O Reward dollars expire, we recognize reward dollar breakage as Other income, net in our consolidated statements of operations.
Beginning in 2015, we enrolled a significant number of members in Club O Silver, a newly introduced Club O membership tier for customers who agreed to receive promotional emails. Club O Silver members earned Club O Rewards on
114
qualifying purchases that expired after 90 days from a qualifying purchase. We discontinued Club O Silver in October 2016, and as a result we do not expect further Club O Silver rewards breakage in the future.
In instances where customers receive free Club O Reward dollars not associated with any purchases, we account for these transactions as sales incentives such as coupons and record a reduction of revenue at the time the reward dollars are redeemed.
Co-branded credit card program
We have a co-branded credit card agreement with a commercial bank for the issuance of credit cards bearing the Overstock.com brand, under which the bank pays us fees for new accounts and for customer usage of the cards. The agreement also provides for a customer loyalty program offering reward points that customers will accrue from card usage and can use to make purchases on our Website (see Club O loyalty program above for more information). New account fees are recognized as revenue on a straight-line basis over the estimated expected life of co-branded credit card customers. Credit card usage fees are recognized as revenues as actual credit card usage occurs.
We also have a private label credit card agreement with another commercial bank for the issuance of credit cards bearing our brand, but that is only available for use on our Website. In connection with the agreement, we received upfront fees that we recognize as revenue on a straight-line basis over the term of the agreement, which runs through February 2022. When customers make regular revolving purchases using the card, we receive fees, which are recognized as revenue. When we offer promotional financing for purchases made with the card (for example, 12 months same as cash), we pay a discount fee to the commercial bank, which we recognize as a reduction of revenue. The commercial bank owns all of the accounts under the program and performs all account administration, underwriting and servicing. Fees and royalties from new accounts, credit card usage fees, and fees from both of these cards were less than 1% of total net revenues for all periods presented.
Deferred revenue
Customer orders are recorded as deferred revenue prior to delivery of products or services ordered. We record amounts received for Club O Gold membership fees as deferred revenue and we recognize it ratably over the membership period. We record Club O Reward dollars earned from purchases as deferred revenue at the time they are earned and we recognize it as revenue upon redemption. If reward dollars are not redeemed, we recognize other income upon expiration. In addition, we sell gift cards and record related deferred revenue at the time of the sale. We sell gift cards without expiration dates and we recognize revenue from a gift card upon redemption of the gift card. If a gift card is not redeemed, we recognize other income when the likelihood of its redemption becomes remote based on our historical redemption experience. We consider the likelihood of redemption to be remote after 36 months.
We periodically enter into agreements with other parties to market ancillary products or services on our Website. As a result of those agreements, we sometimes receive payments in advance of performing our obligations under those agreements. Such payments received before we perform our obligations are initially recorded as deferred revenue and then recognized over our service period.
Sales returns allowance
We inspect returned items when they arrive at our processing facilities. We refund the full cost of the merchandise returned and all original shipping charges if the returned item is defective or we or our partners have made an error, such as shipping the wrong product.
If the return is not a result of a product defect or a fulfillment error and the customer initiates a return of an unopened item within 30 days of delivery, for most products we refund the full cost of the merchandise minus the original shipping charge and actual return shipping fees. However, we reduce refunds for returns initiated more than 30 days after delivery or that are received at our returns processing facility more than 45 days after initial delivery.
If our customer returns an item that has been opened or shows signs of wear, we issue a partial refund minus the original shipping charge and actual return shipping fees.
Revenue is recorded net of estimated returns. We record an allowance for returns based on current period revenues and historical returns experience. We analyze actual historical returns, current economic trends and changes in order volume and acceptance of our products when evaluating the adequacy of the sales returns allowance in any accounting period.
115
The allowance for returns was $17.4 million and $18.2 million at December 31, 2017 and 2016, respectively.
Credit card chargeback allowance
Revenue is recorded net of credit card chargebacks. We maintain an allowance for credit card chargebacks based on current period revenues and historical chargeback experience. The allowance for chargebacks was $311,000 and $431,000 at December 31, 2017 and 2016, respectively.
Cost of goods sold
Cost of goods sold includes product costs, warehousing costs, outbound shipping costs, handling and fulfillment costs, customer service costs and credit card fees, and is recorded in the same period in which related revenues have been recorded. Cost of goods sold, including product cost and other costs and fulfillment and related costs are as follows (in thousands):
Year ended December 31, | |||||||||||||||||
2017 | 2016 | 2015 | |||||||||||||||
Total revenue, net | $ | 1,744,756 | 100% | $ | 1,799,963 | 100% | $ | 1,657,838 | 100% | ||||||||
Cost of goods sold | |||||||||||||||||
Product costs and other cost of goods sold | 1,328,749 | 76% | 1,391,736 | 77% | 1,279,766 | 77% | |||||||||||
Fulfillment and related costs | 75,456 | 4% | 76,878 | 4% | 73,418 | 4% | |||||||||||
Total cost of goods sold | 1,404,205 | 80% | 1,468,614 | 82% | 1,353,184 | 82% | |||||||||||
Gross profit | $ | 340,551 | 20% | $ | 331,349 | 18% | $ | 304,654 | 18% | ||||||||
Advertising expense
We expense the costs of producing advertisements the first time the advertising takes place and expense the cost of communicating advertising in the period during which the advertising space or airtime is used. Internet advertising expenses are recognized as incurred based on the terms of the individual agreements, which are generally: 1) a commission for traffic driven to our Website that generates a sale or 2) a referral fee based on the number of clicks on keywords or links to our Website generated during a given period. Advertising expense is included in sales and marketing expenses and totaled $164.6 million, $135.1 million and $115.0 million during the years ended December 31, 2017, 2016 and 2015, respectively. Prepaid advertising (included in Prepaids and other current assets in the accompanying consolidated balance sheets) was $987,000 and $843,000 at December 31, 2017 and 2016, respectively.
Stock-based compensation
We measure compensation expense for all outstanding unvested share-based awards at fair value on the date of grant and recognize compensation expense over the service period for awards at the greater of a straight-line basis or on an accelerated schedule when vesting of the share-based awards exceeds a straight-line basis. As a result of the adoption of ASU 2016-09, we made an accounting policy election to record forfeitures when they occur. When an award is forfeited prior to the vesting date, we recognize an adjustment for the previously recognized expense in the period of the forfeiture. See Note 15—Stock-Based Awards.
Self-funded health insurance
As of January 1, 2017, we established a partially self-funded health insurance plan for our employees. We maintain a stop-loss insurance policy through an insurance company that limits our losses both on a per employee basis and an aggregate basis. Although we intend to maintain this plan indefinitely, we may terminate, modify, suspend, or discontinue this plan at any time and for any reason.
We are responsible for estimating our liability for unpaid costs of insured events that have occurred, which includes known cases on a case-by-case basis, and also for events that have occurred, but have not yet been reported. As of December 31, 2017, we have recorded an accrued liability of approximately $1.0 million. Actual claims may differ from the estimate and any difference could be significant. This accrual is included in Accrued liabilities in the accompanying consolidated balance sheets.
116
Loss contingencies
In the normal course of business, we are involved in legal proceedings and other potential loss contingencies. We accrue a liability for such matters when it is probable that a loss has been incurred and the amount can be reasonably estimated. When only a range of probable loss can be estimated, the most probable amount in the range is accrued. If no amount within this range is a better estimate than any other amount within the range, the minimum amount in the range is accrued. We expense legal fees as incurred (see Note 12—Commitments and Contingencies).
Income taxes
Income taxes are accounted for under the asset and liability method, which requires the recognition of deferred tax assets and liabilities for the expected future tax consequences of events that have been included in the financial statements. Under this method, deferred tax assets and liabilities are determined on the basis of the differences between the financial statements and tax bases of assets and liabilities using enacted tax rates in effect for the year in which the differences are expected to reverse. The effect of a change in tax rates on deferred tax assets and liabilities is recognized in income in the period that includes the enactment date.
We recognize deferred tax assets to the extent that we believe these assets are more likely than not to be realized. In evaluating our ability to recover our deferred tax assets within the jurisdiction from which they arise, we consider all available positive and negative evidence, including projected future taxable income, scheduled reversals of our deferred tax liabilities, tax planning strategies, and results of recent operations.
We record uncertain tax positions in accordance with ASC 740 on the basis of a two-step process whereby (1) we determine whether it is more likely than not that the tax positions will be sustained on the basis of the technical merits of the position and (2) for those tax positions that meet the more-likely-than-not recognition threshold, we recognize the largest amount of tax benefit that is more than 50 percent likely to be realized upon ultimate settlement with the related tax authority. We recognize interest and penalties related to unrecognized tax benefits within the income tax expense line in the accompanying consolidated income statements. Accrued interest and penalties are included within the related tax liability line in our consolidated balance sheets.
Net income (loss) per share
In 2016, we issued shares of our Blockchain Voting Series A Preferred Stock and our Voting Series B Preferred Stock (collectively the "preferred shares"). These shares are considered participating securities, and as a result, net income (loss) per share is calculated using the two-class method. Under this method, we give effect to preferred dividends and then allocate remaining net income (loss) attributable to our stockholders to both common shares and participating securities (based on the percentages outstanding) in determining net income (loss) per common share.
Basic net income (loss) per common share is computed by dividing net income (loss) attributable to common shares (after allocating between common shares and participating securities) by the weighted average number of common shares outstanding during the period.
Diluted net income (loss) per share is computed by dividing net income (loss) attributable to common shares (after allocating between common shares and participating securities) by the weighted average number of common and potential common shares outstanding during the period (after allocating total dilutive shares between our common shares outstanding and our preferred shares outstanding). Potential common shares, comprising incremental common shares issuable upon the exercise of stock options, warrants, and restricted stock awards are included in the calculation of diluted net income (loss) per common share to the extent such shares are dilutive.
117
The following table sets forth the computation of basic and diluted net income (loss) per common share for the periods indicated (in thousands, except per share data):
Year ended December 31, | |||||||||||
2017 | 2016 | 2015 | |||||||||
Net income (loss) attributable to stockholders of Overstock.com, Inc. | $ | (109,878 | ) | $ | 12,522 | $ | 2,446 | ||||
Less: Preferred stock dividends - declared and accumulated | 216 | — | — | ||||||||
Undistributed income (loss) | (110,094 | ) | 12,522 | 2,446 | |||||||
Less: Undistributed loss allocated to participating securities | (2,960 | ) | — | — | |||||||
Net income (loss) attributable to common shares | $ | (107,134 | ) | $ | 12,522 | $ | 2,446 | ||||
Net income (loss) per common share—basic: | |||||||||||
Net income (loss) attributable to common shares—basic | $ | (4.28 | ) | $ | 0.49 | $ | 0.10 | ||||
Weighted average common shares outstanding—basic | 25,044 | 25,342 | 24,612 | ||||||||
Effect of dilutive securities: | |||||||||||
Stock options and restricted stock awards | — | 84 | 91 | ||||||||
Weighted average common shares outstanding—diluted | 25,044 | 25,426 | 24,703 | ||||||||
Net income (loss) attributable to common shares—diluted | $ | (4.28 | ) | $ | 0.49 | $ | 0.10 | ||||
The following shares were excluded from the calculation of diluted shares outstanding as their effect would have been anti-dilutive (in thousands):
Year ended December 31, | ||||||||
2017 | 2016 | 2015 | ||||||
Stock options and restricted stock units | 226 | 466 | 323 | |||||
Common shares issuable under stock warrant | 78 | — | — | |||||
Stock repurchase program
On May 5, 2015, our Board of Directors authorized a stock repurchase program under which we may repurchase shares of our outstanding common stock for up to $25 million at any time through December 31, 2017. In January 2017, we repurchased approximately 604,000 shares of our common stock for an aggregate purchase price of $10 million under the stock repurchase plan. All common shares repurchased were recognized as treasury stock.
Sales of warrants
On November 8, 2017, we issued two warrants to purchase up to a combined aggregate of 3,722,188 shares of the Company's common stock, par value $0.0001 per share, to two purchasers in privately negotiated transactions, for an aggregate purchase price of $6.5 million, net of issuance costs. The exercise price for both warrants is $40.45 per share of common stock. On December 29, 2017, one of the warrant holders exercised its warrants in full and purchased a total of 2,472,188 shares of common stock for $100.0 million. On January 17, 2018, the other warrant holder exercised its warrant in full and purchased 1,250,000 shares of common stock for $50.6 million. As of December 31, 2017, the unexercised warrant was classified as equity and included in the Additional paid-in capital in our consolidated balance sheets.
Recently adopted accounting standards
In July 2015, the FASB issued ASU 2015-11, Inventory (Topic 330): Simplifying the Measurement of Inventory, which requires inventory to be measured at the lower of cost and net realizable value. Net realizable value is the estimated selling prices in the ordinary course of business, less reasonably predictable costs of completion, disposal, and transportation. We implemented the provisions of ASU 2015-11 on January 1, 2017 on a prospective basis. The implementation of ASU 2015-11 did not impact our results of operations or cash flows.
In November 2015, the FASB issued ASU 2015-17, Income Taxes (Topic 740): Balance Sheet Classification of Deferred Taxes, which requires that deferred tax assets and liabilities be classified as noncurrent in a classified balance sheet. We implemented the provisions of ASU 2015-17 on January 1, 2017 on a retrospective basis. Amounts related to the implementation for the year ended December 31, 2016 totaled approximately $16.3 million and have been reclassified to
118
Deferred tax assets, net in our consolidated balance sheet. The implementation of ASU 2015-17 did not impact our results of operations or cash flows.
In March 2016, the FASB issued ASU 2016-09, Compensation-Stock Compensation (Topic 718): Improvements to Employee Share-Based Payment Accounting, which simplifies several aspects of the accounting for share-based payment transactions, including the income tax consequences, classification of awards as either equity or liabilities, and classification on the statement of cash flows. We implemented the provisions of ASU 2016-09 on January 1, 2017 on a modified retrospective basis. We recognized $9.4 million of additional deferred tax assets related to excess tax benefits through a cumulative effect adjustment in Accumulated deficit as of January 1, 2017. We will recognize future excess tax benefits or tax deficiencies related to the vesting of stock-based compensation awards as income tax benefit or income tax expense. This is likely to cause volatility in our effective tax rate and income tax expense. As part of our implementation of this standard, we also made a policy election to recognize forfeitures as they occur under a modified retrospective approach which did not have a significant impact on our results of operations or cash flows. Our adoption of the other provisions of this standard, which will be applied prospectively, did not have a significant impact on our results of operations or cash flows.
In July 2017, the FASB issued ASU 2017-11, Earnings Per Share (Topic 260); Distinguishing Liabilities from Equity (Topic 480); Derivatives and Hedging (Topic 815), which changes the classification analysis of certain equity-linked financial instruments (or embedded features) with down round features. When determining whether certain financial instruments should be classified as liabilities or equity instruments, a down round feature no longer precludes equity classification when assessing whether the instrument is indexed to an entity's own stock. ASU 2017-11 also clarifies existing disclosure requirements for equity-classified instruments. As a result, a freestanding equity-linked financial instrument (or embedded conversion option) no longer would be accounted for as a derivative liability at fair value as a result of the existence of a down round feature. For freestanding equity classified financial instruments, ASU 2017-11 requires entities that present earnings per share ("EPS") in accordance with ASC Topic 260 to recognize the effect of the down round feature when it is triggered. That effect is treated as a dividend and as a reduction of income available to common shareholders in basic EPS. The new standard becomes effective for us on January 1, 2019. We early adopted the proposed guidance under ASU 2017-11 for the year end December 31, 2017, and recognized warrants issued in the fourth quarter of 2017 with a down round feature as equity. No adjustments were required for the retrospective application of this standard.
In January 2017, the FASB issued ASU 2017-04, Intangibles, Goodwill and Other (Topic 350): Simplifying the Test for Goodwill Impairment, which simplifies the manner in which an entity should perform its annual, or interim, goodwill impairment test. The new standard becomes effective for us on January 1, 2020. We early adopted the proposed guidance under ASU 2017-04 for the year end December 31, 2017 on a prospective basis. The implementation of ASU 2017-04 did not have a material impact on our consolidated financial statements and related disclosures.
Recently issued accounting standards
In May 2014, the FASB issued ASU 2014-09, Revenue from Contracts with Customers (Topic 606), which requires an entity to recognize the amount of revenue to which it expects to be entitled for the transfer of promised goods or services to customers. The ASU will replace most existing revenue recognition guidance in U.S. GAAP when it becomes effective. We will adopt the new standard on January 1, 2018 with a cumulative adjustment that will reduce Accumulated deficit by approximately $5.0 million as opposed to retrospectively adjusting prior periods. The adjustment will primarily relate to the unredeemed portion of our gift cards and loyalty program rewards, which we will begin to recognize over the expected redemption period, rather than waiting until the likelihood of redemption becomes remote or the rewards expire. Under previous FASB standards, we recognized revenue from the majority of our sales on a gross basis. We have not reached a definite conclusion, but we believe we will continue to recognize revenue from the majority of our sales on a gross basis. In addition, we believe we will continue to recognize revenue related to merchandise sales upon delivery to our customers. This ASU will also involve updating revenue related internal control documentation and expanding revenue disclosures in the Company's periodic filings.
In January 2016, the FASB issued ASU 2016-01, Financial Instruments-Overall (Subtopic 825-10): Recognition and Measurement of financial Assets and Financial Liabilities. This ASU requires equity investments, except those under the equity method of accounting or those that result in the consolidation of an investee, to be measured at fair value with changes in fair value recognized in net income. However, an entity may choose to measure equity investments that do not have readily determinable fair values at cost minus impairment, if any, plus or minus changes resulting from observable price changes in orderly transactions for the identical or similar investment of the same issuer. The new standard becomes effective for us on January 1, 2018. The amendments in this update should be applied under a retrospective approach, with the exception of the amendments related to equity investments without readily determinable fair values, which must be applied on a prospective basis. We are evaluating the effect of adopting ASU 2016-01, but do not expect the adoption to have a material impact on our consolidated financial statements and related disclosures.
119
In February 2016, the FASB issued ASU 2016-02, Leases (Topic 842), which, among other things, requires lessees to recognize most leases on their balance sheets related to the rights and obligations created by those leases. The new standard also requires new disclosures to help financial statement users better understand the amount, timing, and uncertainty of cash flows arising from leases. The new standard becomes effective for us on January 1, 2019, with early adoption permitted. We plan to adopt this ASU beginning on January 1, 2019. The amendments in this update should be applied under a modified retrospective approach. We are evaluating the effect that ASU 2016-02 will have on our consolidated financial statements and related disclosures.
In November 2016, the FASB issued ASU 2016-18, Statement of Cash Flows (Topic 230): Restricted Cash (a consensus of the FASB Emerging Issues Task Force), which provides guidance on the presentation of restricted cash or restricted cash equivalents in the statement of cash flows, thereby reducing the diversity in practice. The new standard becomes effective for us on January 1, 2018. The standard requires entities to apply this standard using the retrospective transition method to each period presented. The adoption of this standard will require that amounts generally described as restricted cash and restricted cash equivalents be included with cash and cash equivalents when reconciling beginning-of-period and end-of-period total amounts shown in the statement of cash flows, rather than as currently presented within the operating activities and financing activities in the statement of cash flows. We do not expect the reclassification upon adoption of ASU 2016-18 will have a material impact on our consolidated financial statements and related disclosures.
3. ACQUISITIONS, GOODWILL, AND ACQUIRED INTANGIBLE ASSETS
As part of our Medici blockchain and fintech technology initiatives, during 2015, a subsidiary of tZERO entered into a purchase agreement to acquire Cirrus Technologies LLC, a financial technology firm. In connection with the Cirrus Technology acquisition, a subsidiary of tZERO also entered into an agreement to purchase SpeedRoute LLC and all of the outstanding membership interests not already owned by tZERO in PRO Securities LLC. Both SpeedRoute and PRO Securities were under common control with Cirrus Technologies LLC by a party that holds a noncontrolling interest in tZERO. SpeedRoute and PRO Securities are FINRA-registered broker dealers.
This acquisition closed in two parts. The Cirrus Technologies acquisition closed in Q3 2015 and the membership interests in SpeedRoute and PRO Securities closed in Q1 2016 after receiving approval from FINRA. The total gross purchase price of this acquisition was $29.7 million, consisting of approximately $11.6 million in cash (which excludes $2.2 million in cash acquired, primarily during Q1 2016) and 908,364 shares of Overstock's common stock valued at approximately $18.1 million. The proceeds for the acquisition were financed by tZERO through a note payable to Overstock that bears interest that approximates the Federal Funds Rate. The total purchase price has been allocated to the assets acquired and the liabilities assumed based on their respective fair values at the acquisition dates, with amounts exceeding fair value recorded as goodwill. We did not record significant deferred taxes related to the acquisition. The goodwill of the acquired business is deductible for tax purposes.
The acquisition of Cirrus Technologies and the acquisition of the membership interests of SpeedRoute and PRO Securities were negotiated and contemplated in conjunction with each other. As such, this was recognized as a single transaction. We estimated the fair value of the acquired assets based on Level 3 inputs, which were unobservable (see Note 2—Accounting Policies, Fair value of financial instruments). These inputs included our estimate of future revenues, operating margins, discount rates, royalty rates and assumptions about the relative competitive environment.
The fair values of the assets acquired and liabilities assumed at the acquisition dates are as follows (in thousands):
120
Purchase Price | Fair Value | ||
Cash paid, net of cash acquired | $ | 9,353 | |
Common stock issued | 18,149 | ||
$ | 27,502 | ||
Allocation | |||
Goodwill | $ | 11,914 | |
Intangibles | 16,000 | ||
Accounts receivable and other assets | 2,565 | ||
Other liabilities assumed | (2,977 | ) | |
$ | 27,502 | ||
The following table details the identifiable intangible assets acquired at their fair value and remaining useful lives as of December 31, 2017 (amounts in thousands):
Intangible Assets | Fair Value | Weighted Average Useful Life (years) | |||
Technology and developed software | $ | 13,600 | 2.92 | ||
Customer relationships | 1,900 | — | |||
Trade names | 300 | 5.93 | |||
Other | 200 | ||||
Total acquired intangible assets as of the acquisition date | 16,000 | ||||
Less: accumulated amortization of acquired intangible assets | (9,228 | ) | |||
Total acquired intangible assets, net | $ | 6,772 | |||
The expense for amortizing acquired intangible assets in connection with this acquisition was $3.9 million, $3.9 million and $1.5 million for the years ended December 31, 2017, 2016 and 2015, respectively.
Acquired intangible assets primarily include technology, customer relationships and trade names. As described above, we determined the fair value of these assets using an income approach method to determine the present value of expected future cash flows for each identifiable intangible asset. This method was based on discount rates which incorporate a risk premium to take into account the risks inherent in those expected cash flows. The expected cash flows were estimated using the expectations of market participants.
The acquired assets, liabilities, and associated operating results were consolidated into our financial statements at the acquisition dates, or the dates on which we obtained control of the acquired assets or interests.
4. ACCOUNTS RECEIVABLE, NET
Accounts receivable, net consist of the following (in thousands):
December 31, | ||||||||
2017 | 2016 | |||||||
Freight rebates receivable | $ | 8,527 | $ | 7,106 | ||||
Credit card receivables | 8,480 | 10,243 | ||||||
Accounts receivable, trade | 8,317 | 9,054 | ||||||
Other receivables | 6,009 | 3,738 | ||||||
31,333 | 30,141 | |||||||
Less: allowance for doubtful accounts | (1,253 | ) | (1,999 | ) | ||||
Accounts receivable, net | $ | 30,080 | $ | 28,142 | ||||
121
5. INVENTORIES, NET
Inventories, net consist of the following (in thousands):
December 31, | ||||||||
2017 | 2016 | |||||||
Product inventories, net | $ | 8,844 | $ | 11,732 | ||||
Inventory in-transit | 4,859 | 7,205 | ||||||
Total inventories, net | $ | 13,703 | $ | 18,937 | ||||
6. PREPAIDS AND OTHER CURRENT ASSETS
Prepaids and other current assets consist of the following (in thousands):
December 31, | ||||||||
2017 | 2016 | |||||||
Prepaid other | $ | 7,705 | $ | 4,189 | ||||
Prepaid maintenance | 7,427 | 6,622 | ||||||
Prepaid advertising | 987 | 843 | ||||||
Total prepaids and other current assets | $ | 16,119 | $ | 11,654 | ||||
7. FIXED ASSETS, NET
Fixed assets, net consist of the following (in thousands):
December 31, | ||||||||
2017 | 2016 | |||||||
Computer hardware and software, including internal-use software and website development | $ | 196,501 | $ | 196,923 | ||||
Building | 69,169 | 67,892 | ||||||
Furniture and equipment | 14,455 | 15,931 | ||||||
Land | 12,781 | 12,781 | ||||||
Building machinery and equipment | 8,356 | 7,915 | ||||||
Leasehold improvements | 7,752 | 7,062 | ||||||
Land improvements | 6,764 | 6,356 | ||||||
315,778 | 314,860 | |||||||
Less: accumulated depreciation | (186,435 | ) | (180,308 | ) | ||||
Total fixed assets, net | $ | 129,343 | $ | 134,552 | ||||
Depreciation of fixed assets totaled $28.8 million, $27.3 million, and $23.5 million for the years ended December 31, 2017, 2016 and 2015, respectively. During 2017, we retired $23.6 million of fully depreciated fixed assets that were removed from service in 2017.
Upon sale or retirement of assets, cost and related accumulated depreciation and amortization are removed from the balance sheet and the resulting gain or loss, if any, is reflected in the consolidated statements of operations.
Fixed assets included assets under capital leases and finance obligations of $1.8 million and $21.5 million at December 31, 2017 and 2016, respectively. Accumulated depreciation related to assets under capital leases and finance obligations was $458,000 and $8.7 million at December 31, 2017 and 2016, respectively.
Depreciation expense of assets recorded under capital leases and finance obligations was $3.5 million, $4.1 million and $1.6 million for the years ended December 31, 2017, 2016 and 2015, respectively.
122
8. OTHER LONG-TERM ASSETS, NET
Other long-term assets, net consist of the following (in thousands):
December 31, | ||||||||
2017 | 2016 | |||||||
Cost and equity method investments, net | $ | 13,023 | $ | 11,750 | ||||
Other long-term assets | 2,787 | 1,303 | ||||||
Prepaid expenses, long-term portion | 1,430 | 1,275 | ||||||
Total other long-term assets, net | $ | 17,240 | $ | 14,328 | ||||
9. ACCRUED LIABILITIES
Accrued liabilities consist of the following (in thousands):
December 31, | ||||||||
2017 | 2016 | |||||||
Accrued marketing expenses | $ | 25,959 | $ | 26,358 | ||||
Allowance for returns | 17,391 | 18,176 | ||||||
Accounts payable accruals | 16,614 | 17,229 | ||||||
Accrued compensation and other related costs | 10,716 | 8,903 | ||||||
Other accrued expenses | 6,283 | 6,315 | ||||||
Accrued freight | 5,040 | 10,062 | ||||||
Accrued loss contingencies | 608 | 9,173 | ||||||
Total accrued liabilities | $ | 82,611 | $ | 96,216 | ||||
10. DEFERRED REVENUE
Deferred revenue consists of the following (in thousands):
December 31, | ||||||||
2017 | 2016 | |||||||
Payments owed or received prior to product delivery | $ | 24,632 | $ | 22,943 | ||||
Club O membership fees and reward points | 11,761 | 8,958 | ||||||
Unredeemed gift cards | 4,955 | 4,304 | ||||||
In store credits | 4,489 | 4,391 | ||||||
Other | 631 | 1,184 | ||||||
Total deferred revenue | $ | 46,468 | $ | 41,780 | ||||
11. BORROWINGS
U.S. Bank term loan and revolving loan agreement
In October 2014, we entered into a loan agreement (as amended through March 30, 2017, the "Agreement") with U.S. Bank National Association and other banks (the "Banks") in connection with the construction and long-term financing of our corporate headquarters (the "Project"). The Agreement provided for a senior secured real estate loan of $45.8 million (the "Term Loan") and a $25.0 million senior secured revolving credit facility (the "Revolving Loan"). The Term loan was converted into an approximately 6.75-year loan on January 1, 2017 with an aggregate principal amount of $45.8 million. No amounts were borrowed under the Revolving Loan during any periods. Amounts outstanding under the Term Loan carried an interest rate based on one-month LIBOR plus 2.00% or an Alternate Base Rate plus 1.00%. However, we had entered into interest rate swap
123
agreements designed to fix our interest rate on the Term Loan at approximately 4.6% annually (see Derivative financial instruments in Note 2. Accounting Policies).
On November 6, 2017, we paid off the remaining $44.8 million of the Term Loan and terminated both the Term Loan and the Revolving Loan. As a result, we recorded a loss of $824,000 on early extinguishment of debt recorded in Other income, net in our consolidated statements of operations.
U.S. Bank master lease agreement
In November 2015, we entered into a Master Lease Agreement and a Financial Covenants Rider (collectively, the "Master Lease Agreement") with U.S. Bank Equipment Finance, a division of U.S. Bank National Association ("Lessor"). Under the Master Lease Agreement, we were able to sell certain assets (the "Leased Assets") to the Lessor and simultaneously lease them back for a period of 60 months. We were also able to finance certain software licenses (inclusive in the "Leased Assets") for a period of 60 months. The average interest rate for amounts outstanding under the Master Lease Agreement was approximately 3.60%. We had the right to repurchase the Leased Assets for $1.00 and terminate the Master Lease Agreement twelve months following the initial term. We accounted for the Master Lease Agreement as a financing transaction and amounts owed are included in Finance Obligations, current and non-current in the consolidated balance sheets.
On November 6, 2017, we paid off the remaining liability of $12.1 million and terminated the Master Lease Agreement. As a result, we recorded a loss of $229,000 on early extinguishment of debt recorded in Other income, net in our consolidated statements of operations.
PCL L.L.C. term loan agreement
On November 6, 2017, we entered into a loan agreement with PCL L.L.C., an entity directly or indirectly wholly owned by the mother and brother of our Chief Executive Officer, Dr. Patrick Byrne. The agreement provides for a $40.0 million term loan (the "PCL Loan") which carries an annual interest rate of 8.0% and a default rate of 18.0%. The PCL Loan is for a term of 18 months, subject to mandatory prepayment under certain circumstances, and is prepayable at our election at any time without penalty or premium. Interest only will be due monthly. There are no financial covenants associated the PCL Loan.
The principal amount and any then unpaid interest will be due and payable on May 1, 2019 subject to mandatory prepayment in the event of a sale or encumbrance of the headquarters building or a change of ownership of Overstock or the occurrence of certain other events, including material changes to Overstock's business, the loss of management control of Overstock by Dr. Patrick Byrne and other events. The PCL Loan is secured by our corporate headquarters and the related land, fixtures and certain related personal property. Capitalized debt issuance costs with the new loan agreement are insignificant. The $40.0 million proceeds from this loan together with our cash resources were used to repay the remaining outstanding balances and terminate the U.S. Bank Term Loan, Revolving Loan, Master Lease Agreement, and associated derivative instruments.
At December 31, 2017, our outstanding balance on the PCL Loan was $40.0 million. Amounts outstanding under the Term Loan are presented net of discount and issuance costs in our consolidated balance sheets.
U.S. Bank letters of credit
At December 31, 2017 and 2016, letters of credit totaling $355,000 and $430,000, were issued on our behalf collateralized by compensating cash balances held at U.S. Bank, which are included in Restricted cash in the accompanying consolidated balance sheets.
U.S. Bank commercial purchasing card agreement
We have a commercial purchasing card (the "Purchasing Card") agreement with U.S. Bank. We use the Purchasing Card for business purpose purchasing and must pay it in full each month. At December 31, 2017, $822,000 was outstanding and $4.2 million was available under the Purchasing Card. At December 31, 2016, $811,000 was outstanding and $4.2 million was available under the Purchasing Card.
Capital lease
124
During the year ended December 31, 2017, we entered into a capital lease arrangement of computer equipment for $1.4 million. The arrangement will expire in 2020. At December 31, 2017, the outstanding balance under the capital lease was $1.3 million and is included in Other current and non-current liabilities in the consolidated balance sheets. Future payment obligations, including interest, under the capital lease are $496,000, $496,000 and $413,000 for 2018, 2019 and 2020, respectively.
12. COMMITMENTS AND CONTINGENCIES
Summary of future minimum lease payments for all operating leases
Minimum future payments under all operating leases as of December 31, 2017, are as follows (in thousands):
Payments due by period: | ||||
2018 | $ | 6,962 | ||
2019 | 6,733 | |||
2020 | 4,292 | |||
2021 | 4,335 | |||
2022 | 4,439 | |||
Thereafter | 16,356 | |||
$ | 43,117 | |||
Rental expense for operating leases totaled $9.3 million, $12.6 million and $12.7 million for the years ended December 31, 2017, 2016 and 2015, respectively.
Legal proceedings and contingencies
From time to time, we are involved in litigation concerning consumer protection, employment, intellectual property and other commercial matters related to the conduct and operation of our business and the sale of products on our Website. In connection with such litigation, we may be subject to significant damages. In some instances, other parties may have contractual indemnification obligations to us. However, such contractual obligations may prove unenforceable or non-collectible, and if we cannot enforce or collect on indemnification obligations, we may bear the full responsibility for damages, fees and costs resulting from such litigation. We may also be subject to penalties and equitable remedies that could force us to alter important business practices. Such litigation could be costly and time consuming and could divert or distract our management and key personnel from our business operations. Due to the uncertainty of litigation and depending on the amount and the timing, an unfavorable resolution of some or all of these matters could materially affect our business, results of operations, financial position, or cash flows.
On September 23, 2009, SpeedTrack, Inc. sued us along with 27 other defendants in the United States District Court in the Northern District of California. We are alleged to have infringed a patent covering search and categorization software. We believe that certain third-party vendors of products and services sold to us are contractually obligated to indemnify us, and we have tendered defense of the case to an indemnitor who accepted the defense. On April 21, 2016, the court entered an order partially dismissing the claims against us. On May 4, 2016, the plaintiff filed an amended complaint, and we have filed our answer. The nature of the loss contingencies relating to claims that have been asserted against us are described above. However, no estimate of the loss or range of loss can be made. We intend to vigorously defend this action and pursue our indemnification rights with our vendors.
On February 11, 2013, RPost Holdings, Inc., RPost Communications Limited, and RMail Limited, filed suit against us in the United States District Court in Eastern District of Texas for infringement of patents covering products and services that verify the delivery and integrity of email messages. We tendered defense of the case to an indemnitor who accepted the defense. The nature of the loss contingencies relating to claims that have been asserted against us are described above. However, no estimate of the loss or range of loss can be made. We intend to vigorously defend this action and pursue our indemnification rights with our vendors.
In June 2013, William French filed suit against us and 46 other defendants under seal in the Superior Court of the State of Delaware. The filing was unsealed on March 24, 2014. French brought the action on Delaware's behalf for violations of
125
Delaware's unclaimed property laws and for recovery of the unredeemed gift card value allegedly attributable to Delaware residents. French's complaint alleges that we, and other defendants, knowingly refused to fulfill obligations under Delaware's Abandoned Property Law by failing to report and deliver unclaimed gift card funds to the State of Delaware, and knowingly made, used or caused to be made or used, false statements and records to conceal, avoid or decrease an obligation to pay or transmit money to Delaware in violation of the Delaware False Claims and Reporting Act. The complaint seeks an injunction, monetary damages (including treble damages and penalties), and attorney's fees and costs. In the early stages of the case, we, along with others, filed motions to dismiss the case. The court dismissed one count, but allowed one count to remain. Recently, we filed motions for summary judgment, along with other defendants, to dismiss the case. The court has not yet ruled on these motions. We intend to vigorously defend this action. The nature of the loss contingencies relating to claims that have been asserted against us are described above.
On April 28, 2016, the State of South Dakota sued us along with three other defendants in the Sixth Judicial Circuit Court of South Dakota. South Dakota alleges that U.S. constitutional law should be revised to permit South Dakota to require out-of-state e-commerce websites to withhold and remit sales tax in South Dakota in accordance with South Dakota's sales tax statute. Pursuant to the statute, we would not be required to withhold and remit sales tax until there was a verdict in favor of South Dakota which was then upheld by the highest applicable appellate court. The statute does not require us to pay sales tax retroactively if we were to lose. The state court granted summary judgment in our favor, and on September 13, 2017 the South Dakota Supreme Court denied South Dakota's appeal and ruled in our favor. South Dakota appealed to the U.S. Supreme Court, and on January 12, 2018, the U.S. Supreme Court agreed to review the decision. We intend to file our appellate brief with the U.S. Supreme Court and continue to vigorously defend this action.
In September 2016, we received a letter from the District Attorney of Sonoma County, California who is acting as part of the Consumer Protection Divisions of the following counties in California: Sonoma, Alameda, Monterey, Napa, Solano, Fresno, Sacramento, Shasta, Santa Cruz, Butte, and Merced. The District Attorney alleges that certain plastic products on our site which are labeled as biodegradable, degradable, or decomposable constitute false advertising under California law. On July 24, 2017, we agreed to the terms of a Final Judgment pursuant to which we paid the Sonoma County District Attorney's Office a civil penalty of $27,000 and agreed to a five-year injunction. The injunction requires us to comply with the biodegradability law, to search our Website and re-label or remove any non-compliant products, and to certify our compliance to Sonoma each year during the five-year term of the injunction.
On July 7, 2017, the State of Wyoming sued us along with five other defendants in the Second Judicial District Court of Wyoming. Wyoming alleges that U.S. constitutional law should be revised to permit Wyoming to require out-of-state e-commerce websites to withhold and remit sales tax in Wyoming in accordance with Wyoming's sales tax statute. Pursuant to the statute, Wyoming is prohibited by an injunction from requiring us to withhold and remit sales tax until there is verdict in favor of Wyoming or the court otherwise lifts or dissolves the injunction. The statute does not require us to pay sales tax retroactively if we were to lose. We intend to vigorously defend this action.
On August 28, 2017, the State of Indiana sued us along with one other defendant in the Superior Court of Indiana, Marion County. Indiana alleges that U.S. constitutional law should be revised to permit Indiana to require out-of-state e-commerce websites to withhold and remit sales tax in Indiana in accordance with Indiana's sales tax statute. Pursuant to the statute, we would not be required to withhold and remit sales tax until there was a verdict in favor of Indiana and the verdict was no longer subject to appeal. The statute does not require us to pay sales tax retroactively if we were to lose. We intend to vigorously defend this action.
In February 2018, the Division of Enforcement of the SEC informed tZERO and subsequently informed us that it is conducting an investigation focused on the tZERO security token offering and requested that we and our affiliates, including Medici Ventures and tZERO voluntarily provide certain information and documents related to tZERO and the tZERO security token offering in connection with its investigation. We are in the process of responding to these document requests and intend to cooperate fully with the SEC in connection with its investigation. While the SEC is trying to determine whether there have been any violations of the federal securities laws, the investigation does not mean that the SEC has concluded that anyone has violated the law. Also, the investigation does not mean that the SEC has a negative opinion of any person, entity, or security.
tZERO’s broker-dealer subsidiaries are, and any broker-dealer subsidiaries that it acquires or forms in the future will be, subject to extensive regulatory requirements under federal and state laws and regulations and self-regulatory organization (“SRO”) rules. Each of SpeedRoute and PRO Securities is registered with the SEC as a broker-dealer under the Exchange Act and in the states in which it conducts securities business and is a member of FINRA and other SROs. In addition, PRO Securities owns and operates the PRO Securities ATS, which is registered with the SEC as an alternative trading system. Each of SpeedRoute and PRO Securities is subject to regulation, examination and disciplinary action by the SEC, FINRA and state securities regulators, as well as other governmental authorities and SROs with which it is registered or licensed or of which it is
126
a member. On February 22, 2018, the SEC’s New York Regional Office notified PRO Securities that it is conducting an examination of PRO Securities, and on March 6, 2018 the SEC's Boston Regional Office notified tZERO Advisors that it is conducting an examination of tZERO Advisors.
As a result of tZERO’s projects seeking to apply distributed ledger technologies to the capital markets, tZERO’s subsidiaries have been, and remain involved in, ongoing discussions with regulatory authorities. While certain of the discussions have been relatively informal, tZERO’s broker-dealer subsidiaries have also received and responded to several written inquiries from FINRA relating to such projects. While tZERO considers these continuing inquiries to be ordinary course in light of the non-traditional nature of tZERO’s distributed ledger projects, any failure by tZERO’s broker-dealer subsidiaries to satisfy their regulatory authorities that they are in compliance with all applicable rules and regulations could have a material adverse effect on tZERO and on us.
In addition, in December 2017, SpeedRoute received a letter from FINRA stating that the Department of Enforcement at FINRA has received a referral from the staff of FINRA’s Department of Market Regulation relating to rules applicable to supervision and required supervisory procedures for review of certain potential trading activity, such as pre-arranged trades or wash trades. In addition, SpeedRoute continues to have discussions with FINRA about several matters, including a matter related to potential violations of FINRA rules relating to Order Audit Trail System reporting and trading practice matters, and has received document requests from FINRA in connection with certain ongoing matters. SpeedRoute has received and responded to inquiries from FINRA and the SEC. In an unrelated matter, SpeedRoute and PRO Securities have been named in a FINRA investigatory matter in which FINRA has conducted on the record interviews of two senior officers of SpeedRoute and PRO Securities, who are also senior officers of tZERO.
We establish liabilities when a particular contingency is probable and estimable. At December 31, 2017, we have accrued $683,000, which is included in accrued liabilities in the consolidated balance sheets. It is reasonably possible that the actual losses may exceed our accrued liabilities.
13. INDEMNIFICATIONS AND GUARANTEES
During our normal course of business, we have made certain indemnities, commitments, and guarantees under which we may be required to make payments in relation to certain transactions. These indemnities include, but are not limited to, indemnities to various lessors in connection with facility leases for certain claims arising from such facility or lease, the environmental indemnity we entered into in favor of the lenders under our loan agreement with PCL L.L.C., and indemnities to our directors and officers to the maximum extent permitted under the laws of the State of Delaware. The duration of these indemnities, commitments, and guarantees varies, and in certain cases, is indefinite. In addition, the majority of these indemnities, commitments, and guarantees do not provide for any limitation of the maximum potential future payments we could be obligated to make. As such, we are unable to estimate with any reasonableness our potential exposure under these items. We have not recorded any liability for these indemnities, commitments, and guarantees in the accompanying consolidated balance sheets. We do, however, accrue for losses for any known contingent liability, including those that may arise from indemnification provisions, when future payment is both probable and reasonably estimable.
14. STOCKHOLDERS' EQUITY
Common Stock
Each share of common stock has the right to one vote. The holders of common stock are also entitled to receive dividends declared by the Board of Directors out of funds legally available, subject to prior rights of holders of all classes of stock outstanding having priority rights as to dividends. No dividends have been declared or paid on our common stock through December 31, 2017.
Preferred Stock
Each share of Series A Preferred and each share of Series B Preferred (collectively the "preferred shares") is intended to have voting and dividend rights similar to those of one share of common stock. Preferred shares rank senior to common stock with respect to dividends. Holders of the preferred shares will be entitled to an annual cash dividend equal to 1.0% of the subscription price ($0.16 per share), in preference to any dividend payment to the holders of the common stock, out of funds of the Company legally available for payment of dividends and subject to declaration by our Board of Directors. Holders of the preferred shares are also entitled to participate in any cash dividends we pay to the holders of the common stock and are also
127
entitled to participate in non-cash dividends we pay to holders of the common stock, subject to potentially different treatment if we effect a stock dividend, stock split or combination of the common stock. There are no arrearages in cumulative preferred dividends. We declared and paid a cash dividend of $0.16 per share on our preferred stock during 2017.
Neither the Series A Preferred or Series B Preferred is convertible into or exchangeable for shares of our common stock or any other entity; however, at our sole discretion, we may convert the Series A Preferred shares into Series B Preferred shares at any time on a one-to-one basis. Until the third anniversary of the Original Issuance Date, we may redeem, at our discretion, both the Series A and Series B Preferred shares for an amount equal to the highest of the following: (1) the subscription price plus any accrued but unpaid dividends, (2) 105% of the average trading price of our common stock during a five-trading-day period and (3) 105% of the average trading price of the series of preferred shares during the same five-day-trading period. In the event of any liquidation, any amount available for distribution to stockholders after payment of all liabilities will be distributed proportionately, with each share of Series A Preferred and each share of Series B Preferred being treated as though it were a share of our common stock.
15. STOCK BASED AWARDS
We have equity incentive plans that provide for the grant to employees and board members of stock-based awards, including stock options and restricted stock. Stock-based compensation expense was as follows (in thousands):
Years ended December 31, | |||||||||||
2017 | 2016 | 2015 | |||||||||
Overstock restricted stock awards | $ | 4,056 | $ | 4,891 | $ | 3,526 | |||||
Medici Ventures stock options | $ | 21 | $ | — | $ | — | |||||
Total stock-based compensation expense | $ | 4,077 | $ | 4,891 | $ | 3,526 | |||||
Stock Option Awards
Our Board of Directors adopted the 2005 Equity Incentive Plan and it was most recently amended and restated and re-approved by the stockholders on May 3, 2012 (as so amended and restated, the "Plan"). Under the Plan, the Board of Directors may issue incentive stock options to employees and directors of the Company and non-qualified stock options to consultants, as well as restricted stock units and other types of equity awards of the Company. Options granted under this Plan generally expire at the end of ten years and vest in accordance with a vesting schedule determined by our Board of Directors, usually over four years from the grant date. We did not grant any options during the years ended December 31, 2017, 2016 and 2015. At December 31, 2017, 2.0 million shares of stock remained available for future grants under the Plan. We settle stock option exercises with newly issued common shares.
The following is a summary of stock option activity (in thousands, except per share data):
2017 | 2016 | 2015 | ||||||||||||||||||
Shares | Weighted Average Exercise Price | Shares | Weighted Average Exercise Price | Shares | Weighted Average Exercise Price | |||||||||||||||
Outstanding—beginning of year | 156 | $ | 17.33 | 204 | $ | 17.27 | 224 | $ | 17.27 | |||||||||||
Exercised | (39 | ) | 16.90 | (42 | ) | 17.08 | (16 | ) | 16.94 | |||||||||||
Expired/Forfeited | (117 | ) | 17.48 | (6 | ) | 17.08 | (4 | ) | 18.26 | |||||||||||
Outstanding—end of year | — | $ | — | 156 | $ | 17.33 | 204 | $ | 17.27 | |||||||||||
Options exercisable at year-end | — | $ | — | 156 | $ | 17.33 | 204 | $ | 17.27 | |||||||||||
Stock options vest over four years at 28% at the end of the first year and 2% each month thereafter. The most recent stock options were granted in May 2008 and have fully vested. There was no stock based compensation related to stock options recorded during the years ended December 31, 2017, 2016 and 2015.
The total intrinsic value of options exercised during the years ended December 31, 2017, 2016 and 2015 was $54,000, $82,000, and $92,000, respectively. The total cash received from employees as a result of employee stock option exercises
128
during the years ended December 31, 2017, 2016 and 2015 were approximately $664,000, $819,000, and $269,000, respectively.
Restricted Stock Awards
For the years ended December 31, 2017, 2016 and 2015, the Compensation Committee of the Board of Directors approved grants of 310,000, 541,000 and 239,000 restricted stock awards, respectively, to our officers, board members and employees. These restricted stock awards vest over three years at 33.3% at the end of the first year, 33.3% at the end of the second year and 33.3% at the end of the third year and are subject to the employee's continuing service to us. At December 31, 2017, there were 540,000 unvested restricted stock awards that remained outstanding.
The cost of restricted stock units is determined using the fair value of our common stock on the date of the grant and compensation expense is either recognized on a straight-line basis over the three-year vesting schedule on a straight-line basis or on an accelerated schedule when vesting of restricted stock awards exceeds a straight-line basis. The cumulative amount of compensation expense recognized at any point in time is at least equal to the portion of the grant date fair value of the award that is vested at that date. The weighted average grant date fair value of restricted stock awards granted during the years ended December 31, 2017, 2016 and 2015 was $17.75, $14.52 and $24.60, respectively.
The following table summarizes restricted stock award activity (in thousands):
2017 | 2016 | 2015 | ||||||||||||||||||
Units | Weighted Average Grant Date Fair Value | Units | Weighted Average Grant Date Fair Value | Units | Weighted Average Grant Date Fair Value | |||||||||||||||
Outstanding—beginning of year | 560 | $ | 17.46 | 349 | $ | 24.80 | 578 | $ | 16.70 | |||||||||||
Granted at fair value | 310 | 17.75 | 541 | 14.52 | 239 | 24.60 | ||||||||||||||
Vested | (212 | ) | 19.58 | (219 | ) | 22.57 | (377 | ) | 12.34 | |||||||||||
Forfeited | (118 | ) | 16.21 | (111 | ) | 16.52 | (91 | ) | 24.35 | |||||||||||
Outstanding—end of year | 540 | $ | 17.05 | 560 | $ | 17.46 | 349 | $ | 24.80 | |||||||||||
Medici Ventures stock options
In July 2017, the Board of Directors of Medici Ventures, our wholly-owned subsidiary, approved the Medici Ventures, Inc. Stock Option Plan, which provides for the grant of options to employees and directors of and consultants to Medici Ventures. Pursuant to the plan, the Board of Directors approved grants of 74,750 stock options to certain Medici Ventures and Overstock employees during the year ended December 31, 2017. The stock options are valued in total at $91,000 and subject to two vesting schedules, and compensation expense is recognized on a straight-line basis over the vesting schedules.
16. EMPLOYEE RETIREMENT PLAN
We have a 401(k) defined contribution plan which permits participating employees to defer a portion of their compensation, subject to limitations established by the Internal Revenue Code. During the years ended December 31, 2017, 2016 and 2015, employees who completed three months of service and are 21 years of age or older are qualified to participate in the plan which matches 100% of the first 6% of each participant's contributions to the plan subject to IRS limits. Matching contributions vest immediately. Participant contributions also vest immediately. Our matching contribution totaled $4.1 million, $3.8 million and $3.1 million for the years ended December 31, 2017, 2016 and 2015, respectively. We made no discretionary contributions to eligible participants for the years ended December 31, 2017, 2016 and 2015, respectively.
129
17. OTHER INCOME, NET
Other income, net consisted of the following (in thousands):
Years ended December 31, | ||||||||||||
2017 | 2016 | 2015 | ||||||||||
Gain on sale of cryptocurrencies | $ | 4,816 | $ | — | $ | — | ||||||
Club O Rewards and gift card breakage | 2,742 | 16,808 | 5,911 | |||||||||
Gain (loss) on investment in precious metals | 1,971 | 201 | (1,183 | ) | ||||||||
Ineffective portion loss of cash flow hedge | — | — | (124 | ) | ||||||||
Other | (400 | ) | 22 | (970 | ) | |||||||
Early extinguishment costs of long term debts | (2,464 | ) | — | — | ||||||||
Loss on impairment of cost method investments | (5,487 | ) | (2,850 | ) | — | |||||||
Total other income, net | $ | 1,178 | $ | 14,181 | $ | 3,634 | ||||||
18. INCOME TAXES
For financial reporting purposes, income (loss) before income taxes includes the following components (in thousands):
Years ended December 31, | ||||||||||||
2017 | 2016 | 2015 | ||||||||||
United States | $ | (48,039 | ) | $ | 20,974 | $ | 3,358 | |||||
Foreign | 305 | (429 | ) | (243 | ) | |||||||
Total income (loss) before income taxes | $ | (47,734 | ) | $ | 20,545 | $ | 3,115 | |||||
The provision for income taxes for 2017, 2016 and 2015 consists of the following (in thousands):
Years ended December 31, | ||||||||||||
2017 | 2016 | 2015 | ||||||||||
Current: | ||||||||||||
Federal | $ | 365 | $ | 280 | $ | 75 | ||||||
State | 280 | 1,264 | 293 | |||||||||
Foreign | 57 | 34 | 44 | |||||||||
Total current | 702 | 1,578 | 412 | |||||||||
Deferred: | ||||||||||||
Federal | 56,350 | 7,311 | 1,808 | |||||||||
State | 7,146 | 410 | (324 | ) | ||||||||
Foreign | (10 | ) | (2 | ) | (1 | ) | ||||||
Total deferred | 63,486 | 7,719 | 1,483 | |||||||||
Total provision for income taxes | $ | 64,188 | $ | 9,297 | $ | 1,895 | ||||||
The provision for income taxes for 2017, 2016 and 2015 differ from the amounts computed by applying the U.S. federal income tax rate of 35% to income (loss) before income taxes for the following reasons (in thousands):
130
Year ended December 31, | ||||||||||||
2017 | 2016 | 2015 | ||||||||||
U.S. federal income tax provision (benefit) at statutory rate | $ | (16,707 | ) | $ | 7,191 | $ | 1,091 | |||||
State income tax expense, net of federal benefit | (2,480 | ) | 1,232 | (134 | ) | |||||||
Research and development credit | (1,696 | ) | (1,078 | ) | (955 | ) | ||||||
Stock based compensation expense | 164 | 674 | (32 | ) | ||||||||
Lobbying expenses | 197 | 179 | 243 | |||||||||
Other | 384 | (69 | ) | (150 | ) | |||||||
Tax Cuts and Jobs Act | 25,287 | — | — | |||||||||
Change in valuation allowance | 59,039 | 1,168 | 1,832 | |||||||||
Total provision for income taxes | $ | 64,188 | $ | 9,297 | $ | 1,895 | ||||||
The components of our deferred tax assets and liabilities as of December 31, 2017 and 2016 are as follows (in thousands):
December 31, | ||||||||
2017 | 2016 | |||||||
Deferred tax assets: | ||||||||
Net operating loss carryforwards | $ | 29,350 | $ | 36,486 | ||||
Research and development tax credits | 12,653 | 9,832 | ||||||
Accrued expenses | 12,308 | 13,548 | ||||||
Fixed and intangible assets | 8,068 | 1,678 | ||||||
Reserves and other | 1,480 | 2,893 | ||||||
AMT and other tax credits | 220 | 1,827 | ||||||
Gross deferred tax assets | 64,079 | 66,264 | ||||||
Valuation allowance | (63,278 | ) | (4,239 | ) | ||||
Total deferred tax assets | 801 | 62,025 | ||||||
Deferred tax liabilities: | ||||||||
Prepaid expenses | (788 | ) | (1,408 | ) | ||||
Goodwill | (261 | ) | — | |||||
Fixed assets | — | (4,351 | ) | |||||
Total deferred tax liabilities | (1,049 | ) | (5,759 | ) | ||||
Total deferred tax assets (liabilities), net | $ | (248 | ) | $ | 56,266 | |||
At December 31, 2017, we had federal net operating loss carryforwards of approximately $117.2 million and state net operating loss carryforwards of approximately $113.7 million, which may be used to offset future taxable income. Our net operating losses expire at various dates between 2020 and 2037 if unused. In accordance with an Internal Revenue Code section 382 study completed during 2014, the NOL carryforwards indicated above are not limited in future periods.
At December 31, 2017, we had foreign net operating loss carryforwards related to our international operations of approximately $491,000 which have an indefinite life and approximately $932,000 which begin to expire in 2020 if unused.
At December 31, 2017, we had federal research credit carryforwards of approximately $13.1 million and state research credit carryforwards of approximately $6.2 million. These tax credits expire at various dates between 2021 and 2037 if unused.
On December 22, 2017, the President signed into law Public Law No. 115-97, commonly referred to as the Tax Cuts and Jobs Act ("TCJA"), following its passage by the United States Congress. The TCJA will make significant changes to U.S. federal income tax laws, mostly effective for tax years beginning after December 31, 2017. Among many other changes, the new law lowers the corporate tax rate from 35% to 21% for tax years beginning in 2018, transitions U.S international taxation from a worldwide tax system to a territorial system, and includes a one-time transition tax on the mandatory deemed repatriation of cumulative foreign earnings as of December 31, 2017. Staff Accounting Bulletin No. 118 ("SAB 118") was issued to address the application of US GAAP in situations when a registrant does not have the necessary information available,
131
prepared, or analyzed (including computations) in reasonable detail to complete the accounting for certain income tax effects of the TCJA. As of the date of this filing, we have not completed our accounting for the tax effects of the TCJA. In accordance with SAB 118, we have calculated our best estimate of the impact of the TCJA in our year end income tax provision in accordance with our understanding of the law and guidance available as of the date of this filing and as a result have recorded $25.3 million as additional income tax expense in the fourth quarter of 2017. The amount related to the remeasurement of certain deferred tax assets and liabilities, based on the rates at which they are expected to reverse in the future, was $25.2 million. Although the tax rate reduction is known, our analysis may also be affected by other analyses related to the TCJA, including, but not limited to, our calculation of the mandatory deemed repatriation of cumulative foreign earnings and the state tax effect of adjustments made to federal temporary differences, which are uncertain at this time. The provisional amount related to the one-time transition tax on the mandatory deemed repatriation of cumulative foreign earnings was $41,000. The net charge is subject to revisions as we complete our analysis of the TCJA, collect and prepare necessary data, and interpret any additional guidance issued by the U.S. Treasury Department, Internal Revenue Service (“IRS”), FASB, and other standard-setting and regulatory bodies. Any subsequent adjustment to these amounts will be recorded to tax expense in the quarter when the analysis is complete. Our accounting for the tax effects of the TCJA will be completed during the measurement period, which should not extend beyond one year from the enactment date.
The TCJA includes a provision to tax global intangible low-taxed income (“GILTI”) of foreign subsidiaries in excess of a deemed return on tangible assets of foreign corporations beginning in 2018. Under GAAP, we can make an accounting policy election to either treat taxes due on the GILTI inclusion as a current period expense, or factor such amounts into our measurement of deferred taxes. Due to the complexity of the new GILTI tax rules, we are continuing to evaluate this provision of the TCJA and the application of GAAP and we have not yet elected an accounting policy.
We assess available positive and negative evidence to estimate whether we will generate sufficient future taxable income to use our existing deferred tax assets. We have no carryback ability and do not expect significant future reversals of taxable temporary differences to recover our existing deferred tax assets, therefore we must rely on future taxable income, including tax planning strategies, to support their realizability. We have concluded based on all available evidence that it is more likely than not that our deferred tax assets as of December 31, 2017 will not be realized in the future. Therefore, it is appropriate to record a valuation allowance against our deferred tax assets, net of deferred tax liabilities related to assets with a definite reversal period and we increased our existing valuation allowance by $59.0 million for a total valuation allowance of $63.3 million. In reaching these conclusions we considered, among other things, three significant pieces of negative evidence that occurred during the quarter ended December 31, 2017. First, a significant piece of objective negative evidence evaluated was the cumulative loss incurred over the three-year period ended December 31, 2017. We expect the trends that contributed to the loss to continue. Such objective evidence limits the ability to consider other subjective evidence, such as projections for future taxable income, if any. Second, during the quarter ended December 31, 2017, forecasts for future years were significantly revised. We are projecting significant pretax operating losses over the next several years and it is uncertain when we will return to profitability. While forecasts of future years are a more subjective piece of evidence, these forecasted losses in the near-term are further negative evidence that we will not have sufficient future taxable income to use our existing deferred tax assets. Third, we have certain tax planning strategies that we intended to implement to accelerate taxable income into earlier periods in order to utilize loss carryforwards and tax credits prior to expiration. While these tax planning strategies previously would have been sufficient to utilize most of our deferred tax assets in periods of low pretax income, these tax planning strategies will not be sufficient to utilize deferred tax assets in periods where we generate significant pretax losses, such as our current year operating results or our newly revised projections for future years. Additionally, one of our tax planning strategies was significantly impacted and reduced in application due to the TCJA, enacted on December 22, 2017. Therefore, we no longer have prudent and feasible tax planning strategies to support the realizability of deferred tax assets. We intend to continue maintaining a valuation allowance on our net deferred tax assets until there is sufficient evidence to support the reversal of all or some portion of these allowances. The amount of the deferred tax asset considered realizable could be adjusted if objective negative evidence in the form of cumulative losses is no longer present and additional weight may be given to subjective evidence such as long-term projections for growth.
A reconciliation of the beginning and ending unrecognized tax benefits, excluding interest and penalties, as of December 31, 2017, 2016 and 2015 is as follows (in thousands):
132
Year ended December 31, | ||||||||||||
2017 | 2016 | 2015 | ||||||||||
Beginning balance | $ | 7,333 | $ | 4,753 | $ | 4,128 | ||||||
Additions for tax positions related to the current year | 881 | 1,112 | 751 | |||||||||
Additions (reductions) for tax positions taken in prior years | 230 | 1,468 | (126 | ) | ||||||||
Reduction for tax positions settled by utilizing tax attributes | (1,480 | ) | — | — | ||||||||
Ending balance | $ | 6,964 | $ | 7,333 | $ | 4,753 | ||||||
Included in the balance of unrecognized tax benefits as of December 31, 2017, 2016 and 2015, are approximately $7.0 million, $5.9 million, and $4.8 million, respectively, of tax benefits that, if recognized, would affect the effective tax rate. Also included in the balance of unrecognized tax benefits as of December 31, 2017, 2016 and 2015, are approximately $0, $1.5 million, and $0, respectively, of tax benefits that, if recognized, would result in adjustments to other tax accounts, primarily deferred taxes. At December 31, 2016 we believed that it was reasonably possible that a decrease of up to $1.5 million in unrecognized tax benefits related to marketing deductions would occur upon settlement with tax authorities within the next 12 months. During the year ended December 31, 2017 those unrecognized tax benefits were settled by using tax attributes as illustrated in the table above.
Accrued interest and penalties on unrecognized tax benefits as of December 31, 2017 and 2016 were $492,000 and $345,000, respectively.
We are subject to taxation in the United States and various state and foreign jurisdictions. Tax years beginning in 2013 are subject to examination by taxing authorities, although net operating loss and credit carryforwards from all years are subject to examinations and adjustments for at least three years following the year in which the attributes are used. We are currently under audit in Ireland for the 2016 tax year. The IRS concluded an audit of our 2015 federal income tax return in 2017 with no changes to the return.
We have indefinitely reinvested foreign earnings of $1.3 million at December 31, 2017. The TCJA includes a mandatory deemed repatriation of cumulative foreign earnings for the year ended December 31, 2017, for which we accrued provisional tax expense. However, we would still need to accrue and pay various other taxes on this amount if repatriated. We are currently analyzing our global working capital and cash requirements and the potential tax liabilities attributable to a repatriation, including calculating any excess of the amount for financial reporting over the tax basis in our foreign subsidiaries, but we have yet to determine whether we plan to change our prior assertion and repatriate earnings. Accordingly, we have not recorded any deferred taxes attributable to our investments in our foreign subsidiaries. We will record the tax effects of any change in our prior assertion in the period that we complete our analysis and are able to make a reasonable estimate, and disclose any unrecognized deferred tax liability for temporary differences related to our foreign investments, if practicable, in the period that we are first able to make a reasonable estimate, no later than December 2018.
19. RELATED PARTY TRANSACTIONS
On occasion, Haverford-Valley, L.C. (an entity owned by our Chief Executive Officer, Dr. Patrick Byrne) and certain affiliated entities make travel arrangements for our executives and pay the travel related expenses incurred by our executives on company business. During the years ended December 31, 2017, 2016 and 2015, we reimbursed Haverford-Valley L.C. $601,000, $703,000, and $423,000, respectively, for these expenses.
In November 2017, our subsidiary O.com Land, borrowed $40.0 million from PCL L.L.C., an entity owned by the brother and mother of Dr. Patrick Byrne. We have guaranteed the loan, and it is secured by our corporate headquarters, the land on which it is located and certain fixtures and personal property related to the property. In connection with the loan, O.com Land entered into an environmental indemnity agreement in favor of PCL L.L.C. The loan is subject to mandatory prepayment under certain circumstances.
In November 2016, we entered into a Software Licensing Agreement with SiteHelix Inc. (the "SiteHelix Agreement"). Saum Noursalehi, our President, Retail, is the majority owner of SiteHelix. Pursuant to the SiteHelix Agreement, SiteHelix granted a non-exclusive, non-transferrable license to its proprietary software to us. The software is intended to improve customer conversion rates on our website. Pursuant to the SiteHelix Agreement, we will pay SiteHelix 20% of an amount, if any, intended to reflect the economic benefit of the software to us, as calculated by us. Either party may terminate the SiteHelix Agreement on 30 days' notice to the other party. In addition to this and other termination rights, we may terminate the SiteHelix
133
Agreement immediately at any time if we determine that we can obtain substantially the same services from an unrelated person or entity at a lower cost, or better services from an unrelated person or entity for substantially the same cost. During 2017, we have made payments to SiteHelix totaling approximately $31,000.
In February 2018, we also purchased the assets of Rental Roost and Houserie, companies in which our Senior Vice President Vikram Raghavan is a shareholder, for a combined purchase price of $600,000, and in January 2018, Medici Ventures purchased an interest in Bitsy, Inc., a startup company founded and one-third owned by Medici Ventures' chief operating officer and general counsel, for $1.0 million.
20. BROKER DEALERS
As part of our Medici blockchain and fintech technology initiatives, we hold a controlling interest in each of two broker dealers, SpeedRoute LLC ("SpeedRoute") and PRO Securities LLC ("PRO Securities"), which we acquired in January 2016 (see Note 3—Acquisitions, Goodwill, and Acquired Intangible Assets).
SpeedRoute is an electronic, agency-only FINRA-registered broker dealer that provides connectivity for its customers to U.S. equity exchanges as well as off-exchange sources of liquidity such as dark pools. All of SpeedRoute's customers are registered broker dealers. SpeedRoute does not hold, own or sell securities.
PRO Securities is a FINRA-registered broker dealer that owns and operates the PRO Securities alternative trading system ("ATS"), which is registered with the SEC. An ATS is a trading system that is not regulated as an exchange, but is a licensed venue for matching buy and sell orders. The PRO Securities ATS is a closed system available only to its broker dealer subscribers. PRO Securities does not accept orders from non-broker dealers, nor does it hold, own or sell securities.
SpeedRoute and PRO Securities are subject to the SEC's Uniform Net Capital Rule (SEC Rule 15c3-1), which requires the maintenance of minimum net capital and requires that the ratio of aggregate indebtedness to net capital, both as defined, shall not exceed 15 to 1 and that equity capital may not be withdrawn or cash dividends paid if the resulting net capital ratio would exceed 10 to 1. At December 31, 2017, SpeedRoute had net capital of $334,848, which was $233,485 in excess of its required net capital of $101,363 and SpeedRoute's net capital ratio was 4.5 to 1. At December 31, 2017, PRO Securities had net capital of $24,175, which was $19,175 in excess of its required net capital of $5,000 and PRO Securities net capital ratio was 1.3 to 1. At December 31, 2016, SpeedRoute had net capital of $430,260, which was $304,536 in excess of its required net capital of $125,724 and SpeedRoute's net capital ratio was 4.4 to 1. At December 31, 2016, PRO Securities had net capital of $24,141, which was $19,141 in excess of its required net capital of $5,000 and PRO Securities net capital ratio was 0.92 to 1.
SpeedRoute and PRO Securities did not have any securities owned or securities sold, not yet purchased at December 31, 2017 and 2016.
21. BUSINESS SEGMENTS
Segment information has been prepared in accordance with ASC Topic 280 Segment Reporting. We determined our segments based on how we manage our business, which, in our view, consists primarily of our Retail and Medici businesses. Our Retail business consists of our Direct and Partner reportable segments. We use gross profit as the measure to determine our reportable segments because there is not discrete financial information available below gross profit for our Direct and Partner segments. As a result, our Medici business is not significant as compared to our Direct and Partner segments and is included in Other. Our Other segment consists of Medici. Although our Direct and Partner segments both relate to our Retail business, we do not combine these segments because they have dissimilar economic characteristics, such as gross profit margins. We do not allocate assets between our segments for our internal management purposes, and as such, they are not presented here. There were no significant inter-segment sales or transfers during the years ended December 31, 2017, 2016 and 2015.
134
The following table summarizes information about reportable segments for the years ended December 31, 2017, 2016 and 2015 (in thousands):
Year ended December 31, | |||||||||||||||||||
Direct | Partner | Retail Total | Other | Total | |||||||||||||||
2017 | |||||||||||||||||||
Revenue, net | $ | 83,052 | $ | 1,645,052 | $ | 1,728,104 | $ | 16,652 | $ | 1,744,756 | |||||||||
Cost of goods sold | 80,585 | 1,311,973 | 1,392,558 | 11,647 | 1,404,205 | ||||||||||||||
Gross profit | $ | 2,467 | $ | 333,079 | $ | 335,546 | $ | 5,005 | $ | 340,551 | |||||||||
Operating expenses | 365,648 | 21,537 | 387,185 | ||||||||||||||||
Interest and other income (expense), net (1) | 4,680 | (5,780 | ) | (1,100 | ) | ||||||||||||||
Pre-tax loss | (25,422 | ) | (22,312 | ) | (47,734 | ) | |||||||||||||
Provision (benefit) for income taxes | 66,128 | (1,940 | ) | 64,188 | |||||||||||||||
Net loss (2) (3) (4) | $ | (91,550 | ) | $ | (20,372 | ) | $ | (111,922 | ) | ||||||||||
2016 | |||||||||||||||||||
Revenue, net | $ | 101,578 | $ | 1,683,204 | $ | 1,784,782 | $ | 15,181 | $ | 1,799,963 | |||||||||
Cost of goods sold | 96,271 | 1,362,140 | 1,458,411 | 10,203 | 1,468,614 | ||||||||||||||
Gross profit | $ | 5,307 | $ | 321,064 | $ | 326,371 | $ | 4,978 | $ | 331,349 | |||||||||
Operating expenses | 307,669 | 16,765 | 324,434 | ||||||||||||||||
Interest and other income, net (1) | 13,630 | — | 13,630 | ||||||||||||||||
Pre-tax income (loss) | 32,332 | (11,787 | ) | 20,545 | |||||||||||||||
Provision (benefit) for income taxes | 13,797 | (4,500 | ) | 9,297 | |||||||||||||||
Net income (loss) (2) (3) (4) | $ | 18,535 | $ | (7,287 | ) | $ | 11,248 | ||||||||||||
2015 | |||||||||||||||||||
Revenue, net | $ | 137,783 | $ | 1,518,125 | $ | 1,655,908 | $ | 1,930 | $ | 1,657,838 | |||||||||
Cost of goods sold | 128,077 | 1,225,107 | 1,353,184 | — | 1,353,184 | ||||||||||||||
Gross profit | $ | 9,706 | $ | 293,018 | $ | 302,724 | $ | 1,930 | $ | 304,654 | |||||||||
Operating expenses | 296,281 | 8,907 | 305,188 | ||||||||||||||||
Interest and other income, net (1) | 3,649 | — | 3,649 | ||||||||||||||||
Pre-tax income (loss) | 10,092 | (6,977 | ) | 3,115 | |||||||||||||||
Provision (benefit) for income taxes | 3,448 | (1,553 | ) | 1,895 | |||||||||||||||
Net income (loss) (2) (3) (4) | $ | 6,644 | $ | (5,424 | ) | $ | 1,220 | ||||||||||||
___________________________________________
(1) | — The above amounts exclude intercompany transactions eliminated in consolidation, which consist primarily of service fees and interest. The net amounts of these intercompany transactions were $2.0 million, $594,000, and $158,000 for the years ended December 31, 2017, 2016 and 2015, respectively. |
(2) | — Net income (loss) presented for segment reporting purposes is before any adjustments attributable to noncontrolling interests. |
(3) | — The above amounts include Retail depreciation and amortization expense of $27.8 million, $26.9 million and $23.6 million for the years ended December 31, 2017, 2016 and 2015, respectively. |
(4) | — The above amounts include Other depreciation and amortization expense of $5.0 million, $4.4 million and $1.5 million for the years ended December 31, 2017, 2016 and 2015, respectively. |
Our Direct segment includes revenues, direct costs, and cost allocations associated with sales of inventory we own. Costs for this segment include product costs, freight, warehousing and fulfillment costs, credit card fees and customer service costs.
Our Partner segment includes revenues, direct costs and cost allocations associated with sales of inventory sourced through our partners. Costs for this segment include product costs, outbound freight and fulfillment costs, credit card fees and customer service costs.
135
For the years ended December 31, 2017, 2016 and 2015, substantially all our sales revenues were attributable to customers in the United States. At December 31, 2017 and 2016, substantially all our fixed assets were located in the United States.
22. SUBSEQUENT EVENTS
Security token offering
On December 18, 2017, tZERO launched an offering (the "security token offering") of the right to acquire, if issued by tZERO in the future, tZERO Preferred Equity Tokens (the "tZERO Security Token") through a Simple Agreement for Future Equity ("SAFE"). The security token offering is expected to run through May 14, 2018 but may be extended or shortened and is subject to withdrawal rights under certain circumstances. As of March 14, 2018, tZERO has received $91.4 million in proceeds, net of requested withdrawals.
tZERO issuance of equity awards
In December 2017, tZERO’s Board of Directors approved an equity incentive plan for tZERO pursuant to which it may grant compensatory options to acquire up to 5% of tZERO’s common stock. In January 2018, tZERO granted restricted stock units under the equity incentive plan for an aggregate of approximately 1.0% of tZERO’s common stock, net of shares withheld to satisfy minimum tax withholdings, all of which vested on January 23, 2018. In January 2018, tZERO recognized $4.0 million in compensation expense associated with these awards based on their estimated fair value at the grant date. As a result of these vested awards, our ownership interest in tZERO will be reduced from 81% to 80%.
Collaboration with Hernando de Soto
In January 2018, we jointly formed DeSoto Inc. (“DeSoto”), which is a public benefit corporation that will carry out our collaboration efforts with economist Hernando de Soto. DeSoto intends to build systems using blockchain, social media, artificial intelligence, and mobile apps to help develop more effective records of ownership in developing countries. DeSoto is owned 50% by Medici Ventures, 33% by Mr. de Soto, and 17% by our Chief Executive Officer, Patrick Byrne. During the first quarter of 2018, we have contributed $10.0 million to help launch the project and expect to contribute an additional $4.0 million before the end of the first quarter of 2018. Dr. Byrne personally plans to contribute $14.0 million to help launch the project, and he will receive a 17% ownership interest in DeSoto. Mr. de Soto will serve as Chairman of DeSoto and as a director of Medici Ventures, and Dr. Byrne will serve as Co-Chairman and Chief Executive Officer of DeSoto, in addition to his positions with Overstock and Medici Ventures.
StockCross Financial Services, Inc., Siebert Financial Corp. and Kennedy Cabot Acquisition, LLC
On January 31, 2018, tZERO entered into a Common Stock Purchase Agreement by and among the Company, certain holders of common stock of Siebert Financial Corp. (“Siebert”) and StockCross Financial Services, Inc. (“StockCross”), an affiliate of Siebert, pursuant to which tZERO received 1,476,600 shares of StockCross common stock, or 24% of the total outstanding shares, and 1,217,295 shares of Siebert common stock, or 4.5% of the total outstanding shares, for an aggregate purchase price of $12.0 million. On the same day, tZERO entered into a Securities Purchase Agreement with Kennedy Cabot Acquisition (“Kennedy”), the majority shareholder of Siebert, pursuant to which tZERO received 100 member units of Kennedy, or 1% of the total outstanding member units, and 70,000 shares of Siebert common stock, or 0.3% of the total outstanding shares, for an aggregate purchase price of $1.0 million. Siebert is a public holding company that, among other things, conducts a retail discount brokerage business through its wholly-owned subsidiary, Muriel Siebert & Co., Inc. (“Muriel Siebert & Co.”). All of the shares and interests purchased are subject to legal and/or contractual restrictions on transfer and, under certain circumstances, a right of StockCross to repurchase the 24% interest in StockCross and 1,217,295 shares of Siebert at tZERO’s purchase price.
On February 16, 2018, Siebert distributed an additional 90,000 shares to tZERO. Following this distribution, tZERO holds approximately 5.1% of the total outstanding shares of Siebert common stock.
In conjunction with the above agreements, tZERO also signed a Financial Services Advertising Agreement by and among tZERO, SpeedRoute and Muriel Siebert & Co. to offer discounted online trading of U.S. equities to customers accessing Muriel Siebert & Co. through the Overstock.com website’s FinanceHub.
136
Verify Investors, LLC
On February 12, 2018, tZERO entered into a purchase agreement by and among tZERO, Verify Investor, LLC and Jor L. Law, as representative of the several sellers of membership interests in Verify Investor, LLC, in which tZERO purchased 81.0% of Verify Investor, LLC, an accredited investor verification company, for $12.0 million in cash.
ES Capital Advisors, LLC
On January 31, 2018, tZERO entered into a stock purchase agreement by and among the Company, David J. Morton (“Morton”) and PLG Consulting pursuant to which tZERO purchased an additional 2,250 membership units of ES Capital Advisors, LLC, (“ES Capital”), a registered investment advisor under the Investment Advisers Act of 1940, from each of PLG Consulting and Morton, who serves as the manager of ES Capital, for an aggregate purchase price of approximately $3.0 million. Following the additional purchase, tZERO beneficial ownership in the entity will increase from 51% to 65.8% of the membership units of ES Capital. tZERO operates the ES Capital business under the name tZERO Advisors and offers automated investment advisory services through the Overstock.com website’s FinanceHub.
Weeden Prime Services, LLC
On February 6, 2018, tZERO entered into a Letter of Intent (the "WPS LOI") with Weeden Prime Services, LLC ("WPS"), a U.S. registered broker-dealer. The WPS LOI contemplates that tZERO will acquire 51% of the outstanding membership interests of WPS for $11.0 million in cash with a subsequent purchase, prior to the first anniversary of the initial purchase, of an additional 30% of the aggregate membership interests of WPS for an additional $7.0 million in cash. Following the subsequent purchase, tZERO will own 81% of the then-outstanding membership units of WPS. The WPS LOI contemplates that the existing members of WPS shall retain certain minority investor rights, including with respect to representation on the board of managers of WPS (proportionate to ownership) and customary drag-along and tag-along rights and anti-dilution protections. The WPS LOI also contemplates that at any time following the first anniversary of the second closing, tZERO may, with 60-days' written notice, acquire all (but not less than all) of the outstanding membership units of WPS not then owned by tZERO at fair market value. tZERO expects the transaction to close during the third quarter of 2018, subject to the execution of definitive documentation, any applicable regulatory approvals and customary closing conditions.
Other matters regarding tZERO
On January 16, 2018, tZERO announced its intent to provide advisory services to WENN Digital ("WENN") in connection with its previously announced KodakCoin Security Token (the "KodakCoin") offering which was initially expected to launch in the first quarter of 2018. To date, tZERO has not provided advisory services to WENN with respect to KodakCoin, and there can be no assurance that tZERO will do so.
23. QUARTERLY RESULTS OF OPERATIONS (unaudited)
The following tables set forth our unaudited quarterly results of operations data for the eight most recent quarters for the period ended December 31, 2017. We have prepared this information on the same basis as the consolidated statements of operations and the information includes all adjustments that we consider necessary for a fair statement of its financial position and operating results for the quarters presented.
137
Three Months Ended | ||||||||||||||||
March 31, 2017 | June 30, 2017 | September 30, 2017 | December 31, 2017 | |||||||||||||
(in thousands, except per share data) | ||||||||||||||||
Consolidated Statement of Operations Data: | ||||||||||||||||
Revenue, net | ||||||||||||||||
Direct | $ | 22,828 | $ | 22,099 | $ | 19,645 | $ | 18,480 | ||||||||
Partner and other | 409,607 | 409,925 | 404,362 | 437,810 | ||||||||||||
Total net revenue | 432,435 | 432,024 | 424,007 | 456,290 | ||||||||||||
Cost of goods sold | ||||||||||||||||
Direct | 20,963 | 21,147 | 19,577 | 18,898 | ||||||||||||
Partner and other | 324,565 | 326,706 | 320,755 | 351,594 | ||||||||||||
Total cost of goods sold | 345,528 | 347,853 | 340,332 | 370,492 | ||||||||||||
Gross profit | 86,907 | 84,171 | 83,675 | 85,798 | ||||||||||||
Operating expenses: | ||||||||||||||||
Sales and marketing | 37,618 | 43,297 | 45,153 | 54,521 | ||||||||||||
Technology | 28,992 | 28,244 | 28,746 | 29,896 | ||||||||||||
General and administrative | 22,610 | 22,361 | 21,651 | 24,096 | ||||||||||||
Total operating expenses | 89,220 | 93,902 | 95,550 | 108,513 | ||||||||||||
Operating loss | (2,313 | ) | (9,731 | ) | (11,875 | ) | (22,715 | ) | ||||||||
Interest income | 125 | 136 | 189 | 209 | ||||||||||||
Interest expense | (710 | ) | (716 | ) | (713 | ) | (798 | ) | ||||||||
Other income (expense), net | (3,724 | ) | 593 | 5,882 | (1,573 | ) | ||||||||||
Net loss before income taxes | (6,622 | ) | (9,718 | ) | (6,517 | ) | (24,877 | ) | ||||||||
Provision (benefit) for income taxes | (340 | ) | (1,975 | ) | (5,412 | ) | 71,915 | |||||||||
Consolidated net loss | (6,282 | ) | (7,743 | ) | (1,105 | ) | (96,792 | ) | ||||||||
Less: Net loss attributable to noncontrolling interests | (379 | ) | (244 | ) | (319 | ) | (1,102 | ) | ||||||||
Net loss attributable to stockholders of Overstock.com, Inc. | $ | (5,903 | ) | $ | (7,499 | ) | $ | (786 | ) | $ | (95,690 | ) | ||||
Net loss per common share—basic: | ||||||||||||||||
Net loss attributable to common shares—basic | $ | (0.23 | ) | $ | (0.29 | ) | $ | (0.03 | ) | $ | (3.72 | ) | ||||
Weighted average common shares outstanding—basic | 25,290 | 24,996 | 25,003 | 25,103 | ||||||||||||
Net loss per common share—diluted: | ||||||||||||||||
Net loss attributable to common shares—diluted | $ | (0.23 | ) | $ | (0.29 | ) | $ | (0.03 | ) | $ | (3.72 | ) | ||||
Weighted average common shares outstanding—diluted | 25,290 | 24,996 | 25,003 | 25,103 | ||||||||||||
138
Three Months Ended | ||||||||||||||||
March 31, 2016 | June 30, 2016 | September 30, 2016 | December 31, 2016 | |||||||||||||
(in thousands, except per share data) | ||||||||||||||||
Consolidated Statement of Operations Data: | ||||||||||||||||
Revenue, net | ||||||||||||||||
Direct | $ | 26,651 | $ | 24,630 | $ | 24,620 | $ | 25,677 | ||||||||
Partner and other | 387,026 | 393,910 | 416,944 | 500,505 | ||||||||||||
Total net revenue | 413,677 | 418,540 | 441,564 | 526,182 | ||||||||||||
Cost of goods sold | ||||||||||||||||
Direct | 25,406 | 23,098 | 23,955 | 23,812 | ||||||||||||
Partner and other | 310,964 | 319,120 | 337,893 | 404,366 | ||||||||||||
Total cost of goods sold | 336,370 | 342,218 | 361,848 | 428,178 | ||||||||||||
Gross profit | 77,307 | 76,322 | 79,716 | 98,004 | ||||||||||||
Operating expenses: | ||||||||||||||||
Sales and marketing | 31,456 | 33,353 | 34,707 | 48,380 | ||||||||||||
Technology | 25,710 | 25,800 | 26,739 | 28,511 | ||||||||||||
General and administrative | 21,848 | 22,678 | 23,317 | 21,455 | ||||||||||||
Litigation settlement | (19,520 | ) | — | — | — | |||||||||||
Total operating expenses | 59,494 | 81,831 | 84,763 | 98,346 | ||||||||||||
Operating income (loss) | 17,813 | (5,509 | ) | (5,047 | ) | (342 | ) | |||||||||
Interest income | 91 | 64 | 73 | 98 | ||||||||||||
Interest expense | (2 | ) | (5 | ) | (212 | ) | (658 | ) | ||||||||
Other income, net | 4,156 | 3,992 | 1,251 | 4,782 | ||||||||||||
Net income (loss) before income taxes | 22,058 | (1,458 | ) | (3,935 | ) | 3,880 | ||||||||||
Provision (benefit) for income taxes | 8,964 | (243 | ) | (543 | ) | 1,119 | ||||||||||
Consolidated net income (loss) | 13,094 | (1,215 | ) | (3,392 | ) | 2,761 | ||||||||||
Less: Net loss attributable to noncontrolling interests | (335 | ) | (311 | ) | (294 | ) | (334 | ) | ||||||||
Net income (loss) attributable to stockholders of Overstock.com, Inc. | $ | 13,429 | $ | (904 | ) | $ | (3,098 | ) | $ | 3,095 | ||||||
Net income (loss) per common share—basic: | ||||||||||||||||
Net income (loss) per share—basic | $ | 0.53 | $ | (0.04 | ) | $ | (0.12 | ) | $ | 0.12 | ||||||
Weighted average common shares outstanding—basic | 25,280 | 25,341 | 25,356 | 25,391 | ||||||||||||
Net income (loss) per common share—diluted: | ||||||||||||||||
Net income (loss) per share—diluted | $ | 0.53 | $ | (0.04 | ) | $ | (0.12 | ) | $ | 0.12 | ||||||
Weighted average common shares outstanding—diluted | 25,290 | 25,341 | 25,356 | 25,540 | ||||||||||||
139
Schedule II
Valuation and Qualifying Accounts
(in thousands)
Balance at Beginning of Year | Charged to Expense | Deductions | Balance at End of Year | |||||||||||||
Year ended December 31, 2017 | ||||||||||||||||
Deferred tax valuation allowance | $ | 4,239 | $ | 59,039 | $ | — | $ | 63,278 | ||||||||
Allowance for sales returns | 18,176 | 169,398 | 170,183 | 17,391 | ||||||||||||
Allowance for doubtful accounts | 1,999 | 309 | 1,055 | 1,253 | ||||||||||||
Year ended December 31, 2016 | ||||||||||||||||
Deferred tax valuation allowance | $ | 3,071 | $ | 1,168 | $ | — | $ | 4,239 | ||||||||
Allowance for sales returns | 17,896 | 163,693 | 163,413 | 18,176 | ||||||||||||
Allowance for doubtful accounts | 465 | 1,608 | 74 | 1,999 | ||||||||||||
Year ended December 31, 2015 | ||||||||||||||||
Deferred tax valuation allowance | $ | 1,000 | $ | 2,071 | (1) | $ | — | $ | 3,071 | |||||||
Allowance for sales returns | 15,531 | 142,887 | 140,522 | 17,896 | ||||||||||||
Allowance for doubtful accounts | 511 | 217 | 263 | 465 | ||||||||||||
___________________________________________
(1) | The amount charged to expense for the year ended December 31, 2015 includes a foreign deferred tax valuation allowance recognized as part of an acquisition as described in Note 3—Acquisitions, Goodwill and Acquired Intangible Assets. The allowance was included as an adjustment to goodwill. |
140