Attached files
| file | filename |
|---|---|
| 8-K - FORM 8-K - MERGE HEALTHCARE INC | c57327e8vk.htm |
| EX-99.2 - EX-99.2 - MERGE HEALTHCARE INC | c57327exv99w2.htm |
Exhibit
99.1

| 1 Merge Healthcare Incorporated Information associated with the proposed AMICAS acquisition April 2010 |
| 3 Safe Harbor Actual results may differ materially from those indicated by these forward- looking statements as a result of various factors, including those discussed in the Company's offering memorandum, which is available to qualified institutional buyers from Merge Healthcare Incorporated. These factors should be considered carefully and undue reliance should not be placed on these forward-looking statements. We cannot ensure that actual results will not be materially different from those expressed or implied by these forward-looking statements. In addition, any forward-looking statements represent our estimates only as of today and should not be relied upon as representing our estimates as of any subsequent date. While we may elect to update forward-looking statements at some point in the future, we specifically disclaim any obligation to do so, even if our estimates change. |

| 5 Strong Combination Large direct and indirect customer base A leading provider of RIS / PACS in North America Ability to sell AMICAS and Merge solutions across combined complementary customer base and footprint Combination of two well-established brands Significant potential cost savings |

| 7 Revenue Breakdown 2009: $67MM 7 Merge Healthcare Merge is a health information technology company Focused on developing solutions that automate healthcare data and diagnostic workflow Established global customer footprint Hundreds of hospital and outpatient imaging center sites Majority of global OEM companies Some of the top 10 pharmaceutical companies Major Products Radiology RIS/PACS with CAD Development toolkits and technologies for vendors Clinical trials management solutions Competitive Advantages History of technology leadership; 40+ patents granted Global reach Diversified business model (geography, channel) Brand Leadership Experienced management team with successful acquisition integration and synergy achievement track record Service & Maintenance Software & Other 27561 Service and Maint 29174 Software & Other United States Europe Japan Canada 2% Other Direct 0.5 Indirect 0.5 Direct (End-User Solutions) Indirect (OEM, VAR Solutions) United States 0.77 Europe 0.11 Japan 0.05 Canada 0.02 Other 0.05 |

| 9 9 Merge Company History Quarterly Revenue & EBITDA (1) $MM Revenue EBITDA Company Timeline 1987 Company Established 1987 2010 1995 IPO 2002 Acquired eFilm 2003 Acquired RIS Logic 2005 Acquired Cedara May 2008 Strategic Alternatives Review: Sell the company Sell a division Take on investment Jun 2008 Merrick Ventures invested $20 million into Merge Entire senior management team replaced Installed proven management team (Click Commerce) 3Q2008 Established profitability Nov 2008 Settled shareholder litigation Jan 2009 Retained China operations Jul 2009 Acquired etrials Worldwide Sep 2009 Acquired Confirma Mar 2010 Announced acquisition of AMICAS Nov 2009 Registered Direct Offering Note: (1) Revenue and EBITDA reflect deferred revenue purchase accounting adjustment |

| 11 Direct 0.1 11 AMICAS Software Licenses & System Sales Maintenance & Services Revenue Breakdown 2009: $89MM AMICAS is an independent provider of radiology and medical imaging IT solutions in the U.S. Strong brand recognition and customer base Hundreds of hospital and outpatient imaging center sites Major products Radiology: RIS/PACS, Revenue Cycle Management Cardiology: CVIS/PACS Enterprise Content Management Competitive Advantages Full-service and integrated revenue cycle management capabilities Specialized cardiology CVIS PACS (recent acquisition of Emageon) Above industry average R&D investment Solid brand leadership Highly valued vendor by customers North America Maintenance & Services 72022 Software Licenses & System Sales 17120 United States 100 Direct (End-User Solutions) |
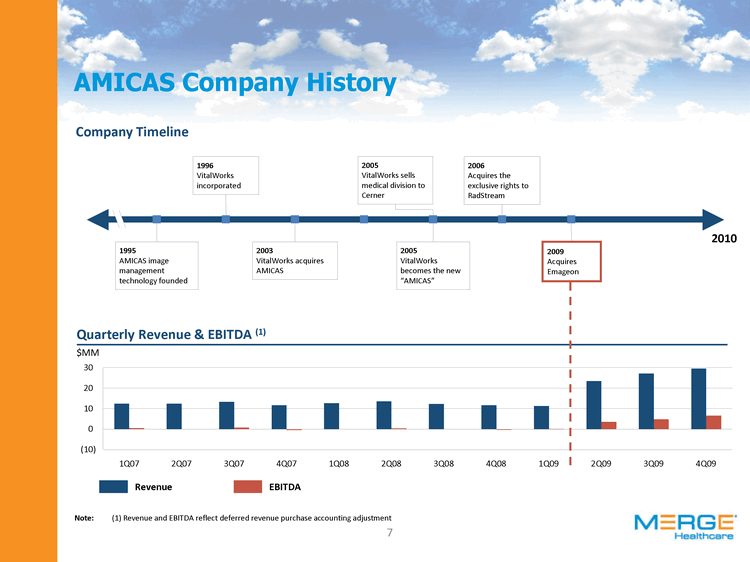
| 13 13 AMICAS Company History Quarterly Revenue & EBITDA (1) $MM 2010 1995 AMICAS image management technology founded 2003 VitalWorks acquires AMICAS 2005 VitalWorks sells medical division to Cerner 2005 VitalWorks becomes the new "AMICAS" 2006 Acquires the exclusive rights to RadStream 2009 Acquires Emageon 1996 VitalWorks incorporated Company Timeline Revenue EBITDA Note: (1) Revenue and EBITDA reflect deferred revenue purchase accounting adjustment |

| 15 Merger Potential Attractive market characteristics with sustainable long-term growth Leading healthcare IT solution provider with substantial install base Diversified customer base and business model Strong Financials Potential synergy achievement Proven and experienced management team with long history of successful acquisitions Blue chip equity sponsorship |

| 17 17 Attractive Market - Overall Growth Sustainable, long-term growth in imaging volumes Improved diagnostic capabilities and efficiencies Increasing clinical applications Adoption and availability of imaging technology driving increased use Innovation and pricing provide for proliferation of imaging technology Digitization of the Healthcare System Portability and mobility of health records will necessitate transition to digital modalities Electronic diagnostic image ordering and viewing tie- in to "meaningful use" designation in 2013 Reimbursement pressures aimed at moderating rather than stopping growth Imaging has a proven value proposition to the delivery of high-quality, lower cost care Potential positive impact on volume growth Broader health insurance coverage U.S. demographic trends Accumulated Procedure Volumes on Hospital PACS Archives Additional Hospital Annual Procedures '05 473 191 '06 665 222 '07 857 252 '08 1047 284 '09E 1237 313 '10E 1419 341 '11E 1603 371 '12E 1783 404 '13E 1964 438 '14E 2149 474 '15E 2340 512 Imaging Procedure Volume (MM) Annual North America Hospital Imaging Procedure Volumes (1) Source: Frost and Sullivan Note: (1) All figures are rounded; the base year is 2008 (2) Assumes 7-year retention period for imaging procedures Accum. Imaging Procedure Volume on Hospital PACS Archives (2) Additional Hospital Annual Imaging Procedures |
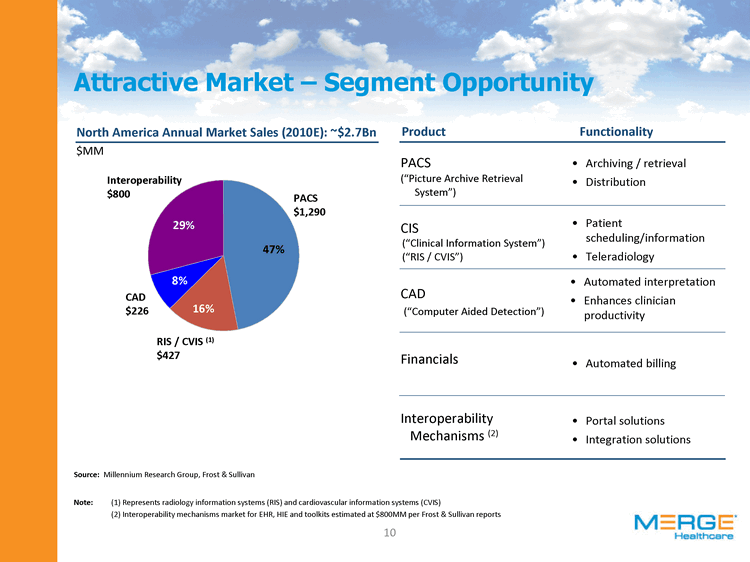
| Note: (1) Represents radiology information systems (RIS) and cardiovascular information systems (CVIS) (2) Interoperability mechanisms market for EHR, HIE and toolkits estimated at $800MM per Frost & Sullivan reports 19 Attractive Market - Segment Opportunity North America Annual Market Sales (2010E): ~$2.7Bn $MM PACS RIS/CVIS CAD Interoperability East 1290 427 226 800 PACS CIS CAD Financials Interoperability Mechanisms (2) Product Functionality Archiving / retrieval Distribution Patient scheduling/information Teleradiology Automated interpretation Enhances clinician productivity ("Picture Archive Retrieval System") ("Clinical Information System") ("RIS / CVIS") Automated billing RIS / CVIS (1) $427 CAD $226 PACS $1,290 Portal solutions Integration solutions ("Computer Aided Detection") Source: Millennium Research Group, Frost & Sullivan Interoperability $800 |
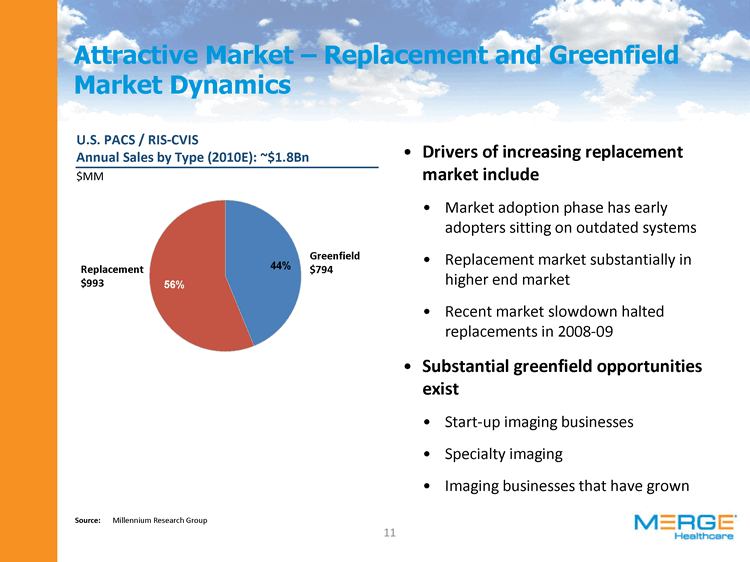
| 21 21 Attractive Market - Replacement and Greenfield Market Dynamics U.S. PACS / RIS-CVIS Annual Sales by Type (2010E): ~$1.8Bn $MM Greenfield Replace. East 44 56 Replacement $993 Greenfield $794 Source: Millennium Research Group Drivers of increasing replacement market include Market adoption phase has early adopters sitting on outdated systems Replacement market substantially in higher end market Recent market slowdown halted replacements in 2008-09 Substantial greenfield opportunities exist Start-up imaging businesses Specialty imaging Imaging businesses that have grown |

| 23 Software Licensing Hardware Solutions Professional Services Maintenance Contracts '05 429.9 291.8 213.3 170.2 '06 486.1 303.5 238.2 181.4 '07 451 298.6 266.9 202.3 '08 386 285.3 249.5 198 '09E 341.7 252.4 240.1 191.9 '10E 377.7 248.6 245.3 213.8 '11E 428.1 253.1 257.8 243.6 '12E 468.4 258.4 271.1 274.9 '13E 481.4 267.4 291.5 296.9 '14E 490.5 273.1 323.3 306.6 '15E 481.3 281.8 357 325.2 23 Attractive Market - Pent Up Demand Revenues ($MM) North America Revenue Breakdown by Solution Component (1) Source: Frost and Sullivan Note: (1) Represents North America PACS market Pent up need to upgrade systems leading to a 2010 and go-forward recovery 2005 - 2007 government reimbursement cuts Softness in 2008 - 2009 capex budgets Fundamental long-term growth drivers Need for efficiency-enhancing IT solutions Upgraded IT required to accommodate later-generation equipment Software Licensing Hardware Solutions Professional Services Maintenance Contracts Software 5.9% Hardware 1.9% Professional Services 6.8% Maintenance 9.2% Total Solutions 5.9% North America 2009E - 2015E Compound Annual Growth Rate (1) |

| 25 25 Leading Pure Play Provider Leading pure-play imaging software company Health IT specialist vs. generalist Tier 1 industry player Direct complemented with indirect channel provides Merge with access to additional market share Sustainable competitive advantage through technology and business model innovation CAD solutions for industry productivity Interoperability solutions for U.S. healthcare initiatives Cloud computing solutions for TCO reduction Source: Frost and Sullivan; data as of year-end 2008 North America Market Share (RIS/PACS Market) GE McKesson Philips AMICAS Fujifilm Agfa Other 0.201 0.156 0.151 0.121 0.092 0.086 0.198 GE McKesson Philips Merge / AMICAS Fujifilm Agfa Others 15% 12% |

| 27 27 Leading Provider Across Imaging Workflow Combined Company offers complete end-to-end solution Provides solutions across all provider segments, from large hospital systems through outpatient imaging sites Solutions for clinical, billing and information workflows serve physician, patient, payor and healthcare provider needs Differentiated portfolio of advanced clinical applications drives additional revenue opportunities Request arrives from referring physician Request is registered Exam is scheduled and confirmed Patient arrives and checks in at patient kiosk Patient appears on modality and technologist worklists Exam is performed Images are viewed at modality Associated images & priors are launched in PACS, and images are read and dictated by radiologist Report gets transcribed, then goes to radiologist's pending signature worklist Radiologist signs off on report via electronic signature Final report & images are distributed to the referring physician and patient Exam coding, billing Business Analytics Images are distributed to the radiologist's worklist |
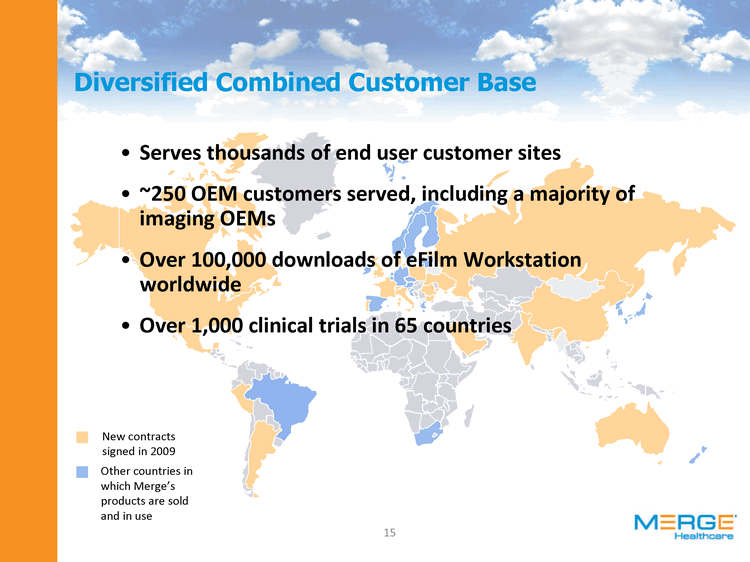
| 29 29 Diversified Combined Customer Base Other countries in which Merge's products are sold and in use New contracts signed in 2009 Serves thousands of end user customer sites ~250 OEM customers served, including a majority of imaging OEMs Over 100,000 downloads of eFilm Workstation worldwide Over 1,000 clinical trials in 65 countries |
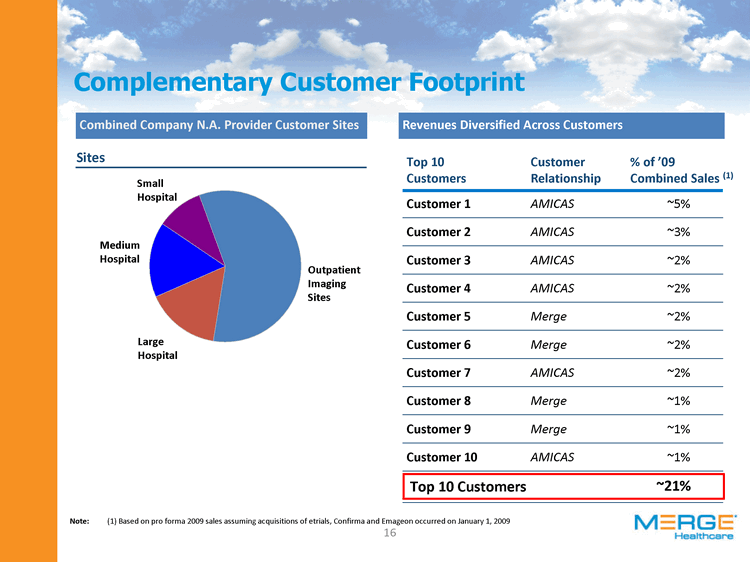
| Top 10 Customers Complementary Customer Footprint ~21% Top 10 Customers Customer 3 Customer 4 Customer 5 Customer 6 Customer 7 Customer 8 Customer 9 Customer 10 Customer 2 Customer 1 ~5% ~3% ~2% ~2% ~2% ~2% ~2% ~1% ~1% ~1% AMICAS AMICAS AMICAS AMICAS Merge Merge Merge AMICAS Merge AMICAS Customer Relationship Revenues Diversified Across Customers % of '09 Combined Sales (1) Note: (1) Based on pro forma 2009 sales assuming acquisitions of etrials, Confirma and Emageon occurred on January 1, 2009 OIC Large Hospital Medium Hospital Small Hospital East 58 16 16 10 Small Hospital Large Hospital Outpatient Imaging Sites Medium Hospital Combined Company N.A. Provider Customer Sites Sites 31 |

| 33 33 Combined Company Revenue (1) $MM Recurring revenue base exceeds 60% of annual revenues Ongoing, recurring revenue driven by maintenance contracts Enhanced visibility due to 12-month forward maintenance revenue High customer retention rate Non-recurring revenue backlog for the Combined Company of $45MM as of 12/31/09 Provides additional strength to go-forward revenue model Note: (1) Based on 2009 GAAP revenue Significant Recurring Revenue and Backlog |

| 35 Combined Company Gross Margin % 35 Attractive margin profile Software-typical margins Total combined gross margins of greater than 50%, with recurring gross margins exceeding those levels Minimal capital expenditures required Capex has historically averaged ~1% of sales Combined Capex as a % Sales % (1) Note: (1) Excludes $650K of Merge capital expenditures in the fourth quarter related non-recurring office/leasehold investments High Margins and Low Capex Requirements |

| 37 37 Straightforward Synergy Achievement Unique Products Merge North America Merge Intern'l AMICAS North America CAD Kiosk EMPI Surgical Management Vendor Neutral Archive Cardio Suite New Cross Selling Opportunities Cost-savings synergies expected to be ~$15MM and to be realized within 6-12 months Expected costs to achieve synergies is 1-for-1 for cost-savings |

| 39 Proven and Experienced Management Team Executive team with extensive turnaround and acquisition experience Growing execution track record Returned Merge to profitability in first full quarter Consistent sequential quarterly revenue growth since June 2008 Supported by a technical and operating management team with extensive industry and customer knowledge Over 10 years average tenure and over 18 years average industry experience Strong insider ownership Current fully diluted officer and director share ownership of 39.1% (1)(2) Name Title Years Experience Michael W. Ferro Chairman 20+ Justin C. Dearborn Chief Executive Officer 15+ Nancy Koenig President, Merge Fusion 20+ Jon DeVries President, Merge e-Clinical 20+ Steven M. Oreskovich Chief Financial Officer 15+ Ann Mayberry-French General Counsel & Secretary 20+ Antonia Wells President, Merge OEM 25+ Paul Budak President, Merge CAD 20+ Julie Pekarek Chief Marketing Officer 15+ Designates formerly part of Click Commerce Note: (1) Based on fully diluted shares outstanding (2) Excludes impact from new Merge perpetual preferred stock issuance; $10MM held by Michael Ferro / Merrick RIS |
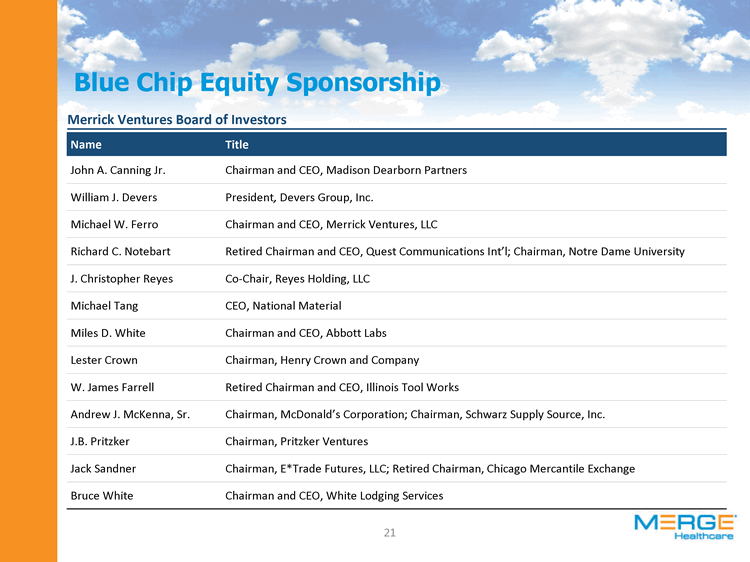
| Blue Chip Equity Sponsorship Name Title John A. Canning Jr. Chairman and CEO, Madison Dearborn Partners William J. Devers President, Devers Group, Inc. Michael W. Ferro Chairman and CEO, Merrick Ventures, LLC Richard C. Notebart Retired Chairman and CEO, Quest Communications Int'l; Chairman, Notre Dame University J. Christopher Reyes Co-Chair, Reyes Holding, LLC Michael Tang CEO, National Material Miles D. White Chairman and CEO, Abbott Labs Lester Crown Chairman, Henry Crown and Company W. James Farrell Retired Chairman and CEO, Illinois Tool Works Andrew J. McKenna, Sr. Chairman, McDonald's Corporation; Chairman, Schwarz Supply Source, Inc. J.B. Pritzker Chairman, Pritzker Ventures Jack Sandner Chairman, E*Trade Futures, LLC; Retired Chairman, Chicago Mercantile Exchange Bruce White Chairman and CEO, White Lodging Services Merrick Ventures Board of Investors 41 |

| 43 43 Financial Overview |

| Combined Financial Results Note: (1) Based on annualized adjusted 4Q 2009 financials and includes purchase accounting, other normalizing run-rate adjustments and cost-savings synergies. See run-rate EBITDA calculations on slide 26 and run-rate free cash flow calculations on slide 30 (2) Adjusted EBITDA excludes non-recurring charges and stock-based compensation expenses (3) Illustrative run-rate interest expense based on 10.5% interest rate on $200MM of senior secured notes (4) Run-rate adjusted levered free cash flow assumes $21.9MM Merge FCF, $20.7MM AMICAS FCF, $15MM of cost-savings synergies and $21MM of pro forma interest expense; see slide 30 for Run-Rate Adjusted Free Cash Flow Analysis (5) Assumes the Combined Company will have low working capital needs (4) (5) 45 |

| 47 Historical Financial Results Merge Revenues $MM Merge Adjusted EBITDA (2) $MM Merge Levered FCF (3) $MM AMICAS Revenues $MM AMICAS Adjusted EBITDA (2) $MM AMICAS Levered FCF (3) $MM Note: (1) Based on annualized adjusted 4Q 2009 financials and includes purchase accounting and other normalizing run-rate adjustments. See Run-Rate Adjusted EBITDA calculations on slide 26 (2) Adjusted EBITDA excludes non-recurring charges and stock-based compensation expenses (3) Levered free cash flow defined as operating cash flow less capital expenditures and interest expense. See calculations on slide 30 (1) (1) (1) (1) (1) (1) |

| 49 2009 Run-Rate Adjusted Financeable EBITDA 2009 Run-Rate Financeable EBITDA Bridge $MM Adjusted RT Data Merge Annualized Adjusted 4Q '09 EBITDA 0 19.456 Merge Annualized Run-Rate Adjustments 19.456 1.312 AMICAS Annualized Adjusted 4Q '09 EBITDA 20.768 26.396 AMICAS Annualized Run-Rate Adjustments 41.552 5.612 Synergies 41.552 15 Run-Rate Financeable EBITDA 56.552 (1) (1) (1) (1) (2) Note: (1) See slide 26 for Run-Rate Adjusted EBITDA calculations (2) See slide 19 for potential synergies detail |

| Merge 4Q '09 Adjusted EBITDA Merge 4Q '09 Adjusted EBITDA ($MM) Net income (loss) (2.1) Income tax expense (benefit) (0.2) Depreciation, amortization and impairment 2.1 Interest expense (income), net 0.4 Acquisition-related expenses (1) 0.2 Restructuring and other expenses (0.4) Loss on early retirement of debt 3.3 Non-cash stock-based compensation expense 0.4 Acquisition related sales adjustments (2) 1.1 Adjusted 4Q '09 EBITDA 4.9 Annualized Adjusted 4Q '09 EBITDA 19.5 Note: (1) Acquisition related expenses including banking, legal, accounting, valuation, consulting and other professional (2) Acquisition related sales and cost of sales adjustments represent those sales and cost of sales for acquisitions that would typically have been recognized but were not due to the accounting treatment for such acquisitions (3) Amount represents an adjustment for trade show expenses to reflect normalized quarterly expense for 2009 (4) Amount represents a non-recurring unwind of an AMICAS customer escrow agreement (5) Amount represents an adjustment for incentive compensation to reflect normalized quarterly expense for 2009 Merge Run-Rate Adjusted EBITDA Bridge $MM Adjusted RT Data Annualized Adjusted 4Q 2009 EBITDA 0 19.456 Annualized Tradeshow Adjustment 19.456 1.31 Annualized Run-Rate Adjusted EBITDA 20.768 AMICAS Run-Rate Adjusted EBITDA Bridge $MM (3) Adjusted RT Data Annualized Adjusted 4Q 2009 EBITDA 0 26.396 Annualized Tradeshow Adjustment 26.396 1.224 Annualized Customer Escrow Unwind 23.62 4 Annualized Compensation Adjustment 20.784 2.836 Annualized Run-Rate Adjusted EBITDA 20.784 (4) (5) (3) 2009 Run-Rate Adjusted EBITDA Analysis AMICAS 4Q '09 Adjusted EBITDA AMICAS 4Q '09 Adjusted EBITDA ($MM) Net income (loss) 2.1 Income tax expense (benefit) (0.5) Depreciation, amortization and impairment 1.7 Interest expense (income), net (0.1) Acquisition-related expenses (1) 0.6 Restructuring and other expenses (0.1) Non-cash stock-based compensation expense 0.6 Acquisition related sales adjustments (2) 2.5 Acquisition related cost of sales adj. (2) (0.1) Adjusted 4Q '09 EBITDA 6.6 Annualized Adjusted 4Q '09 EBITDA 26.4 51 |

| Capital Structure Policy and Capitalization Maintain moderate leverage Focus on reducing debt Prudent cash liquidity balance Note: (1) Includes 12/31/09 balance sheet cash less Merge and AMICAS balance sheet cash used to fund the subject transaction. Excludes impact of ~$15MM of costs to achieve synergies (2) This ratio divides total debt of $200MM by annualized Run-Rate Adjusted EBITDA including cost synergies. See Run-Rate Adjusted EBITDA calculations on slide 26 (3) This ratio divides net debt of $173.3MM ($200MM of total debt less pro forma cash and marketable securities of $26.7MM) by annualized Run-Rate Adjusted EBITDA including cost synergies. See Run-Rate Adjusted EBITDA calculations on slide 26 (4) This ratio divides annualized Run-Rate Adjusted EBITDA including cost synergies by estimated annual interest of $21.0MM, Annual interest includes cash interest only and is estimated at 10.5% of total debt of $200MM. See Run-Rate Adjusted EBITDA calculations on slide 26 53 |

| Offering Highlights Diversified Customer Base Straightforward Synergy Achievement $MM Blue Chip Investment Management Team Leading Healthcare IT Solution Provider GE 0.201 McKesson 0.156 Philips 0.151 AMICAS 0.12 Fujifilm 0.092 Agfa 0.086 Other 0.198 McKesson GE Other Philips Merge / AMICAS Fujifilm Agfa Attractive Market North America Hospital Imaging Procedure Volumes (MM) Strong Recurring Revenue and Margins $MM % Gross Margin 55 |

| 57 Appendix |
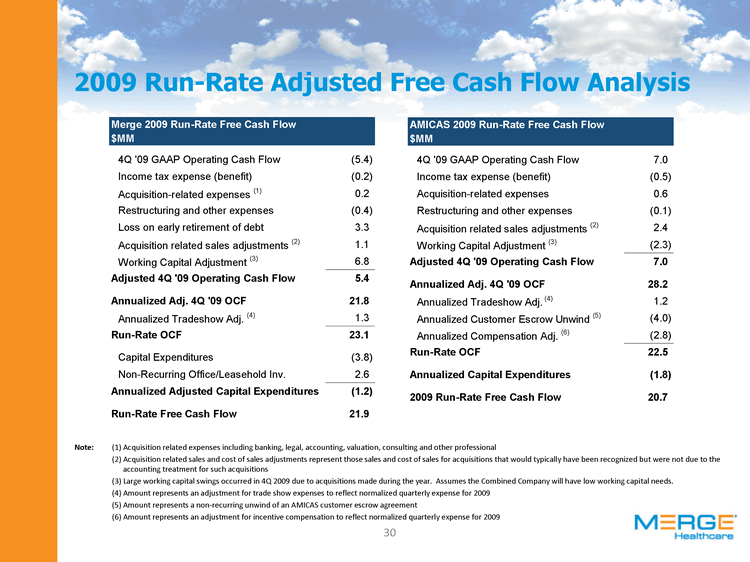
| 2009 Run-Rate Adjusted Free Cash Flow Analysis Note: (1) Acquisition related expenses including banking, legal, accounting, valuation, consulting and other professional (2) Acquisition related sales and cost of sales adjustments represent those sales and cost of sales for acquisitions that would typically have been recognized but were not due to the accounting treatment for such acquisitions (3) Large working capital swings occurred in 4Q 2009 due to acquisitions made during the year. Assumes the Combined Company will have low working capital needs. (4) Amount represents an adjustment for trade show expenses to reflect normalized quarterly expense for 2009 (5) Amount represents a non-recurring unwind of an AMICAS customer escrow agreement (6) Amount represents an adjustment for incentive compensation to reflect normalized quarterly expense for 2009 59 |
