Attached files
| file | filename |
|---|---|
| EXCEL - IDEA: XBRL DOCUMENT - MERGE HEALTHCARE INC | Financial_Report.xls |
| EX-21 - EXHIBIT 21 - MERGE HEALTHCARE INC | ex21.htm |
| EX-24.1 - EXHIBIT 24.1 - MERGE HEALTHCARE INC | ex24_1.htm |
| EX-31.1 - EXHIBIT 31.1 - MERGE HEALTHCARE INC | ex31_1.htm |
| EX-32 - EXHIBIT 32 - MERGE HEALTHCARE INC | ex32.htm |
| EX-31.2 - EXHIBIT 31.2 - MERGE HEALTHCARE INC | ex31_2.htm |
| EX-23.1 - EXHIBIT 23.1 - MERGE HEALTHCARE INC | ex23_1.htm |
| EX-10.13 - EXHIBIT 10.13 - MERGE HEALTHCARE INC | ex10_13.htm |
| EX-10.20 - EXHIBIT 10.20 - MERGE HEALTHCARE INC | ex10_20.htm |
UNITED STATES
SECURITIES AND EXCHANGE COMMISSION
Washington, D.C. 20549
FORM 10-K
| ☒ | ANNUAL REPORT PURSUANT TO SECTION 13 OR 15(d) OF THE SECURITIES EXCHANGE ACT OF 1934 |
For the fiscal year ended December 31, 2014
| ☐ | TRANSITION REPORT PURSUANT TO SECTION 13 OR 15(d) OF THE SECURITIES EXCHANGE ACT OF 1934 |
For the transition period from to
Commission file number 001-33006
MERGE HEALTHCARE INCORPORATED
(Exact name of Registrant as specified in its charter)
|
Delaware
|
39-1600938
|
|
|
(State or other jurisdiction of incorporation or organization)
|
(I. R. S. Employer Identification No.)
|
350 North Orleans Street, 1st Floor
Chicago, Illinois 60654
(Address of principal executive offices, including zip code)
(Registrant’s telephone number, including area code) (312) 565-6868
Securities registered under Section 12(b) of the Exchange Act:
|
Title of Each Class
|
Name of Each Exchange on Which Registered
|
|
|
Common Stock, $0.01 par value per share
|
The NASDAQ Global Select Market
|
Securities registered under Section 12(g) of the Exchange Act: NONE
Indicate by check mark if the Registrant is a well-known seasoned issuer, as defined in Rule 405 of the Securities Act.
Yes ☐No ☒
Indicate by check mark if the Registrant is not required to file reports pursuant to Section 13 or Section 15(d) of the Act.
Yes ☐No ☒
Indicate by check mark whether the Registrant (1) has filed all reports required to be filed by Section 13 or 15(d) of the Securities Exchange Act of 1934 during the preceding 12 months (or for such shorter period that the Registrant was required to file such reports), and (2) has been subject to such filing requirements for the past 90 days.Yes ☒No ☐
Indicate by check mark whether the registrant has submitted electronically and posted on its corporate Web site, if any, every Interactive Data File required to be submitted and posted pursuant to Rule 405 of Regulation S-T during the preceding 12 months (or for such shorter period that the registrant was required to submit and post such files). Yes ☒ No ☐
Indicate by check mark if disclosure of delinquent filers pursuant to Item 405 of Regulation S-K is not contained herein, and will not be contained, to the best of Registrant’s knowledge, in definitive proxy or information statements incorporated by reference in Part III of this Form 10-K or any amendment to this Form 10-K.☒
Indicate by check mark whether the Registrant is a large accelerated filer, an accelerated filer, or a non-accelerated filer, or a smaller reporting company. See the definitions of “large accelerated filer,” “accelerated filer”, and “smaller reporting company” in Rule 12b-2 of the Exchange Act.
|
Large accelerated filer ☐
|
Accelerated filer ☒
|
Non-accelerated filer ☐
|
Smaller reporting company ☐
|
Indicate by check mark whether the Registrant is a shell company (as defined in Rule 12b-2 of the Act). Yes ☐No ☒
The aggregate market value for the Registrant’s voting and non-voting common equity held by non-affiliates of the Registrant as of June 30, 2014, based upon the closing sale price of the Common Stock on June 30, 2014, as reported on The NASDAQ Global Select Market, was approximately $155,662,238. Shares of Common Stock held by each officer and director and by each person who owns ten percent or more of the outstanding Common Stock have been excluded in that such persons may be deemed to be affiliates. This determination of affiliate status is not necessarily a conclusive determination for other purposes.
The number of shares outstanding of the Registrant’s common stock, par value $0.01 per share, as of February 25, 2015: 98,456,765
DOCUMENTS INCORPORATED BY REFERENCE
Certain of the information required by Part III is incorporated by reference from the Registrant’s Proxy Statement for its 2015 Annual Meeting of Stockholders.
|
PART I
|
||
|
Item 1.
|
2
|
|
|
Item 1A.
|
6
|
|
|
Item 1B.
|
19
|
|
|
Item 2.
|
19
|
|
|
Item 3.
|
19
|
|
|
Item 4.
|
20
|
|
|
PART II
|
||
|
Item 5.
|
21
|
|
|
Item 6.
|
22
|
|
|
Item 7.
|
23
|
|
|
Item 7A.
|
37
|
|
|
Item 8.
|
39
|
|
|
Item 9.
|
70
|
|
|
Item 9A.
|
70
|
|
|
Item 9B.
|
71
|
|
|
PART III
|
||
|
Item 10.
|
72
|
|
|
Item 11.
|
72
|
|
|
Item 12.
|
72
|
|
|
Item 13.
|
73
|
|
|
Item 14.
|
73
|
|
|
PART IV
|
||
|
Item 15.
|
73
|
PART I
This Annual Report on Form 10‑K and other written or oral statements made by us or on our behalf may include forward-looking statements that reflect our current views with respect to future events and future financial performance. Certain statements in this Annual Report on Form 10-K are “forward-looking statements.” You can identify these forward-looking statements by our use of the words “believes,” “anticipates,” “forecasts,” “projects,” “could,” “plans,” “expects,” “may,” “will,” “would,” “intends,” “estimates” and similar expressions, whether in the negative or affirmative. We wish to caution you that any forward-looking statements made by us or on our behalf are subject to uncertainties and other factors that could cause such statements to be wrong. We cannot guarantee that we actually will achieve these plans, intentions or expectations. Actual results or events could differ materially from the plans, intentions and expectations disclosed in the forward-looking statements that we make and we cannot guarantee future results, levels of activity, and/or performance. We do not assume any obligation to update or revise any forward-looking statements that we make, whether as a result of new information, future events or otherwise.
Factors that may impact forward-looking statements include, among others, the risks and other matters set forth in the section entitled “Item 1A Risk Factors” in this Annual Report on Form 10-K. Although we have attempted to list comprehensively these important factors, we also wish to caution investors that other factors may prove to be important in the future in affecting our business and operating results. New factors emerge from time to time, and it is not possible for us to predict all of these factors, nor can we assess the impact each factor or combination of factors may have on our business.
Unless otherwise indicated by the context, references to “we” include Merge Healthcare Incorporated and its consolidated subsidiaries.
Overview
We develop software solutions that facilitate the sharing of images to create a more effective and efficient electronic healthcare experience for patients and physicians. Our solutions are designed to help solve some of the most difficult challenges in health information exchange today, such as the incorporation of medical images and diagnostic information into broader healthcare IT applications, the interoperability of proprietary software solutions, the profitability of outpatient imaging practices and the ability to improve the efficiency and cost effectiveness of our customers’ businesses.
We are a Delaware corporation that was founded in 1987. Our principal executive offices are located at 350 North Orleans Street, 1st Floor, Chicago, Illinois, 60654, and our telephone number there is (312) 565-6868.
Our website address, which we use to communicate important business information, can be accessed at: www.merge.com. We make our annual report on Form 10-K, quarterly reports on Form 10-Q, current reports on Form 8-K and all amendments to those reports available free of charge on or through our website as soon as reasonably practicable after such material is electronically filed with or furnished to the Securities and Exchange Commission (SEC). References to our website addressed in this Annual Report on Form 10-K are provided as a convenience and do not constitute, and should not be viewed as, an incorporation by reference of the information contained on, or available through, the website. Therefore, such information should not be considered part of this Annual Report on Form 10-K. Materials we file with or furnish to the SEC may also be read and copied at the SEC’s Public Reference Room at 100 F Street, NE, Washington, D.C. 20549. Information on the operation of the Public Reference Room may be obtained by calling the SEC at 1-800-SEC-0330. Also, the SEC Internet website (www.sec.gov) contains reports, proxy and information statements, and other information that we file electronically with the SEC.
Our solutions optimize processes for healthcare providers ranging in size from single provider practices to large health systems, to the sponsors of clinical trials and medical device manufacturers. We operate under two reportable segments: Merge Healthcare and Merge DNA. Our Merge Healthcare segment represents approximately 85% of our total revenues and markets, sells and implements interoperability, imaging and clinical solutions to healthcare providers. Our Merge DNA (Data and Analytics) segment represents approximately 15% of our total revenues and focuses on the marketing and sale of data capture software for clinical trials and related solutions. We evaluate the performance of each operating segment based on its respective revenues and operating income.
Our Merge Healthcare segment primarily generates revenue from the licensing of software (including upgrades), the sale of hardware, professional services, maintenance and electronic data interchange (EDI) services. Our Merge DNA segment generates revenue from software, through both on-premise licensing and hosting arrangements, and professional services. Going forward, we expect the vast majority of revenues of Merge DNA will come from hosted clinical trial arrangements.
Healthcare IT Industry
We believe there are several factors that may be favorable for the healthcare IT industry over the next few years, most notably the expected rate of growth in domestic healthcare spending. The Centers for Medicare and Medicaid Services (CMS) estimates U.S. healthcare spending in 2014 at $3.1 trillion, or 17.6% of Gross Domestic Product (GDP), and projects it to be 19.3% of GDP by 2023.
The American Recovery and Reinvestment Act (ARRA) and accompanying Health Information Technology for Economic and Clinical Health (HITECH) provisions included more than $35 billion in incentives which reward providers who provide for “meaningful use” of certified electronic health records (EHRs). These incentives may contribute to increased demand for a broader segment of healthcare IT solutions and services in the United States.
Imaging is an essential component of healthcare delivery across the continuum of care. As both Medicare and private payers move more rapidly towards outcomes-based reimbursement, including Accountable Care Organizations (ACOs) and shared savings models, we believe the need for image management and image sharing solutions will grow significantly.
We believe that we are positioned to provide value added solutions and services to our customers amidst potential changes in industry standards and regulations. We believe the fundamental value proposition of healthcare IT remains strong and that the industry will likely benefit as healthcare providers and governments continue to recognize that these solutions and services contribute to safer, more efficient healthcare delivery.
Merge Growth Strategy
Our strategy is to be a leading provider of enterprise imaging and interoperability solutions and services that improve the exchange of healthcare information. We believe the growth drivers for Merge are the importance of imaging and the need for interoperability between providers and other healthcare constituents.
Our portfolio of technologies is used across a wide variety of clinical specialties in addition to being an increasingly important component of clinical trials. For example, our iConnect platform offers hospitals and imaging centers the ability to electronically manage in-bound medical imaging referrals and distribution of results to referring physicians without having to build expensive point-to-point HL7 interfaces.
We have an opportunity to cross-sell products to existing customers as only a small percentage currently have more than one of our enterprise solutions. This is evidenced by the fact that no customer accounted for more than 10% of our net sales in any of the last three years. With the benefit of a broad customer base and several product lines undergoing ongoing innovation, we intend to continue to leverage technologies into new segments where customers see value.
Our Product Portfolio
We provide a broad range of products and services to our customers, including:
| · | Image Interoperability Platform |
| o | iConnect Enterprise Archive; iConnect Access Enterprise Viewer: An interoperability and connectivity platform that enables hospitals, imaging centers, Integrated Delivery Networks and HIEs to create image archives and exchanges within their environments and with other entities. This platform provides access to imaging and diagnostic data across disparate sites, geographies, specialties and providers. This enables providers to expedite care, reduce duplicate exams, consolidate infrastructure and limit the expenses associated with moving, managing and storing diagnostic content and results. |
| o | iConnect Network: An advanced interoperability network that allows hospitals and imaging centers to electronically manage in-bound medical imaging referrals and distribution of results to referring physicians without having to build expensive point-to-point HL7 interfaces. |
| o | iConnect Cloud Archive (formerly known as Merge Honeycomb Archive:):A cloud-based, multi-tenant image archive that provides disaster recovery/business continuity services for hospitals, imaging centers, and physician practices. |
| o | iConnect Retinal Screening: An end-to-end software solution for the screening of chronic visual diseases. This solution allows providers to have easy access to highly specialized eye care. |
| · | Clinical and Financial Information Systems |
| o | Digital Imaging Solutions: Picture Archiving and Communication Systems (PACS), specialty workstations and related applications manage the image workflow of a medical enterprise. PACS can be used by any medical imaging provider at a hospital or outpatient imaging site. We offer PACS solutions for general image review and management, specialty solutions for cardiology, orthopedics, ophthalmology, mammography and oncology, and add-on modules like referring physician portals and critical test results reporting. We also offer our eFilm Workstation for general radiology reading and CADstream workstations for specialty reading of magnetic resonance imaging (MRI) breast, liver and prostate studies. |
| o | Clinical information systems: These systems provide a complete electronic record of a medical procedure across a variety of specialties – including Merge OrthoEMR for orthopedics and Merge RIS for radiology. |
| o | Revenue Cycle Management: We offer software and services for the revenue cycle management of physician practices. These solutions can be used across many physician specialties, but our solutions are most commonly used by radiology practices, imaging centers and billing services. |
| o | Merge One: A cloud-based radiology solution for ambulatory imaging businesses to power a practice’s entire workflow. |
| · | Software Development Toolkits, Technologies and Platforms. |
| o | Merge toolkits, technologies and platforms provide software developers with the necessary resources to assist in the timely development of new products and enhance existing products. They can be used by original equipment manufacturers (OEMs), medical device manufacturer, RIS/PACS or general healthcare IT vendors. We offer development toolkits in the basic standards of medical imaging and information interoperability, as well as advanced toolkits and unfinished applications for specialized medical image review and distribution. |
| · | Hosted Software Solutions for Clinical Trial Data Management. |
| o | We provide hosted software solutions for the collection, aggregation, analysis, reporting and overall management of clinical trials information. These solutions can be sold to sponsors of clinical trials, including pharmaceutical companies, contract research organizations (CRO) or imaging core labs. Our solutions include electronic data capture (EDC), interactive voice/web response (IVR/IWR) and electronic patient reported outcomes (ePRO) software and devices. |
Backlog
At the end of 2014, we had software and professional services backlog, both licensed and hosted, of $76.0 million as compared to $80.1 million at the end of 2013. This backlog represents revenue from signed contracts that has not yet been recognized. Due to the variability in timing and length of maintenance renewals, we do not track maintenance backlog.
Competition
The healthcare IT and imaging markets in which we participate are highly competitive, rapidly evolving and subject to rapid technological change.
Our principal competitors in the healthcare solutions and services market include: General Electric, McKesson Corporation, Fuji, Philips, Carestream, and Agfa, each of which offers software solutions that compete with a portion of our product portfolio. Almost all of these competitors are substantially larger or have more experience and market share than Merge in their respective markets. We also partner with certain of these companies.
Other competitors focus on specific portions of the market that we address or compete against specific products we sell. For example, there are 30 other companies in the North American PACS market, according to Frost & Sullivan. These companies include original equipment manufacturers, former film companies and healthcare IT companies. Our eClinical solutions and services are in a highly competitive market led by Oracle and Medidata. Our OEM technologies most often compete with internal development departments, but also compete with software development companies for our Digital Imaging and Communications in Medicine (DICOM) and HL7 toolkits.
In addition, major software information systems companies, large information technology consulting service providers and system integrators, start-up companies, managed care companies and others that specialize in the healthcare industry offer competitive software solutions or services. The pace of change in the healthcare IT market is rapid and there are frequent new software solutions or service introductions, enhancements and evolving industry standards and requirements. We believe that the principal competitive factors in this market include the breadth and quality of solution and service offerings, the stability of the solution provider, the quality, features and performance of the products, the ongoing support for the systems and the potential for enhancements and future compatible software solutions.
Employees
At December 31, 2014, we had approximately 800 employees worldwide. Competition for personnel in the industry in which we compete is intense. We believe that our future success depends in part on our continued ability to hire, assimilate, train and retain qualified personnel.
Software Development
We commit significant resources to developing new health information system solutions. At December 31, 2014, approximately 200 of our employees were engaged in research and development activities. Total expenditures for the development and enhancement of our solutions, including capitalized software costs, were approximately $32.7 million, $32.4 million and $32.4 million during 2014, 2013 and 2012, respectively.
Our products, ranging from standards-based development toolkits to fully integrated clinical applications, have been used by healthcare providers worldwide for over 20 years. Our software solutions follow industry standards such as DICOM, which ensures that images from any DICOM-compliant imaging modality can be displayed, moved and stored within a standard set of guidelines. In addition, Merge follows the guidelines of the Integrating the Healthcare Enterprise (IHE) standards body, an organization dedicated to developing standard profiles for health information exchange. Our long-time involvement with the standards committees and continuous development of products like our DICOM and HL7 toolkits have enabled Merge to stay closely tied to industry innovation. As discussed above, continued investment in research and development remains a core element of our strategy. This will include ongoing enhancement of our core solutions and development of new solutions and services such as iConnect Cloud Archive, our cloud-based platform and iConnect Network, our new image and data exchange network.
Patents, Trademarks, Copyrights and Trade Secrets
We regard our intellectual property as important to our success. We have a portfolio of U.S. and international patents, trademarks, service marks, copyrights and trade secrets covering our products and services. Our proprietary technology is not dependent on any single patent or copyright or groups of related patents or copyrights. Our business is not dependent on any single patent, copyright or other form of intellectual property. We believe the term of each of our patents is adequate relative to the expected lives of our products. We rely on trademark, copyright, patent and trade secret law, and utilize confidentiality, license and other agreements with employees, customers and others to protect our proprietary rights.
We hold inbound licenses for certain intellectual property that is used internally, and in some cases, utilized in our products or services. While it may be necessary in the future to seek or renew licenses relating to various aspects of our products and services, we believe, based upon past experience and industry practice, such licenses generally can be obtained on commercially reasonable terms. We believe our operations and products and services are not materially dependent on any single license or other agreement with any third party.
Sales, Marketing and Distribution
Sales to large health systems typically require a minimum of nine months of development time, while the sales cycle can be shorter when selling to smaller hospitals and imaging centers. At December 31, 2014, approximately 135 of our employees were engaged in sales and marketing activities. Our executive sales and marketing management is located in Chicago, Illinois, while our sales team is deployed across the U.S. and globally.
We employ quota based sales teams that specialize in particular solutions and services. In addition, we have sales teams dedicated to establishing and maintaining distributor relationships on a global basis. We have concentrated inside and telesales staff in one location in order to bring economies of scale in management and process. Our sales teams are complemented by a staff of lead generation and marketing employees. These teams use online tools and resources that streamline and track the sales process.
Our marketing efforts are mainly electronic, utilizing our website and our extensive email database of customers for our communication campaigns, as well as our website for online communities and certain social media. Beyond electronic media, we employ consistent media relations efforts for market communications. In addition, we participate in the major industry trade shows for our respective product lines. We also have an active user group for our U.S. customers and an industry advisory board.
Financial Information about Segments
For financial information regarding our two operating groups as well as our geographic areas of operation, refer to Item 8, “Note 1 – Basis of Presentation and Significant Accounting Policies” and “Note 14 – Segment Information and Concentrations of Risk” of this Annual Report on Form 10-K.
Discussion of our business and operating results included in this annual report on Form 10-K should be read together with the risk factors set forth below. They describe various risks and uncertainties to which we are or may become subject. These risks and uncertainties, together with other factors described elsewhere in this report, have the potential to affect our business, financial condition, results of operations, cash flows, strategies, prospects, or the market price of our common stock in a material and adverse manner. New risks may emerge at any time, and we cannot predict those risks or estimate the extent to which they may affect financial performance. We undertake no obligation to update or revise the statements.
Reductions in Medicare and Medicaid Reimbursement Rates for Imaging Procedures and Professional Services or Delays in the Payment of Reimbursements could Negatively Affect Revenues of our Hospital and Imaging Clinic Customers, which could cause our Customers to Reduce or Delay Purchases of our Software and Services.
The ability of customers to obtain appropriate reimbursement for their services from these programs and payors is critical to our success. Reductions in the amount of reimbursements or uncertainty or delays in those reimbursements have in the past, and could in the future, cause our customers to cancel or delay making new expenditures on healthcare IT. Federal budget reductions can affect the timing of the sales of our software and services.
In addition, the U.S. Congress has enacted far-reaching health system reform legislation that could have a negative impact on our business. While the impact of the legislation is difficult to predict, the legislation will increase pressure to control spending in government programs (e.g., Medicare and Medicaid) and by third party payors. For example, changes in the equipment utilization rate, once fully implemented, have the potential to decrease technical reimbursements for radiology procedures, and could have a particularly negative impact on hospitals and imaging clinics in rural regions of the country where utilization rates are naturally lower. A second significant potential reimbursement change relates to the Sustainable Growth Rate (SGR) component of the Medicare Physician Fee Schedule. The SGR is part of the update factor process used to set the annual rate of growth in allowed reimbursable medical expenditures, and is determined by a formula specified by Congress. Because the annual calculation of the SGR would have led to reimbursement reductions that Congress found unacceptable, Congress has interceded on an annual basis to delay the implementation of this statutory SGR update factor. While these changes have provided temporary reimbursement relief to healthcare providers and us, because of the significant budgetary impacts, Congress has retained the SGR formula, thereby allowing annual unimplemented payment reductions to accumulate in the Medicare statute. The current SGR fix delay expires in March, and there are again various proposals to implement a permanent fix. The changes being considered have the potential to negatively impact the professional component of any reimbursement system. In addition, the SGR delay legislation contained many additional reimbursement provisions, such as the mandate to delay the implementation of ICD-10 for one year.
Annual changes related to CMS reimbursement inputs and the SGR calculation could result in a reduction in software and service procurement of our customers, and have a material adverse effect on our revenues and operating results.
We are Subject to Government Regulation, Changes to which could Negatively Impact our Business.
We are subject to regulation in the U.S. by the Food and Drug Administration (FDA), including periodic FDA inspections, in Canada under Health Canada’s Medical Devices Regulations, and in other countries by corresponding regulatory authorities. We may be required to undertake additional actions in the U.S. to comply with the Federal Food, Drug and Cosmetic Act (FDCA), regulations promulgated under the FDCA, and any other applicable regulatory requirements. For example, the FDA has increased its focus on regulating computer software intended for use in a healthcare setting. If our software solutions are deemed to be actively regulated medical devices by the FDA, we could be subject to more extensive requirements governing pre- and post-marketing activities. Complying with these regulations could be time consuming and expensive, and may include:
| · | Requiring us to receive FDA clearance of a pre-market notification submission demonstrating substantial equivalence to a device already legally marketed, or to obtain FDA approval of a pre-market approval application establishing the safety and effectiveness of the software; |
| · | Requiring us to comply with rigorous regulations governing the pre-clinical and clinical testing, manufacture, distribution, labeling and promotion of medical devices; and |
| · | Requiring us to comply with the FDCA regarding general controls, including establishment registration, device listing, compliance with good manufacturing practices, reporting of specified malfunctions and adverse device events. |
Similar obligations may exist in other countries in which we do business, including Canada. Any failure by us to comply with other applicable regulatory requirements, both domestic and foreign, could subject us to a number of enforcement actions, including warning letters, fines, product seizures, recalls, injunctions, total or partial suspensions of production, operating restrictions or limitations on marketing, refusals of the government to grant new clearances or approvals, withdrawals of marketing clearances or approvals and civil and criminal penalties.
We are subject to periodic FDA inspections and there can be no assurances that we will not be required to undertake additional actions to comply with the FDCA and any other applicable regulatory requirements. Any failure by us to comply with the FDCA and any other applicable regulatory requirements could have a material adverse effect on our ability to continue to manufacture and distribute our software solutions. The FDA has many enforcement tools including recalls, seizures, injunctions, civil fines and/or criminal prosecutions. Any of the foregoing could have a material adverse effect on our business, results of operations or financial condition.
Changes in Federal and State Regulations Relating to Handling of Data and Data Privacy could Depress the Demand for our Software and Impose Significant Software Redesign Costs.
Federal regulations under the Health Insurance Portability and Accountability Act (HIPAA) impose national health data standards on healthcare providers that conduct electronic health transactions, healthcare clearinghouses that convert health data between HIPAA compliant and non-compliant formats and health plans. Collectively, these groups are known as covered entities. HIPAA regulations prescribe transaction formats and code sets for electronic health transactions, protect individual privacy by limiting the uses and disclosures of individually identifiable health information and require covered entities to implement administrative, physical and technological safeguards to ensure the confidentiality, integrity, availability and security of individually identifiable health information in electronic form. Although we are not a covered entity, most of our customers are, and they require that our software and services adhere to HIPAA regulations. Any failure or perceived failure of our software or services to meet HIPAA regulations, or any breach of the HIPAA regulations or any other federal, state or foreign data privacy laws or regulations, could result in remediation costs and fines, and could adversely affect demand for our software and services and potentially require us to expend significant capital, research and development and other resources to modify our software or services to address the privacy and security requirements of our clients.
States and foreign jurisdictions have adopted, or may adopt, privacy standards that are similar to or more stringent than the federal HIPAA privacy regulations. This may lead to different restrictions for handling individually identifiable health information. As a result, our customers may demand IT solutions and services that are adaptable to reflect different and changing regulatory requirements, which could increase our development costs. In the future, federal, state or foreign governmental authorities may impose new data security regulations or additional restrictions on the collection, use, transmission and other disclosures of health information. We cannot predict the potential impact that these future rules may have on our business; however, the demand for our software and services may decrease if we are not able to develop and offer software and services that can address the regulatory challenges and compliance obligations facing our clients.
Our Business could be Harmed by Adverse General Economic and Market Conditions.
Our markets have been and will continue to be affected by general economic and market conditions. If general economic conditions deteriorate or economic uncertainty continues in the markets in which we do business, our clients might experience deterioration of their businesses, cash flow shortages and difficulty obtaining financing which may impact the decisions of customers to purchase products that improve their processes and delay or reduce their purchases, and in our having higher customer receivables with increased default rates. General concerns about the fundamental soundness of domestic and foreign economies may also cause customers to reduce their purchases, even if they have cash or if credit is available to them. This could result in reductions in sales of our products, longer sales cycles, slower adoption of new technologies and increased price competition. In addition, weakness in the end-user market could negatively affect our OEM and VAR customers who could, in turn, delay paying their obligations, which would increase our credit risk exposure and cause a decrease in operating cash flows. Also, if OEM and VAR customers experience excessive financial difficulties and/or insolvency, and we are unable to successfully transition end-users to purchase products from other vendors or directly from us, sales could decline. Any of these events would likely harm our business, results of operations and financial condition.
The Financial Covenants in our Credit Agreement Dated April 29, 2014 (Credit Agreement), may Force Us to Take Certain Actions that Could Adversely Affect our Future Results of Operations.
The Credit Agreement contains a leverage ratio covenant and an interest coverage ratio covenant in future periods. Our ability to satisfy these financial covenants going forward will depend on our future operating performance, which is in part subject to prevailing economic and competitive conditions and various financial, business, legislative, regulatory and other factors, some of which are beyond our control. If we cannot, or expect that we may not, meet the Credit Agreement’s financial covenants in the future, we may need to dispose of material assets or operations, reduce or delay investments and capital expenditures, seek additional equity capital investments or negotiate to restructure or refinance our indebtedness with our lenders. We may not be able to affect any such alternative measures on commercially reasonable terms or at all. Even if successful, such alternative measures may not allow us to meet the financial covenants in future periods, and/or they could limit our ability to realize the value of our assets and opportunities, restrict our ability to execute our long-term strategy or otherwise adversely affect our future results of operations.
We have a Substantial Amount of Indebtedness, which could Impact our Ability to Obtain Future Financing or Pursue our Growth Strategy.
We have substantial indebtedness. As of December 31, 2014, our indebtedness principally consisted of a Term Loan of $229.1 million. In addition, we may incur additional amounts of debt under our existing credit facilities.
Our high level of indebtedness could have important consequences and significant adverse effects on our business, including the following:
| · | We must use a substantial portion of our cash flow from operations to pay interest and principal on our indebtedness, which will reduce the funds available to us for operations and other purposes; |
| · | We must use a substantial portion of the proceeds of any asset sales to repay our indebtedness; |
| · | Our ability to obtain additional financing for working capital, capital expenditures, acquisitions or general corporate purposes may be limited; |
| · | We are exposed to fluctuations in the interest rate environment because the interest rates under the Credit Facilities are variable; |
| · | Our flexibility in planning for, or reacting to, changes in our business and the industry in which we operate may be limited, which may place us at a competitive disadvantage compared to our competitors that have less debt; |
| · | Our ability to pursue additional business opportunities may be limited; and |
| · | Our high level of indebtedness may make us more vulnerable to economic downturns and adverse developments in our business. |
The Credit Agreement contains, and the instruments governing any indebtedness we may incur in the future may contain, restrictive covenants that impose significant operating and financial restrictions, including restrictions on our ability to take actions that we believe may be in our best interest. The Credit Agreement, among other things, limits our ability to:
| · | Incur additional indebtedness and issue preferred stock; |
| · | Create or incur liens; |
| · | Enter into certain sale-leaseback transactions; |
|
|
· | Make certain investments or certain other restricted payments or make certain capital expenditures or acquisitions; |
| · | Merge or consolidate without meeting certain conditions; |
| · | Sell assets; |
|
|
· | Pay dividends on our capital stock or redeem, repurchase or retire our capital stock or indebtedness; |
|
|
· | Enter into transactions with our affiliates; |
| · | Guarantee indebtedness; |
| · | Issue or sell stock of certain subsidiaries. |
Our failure to comply with these restrictive covenants could result in an event of default which, if not cured or waived, could result in the acceleration of all or a portion of our outstanding indebtedness, which would have a material adverse effect on our business, financial condition and results of operations.
Payments on our Indebtedness will Require a Significant Amount of Cash and our Ability to Service our Indebtedness is Impacted by Many Factors that are Outside of our Control.
We expect to obtain the funds to pay our expenses and to pay the amounts due under the Credit Agreement primarily from our operations. Our ability to meet our expenses and make these payments thus depends on our future performance, which will be affected by financial, business, economic and other factors, many of which we cannot control. Our business may not generate sufficient cash flow from operations in the future and our currently anticipated growth in revenue and cash flow may not be realized, either or both of which could result in our being unable to service our indebtedness, including the Credit Agreement, meet the financial covenants in the Credit Agreement or to fund other liquidity needs. If we do not have sufficient cash resources in the future, we may be required to refinance all or part of our then existing indebtedness, sell assets or borrow more money. We cannot be assured that we will be able to accomplish any of these alternatives on terms acceptable to us or at all. See the section captioned “Liquidity and Capital Resources” in the Item 7, “Management’s Discussion and Analysis of Financial Condition and Results of Operations” in this Annual Report on Form 10-K.
We may Incur Substantial Additional Indebtedness that could Further Exacerbate the Risks Associated with our Indebtedness.
We may incur substantial additional indebtedness in the future. Although the Credit Agreement contains restrictions on our incurrence of additional indebtedness, these restrictions are subject to a number of qualifications and exceptions, and we could incur substantial additional indebtedness in the future, including additional secured indebtedness. In addition, we may refinance our existing indebtedness, which would permit us to incur additional indebtedness. If we incur additional indebtedness, certain of the risks described above would intensify. Our ability to meet our cash requirements and service our indebtedness is impacted by many factors that are outside of our control.
Our Failure to Comply with the Credit Agreement, Including as a Result of Events Beyond our Control, Could Result in an Event of Default.
If there were an event of default under any of the agreements relating to the Credit Agreement, including as a result of our failure to meet the financial covenants included in the Credit Agreement with respect to our consolidated leverage ratio or our interest coverage ratio, we may not be able to incur additional indebtedness under the Credit Agreement and the holders of the defaulted debt could cause all amounts outstanding with respect to that debt to be due and payable immediately. We cannot assure you that our assets or cash flow would be sufficient to fully repay borrowings under our outstanding debt instruments if accelerated upon an event of default, which could have a material adverse effect on our ability to continue to operate as a going concern. Further, if we are unable to repay, refinance or restructure our secured debt, the holders of such debt could proceed against the collateral securing that indebtedness.
An Increase in Interest Rates Would Increase the Cost of Servicing our Debt and Could Reduce our Profitability.
The Credit Agreement provides that borrowings under the Credit Agreement bear interest at a variable rate. While we are able to mitigate the effects of interest rate changes pursuant to the Credit Agreement through the use of hedging transactions, we will not completely eliminate the effect of interest rate changes. As a result, interest rate changes will not affect our obligation for any debt incurred under the Credit Agreement, but could affect the amount of our interest payments, and accordingly, our future earnings and cash flows, assuming other factors are held constant. An increase in interest rates, whether because of an increase in market interest rates or an increase in our own cost of borrowing, would increase the cost of servicing our debt and could materially reduce our profitability.
We are required to pay regular dividends on the Series A Convertible Preferred Stock, par value $0.01 per share ("Preferred Stock") issued to investment funds (the “Series A Investors”) affiliated with Guggenheim Partners, LLC (“Guggenheim”), which ranks senior to our common stock, and we may be required under certain circumstances to repurchase the outstanding shares of Preferred Stock; such obligations could materially adversely affect our liquidity and financial condition.
The Preferred Stock ranks senior to our common stock with respect to dividend rights, and holders of Preferred Stock are entitled to cumulative dividends payable quarterly in cash at a rate of 8.5% per annum of the stated value of $1,000 per share. These regular cash dividends on our Preferred Stock are payable quarterly in arrears on March 31, June 30, September 30 and December 31 of each year, commencing on March 31, 2015. In addition, the holders of our Preferred Stock have certain redemption rights, including upon certain change in control events involving us, which, if exercised, could require us to repurchase all of the outstanding shares of Preferred Stock at 100% or more of the stated value of the Preferred Stock, plus all accrued but unpaid dividends. These redemption rights include a right to force us to redeem the Preferred Stock at any time prior to August 25, 2015 for an amount equal to 100% of the stated value of the Preferred Stock, plus all accrued but unpaid dividends. If we are forced to redeem the Preferred Stock prior to August 25, 2015 and are unable to do so, the dividend rate on the Preferred Stock will increase at an additional rate of three percent for the first 180 days and an additional two percent for each additional 180 day period up to a maximum of fifteen and one half percent. In addition, the Credit Agreement places limitations on our ability to redeem the Preferred Stock using cash on hand and additional indebtedness, which may require us to issue additional shares of our common stock or preferred stock in order to fund such redemption.
Any required redemption of the outstanding shares of Preferred Stock could impact our liquidity and reduce the amount of cash flows available for working capital, capital expenditures, growth opportunities, acquisitions, and other general corporate purposes. Redemptions could also result in significant dilution of our outstanding common stock. Our obligations to the holders of Preferred Stock could also limit our ability to obtain additional financing or increase our borrowing costs, which could have an adverse effect on our financial condition.
9
The issuance of 50,000 shares of our Preferred Stock to investment funds to the Series A Investors reduces the relative voting power of holders of our common stock, may dilute the ownership of such holders, and may adversely affect the market price of our common stock.
On February 25, 2015, we issued 50,000 shares of Preferred Stock to investment funds affiliated with Guggenheim. The Series A Investors currently own all of the outstanding shares of Preferred Stock, and based on the number of shares of our common stock outstanding as of February 25, 2015, the Series A Investors collectively own Preferred Stock convertible into approximately 10.9% of our common stock (after giving effect to the conversion of the shares of Preferred Stock). As holders of our Preferred Stock are entitled to vote, on an as-converted basis, together with holders of our common stock as a single class on all matters submitted to a vote of our common stock holders, the issuance of the Preferred Stock to the Series A Investors has effectively reduced the relative voting power of the holders of our common stock.
In addition, conversion of the Preferred Stock to common stock will dilute the ownership interest of existing holders of our common stock, and any sales in the public market of the common stock issuable upon conversion of the Preferred Stock could adversely affect prevailing market prices of our common stock. We have granted the Series A Investors registration rights in respect of the shares of Preferred Stock and any shares of common stock issued upon conversion of the Preferred Stock. These registration rights would facilitate the resale of such securities into the public market, and any such resale would increase the number of shares of our common stock available for public trading. Sales by the Series A Investors of a substantial number of shares of our common stock in the public market, or the perception that such sales might occur, could have a material adverse effect on the price of our common stock.
The Series A Investors may exercise significant influence over us, including through their ability to elect one of the members of our Board of Directors.
As of February 25, 2015, the shares of Preferred Stock owned by the Series A Investors represent approximately 10.9% of the voting rights of our common stock, on an as-converted basis, so the Series A Investors will have the ability to significantly influence the outcome of any matter submitted for the vote of our stockholders. In addition, the Certificate of Designations of the Preferred Stock and the investor rights agreement entered into in connection therewith grant certain consent rights to the holders of Preferred Stock in respect of certain actions by us, including the issuance of pari passu or senior equity securities of the company, certain amendments to our certificate of incorporation or bylaws, any change in the size of our Board, the payment of certain distributions to our stockholders, and the incurrence of indebtedness that would have terms that are materially more restrictive than the Credit Agreement. The Series A Investors may have interests that diverge from, or even conflict with, those of our other stockholders. For example, Guggenheim and its affiliates may have an interest in directly or indirectly pursuing acquisitions, divestitures, financings or other transactions that, in their judgment, could enhance their other equity investments, even though such transactions might involve risks to us. Guggenheim and its affiliates are in the business of making or advising on investments in companies, including businesses that may directly or indirectly compete with certain portions of our business. They may also pursue acquisition opportunities that may be complementary to our business, and, as a result, those acquisition opportunities may not be available to us.
In addition, the purchase agreement entered into in connection with the issuance of the Preferred Stock (the “Purchase Agreement”) grants the Series A Investors certain rights to designate a director to serve on our Board. For so long as the Series A Investors and their permitted transferees beneficially own shares of Preferred Stock or the as-converted common stock purchased pursuant to the Purchase Agreement that represent more than 25% of the number of shares of the as-converted common stock purchased pursuant to the Purchase Agreement, the majority Series A Investors will have the right to designate for nomination one director to our Board. In addition, we agreed to submit to our stockholders at our next annual meeting a shareholder proposal pursuant to which the holders of Preferred Stock would be permitted to elect a director directly.
Our Performance Depends on our Ability to Attract and Retain Qualified Personnel.
We are dependent, in part, upon the services of our senior executives and other key business and technical personnel and competition for these types of highly skilled individuals is intense. We may not be able to retain existing key employees or be able to attract and retain skilled personnel on acceptable terms. We do not currently maintain key-man life insurance on our senior executives. If we are unable to fill any open positions with adequately qualified employees who are capable of quickly learning the responsibilities associated with their positions, or we fail to retain those employees, our business and financial results could be materially adversely affected.
Concerns About our Financial Stability Could Adversely Affect our Sales.
We rely on sales of software (including upgrades) and maintenance agreements for a significant portion of our revenue. Many of the customers in our industry expect to utilize software and services over a period of years and require access to upgrades and maintenance services during that time period. To the extent our customers have doubts about our financial stability and our ability to continue to operate as a going concern, those customers may seek alternative solutions from competitors who those customers believe to be more financially stable. If our customers shift their business to our competitors who appear to be more financially stable, our revenues and results of operations could be adversely affected.
Inadequate Liquidity Could Limit our Ability to Meet our Obligations and could Materially Adversely Affect our Business Operations in the Future.
We require substantial liquidity to make interest and principal payments on our indebtedness and run our normal business operations. Our business is subject to numerous risks and uncertainties that could negatively affect our cash flow and liquidity position in the future, including the other risks discussed under the heading "Risk Factors" in this Annual Report on Form 10-K. Our ability to incur additional indebtedness in the future is dependent upon our ability to manage business operations and generate sufficient cash flows to service such indebtedness and may be limited or available only on disadvantageous terms. Unless we can achieve cash flow levels sufficient to support our operations, we may require additional borrowings or the sale of debt or equity securities, sale of non-strategic assets, or some combination thereof, to provide funding for our operations. If we are unable to generate sufficient working capital or obtain alternative financing, we may not be able to borrow or otherwise obtain additional funds to finance our operations when needed, our financial condition and operating results would be materially adversely affected. In addition to generating sufficient liquidity to meet our obligations, we must generate sufficient liquidity to fund our business plan. If we cannot raise funds on acceptable terms when necessary, we may not be able to develop or enhance products and services, execute our business plan, take advantage of future opportunities or respond to competitive pressures or unanticipated customer requirements and funding our plan. Any such failure to raise funds on acceptable terms could weaken our competitive position and materially adversely affect our business.
Healthcare Industry Consolidation could Impose Pressure on our Software Prices, Reduce our Potential Client Base and Reduce Demand for our Software.
Many hospitals and imaging centers have consolidated to create larger healthcare enterprises with greater market and purchasing power. If this consolidation trend continues, it could reduce the size of our potential customer base and give the resulting enterprises greater bargaining or purchasing power, which may lead to erosion of the prices for our software or decreased margins for our products. In addition, when hospitals and imaging centers combine, they often consolidate infrastructure, and consolidation of our customers could result in fewer overall customers and erode our revenue base.
We may Fail to Achieve our Financial Forecasts due to Inaccurate Sales Forecasts, Delays in Sales and Installation of our Products and Other Reasons.
We may not be able to accurately forecast our revenue which may decrease or fluctuate significantly. Our revenue and operating profit growth depends on the continued demand for our products and services offered through us or our OEM and VAR customers, and our business is affected by general economic and business conditions worldwide. We base expense levels and investment plans on sales estimates, which are reviewed on a quarterly basis, and signed customer contracts, which may be cancelable or subject to modification. As a result, our revenues are difficult to forecast, and our operating results can fluctuate substantially from quarter to quarter. Because a significant portion of our cost structure, including expenses and investments, are fixed in the short-term, if revenues are lower than expected we may not be able to adjust spending quickly enough and as such we may experience a disproportionately negative impact on our profitability.
Delays in the expected sales or installation of our software may have a significant impact on our anticipated quarterly revenues and, because a significant percentage of our expenses are relatively fixed, our expenses may not align with our revenue. Additionally, we sometimes depend, in part, upon large contracts with a limited number of significant customers to meet projected sales goals in any particular quarter. Delays in the expected sales or installation of solutions under these large contracts may have a significant impact on our quarterly net sales and consequently our earnings.
The Length of our Sales and Implementation Cycles may Adversely Affect our Operating Results.
We have experienced long sales and implementation cycles. How and when to implement, replace, expand or substantially modify medical imaging management software, or to modify or add business processes, are major decisions for our end-user target market. The sales cycle for our software ranges from six to 18 months or more from initial contact to contract execution. Our end-user implementation cycle has generally ranged from three to nine months from contract execution to completion of implementation. During the sales and implementation cycles, we will expend substantial time, effort and resources preparing contract proposals, negotiating the contract and implementing the software, and may not realize any revenues to offset these expenditures. Additionally, any decision by our customers to delay or cancel purchases or the implementation of our software may adversely affect net sales.
We Operate in Competitive Markets, which may Adversely Affect our Market Share and Financial Results.
The markets for Healthcare IT solutions are highly competitive and subject to rapid technological change. We may be unable to maintain our competitive position against current and potential competitors. Some of our competitors are focused on sub-markets within targeted industries, while others have significant financial and information-gathering resources with recognized brands, technological expertise and market experience. We believe that competitors are continuously enhancing their products and services, developing new products and services and investing in technology to better serve the needs of their existing customers and to attract new customers. In addition, new competitors may emerge and our system and software solution offerings may be threatened by new technologies or market trends that reduce the value of our solutions.
We face competition in specific industries and with respect to specific offerings. We may also face competition from organizations and businesses that have not traditionally competed with us, but that could adapt their products and services to meet the demands of our customers. In addition, we often compete with our OEM customers’ own internal software engineering groups. The size and competency of these groups may create additional competition. Increased competition may require us to reduce the prices of our offerings or make additional capital investments that would adversely affect margins. If we are unable or unwilling to do so, we may lose market share in target markets and our financial results may be adversely affected.
If We Are Unable to Successfully Identify or Effectively Integrate Acquisitions, our Financial Results may be Adversely Affected.
We have in the past and may in the future acquire and make investments in companies, products or technologies that we believe complement or expand our existing business and assist in quickly bringing new products to market. There can be no assurance that we will be able to identify suitable candidates for successful acquisitions at acceptable valuations. In addition, our ability to achieve the expected returns and synergies from past and future acquisitions depends in part upon our ability to integrate the offerings, technology, administrative functions, and personnel of these businesses into our business in an efficient and effective manner. We cannot predict whether we will be successful in integrating acquired businesses or that our acquired businesses will perform at anticipated levels. In addition, our past and future acquisitions may subject us to unanticipated risks or liabilities, or disrupt operations and divert management’s attention from day-to-day operations. In addition, we may use our capital stock to acquire acquisition targets, which could be dilutive to the existing stockholders and cause a decline in the price of our common stock.
In making or attempting to make acquisitions or investments, we face a number of risks, including risks related to:
| · | Identifying suitable candidates, performing appropriate due diligence, identifying potential liabilities and negotiating acceptable terms; |
| · | The potential distraction of our management, diversion of our resources and disruption to our business; |
| · | Retaining and motivating key employees of the acquired companies; |
| · | Managing operations that are distant from our current headquarters and operational locations; |
| · | Entering into industries or geographic markets in which we have little or no prior experience; |
| · | Competing for acquisition opportunities with competitors that are larger or have greater financial and other resources than us; |
| · | Accurately forecasting the financial impact of a transaction; |
| · | Assuming liabilities of acquired companies, including existing or potential litigation related to the operation of the business prior to the acquisition; |
| · | Reducing our working capital and hindering our ability to expand or maintain our business, if acquisitions are made using cash; |
| · | Maintaining good relations with the customers and suppliers of the acquired company; and |
| · | Effectively integrating acquired companies and achieving expected synergies. |
In addition, any acquired business, products or technologies may not generate sufficient revenue and net income to offset the associated costs of such acquisitions, and such acquisitions could result in other adverse effects. In the years ended December 31, 2014, 2013 and 2012, we incurred $0.2 million, $0.9 million, and $3.4 million of acquisition related costs, respectively. All such direct acquisition costs are expensed as incurred by us. In addition, we often are required to incur charges to operations in the quarters following an acquisition to reflect costs associated with integrating acquired companies. We anticipate that our acquisition activities will require cash outflows directly related to completing acquisitions as well as costs related to integration efforts. If the benefits of an acquisition do not exceed the costs of integrating the businesses, our financial results may be adversely affected.
Moreover, from time to time, we may enter into negotiations for the acquisition of businesses, products or technologies but be unable or unwilling to consummate the acquisitions under consideration. This can be expensive and could cause significant diversion of managerial attention and resources.
A Portion of our Business Relies Upon a Network of Independent Contractors and Distributors Whose Actions could have an Adverse Effect on our Business.
We obtain some critical services from independent contractors. In addition, we rely on a network of VARs and distributors to sell our offerings in locations where we do not maintain a sales office or direct sales team. These independent contractors, VARs and distributors are not our employees. As a result, we have limited ability to monitor and direct their activities. The loss of a significant number of these independent contractors, VARs or distributors could disrupt our sales, marketing and distribution efforts and we may not be able to obtain or utilize on favorable terms, or at all, replacement licenses or other rights with respect to intellectual property we do not own in providing services under commercial agreements. Furthermore, if any actions or business practices of these individuals or entities violate our policies or procedures, or laws or regulations to which we are subject, we could be subject to litigation, regulatory sanctions or reputation damage, any of which could adversely affect our business and require us to terminate relationships with them.
Our Investments in Technology may not be Sufficient and may not Result in an Increase in our Revenues or Decrease in our Operating Costs.
As the technological landscape continues to evolve, it may become increasingly difficult for us to make timely, cost-effective changes to our product offerings to allow us to effectively compete against our competitors’ product offerings. In order to effectively market our products, we require constant innovation, which requires investments in research and development, among other things. We cannot provide any assurance that our investments will result in successful applications that will be sufficient to maintain or improve our competitive position.
If our New and Existing Products, Including Product Upgrades and Services do not Achieve and Maintain Sufficient Market Acceptance, our Business, Financial Condition, Cash Flows, Revenues, and Operating Results could Suffer.
The success of our business depends and will continue to depend in large part on the market acceptance of:
| · | Our existing products and services; |
| · | Our new products and services; and |
| · | Enhancements to existing products support and services. |
There can be no assurance that customers will accept any of these products, product upgrades, support or services. In addition, even if customers accept these products and services initially, we cannot be assured that they will continue to purchase our products and services at levels that are consistent with, or higher than, past quarters. Customers may significantly reduce their relationships with us or choose not to expand their relationship with us. In addition, any pricing strategy that we implement for any of our products, product upgrades, or services may not be economically viable or acceptable to our target markets. Failure to achieve or to sustain significant penetration in our target markets with respect to any of these products, product upgrades, or services could have a material adverse effect on our business.
Achieving and sustaining market acceptance for these products, product upgrades and services is likely to require substantial marketing and service efforts and the expenditure of significant funds to create awareness and demand by participants in the healthcare industry. In addition, deployment of new or newly integrated products or product upgrades may require the use of additional resources for training our existing sales force and customer service personnel and for hiring and training additional sales and customer service personnel. There can be no assurance that the revenue opportunities for new products, product upgrades and services will justify the amounts that we spend for their development, marketing and rollout.
If we are unable to sell new and next-generation software products to healthcare providers that are in the market for healthcare information and/or image management systems, such inability will likely have a material adverse effect on our business, financial condition, cash flows, revenues and operating results. If anticipated software sales and services do not materialize, or if we lose customers or experience significant declines in orders from customers, our revenues would decrease over time due to the combined effects of attrition of existing customers and a shortfall in new client additions.
We may not be Able to Adequately Protect our Intellectual Property Rights or may be Accused of Infringing Intellectual Property Rights of Third Parties.
We regard our intellectual property as important to our success. We have a portfolio of U.S. and international patents, trademarks, service marks, copyrights and trade secrets covering our products and services. Our proprietary technology is not dependent on any single patent or copyright or groups of related patents or copyrights. Our business is not dependent on any single patent, copyright or other form of intellectual property. We believe the term of each of our patents is adequate relative to the expected lives of our products. We rely on trademark, copyright, patent and trade secret law, and utilize confidentiality, license and other agreements with employees, customers and others to protect our proprietary rights.
We hold inbound licenses for certain intellectual property that is used internally, and in some cases, utilized in our products or services. While it may be necessary in the future to seek or renew licenses relating to various aspects of our products and services, we believe, based upon past experience and industry practice, such licenses generally can be obtained on commercially reasonable terms. We believe our operations and products and services are not materially dependent on any single license or other agreement with any third party.
We may not be able to discover or determine the extent of any unauthorized use of our intellectual property and proprietary rights. Third parties that license our proprietary rights also may take actions that diminish the value of these rights. Any claims of alleged infringement of the intellectual property rights of third parties, whether or not meritorious, may result in the expenditure of significant financial and managerial resources. If we are found liable of infringement, we may be required to pay damages or cease making or selling certain products. We may need to obtain licenses from third parties who allege that we have infringed on their rights, but such licenses may not be available on terms acceptable to us or at all.
We also rely on proprietary know how and confidential information and employ various methods, such as entering into confidentiality and non-compete agreements with our current employees and with certain third parties to whom we have divulged proprietary information to protect the processes, concepts, ideas and documentation associated with our solutions. Such methods may not afford sufficient protection, and we may not be able to protect trade secrets adequately or ensure that other companies would not acquire information that we consider proprietary, particularly in foreign countries where the laws may not protect our proprietary rights as fully as in the U.S. Our inability to protect our proprietary technology could result in competitive harm that could adversely affect our business.
Changes in Foreign Exchange Rates may Impact our Results of Operations and Financial Condition.
Our international operating results are exposed to foreign exchange rate fluctuations. While the functional currency of most of our international operations is the U.S. Dollar, we conduct transactions in currencies other than the U.S. Dollar, and certain account balances in foreign countries are maintained in the local currency. As such, changes in the value of certain foreign currencies relative to the U.S. Dollar can affect our revenues, operating results and the value of our foreign currency account balances. Generally, our revenues, operating results and foreign currency account balances are adversely affected when the dollar strengthens relative to other currencies and are positively affected when the dollar weakens. As we expand international operations, our exposure to exchange rate fluctuations may increase.
We may not be Successful in our Efforts to Expand into International Markets.
Our international activities are material to our revenues and profits, and we plan to further expand internationally. In 2014, our international revenues were $14 million, or about 7% of total revenues. We have limited experience operating in international markets and may not benefit from any first-to-market advantages or otherwise succeed in developing products to meet demand in new markets. It is costly to establish, develop and maintain international operations and websites and promote our brand internationally. Our international operations may not be profitable on a sustained basis.
In addition to risks described elsewhere in this section, our international sales and operations are subject to a number of risks, including:
| · | Local economic and political conditions; |
| · | Foreign government regulation of healthcare and government reimbursement of health services; |
| · | Local restrictions on sales or distribution of certain products or services and uncertainty regarding liability for products and services; |
| · | Local import, export or other business licensing requirements; |
| · | Local limitations on the repatriation and investment of funds and foreign currency exchange restrictions; |
| · | Shorter payable and longer receivable cycles and the resultant negative impact on cash flow; |
|
|
· | Local laws and regulations regarding data protection, privacy, network security and restrictions on pricing; |
| · | Difficulty in staffing, developing and managing foreign operations as a result of distance, language and cultural differences; |
| · | Different employee/employer relationships and the existence of workers’ councils and labor unions; |
| · | Laws and policies of the U.S. and other jurisdictions affecting trade, foreign investment, loans and taxes; and |
| · | Geopolitical events, including war and terrorism. |
Litigation or Regulatory Actions could Adversely Affect our Financial Condition.
As a result of lawsuits and regulatory matters, including the matters discussed in Item 3, Legal Proceedings in this Annual Report on Form 10-K, we have incurred and may continue to incur substantial expenses. In addition, we are, from time to time, parties to legal and regulatory proceedings, lawsuits and other claims incident to our business activities. Such matters may include, among other things, assertions of contract breach or intellectual property infringement, claims for indemnity arising in the course of our business and claims by persons whose employment has been terminated. Such matters are subject to many uncertainties and outcomes are not predictable. The defense of these actions may be both time consuming and expensive. We are unable to estimate the ultimate aggregate amount of monetary liability, amounts which may be covered by insurance or recoverable from third parties, or the financial impact with respect to these matters as of the date of this Annual Report on Form 10-K. If any of these legal proceedings were to result in an unfavorable outcome, it could have a material adverse effect on our business, financial position and results of operations.
We may be Subject to Product Liability Claims if People or Property are Harmed by the Products and Services that we Sell.
Some of the products we sell or manufacture may expose us to product liability claims relating to personal injury, death or environmental or property damage and may require product recalls or other actions. Moreover, because our products are intended to be used in connection with providing medical care to patients, users of our products may have a greater sensitivity to errors than in the general market for software products. If our products lead to faulty medical decisions or injury to patients, we could be exposed to claims or litigation that could have an adverse effect on our business. Certain third parties, primarily our customers, also sell products or services using our products. This may increase our exposure to product liability claims. Although we maintain liability insurance, we cannot be certain that coverage will be adequate for liabilities actually incurred or that insurance will continue to be available on economically reasonable terms or at all. In addition, some of our agreements with vendors do not indemnify us from product liability. Even unsuccessful claims could result in substantial costs and diversion of management resources. A claim brought against us that is uninsured or under-insured could harm our business, financial condition and results of operations.
We Provide Customers with Certain Warranties that could Result in Higher Costs than Anticipated.
Software products such as ours that are used in a wide range of clinical and health information system settings may contain a number of errors or “bugs,” especially early in their product life cycle. Our products include clinical information systems used in patient care settings where a low tolerance for errors or bugs exists. Testing of products is difficult due to the wide range of environments in which systems are installed. The discovery of defects or errors in our software products or in our implementation of integrated solutions may cause delays in product delivery, poor client references, payment disputes, contract cancellations, harm to our reputation, product liability claims or additional expenses and payments to rectify problems. Furthermore, our customers might use our software together with products from other companies or those that they have developed internally. As a result, when problems occur, it might be difficult to identify the source of the problem. Even when our software does not cause these problems, the existence of these errors might cause us to incur significant costs, divert the attention of our technical personnel from our research and development efforts; impact our reputation and cause significant customer relations problems. Any of those factors may result in delayed acceptance of, or the return of, our software products.
We Depend on Licenses from Third Parties for Rights to Some Technology we use, and if we are Unable to Continue these Relationships and Maintain our Rights to this Technology, our Business could Suffer.
Some of the technology used in our software depends upon licenses from third party vendors. These licenses typically expire within one to five years, can be renewed only by mutual consent and may be terminated if we breach the license and fail to cure the breach within a specified period of time. We may not be able to continue using the technology made available to us under these licenses on commercially reasonable terms or at all. As a result, we may have to discontinue, delay or reduce software shipments until we obtain equivalent technology, if available, which could hurt our business. Most of our third party licenses are nonexclusive. Our competitors may obtain the same right to use any of the technology covered by these licenses and use the technology to compete directly with us. In addition, if our vendors choose to discontinue support of the licensed technology in the future or are unsuccessful in their continued research and development efforts, particularly with regard to the Microsoft Windows/Intel platform on which most of our products operate, we may not be able to modify or adapt our own software. This could have an adverse effect on our business.
Our Large Stockholders may have Interests that Differ from other Stockholders.
Merrick Ventures, LLC (Merrick Ventures) and its affiliates, including Merrick Venture Management Holdings, LLC (Merrick Holdings), beneficially own, as of December 31, 2014, 26.9% of our outstanding common stock. Michael W. Ferro, Jr., our Chairman of the Board, and trusts for the benefit of Mr. Ferro’s family members beneficially own a majority of the equity interests in Merrick Ventures and Merrick Holdings. Mr. Ferro also serves as the chairman and chief executive officer of Merrick Ventures and Merrick Holdings. Accordingly, Mr. Ferro indirectly owns or controls all of the shares of our common stock owned by Merrick Ventures and Merrick Holdings. Due to their stock ownership, Merrick Ventures and Merrick Holdings have significant influence over our business, including the election of our directors.
The interests of Merrick Ventures, Merrick Holdings and their affiliates may differ from those of our other stockholders. Merrick Ventures, Merrick Holdings and their affiliates are in the business of making investments in companies and maximizing the return on those investments. They currently have, and may from time to time in the future acquire, interests in businesses that directly or indirectly compete with certain aspects of our business or that supply us with goods and services. Merrick Ventures, Merrick Holdings and their affiliates may also pursue acquisition opportunities that may be complementary to our business and, as a result, those acquisition opportunities may not be available to us. Merrick Ventures’ and Merrick Holdings’ significant ownership of our voting stock will enable it to influence or effectively control us and the influence of our large stockholders could impact our business strategy and also have the effect of discouraging others from purchasing or attempting to take a control position in our common stock, thereby increasing the likelihood that the market price of our common stock will not reflect a premium for control.
Shares of our Common Stock Eligible for Public Sale may have a Negative Impact on the Market Price of our Common Stock.
Sales of a substantial number of shares of our common stock in the public market, or the perception that these sales may occur, could cause the market price of our common stock to decline. In addition, the sale of these shares could impair our ability to raise capital, should we wish to do so, through the sale of additional common or preferred stock. As of December 31, 2014, we had approximately 98.4 million shares of common stock outstanding. In addition, as of December 31, 2014, we had outstanding options to purchase approximately 6.0 million shares of our common stock. Future sales of shares of our common stock by existing holders of our common stock or by holders of outstanding options, upon the exercise thereof, could have a negative impact on the market price of our common stock. As additional shares of common stock become available for sale in the public market, due to the exercise of options or the issuance of shares as a result of acquisitions, the market supply of shares of common stock will increase, which could also decrease the market price.
We are unable to estimate the number of shares that may be sold because this will depend on the market price for our common stock, the personal circumstances of the sellers and other factors. Any sale of substantial amounts of our common stock or other securities in the open market may adversely affect the market price of such securities and may adversely affect our ability to obtain future financing in the capital markets as well as create a potential market overhang.
Because we do not Intend to Pay Cash Dividends, Stockholders will Benefit from an Investment in our Stock Only if it Appreciates in Value.
We currently intend to retain future earnings, if any, to fund future growth, and do not expect to pay any cash dividends in the foreseeable future. As a result, the success of an investment in our common stock will depend upon any future appreciation in its value. There is no guarantee that our common stock will appreciate in value or even maintain the price at which stockholders have purchased and will purchase shares.
The Trading Price of our Common Stock has been Volatile and may Fluctuate Substantially in the Future.
The price of our common stock has been, and may continue to be, volatile. The trading price of our common stock may continue to fluctuate widely as a result of a number of factors, some of which are not in our control, including:
| · | Our ability to meet or exceed the expectations of analysts or investors; |
| · | Changes in our forecasts or earnings estimates by analysts; |
| · | Quarter-to-quarter variations in our operating results; |
| · | Announcements regarding clinical activities or new products by us or our competitors; |
| · | General conditions in the healthcare IT industry; |
| · | Governmental regulatory action and healthcare reform measures, including changes in reimbursement rates for imaging procedures; |
| · | Rumors about our performance or software solutions; |
| · | Announcements regarding acquisitions; |
| · | Uncertainty regarding our ability to service existing debt; |
| · | Price and volume fluctuations in the overall stock market, which have particularly affected the market prices of many software, healthcare and technology companies; and |
| · | General economic conditions. |
In addition, the market for our common stock may experience price and volume fluctuations unrelated or disproportionate to our operating performance. These fluctuations could have a significant impact on our business due to diminished incentives for management and diminished currency for acquisitions.
If our Operating and Financial Performance Does not Meet the Guidance that we Have Provided to the Public, our Stock Price may Decline.
Periodically, we provide public guidance on our expected operating and financial results for future periods. Although we believe that this guidance provides investors and analysts with a better understanding of management's expectations for the future and is useful to our stockholders and potential stockholders, such guidance is comprised of forward-looking statements subject to the risks and uncertainties described in this report and in our other public filings and public statements. Our actual results may not always be in line with or exceed the guidance we have provided, especially in times of economic uncertainty. If our financial results for a particular period do not meet our guidance or the expectations of investment analysts, or if we reduce our guidance for future periods, the market price of our common stock may decline.
Certain Provisions of our Certificate of Incorporation, Bylaws and Delaware law could make a Takeover Difficult and May Prevent or Frustrate Attempts by our Stockholders to Replace or Remove our Management Team.
Various provisions contained in our certificate of incorporation and bylaws could delay or discourage some transactions involving an actual or potential change in control and may limit the ability of our stockholders to remove current management or approve transactions that our stockholders may deem to be in their best interests. For instance, we have an authorized class of 1,000,000 shares of preferred stock all of which shares are undesignated except for 50,000 shares of Series A Preferred Stock (none of which were issued and outstanding as of December 31, 2014 and 2013). Shares of our authorized but unissued preferred stock may be issued by our board of directors without stockholder approval, on such terms and with such rights, preferences and designation as the board of directors may determine. Issuance of such preferred stock, depending upon the rights, preferences and designations thereof, may have the effect of delaying, deterring or preventing a change in control.
In addition, provisions of our certificate of incorporation and bylaws:
| · | Require that any action required or permitted to be taken by our stockholders be effected at a duly called annual or special meeting of stockholders and may not be effected by any consent in writing; |
| · | Provide an advance written notice procedure with respect to stockholder proposals and the nomination of candidates for election as directors, other than nominations made by or at the direction of our board of directors or a committee of our board of directors; |
| · | State that special meetings of our stockholders may be called only by the chairman of our board of directors, our chief executive officer or by a majority of our board of directors then in office; and |
| · | Allow our directors to fill vacancies on our board of directors, including vacancies resulting from removal or enlargement of the board of directors. |
We are also subject to provisions of Delaware corporate law which, subject to certain exceptions, will prohibit us from engaging in any “business combination” with a person who, together with affiliates and associates, owns 15% or more of our common stock for a period of three years following the date that the person came to own 15% or more of our common stock, unless the business combination is approved in a prescribed manner.
These provisions of our certificate of incorporation, bylaws and of Delaware law, may have the effect of delaying, deterring or preventing a change in control, may discourage bids for our common stock at a premium over market price and may adversely affect the market price, and the voting and other rights of the holders, of our common stock. In addition, these provisions make it more difficult to replace or remove our current management team in the event our stockholders believe this would be in our best interest and the best interests of our stockholders.
Some of our Activities may Subject us to Risks under Laws and Regulations relating to Healthcare Fraud.
We are subject to extensive and frequently changing local, state and federal laws and regulations relating to healthcare fraud, waste and abuse, and the government, both state and federal, continues to strengthen its position and scrutiny over practices involving fraud, waste and abuse affecting Medicare, Medicaid and other government healthcare programs. Our relationships with hospitals and imaging centers, as well as our provision of products and services to government entities, subject our business to laws and regulations on fraud and abuse, which among other things: (1) prohibit persons from soliciting, offering, receiving or paying any remuneration in order to induce the referral of a patient for treatment or for inducing the ordering or purchasing of items or services that are in any way paid for by Medicare, Medicaid or other government-sponsored healthcare programs; (2) impose a number of restrictions upon referring physicians and providers of designated health services under Medicare and Medicaid programs; and (3) prohibit the knowing submission of a false or fraudulent claim for payment to, and knowing retention of an overpayment by, a federal health care program such as Medicare and Medicaid. Many of the regulations applicable to us, including those relating to marketing incentives, are vague or indefinite and have not been interpreted by the courts. They may be interpreted or applied by a prosecutorial, regulatory, or judicial authority in a manner that could require us to make changes in our operations. If we fail to comply with applicable laws and regulations, we could become liable for damages, suffer civil and criminal penalties, including the loss of licenses or our ability to participate in Medicare, Medicaid and other federal and state healthcare programs.
Our Failure to Comply with Evolving Interoperability Standards could Depress the Demand for our Software and Impose Significant Software Redesign Costs.
There is increasing demand among customers, industry groups and government authorities that healthcare software and systems provided by various vendors be compatible with each other. This need for interoperability is leading to the development of standards by various groups, and certain federal and state agencies are also developing standards that could become mandatory for systems purchased by these agencies. For example, the HITECH Act requires meaningful use of “certified” healthcare information technology products by healthcare providers in order to receive stimulus funds from the federal government. Effective September 27, 2010, Centers for Medicare and Medicaid Services (“CMS”) issued a rule that utilizes a staged approach for defining meaningful use criteria. Under the staged approach, CMS has issued rules that identify the initial criteria for meaningful use and is updating these initial criteria with additional rules. On September 4, 2012, CMS published a final rule that specifies the Stage 2 criteria that eligible professionals, eligible hospitals, and critical access hospitals must meet in order to continue to participate in the Medicare and Medicaid Electronic Health Record Incentive Programs. All providers must achieve meaningful use under the Stage 1 criteria before moving to Stage 2. In addition, these standards are subject to interpretation by the entities designed to certify such technology. A combination of our solutions has been certified as meeting the initial criteria. However, we may incur increased development costs and delays in upgrading our customer software and systems to be in compliance with these varying and evolving standards. In addition, these new standards may lengthen our sales and implementation cycle and we may incur costs in periods prior to the corresponding recognition of revenue. To the extent these standards are narrowly construed or delayed in publication, or that we are delayed in achieving certification under these evolving standards for applicable products, our customers may postpone or cancel their decisions to purchase or implement our software and systems. For example, the 2014 Meaningful Use program included changes, proposed in July and finalized in October, which allowed providers to report using older technology. This significantly impacted upgrades, as our customers could use older versions of our product and still stay compliant with the program. Currently, CMS has issued a proposal to change the reporting period in 2015 from a full year to 90 days. We anticipate that this could further delay upgrades.
In addition to national programs like Meaningful Use, state laws and subsequent change can impact development costs on our products. Some examples include varying state laws on radiation dosage tracking and the reporting of breast density in mammography tracking. Both state and national regulations are becoming increasingly focused on health IT, and it has caused roadmap changes for our products.
With regard to interoperability, the Office of the National Coordinator (ONC) has published an interoperability roadmap titled Connecting Health and Care for the Nation: A 10-year vision to Achieve Interoperable Health IT Infrastructure first published in June 2014 and updated in October 2014, which will impact virtually all of our products if implemented. It contains both standards for clinical data definitions and standards for the mechanisms of moving such data among providers and patients.
None.
Our five largest facilities, all of which are leased, are set forth in the following table:
|
Location
|
Square Footage
|
Annual Lease
Payments
(thousands of $)
|
||||||
|
Chicago, Illinois
|
22,633
|
$
|
378
|
|||||
|
Daytona Beach, Florida
|
36,000
|
177
|
||||||
|
Hartland, Wisconsin
|
81,000
|
730
|
||||||
|
Mississauga, Ontario
|
24,000
|
572
|
||||||
|
Morrisville, North Carolina
|
14,746
|
278
|
||||||
We actively monitor our real estate needs in light of our current utilization and projected growth. We believe that we can acquire any necessary additional facility capacity on reasonably acceptable terms within a relatively short timeframe. We devote capital resources to facility improvements and expansions as we deem necessary to promote growth and most effectively serve our customers.
In August 2010, Merge Healthcare was sued in the Northern District of Texas by the Court-appointed receiver for Stanford International Bank, Ltd. The receiver alleges that Merge Healthcare was a recipient of a fraudulent conveyance as a result of a Ponzi scheme orchestrated by Robert Stanford and Stanford International Bank, Ltd. (SIBL). Merge Healthcare is not alleged to have participated in the Ponzi scheme. The receiver’s claims arise from the failed acquisition of Emageon, Inc. (Emageon) by Health Systems Solutions, Inc. (HSS), an affiliate of SIBL, in February 2009, which resulted in the payment of a $9.0 million break-up fee by HSS, which payment is alleged to have been financed by SIBL. Merge Healthcare subsequently acquired Emageon as part of our AMICAS acquisition. The complaint seeks to recover the $9.0 million payment to Emageon, plus interest, costs, and attorneys’ fees. We have retained litigation counsel and intend to vigorously defend this action. We filed a motion to dismiss the complaint, which motion was denied. Trial has been scheduled for May 2015. Discovery in this matter is ongoing. We believe it is reasonably possible that we may incur a loss with respect to this matter. The potential loss may lie in a range from zero to the full amount claimed, plus interest.
On January 16, 2014, a purported shareholder class action complaint was filed in the United States District Court for the Northern District of Illinois by Fernando Rossy, who claims to be a Merge Healthcare stockholder, against Merge Healthcare and certain current and former directors and officers claiming violations of federal securities laws and asserting that a class of our stockholders suffered damages due to the alleged dissemination or approval of false and misleading statements by Merge Healthcare from August 1, 2012 through January 7, 2014 related to falsified subscription backlog figures and a reluctance amongst large health systems to make enterprise purchases, as well as a lack of effective controls. Several other putative shareholder class action complaints alleging materially the same causes of action were subsequently filed. A hearing was held on March 26, 2014 before the Court of the Northern District Illinois, at which time the Court granted the motion of the Arkansas Teacher Retirement System (“ATRS”) to consolidate the class action cases and to appoint ATRS as lead plaintiff. ATRS filed an amended complaint on May 28, 2014. We have filed a motion to dismiss the purported class action lawsuit, and we expect a decision on the motion to be rendered in the first quarter of 2015. On February 14, 2014, William B. Federman, who claims to be a Merge Healthcare stockholder, filed a derivative complaint in the Circuit Court of Cook County, Illinois against certain of our current and former directors and officers, asserting breaches of fiduciary duty arising out of materially the same conduct alleged in the securities fraud class action complaints. Subsequently, two other derivative complaints were filed in the United States District Court of the Northern District of Illinois. On June 6, 2014, the judge assigned to the class action case granted our motion to reassign the two Federal derivative actions to her on the basis of relatedness and stayed the Federal derivative cases until she rules on our motion to dismiss the class action case. The plaintiffs in the class action and derivative cases have not claimed a specific amount of damages. Merge Healthcare and the other named defendants are actively considering all possible responses to these complaints. While we intend to defend the claims vigorously and carry directors and officers insurance, it is reasonably possible that we may incur a loss in this matter. At this stage of the proceedings, however, it is not possible for management to reasonably estimate either the likelihood of such a loss or its magnitude.
In addition to the matters discussed above, we are involved in various legal matters that are in the process of litigation or settled in the ordinary course of business. Although the final results of all such matters and claims cannot be predicted with certainty, we believe that the ultimate resolution of all such matters and claims will not have a material adverse effect on Merge Healthcare’s financial condition. Professional legal fees are expensed when incurred. We accrue for contingent losses when such losses are probable and reasonably estimable. In the event that estimates or assumptions prove to differ from actual results, adjustments are made in subsequent periods to reflect more current information. Should we fail to prevail in any legal matter or should several legal matters be resolved against us in the same reporting period, such matters could have a material adverse effect on our operating results and cash flows for that particular period.
Not applicable.
PART II
|
Item 5.
|
Our common stock trades on The NASDAQ Global Select Market (NASDAQ). The following table sets forth for the periods indicated, the high and low sale prices of our common stock as reported by the NASDAQ:
Common Stock Market Prices
|
2014
|
4th Quarter
|
3rd Quarter
|
2nd Quarter
|
1st Quarter
|
||||||||||||
|
High
|
$
|
3.68
|
$
|
2.74
|
$
|
2.67
|
$
|
2.84
|
||||||||
|
Low
|
$
|
2.04
|
$
|
2.20
|
$
|
1.97
|
$
|
1.99
|
||||||||
|
|
||||||||||||||||
|
2013
|
4th Quarter
|
3rd Quarter
|
2nd Quarter
|
1st Quarter
|
||||||||||||
|
High
|
$
|
2.82
|
$
|
4.71
|
$
|
3.79
|
$
|
3.13
|
||||||||
|
Low
|
$
|
2.13
|
$
|
2.35
|
$
|
2.81
|
$
|
2.27
|
||||||||
According to the records of American Stock Transfer & Trust Company, our registrar and transfer agent, we had 423 shareholders of record of common stock as of February 18, 2015.
For information regarding securities authorized for issuance under our equity compensation plans, see Note 8 of the notes to consolidated financial statements included in this Annual Report on Form 10-K.
Stock Price Performance Graph
The graph below compares the cumulative total return on our common stock with the Russell 2000 Index and the NASDAQ Computer Index (U.S. companies) for the period from December 31, 2009 to December 31, 2014. The comparison assumes that $100 was invested on December 31, 2009 in our common stock and in each of the comparison indices, and assumes reinvestment of dividends, where applicable. We have selected the Russell 2000 index for comparison purposes as we do not believe we can reasonably identify an appropriate peer group index. The comparisons shown in the graph below are based upon historical data. The stock price performance shown in the graph below is not indicative of, nor intended to forecast, the potential future performance of our common stock.
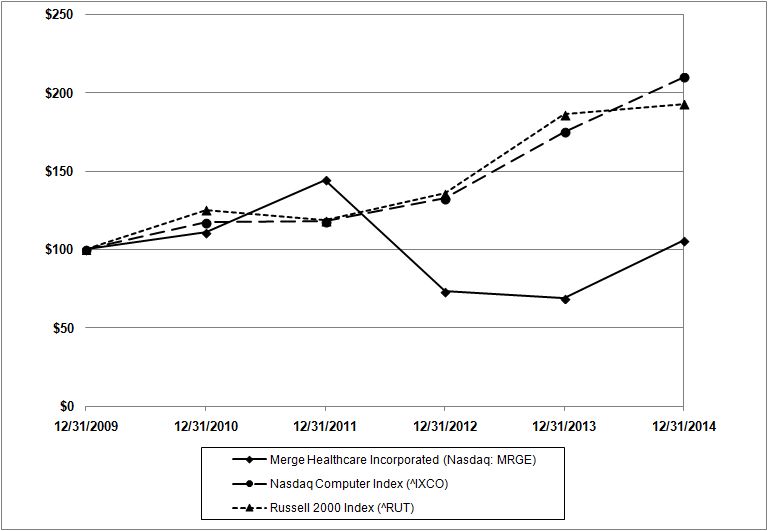
COMPARISON OF THE 5 YEAR CUMULATIVE TOTAL RETURNS
FOR THE FIVE YEAR PERIOD ENDED DECEMBER 31, 2014
|
Date
|
Merge Healthcare Incorporated (Nasdaq: MRGE)
|
Nasdaq Computer Index (^IXCO)
|
Russell 2000 Index (^RUT)
|
|||||||||
|
12/31/2009
|
$
|
100
|
$
|
100
|
$
|
100
|
||||||
|
12/31/2010
|
$
|
111
|
$
|
117
|
$
|
125
|
||||||
|
12/31/2011
|
$
|
144
|
$
|
118
|
$
|
118
|
||||||
|
12/31/2012
|
$
|
74
|
$
|
133
|
$
|
136
|
||||||
|
12/31/2013
|
$
|
69
|
$
|
175
|
$
|
186
|
||||||
|
12/31/2014
|
$
|
106
|
$
|
210
|
$
|
193
|
||||||
Dividend Policy
We are prohibited from making certain dividend payments under the terms of the Credit Agreement for our Term Loan and have not declared any cash dividends on our common stock in the past two fiscal years. We currently do not intend to declare or pay any cash dividends on our common stock in the foreseeable future.
Issuer Purchases of Equity Securities
|
Period
|
Total Number of Shares Purchased
|
Average Price Paid per Share
|
Total Number of Shares Purchased Under Announced Programs
|
Approximate Dollar Value of Shares That May Yet be Purchased Under Announced Programs
|
||||||||||||
|
October 1, 2014 – October 31, 2014
|
—
|
—
|
N/A
|
N/A
|
|
|||||||||||
|
November 1, 2014 – November 30, 2014
|
180,236
|
$
|
3.00
|
N/A
|
|
N/A
|
|
|||||||||
|
December 1, 2014 – December 31, 2014
|
—
|
—
|
N/A
|
|
N/A
|
|
||||||||||
|
Total
|
180,236
|
$
|
3.00
|
N/A
|
|
N/A
|
|
|||||||||
On November 5, 2014, 180,236 shares of common stock, at an average price of $3.00 per share, were delivered by employees back to us as payment for taxes resulting from the lapse of restrictions on restricted stock awards relating to compensation plans. Refer to Note 8 of our consolidated financial statements for additional information on employee incentive plans.
The following selected historical financial data is qualified in its entirety by reference to, and should be read in conjunction with, our consolidated financial statements and the related notes thereto appearing elsewhere herein and Item 7, “Management’s Discussion and Analysis of Financial Condition and Results of Operations” in this Annual Report on Form 10-K.
|
Years Ended December 31,
|
||||||||||||||||||||
|
2014
|
2013
|
2012
|
2011
|
2010 (1)
|
||||||||||||||||
|
(in thousands, except for share and per share data)
|
||||||||||||||||||||
|
Statement of Operations Data:
|
||||||||||||||||||||
|
Net sales
|
$
|
212,304
|
$
|
231,667
|
$
|
248,904
|
$
|
232,428
|
$
|
140,332
|
||||||||||
|
Operating income (loss)
|
23,628
|
9,807
|
6,620
|
29,155
|
(8,524
|
)
|
||||||||||||||
|
Income (loss) before income taxes
|
1,889
|
(36,094
|
)
|
(24,729
|
)
|
(1,866
|
)
|
(25,162
|
)
|
|||||||||||
|
Income tax expense (benefit)
|
2,297
|
2,889
|
4,091
|
3,665
|
(13,646
|
)
|
||||||||||||||
|
Net loss
|
(408
|
)
|
(38,983
|
)
|
(28,820
|
)
|
(5,531
|
)
|
(11,516
|
)
|
||||||||||
|
Net loss attributable to Merge
|
(447
|
)
|
(38,980
|
)
|
(28,802
|
)
|
(5,521
|
)
|
(11,516
|
)
|
||||||||||
|
Net loss available to common shareholders
|
(447
|
)
|
(38,980
|
)
|
(28,802
|
)
|
(8,674
|
)
|
(30,592
|
)
|
||||||||||
|
Net loss per share attributable to common shareholders of Merge
|
||||||||||||||||||||
|
Basic
|
$
|
(0.00
|
)
|
$
|
(0.42
|
)
|
$
|
(0.31
|
)
|
$
|
(0.10
|
)
|
$
|
(0.38
|
)
|
|||||
|
Diluted
|
(0.00
|
)
|
(0.42
|
)
|
(0.31
|
)
|
(0.10
|
)
|
(0.38
|
)
|
||||||||||
|
Weighted average number of common shares outstanding
|
||||||||||||||||||||
|
Basic
|
95,439,676
|
93,727,394
|
92,128,717
|
86,647,097
|
80,231,427
|
|||||||||||||||
|
Diluted
|
95,439,676
|
93,727,394
|
92,128,717
|
86,647,097
|
80,231,427
|
|||||||||||||||
|
|
||||||||||||||||||||
|
|
December 31,
|
|||||||||||||||||||
|
2014
|
2013
|
2012
|
2011
|
2010
|
||||||||||||||||
|
(in thousands)
|
||||||||||||||||||||
|
Balance Sheet Data:
|
||||||||||||||||||||
|
Working capital
|
$
|
13,277
|
$
|
11,889
|
$
|
43,201
|
$
|
46,020
|
$
|
28,357
|
||||||||||
|
Total assets
|
374,337
|
382,081
|
436,853
|
450,387
|
396,645
|
|||||||||||||||
|
Long-term debt obligations
|
213,676
|
233,942
|
250,046
|
249,438
|
195,077
|
|||||||||||||||
|
Shareholders’ equity
|
50,601
|
45,260
|
77,461
|
92,471
|
104,806
|
|||||||||||||||
|
(1)
|
Includes the results of AMICAS from April 28, 2010, the date of the business combination.
|
The discussion below contains “forward-looking statements. We have used words such as “believes,” “intends,” “anticipates,” “expects” and similar expressions to identify forward-looking statements. These statements are based on information currently available to us and are subject to a number of risks and uncertainties that may cause our actual results of operations, financial condition, cash flows, performance, business prospects and opportunities and the timing of certain events to differ materially from those expressed in, or implied by, these statements. These risks, uncertainties and other factors include, without limitation, those matters discussed in Item 1A of Part I of this Annual Report on Form 10-K. Except as expressly required by the federal securities laws, we undertake no obligation to update such factors or to publicly announce the results of any of the forward-looking statements contained herein to reflect future events, developments, or changed circumstances, or for any other reason. The following discussion should be read in conjunction with our consolidated financial statements and notes thereto appearing elsewhere in this Annual Report on Form 10-K and Item 1A, “Risk Factors”.
Management’s Discussion and Analysis is presented in the following order:
| · | Overview |
| · | Business Segments |
| · | Revenue and Expenses |
| · | Results of Operations |
| · | Liquidity and Capital Resources |
| · | Material Off Balance Sheet Arrangements |
| · | Critical Accounting Policies |
Overview
We develop enterprise imaging software solutions that facilitate the management of images to create a more effective and efficient electronic healthcare experience for patients and physicians. Our solutions are designed to help solve some of the most difficult challenges in health information exchange today, such as the incorporation of medical images and diagnostic information into broader healthcare IT applications, the interoperability of proprietary software solutions, and the ability to improve the efficiency and cost effectiveness of our customers’ businesses. We believe that our ability to innovate has driven consistent expansion of solutions and services and entry into new markets.
Our solutions optimize processes for healthcare providers ranging in size from single provider practices to large health systems, to the sponsors of clinical trials and medical device manufacturers.
To ensure we maintain a continued, disciplined approach of cost alignment to sales expectations, we reorganized our leadership team and sales organization to focus on our core markets and right-sized our cost structure, primarily within sales and marketing, in the third quarter of 2013 when it became apparent that certain macro events initiated by the U.S. government would impact sales. Since we believe that market opportunities still exist over the long-term for our products and the solutions we have developed, these actions did not impact our product research and development costs as we continued to invest meaningfully in our product solutions. We believe that investment in our development has been validated by KLAS Research’s 2014 Best in KLAS Awards Software and Services Report in which Merge Healthcare was, for the second year in a row, awarded the “Best in KLAS” honor in the cardiology category for our Merge Cardio solution, and by retaining the number one spot (for the fourth consecutive year) as KLAS Category Leader in cardiology hemodynamics. Merge Healthcare, for the third straight year, was also named the global leader in VNA according to IHS.
Business Segments
We operate under two reportable operating segments: Merge Healthcare and Merge DNA. We evaluate the performance of each operating group based on its respective revenues and operating income.
Our Merge Healthcare segment represents about 85% of our 2014 total revenues and markets, sells and implements interoperability, imaging and clinical solutions to healthcare providers. It generates revenue from the licensing of software (including upgrades), hardware, professional services, maintenance and electronic data interchange (EDI) services.
Our Merge DNA (Data and Analytics) segment represents the other 15% of our 2014 total revenues and focuses on data capture software for clinical trials and other solutions. This segment derives the vast majority of its revenue from software, through both on-premise licensing and hosting arrangements, and professional services. Going forward, we expect that substantially all revenues for Merge DNA will come from clinical trials.
The majority of total revenue continues to be generated through perpetual license agreements with our customers. Under perpetual license agreements, the software, hardware and professional services are considered to be sources of non-recurring revenue.
Subscription-based pricing arrangements involve fees that are payable by our customers over a number of years, including leases, clinical trials software-as-a-service, certain interoperability solutions, and renewable annual software contracts (with very high renewal rates). In 2014, subscription revenue was approximately 16% of total net sales. Previously, these types of contracts included a minimum volume and/or dollar commitment, but, in an effort to increase customer adoption, we recently introduced a no minimum, pay-per-transaction structure for certain products. Subscription based pricing arrangements include contract elements that are recognized ratably over an extended period of time. Subscription arrangements include, but are not limited to, contracts that are structured with monthly payments (including leases), clinical trials or renewable annual software contracts (with very high renewal rates).
The following tables provide operating group information for the periods indicated, based on GAAP reported information.
|
Merge Healthcare Segment
|
Years Ended December 31,
|
Change 2014 vs. 2013
|
||||||||||||||||||
|
2014
|
2013
|
2012
|
$
|
%
|
||||||||||||||||
|
Net sales:
|
||||||||||||||||||||
|
Software and other
|
$
|
51,801
|
$
|
57,371
|
$
|
78,941
|
$
|
(5,570
|
)
|
-9.7
|
%
|
|||||||||
|
Professional services
|
27,162
|
28,290
|
27,552
|
(1,128
|
)
|
-4.0
|
%
|
|||||||||||||
|
Maintenance and EDI
|
102,004
|
107,220
|
110,894
|
(5,216
|
)
|
-4.9
|
%
|
|||||||||||||
|
Total net sales
|
180,967
|
192,881
|
217,387
|
(11,914
|
)
|
-6.2
|
%
|
|||||||||||||
|
Expenses
|
151,809
|
171,838
|
192,408
|
(20,029
|
)
|
-11.7
|
%
|
|||||||||||||
|
Segment income
|
$
|
29,158
|
$
|
21,043
|
$
|
24,979
|
$
|
8,115
|
38.6
|
%
|
||||||||||
|
Merge DNA Segment
|
Years Ended December 31,
|
Change 2014 vs. 2013
|
||||||||||||||||||
| 2014 | 2013 | 2012 | $ |
%
|
||||||||||||||||
|
Net sales:
|
||||||||||||||||||||
|
Software and other
|
$
|
19,283
|
$
|
21,204
|
$
|
15,525
|
$
|
(1,921
|
)
|
-9.1
|
%
|
|||||||||
|
Professional services
|
10,871
|
15,540
|
13,426
|
(4,669
|
)
|
-30.0
|
%
|
|||||||||||||
|
Maintenance and EDI
|
1,183
|
2,042
|
2,566
|
(859
|
)
|
-42.1
|
%
|
|||||||||||||
|
Total net sales
|
31,337
|
38,786
|
31,517
|
(7,449
|
)
|
-19.2
|
%
|
|||||||||||||
|
Expenses
|
27,719
|
35,094
|
33,315
|
(7,375
|
)
|
-21.0
|
%
|
|||||||||||||
|
Segment income (loss)
|
$
|
3,618
|
$
|
3,692
|
$
|
(1,798
|
)
|
$
|
(74
|
)
|
-2.0
|
%
|
||||||||
Merge Healthcare net sales in 2014 were negatively impacted by macro events and the exiting of low margin product lines, the effects of which were more than offset by cost reduction efforts leading to an $8.1 million increase in segment income over 2013. During 2014, Merge DNA completed a two year exit from the low margin health station business and achieved added profitability from the new clinical trials platform, which takes much less professional services to configure. As a result, segment income in 2014 was similar to 2013 despite a decrease in net sales of $7.4 million.
The following tables provide GAAP sales generated by non-recurring, subscription and maintenance and EDI revenue sources by segment for 2014 and 2013.
|
|
Net Sales Year Ended December 31, 2014
|
|||||||||||||||||||||||
|
|
Healthcare
|
DNA
|
Total
|
|||||||||||||||||||||
|
Revenue Source
|
$
|
%
|
$
|
%
|
$
|
%
|
||||||||||||||||||
|
Maintenance & EDI
|
$
|
102,004
|
56.4
|
%
|
$
|
1,183
|
3.8
|
%
|
$
|
103,187
|
48.6
|
%
|
||||||||||||
|
Subscription
|
6,209
|
3.4
|
%
|
27,342
|
87.2
|
%
|
33,551
|
15.8
|
%
|
|||||||||||||||
|
Non-recurring
|
72,754
|
40.2
|
%
|
2,812
|
9.0
|
%
|
75,566
|
35.6
|
%
|
|||||||||||||||
|
Total
|
$
|
180,967
|
100.0
|
%
|
$
|
31,337
|
100.0
|
%
|
$
|
212,304
|
100.0
|
%
|
||||||||||||
|
|
||||||||||||||||||||||||
|
|
85.2
|
%
|
14.8
|
%
|
||||||||||||||||||||
|
|
||||||||||||||||||||||||
|
|
Net Sales Year Ended December 31, 2013
|
|||||||||||||||||||||||
|
|
Healthcare
|
DNA
|
Total
|
|||||||||||||||||||||
|
Revenue Source
|
$
|
%
|
$
|
%
|
$
|
%
|
||||||||||||||||||
|
Maintenance & EDI
|
$
|
107,220
|
55.6
|
%
|
$
|
2,042
|
5.3
|
%
|
$
|
109,262
|
47.2
|
%
|
||||||||||||
|
Subscription
|
7,063
|
3.7
|
%
|
29,951
|
77.2
|
%
|
37,014
|
16.0
|
%
|
|||||||||||||||
|
Non-recurring
|
78,598
|
40.7
|
%
|
6,793
|
17.5
|
%
|
85,391
|
36.8
|
%
|
|||||||||||||||
|
Total
|
$
|
192,881
|
100.0
|
%
|
$
|
38,786
|
100.0
|
%
|
$
|
231,667
|
100.0
|
%
|
||||||||||||
|
|
||||||||||||||||||||||||
|
|
83.3
|
%
|
16.7
|
%
|
||||||||||||||||||||
Revenues and Expenses
The following is a brief discussion of our revenues and expenses:
Net Sales
Net sales consist of:
| · | Software and other sales, net of estimated returns and allowances, including our internally developed software, third party software and hardware revenue recognized in sales to OEM customers, healthcare facilities and other providers; |
| · | Professional services, including hosting, installation, custom engineering services, training, consulting and project management; and |
| · | Maintenance and EDI, including software maintenance and support. |
Cost of Sales
Cost of sales consists of:
| · | Software and other cost of sales, including purchased components and third-party royalties included in software and hardware sales to our customers; |
| · | Professional services cost of sales, including headcount and related costs incurred in our performance of SaaS offerings, installation, custom engineering services, training, consulting and project management; |
| · | Maintenance and EDI cost of sales, including headcount and related costs and direct third-party costs incurred to fulfill our maintenance and support obligations and to deliver EDI services; and |
| · | Depreciation and amortization, including any impairment, for amounts assessed on capital equipment used to fulfill contract obligations as well as our purchased and developed software and backlog assets. Depreciation and amortization are recorded over the respective assets’ useful lives. Each quarter we test our purchased and developed software for impairment by comparing its net realizable value (estimated using undiscounted future cash flows) to the carrying value of the software. If the carrying value of the software exceeds its net realizable value, we record an impairment charge in the period in which the impairment is incurred equal to the amount of the difference between the carrying value and estimated undiscounted future cash flows. |
Sales and Marketing Expense
Sales and marketing expense includes the costs of our sales and marketing departments, commissions and costs associated with trade shows.
Research and Development Expense
Research and development expense consists of expenses incurred for the development of our proprietary software and technologies. The amortization of capitalized software development costs and any related impairments are included in cost of sales.
General and Administrative Expense
General and administrative expense includes costs for information systems, accounting, administrative support, management personnel, bad debt expense, legal fees and general corporate costs.
Acquisition-Related Expenses
Acquisition-related expenses are costs incurred in business combination activities, including banking, legal, accounting, valuation and other professional or consulting fees.
Restructuring and Other Expenses
Restructuring and other expenses consist of severance to involuntarily terminated employees and relocation expenses resulting from our restructuring initiatives, loss on disposal of subsidiaries and impairment of non-cancelable building leases associated with restructuring activities.
Depreciation, Amortization and Impairment
Depreciation and amortization, including any impairment, are assessed on capital equipment, leasehold improvements and our intangible assets which include customer relationships, trade names and non-compete agreements. Depreciation and amortization are recorded over the respective assets’ useful lives. We also record impairment charges on these long-lived assets whenever events or changes in circumstances indicate that the carrying amount of an asset may not be recoverable based primarily upon whether expected future undiscounted cash flows are sufficient to support recovery of the assets.
Loss on Debt Extinguishment
Loss on debt extinguishment includes charges for unamortized debt issuance costs, unamortized net debt discount and early retirement costs.
Other Income (Expense)
Other income (expense) is comprised of interest income earned on cash and cash equivalent balances, interest expense, amortization of costs and discounts incurred from borrowings and issuance costs on borrowings which did not qualify for capitalization. It also includes foreign exchange gains or losses on foreign currency payables and receivables. In addition, we also record any other-than-temporary impairment charges recognized on our equity investments in non-public companies in other income (expense).
Results of Operations
The following have significantly impacted the results of operations for the periods discussed herein:
| · | In the second quarter of 2014, we completed a debt refinancing that resulted in a new six-year term loan (the Term Loan) of $235 million at a 7.00% interest rate. The Term Loan replaced an existing term loan (the Prior Term Loan) at a 6.00% interest rate with more restrictive financial ratio covenants, which was terminated upon completion of the debt refinancing. Proceeds from the Term Loan were used to repay the aggregate principal outstanding under the Prior Term Loan in addition to funding related transaction costs. The Prior Term Loan had an outstanding balance of $230.1 million as of April 29, 2014, and we recorded a non-cash charge of $4.8 million in the second quarter of 2014 associated with its extinguishment. |
| · | In the second quarter of 2013, we entered into a senior secured credit facility consisting of a six-year term loan (the Prior Term Loan) of $255 million issued at 99% of the Term Loan amount and a five-year revolving credit facility (the Revolving Credit Facility) of up to $20 million. The Prior Term Loan replaced $252 million of Senior Secured Notes that bore interest at 11.75% (Notes), which we retired at the same time the Prior Term Loan was funded. We recorded charges of $23.8 million consisting of $5.2 million for unamortized debt issuance costs, $1.7 million for unamortized net debt discount and $16.9 million of early retirement costs associated with the extinguishment for the Notes. |
| · | In 2013, we completed certain restructuring initiatives. These initiatives included the end of life of specific, non-core products at low or negative margins, consolidations of operations surrounding three facilities and the reorganization of our leadership team and sales organization. As a result, we incurred $3.9 million of employee termination and contract exit costs that were recorded in restructuring and other expenses in our statement of operations. |
| · | During the fourth quarter of 2012, we recorded charges of $3.9 million related to third party licenses and technology considered unusable, $1.3 million for the write-off of acquired intangibles and $9.2 million related primarily to uncollectible billings from customer contracts obtained through acquisitions in the past few years. |
Year Ended December 31, 2014 Compared to the Year Ended December 31, 2013
The following table sets forth selected, summarized, consolidated financial data for the periods indicated, as well as comparative data showing increases and decreases between the periods. All amounts, except percentages, are in thousands.
|
|
Years Ended December 31,
|
Change
|
||||||||||||||||||||||
|
|
2014
|
%
|
(1) |
2013
|
%
|
(1) |
$
|
%
|
||||||||||||||||
|
|
||||||||||||||||||||||||
|
Net sales:
|
||||||||||||||||||||||||
|
Software and other
|
$
|
71,084
|
33.5
|
%
|
$
|
78,575
|
33.9
|
%
|
$
|
(7,491
|
)
|
-9.5
|
%
|
|||||||||||
|
Professional services
|
38,033
|
17.9
|
%
|
43,830
|
18.9
|
%
|
(5,797
|
)
|
-13.2
|
%
|
||||||||||||||
|
Maintenance and EDI
|
103,187
|
48.6
|
%
|
109,262
|
47.2
|
%
|
(6,075
|
)
|
-5.6
|
%
|
||||||||||||||
|
Total net sales
|
212,304
|
100.0
|
%
|
231,667
|
100.0
|
%
|
(19,363
|
)
|
-8.4
|
%
|
||||||||||||||
|
Cost of sales:
|
||||||||||||||||||||||||
|
Software and other
|
30,433
|
42.8
|
%
|
41,813
|
53.2
|
%
|
(11,380
|
)
|
-27.2
|
%
|
||||||||||||||
|
Professional services
|
25,092
|
66.0
|
%
|
25,114
|
57.3
|
%
|
(22
|
)
|
-0.1
|
%
|
||||||||||||||
|
Maintenance and EDI
|
27,744
|
26.9
|
%
|
28,989
|
26.5
|
%
|
(1,245
|
)
|
-4.3
|
%
|
||||||||||||||
|
Depreciation and amortization
|
7,475
|
3.5
|
%
|
6,980
|
3.0
|
%
|
495
|
7.1
|
%
|
|||||||||||||||
|
Total cost of sales
|
90,744
|
42.7
|
%
|
102,896
|
44.4
|
%
|
(12,152
|
)
|
-11.8
|
%
|
||||||||||||||
|
Total gross margin
|
121,560
|
57.3
|
%
|
128,771
|
55.6
|
%
|
(7,211
|
)
|
-5.6
|
%
|
||||||||||||||
|
|
||||||||||||||||||||||||
|
Gross margin by net sales category (2)
|
||||||||||||||||||||||||
|
Software and other
|
40,651
|
57.2
|
%
|
36,762
|
46.8
|
%
|
3,889
|
10.6
|
%
|
|||||||||||||||
|
Professional services
|
12,941
|
34.0
|
%
|
18,716
|
42.7
|
%
|
(5,775
|
)
|
-30.9
|
%
|
||||||||||||||
|
Maintenance and EDI
|
75,443
|
73.1
|
%
|
80,273
|
73.5
|
%
|
(4,830
|
)
|
-6.0
|
%
|
||||||||||||||
|
|
||||||||||||||||||||||||
|
Operating expenses:
|
||||||||||||||||||||||||
|
Sales and marketing
|
31,991
|
15.1
|
%
|
36,585
|
15.8
|
%
|
(4,594
|
)
|
-12.6
|
%
|
||||||||||||||
|
Product research and development
|
28,434
|
13.4
|
%
|
32,388
|
14.0
|
%
|
(3,954
|
)
|
-12.2
|
%
|
||||||||||||||
|
General and administrative
|
27,144
|
12.8
|
%
|
34,689
|
15.0
|
%
|
(7,545
|
)
|
-21.8
|
%
|
||||||||||||||
|
Acquisition-related expenses
|
232
|
0.1
|
%
|
906
|
0.4
|
%
|
(674
|
)
|
-74.4
|
%
|
||||||||||||||
|
Restructuring and other expenses
|
-
|
0.0
|
%
|
3,856
|
1.7
|
%
|
(3,856
|
)
|
-100.0
|
%
|
||||||||||||||
|
Depreciation and amortization
|
10,131
|
4.8
|
%
|
10,540
|
4.5
|
%
|
(409
|
)
|
-3.9
|
%
|
||||||||||||||
|
Total operating costs and expenses
|
97,932
|
46.1
|
%
|
118,964
|
51.4
|
%
|
(21,032
|
)
|
-17.7
|
%
|
||||||||||||||
|
Operating income
|
23,628
|
11.1
|
%
|
9,807
|
4.2
|
%
|
13,821
|
140.9
|
%
|
|||||||||||||||
|
Loss on debt extinguishment
|
(4,821
|
)
|
-2.3
|
%
|
(23,822
|
)
|
-10.3
|
%
|
19,001
|
-79.8
|
%
|
|||||||||||||
|
Other expense, net
|
(16,918
|
)
|
-8.0
|
%
|
(22,079
|
)
|
-9.5
|
%
|
5,161
|
-23.4
|
%
|
|||||||||||||
|
Income (loss) before income taxes
|
1,889
|
0.9
|
%
|
(36,094
|
)
|
-15.6
|
%
|
37,983
|
-105.2
|
%
|
||||||||||||||
|
Income tax expense
|
2,297
|
1.1
|
%
|
2,889
|
1.2
|
%
|
(592
|
)
|
-20.5
|
%
|
||||||||||||||
|
Net loss
|
$
|
(408
|
)
|
-0.2
|
%
|
$
|
(38,983
|
)
|
-16.8
|
%
|
$
|
38,575
|
-99.0
|
%
|
||||||||||
| (1) | Percentages are of total net sales, except for cost of sales and gross margin, which are based upon related net sales. |
| (2) | Depreciation and amortization expenses are excluded from these gross margin calculations. |
Net Sales
Software and Other Sales Total software and other sales in 2014 were $71.1 million, a decrease of $7.5 million, or 9.5% from $78.6 million in 2013. Software and other sales in the Merge Healthcare operating segment decreased by $5.6 million, primarily due to delays in customer buying decisions which started in mid-2013 and began to recover during 2014. Software and hardware orders sold through perpetual software agreements in the Merge Healthcare segment are typically fulfilled, and revenue recognized, in either the quarter signed or the following few quarters. Revenue recognized from software and other sales may vary significantly on a quarterly basis.
Merge DNA segment sales decreased $1.9 million. This decrease includes a $9.0 million increase in clinical trials revenue from a platform enhancement introduced in late 2012 which entails more transaction-based software fees and less professional services required to configure the platform. This increase was partially offset by a $2.0 million decline in sales of our legacy clinical trials products for a net increase in clinical trials sales of $7.0 million. Going forward, we expect that substantially all revenue for the Merge DNA segment will come from clinical trials, with continued growth in the new platform and reduction of legacy platform sales.
The net increase in clinical trials revenue in the Merge DNA segment was offset by lower revenue from the sale of health stations as we completed the exit from this low margin product line. This exit occurred over the past two years, concluding in the third quarter of 2014. In 2014, total health station sales and lease revenue related to health stations decreased by $8.6 million as compared to 2013.
Professional Services Sales Total professional services sales in 2014 were $38.0 million, a decrease of $5.8 million, or 13.2% from $43.8 million in 2013. Sales decreased $1.1 million in the Merge Healthcare segment as a result of customer buying delays. Sales in the Merge DNA segment decreased $4.7 million, as a result of the clinical trials platform introduced in late 2012 that resulted in a shift in revenue mix from services to software as the new platform requires significantly less services to configure for customer use and such configuration can be performed by customers themselves. Revenue recognized from professional services sales generally lag software and other sales by one to three quarters due to the timing of when such services are performed compared to when the products are delivered.
Maintenance and EDI Sales Total maintenance and EDI sales in 2014 were $103.2 million, a decrease of $6.1 million, or 5.6%, from $109.3 million in 2013 primarily due our conscious decision to exit certain product lines in the Merge Healthcare segment throughout 2013 that lowered comparable 2014 sales.
Depreciation and Amortization Cost of Sales
Depreciation and amortization expense increased to $7.5 million in 2014 from $7.0 million in 2013, due to the accelerated depreciation related to the remaining $0.8 million of carrying value of health stations that were sold, offset by assets that became fully depreciated in the prior year.
Gross Margin
Gross Margin – Software and Other Sales Gross margin on software and other sales was $40.7 million in 2014, an increase of $3.9 million, or 10.6%, from $36.8 million in 2013. Gross margin as a percentage of software and other sales increased to 57.2% in 2014 from 46.8% in 2013, due, in part to more software being sold and also as a result of greater margins on hardware that was sold in 2014. Hardware sales produce much lower margins than software sales. We expect gross margins on software and other sales to fluctuate depending on the software and hardware mix.
Gross Margin – Professional Services Sales Gross margin on professional service sales was $12.9 million in 2014, a decrease of $5.8 million, or 30.9%, from $18.7 million in 2013. Gross margin as a percentage of professional service sales decreased to 34.0% in 2014, from 42.7% in 2013, primarily due to the billable utilization of our professional services resources as we made a conscious effort to maintain headcount in the Healthcare Segment to ensure customer satisfaction despite the macro events. As the majority of professional services costs are fixed, we expect gross margins to fluctuate depending on billable utilization of these resources.
Gross Margin – Maintenance and EDI Sales Gross margin on maintenance and EDI sales was $75.4 million in 2014, a decrease of $4.8 million, or 6.0%, from $80.3 million in 2013. Gross margin as a percentage of maintenance and EDI sales was 73.1% in 2014 compared to 73.5% in 2013. The dollar change occurred as a result of product lines exited throughout 2013.
Sales and Marketing
Sales and marketing expense decreased $4.6 million, or 12.6%, to $32.0 million in 2014 from $36.6 million in 2013. As a percentage of net sales, sales and marketing expense decreased by 0.7%, to 15.1%, primarily due to lower headcount and headcount related costs associated with a restructuring initiative that occurred in the third quarter of 2013.
Product Research and Development
Product research and development expense decreased $4.0 million, or 12.2 %, to $28.4 million in 2014 from $32.4 million in 2013. The decrease is primarily due to enhancements to our product development and quality assurance processes in the fourth quarter of 2013 which allowed us to capitalize and thus not recognize as an expense, software development cost of $3.9 million in 2014 compared to $0.1 million in 2013. Product research and development expense decreased 12.2% to 13.4% of net sales in 2014.
General and Administrative
General and administrative expense decreased $7.5 million, or 21.8%, to $27.1 million in 2014 from $34.7 million in 2013 primarily due to decreases of $4.8 million in bad debt expense (consisting of a $4.3 million reduction in direct write-offs and a $0.5 million reduction in the year over year provision for doubtful accounts) and $1.1 million in legal fees. General and administrative expense as a percentage of net sales was 12.8% in 2014. The 2013 expense includes a favorable non-cash settlement of a legal matter totaling $2.5 million and non-cash charges consisting of a $1.3 million settlement involving an insignificant acquisition and $0.9 million in expense associated with stock consideration provided for in the settlement of a lawsuit that existed at the time of an insignificant acquisition.
Acquisition-Related Expenses
We did not have any significant acquisition-related activities or expenses in 2014.
Restructuring and other expenses
There were no restructuring and other expenses in 2014. The 2013 expenses of $3.9 million related to restructuring initiatives and included costs involving the end of life of certain non-core products and the reorganization of our leadership team and sales organization.
Depreciation and Amortization
Depreciation and amortization expense decreased $0.4 million, or 3.9%, to $10.1 million in 2014 from $10.5 million in 2013. In the third quarter of 2014, we exited an immaterial product line which resulted in a charge of $0.7 million for the reduction in the useful life of the related customer relationships. Excluding this charge, we experienced an overall decrease in amortization of certain intangible assets which are amortized on a basis consistent with the expected cash flows from such assets (as opposed to a straight-line basis) and assets that became fully depreciated in the prior year.
Loss on Debt Extinguishment
During 2014 and 2013, we refinanced our debt and incurred losses on debt extinguishment of $4.8 million and $23.8 million, respectively. See Note 6 of the notes to the consolidated financial statements for additional information pertaining to the refinancing of our debt.
Other Expense, net
Other expense, net consists primarily of interest expense. Interest expense decreased to $17.2 million in 2014 from $21.8 million in 2013, due to a decrease in the average amount of principal indebtedness outstanding during 2014 and a lower average interest rate during 2014. In addition, other expense, net included a $0.6 million realized loss on an equity security investment in 2013.
Income Tax Expense
In 2014, we recorded income tax expense of $2.3 million compared to income tax expense of $2.9 million in 2013. The income tax benefit or expense in each year results from the mix of profit or loss in the U.S. and Canadian operations, state income taxes, valuation allowance establishment or releases and the deferred effect of tax deductible goodwill amortization. The current year expense includes a $0.6 million benefit related to releasing the valuation allowance on Merge Healthcare Solutions’ state jurisdictions. The original valuation allowance was acquired via a historical acquisition in which the acquired business had previously provided a full valuation allowance on its deferred tax assets. At the time of the acquisition, the acquired business had incurred cumulative losses and there existed significant uncertainty surrounding the successful integration of the business and its future profitability. Merge Healthcare Solutions is now in a three year cumulative pre-tax book income position and we have met internal policies in order to rely on income forecasts specific to the legal entity or filing group. We believe consistent profitability over six quarters, i.e. eighteen months, is a reasonable period over which to evaluate management’s ability to project future profits and rely on forecasted earnings. Only state income taxes resulted in cash tax payments in each year. Our expected effective income tax rate may vary significantly due to changes in, among other items, operating income by jurisdiction and the results of changes in tax laws and regulations of the U.S. and foreign jurisdictions in which we operate.
Year Ended December 31, 2013 Compared to the Year Ended December 31, 2012
The following table sets forth selected, summarized, consolidated financial data for the periods indicated, as well as comparative data showing increases and decreases between the periods. All amounts, except percentages, are in thousands.
|
Years Ended December 31,
|
Change
|
|||||||||||||||||||||||
|
2013
|
%
|
(1) |
2012
|
%
|
(1)
|
$
|
%
|
|||||||||||||||||
|
Net sales:
|
||||||||||||||||||||||||
|
Software and other
|
$
|
78,575
|
33.9
|
%
|
$
|
94,466
|
38.0
|
%
|
$
|
(15,891
|
)
|
-16.8
|
%
|
|||||||||||
|
Professional services
|
43,830
|
18.9
|
%
|
40,978
|
16.5
|
%
|
2,852
|
7.0
|
%
|
|||||||||||||||
|
Maintenance and EDI
|
109,262
|
47.2
|
%
|
113,460
|
45.5
|
%
|
(4,198
|
)
|
-3.7
|
%
|
||||||||||||||
|
Total net sales
|
231,667
|
100.0
|
%
|
248,904
|
100.0
|
%
|
(17,237
|
)
|
-6.9
|
%
|
||||||||||||||
|
Cost of sales:
|
||||||||||||||||||||||||
|
Software and other
|
41,813
|
53.2
|
%
|
43,281
|
45.8
|
%
|
(1,468
|
)
|
-3.4
|
%
|
||||||||||||||
|
Professional services
|
25,114
|
57.3
|
%
|
24,693
|
60.3
|
%
|
421
|
1.7
|
%
|
|||||||||||||||
|
Maintenance and EDI
|
28,989
|
26.5
|
%
|
31,090
|
27.4
|
%
|
(2,101
|
)
|
-6.8
|
%
|
||||||||||||||
|
Depreciation, amortization and impairment
|
6,980
|
3.0
|
%
|
8,987
|
3.6
|
%
|
(2,007
|
)
|
-22.3
|
%
|
||||||||||||||
|
Total cost of sales
|
102,896
|
44.4
|
%
|
108,051
|
43.4
|
%
|
(5,155
|
)
|
-4.8
|
%
|
||||||||||||||
|
Total gross margin
|
128,771
|
55.6
|
%
|
140,853
|
56.6
|
%
|
(12,082
|
)
|
-8.6
|
%
|
||||||||||||||
|
Gross margin by net sales category (2)
|
||||||||||||||||||||||||
|
Software and other
|
36,762
|
46.8
|
%
|
51,185
|
54.2
|
%
|
(14,423
|
)
|
-28.2
|
%
|
||||||||||||||
|
Professional services
|
18,716
|
42.7
|
%
|
16,285
|
39.7
|
%
|
2,431
|
14.9
|
%
|
|||||||||||||||
|
Maintenance and EDI
|
80,273
|
73.5
|
%
|
82,370
|
72.6
|
%
|
(2,097
|
)
|
-2.5
|
%
|
||||||||||||||
|
Operating expenses:
|
||||||||||||||||||||||||
|
Sales and marketing
|
36,585
|
15.8
|
%
|
43,908
|
17.6
|
%
|
(7,323
|
)
|
-16.7
|
%
|
||||||||||||||
|
Product research and development
|
32,388
|
14.0
|
%
|
32,419
|
13.0
|
%
|
(31
|
)
|
-0.1
|
%
|
||||||||||||||
|
General and administrative
|
34,689
|
15.0
|
%
|
42,366
|
17.0
|
%
|
(7,677
|
)
|
-18.1
|
%
|
||||||||||||||
|
Acquisition-related expenses
|
906
|
0.4
|
%
|
3,402
|
1.4
|
%
|
(2,496
|
)
|
-73.4
|
%
|
||||||||||||||
|
Restructuring and other expenses
|
3,856
|
1.7
|
%
|
830
|
0.4
|
%
|
3,026
|
NM
|
||||||||||||||||
|
Depreciation, amortization and impairment
|
10,540
|
4.5
|
%
|
11,308
|
4.5
|
%
|
(768
|
)
|
-6.8
|
%
|
||||||||||||||
|
Total operating costs and expenses
|
118,964
|
51.4
|
%
|
134,233
|
53.9
|
%
|
(15,269
|
)
|
-11.4
|
%
|
||||||||||||||
|
Operating income (loss)
|
9,807
|
4.2
|
%
|
6,620
|
2.7
|
%
|
3,187
|
48.1
|
%
|
|||||||||||||||
|
Loss on debt extinguishment
|
(23,822
|
)
|
-10.3
|
%
|
-
|
0.0
|
%
|
(23,822
|
)
|
NM
|
(3)
|
|||||||||||||
|
Other expense, net
|
(22,079
|
)
|
-9.5
|
%
|
(31,349
|
)
|
-12.6
|
%
|
9,270
|
-29.6
|
%
|
|||||||||||||
|
Loss before income taxes
|
(36,094
|
)
|
-15.6
|
%
|
(24,729
|
)
|
-9.9
|
%
|
(11,365
|
)
|
46.0
|
%
|
||||||||||||
|
Income tax expense
|
2,889
|
1.2
|
%
|
4,091
|
1.7
|
%
|
(1,202
|
)
|
-29.4
|
%
|
||||||||||||||
|
Net loss
|
$
|
(38,983
|
)
|
-16.8
|
%
|
$
|
(28,820
|
)
|
-11.6
|
%
|
$
|
(10,163
|
)
|
35.3
|
%
|
|||||||||
| (1) | Percentages are of total net sales, except for cost of sales and gross margin, which are based upon related net sales. |
| (2) | Depreciation, amortization and impairment expenses are excluded from these gross margin calculations. |
| (3) | NM denotes percentage is not meaningful. |
Net Sales
Software and Other Sales Total software and other sales in 2013 were $78.6 million, a decrease of $15.9 million, or 16.8% from $94.5 million in 2012. Software and other sales decreased $21.6 million in our Merge Healthcare segment, primarily due to the customer buying delays we experienced as a result of a change in market conditions in 2013.
Merge DNA segment sales increased $5.7 million. The increase includes a $5.4 millionincrease in clinical trials revenue from the aforementioned platform enhancement. This increase was partially offset by a $3.4 million decline in sales of our legacy clinical trials products for a net increase in clinical trials sales of $2.0 million. In 2013, total health station sales and lease revenues related to health stations were $3.7 million more than the prior year, as we began exiting this lower margin product line.
Professional Services Sales Total professional services sales in 2013 were $43.8 million, an increase of $2.8 million, or 7.0% from $41.0 million in 2012. Professional services sales in our Merge Healthcare segment increased $0.7 million as a direct result of the increase in overall perpetual software license agreements. Professional services sales in our Merge DNA segment increased $2.1 million, primarily due to increased clinical trials sales.
Maintenance and EDI Sales Total maintenance and EDI sales in 2013 were $109.3 million, a decrease of $4.2 million, or 3.7%, from $113.5 million in 2012. The decrease is primarily due to a decrease in software maintenance support sales as we exited unprofitable product lines (see restructuring and other expenses discussion).
Depreciation, Amortization and Impairment Cost of Sales
Depreciation, amortization and impairment decreased $2.0 million, or 22.3%, to $7.0 million in 2013 from $9.0 million in 2012, primarily due to a decrease in amortization related to certain acquired intangible assets which were written off in 2012, including the related $0.8 million charge for the write-off of those acquired intangibles in 2012.
Gross Margin
Gross Margin – Software and Other Sales Gross margin on software and other sales was $36.8 million in 2013, a decrease of $14.4 million, or 28.2%, from $51.2 million in 2012. Gross margin as a percentage of software and other sales decreased to 46.8% in 2013 from 54.2% in 2012, due to a decrease in software sales which produce a much greater margin than do hardware sales. Hardware sales were 48.0% of software and other sales in 2013 compared to 40.0% in 2012, primarily due to the aforementioned kiosk sales.
Gross Margin – Professional Services Sales Gross margin on professional service sales was $18.7 million in 2013, an increase of $2.4 million, or 14.9%, from $16.3 million in 2012. Gross margin as a percentage of professional service sales increased to 42.7% in 2013 from 39.7% in 2012, primarily due to the billable utilization of our professional services resources.
Gross Margin – Maintenance and EDI Sales Gross margin on maintenance and EDI sales was $80.3 million in 2013, a decrease of $2.1 million, or 2.5%, from $82.4 million in 2012. Gross margin as a percentage of maintenance and EDI sales increased to 73.5% in 2013 compared to 72.6% in 2012, as we continued to focus on controlling third party costs.
Sales and Marketing
Sales and marketing expense decreased $7.3 million, or 16.7%, to $36.6 million in 2013 from $43.9 million in 2012. As a percentage of net sales, sales and marketing decreased by 1.8%, to 15.8%, primarily due to the restructuring activity undertaken in the third quarter of 2013.
Product Research and Development
Product research and development expense in 2013 was flat when compared to 2012. As a percentage of net sales, product research and development increased to 14.0% in 2013 compared to 13.0% in 2012as we continued to invest in both new product innovation and enhancement of our existing solutions.
General and Administrative
General and administrative expense decreased $7.7 million, or 18.1%, to $34.7 million in 2013 from $42.4 million in 2012. Offsetting factors caused this change and include a reduction in bad debt expense of $7.0 million. The 2013 expense includes a favorable non-cash settlement of $2.5 million (for which significant legal costs were incurred in prior periods) and and non-cash charges consisting of a $1.3 million settlement surrounding an insignificant acquisition and $0.9 million expense associated with stock consideration provided for in the settlement of a lawsuit that existed at the time of an insignificant acquisition. General and administrative expense as a percentage of net sales was 15.0% in 2013 compared to 17.0% in 2012.
Acquisition-Related Expenses
Acquisition-related expenses decreased $2.5 million in 2013 to $0.9 million, from $3.4 million in 2012 primarily due to reduced activities in the year.
Restructuring and other expenses
We incurred $3.9 million and $0.8 million of employee termination and contract exit costs that were recorded in restructuring and other expenses in our statement of operations in 2013 and 2012, respectively, as a result of specific initiatives in each year.
Depreciation, Amortization and Impairment
Depreciation, amortization and impairment expense decreased $0.8 million, or 6.8%, to $10.5 million in 2013 from $11.3 million in 2012.
Loss on Debt Extinguishment
During the second quarter of 2013, we recorded a charge of $23.8 million for the early extinguishment of our Notes. This charge consisted of $5.2 million for unamortized debt issuance costs, $1.7 million for unamortized net debt discount and $16.9 million for early retirement costs.
Other Expense, net
Other expense, net, decreased $9.2 million to $22.1 million in 2013 compared to $31.3 million in 2012. The decrease is primarily due to debt refinancing activities that resulted in a lower interest rate and $11.2 million less expense in 2013. Other expense, net included a $0.6 million realized loss on an equity investment in 2013, while 2012 included a $0.5 million gain on the same equity security investment as well as a favorable legal settlement of $0.3 million.
Income Tax Expense
In 2013, we recorded income tax expense of $2.9 million on a pre-tax book loss of $36.1 million, resulting in a negative annual effective tax rate of 8.0% compared to a $4.1 million tax expense in 2012 and a negative effective tax rate of 16.5% The tax expense in each year resulted from profitable Canadian operations (which was greater in 2012), state income taxes, and the deferred effect of tax deductible goodwill amortization. Only the state income taxes resulted in cash tax payments. Our expected effective income tax rate is volatile and may move up or down with changes in, among other items, operating income and the results of changes in tax law and regulations of the U. S. and the foreign jurisdictions in which we operate.
Liquidity and Capital Resources
Our cash and cash equivalents were $42.5 million at December 31, 2014, an increase of approximately $22.8 million, or 115.7%, from our balance of $19.7 million at December 31, 2013. We used cash generated from successful collection activities to pay down additional debt principal of $8.0 million and $15.0 million ahead of schedule in 2014 and 2013, respectively. The Credit Agreement includes a required annual repayment of principal at no premium in the first quarter of each year based upon a defined calculation of excess cash flows generated by us. Our working capital was $13.3 million at December 31, 2014, an increase of $1.4 million from our working capital of $11.9 million at December 31, 2013.
Operating Cash Flows
As set forth in the statement of cash flows included in our audited financial statements, cash provided by operating activities was $42.6 million in 2014, compared to cash provided by operating activities of $21.3 million in 2013 and cash used by operating activities of $0.6 million in 2012. The net loss in each of the years 2014, 2013 and 2012 includes non-cash expenses of $31.0 million, $51.3 million and $43.8 million, respectively. We also incurred and paid $15.9 million, $24.8 million and $29.8 million in interest expense on our debt in 2014, 2013 and 2012. We paid Zero, $2.8 million and $1.5 million related to restructuring activities during 2014, 2013 and 2012 respectively. Average quarterly days sales outstanding (DSOs) in 2014 were 88 days compared to a 106 days in 2013 and 103 days in 2012.
Investing Cash Flows
Cash used in investing activities was $5.9 million in 2014, $0.6 million in 2013 and $3.4 million in 2012. We purchased $1.8 million, $2.2 million and $2.2 million of fixed assets and $0.3 million, $0.5 million and zero purchased technology for use in our product offerings during 2014, 2013 and 2012, respectively. We capitalized software development costs of $3.9 million in 2014 compared to $0.1 million in 2013 and none in 2012. We expect to continue capitalizing software development costs in the future. In 2012, we paid $0.9 million, net of cash acquired, for insignificant acquisitions.
Financing Cash Flows
Cash used in financing activities was $13.6 million in 2014, compared to $36.3 million in 2013. Cash provided by financing activities was $0.6 million in 2012. The decrease of $22.7 million in 2014 from 2013 is primarily due to $21.5 million of costs incurred on our 2013 debt refinancing. Principal payments made on our term loans also decreased by $1.8 million in 2014, but included $8.0 million of voluntary principal payments. Required minimum principal payments of $1.3 million and voluntary principal payments of $15.0 million were made on our debt during 2013. There were no principal payments is on our debt nor a debt refinancing in 2012.
The 2013 debt refinancing consisted of a $16.9 million penalty for early extinguishment of debt and debt issuance costs of $4.6 million. Proceeds from the exercise of stock options and common stock purchased under the employee stock purchase plan were $1.2 million, $1.5 million and $1.0 million, respectively, in 2014, 2013 and 2012.
Contractual Obligations
Total outstanding commitments as of December 31, 2014 (in thousands), were as follows:
|
|
Payment due by period
|
|||||||||||||||||||
|
Contractual Obligations
|
Total
|
Less than
1 Year |
1 – 3 Years
|
3 – 5 Years
|
More than
5 Years |
|||||||||||||||
|
Operating leases
|
$
|
11,988
|
$
|
2,152
|
$
|
2,816
|
$
|
2,604
|
$
|
4,416
|
||||||||||
|
Capital leases (including interest)
|
275
|
254
|
21
|
-
|
-
|
|||||||||||||||
|
Acquisition obligations
|
267
|
267
|
-
|
-
|
-
|
|||||||||||||||
|
Term loan (including interest and fees)
|
304,787
|
27,747
|
53,034
|
49,656
|
174,350
|
|||||||||||||||
|
Patent license obligation
|
1,125
|
125
|
250
|
250
|
500
|
|||||||||||||||
|
Other notes payable (including interest)
|
50
|
26
|
10
|
14
|
-
|
|||||||||||||||
|
Total
|
$
|
311,492
|
$
|
30,571
|
$
|
56,131
|
$
|
52,524
|
$
|
179,266
|
||||||||||
The above obligations include lease payments for facilities that we use.
We do not have any other significant long-term obligations, contractual obligations, lines of credit, standby letters of credit, guarantees, standby repurchase obligations or other commercial commitments except for the contractual obligations shown above as of December 31, 2014.
As of December 31, 2014, approximately $1.1 million of our cash balance was held by our foreign subsidiaries. We may need to accrue and pay taxes if we choose to repatriate these funds.
General
We believe our current cash and cash equivalent balances will be sufficient to meet our operating, financing and capital requirements through at least the next 12 months, including minimum principal and interest payments due under the Term Loan. However, any projections of future cash inflows and outflows are subject to uncertainty. In the event that it is necessary to raise additional capital to meet our short term or long term liquidity needs, such capital may be raised through additional debt, equity offerings or sale of certain assets, however our ability to undertake such transactions may be limited by the Credit Agreement. If we raise additional funds through the issuance of equity, equity-related or debt securities, such securities may have rights, preferences or privileges senior to those of our common stock. Furthermore, the number of shares of any new equity or equity-related securities that may be issued may result in significant dilution to existing shareholders. In addition, the issuance of debt securities could increase the liquidity risk or perceived liquidity risk that we face. We cannot, however, be certain that additional financing, or funds from asset sales, will be available on acceptable terms. If adequate funds are not available or are not available on acceptable terms, we will likely not be able to take advantage of opportunities, develop or enhance services or products or respond to competitive pressures. In particular, our uses of cash in 2015 and beyond will depend on a variety of factors such as the costs to implement our business strategy, the amount of cash that we are required to devote to defend and address any legal or regulatory proceedings, and potential merger and acquisition activities. Liquidity on a go forward basis is dependent on our ability to meet covenants in our Credit Agreement, including certain financial covenants. For a description of the other covenants included in our Credit Agreement, see Note 6 of the notes to consolidated financial statements included in this Annual Report on Form 10-K.
Material Off Balance Sheet Arrangements
We have no material off balance sheet arrangements.
Critical Accounting Policies
Our consolidated financial statements are impacted by the accounting policies used and the estimates, judgments, and assumptions made by management during their preparation. We base our estimates and judgments on our experience, our current knowledge (including terms of existing contracts), our beliefs of what could occur in the future, our observation of trends in the industry, information provided by our customers and information available from other sources. Actual results may differ from these estimates under different assumptions or conditions.
We have identified the following accounting policies and estimates as those that we believe are most critical to our financial condition and results of operations and that require management’s most subjective and complex judgments in estimating the effect of inherent uncertainties: revenue recognition, allowance for doubtful accounts and sales returns, intangible assets and goodwill, share-based compensation expense, income taxes, guarantees and loss contingencies.
Revenue Recognition
Revenues are derived primarily from the licensing of software, sales of hardware and related ancillary products, SaaS offerings, installation and engineering services, training, consulting, and software maintenance and EDI. Inherent to software revenue recognition are significant management estimates and judgments in the interpretation and practical application of the complex rules to individual contracts. These interpretations generally would not influence the amount of revenue recognized, but could influence the timing of such revenues. In addition, revenue results are difficult to predict, and any shortfall in revenue or delay in recognizing revenue could cause our operating results to vary significantly from period to period. Significant areas of judgment include:
| · | The determination of deliverables specified in a multiple-element arrangement and treatment as separate units of accounting; |
| · | Whether separate arrangements with the same customer executed within a short time frame of each other are a single arrangement; |
| · | The assessment of the probability of collection and the current credit worthiness of each customer since we generally do not request collateral from customers; |
| · | The determination of whether the fees are fixed and determinable; |
| · | Whether or not installation, engineering or consulting services are significant to the software licensed; and |
| · | The amount of total estimated labor hours, based on management’s best estimate, to complete a project we account for under the input method of percentage of completion accounting. We review our contract estimates periodically to assess revisions in contract values and estimated labor hours, and reflect changes in estimates in the period that such estimates are revised under the cumulative catch-up method. |
Typically, our contracts contain multiple elements, and while the majority of our contracts contain standard terms and conditions, there are instances where our contracts contain non-standard terms and conditions. As a result, contract interpretation is sometimes required to determine the appropriate accounting. We analyze our multiple element arrangements to determine the estimated selling price of each element, the amount of revenue to be recognized upon shipment, if any, and the period and conditions under which deferred revenue should be recognized. As a result, if facts and circumstances change that affect our current judgments, our revenue could be materially different in the future.
Allowance for Doubtful Accounts and Sales Returns
Based upon past experience and judgment, we establish allowances for doubtful accounts related to our accounts receivable and customer credits with respect to our sales returns. We determine collection risk and record allowances for bad debts based on the aging of accounts and past transaction history with customers. In addition, our policy is to allow sales returns when we have preauthorized the return. We have determined an allowance for estimated returns and credits based on our historical experience of returns and customer credits. We monitor our collections, write-offs, returns and credit experience to assess whether adjustments to our allowance estimates are necessary. Changes in trends in any of the factors that we believe impact the realizability of our receivables or modifications to our credit standards, collection, return and credit, authorization practices or other related policies may impact our estimates.
Intangible Assets and Goodwill
Intangible assets include purchased software, capitalized software, customer relationships, backlog, trade names, and non-compete agreements. Finite-lived intangible assets are amortized to reflect the pattern in which the economic benefits are consumed, which is primarily the straight-line method.
Purchased software and capitalized software are tested for impairment quarterly by comparing the net realizable value (estimated using undiscounted future cash flows) to the carrying value of the software. If the carrying value of the software exceeds its net realizable value, we record an impairment charge in the period in which the impairment is incurred equal to the amount of the difference between the carrying value and estimated undiscounted future cash flows.
Customer relationships, backlog, trade names and non-compete agreements are evaluated for potential impairment whenever events or circumstances indicate that the carrying amount may not be recoverable, based primarily upon whether expected future undiscounted cash flows are sufficient to support the asset’s recovery. If the actual useful life of the asset is shorter than the useful life estimated by us, the asset may be deemed to be impaired, and, accordingly, a write-down of the value of the asset determined by a discounted cash flow analysis, or a shorter amortization period, may be required. We have reviewed these long-lived assets with estimable useful lives and determined that their carrying values as of December 31, 2014 are recoverable in future periods.
We review goodwill for impairment annually or more frequently if impairment indicators arise. Our policy provides that goodwill will be reviewed for impairment as of October 1st of each year. In calculating potential impairment losses, we evaluate the fair value of our reporting units using either quoted market prices or, if not available, by estimating the expected present value of their future cash flows. We use a two-step impairment test. The first step of the goodwill impairment test, used to identify potential impairment, compares the fair value of a reporting unit with its carrying amount, including goodwill. If the fair value of a reporting unit exceeds its carrying amount, goodwill of the reporting unit is considered not impaired, thus the second step of the impairment test is unnecessary. If the carrying amount of a reporting unit exceeds its fair value, the second step of the goodwill impairment test is performed to measure the amount of impairment loss, if any. The second step of the goodwill impairment test, used to measure the amount of impairment loss, compares the implied fair value of reporting unit goodwill with the carrying amount of that goodwill. If the carrying amount of reporting unit’s goodwill exceeds the implied fair value of that goodwill, an impairment loss is recognized in an amount equal to that excess.
Identification of, and assignment of assets and liabilities to, a reporting unit require our judgment and estimates. In addition, future cash flows are based upon our assumptions about future sales activity and market acceptance of our products. If these assumptions change, we may be required to write down the gross value of our remaining goodwill to a revised amount. We performed our goodwill testing and determined that there is no impairment as of December 31, 2014, since the fair value of our reporting units substantially exceeded the carrying value.
Software Development Costs
Costs incurred internally in creating computer software solutions and enhancements to those solutions are expensed until completion of a detailed program design, when technological feasibility has been established. Thereafter, all software development costs are capitalized until the software solutions and enhancements are available for general release, and subsequent capitalized costs are reported at the lower of amortized cost or net realizable value.
Net realizable value is computed as the estimated gross future revenues from each software solution less the amount of estimated future costs of completing and distributing of that product. Because the development of projected net future revenues related to our software solutions used in our net realizable value computation is based on estimates, a significant reduction in our future revenues could impact the recovery of our capitalized software development costs.
Capitalized costs are amortized straight-line over the estimated economic life of the software solution with minimum annual amortization based on current and expected net future revenue for each software solution. We are generally amortizing capitalized costs over five years. The five-year period over which capitalized software development costs are amortized is an estimate based upon our forecast of a reasonable useful life for the capitalized costs. Historically, use of our software programs by our clients has exceeded five years and is capable of being used a decade or more.
Share-based Compensation Expense
We calculate share-based compensation expense for option awards based on the estimated grant-date fair value using the Black-Scholes option pricing model, and recognize the expense on a straight-line basis over the vesting period, net of estimated forfeitures. The fair value of stock-based awards is based on certain assumptions, including:
| · | Expected volatility, which we base on the historical volatility of our stock and other factors; and |
| · | Estimated option life, which represents the period of time the options granted are expected to be outstanding and is based, in part, on historical data. |
We also estimate employee terminations (option forfeiture rate), which is based, in part, on historical data, employee class and the type of award. We evaluate the assumptions used to value stock options and restricted stock awards on a quarterly basis. The estimation of share-based awards that will ultimately vest requires judgment, and to the extent actual results or updated estimates differ from our current estimates, such amounts will be recorded as a cumulative adjustment in the period estimates are revised. Although we believe our assumptions used to calculate share-based compensation expense are reasonable, these assumptions can involve complex judgments about future events, which are open to interpretation and inherent uncertainty. In addition, significant changes to our assumptions could significantly impact the amount of expense recorded in a given period.
Income Taxes
As part of the process of preparing our consolidated financial statements, we are required to estimate income taxes in each of the jurisdictions in which we operate. Our provision for income taxes is determined using the asset and liability approach to account for income taxes. A current liability is recorded for the estimated taxes payable for the current year. Deferred tax assets and liabilities are recorded for the estimated future tax consequences attributable to differences between the financial statement carrying amounts of existing assets and liabilities and their respective tax bases. Deferred tax assets and liabilities are measured using the enacted tax rates in effect for the year in which the timing differences are expected to be recovered or settled. The effect on deferred tax assets and liabilities of changes in tax rates or tax laws are recognized in the provision for income taxes in the period that includes the enactment date.
Valuation allowances are established, when necessary, to reduce deferred tax assets to the amount more-likely-than-not to be realized. Changes in valuation allowances will flow through the statement of operations unless related to deferred tax assets that expire unutilized or are modified through translation, in which case both the deferred tax asset and related valuation allowance are similarly adjusted. Where a valuation allowance was established through purchase accounting for acquired deferred tax assets, any future change will be credited or charged to income tax expense.
The determination of our provision for income taxes requires significant judgment, the use of estimates, and the interpretation and application of complex tax laws. We are subject to income taxes in the U.S. and numerous foreign jurisdictions. Significant judgment is required in determining our worldwide provision for income taxes and recording the related tax assets and liabilities. In the ordinary course of our business, there are transactions and calculations for which the ultimate tax determination is uncertain. In spite of our belief that we have appropriate support for all the positions taken on our tax returns, we acknowledge that certain positions may be successfully challenged by the taxing authorities. We determine the tax benefits more likely than not to be recognized with respect to uncertain tax positions. Unrecognized tax benefits are evaluated quarterly and adjusted based upon new information, resolution with taxing authorities and expiration of the statute of limitations. The provision for income taxes includes the impact of changes in the liability for our uncertain tax positions. Although we believe our recorded tax assets and liabilities are reasonable, tax laws and regulations are subject to interpretation and inherent uncertainty; therefore, our assessments can involve both a series of complex judgments about future events and rely on estimates and assumptions. Although we believe these estimates and assumptions are reasonable, the final determination could be materially different than that which is reflected in our provision for income taxes and recorded tax assets and liabilities.
Guarantees
We recognize the importance of identifying the fair value of guarantee and indemnification arrangements issued or modified by us, as applicable. In addition, we must continue to monitor the conditions that are subject to the guarantees and indemnifications in order to identify if a loss has occurred. If we determine it is probable that a loss has occurred, then any such estimable loss would be recognized under those guarantees and indemnifications.
Under our standard software license agreements, we agree to indemnify, defend and hold harmless our licensees from and against certain losses, damages and costs arising from claims alleging the licensees’ use of our software infringes the intellectual property rights of a third party. Historically, we have not been required to pay material amounts in connection with claims asserted under these provisions, and, accordingly, we have not recorded a liability relating to such provisions. We also represent and warrant to licensees that our software products will operate substantially in accordance with published specifications, and that the services we perform will be undertaken by qualified personnel in a professional manner conforming to generally accepted industry standards and practices. Historically, only minimal costs have been incurred relating to the satisfaction of product warranty claims.
Other guarantees include promises to indemnify, defend and hold harmless each of our executive officers, non-employee directors and certain key employees from and against losses, damages and costs incurred by each such individual in administrative, legal or investigative proceedings arising from alleged wrongdoing by the individual while acting in good faith within the scope of his or her job duties on our behalf.
Loss Contingencies
We have accrued for costs as of December 31, 2014 and may, in the future, accrue for costs associated with certain contingencies when such costs are probable and reasonably estimable. Liabilities established to provide for contingencies are adjusted as further information develops, circumstances change, or contingencies are resolved.
Recent Accounting Pronouncements
We describe below recent pronouncements that have had or may have a significant effect on our financial statements or have an effect on our disclosures. We do not discuss recent pronouncements that are not anticipated to have an impact on or are unrelated to our financial condition, statement of operations, or related disclosures.
In July 2013, the FASB issued ASU No. 2013-11, Presentation of an Unrecognized Tax Benefit When a Net Operating Loss Carryforward, a Similar Tax Loss, or a Tax Credit Carryforward Exist, which is included in ASC Topic 740 (Income Taxes). ASU 2013-11 requires an entity to net its liability for unrecognized tax positions against a net operating loss carryforward, a similar tax loss or a tax credit carryforward when settlement in this manner is available under the tax law. The provisions of this new guidance are effective for reporting periods beginning after December 15, 2013. We applied this guidance in the first quarter of 2014 and it did not have a material impact on our statement of operations, financial position, or cash flows.
In April 2014, the FASB issued ASU No. 2014-08, Reporting Discontinued Operations and Disclosures of Disposals of Components of an Entity, which changes the criteria for determining which disposals can be presented as discontinued operations and modifies the related disclosure requirements. To qualify as a discontinued operation the standard requires a disposal to represent a strategic shift that has, or will have, a major effect on an entity's operations and financial results. The standard also expands the disclosures for discontinued operations and requires new disclosures related to individually material dispositions that do not qualify as discontinued operations. The standard is effective prospectively for fiscal years beginning after December 15, 2014, with early adoption permitted. We applied this guidance in the third quarter of 2014 and it did not have a material impact on our statement of operations, financial position, or cash flows.
In May 2014, the FASB issued ASU No. 2014- 09, Revenue from Contracts with Customers (Topic 606). ASU 2014-09 also adds Subtopic 340-40 Other Assets and deferred Costs‒Contracts with Customers. The FASB issued ASU 2014-09 to clarify the principles for recognizing revenue and to develop a common revenue standard for generally accepted accounting principles and International Financial Reporting Standards. The standard outlines a single comprehensive model for entities to use in accounting for revenue arising from contracts with customers and supersedes the most current revenue recognition guidance. ASU 2014-09 requires retrospective application either, a) to each prior period presented, or, b) retrospectively with the cumulative effect of initially applying the guidance recognized at the date of initial application as an adjustment to opening retained earnings. The provisions of this new guidance are effective for annual reporting periods beginning after December 15, 2016, including interim reporting periods within that reporting period. Earlier application is not permitted. We are currently evaluating the impact of the new guidance on our financial statements.
In August 2014, the FASB issued ASU No. 2014-15, Presentation of Financial Statements—Going Concern (Subtopic 205-40), Disclosure of Uncertainties about an Entity’s Ability to Continue as a Going Concern which requires management to evaluate, in connection with preparing financial statements for each annual and interim reporting period, whether there are conditions or events, considered in the aggregate, that raise substantial doubt about an entity’s ability to continue as a going concern within one year after the date that the financial statements are issued (or within one year after the date that the financial statements are available to be issued when applicable) and provide related disclosures. ASU 2014-15 is effective for the annual period ending after December 15, 2016, and for annual and interim periods thereafter. Early adoption is permitted. We are currently evaluating the impact of the new guidance on our financial statements.
In November 2014, the FASB issued ASU No. 2014-17, Business Combinations (Topic 805): Pushdown Accounting (a consensus of the FASB Emerging Issues Task Force) to make pushdown accounting optional for an acquiree. In addition, the staff of the Securities and Exchange Commission (SEC) released Staff Accounting Bulletin (SAB) No. 115, which rescinds SAB Topic 5J (the SEC staff’s pre-existing guidance on pushdown accounting). The standard provides an acquired entity with an option to apply pushdown accounting in its separate financial statements upon occurrence of an event in which an acquirer obtains control of the acquired entity. If the acquiree elects not to apply pushdown accounting at the time an acquirer obtains control of it, the acquiree can later elect to apply pushdown accounting retrospectively to the most recent event in which an acquirer obtained control of the acquiree. Such an election will be treated as a change in accounting principle in accordance with Accounting Standards Codification (ASC) 250. Once an entity elects to apply pushdown accounting, its decision is irrevocable. The provisions of this new guidance are effective on November 18, 2014. The new guidance did not have an impact upon our consolidated financial statements.
Interest Rate Risk
Our cash and cash equivalents are exposed to financial market risk due to fluctuations in interest rates, which may affect our interest income. As of December 31, 2014, our cash and cash equivalents included money market funds and short term deposits, including certain cash which is restricted, totaling approximately $42.5 million, and earned interest at a weighted average rate of approximately 0.1%. The value of the principal amounts is equal to the fair value of these instruments. Due to the relative short-term nature of our investment portfolio, our interest income is subject to changes in short-term interest rates. At current investment levels, our net income (loss) would vary by approximately $0.4 million on an annual basis for every 100 basis point change in our weighted average short-term interest rate. We do not use our portfolio for trading or other speculative purposes.
We utilize a combination of short-term and long-term debt to finance our operations and are exposed to interest rate risk on these debt obligations.
Indebtedness under our senior secured credit facility bears interest at rates that fluctuate with changes in certain short-term prevailing interest rates. As of December 31, 2014, our outstanding borrowings under the Term Loan were $225.4 million (net of $3.7 million unamortized original issue discount). As of December 31, 2014, current borrowings under our credit agreement had an effective interest rate of 7.5% and weighted average interest rate of 7.00%, determined as the LIBOR rate (subject to a 1.00% floor) plus 6.00%.
To partially offset variable interest rate risks, we maintain an interest rate cap at 3.00% (versus the 1.00% LIBOR floor) with a notional amount equal to $122,588 as of December 31, 2014. The notional amount of the interest rate cap decreases over time to $121,950 as of September 29, 2015, and thereafter is equal to $62,316 through termination on October 23, 2015. See Part II Item 8, Note 6 for more information on the refinancing of our debt. We will continue to assess the appropriateness of hedging interest rate risk with our outstanding variable debt under our current senior secured credit facilities.
Our net income would likely be affected by changes in market interest rates on our variable-rate obligations. As discussed above, our term loan facility is subject to a 1.00% LIBOR floor. Therefore, a 100 basis point increase in the December 31, 2014 market interest rate would increase interest expense under the term loan by approximately $1.3 million on an annual basis.
Foreign Currency Exchange Risk
We have sales and expenses that are denominated in currencies other than the U.S. dollar and, as a result, have exposure to foreign currency exchange risk. In the event our exposure to foreign currency exchange risk increases to levels that we do not deem acceptable, we may choose to hedge those exposures. We did not enter into any derivative financial instruments to hedge such exposures in 2014 or 2013.
Report of Independent Registered Public Accounting Firm
Board of Directors and Shareholders
Merge Healthcare Incorporated
Chicago, Illinois
We have audited the accompanying consolidated balance sheets of Merge Healthcare Incorporated (“the Company”) as of December 31, 2014 and 2013, and the related consolidated statements of operations, comprehensive loss, shareholders’ equity, and cash flows for each of the three years in the period ended December 31, 2014. These financial statements are the responsibility of the Company’s management. Our responsibility is to express an opinion on these financial statements based on our audits.
We conducted our audits in accordance with the standards of the Public Company Accounting Oversight Board (United States). Those standards require that we plan and perform the audit to obtain reasonable assurance about whether the financial statements are free of material misstatement. An audit includes examining, on a test basis, evidence supporting the amounts and disclosures in the financial statements, assessing the accounting principles used and significant estimates made by management, as well as evaluating the overall presentation of the financial statement. We believe that our audits provide a reasonable basis for our opinion.
In our opinion, the consolidated financial statements referred to above present fairly, in all material respects, the financial position of Merge Healthcare Incorporated at December 31, 2014 and 2013, and the results of its operations and its cash flows for each of the three years in the period ended December 31, 2014, in conformity with accounting principles generally accepted in the United States of America.
We also have audited, in accordance with the standards of the Public Company Accounting Oversight Board (United States), Merge Healthcare Incorporated’s internal control over financial reporting as of December 31, 2014, based on criteria established in Internal Control – Integrated Framework (2013) issued by the Committee of Sponsoring Organizations of the Treadway Commission (COSO) and our report dated February 27, 2015, expressed an unqualified opinion thereon.
/s/BDO USA, LLP
Milwaukee, Wisconsin
February 27, 2015
MERGE HEALTHCARE INCORPORATED AND SUBSIDIARIES
CONSOLIDATED BALANCE SHEETS
(in thousands, except for share data)
|
ASSETS
|
December 31,
2014 |
December 31,
2013 |
||||||
|
Current assets:
|
||||||||
|
Cash and cash equivalents, including restricted cash of $209 and $392 at December 31, 2014 and December 31, 2013
|
$
|
42,531
|
$
|
19,729
|
||||
|
Accounts receivable, net of reserves of $4,990 and $11,938 at December 31, 2014 and December 31, 2013
|
51,300
|
61,895
|
||||||
|
Inventory
|
5,686
|
5,851
|
||||||
|
Prepaid expenses
|
3,690
|
4,803
|
||||||
|
Deferred income taxes
|
1,131
|
1,915
|
||||||
|
Other current assets
|
11,110
|
12,506
|
||||||
|
Total current assets
|
115,448
|
106,699
|
||||||
|
Property and equipment:
|
||||||||
|
Computer equipment
|
9,159
|
8,930
|
||||||
|
Office equipment
|
2,927
|
2,857
|
||||||
|
Leasehold improvements
|
1,589
|
1,870
|
||||||
|
|
13,675
|
13,657
|
||||||
|
Less accumulated depreciation
|
9,596
|
8,918
|
||||||
|
Net property and equipment
|
4,079
|
4,739
|
||||||
|
Purchased and developed software, net of accumulated amortization of $23,764 and $18,591 at December 31, 2014 and December 31, 2013
|
14,585
|
15,906
|
||||||
|
Other intangible assets, net of accumulated amortization of $38,370 and $34,466 at December 31, 2014 and December 31, 2013
|
17,956
|
26,200
|
||||||
|
Goodwill
|
214,374
|
214,374
|
||||||
|
Deferred income taxes
|
5,396
|
6,979
|
||||||
|
Other assets
|
2,499
|
7,184
|
||||||
|
Total assets
|
$
|
374,337
|
$
|
382,081
|
||||
|
LIABILITIES AND SHAREHOLDERS' EQUITY
|
||||||||
|
Current liabilities:
|
||||||||
|
Accounts payable
|
$
|
21,072
|
$
|
22,072
|
||||
|
Current maturities of long-term debt
|
11,750
|
2,490
|
||||||
|
Accrued wages
|
11,169
|
5,559
|
||||||
|
Restructuring accrual
|
-
|
1,301
|
||||||
|
Other current liabilities
|
4,996
|
8,205
|
||||||
|
Deferred revenue
|
53,184
|
55,183
|
||||||
|
Total current liabilities
|
102,171
|
94,810
|
||||||
|
Long-term debt, less current maturities, net of unamortized discount
|
213,676
|
233,942
|
||||||
|
Deferred income taxes
|
4,025
|
4,065
|
||||||
|
Deferred revenue
|
1,091
|
378
|
||||||
|
Income taxes payable
|
1,109
|
1,399
|
||||||
|
Other liabilities
|
1,664
|
2,227
|
||||||
|
Total liabilities
|
323,736
|
336,821
|
||||||
|
Shareholders' equity:
|
||||||||
|
Preferred Stock, $0.01 par value: 1,000,000 shares authorized; none issued
|
-
|
-
|
||||||
|
Series A Non-voting Preferred Stock, $0.01 par value: 50,000 shares authorized; none issued
|
-
|
-
|
||||||
|
Common stock, $0.01 par value: 150,000,000 shares authorized: 98,442,336 and 96,688,889 shares issued and outstanding at December 31, 2014 and December 31, 2013
|
984
|
967
|
||||||
|
Common stock subscribed, 14,429 and 26,259 shares at December 31, 2014 and December 31, 2013
|
49
|
57
|
||||||
|
Additional paid-in capital
|
590,938
|
585,102
|
||||||
|
Accumulated deficit
|
(543,622
|
)
|
(543,175
|
)
|
||||
|
Accumulated other comprehensive income
|
1,766
|
1,862
|
||||||
|
Total Merge shareholders' equity
|
50,115
|
44,813
|
||||||
|
Noncontrolling interest
|
486
|
447
|
||||||
|
Total shareholders' equity
|
50,601
|
45,260
|
||||||
|
Total liabilities and shareholders' equity
|
$
|
374,337
|
$
|
382,081
|
||||
See accompanying notes to consolidated financial statements.
MERGE HEALTHCARE INCORPORATED AND SUBSIDIARIES
CONSOLIDATED STATEMENTS OF OPERATIONS
(in thousands, except for share and per share data)
|
|
Years Ended December 31,
|
|||||||||||
|
|
2014
|
2013
|
2012
|
|||||||||
|
Net sales:
|
||||||||||||
|
Software and other
|
$
|
71,084
|
$
|
78,575
|
$
|
94,466
|
||||||
|
Professional services
|
38,033
|
43,830
|
40,978
|
|||||||||
|
Maintenance and EDI
|
103,187
|
109,262
|
113,460
|
|||||||||
|
Total net sales
|
212,304
|
231,667
|
248,904
|
|||||||||
|
Cost of sales:
|
||||||||||||
|
Software and other
|
30,433
|
41,813
|
43,281
|
|||||||||
|
Professional services
|
25,092
|
25,114
|
24,693
|
|||||||||
|
Maintenance and EDI
|
27,744
|
28,989
|
31,090
|
|||||||||
|
Depreciation, amortization and impairment
|
7,475
|
6,980
|
8,987
|
|||||||||
|
Total cost of sales
|
90,744
|
102,896
|
108,051
|
|||||||||
|
Gross margin
|
121,560
|
128,771
|
140,853
|
|||||||||
|
Operating costs and expenses:
|
||||||||||||
|
Sales and marketing
|
31,991
|
36,585
|
43,908
|
|||||||||
|
Product research and development
|
28,434
|
32,388
|
32,419
|
|||||||||
|
General and administrative
|
27,144
|
34,689
|
42,366
|
|||||||||
|
Acquisition-related expenses
|
232
|
906
|
3,402
|
|||||||||
|
Restructuring and other expenses
|
-
|
3,856
|
830
|
|||||||||
|
Depreciation, amortization and impairment
|
10,131
|
10,540
|
11,308
|
|||||||||
|
Total operating costs and expenses
|
97,932
|
118,964
|
134,233
|
|||||||||
|
Operating income
|
23,628
|
9,807
|
6,620
|
|||||||||
|
Other income (expense):
|
||||||||||||
|
Interest expense
|
(17,199
|
)
|
(21,762
|
)
|
(32,926
|
)
|
||||||
|
Interest income
|
18
|
514
|
766
|
|||||||||
|
Loss on debt extinguishment
|
(4,821
|
)
|
(23,822
|
)
|
-
|
|||||||
|
Other, net
|
263
|
(831
|
)
|
811
|
||||||||
|
Total other income (expense)
|
(21,739
|
)
|
(45,901
|
)
|
(31,349
|
)
|
||||||
|
Income (loss) before income taxes
|
1,889
|
(36,094
|
)
|
(24,729
|
)
|
|||||||
|
Income tax expense
|
2,297
|
2,889
|
4,091
|
|||||||||
|
Net loss
|
(408
|
)
|
(38,983
|
)
|
(28,820
|
)
|
||||||
|
Less: noncontrolling interest's share
|
39
|
(3
|
)
|
(18
|
)
|
|||||||
|
Net loss available to common shareholders of Merge
|
$
|
(447
|
)
|
$
|
(38,980
|
)
|
$
|
(28,802
|
)
|
|||
|
Net loss per share attributable to common shareholders of Merge - basic
|
$
|
(0.00
|
)
|
$
|
(0.42
|
)
|
$
|
(0.31
|
)
|
|||
|
Weighted average number of common shares outstanding - basic
|
95,439,676
|
93,727,394
|
92,128,717
|
|||||||||
|
|
||||||||||||
|
Net loss per share attributable to common shareholders of Merge - diluted
|
$
|
(0.00
|
)
|
$
|
(0.42
|
)
|
$
|
(0.31
|
)
|
|||
|
Weighted average number of common shares outstanding - diluted
|
95,439,676
|
93,727,394
|
92,128,717
|
|||||||||
See accompanying notes to consolidated financial statements.
MERGE HEALTHCARE INCORPORATED AND SUBSIDIARIES
CONSOLIDATED STATEMENTS OF COMPREHENSIVE LOSS
(in thousands)
|
|
Years Ended December 31,
|
|||||||||||
|
|
2014
|
2013
|
2012
|
|||||||||
|
|
||||||||||||
|
Net loss
|
$
|
(408
|
)
|
$
|
(38,983
|
)
|
$
|
(28,820
|
)
|
|||
|
Translation adjustment
|
(96
|
)
|
(103
|
)
|
4
|
|||||||
|
Change in fair value of marketable security, net of income taxes
|
-
|
398
|
(50
|
)
|
||||||||
|
Comprehensive loss
|
(504
|
)
|
(38,688
|
)
|
(28,866
|
)
|
||||||
|
Less: noncontrolling interest's share
|
39
|
(3
|
)
|
(18
|
)
|
|||||||
|
Comprehensive loss attributable to Merge
|
$
|
(543
|
)
|
$
|
(38,685
|
)
|
$
|
(28,848
|
)
|
|||
See accompanying notes to consolidated financial statements.
MERGE HEALTHCARE INCORPORATED
CONSOLIDATED STATEMENTS OF SHAREHOLDERS’ EQUITY
Years Ended December 31, 2014, 2013 and 2012
(in thousands, except for share data)
|
|
Preferred Stock
|
Common Stock
|
||||||||||||||||||||||||||||||||||||||||||||||
|
|
Shares
Issued |
Issued
Amount |
Shares
Subscribed |
Subscribed
Amount |
Shares
Issued |
Issued
Amount |
Additional
Paid-in |
Accumulated
Deficit |
Accumulated
Other |
Total Merge
Shareholders’ |
Non-
controlling |
Total
Shareholders’ |
||||||||||||||||||||||||||||||||||||
|
Balance at December 31, 2011
|
-
|
$
|
-
|
195,116
|
$
|
1,311
|
90,939,053
|
$
|
909
|
$
|
563,563
|
$
|
(475,393
|
)
|
$
|
1,613
|
$
|
92,003
|
$
|
468
|
$
|
92,471
|
||||||||||||||||||||||||||
|
Stock activity for acquisitions
|
-
|
-
|
(53,574
|
)
|
(373
|
)
|
1,410,491
|
14
|
5,561
|
-
|
-
|
5,202
|
-
|
5,202
|
||||||||||||||||||||||||||||||||||
|
Stock issued under ESPP
|
-
|
-
|
16,853
|
(4
|
)
|
92,886
|
1
|
356
|
-
|
-
|
353
|
-
|
353
|
|||||||||||||||||||||||||||||||||||
|
Exercise of stock options
|
-
|
-
|
-
|
-
|
190,269
|
2
|
686
|
-
|
-
|
688
|
-
|
688
|
||||||||||||||||||||||||||||||||||||
|
Issuance of restricted shares
|
-
|
-
|
-
|
-
|
505,038
|
5
|
1,822
|
-
|
-
|
1,827
|
-
|
1,827
|
||||||||||||||||||||||||||||||||||||
|
Share-based compensation expense
|
-
|
-
|
-
|
-
|
-
|
-
|
5,786
|
-
|
-
|
5,786
|
-
|
5,786
|
||||||||||||||||||||||||||||||||||||
|
Net loss
|
-
|
-
|
-
|
-
|
-
|
-
|
-
|
(28,802
|
)
|
-
|
(28,802
|
)
|
(18
|
)
|
(28,820
|
)
|
||||||||||||||||||||||||||||||||
|
Other comprehensive loss
|
-
|
-
|
-
|
-
|
-
|
-
|
-
|
-
|
(46
|
)
|
(46
|
)
|
-
|
(46
|
)
|
|||||||||||||||||||||||||||||||||
|
Balance at December 31, 2012
|
-
|
$
|
-
|
158,395
|
$
|
934
|
93,137,737
|
$
|
931
|
$
|
577,774
|
$
|
(504,195
|
)
|
$
|
1,567
|
$
|
77,011
|
$
|
450
|
$
|
77,461
|
||||||||||||||||||||||||||
|
Stock activity for acquisitions
|
-
|
-
|
(122,292
|
)
|
(850
|
)
|
40,225
|
1
|
123
|
-
|
-
|
(726
|
)
|
-
|
(726
|
)
|
||||||||||||||||||||||||||||||||
|
Stock issued for settlement
|
-
|
-
|
-
|
-
|
400,000
|
4
|
881
|
-
|
-
|
885
|
-
|
885
|
||||||||||||||||||||||||||||||||||||
|
Stock issued under ESPP
|
-
|
-
|
(9,844
|
)
|
(27
|
)
|
108,427
|
1
|
279
|
-
|
-
|
253
|
-
|
253
|
||||||||||||||||||||||||||||||||||
|
Exercise of stock options
|
-
|
-
|
-
|
-
|
902,500
|
9
|
1,227
|
-
|
-
|
1,236
|
-
|
1,236
|
||||||||||||||||||||||||||||||||||||
|
Issuance of restricted shares
|
-
|
-
|
-
|
-
|
2,100,000
|
21
|
(21
|
)
|
-
|
-
|
-
|
-
|
-
|
|||||||||||||||||||||||||||||||||||
|
Share-based compensation expense
|
-
|
-
|
-
|
-
|
-
|
-
|
4,839
|
-
|
-
|
4,839
|
-
|
4,839
|
||||||||||||||||||||||||||||||||||||
|
Net loss
|
-
|
-
|
-
|
-
|
-
|
-
|
-
|
(38,980
|
)
|
-
|
(38,980
|
)
|
(3
|
)
|
(38,983
|
)
|
||||||||||||||||||||||||||||||||
|
Other comprehensive income
|
-
|
-
|
-
|
-
|
-
|
-
|
-
|
-
|
295
|
295
|
-
|
295
|
||||||||||||||||||||||||||||||||||||
|
Balance at December 31, 2013
|
-
|
$
|
-
|
26,259
|
$
|
57
|
96,688,889
|
$
|
967
|
$
|
585,102
|
$
|
(543,175
|
)
|
$
|
1,862
|
$
|
44,813
|
$
|
447
|
$
|
45,260
|
||||||||||||||||||||||||||
|
Stock issued under ESPP
|
-
|
-
|
(11,830
|
)
|
(8
|
)
|
90,238
|
-
|
207
|
-
|
199
|
-
|
199
|
|||||||||||||||||||||||||||||||||||
|
Exercise of stock options
|
-
|
-
|
-
|
-
|
1,191,250
|
12
|
1,006
|
-
|
-
|
1,018
|
-
|
1,018
|
||||||||||||||||||||||||||||||||||||
|
Issuance of restricted shares
|
-
|
-
|
-
|
-
|
652,195
|
7
|
(7
|
)
|
-
|
-
|
-
|
-
|
-
|
|||||||||||||||||||||||||||||||||||
|
Share-based compensation expense
|
-
|
-
|
-
|
-
|
-
|
-
|
5,169
|
-
|
-
|
5,169
|
-
|
5,169
|
||||||||||||||||||||||||||||||||||||
|
Return of shares to satisfy recipients' income tax obligations related to restricted stock vesting
|
-
|
-
|
(180,236
|
)
|
(2
|
)
|
(539
|
)
|
-
|
-
|
(541
|
)
|
-
|
(541
|
)
|
|||||||||||||||||||||||||||||||||
|
Net loss
|
-
|
-
|
-
|
-
|
-
|
-
|
-
|
(447
|
)
|
-
|
(447
|
)
|
39
|
(408
|
)
|
|||||||||||||||||||||||||||||||||
|
Other comprehensive loss
|
-
|
-
|
-
|
-
|
-
|
-
|
-
|
-
|
(96
|
)
|
(96
|
)
|
-
|
(96
|
)
|
|||||||||||||||||||||||||||||||||
|
Balance at December 31, 2014
|
-
|
$
|
-
|
14,429
|
$
|
49
|
98,442,336
|
$
|
984
|
$
|
590,938
|
$
|
(543,622
|
)
|
$
|
1,766
|
$
|
50,115
|
$
|
486
|
$
|
50,601
|
||||||||||||||||||||||||||
See accompanying notes to consolidated financial statements.
MERGE HEALTHCARE INCORPORATED AND SUBSIDIARIES
CONSOLIDATED STATEMENTS OF CASH FLOWS
(in thousands)
|
Year Ended December 31,
|
||||||||||||
|
2014
|
2013
|
2012
|
||||||||||
|
Cash flows from operating activities:
|
||||||||||||
|
Net loss
|
$
|
(408
|
)
|
$
|
(38,983
|
)
|
$
|
(28,820
|
)
|
|||
|
Adjustments to reconcile net loss to net cash provided by (used in) operating activities:
|
||||||||||||
|
Depreciation, amortization and impairment
|
17,606
|
17,520
|
20,295
|
|||||||||
|
Share-based compensation
|
5,169
|
4,839
|
5,786
|
|||||||||
|
Amortization of term loan and note payable issuance costs & discounts
|
1,129
|
1,649
|
2,724
|
|||||||||
|
Unrealized gain on equity security
|
-
|
-
|
(486
|
)
|
||||||||
|
Realized loss on equity security
|
-
|
745
|
-
|
|||||||||
|
Change in contingent consideration for acquisitions
|
-
|
-
|
1,380
|
|||||||||
|
Loss on extinguishment of debt
|
4,821
|
23,822
|
-
|
|||||||||
|
Provision for doubtful accounts receivable and allowances, net of recoveries
|
200
|
693
|
10,523
|
|||||||||
|
Deferred income taxes
|
2,113
|
2,301
|
3,581
|
|||||||||
|
Loss on acquisition settlement
|
-
|
1,345
|
-
|
|||||||||
|
Stock issued for lawsuit settlement
|
-
|
885
|
-
|
|||||||||
|
Gain on lawsuit settlement
|
-
|
(2,500
|
)
|
-
|
||||||||
|
Changes in operating assets and liabilities, net of effects of acquisitions and dispositions:
|
||||||||||||
|
Accounts receivable
|
10,395
|
9,476
|
(9,659
|
)
|
||||||||
|
Inventory
|
164
|
128
|
(1,261
|
)
|
||||||||
|
Prepaid expenses
|
1,110
|
(708
|
)
|
(148
|
)
|
|||||||
|
Accounts payable
|
(1,000
|
)
|
(2,243
|
)
|
2,258
|
|||||||
|
Accrued wages
|
5,611
|
(322
|
)
|
(979
|
)
|
|||||||
|
Restructuring accrual
|
(1,301
|
)
|
1,079
|
(1,297
|
)
|
|||||||
|
Other accrued liabilities
|
(3,244
|
)
|
(6,585
|
)
|
(556
|
)
|
||||||
|
Deferred revenue
|
(1,286
|
)
|
2,312
|
(422
|
)
|
|||||||
|
Other
|
1,508
|
5,828
|
(3,559
|
)
|
||||||||
|
Net cash provided by (used in) operating activities
|
42,587
|
21,281
|
(640
|
)
|
||||||||
|
Cash flows from investing activities:
|
||||||||||||
|
Cash paid for acquisitions, net of cash acquired
|
-
|
-
|
(876
|
)
|
||||||||
|
Investment in securities
|
-
|
-
|
(240
|
)
|
||||||||
|
Purchases of property, equipment and leasehold improvements
|
(1,844
|
)
|
(2,239
|
)
|
(2,174
|
)
|
||||||
|
Purchased technology
|
(300
|
)
|
(450
|
)
|
-
|
|||||||
|
Capitalized software development
|
(3,942
|
)
|
(85
|
)
|
-
|
|||||||
|
Change in restricted cash
|
183
|
422
|
(106
|
)
|
||||||||
|
Proceeds from sale of equity investment
|
-
|
1,785
|
-
|
|||||||||
|
Net cash used in investing activities
|
(5,903
|
)
|
(567
|
)
|
(3,396
|
)
|
||||||
|
Cash flows from financing activities:
|
||||||||||||
|
Proceeds from debt issuance
|
231,251
|
252,450
|
-
|
|||||||||
|
Retirement of debt
|
(230,133
|
)
|
(252,000
|
)
|
-
|
|||||||
|
Penalty for early extinguishment of debt
|
-
|
(16,863
|
)
|
-
|
||||||||
|
Note issuance costs paid
|
(250
|
)
|
(4,588
|
)
|
-
|
|||||||
|
Proceeds from exercise of stock options and employee stock purchase plan
|
1,217
|
1,489
|
1,039
|
|||||||||
|
Principal payments on term loan and notes payable
|
(14,467
|
)
|
(16,286
|
)
|
(37
|
)
|
||||||
|
Principal payments on capital leases
|
(680
|
)
|
(535
|
)
|
(396
|
)
|
||||||
|
Repurchase and retirement of common stock
|
(541
|
)
|
-
|
-
|
||||||||
|
Net cash (used in) provided by financing activities
|
(13,603
|
)
|
(36,333
|
)
|
606
|
|||||||
|
Effect of exchange rates on cash and cash equivalents
|
(96
|
)
|
(106
|
)
|
(73
|
)
|
||||||
|
Net increase (decrease) in cash and cash equivalents
|
22,985
|
(15,725
|
)
|
(3,503
|
)
|
|||||||
|
Cash and cash equivalents (net of restricted cash), beginning of period (1)
|
19,337
|
35,062
|
38,565
|
|||||||||
|
Cash and cash equivalents (net of restricted cash), end of period (2)
|
$
|
42,322
|
$
|
19,337
|
$
|
35,062
|
||||||
|
Supplemental Disclosures of Cash Flow Information:
|
||||||||||||
|
Cash paid for interest
|
$
|
15,949
|
$
|
24,847
|
$
|
29,792
|
||||||
|
Cash paid for income taxes, net of refunds
|
$
|
402
|
$
|
411
|
$
|
261
|
||||||
|
Non-Cash Investing and Financing Activities
|
||||||||||||
|
Equity securities received in settlement of receivable
|
$
|
-
|
$
|
-
|
$
|
1,530
|
||||||
|
Value of common stock issued for acquisitions and returns for settlements
|
$
|
-
|
$
|
(726
|
)
|
$
|
7,029
|
|||||
|
Assets purchased under capital lease obligations
|
$
|
60
|
$
|
187
|
$
|
1,412
|
||||||
|
Assets purchased under lease line facility
|
$
|
-
|
$
|
-
|
$
|
897
|
||||||
| (1) | Net of restricted cash of $392, $813, and $707 at December 31, 2013, 2012, and 2011, respectively. |
| (2) | Net of restricted cash of $209, $392, and $813 at December 31, 2014, 2013 and 2012, respectively. |
See accompanying notes to consolidated financial statements.
Merge Healthcare Incorporated and Subsidiaries
Notes to Consolidated Financial Statements
(in thousands, except for share and per share data)
|
(1)
|
Basis of Presentation and Significant Accounting Policies
|
Nature of Operations
Merge Healthcare Incorporated and its subsidiaries or affiliates (collectively Merge, we, us, or our) is an enterprise image provider dedicated to healthcare information technology (IT) solutions. We develop software solutions that facilitate the management of images to create a more effective and efficient electronic healthcare experience for patients and physicians. Our solutions are designed to help solve some of the most difficult challenges in health information exchange today, such as the incorporation of medical images and diagnostic information into broader healthcare IT applications, the interoperability of proprietary software solutions, the profitability of outpatient imaging practices in the face of declining reimbursement and the ability to improve the efficiency and cost effectiveness of our customers’ businesses.
Principles of Consolidation
The consolidated financial statements include the financial statements of our wholly owned subsidiaries, and include the results of all acquisitions from the dates of acquisition. All intercompany balances and transactions have been eliminated in consolidation.
We have certain minority equity interests in various companies accounted for as cost method investments. The operating results of these companies are not included in our results of operations. We also own a 63% equity interest in a company which is included in our consolidated financial statements. These statements are adjusted based on the noncontrolling interest’s share.
Use of Estimates
Our consolidated financial statements are prepared in accordance with United States of America (U.S.) generally accepted accounting principles (GAAP). These accounting principles require us to make certain estimates, judgments and assumptions that affect the reported amounts of assets and liabilities and disclosure of contingent assets and liabilities at the date of the financial statements, and the reported amounts of revenues and expenses during the reporting period. Estimates are used when accounting for items and matters such as revenue recognition and allowances for uncollectible accounts receivable, sales returns and revenue recognized in excess of billings, inventory obsolescence, depreciation and amortization, long-lived and intangible asset valuations, impairment assessments, restructuring reserves, taxes and related valuation allowance, income tax provisions, stock-based compensation, and contingencies. We believe that the estimates, judgments and assumptions are reasonable, based on information available at the time they are made. Actual results may differ from those estimates.
Reclassifications
Certain prior year amounts have been reclassified to conform to the 2014 presentation.
Functional Currency
Certain of our foreign subsidiaries use the United States of America dollar (U.S. Dollar) as their functional currency. Foreign currency denominated revenues and expenses are translated at weighted average exchange rates throughout the year and foreign currency denominated monetary assets and liabilities are translated at rates prevailing at the balance sheet dates. For those foreign subsidiaries which use the U.S. Dollar as their functional currency, adjustments arising from the use of differing exchange rates from period to period are reflected in our consolidated statements of operations as a component of other income (expense), net. For those foreign subsidiaries which use their local currency as the functional currency, translation adjustments arising from the use of differing exchange rates from period to period are included as a component of other comprehensive income (loss). Foreign exchange gains and losses on transactions during the year are reflected in the consolidated statements of operations, as a component of other income (expense), net.
Fair Value of Financial Instruments
Our financial instruments include cash and cash equivalents, accounts receivable, marketable and non‑marketable equity securities, accounts payable, notes payable, and certain accrued liabilities. The carrying amounts of these assets and liabilities approximate fair value due to the short maturity of these instruments, except for the notes payable and non‑marketable equity securities. The carrying amount of the notes payable approximates fair value due to the interest rate and terms approximating those available to us for similar obligations. The estimated fair values of the non-marketable equity securities have been determined from information obtained from independent valuations and management estimates.
We use a three-tier value hierarchy to prioritize the inputs used in measuring fair value of our financial assets and liabilities. These tiers include: Level 1, defined as observable inputs such as quoted prices in active markets; Level 2, defined as inputs other than quoted prices in active markets that are directly or indirectly observable; and Level 3, defined as unobservable inputs in which little or no market data exists, therefore, requiring an entity to develop its own assumptions.
We also consider additional information in estimating fair value when the volume and level of activity for the asset or liability have significantly decreased, or circumstances indicate a transaction is not suitable for fair value measurement. See Note 4 for further discussion of the fair value of our financial instruments.
Cash and Cash Equivalents
Cash and cash equivalents consist of balances with banks (including restricted cash), money market accounts and liquid short-term investments with original maturities of ninety days or less and are carried on the balance sheet at cost plus accrued interest. As of December 31, 2014, cash and cash equivalents were $42,531, including restricted cash of $209.
Inventory
Inventory, consisting principally of finished goods (primarily purchased third-party hardware) is stated at the lower of cost or market determined on a first-in, first-out (FIFO) basis. We also maintain inventory reserves for excess and obsolete inventory determined based on the age of our inventory.
Other Current Assets
Other current assets consist primarily of revenue recognized that has not yet been billed to a customer and other receivables, all of which are due within the next twelve months. The balances are comprised of the following as of December 31, 2014 and 2013:
|
|
Balance at December 31,
|
|||||||
|
|
2014
|
2013
|
||||||
|
Revenue recognized in excess of billings, net of reserves of $1,389 and $2,249, respectively
|
$
|
9,924
|
$
|
12,069
|
||||
|
Other current assets
|
1,186
|
437
|
||||||
|
|
$
|
11,110
|
$
|
12,506
|
||||
The following table shows the changes in our reserves for revenue recognized in excess of billings:
|
|
Balance at Beginning of Period
|
Net Additions Charged to Expenses
|
Deductions
|
Balance at End of Period
|
||||||||||||
|
For year ended December 31:
|
||||||||||||||||
|
2014
|
$
|
2,249
|
$
|
745
|
$
|
(1,605
|
)
|
$
|
1,389
|
|||||||
|
2013
|
1,763
|
1,279
|
(793
|
)
|
2,249
|
|||||||||||
|
2012
|
235
|
1,528
|
-
|
1,763
|
||||||||||||
During the fourth quarter of 2012, we recorded a charge of $1,308 related primarily to uncollectible billings from customer contracts obtained through acquisitions in the prior few years. The $1,308 related to a change in estimate to our reserve for revenues in excess of billings. The effect of the change in estimate related to our reserve for revenues in excess of billings, which was recorded to general and administrative in our statement of operations, was to increase our net loss by $1,308 ($0.01 per share, net of income tax), for the year ended December 31, 2012.
Property and Equipment
Property and equipment are stated at cost. Depreciation on property and equipment is calculated on the straight-line method over the estimated useful lives of the assets. Property and equipment are evaluated for potential impairment whenever events or circumstances indicate that the carrying amount may not be recoverable, based primarily upon whether expected future undiscounted cash flows are sufficient to support the asset’s recovery. Useful lives of our major classes of property and equipment are three years for computer equipment and three to five years for office equipment. Leasehold improvements are amortized using the straight-line method over the shorter of the estimated life of the asset or the term of the lease. We recorded depreciation expense of $3,778, $3,394 and $3,752 in 2014, 2013 and 2012, respectively.
Intangible Assets and Goodwill
Intangible assets include purchased and capitalized technology, customer relationships, backlog, trade names, and non-compete agreements. Finite-lived intangible assets are amortized to reflect the pattern of economic benefits consumed, which is primarily the straight-line method.
Purchased software and capitalized software are tested for impairment quarterly by comparing the net realizable value (estimated using undiscounted future cash flows) to the carrying value of the software. If the carrying value of the software exceeds its net realizable value, we record an impairment charge in the period in which the impairment is incurred equal to the amount of the difference between the carrying value and estimated undiscounted future cash flows.
Customer relationships, backlog, trade names and non-compete agreements are evaluated for potential impairment whenever events or circumstances indicate that the carrying amount may not be recoverable, based primarily upon whether expected future undiscounted cash flows are sufficient to support the asset’s recovery. If the actual useful life of the asset is shorter than the useful life estimated by us, the asset may be deemed to be impaired, and, accordingly, a write-down of the value of the asset determined by a discounted cash flow analysis, or a shorter amortization period, may be required. We have reviewed the assets with estimable useful lives and determined that their carrying values as of December 31, 2014 are recoverable in future periods.
We review goodwill for impairment annually on October 1st, or more frequently if impairment indicators arise. During 2012, our reporting units changed from Merge Healthcare and Merge eClinical to Merge Healthcare and Merge Data and Analytics (DNA) due to the level of discrete financial information as well as the aggregation of Merge’s components, which exhibit similar long term performance and have similar economic characteristics. In calculating potential impairment losses, we evaluate the fair value of our reporting units using either quoted market prices or, if not available, by estimating the expected present value of their future cash flows. We use a two-step impairment test. The first step of the goodwill impairment test, used to identify potential impairment, compares the fair value of a reporting unit with its carrying amount, including goodwill. If the fair value of a reporting unit exceeds its carrying amount, goodwill of the reporting unit is considered not impaired, thus the second step of the impairment test is unnecessary. If the carrying amount of a reporting unit exceeds its fair value, the second step of the goodwill impairment test is performed to measure the amount of impairment loss, if any. The second step of the goodwill impairment test, used to measure the amount of impairment loss, compares the implied fair value of reporting unit goodwill with the carrying amount of that goodwill. If the carrying amount of the reporting unit’s goodwill exceeds the implied fair value of that goodwill, an impairment loss is recognized in an amount equal to that excess. Identification of, and assignment of assets and liabilities to, a reporting unit require our judgment and estimates. In addition, future cash flows are based upon our assumptions about future sales activity and market acceptance of our products. We performed our annual goodwill testing and determined that there is no impairment, since the fair value of our reporting units substantially exceeded the carrying value.
Software Development Costs
Costs incurred internally in creating computer software solutions and enhancements to those solutions are expensed until completion of a detailed program design, when technological feasibility has been established. Thereafter, all software development costs are capitalized until the software solutions and enhancements are available for general release, and subsequent capitalized costs are reported at the lower of amortized cost or net realizable value.
Net realizable value is computed as the estimated gross future revenues from each software solution less the amount of estimated future costs of completing and distributing of that product. Capitalized costs are amortized straight-line over the estimated economic life of the software solution with minimum annual amortization based on current and expected net future revenue for each software solution. We are generally amortizing capitalized costs over five years. The five-year period over which capitalized software development costs are amortized is an estimate based upon our forecast of a reasonable useful life for the capitalized costs. Historically, use of our software programs by our clients has exceeded five years and is capable of being used a decade or more.
Other Current Liabilities
Other current liabilities consist primarily of customer deposits, the current portion of an acquisition obligation, accrued taxes and other non-trade payables, all of which are due within the next twelve months. The balances are comprised of the following as of December 31, 2014 and 2013:
|
|
Balance at December 31,
|
|||||||
|
|
2014
|
2013
|
||||||
|
Customer deposits
|
$
|
1,956
|
$
|
2,697
|
||||
|
Acquisition obligation
|
267
|
1,967
|
||||||
|
Accrued taxes
|
-
|
918
|
||||||
|
Other liabilities
|
2,773
|
2,623
|
||||||
|
|
$
|
4,996
|
$
|
8,205
|
||||
The acquisition obligation relates to the balance due for an insignificant acquisition completed in 2011. The remaining $267 of this obligation will be paid in 2015.
Guarantees
We recognize the fair value of guarantee and indemnification arrangements issued or modified by us, as applicable. In addition, we must continue to monitor the conditions that are subject to the guarantees and indemnifications in order to identify if a loss has occurred. If we determine it is probable that a loss has occurred, then any such estimable loss would be recorded under those guarantees and indemnifications.
Under our standard software license agreements, we agree to indemnify, defend and hold harmless our licensees from and against certain losses, damages and costs arising from claims alleging the licensees’ use of our software infringes the intellectual property rights of a third party. Historically, we have not been required to pay material amounts in connection with claims asserted under these provisions, and, accordingly, we have not recorded a liability relating to such provisions. We also represent and warrant to licensees that our software products will operate substantially in accordance with published specifications, and that the services we perform will be undertaken by qualified personnel in a professional manner conforming to generally accepted industry standards and practices. Historically, only minimal costs have been incurred relating to the satisfaction of product warranty claims.
Other guarantees include promises to indemnify, defend and hold harmless each of our executive officers, non-employee directors and certain key employees from and against losses, damages and costs incurred by each such individual in administrative, legal or investigative proceedings arising from alleged wrongdoing by the individual while acting in good faith within the scope of his or her job duties on our behalf.
Income Taxes
As part of the process of preparing our consolidated financial statements, we are required to estimate income taxes in each of the jurisdictions in which we operate. Our provision for income taxes is determined using the asset and liability approach to account for income taxes. A current liability is recorded for the estimated taxes payable for the current year. Deferred tax assets and liabilities are recorded for the estimated future tax consequences attributable to differences between the financial statement carrying amounts of existing assets and liabilities and their respective tax bases. Deferred tax assets and liabilities are measured using the enacted tax rates in effect for the year in which the timing differences are expected to be recovered or settled. The effect on deferred tax assets and liabilities of changes in tax rates or tax laws are recognized in the provision for income taxes in the period that includes the enactment date.
Valuation allowances are established, when necessary, to reduce deferred tax assets to the amount more-likely-than-not to be realized. Changes in valuation allowances will flow through the statement of operations unless related to deferred tax assets that expire unutilized or are modified through translation, in which case both the deferred tax asset and related valuation allowance are similarly adjusted. Where a valuation allowance was established through purchase accounting for acquired deferred tax assets, any future change will be credited or charged to income tax expense.
The determination of our provision for income taxes requires significant judgment, the use of estimates, and the interpretation and application of complex tax laws. We are subject to income taxes in the U.S. and numerous foreign jurisdictions. Significant judgment is required in determining our worldwide provision for income taxes and recording the related tax assets and liabilities. In the ordinary course of our business, there are transactions and calculations for which the ultimate tax determination is uncertain. In spite of our belief that we have appropriate support for all the positions taken on our tax returns, we acknowledge that certain positions may be successfully challenged by the taxing authorities. We determine the tax benefits more likely than not to be recognized with respect to uncertain tax positions. Unrecognized tax benefits are evaluated quarterly and adjusted based upon new information, resolution with taxing authorities and expiration of the statute of limitations. The provision for income taxes includes the impact of changes in the liability for our uncertain tax positions. Although we believe our recorded tax assets and liabilities are reasonable, tax laws and regulations are subject to interpretation and inherent uncertainty; therefore, our assessments can involve both a series of complex judgments about future events and rely on estimates and assumptions. Although we believe these estimates and assumptions are reasonable, the final determination could be materially different than that which is reflected in our provision for income taxes and recorded tax assets and liabilities.
Accumulated Other Comprehensive Income
Foreign currency translation adjustments and unrealized gains or losses on our available-for-sale securities, net of applicable taxes, are included in accumulated other comprehensive income, and are further detailed in Note 4 for the years ended December 31, 2014 and 2013.
Revenue Recognition
Revenues are derived primarily from the licensing of software, sales of hardware and related ancillary products, hosted clinical trial software-as-a-service (SaaS) offerings, installation and engineering services, training, consulting, and software maintenance and support. Inherent to software revenue recognition are significant management estimates and judgments in the interpretation and practical application of the complex rules to individual contracts. These interpretations generally would not influence the amount of revenue recognized, but could influence the timing of such revenues. Typically, our contracts contain multiple elements, and while the majority of our contracts contain standard terms and conditions, there are instances where our contracts contain non-standard terms and conditions. As a result, contract interpretation is sometimes required to determine the appropriate accounting, including whether the deliverables specified in a multiple-element arrangement should be treated as separate units of accounting for revenue recognition purposes, and if so, the relative selling price that should be allocated to each of the elements and when to recognize revenue for each element.
We recognize revenue on software arrangements involving multiple elements, including separate arrangements with the same customer executed within a short time frame of each other, based on the vendor-specific objective evidence (VSOE) of fair values of those elements. For the majority of our business, we determine the fair value of the maintenance and support portion of the arrangement based on the substantive renewal price of the maintenance offered to customers, which generally is stated in the contract. The fair value of installation, engineering services, training, and consulting is based upon the price charged when these services are sold separately. For sales transactions where the software is incidental or the only contract deliverable is engineering or other services, as well as hardware transactions where no software is involved, we recognize revenue based on VSOE of fair value, other third-party evidence of fair value or our best estimated selling price of those elements.
Revenue from multiple-element arrangements including software is recognized using the residual method. Under the residual method, revenue is recognized in a multiple element arrangement when fair value exists for all of the undelivered elements in the arrangement, even if fair value does not exist for one or more of the delivered elements in the arrangement, assuming all other conditions for revenue recognition have been satisfied. If evidence of fair value cannot be established for the maintenance and support element of a sale, and it represents the only undelivered element, all contract elements are deferred and recognized ratably over the related maintenance and support period.
Revenue from multiple-element arrangements not including software is typically recognized using the relative method. Under the relative method, revenue is recognized in a multiple element arrangement based on selling prices for all of the elements in the arrangement, assuming all other conditions for revenue recognition have been satisfied.
Provided that evidence of an arrangement exists, fees are fixed or determinable, collection of the related receivable is probable, fair value for the undelivered elements exist and there are no other contract considerations resulting in the deferral of revenue, we typically recognize revenue in the following manner:
| · | Software licenses and hardware are recognized upon delivery, while installation, engineering services, training, and consulting services are recognized as performed and maintenance and support is recognized ratably over the period in which the services are performed. This is the primary method used for sales of software products which are typically fully functional upon delivery and do not require significant modification or alteration. Any subsequent software royalties associated with such contracts are generally recognized as reported by the customer. Revenue is also recognized in this manner for the majority of sales of additional modules to existing customers. |
| · | Merge sells software with or without various standard hardware components (i.e. servers, monitors, storage disk arrays, etc.). The hardware items are sold primarily as a convenience for its customers who may choose not to purchase it because either they already have the applicable hardware or they purchased the hardware directly from a third party vendor. We have a sufficient number of stand-alone sales of hardware to allow it to obtain vendor-specific objective evidence of fair value for the hardware. These arrangements include software that is more-than-incidental to the hardware. Therefore, the software is not essential to the functionality of the hardware (and vice versa). Software licenses sold through annual contracts that include software maintenance and support are deferred and recognized ratably over the one-year period. |
| · | Revenues derived from SaaS offerings are generally recognized ratably as we provide software application-hosting and are recognized using the proportional performance method for services provided to customers under fixed-price contracts. Such contracts are entered into by certain customers with clinical trial products comprising the vast majority. These contracts consist of master agreements containing general terms and conditions and separately negotiated addendums (called task orders) which include services, software subscription and usage fees, and hosting fees. Customers generally have the ability to terminate contracts upon 30 days’ notice. However, these contracts typically require payment of fees earned from all services provided through the termination date. Additionally, customers are able to use a self-service platform to run their studies. This self-service platform allows the customer to set its studies live quickly with minimal intervention on the part of Merge. These contracts consist of a signed software usage agreement, which determines the pricing of each individual usage element, and an executed configurator quote, which establishes the parameters for the individual study. The configurator quote is simply an estimate of the usage that will be incurred throughout the life of the study as opposed to a contract with guaranteed amounts due Merge. The customer is charged and revenue is recognized based on the monthly usage on the platform. These contracts consist primarily of usage elements with minimal services. |
| · | If services are considered essential to the functionality of the software, revenue is recognized based on service hours expended through project completion and maintenance and support is recognized ratably over the applicable period. |
| · | EDI revenues are typically recognized monthly based on transactional volumes or a fixed fee. |
If services are considered essential, we recognize revenue using either the proportional performance guidelines or percentage of completion accounting, as appropriate. Revenue is determined by the input method based upon the amount of labor hours expended compared to the total labor hours expended plus the estimated amount of labor hours to complete the project. Total estimated labor hours are based on management’s best estimate of the total amount of time it will take to complete a project. These estimates require the use of judgment. A significant change in one or more of these estimates could affect the profitability of one or more of our contracts. We review our contract estimates periodically to assess the possible need for revisions in contract values and estimated labor hours, and reflect changes in estimates in the period that such estimates are revised under the cumulative catch-up method. When estimates indicate a loss, such loss is recognized in the current period in its entirety. Because of the inherent uncertainties in estimating total labor hours, it is possible that the estimates will change and could result in a material change of revenue recognized in the applicable period. We record a loss for a contract at the point it is determined that the total estimated contract costs will exceed management’s estimates of contract revenues. As of December 31, 2014, we have not experienced any material losses on uncompleted contracts.
We assess collectability based on a number of factors, including past transaction history with the customer and the credit worthiness of the customer. We must exercise our judgment when we assess the probability of collection and the current credit worthiness of each customer. We have provided for an allowance for estimated returns and credits based on our historical experience of returns and customer credits.
Deferred revenue is comprised of deferrals for license fees, support and maintenance and other services. Long-term deferred revenue as of December 31, 2014 represents license fees, support and maintenance and other services to be earned or provided beginning January 1, 2016. Revenue recognized that has not yet been billed to a customer results in an asset as of the end of the period. As of December 31, 2014 and 2013, there was $9,924 and $12,069, net of reserves, recorded within other current assets related to revenue recognized that has not yet been billed.
We record reimbursable out-of-pocket expenses in both services and maintenance net sales and as a direct cost of services and maintenance. The reimbursement by customers of shipping and handling costs are recorded in software and other net sales and the associated cost as a cost of sale. Sales tax, if any, is passed on to our customers.
Share-Based Compensation
We calculate share-based compensation expense for option awards based on the estimated grant-date fair value using the Black-Scholes option pricing model, and recognize the expense on a straight-line basis over the vesting period, net of estimated forfeitures. Share-based compensation expense for restricted stock awards is calculated based on the fair market value of the restricted stock awards at the date of grant, and recognized on a straight-line basis over the vesting period. We evaluate the assumptions used to value stock options and restricted stock awards on a quarterly basis. The estimation of share-based awards that will ultimately vest requires judgment, and to the extent actual results or updated estimates differ from our current estimates, such amounts will be recorded as a cumulative adjustment in the period estimates are revised. We consider different factors when estimating expected forfeitures, including types of awards, employee class, and historical experience.
Recent Accounting Pronouncements
We describe below recent pronouncements that have had or may have a significant effect on our financial statements or have an effect on our disclosures. We do not discuss recent pronouncements that are not anticipated to have an impact on or are unrelated to our financial condition, statement of operations, or related disclosures.
In July 2013, the FASB issued ASU No. 2013-11, Presentation of an Unrecognized Tax Benefit When a Net Operating Loss Carryforward, a Similar Tax Loss, or a Tax Credit Carryforward Exist, which is included in ASC Topic 740 (Income Taxes). ASU 2013-11 requires an entity to net its liability for unrecognized tax positions against a net operating loss carryforward, a similar tax loss or a tax credit carryforward when settlement in this manner is available under the tax law. The provisions of this new guidance are effective for reporting periods beginning after December 15, 2013. We applied this guidance in the first quarter of 2014 and it did not have a material impact on our statement of operations, financial position, or cash flows.
In April 2014, the FASB issued ASU No. 2014-08, Reporting Discontinued Operations and Disclosures of Disposals of Components of an Entity, which changes the criteria for determining which disposals can be presented as discontinued operations and modifies the related disclosure requirements. To qualify as a discontinued operation the standard requires a disposal to represent a strategic shift that has, or will have, a major effect on an entity's operations and financial results. The standard also expands the disclosures for discontinued operations and requires new disclosures related to individually material dispositions that do not qualify as discontinued operations. The standard is effective prospectively for fiscal years beginning after December 15, 2014, with early adoption permitted. We applied this guidance in the third quarter of 2014 and it did not have a material impact on our statement of operations, financial position, or cash flows.
In May 2014, the FASB issued ASU No. 2014- 09, Revenue from Contracts with Customers (Topic 606). ASU 2014-09 also adds Subtopic 340-40 Other Assets and Deferred Costs‒Contracts with Customers. The FASB issued ASU 2014-09 to clarify the principles for recognizing revenue and to develop a common revenue standard for Generally Accepted Accounting Principles and International Financial Reporting Standards. The standard outlines a single comprehensive model for entities to use in accounting for revenue arising from contracts with customers and supersedes the most current revenue recognition guidance. ASU 2014-09 requires retrospective application either, a) to each prior period presented, or, b) retrospectively with the cumulative effect of initially applying the guidance recognized at the date of initial application as an adjustment to opening retained earnings. The provisions of this new guidance are effective for annual reporting periods beginning after December 15, 2016, including interim reporting periods within that reporting period. Earlier application is not permitted. We are currently evaluating the impact of the new guidance on our financial statements.
In August 2014, the FASB issued ASU No. 2014-15, Presentation of Financial Statements—Going Concern (Subtopic 205-40), Disclosure of Uncertainties about an Entity’s Ability to Continue as a Going Concern which requires management to evaluate, in connection with preparing financial statements for each annual and interim reporting period, whether there are conditions or events, considered in the aggregate, that raise substantial doubt about an entity’s ability to continue as a going concern within one year after the date that the financial statements are issued (or within one year after the date that the financial statements are available to be issued when applicable) and provide related disclosures. ASU 2014-15 is effective for the annual period ending after December 15, 2016, and for annual and interim periods thereafter. Early adoption is permitted. We are currently evaluating the impact of the new guidance on our financial statements.
In November 2014, the FASB issued ASU No. 2014-17, Business Combinations (Topic 805): Pushdown Accounting (a consensus of the FASB Emerging Issues Task Force) to make pushdown accounting optional for an acquiree. In addition, the staff of the Securities and Exchange Commission (SEC) released Staff Accounting Bulletin (SAB) No. 115, which rescinds SAB Topic 5J (the SEC staff’s pre-existing guidance on pushdown accounting). The standard provides an acquired entity with an option to apply pushdown accounting in its separate financial statements upon occurrence of an event in which an acquirer obtains control of the acquired entity. If the acquiree elects not to apply pushdown accounting at the time an acquirer obtains control of it, the acquiree can later elect to apply pushdown accounting retrospectively to the most recent event in which an acquirer obtained control of the acquiree. Such an election will be treated as a change in accounting principle in accordance with Accounting Standards Codification (ASC) 250. Once an entity elects to apply pushdown accounting, its decision is irrevocable. The provisions of this new guidance are effective on November 18, 2014. The new guidance did not have an impact on our consolidated financial statements.
|
(2)
|
Accounts Receivable
|
Substantially all receivables are derived from sales and related services, support and maintenance of our products to healthcare IT providers, device manufacturers and pharmaceutical companies located throughout the U.S. and in certain foreign countries as indicated in Note 14.
Our accounts receivable balance is reported net of an allowance for doubtful accounts and for sales returns. We provide for an allowance for estimated uncollectible accounts and sales returns based upon historical experience and management’s judgment. As of December 31, 2014 and 2013, the allowances for estimated uncollectible accounts and sales returns were $4,990 and $11,938, respectively.
The following table shows the changes in our allowance for doubtful accounts and sales returns.
|
Balance at Beginning of Period
|
Net Additions Charged to Revenue and Expenses
|
Deductions
|
Balance at End of Period
|
|||||||||||||
|
For year ended December 31,:
|
||||||||||||||||
|
2014
|
$
|
11,938
|
$
|
200
|
$
|
(7,148
|
)
|
$
|
4,990
|
|||||||
|
2013
|
14,074
|
693
|
(2,829
|
)
|
11,938
|
|||||||||||
|
2012
|
4,080
|
10,523
|
(529
|
)
|
14,074
|
|||||||||||
During 2014, 2013 and 2012 we wrote off $6,683, $2,492 and $401 of accounts receivable and had $465, $337 and $128 of sales returns, respectively.
We recorded a charge to bad debt expense for $12,051 within general and administrative in our statement of operations during the year ended December 31, 2012, primarily due to uncollectible billings from customer contracts obtained through acquisitions in prior years. The expense included a charge recorded in the fourth quarter of $7,855 related to a change in estimate to our allowance for bad debts and sales returns. The effect of the change in estimate, which was recorded to general and administrative in our statement of operations, was to increase our net loss by $7,855 ($0.09 per share, net of income tax), for the year ended December 31, 2012.
|
(3)
|
Goodwill and Other Intangible Assets
|
Goodwill
Goodwill is our primary intangible asset not subject to amortization. The changes in carrying amounts during the years ended December 31, 2014 and 2013 were as follows:
|
|
Total
|
Merge
Healthcare |
Merge
DNA |
|||||||||
|
|
||||||||||||
|
Balance at December 31, 2012
|
$
|
214,312
|
$
|
194,115
|
$
|
20,197
|
||||||
|
Increase due to foreign currency
|
62
|
-
|
62
|
|||||||||
|
Balance at December 31, 2013
|
214,374
|
194,115
|
20,259
|
|||||||||
|
2014 activity
|
-
|
-
|
-
|
|||||||||
|
Balance at December 31, 2014
|
$
|
214,374
|
$
|
194,115
|
$
|
20,259
|
||||||
Other Intangible Assets
Our intangible assets subject to amortization are summarized as of December 31, 2014 and 2013 as follows:
|
December 31, 2014
|
December 31, 2013
|
|||||||||||||||||||
|
Weighted Average Remaining Amortization Period (Years)
|
Gross Carrying Amount
|
Accumulated Amortization
|
Gross Carrying Amount
|
Accumulated Amortization
|
||||||||||||||||
|
Purchased software
|
2.6
|
$
|
32,497
|
$
|
21,706
|
$
|
32,587
|
$
|
16,906
|
|||||||||||
|
Capitalized software
|
4.8
|
5,852
|
2,058
|
1,910
|
1,685
|
|||||||||||||||
|
Customer relationships
|
4.6
|
43,664
|
27,440
|
46,333
|
22,740
|
|||||||||||||||
|
Backlog
|
0.0
|
8,100
|
8,100
|
9,680
|
9,448
|
|||||||||||||||
|
Trade names
|
6.3
|
1,463
|
764
|
1,463
|
605
|
|||||||||||||||
|
Non-competes
|
2.3
|
3,099
|
2,066
|
3,190
|
1,673
|
|||||||||||||||
|
Total
|
$
|
94,675
|
$
|
62,134
|
$
|
95,163
|
$
|
53,057
|
||||||||||||
Estimated aggregate amortization expense for our intangible assets, which become fully amortized in 2023, for the remaining periods is as follows:
|
For the year ending December 31:
|
2015
|
10,057
|
|||
|
2016
|
8,645
|
||||
|
2017
|
6,496
|
||||
|
2018
|
4,268
|
||||
|
2019
|
2,434
|
||||
|
Thereafter
|
641
|
||||
|
Total
|
$
|
32,541
|
|||
Amortization expense, including impairments for our intangible assets, is set forth in the following table:
|
|
Year Ended December 31,
|
|||||||||||
|
|
2014
|
2013
|
2012
|
|||||||||
|
Amortization included in cost of sales:
|
||||||||||||
|
Purchased software
|
$
|
5,211
|
$
|
4,525
|
$
|
5,501
|
||||||
|
Capitalized software
|
372
|
152
|
205
|
|||||||||
|
Backlog
|
232
|
1,110
|
2,211
|
|||||||||
|
Total
|
5,815
|
5,787
|
7,917
|
|||||||||
|
|
||||||||||||
|
Amortization included in operating expenses:
|
||||||||||||
|
Customer relationships
|
7,370
|
7,719
|
7,434
|
|||||||||
|
Trade names
|
159
|
159
|
732
|
|||||||||
|
Non-competes
|
484
|
461
|
461
|
|||||||||
|
Total
|
8,013
|
8,339
|
8,627
|
|||||||||
|
Total amortization
|
$
|
13,828
|
$
|
14,126
|
$
|
16,544
|
||||||
During 2014, we recorded $300 of purchased software and $3,942 of capitalized software. Upon completing the exit of an immaterial product line in 2014, we recorded a $727 charge to depreciation and amortization in operating expenses for the reduction in the useful life of related customer relationships and wrote off the fully amortized backlog and customer relationships of $1,580 and $2,520, respectively. For the year ended December 31, 2014, we wrote off fully amortized purchased software, backlog, customer relationships and non-competes of $390, $1,580, $2,669 and $91, respectively.
Upon completion of a product rationalization and a product being rebranded in the fourth quarter of 2012, we recorded a $796 impairment charge to purchased software and a $474 impairment charge to trade names. We also wrote off the fully amortized gross carrying amounts and the accumulated amortization related to the purchased software and trade name of $1,110 and $620, respectively, in 2012.
|
(4)
|
Fair Value Measurements
|
Our financial instruments include cash and cash equivalents, accounts receivable, marketable and non‑marketable securities, accounts payable, debt payable, and certain accrued liabilities. The carrying amounts of our cash and cash equivalents (which are comprised primarily of deposit and overnight sweep accounts), accounts receivable, accounts payable, and certain accrued liabilities approximate fair value due to the short maturity of these instruments. The carrying value of long-term debt recognized in the consolidated balance sheets as of December 31, 2014 and 2013, was approximately $225,426 and $236,432, respectively, while the fair value of long-term debt as of December 31, 2014 and 2013, was approximately $229,125 and $226,789, respectively, based on Level 2 inputs consisting of quoted market prices for the same issues or quoted market prices for similar issues in active markets. See Note 6 for further discussion of our debt.
Non-Current Investments
At December 31, 2014, we held certain securities in private companies, which are classified within other assets in our consolidated balance sheets. The investments in equity securities of private companies are classified as Level 3 investments and are reported at cost or on an equity basis. Any loss due to impairment in value is recorded as a realized loss when such loss occurs. We performed the evaluation of our Level 3 investments as of December 31, 2014 and 2013, and recorded a realized loss of $100 for the year ended December 31, 2013, based on our proportionate share of the losses from the Level 3 investment that we account for under the equity method of accounting.
During 2013, we sold an equity security investment for $1,785 that was classified as a Level 1 trading security within the other current assets line in our consolidated balance sheets. We recorded a realized loss of $231 within the other, net line in our statement of operations for the year ended December 31, 2013. This equity security investment was transferred from Level 2 to Level 1 during 2013 upon the lapse of a trading restriction on the investment security. We initially estimated the fair value of this investment to be $1,530. At December 31, 2012, we re-estimated the fair value of this investment and recorded a gain of $486 within the other, net line in our statements of operations for the twelve months ended December 31, 2012.
During the third quarter of 2013, we wrote off an investment in a publicly traded company as the company filed bankruptcy and trading of the stock was halted. Our investment in this publicly traded equity security, over which we did not exert significant influence, was classified as available-for-sale and reported at fair value on a recurring basis using Level 1 inputs. Unrealized gains and losses were reported within the accumulated other comprehensive income component of shareholders’ equity. We recorded an unrealized loss of $56 net of tax within other comprehensive income for the year ended December 31, 2013 and reclassified $454 from accumulated other comprehensive income to our statement of operations with a $414 realized loss included in the Other, net line in our statements of operations for the year ended December 31, 2013, and the balance of $40 included in tax expense.
The following table sets forth the change in the fair value of our investments for the periods indicated:
|
|
Level 1
|
Level 2
|
Level 3
|
Total
|
||||||||||||
|
|
||||||||||||||||
|
Balance at December 31, 2011
|
$
|
106
|
$
|
-
|
$
|
313
|
$
|
419
|
||||||||
|
Unrealized gain (loss)
|
(50
|
)
|
486
|
-
|
436
|
|||||||||||
|
Acquired investments
|
-
|
1,530
|
240
|
1,770
|
||||||||||||
|
Balance at December 31, 2012
|
56
|
2,016
|
553
|
2,625
|
||||||||||||
|
Unrealized gain (loss)
|
19
|
(441
|
)
|
-
|
(422
|
)
|
||||||||||
|
Realized gain (loss)
|
135
|
-
|
(100
|
)
|
35
|
|||||||||||
|
Level inputs transfer
|
1,575
|
(1,575
|
)
|
-
|
-
|
|||||||||||
|
Sale of investment
|
(1,785
|
)
|
-
|
-
|
(1,785
|
)
|
||||||||||
|
Balance at December 31, 2013
|
-
|
-
|
453
|
453
|
||||||||||||
|
2014 activity
|
-
|
-
|
-
|
-
|
||||||||||||
|
Balance at December 31, 2014
|
$
|
-
|
$
|
-
|
$
|
453
|
$
|
453
|
||||||||
Unrealized gains or losses on our available-for-sale (publicly traded) security, as well as foreign currency translation adjustments, are components of accumulated other comprehensive income as set forth in the following table:
|
|
Cumulative Translation Adjustment
|
Unrealized Gain (Loss)
on Available-For-Sale Security, Net of Tax |
Accumulated Other Comprehensive Income
|
|||||||||
|
Balance at December 31, 2011
|
$
|
1,961
|
$
|
(348
|
)
|
$
|
1,613
|
|||||
|
Net current period other comprehensive income (loss)
|
4
|
(50
|
)
|
(46
|
)
|
|||||||
|
Balance at December 31, 2012
|
1,965
|
(398
|
)
|
1,567
|
||||||||
|
Other comprehensive loss before reclassification
|
(103
|
)
|
(56
|
)
|
(159
|
)
|
||||||
|
Amounts reclassified from accumulated other comprehensive income
|
-
|
454
|
454
|
|||||||||
|
Net current period other comprehensive income (loss)
|
(103
|
)
|
398
|
295
|
||||||||
|
Balance at December 31, 2013
|
1,862
|
-
|
1,862
|
|||||||||
|
Net current period other comprehensive loss
|
(96
|
)
|
-
|
(96
|
)
|
|||||||
|
Balance at December 31, 2014
|
$
|
1,766
|
$
|
-
|
$
|
1,766
|
||||||
|
(5)
|
Restructuring
|
Restructuring and other expenses include $0, $3,856 and $830 of restructuring costs in the years ended December 31, 2014, 2013 and 2012, respectively.
In 2013, we completed certain restructuring initiatives. These initiatives included the end of life of specific, non-core products, consolidations of operations surrounding three facilities and the reorganization of our leadership team and sales organization. Included in contract exit costs are those charges associated with exiting or cancelling both vendor and customer contracts. In 2012, we completed a restructuring initiative to reduce our workforce. This action was taken based upon our assessment of ongoing personnel needs.
The following table shows a summary of the restructuring activity through December 31, 2014:
|
Employee Termination Costs
|
Contract Exit Costs
|
Total
|
||||||||||
|
Balance at December 31, 2011
|
$
|
970
|
$
|
437
|
$
|
1,407
|
||||||
|
Charges to expense
|
830
|
-
|
830
|
|||||||||
|
Payments
|
(1,094
|
)
|
(434
|
)
|
(1,528
|
)
|
||||||
|
Non-cash adjustments
|
(487
|
)
|
-
|
(487
|
)
|
|||||||
|
Balance at December 31, 2012
|
219
|
3
|
222
|
|||||||||
|
Charges to expense
|
1,943
|
1,913
|
3,856
|
|||||||||
|
Payments
|
(1,890
|
)
|
(887
|
)
|
(2,777
|
)
|
||||||
|
Balance at December 31, 2013
|
272
|
1,029
|
1,301
|
|||||||||
|
Payments
|
(146
|
)
|
(37
|
)
|
(183
|
)
|
||||||
|
Non-cash adjustments
|
(126
|
)
|
(992
|
)
|
(1,118
|
)
|
||||||
|
Balance at December 31, 2014
|
$
|
-
|
$
|
-
|
$
|
-
|
||||||
|
(6)
|
Debt and Operating Leases
|
Term Loan
On April 29, 2014, we completed a debt refinancing that resulted in a new six-year term loan (the Term Loan) of $235,000. The Term Loan replaced an existing term loan (the Prior Term Loan) and revolving credit facility, each of which was terminated upon completion of the debt refinancing.Proceeds from the Term Loan were used to repay the aggregate principal outstanding under the Prior Term Loan in addition to funding related transaction costs. The Prior Term Loan had a final outstanding balance of $230,133.
The Term Loan was established pursuant to a credit agreement (the Credit Agreement) which contains financial covenants consisting of total leverage and interest coverage ratios which are applicable beginning with the quarter ending March 31, 2015. Borrowings under the Credit Agreement bear interest at a floating rate that can be, at our option, either (i) a LIBOR borrowing rate for a specified interest period plus an applicable margin or, (ii) an alternative base rate plus an applicable margin, subject to a LIBOR rate floor of 1%, or a base rate floor of 2%, as applicable. The applicable margin for borrowings under the Credit Agreement is 6% per annum for LIBOR loans and 5% per annum for base rate loans. If an event of default occurs under the Credit Agreement, the applicable interest rate will increase by 2% per annum during the continuance of such event of default. Based on an election we made pursuant to the terms of the Credit Agreement with respect to the interest period and optional rate, borrowings under the Credit Agreement bore interest at a rate of 7.00% per annum through December 31, 2014. As of December 31, 2014, borrowings had a weighted average interest rate of 7.00%. Interest is currently payable on the last business day of each month and is dependent upon the type of loan outstanding under the Credit Agreement.
During 2014, we were required to make quarterly principal payments of $2,938. We made two such quarterly principal payments totaling $5.9 million in 2014. The Credit Agreement includes a required annual repayment of principal at no premium in the first quarter of each year based upon a defined calculation of excess cash flows generated by us. We obtained a waiver from our lenders and reclassified the amount of the mandatory prepayment for excess cash flows from a current liability to long-term debt at December 31, 2014, based on our intent and ability to obtain the waiver from our lenders subsequent to December 31, 2014. See note 16 for further discussion. As of December 31, 2014, the future maturities of principal under the Term Loan will be $229,125 as follows: for the years ended December 31, 2015, 2016, 2017, 2018 and 2019, $11,750, with $170,375 due in 2020.
Debt Modification and Extinguishment, Issuance Costs and Discount
We accounted for the April 29, 2014 debt refinancing in accordance with ASC 470-50-40. Accordingly, a portion of our Prior Term Loan was deemed modified and a portion was deemed extinguished. In the year ended December 31, 2014, for the portion deemed extinguished, we recorded a loss on debt extinguishment charge of $4,821 in our consolidated statement of operations. This loss included the write off of unamortized issuance costs of $3,080, unamortized debt discount of $1,679 and $62 of third-party costs. For the portion of the Prior Term Loan deemed modified, unamortized debt issuance costs of $678 and unamortized debt discount of $410 were deferred to be amortized over the life of the Term Loan. In addition, $202 of third-party costs were deferred as additional issuance costs of the Term Loan. Creditor fees of $2,575 and deferred unamortized debt discount of $410 were treated as additional debt discount, and along with the Term Loan original issue discount of $1,175, included in the consolidated balance sheet as a reduction of long-term debt. The debt discount is being amortized over the life of the Term Loan using the effective interest method. As of December 31, 2014, the long term debt balance on our consolidated balance sheet includes $3,699 of unamortized debt discount and the balance of unamortized issuance costs included in other assets is $783.
Interest Expense and Other
For the years ended December 31, 2014, 2013 and 2012, we recorded $17,096, $21,551 and $32,334, respectively, of interest expense related to the Term Loan, Prior Term Loan and Notes, including $465, $1,162 and $2,049, respectively, of amortization of debt issuance costs and $664, $487 and $675, respectively, of amortization of debt discount.
In 2014, 2013 and 2012, we made interest payments of $15,852, $24,759 and $29,610, respectively, related to the Term Loan, Prior Term Loan and Notes. Our borrowings under the Term Loan had an effective interest rate of 7.50% at December 31, 2014.
Variable Interest Rate Risk
To partially offset variable interest rate risks, we maintain an interest rate cap at 3.00% (versus the 1.00% LIBOR floor) with a notional amount equal to $122,588 as of December 31, 2014. The notional amount of the interest rate cap decreases over time to $121,950 as of September 29, 2015, and thereafter is equal to $62,316 until termination on October 23, 2015.
Prior Term Loan and Revolving Credit Facility
On April 23, 2013, we entered into a senior secured credit facility consisting of a six-year term loan (the Prior Term Loan) of $255,000 issued at 99% of the Prior Term Loan amount and a five-year revolving credit facility (the Revolving Credit Facility) of up to $20,000. The Prior Term Loan which had an intrest rate of 6% replaced our $252,000 Senior Secured Notes that bore interest at 11.75% (the Notes). The Prior Term Loan and Revolving Credit Facility were both terminated on April 29, 2014. During 2014, we made required principal payments of $592 against the Prior Term Loan as well as additional voluntary payments of $8,000.
During 2013, we capitalized $4,588 of debt issuance costs in other assets in our consolidated balance sheet. These issuance costs and the original issue discount of $2,550 were being amortized over the life of the Prior Term Loan using the effective interest method. The balances of unamortized debt issuance costs and debt discount at December 31, 2013 were $4,127 and $2,294, respectively.
For the year ended December 31, 2013, we made required principal payments of $1,275 against the Prior Term Loan as well as additional voluntary payments of $15,000.
$252,000 Senior Secured Notes
The Notes were replaced by our Prior Term Loan and Revolving Credit Facility in April 2013 as noted above. For the year ended December 31, 2013, we recorded a charge of $23,822 for the early debt extinguishment of these notes in our consolidated statement of operations. This charge consisted of $5,235 for unamortized debt issuance costs, $1,724 for unamortized net debt discount and $16,863 for early retirement costs associated with the extinguishment of the Notes.
Operating Leases
We have non-cancelable operating leases at various locations. Our five largest operating leases are all facility leases as set forth in the following table:
|
Location
|
Square Footage
|
Annual Lease Payments
|
End of Term
|
||||||
|
Chicago, Illinois
|
22,633
|
$
|
378
|
December 2015
|
|||||
|
Daytona Beach, Florida
|
36,000
|
177
|
December 2015
|
||||||
|
Hartland, Wisconsin
|
81,000
|
730
|
November 2025
|
||||||
|
Mississauga, Ontario
|
24,000
|
572
|
February 2020
|
||||||
|
Morrisville, North Carolina
|
14,746
|
278
|
September 2016
|
||||||
Total rent expense for all operating leases in 2014, 2013 and 2012 was $2,263, $3,184, and $3,351, respectively. Future minimum lease payments under all non-cancelable operating leases as of December 31, 2014, are:
|
2015
|
$
|
2,152
|
||
|
2016
|
1,514
|
|||
|
2017
|
1,302
|
|||
|
2018
|
1,302
|
|||
|
2019
|
1,302
|
|||
|
Thereafter
|
4,416
|
|||
|
Total minimum lease payments
|
$
|
11,988
|
Income received under non-cancelable sub-leases in 2014, 2013 and 2012 was $0, $76 and $227, respectively.
|
(7)
|
Shareholders’ Equity
|
In 2013, we issued 40,225 shares of our common stock valued at $124 as consideration for insignificant acquisitions. The value of the shares issued was based on the closing price of our common stock on the date of issuance. Additionally, we cancelled 122,292 shares of common stock which were originally valued at $6.95 per share and were issued as part of a holdback position in an insignificant acquisition. The cancellation of the shares was in settlement of a $2,194 indemnified asset. This resulted in a charge of $1,345 within general and administrative expense. We also issued 400,000 shares of our common stock valued at $885 as consideration in the settlement of a lawsuit that existed at the time of an insignificant acquisition. The value of the shares issued was based on the closing price of our common stock on the date of issuance, discounted for a trading restriction, and was recorded within general and administrative expense.
In 2012, we issued 1,356,917 shares of our common stock valued at $5,202 as consideration for insignificant acquisitions. The value of the shares issued was based on the closing price of our common stock on the earlier of the date shares were issued or subscribed, discounted based upon a holdback provision and trading restrictions over one year. The agreement also contained a provision for a settlement at a future date calculated by the change in the volume weighted average price of our stock. This was accounted for as a liability based on the use of the Monte Carlo Simulation Method. Through settlement, we incurred a $1,383 charge to Acquisition-related expenses for the change in fair value of this Level 2 instrument. These shares were issued pursuant to an exception from registration provided by Section 4(a)(2) of the Securities Act of 1933, as amended. We also issued 505,038 shares of restricted stock which immediately vested to current employees as settlement of contingent consideration arising for an insignificant acquisition. The restricted shares were valued at $1,827 based on the closing price of our common stock on the date of issuance.
|
(8)
|
Share-Based Compensation
|
The following table summarizes share-based compensation expense related to share-based awards recognized in 2014, 2013 and 2012:
|
Years Ended December 31,
|
||||||||||||
|
2014
|
2013
|
2012
|
||||||||||
|
Share-based compensation expense included in the statement of operations:
|
||||||||||||
|
Software and other cost of sales
|
$
|
57
|
$
|
20
|
$
|
-
|
||||||
|
Professional services cost of sales
|
116
|
91
|
90
|
|||||||||
|
Maintenance and EDI cost of sales
|
101
|
44
|
40
|
|||||||||
|
Sales and marketing
|
1,487
|
1,243
|
1,805
|
|||||||||
|
Product research and development
|
776
|
498
|
451
|
|||||||||
|
General and administrative
|
2,632
|
2,749
|
3,400
|
|||||||||
|
Restructuring and other expenses
|
-
|
194
|
-
|
|||||||||
|
Share-based compensation expense, net of tax
|
$
|
5,169
|
$
|
4,839
|
$
|
5,786
|
||||||
The expense in restructuring and other expenses of $194 during 2013 relates to the acceleration of certain stock options held by a former executive officer.
Share-Based Compensation Plans
We maintain three share-based employee compensation plans, which includes our 2005 Equity Incentive Plan (EIP), our employee stock purchase plan (ESPP), and our 1998 stock plan for directors.
Our 2005 Equity Incentive Plan (EIP) provides for awards of common stock, non-statutory stock options, incentive stock options, stock unit and performance unit grants and stock appreciation rights to eligible participants. On June 18, 2013, an amendment was approved by our shareholders to increase the number of shares of common stock authorized for issuance under the 2005 EIP by 2,000,000 to a total of 18,500,000 shares. Under the terms of the 2005 EIP, incentive stock option grants are limited to 5.0 million shares. Also, under the EIP, new stock option grants have an exercise price equal to the fair market value of our common stock at the date of grant with limited exceptions. The majority of the options issued under the 2005 EIP vest over a three or four-year period. As of December 31, 2014, non-statutory stock options to purchase 5,992,868 shares of our common stock were outstanding under this plan.
We no longer grant options to purchase common stock under our 1998 Director Stock Option Plan.
Stock Options
We use the Black-Scholes option pricing model to estimate the fair value of stock option awards on the date of grant utilizing the assumptions noted in the following table. We expense the cost of stock option awards on a straight-line basis over the vesting period. Expected volatilities are based on the historical volatility of our stock and other factorsincluding the historical exercise patterns of employees in relatively homogeneous groups with respect to exercise and post-vesting employment termination behaviors, expected future exercise patterns for these same homogeneous groups, and the volatility of our stock price. ASC Topic No. 718, Compensation-Stock Compensation, requires forfeitures to be estimated at the time of grant and revised, if necessary, in subsequent periods if actual forfeitures differ from those estimates. We use historical data to estimate option exercises and employee terminations within the valuation model. The expected term of options represents the period of time that options granted are expected to be outstanding. The risk-free rate for periods during the contractual life of the option is based on the U.S. Treasury rates in effect at the grant date.
|
Years Ended December 31,
|
||||||||||||
|
2014
|
2013
|
2012
|
||||||||||
|
Dividend yield
|
0
|
%
|
0
|
%
|
0
|
%
|
||||||
|
Expected volatility
|
65
|
%
|
65
|
%
|
65
|
%
|
||||||
|
Risk–free interest rate
|
0.7% - 1.1
|
%
|
0.3% - 1.0
|
%
|
0.3% - 0.8
|
%
|
||||||
|
Expected term (in years)
|
5.0
|
3.0
|
3.0
|
|||||||||
|
Weighted–average grant date fair value
|
$
|
2.33
|
$
|
1.99
|
$
|
3.51
|
||||||
At December 31, 2014, there was $3,089 of unrecognized compensation cost related to stock option share-based payments. We expect this compensation cost to be recognized over a weighted-average period of 1.6 years.
Stock option activity for the years ended December 31, 2013 and 2014, is as follows:
|
|
Number
of |
Weighted-
Average |
Weighted-Average
Remaining |
Aggregate
Intrinsic |
||||||||||||
|
Options outstanding, December 31, 2012
|
12,172,452
|
$
|
3.63
|
4.1
|
$
|
3,767
|
||||||||||
|
Options granted
|
1,120,000
|
3.19
|
||||||||||||||
|
Options exercised
|
(902,500
|
)
|
1.37
|
$
|
1,238
|
|||||||||||
|
Options forfeited and expired
|
(3,471,662
|
)
|
4.37
|
|||||||||||||
|
Options outstanding, December 31, 2013
|
8,918,290
|
$
|
3.51
|
2.5
|
$
|
2,391
|
||||||||||
|
Options granted
|
565,000
|
2.41
|
||||||||||||||
|
Options exercised
|
(1,191,250
|
)
|
0.85
|
$
|
1,594
|
|||||||||||
|
Options forfeited and expired
|
(2,299,172
|
)
|
3.96
|
|||||||||||||
|
Options outstanding, December 31, 2014
|
5,992,868
|
$
|
3.76
|
3.0
|
$
|
4,145
|
||||||||||
|
|
||||||||||||||||
|
Options exercisable, December 31, 2012
|
5,545,382
|
$
|
2.50
|
3.4
|
$
|
3,765
|
||||||||||
|
Options exercisable, December 31, 2013
|
6,185,165
|
$
|
3.06
|
1.8
|
$
|
2,391
|
||||||||||
|
Options exercisable, December 31, 2014
|
4,003,493
|
$
|
3.61
|
2.5
|
$
|
3,098
|
||||||||||
We received cash proceeds of $1,018 from the exercise of stock options in 2014 and $1,236 in 2013.
The following table summarizes information about stock options outstanding at December 31, 2014:
|
Options Outstanding
|
Options Exercisable
|
|||||||||||||||||||
|
Range of exercise prices
|
Number of
shares |
Weighted–
average |
Weighted–
average |
Number of
shares |
Weighted–
average |
|||||||||||||||
|
$0.00 - $2.49
|
1,115,000
|
4.3
|
$
|
1.76
|
775,000
|
$
|
1.49
|
|||||||||||||
|
$2.49 - $4.98
|
3,111,902
|
2.5
|
2.99
|
2,204,402
|
3.03
|
|||||||||||||||
|
$4.98 - $7.46
|
1,734,272
|
3.0
|
6.19
|
992,397
|
6.13
|
|||||||||||||||
|
$7.46 - $9.95
|
-
|
-
|
-
|
-
|
-
|
|||||||||||||||
|
$9.95 - $12.44
|
1,694
|
2.3
|
10.81
|
1,694
|
10.81
|
|||||||||||||||
|
$12.44 - $14.93
|
-
|
-
|
-
|
-
|
-
|
|||||||||||||||
|
$14.93 - $17.42
|
-
|
-
|
-
|
-
|
-
|
|||||||||||||||
|
$17.42 - $19.90
|
30,000
|
0.4
|
17.50
|
30,000
|
17.50
|
|||||||||||||||
|
|
5,992,868
|
3.0
|
$
|
3.76
|
4,003,493
|
$
|
3.61
|
|||||||||||||
Restricted Stock Awards
In 2014 and 2013, we granted restricted stock awards to non-employee directors and employees under the 2005 EIP. A restricted stock award is an award of shares of our common stock that is subject to time-based vesting during a specified period, which is generally three years. Restricted stock awards are independent of option grants and are generally subject to forfeiture if employment terminates prior to the vesting of the awards. Participants have full voting and dividend rights with respect to shares of restricted stock.
We expense the cost of the restricted stock awards, which is determined to be the fair market value of the restricted stock awards at the date of grant, on a straight-line basis over the vesting period. For these purposes, the fair market value of the restricted stock award is determined based on the closing price of our common stock on the grant date.
The following table presents a summary of the activity for our restricted stock awards:
|
|
Number
of |
Weighted-Average
Grant-date |
Weighted-Average
Remaining |
|||||||||
|
Restricted stock outstanding, December 31, 2012
|
-
|
$
|
-
|
-
|
||||||||
|
Restricted stock granted
|
2,100,000
|
2.47
|
-
|
|||||||||
|
Restricted stock vested
|
-
|
-
|
-
|
|||||||||
|
Restricted stock forfeited
|
-
|
-
|
-
|
|||||||||
|
Restricted stock outstanding, December 31, 2013
|
2,100,000
|
$
|
2.47
|
2.9
|
||||||||
|
Restricted stock granted
|
652,195
|
2.41
|
-
|
|||||||||
|
Restricted stock vested
|
(809,447
|
)
|
2.47
|
-
|
||||||||
|
Restricted stock forfeited
|
-
|
-
|
-
|
|||||||||
|
Restricted stock outstanding, December 31, 2014
|
1,942,748
|
$
|
2.45
|
1.7
|
||||||||
During 2013, we granted 2,100,000 shares of restricted stock at a weighted-average grant date fair value of $2.47 per share that vest over a three year term. During 2014, we granted 400,000 shares of restricted stock at a weighted-average grant date fair value of $2.49 per share, 100,000 of which vested upon issuance and 300,000 of which vest over a three year term. During 2014, we also granted 252,195 shares of restricted stock at a weighted-average grant date fair value of $2.28 per share, all of which vest over one year.
At December 31, 2014, there was $3,705 of unrecognized compensation cost related to restricted stock. We expect this compensation cost to be recognized over a weighted-average period of 1.8 years.
Other information pertaining to vested restricted stock activity was as follows:
|
Years Ended December 31,
|
||||||||||||
|
2014
|
2013
|
2012
|
||||||||||
|
Total fair value of restricted stock awards vested
|
$
|
2,882
|
$
|
-
|
$
|
1,591
|
||||||
Employee Stock Purchase Plan
We maintain an ESPP that allows eligible employees to purchase shares of our common stock through payroll deductions of up to 10% of eligible compensation on an after-tax basis. Eligible employees receive a 5% discount from the market price at the end of each calendar quarter for purchases made. There is no stock-based compensation expense associated with our ESPP.During the second quarter of 2014, our shareholders approved a 500,000 share increase in the number of shares available for purchase under the plan.
Employees contributed $199, $253, and $353, during the years ended December 31, 2014, 2013, and 2012, respectively, to purchase shares of our common stock under the employee stock purchase plan.
|
(9)
|
Commitments and Contingencies
|
Litigation
In August 2010, Merge Healthcare was sued in the Northern District of Texas by the Court-appointed receiver for Stanford International Bank, Ltd. The receiver alleges that Merge Healthcare was a recipient of a fraudulent conveyance as a result of a Ponzi scheme orchestrated by Robert Stanford and Stanford International Bank, Ltd. (SIBL). Merge Healthcare is not alleged to have participated in the Ponzi scheme. The receiver’s claims arise from the failed acquisition of Emageon, Inc. (Emageon) by Health Systems Solutions, Inc. (HSS), an affiliate of SIBL, in February 2009, which resulted in the payment of a $9,000 break-up fee by HSS, which payment is alleged to have been financed by SIBL. Merge Healthcare subsequently acquired Emageon as part of our AMICAS acquisition. The complaint seeks to recover the $9,000 payment to Emageon, plus interest, costs, and attorneys’ fees. We have retained litigation counsel and intend to vigorously defend this action. We filed a motion to dismiss the complaint, which motion was denied. Trial has been scheduled for May 2015. Discovery in this matter is ongoing. We believe it is reasonably possible that we may incur a loss with respect to this matter. The potential loss may lie in a range from zero to the full amount claimed, plus interest.
On January 16, 2014, a purported shareholder class action complaint was filed in the United States District Court for the Northern District of Illinois by Fernando Rossy, who claims to be a Merge Healthcare stockholder, against Merge Healthcare and certain current and former directors and officers claiming violations of federal securities laws and asserting that a class of our stockholders suffered damages due to the alleged dissemination or approval of false and misleading statements by Merge Healthcare from August 1, 2012 through January 7, 2014 related to falsified subscription backlog figures and a reluctance amongst large health systems to make enterprise purchases, as well as a lack of effective controls. Several other putative shareholder class action complaints alleging materially the same causes of action were subsequently filed. A hearing was held on March 26, 2014 before the Court of the Northern District Illinois, at which time the Court granted the motion of the Arkansas Teacher Retirement System (“ATRS”) to consolidate the class action cases and to appoint ATRS as lead plaintiff. ATRS filed an amended complaint on May 28, 2014. We have filed a motion to dismiss the purported class action lawsuit, and we expect a decision on the motion to be rendered in the first quarter of 2015. On February 14, 2014, William B. Federman, who claims to be a Merge Healthcare stockholder, filed a derivative complaint in the Circuit Court of Cook County, Illinois against certain of our current and former directors and officers, asserting breaches of fiduciary duty arising out of materially the same conduct alleged in the securities fraud class action complaints. Subsequently, two other derivative complaints were filed in the United States District Court of the Northern District of Illinois. On June 6, 2014, the judge assigned to the class action case granted our motion to reassign the two Federal derivative actions to her on the basis of relatedness and stayed the Federal derivative cases until she rules on our motion to dismiss the class action case. The plaintiffs in the class action and derivative cases have not claimed a specific amount of damages. Merge Healthcare and the other named defendants are actively considering all possible responses to these complaints. While we intend to defend the claims vigorously and carry directors and officers insurance, it is reasonably possible that we may incur a loss in this matter. At this stage of the proceedings, however, it is not possible for management to reasonably estimate either the likelihood of such a loss or its magnitude.
In addition to the matters discussed above, we are involved in various legal matters that are in the process of litigation or settled in the ordinary course of business. Although the final results of all such matters and claims cannot be predicted with certainty, we believe that the ultimate resolution of all such matters and claims will not have a material adverse effect on Merge’s financial condition. Professional legal fees are expensed when incurred. We accrue for contingent losses when such losses are probable and reasonably estimable. In the event that estimates or assumptions prove to differ from actual results, adjustments are made in subsequent periods to reflect more current information. Should we fail to prevail in any legal matter or should several legal matters be resolved against us in the same reporting period, such matters could have a material adverse effect on our operating results and cash flows for that particular period.
|
(10)
|
Transactions with Related Party
|
Merrick Ventures, LLC (Merrick Ventures) and Merrick Venture Management Holdings, LLC (Merrick Holdings), beneficially own, as of December 31, 2014, approximately 26.9% of our outstanding common stock. Michael W. Ferro, Jr., the Chairman of the Board of Merge Healthcare, and trusts for the benefit of Mr. Ferro’s family members beneficially own a majority of the equity interests in Merrick Ventures and Merrick Holdings. Mr. Ferro serves as the chairman and chief executive officer of each of Merrick Holdings and of Merrick Ventures. Accordingly, Mr. Ferro indirectly controls all of the shares of Common Stock owned by Merrick Holdings and Merrick Ventures.
Beginning in 2009 we were a party to a consulting agreement with Merrick RIS, LLC, an affiliate of Merrick Holdings and Merrick Ventures, under which Merrick provided services including financial analysis and strategic planning. In 2012 we entered into a second amendment to extend the term of the consulting agreement with Merrick RIS, LLC, through December 31, 2013, and modified the fee structure to include a quarterly retainer in the amount of $150 in addition to a per transaction fee of $250 for acquisitions by Merge Healthcare. The consulting agreement expired on December 31, 2013. We paid $627 and $1,069 to Merrick for such services and recognized $600 and $850 in acquisition related expenses and $27 and $126 in general and administrative expenses in 2013 and 2012, respectively. As of December 31, 2013, we had no remaining obligations under this agreement.
Merrick Ventures owned 33% of the outstanding equity interest of an entity called higi llc (higi). Mr. Ferro was higi’s Founder. In December 2011, we entered into a master services agreement with higi, pursuant to which we agreed to provide higi with certain professional services, including software engineering design, application and web portal development. Revenue of $14 and $155 was recognized under this agreement in 2013 and 2012, respectively. In addition, the agreement granted higi certain branding rights related to our health station business and required higi to pay to us a fixed annual fee of one hundred dollars per station for each station that was branded with higi’s trademark and that included higi’s user interface. The agreement terminated in accordance with its terms on December 31, 2013. On March 28, 2012, we entered into an agreement to sell higi health stations and related equipment for $2,750. Revenue of $2,750 was recognized related to this agreement in 2012.
From September 8, 2010 through expiration on December 9, 2013, we were a party to an assignment agreement with Merrick Ventures under which Merrick Ventures assigned to us its sublease with Aon Corporation for approximately 11,934 square feet located on the 20th floor of 200 East Randolph Street, in Chicago Illinois. The base rental rate was approximately $20 per month from January 1, 2012 to December 9, 2013, when the sublease expired. The rent was paid to the sub–landlord monthly and was the same rate as Merrick Ventures paid under the sublease.
From February 24, 2012 through expiration on December 13, 2013, we were a party to an agreement with Merrick Ventures under which Merge agreed to sublease from Merrick approximately 4,700 square feet located at 200 E. Randolph Street, 22nd floor, Chicago, IL at an annual rental of $80. The rent was paid to Merrick monthly and was the same rate as Merrick paid under its lease. Merge paid approximately $74 (which represents the book value) for all fixtures, leasehold improvements and furniture located in the space. We vacated the space we subleased from Merrick Ventures in September 2013.
|
(11)
|
Income Taxes
|
Components of loss before income taxes in 2014, 2013 and 2012 are as follows:
|
|
Years Ended December 31,
|
|||||||||||
|
|
2014
|
2013
|
2012
|
|||||||||
|
United States
|
$
|
(3,019
|
)
|
$
|
(39,888
|
)
|
$
|
(32,231
|
)
|
|||
|
Foreign
|
4,908
|
3,794
|
7,502
|
|||||||||
|
|
$
|
1,889
|
$
|
(36,094
|
)
|
$
|
(24,729
|
)
|
||||
The provision for income taxes consists of the following in 2014, 2013 and 2012:
|
|
Years Ended December 31,
|
|||||||||||
|
|
2014
|
2013
|
2012
|
|||||||||
|
Current:
|
||||||||||||
|
Federal
|
$
|
-
|
$
|
-
|
$
|
-
|
||||||
|
State
|
184
|
588
|
482
|
|||||||||
|
Foreign
|
-
|
-
|
28
|
|||||||||
|
Total current
|
184
|
588
|
510
|
|||||||||
|
Deferred:
|
||||||||||||
|
Federal
|
519
|
1,054
|
925
|
|||||||||
|
State
|
(445
|
)
|
(89
|
)
|
279
|
|||||||
|
Foreign
|
2,039
|
1,336
|
2,377
|
|||||||||
|
Total deferred
|
2,113
|
2,301
|
3,581
|
|||||||||
|
Total provision
|
$
|
2,297
|
$
|
2,889
|
$
|
4,091
|
||||||
Actual income taxes varied from the expected income taxes (computed by applying the statutory income tax rate of 35% for the years ended December 31, 2014, 2013 and 2012 to income before income taxes) as a result of the following:
|
|
Years Ended December 31,
|
|||||||||||
|
|
2014
|
2013
|
2012
|
|||||||||
|
|
||||||||||||
|
Expected tax expense (benefit)
|
$
|
661
|
$
|
(12,633
|
)
|
$
|
(8,655
|
)
|
||||
|
Total increase (decrease) in income taxes resulting from:
|
||||||||||||
|
Change in valuation allowance allocated to income tax expense
|
1,584
|
16,223
|
13,987
|
|||||||||
|
Acquisition costs
|
-
|
(293
|
)
|
309
|
||||||||
|
State and local income taxes, net of federal income tax benefit
|
1,118
|
(8
|
)
|
(672
|
)
|
|||||||
|
Foreign income tax rate differential
|
(638
|
)
|
(426
|
)
|
(723
|
)
|
||||||
|
Change in unrecognized tax benefits
|
(76
|
)
|
359
|
167
|
||||||||
|
Other
|
(352
|
)
|
(333
|
)
|
(322
|
)
|
||||||
|
Actual income tax expense
|
$
|
2,297
|
$
|
2,889
|
$
|
4,091
|
||||||
The tax effects of temporary differences that give rise to significant portions of the deferred tax assets and deferred tax liabilities at December 31, 2014 and 2013 are presented as follows:
|
|
December 31,
|
|||||||
|
|
2014
|
2013
|
||||||
|
Deferred tax assets:
|
||||||||
|
Accrued compensation
|
$
|
802
|
$
|
1,354
|
||||
|
Bad Debt
|
419
|
2,977
|
||||||
|
Depreciation
|
1,978
|
1,780
|
||||||
|
Research and experimentation credit carryforwards
|
3,725 |
6,951
|
||||||
|
Other credit carryforwards
|
1,370 |
1,566
|
||||||
|
Domestic loss carryforwards
|
93,414 |
125,143
|
||||||
|
Foreign loss carryforwards
|
5,998
|
7,240
|
||||||
|
Nonqualified stock options
|
7,551
|
6,667
|
||||||
|
Other
|
4,413
|
4,249
|
||||||
|
Total gross deferred tax assets
|
119,670 |
157,927
|
||||||
|
Less: asset valuation allowance
|
(104,356
|
)
|
(136,364
|
)
|
||||
|
Net deferred tax asset
|
15,314 |
21,563
|
||||||
|
Deferred tax liabilities:
|
||||||||
|
Software development costs and intangible assets
|
(6,573
|
)
|
(5,656
|
)
|
||||
|
Intangibles—customer contracts & tradenames
|
(3,388
|
)
|
(5,977
|
)
|
||||
|
Other
|
(2,851) |
(5,101
|
)
|
|||||
|
Total gross deferred liabilities
|
(12,812
|
)
|
(16,734
|
)
|
||||
|
Net deferred tax asset
|
$
|
2,502
|
$
|
4,829
|
||||
|
Included on balance sheet:
|
||||||||
|
Current assets: deferred income taxes
|
$
|
1,131
|
$
|
1,915
|
||||
|
Non–current asset: deferred income taxes
|
5,396
|
6,979
|
||||||
|
Current liabilities: deferred income taxes
|
-
|
-
|
||||||
|
Non–current liabilities: deferred income taxes
|
(4,025
|
)
|
(4,065
|
)
|
||||
|
Net deferred income taxes
|
$
|
2,502
|
$
|
4,829
|
||||
At December 31, 2014, we had U.S. federal net operating loss, research credit, alternative minimum tax credit, and foreign tax credit carryforwards of $254,410, $2,072, $972 and $106 respectively, state net operating loss carryforwards of $65,512, foreign federal and provincial net operating loss carryforwards of $65,512 foreign and provincial capital loss carryforwards of $5,981 and $5,981, respectively, and foreign federal and provincial research credit carryforwards of $1,976 and $292, respectively. The U.S. federal net operating loss, research credit and foreign tax credit carryforwards expire in varying amounts beginning in 2015 and continuing through 2034, 2030 and 2018, respectively. The state net operating loss carryforwards expire in varying amounts beginning in 2014 and continuing through 2034, and the credit carryforwards expire in varying amounts beginning 2020 and continuing through 2023. The foreign tax credits expire in varying amounts beginning in 2018, and continuing through 2024. The foreign federal and provincial net operating loss carryforwards expire in varying amounts beginning in 2014, and continuing through 2030. Foreign and provincial capital losses may be carried forward indefinitely.
Management has an obligation to review, at least annually, the components of our deferred tax assets. This review is to ascertain that, based upon the information available at the time of the preparation of financial statements, it is more likely than not, that we expect to utilize these future deductions and credits. In the event that management determines that it is more likely than not these future deductions, or credits, will not be utilized, a valuation allowance is recorded, reducing the deferred tax asset to the amount expected to be realized.
Management’s analysis for 2014 resulted in a valuation allowance of 104,356 at December 31, 2014. Based on both quantitative and qualitative factors, we record a valuation allowance for all jurisdictions except Canada, which is profitable and separate company state jurisdictions for the Merge Healthcare Solutions legal entity, which are profitable as well. Valuation allowances were released during 2014 related to net deferred tax assets at separate company state jurisdictions for the Merge Healthcare Solutions legal entity. The release of this valuation allowance is a result of a separate legal entity’s consistent cumulative income position and ability to satisfy the internal policy to rely on forecasted earnings. The net income impact of the tax valuation allowance release was a tax benefit of approximately $562. A valuation allowance was retained on the portion of the separate legal entity’s state net operating losses that are estimated to not be utilized based on income forecasts and Section 382 limitations. The state NOLs expire in various tax years through 2034.
We considered the effect of U.S. Internal Revenue Code (Code) Section 382 on our ability to utilize existing U.S. net operating loss and tax credit carryforwards. Section 382 imposes limits on the amount of tax attributes that can be utilized where there has been an ownership change as defined under the Code. Almost all of our U.S. and state net operating loss, capital loss and credit carryforwards are subject to future limitation. The future limitation is in addition to any past limitations applicable to the net operating loss and credit carryforwards of previously acquired businesses. While application of Section 382 is complex, we currently project deferred tax assets of $33,072 related to U.S. net operating loss and research tax credit carryforwards may be unrealizable due to Section 382 limitations. Certain recognition periods related to the application of Section 382 have lapsed in the current year related to significant historical acquisitions. We reevaluated the recognition of the associated deferred tax assets in the current year, and have reduced the deferred tax assets and the corresponding valuation allowance by the amount projected to be unrealized.
The net decrease in the valuation allowance in 2014 was $32,008 and the net increase in 2013 and 2012 was $15,247 and $15,375, respectively. The 2014 decrease was primarily attributable to the reduction of deferred tax assets related to unrealizable tax attribute carry forwords based on Section 382 limitations.
There exist potential tax benefits for us associated with stock-based compensation. At December 31, 2014, 2013 and 2012, we had $2,364, $1,892 and $1,638, respectively, of excess tax benefits related to vesting of restricted stock awards, nonqualified stock option exercises and disqualifying dispositions of employee incentive stock options. The income tax benefit related to excess tax benefits of stock-based compensation will be credited to paid-in-capital, when recognized, by reducing taxes payable.
The total amount of unrecognized tax benefits as of December 31, 2014, 2013, and 2012 was $2,256, $2,232 and $2,109, respectively. We recognize interest and penalties in the provision for income taxes. Total accrued interest and penalties as of December 31, 2014 were $274 and $167, respectively. Total accrued interest and penalties as of December 31, 2013 were $299 and $199, respectively. Total accrued interest and penalties as of December 31, 2012 were $162 and $102, respectively. Total interest included in tax expense in 2014, 2013, and 2012 were $(25), $138 and $19, respectively. Total penalties included in tax expense in 2014, 2013, and 2012 were $(33), $98 and $48, respectively.
The following is a tabular reconciliation of the total amounts of unrecognized tax benefits in 2014, 2013 and 2012:
|
|
December 31,
|
|||||||||||
|
|
2014
|
2013
|
2012
|
|||||||||
|
Balance at January 1
|
$
|
2,232
|
$
|
2,109
|
$
|
1,862
|
||||||
|
Gross increases - tax positions in current year
|
-
|
-
|
55
|
|||||||||
|
Gross increases - tax positions in prior year
|
24
|
123
|
192
|
|||||||||
|
Gross decreases - tax positions in prior year
|
-
|
-
|
-
|
|||||||||
|
Decreases due to statute expirations
|
-
|
-
|
-
|
|||||||||
|
Balance at December 31
|
$
|
2,256
|
$
|
2,232
|
$
|
2,109
|
||||||
The total amount of unrecognized tax benefits at December 31, 2014, December 31, 2013 and December 31, 2012 that, if recognized, would affect the effective tax rate is $1,977, $2,029 and $1,948, respectively. We do not expect a significant change in unrecognized tax benefits within the next twelve months.
We file income tax returns in the U.S., various states and foreign jurisdictions. We are currently under examination in the U.S. federal taxing jurisdiction for 2012. U.S. federal tax jurisdiction years ending after 2010 remain subject to examination. Years prior to 2011 remain subject to examination to the extent net operating loss and tax credit carryforwards have been utilized after 2009, or remain subject to carryforward. Our Canadian tax returns have been examined through 2009.
We indefinitely reinvest any undistributed profits of our non-U.S. subsidiaries. Through year-end our non-U.S. subsidiaries have cumulative deficits.
|
(12)
|
Net Loss Per Share Attributable to Common Shareholders of Merge
|
Basic and diluted net income or loss per share is computed by dividing net income or loss available to common shareholders by the weighted average number of shares of common stock outstanding during the period. The computation of net income or loss available to common shareholders is presented in our consolidated statements of operations. Diluted net income per share includes the dilution that could occur based on the potential exercise of stock options, except for stock options with an exercise price of more than the average market price of our common stock during the period, as such exercise would be anti-dilutive, and assuming the potential lapse of restrictions on outstanding restricted stock awards.
In 2014, 2013, and 2012, options to purchase 5,217,868, 5,023,602 and 4,579,300 shares of our common stock, respectively, had exercise prices greater than the average market price of our common stock, and, therefore, would not be included in the calculations of diluted net income per share. Restricted stock at December 31, 2014 and 2013, totaling 1,942,748 and 2,100,000 shares, respectively, was not included in the calculation of basic net income or loss per share as the shares were not vested as of those dates.
As a result of the losses in 2014, 2013 and 2012, incremental shares from the assumed conversion of employee stock options totaling 775,000, 3,894,688, and 7,593,152 shares, respectively, and the potential lapse of restrictions on outstanding restricted stock awards have been excluded from the calculation of diluted loss per share as their inclusion would have been anti-dilutive.
Potentially dilutive common stock equivalent securities, including securities that may be considered in the calculation of diluted net income per share outstanding as of December 31, 2014, 2013 and 2012, were 7,935,616, 11,018,290, and 12,172,452, respectively.
|
(13)
|
Employee Benefit Plan
|
We maintain defined contribution retirement plans (a 401(k) profit sharing plan for the U.S. employees and Registered Retirement Saving Plan (RRSP) for the Canadian employees), covering employees who meet the minimum service requirements and have elected to participate. We made matching contributions (under the 401(k) profit sharing plan for the U.S. employees and Deferred Profit Sharing Plan (DPSP) for the Canadian employees) equal to a maximum of 3.0% of base salary in 2014, 2013 and 2012. Our matching contributions totaled $1,195, $1,256, and $1,225, in 2014, 2013, and 2012, respectively.
|
(14)
|
Segment Information and Concentrations of Risk
|
We operate under two reportable segments, Merge Healthcare and Merge DNA. Our Merge Healthcare operating group, which represents about 85% of our total revenue in 2014, markets, sells and implements interoperability, imaging and clinical solutions to healthcare providers. Our Merge DNA (Data and Analytics) operating group represents the remaining revenue and focuses on data capture software for clinical trials and other solutions.
We evaluate the performance of these operating groups based on their respective revenues and operating income, which exclude public company costs, certain corporate costs (amortization expense that is not specific to a segment), net interest expense and income taxes.
The following tables present operating group financial information for the periods indicated.
|
|
Year ended December 31, 2014
|
|||||||||||
|
|
Healthcare
|
DNA
|
Total
|
|||||||||
|
Net sales:
|
||||||||||||
|
Software and other
|
$
|
51,801
|
$
|
19,283
|
$
|
71,084
|
||||||
|
Professional Services
|
27,162
|
10,871
|
38,033
|
|||||||||
|
Maintenance and EDI
|
102,004
|
1,183
|
103,187
|
|||||||||
|
Total net sales
|
180,967
|
31,337
|
212,304
|
|||||||||
|
Expenses
|
151,809
|
27,719
|
179,528
|
|||||||||
|
Segment income
|
$
|
29,158
|
$
|
3,618
|
32,776
|
|||||||
|
|
||||||||||||
|
Net corporate/other expenses (1)
|
30,887
|
|||||||||||
|
Income before income taxes
|
$
|
1,889
|
||||||||||
|
|
||||||||||||
|
|
Year ended December 31, 2013
|
|||||||||||
|
|
Healthcare
|
DNA
|
Total
|
|||||||||
|
Net sales:
|
||||||||||||
|
Software and other
|
$
|
57,371
|
$
|
21,204
|
$
|
78,575
|
||||||
|
Professional Services
|
28,290
|
15,540
|
43,830
|
|||||||||
|
Maintenance and EDI
|
107,220
|
2,042
|
109,262
|
|||||||||
|
Total net sales
|
192,881
|
38,786
|
231,667
|
|||||||||
|
Expenses
|
171,838
|
35,094
|
206,932
|
|||||||||
|
Segment income
|
$
|
21,043
|
$
|
3,692
|
24,735
|
|||||||
|
|
||||||||||||
|
Net corporate/other expenses (1)
|
60,829
|
|||||||||||
|
Loss before income taxes
|
$
|
(36,094
|
)
|
|||||||||
|
|
||||||||||||
|
|
Year ended December 31, 2012
|
|||||||||||
|
|
Healthcare
|
DNA
|
Total
|
|||||||||
|
Net sales:
|
||||||||||||
|
Software and other
|
$
|
78,941
|
$
|
15,525
|
$
|
94,466
|
||||||
|
Professional Services
|
27,552
|
13,426
|
40,978
|
|||||||||
|
Maintenance and EDI
|
110,894
|
2,566
|
113,460
|
|||||||||
|
Total net sales
|
217,387
|
31,517
|
248,904
|
|||||||||
|
Expenses
|
192,408
|
33,315
|
225,723
|
|||||||||
|
Segment income (loss)
|
$
|
24,979
|
$
|
(1,798
|
)
|
23,181
|
||||||
|
|
||||||||||||
|
Net corporate/other expenses (1)
|
47,910
|
|||||||||||
|
Loss before income taxes
|
$
|
(24,729
|
)
|
|||||||||
| (1) | Net corporate/other expenses include public company costs, corporate administration expenses, amortization expense which is not attributable to business segments, acquisition-related expenses and net interest expense. |
|
|
Healthcare
|
DNA
|
Corporate/ Other
|
Consolidated
|
||||||||||||
|
Depreciation and amortization
|
||||||||||||||||
|
|
||||||||||||||||
|
Year ended December 31, 2014
|
$
|
12,910
|
$
|
4,688
|
$
|
8
|
$
|
17,606
|
||||||||
|
|
||||||||||||||||
|
Assets as of December 31, 2014
|
$
|
335,883
|
$
|
36,090
|
$
|
2,364
|
$
|
374,337
|
||||||||
|
|
||||||||||||||||
|
|
Healthcare
|
DNA
|
Corporate/ Other
|
Consolidated
|
||||||||||||
|
Depreciation and amortization
|
||||||||||||||||
|
|
||||||||||||||||
|
Year ended December 31, 2013
|
$
|
13,522
|
$
|
3,949
|
$
|
49
|
$
|
17,520
|
||||||||
|
Restructuring and Other One Time Charges
|
||||||||||||||||
|
|
||||||||||||||||
|
Year ended December 31, 2013
|
$
|
2,886
|
$
|
405
|
$
|
565
|
$
|
3,856
|
||||||||
|
|
||||||||||||||||
|
Assets as of December 31, 2013
|
$
|
333,459
|
$
|
42,894
|
$
|
5,728
|
$
|
382,081
|
||||||||
|
|
||||||||||||||||
|
|
Healthcare
|
DNA
|
Corporate/ Other
|
Consolidated
|
||||||||||||
|
Depreciation and amortization
|
||||||||||||||||
|
|
||||||||||||||||
|
Year ended December 31, 2012
|
$
|
16,049
|
$
|
4,187
|
$
|
59
|
$
|
20,295
|
||||||||
|
Restructuring and Other One Time Charges
|
||||||||||||||||
|
|
||||||||||||||||
|
Year ended December 31, 2012
|
$
|
333
|
$
|
497
|
$
|
-
|
$
|
830
|
||||||||
|
|
||||||||||||||||
|
Assets as of December 31, 2012
|
$
|
412,841
|
$
|
33,207
|
$
|
(9,195
|
)
|
$
|
436,853
|
|||||||
Foreign sales account for approximately 7%, 7%, and 6% of our net sales in 2014, 2013, and 2012, respectively, and sales in foreign currency represented approximately 2%, 2%, and 3%, respectively, of our net sales in 2014, 2013 and 2012.
The following tables present certain geographic information, based on location of customer:
|
Net Sales for the Years Ended December 31,
|
||||||||||||
|
2014
|
2013
|
2012
|
||||||||||
|
United States of America
|
$
|
198,387 |
$
|
216,560
|
$
|
232,848
|
||||||
|
Europe
|
7,644 |
7,566
|
8,687
|
|||||||||
|
Japan
|
2,250
|
2,061
|
2,190
|
|||||||||
|
Korea
|
577
|
1,105
|
1,018
|
|||||||||
|
Canada
|
1,628
|
1,718
|
1,707
|
|||||||||
|
Other
|
1,818
|
2,657
|
2,454
|
|||||||||
|
Total Net Sales
|
$
|
212,304
|
$
|
231,667
|
$
|
248,904
|
||||||
|
Long Lived Assets
|
||||||||||||
|
2014
|
2013
|
2012
|
||||||||||
|
United States of America
|
$
|
3,599
|
$
|
4,184
|
$
|
4,316
|
||||||
|
Canada
|
424
|
487
|
569
|
|||||||||
|
Europe
|
56
|
68
|
79
|
|||||||||
|
Other
|
-
|
-
|
-
|
|||||||||
|
Total
|
$
|
4,079
|
$
|
4,739
|
$
|
4,964
|
||||||
|
(15)
|
Quarterly Results (unaudited)
|
|
|
2014 Quarterly Results
|
|||||||||||||||
|
|
March 31
|
June 30
|
September 30
|
December 31
|
||||||||||||
|
Net sales
|
$
|
50,903
|
$
|
53,814
|
$
|
53,982
|
$
|
53,605
|
||||||||
|
Gross margin
|
29,897
|
30,204
|
30,710
|
30,749
|
||||||||||||
|
Income (loss) before income taxes
|
306
|
(3,276
|
)
|
2,624
|
2,235
|
|||||||||||
|
Net income (loss)
|
325
|
(3,951
|
)
|
1,738
|
1,480
|
|||||||||||
|
Net income (loss) available to common shareholders
|
323
|
(3,973
|
)
|
1,728
|
1,475
|
|||||||||||
|
Basic income (loss) per share
|
$
|
-
|
$
|
(0.04
|
)
|
$
|
0.02
|
$
|
0.02
|
|||||||
|
Diluted income (loss) per share
|
$
|
-
|
$
|
(0.04
|
)
|
$
|
0.02
|
$
|
0.02
|
|||||||
|
2013 Quarterly Results
|
||||||||||||||||
|
March 31
|
June 30
|
September 30
|
December 31
|
|||||||||||||
|
Net sales
|
$
|
63,634
|
$
|
57,193
|
$
|
57,245
|
$
|
53,595
|
||||||||
|
Gross margin
|
35,443
|
31,981
|
30,616
|
30,731
|
||||||||||||
|
Loss before income taxes
|
(3,478
|
)
|
(27,408
|
)
|
(4,579
|
)
|
(629
|
)
|
||||||||
|
Net loss
|
(6,493
|
)
|
(28,120
|
)
|
(4,101
|
)
|
(269
|
)
|
||||||||
|
Net loss available to common shareholders
|
(6,475
|
)
|
(28,107
|
)
|
(4,105
|
)
|
(293
|
)
|
||||||||
|
Basic and diluted loss per share
|
$
|
(0.07
|
)
|
$
|
(0.30
|
)
|
$
|
(0.04
|
)
|
$
|
(0.00
|
)
|
||||
During the second quarter of 2014, we recorded a charge of $4,821 for loss on debt extinguishment in our consolidated statement of operations. Upon completing the exit of an immaterial product line in the third quarter of 2014, we recorded a $727 charge in operating expenses for the reduction in the useful life of an intangible asset.
We recognized a non-cash gain of $2,500 within general and administrative expense in our statement of operations with respect to the settlement of a lawsuit during the first quarter of 2013.
During the second quarter of 2013, we recorded a charge of $23,822 for the early extinguishment of the Notes in our consolidated statement of operations. This charge consisted of $5,235 for unamortized debt issuance costs, $1,724 for unamortized net debt discount and $16,863 for early retirement costs.
|
(16)
|
Subsequent Events
|
On February 25, 2015, we completed the acquisition of approximately 91% of the common stock of DR Systems, Inc. (“DRS”), a leader in healthcare imaging and information technology, pursuant to a Securities Purchase Agreement dated February 25, 2015, for a purchase price of $68,298, net of cash acquired. We intend to complete the acquisition of the remaining shares of DRS common stock by the end of the second quarter. The disclosures required by ASC 805 relative to this acquisition have not been included since all of the necessary information is not currently available.
To finance the transaction, we used $50,000 of cash received from the private placement of 50,000 newly-issued shares of our Series A Convertible Preferred Stock, par value $0.01 per share (the “Preferred Stock”) to certain investment funds associated with Guggenheim Partners, LLC and cash on hand. Each share of Preferred Stock is initially convertible into 241.55 shares of our common stock, par value $0.01 per share. The Preferred Stock will accrue dividends at a rate of 8.5% per annum, payable in cash on a quarterly basis for each outstanding share of Preferred Stock, subject to us having profits, surplus or other funds legally available, however dividends shall accrue whether or not they have been declared and shall be cumulative. In addition to customary liquidation, redemption and conversion provisions, the Preferred Stock provides that at any time prior to August 25, 2015, any holder of Preferred Stock may request redemption of all or any portion of the Preferred Stock held by such holder.
In connection with private placement of the Preferred Stock and the acquisition of DRS, we received a waiver and amended our existing credit agreement. Under the terms of the amendment, the lenders agreed to waive the requirements to make certain mandatory prepayments of the term loans provided with the net cash proceeds of the Preferred Stock issuance or the excess cash flow principal payment for the period beginning July 1, 2014 and ended on December 31, 2014.
Not applicable.
(a) Disclosure Controls and Procedures
Our control system is designed to provide reasonable assurance that the objectives of the control system are met. Because of the inherent limitations in all control systems, no evaluation of controls can provide absolute assurance that all control issues and instances of fraud, if any, within a company have been detected.
Our management has evaluated, under the supervision and with the participation of our Chief Executive Officer and Chief Financial Officer, the effectiveness of the design and operation of our disclosure controls and procedures as of December 31, 2014. Based on their evaluation as of December 31, 2014, our Chief Executive Officer and Chief Financial Officer have concluded that our disclosure controls and procedures (as defined in Rules 13a−15(e) and 15d−15(e) under the Exchange Act) were effective.
(b) Management’s Report on Internal Control Over Financial Reporting
Our management is responsible for establishing and maintaining adequate internal control over financial reporting. Our internal control over financial reporting is a process designed to provide reasonable assurance regarding the reliability of financial reporting and the preparation of our financial statements for external reporting purposes in accordance with GAAP.
Management assessed the effectiveness of our internal control over financial reporting as of December 31, 2014, using the criteria set forth by the Committee of Sponsoring Organizations of the Treadway Commission in Internal Control - Integrated Framework (2013). Based on its assessment, management concluded that our internal control over financial reporting was effective as of December 31, 2014. The effectiveness of our internal control over financial reporting as of December 31, 2014, has been audited by BDO USA, LLP, an independent registered public accounting firm, as stated in its report which is included below.
(c) Report of Independent Registered Public Accounting Firm
Board of Directors and Shareholders
Merge Healthcare Incorporated
Chicago, Illinois
We have audited Merge Healthcare Incorporated’s internal control over financial reporting as of December 31, 2014, based on criteria established in Internal Control – Integrated Framework (2013) issued by the Committee of Sponsoring Organizations of the Treadway Commission (the COSO criteria). Merge Healthcare Incorporated’s management is responsible for maintaining effective internal control over financial reporting and for its assessment of the effectiveness of internal control over financial reporting, included in the accompanying “Item 9A, Management’s Report on Internal Control Over Financial Reporting”. Our responsibility is to express an opinion on the Company’s internal control over financial reporting based on our audit.
We conducted our audit in accordance with the standards of the Public Company Accounting Oversight Board (United States). Those standards require that we plan and perform the audit to obtain reasonable assurance about whether effective internal control over financial reporting was maintained in all material respects. Our audit included obtaining an understanding of internal control over financial reporting, assessing the risk that a material weakness exists, and testing and evaluating the design and operating effectiveness of internal control based on the assessed risk. Our audit also included performing such other procedures as we considered necessary in the circumstances. We believe that our audit provides a reasonable basis for our opinion.
A company’s internal control over financial reporting is a process designed to provide reasonable assurance regarding the reliability of financial reporting and the preparation of financial statements for external purposes in accordance with generally accepted accounting principles. A company’s internal control over financial reporting includes those policies and procedures that (1) pertain to the maintenance of records that, in reasonable detail, accurately and fairly reflect the transactions and dispositions of the assets of the company; (2) provide reasonable assurance that transactions are recorded as necessary to permit preparation of financial statements in accordance with generally accepted accounting principles, and that receipts and expenditures of the company are being made only in accordance with authorizations of management and directors of the company; and (3) provide reasonable assurance regarding prevention or timely detection of unauthorized acquisition, use, or disposition of the company’s assets that could have a material effect on the financial statements.
Because of its inherent limitations, internal control over financial reporting may not prevent or detect misstatements. Also, projections of any evaluation of effectiveness to future periods are subject to the risk that controls may become inadequate because of changes in conditions, or that the degree of compliance with the policies or procedures may deteriorate.
In our opinion, Merge Healthcare Incorporated maintained, in all material respects, effective internal control over financial reporting as of December 31, 2014, based on the COSO criteria.
We also have audited, in accordance with the standards of the Public Company Accounting Oversight Board (United States), the consolidated balance sheets of Merge Healthcare Incorporated as of December 31, 2014 and 2013, and the related consolidated statements of operations, comprehensive loss, shareholders’ equity, and cash flows for each of the three years in the period ended December 31, 2014 and our report dated February 27, 2015, expressed an unqualified opinion thereon.
/s/ BDO USA, LLP
Milwaukee, Wisconsin
February 27, 2015
(d) Changes in Internal Control Over Financial Reporting
There were no changes with respect to our internal control over financial reporting that materially affected, or are reasonably likely to materially affect, our internal control over financial reporting during the quarter ended December 31, 2014.
None.
PART III
As permitted by SEC rules, we have omitted certain information required by Part III from this Report on Form 10-K, because we intend to file (pursuant to Section 240.14a-101) our definitive proxy statement for our 2015 annual shareholder meeting (Proxy Statement) not later than April 30, 2015, and are, therefore, incorporating by reference in this Annual Report on Form 10-K such information from the Proxy Statement.
The information required by this Item 10 will be included under the captions “Election of Directors — Director Biographies and Qualifications” and “Corporate Governance — Executive Officers” in our Proxy Statement for our 2015 annual meeting of shareholders. Information concerning the compliance of our officers, directors and 10% shareholders with Section 16(a) of the Securities Exchange Act of 1934 is incorporated by reference to the information to be contained in the Proxy Statement under the caption “Section 16(a) Beneficial Ownership Reporting Compliance.” The information regarding Audit Committee members and “Audit Committee Financial Experts” is incorporated by reference to the information to be contained in the Proxy Statement under the caption “Corporate Governance — Committee Membership.” The information regarding any changes to the procedures by which security holders may recommend nominees to the registrant's board of directors is incorporated by reference to the information to be contained in the Proxy Statement under the caption “Election of Directors — Director Nominations.” The information regarding our Code of Business Ethics is incorporated by reference to the information to be contained in the Proxy Statement under the heading “Corporate Governance — Merge Healthcare’s Code of Ethics.”
Merge Healthcare's Code of Ethics
All of our employees, including the Chief Executive Officer, Chief Financial Officer, our Controller, and persons performing similar functions, and all Directors, are required to abide by Merge Healthcare’s Code of Ethics to ensure that our business is conducted in a consistently legal and ethical manner. This Code of Ethics along with our Whistleblower Policy form the foundation of a comprehensive process that includes compliance with all corporate policies and procedures, an open relationship among colleagues that contributes to good business conduct, and the high integrity level of our employees and Directors. Our policies and procedures cover all areas of professional conduct, including employment policies, conflicts of interest, intellectual property and the protection of confidential information, as well as strict adherence to all laws and regulations applicable to the conduct of our business. Employees are required to report any conduct that they believe in good faith to be an actual or apparent violation of Merge Healthcare’s Code of Ethics. The Sarbanes–Oxley Act of 2002 requires audit committees to have procedures to receive, retain and address complaints received regarding accounting, internal accounting controls or auditing matters and to allow for the confidential and anonymous submission by employees of concerns regarding questionable accounting or auditing matters. We have such procedures in place as set forth in the Merge Healthcare Incorporated Whistleblower Policy and the Code of Ethics. The Code of Ethics is included on the website, www.merge.com/Company/Investors/Corporate-Governance.
The information required by this item is incorporated herein by reference to the information set forth under the captions “Compensation of Executive Officers and Directors”, “Corporate Governance — Committee Membership — Compensation Committee Interlocks and Insider Participation” and “Compensation Discussion and Analysis — Compensation Committee Report” in the Proxy Statement.
|
Item 12.
|
The information required by this item is incorporated herein by reference to the information set forth under the captions “Security Ownership of Certain Beneficial Owners and Management” and “Equity Compensation Plan Summary” in the Proxy Statement. For additional information regarding our share-based compensation plans, please see Note 8 of the notes to consolidated financial statements included in this Annual Report on Form 10-K.
The information required by this item is incorporated herein by reference to the information set forth under the captions “Corporate Governance — Transactions with Related Persons” and “Corporate Governance — Director Independence” in the Proxy Statement.
The information required by this item is incorporated herein by reference to the information set forth under the caption “Audit and Non-Audit Fees” in the Proxy Statement.
PART IV
(a) The following documents are filed as part of this annual report:
Financial Statements filed as part of this report pursuant to Part II, Item 8 of this Annual Report on Form 10-K:
| · | Consolidated Balance Sheets of Merge Healthcare Incorporated and Subsidiaries at December 31, 2014 and 2013; |
| · | Consolidated Statements of Operations of Merge Healthcare Incorporated and Subsidiaries for each of the three years ended December 31, 2014, 2013 and 2012; |
| · | Consolidated Statements of Comprehensive Loss of Merge Healthcare Incorporated and Subsidiaries for each of the three years ended December 31, 2014, 2013 and 2012; |
| · | Consolidated Statements of Shareholders’ Equity of Merge Healthcare Incorporated and Subsidiaries for each of the three years ended December 31, 2014, 2013 and 2012; |
| · | Consolidated Statements of Cash Flows of Merge Healthcare Incorporated and Subsidiaries for each of the three years ended December 31, 2014, 2013 and 2012; |
| · | Notes to Consolidated Financial Statements of Merge Healthcare Incorporated and Subsidiaries; |
(b) See Exhibit Index that follows.
Exhibit Index
|
Exhibit
|
|
Description
|
|
Incorporated Herein by Reference to
|
|
Filed Herewith
|
|
|
|
|
|
|
|
|
|
3.1
|
Certificate of Incorporation of the Registrant as filed on October 14, 2008
|
Exhibit 3.1 to the Annual Report on Form 10-K of Merge Healthcare Incorporated for the fiscal year ended December 31, 2008 (File No. 001-33006), as filed on March 11, 2009
|
||||
|
|
|
|
|
|
|
|
|
3.2
|
Amendment to the Certificate of Incorporation of the Registrant as filed on September 27, 2010
|
Exhibit 3.1 to the Current Report on Form 8-K of Merge Healthcare Incorporated dated September 30, 2010 (File No. 001-33006), as filed on September 30, 2010
|
||||
|
|
|
|
|
|
|
|
|
3.3
|
Bylaws of Registrant
|
Exhibit 3.3 to the Annual Report on Form 10-K of Merge Healthcare Incorporated for the fiscal year ended December 31, 2008 (File No. 001-33006), as filed on March 11, 2009
|
||||
|
|
|
|
|
|
|
|
|
10.1
|
Registration Rights Agreement, dated June 4, 2008, by and between the Registrant and Merrick RIS, LLC
|
Exhibit 10.1 to the Current Report on Form 8-K of Merge Healthcare Incorporated dated June 6, 2008 (File No. 001-33006), as filed on June 6, 2008
|
||||
|
|
|
|
|
|
|
|
|
10.2
|
Securities Purchase Agreement, dated May 21, 2008, by and among the Registrant, the subsidiaries listed on the Schedule of Subsidiaries attached thereto, and Merrick RIS, LLC
|
Exhibit 10.1 to the Current Report on Form 8-K of Merge Healthcare Incorporated dated May 22, 2008 (File No. 001-33006), as filed on May 22, 2008
|
||||
|
|
|
|
|
|
|
|
|
10.3
|
Employment Letter Agreement between the Registrant and Justin C. Dearborn entered into as of June 4, 2008*
|
Exhibit 10.19 to the Current Report on Form 8-K of Merge Healthcare Incorporated dated July 15, 2008 (File No. 001-33006), as filed on July 15, 2008
|
||||
|
|
|
|
|
|
|
|
|
10.4
|
Employment Letter Agreement between the Registrant and Steven M. Oreskovich entered into as of June 4, 2008 *
|
Exhibit 10.20 to the Current Report on Form 8-K of Merge Healthcare Incorporated dated July 15, 2008 (File No. 001-33006), as filed on July 15, 2008
|
|
10.5
|
Employment Letter Agreement between the Registrant and Nancy J. Koenig entered into as of June 4, 2008*
|
Exhibit 10.21 to the Current Report on Form 8-K of Merge Healthcare Incorporated dated July 15, 2008 (File No. 001-33006), as filed on July 15, 2008
|
||||
|
|
|
|
|
|
|
|
|
10.6
|
Employment Letter Agreement between the Registrant and Antonia A. Wells entered into as of June 4, 2008*
|
Exhibit 10.22 to the Current Report on Form 8-K of Merge Healthcare Incorporated dated July 15, 2008 (File No. 001-33006), as filed on July 15, 2008
|
||||
|
10.7
|
Employment Letter Agreement between the Registrant and Steven Tolle entered into as of November 1, 2012*
|
Exhibit 10.1 to the Quarterly Report on Form 10-Q of Merge Healthcare Incorporated for the three months ended March 31, 2014 (File No. 001-33006), as filed on April 30, 2014
|
||||
|
10.8
|
First Amendment, dated July 1, 2008, to that certain Securities Purchase Agreement, dated as of May 21, 2008, by and among the Registrant, certain of its subsidiaries and Merrick RIS, LLC
|
Exhibit 10.1 to the Current Report on Form 8-K of Merge Healthcare Incorporated dated July 7, 2008 (File No. 001-33006), as filed on July 7, 2008
|
||||
|
|
|
|
|
|
|
|
|
10.9
|
1998 Stock Option Plan for Directors*
|
Exhibit 10.8 to the Annual Report on Form 10-KSB of Merge Healthcare Incorporated for the fiscal year ended December 31, 1997 (File No. 001-33006), as filed on May 5, 1998
|
||||
|
|
|
|
|
|
|
|
|
10.10
|
2000 Employee Stock Purchase Plan of the Registrant effective July 1, 2000 (as amended through the first amendment thereto) *
|
Annex A to the Proxy Statement for Annual Meeting of Shareholders of Merge Healthcare Incorporated dated April 29, 2014 (File No. 001-33006), as filed on April 28, 2014
|
||||
|
|
|
|
|
|
|
|
|
10.11
|
2005 Equity Incentive Plan (as amended through the fourth amendment thereto)*
|
Annex A to the Proxy Statement for Annual Meeting of Shareholders of Merge Healthcare Incorporated dated April 30, 2013 (File No. 001-33006), as filed on April 30, 2013
|
||||
|
|
|
|
|
|
|
|
|
10.12
|
Form of stock option agreement*
|
Exhibit 10.15 to the Annual Report on Form 10-K of Merge Healthcare Incorporated for the fiscal year ended December 31, 2005 (File No. 001-33006), as filed on August 30, 2006
|
|
Form of Restricted Stock award*
|
X
|
|||||
|
|
|
|
|
|
|
|
|
10.14
|
Letter Agreement, dated May 17, 2013, between Merge Healthcare Incorporated and Ann Mayberry-French*
|
Exhibit 10.1 to the Current Report on Form 8-K of Merge Healthcare Incorporated dated May 20, 2013 (File No. 001-33006), as filed on May 20, 2013
|
||||
|
|
|
|
|
|
|
|
|
10.15
|
General Release, dated May 17, 2013, between Merge Healthcare Incorporated and Ann Mayberry-French*
|
Exhibit 10.1 to the Current Report on Form 8-K of Merge Healthcare Incorporated dated May 20, 2013 (File No. 001-33006), as filed on May 20, 2013
|
||||
|
|
|
|
|
|
|
|
|
10.16
|
Letter Agreement, dated August 8, 2013, between Merge Healthcare Incorporated and Jeffery A. Surges*
|
Exhibit 10.1 to the Current Report on Form 8-K of Merge Healthcare Incorporated dated August 9, 2013 (File No. 001-33006), as filed on August 9, 2013
|
||||
|
|
|
|
|
|
|
|
|
10.17
|
General Release, dated August 8, 2013, between Merge Healthcare Incorporated and Jeffery A. Surges*
|
Exhibit 10.2 to the Current Report on Form 8-K of Merge Healthcare Incorporated dated August 9, 2013 (File No. 001-33006), as filed on August 9, 2013
|
||||
|
|
|
|
|
|
|
|
|
10.18
|
Credit Agreement, dated as of April 29, 2014, among Merge Healthcare Incorporated, as Borrower, the Subsidiary Guarantors party thereto, the Lenders party thereto from time to time and Guggenheim Corporate Funding, LLC, as Lead Arranger, Book Runner, Administrative Agent and Collateral Agent.
|
Exhibit 10.1 to the Current Report on Form 8-K of Merge Healthcare Incorporated dated May 5, 2014 (File No. 001-33006), as filed on May 5, 2014
|
||||
|
10.19
|
Security Agreement, dated as of April 29, 2014, among Merge Healthcare Incorporated, the subsidiaries of Merge Healthcare Incorporated party thereto and Guggenheim Corporate Funding, LLC, as Collateral Agent.
|
Exhibit 10.2 to the Current Report on Form 8-K of Merge Healthcare Incorporated dated May 5, 2014 (File No. 001-33006), as filed on May 5, 2014
|
| 10.20 |
Form of Director Indemnification Agreement
|
X
|
||||
|
14.1
|
Code of Ethics
|
Exhibit 14.1 to the Annual Report on Form 10-K of Merge Healthcare Incorporated for the fiscal year ended December 31, 2008 (File No. 001-33006), as filed on March 11, 2009
|
||||
|
|
|
|
|
|
|
|
|
14.2
|
Whistleblower Policy
|
Exhibit 14.2 of the Annual Report on Form 10-K of Merge Healthcare Incorporated for the fiscal year ended December 31, 2008 (File No. 001-33006), as filed on March 11, 2009
|
||||
|
|
|
|
|
|
|
|
|
List of Subsidiaries of the Registrant
|
X
|
|||||
|
|
|
|
|
|
|
|
|
Consent of Independent Registered Public Accounting Firm – BDO USA, LLP
|
X
|
|||||
|
|
|
|
|
|
|
|
|
Power of Attorney
|
X
|
|||||
|
Certificate of Chief Executive Officer (principal executive officer) Pursuant to Rule 13a-14(a) under the Securities Exchange Act of 1934
|
X
|
|||||
|
|
|
|
|
|
|
|
|
Certificate of Chief Financial Officer (principal financial officer) Pursuant to Rule 13a-14(a) under the Securities Exchange Act of 1934
|
X
|
|||||
|
|
|
|
|
|
|
|
|
Certificate of Chief Executive Officer (principal executive officer) and Chief Financial Officer (principal financial officer) Pursuant to Section 18 U.S.C. Section 1350, as Adopted Pursuant to Section 906 of the Sarbanes-Oxley Act of 2002
|
X
|
|||||
|
|
|
|
|
|
|
|
|
101
|
The following materials from the Registrant’s Annual Report on Form 10-K for the year ended December 31, 2014 formatted in Extensible Business Language (XBRL): (i) the Consolidated Balance Sheets, (ii) the Consolidated Statements of Operations, (iii) the Consolidated Statements of Shareholders’ Equity, (iv) the consolidated Statements of Cash Flows, and (v) the Consolidated Statements of Comprehensive Loss
|
X
|
|
*
|
Management contract or compensatory plan or arrangement required to be filed as an exhibit to this Annual Report on Form 10-K.
|
SIGNATURES
Pursuant to the requirements of Section 13 or 15(d) of the Securities Exchange of 1934, the Registrant has duly caused this report to be signed on its behalf by the undersigned, thereunto duly authorized.
|
Merge Healthcare Incorporated
|
||
|
Date: February 27, 2015
|
By:
|
/s/ Justin C. Dearborn
|
|
Justin C. Dearborn
|
||
|
Chief Executive Officer
|
||
Pursuant to the requirements of the Securities Exchange Act of 1934, this report has been signed below on behalf of the Registrant by the following persons in the capacities and on the dates indicated.
|
Date: February 27, 2015
|
Michael W. Ferro, Jr.*
|
|
Michael W. Ferro, Jr.
Chairman of the Board
|
|
|
Date: February 27, 2015
|
Dennis Brown*
|
|
Dennis Brown
Director
|
|
|
Date: February 27, 2015
|
William J. Devers Jr.*
|
|
William J. Devers Jr.
Director
|
|
|
Date: February 27, 2015
|
Matthew M. Maloney*
|
|
Matthew M. Maloney
Director
|
|
|
Date: February 27, 2015
|
Nancy J. Koenig*
|
|
Nancy J. Koenig
Chief Operating Officer and Director
|
|
Date: February 27, 2015
|
Richard A. Reck*
|
|
Richard A. Reck
Director
|
|
|
Date: February 27, 2015
|
Neele E. Stearns, Jr.*
|
|
Neele E. Stearns, Jr.
Director
|
|
Date: February 27, 2015
|
By:
|
/s/ Justin C. Dearborn
|
|
Justin C. Dearborn
|
||
|
Chief Executive Officer and Director
|
||
|
(principal executive officer)
|
||
|
Date: February 27, 2015
|
/s/ Steven M. Oreskovich
|
|
| Steven M. Oreskovich | ||
|
Chief Financial Officer
|
||
|
(principal financial officer and
principal accounting officer)
|
||
|
Date: February 27, 2015
|
*Justin C. Dearborn, by signing his name hereto, does hereby sign this Form 10−K on behalf of each of the above named and designated directors of the Company pursuant to a Power of Attorney executed by such persons and filed with the Securities and Exchange Commission.
|
|
|
/s/ Justin C. Dearborn
|
||
|
Justin C. Dearborn, Attorney-in-Fact
|
79