Attached files
Table of Contents
UNITED STATES
SECURITIES AND EXCHANGE COMMISSION
Washington, D.C. 20549
FORM 10-K
| x | ANNUAL REPORT PURSUANT TO SECTION 13 OR 15(d) OF THE SECURITIES EXCHANGE ACT OF 1934 |
For the fiscal year ended December 31, 2009
or
| ¨ | TRANSITION REPORT PURSUANT TO SECTION 13 OR 15(d) OF THE SECURITIES EXCHANGE ACT OF 1934 |
For the transition period from to
Commission file number 000-52155
GeoMet, Inc.
(Exact name of registrant as specified in its charter)
| Delaware | 76-0662382 | |
| (State or other jurisdiction of incorporation or organization) |
(I.R.S. Employer Identification No.) | |
| 909 Fannin, Suite 1850, Houston, Texas 77010 | 77010 | |
| (Address of principal executive offices) | (Zip Code) | |
Registrant’s telephone number, including area code
(713) 659-3855
Securities registered pursuant to Section 12(b) of the Act:
| Title of Each Class |
Name of Each Exchange on Which Registered | |
| Common stock, par value $0.001 per share | NASDAQ Global Market |
Securities registered pursuant to Section 12(g) of the Act:
None
Indicate by check mark if the registrant is a well-known seasoned issuer, as defined in Rule 405 of the Securities Act. Yes ¨ No x
Indicate by check mark if the registrant is not required to file reports pursuant to Section 13 or Section 15(d) of the Act. Yes ¨ No x
Indicate by check mark whether the registrant (1) has filed all reports required to be filed by Section 13 or 15(d) of the Securities Exchange Act of 1934 during the preceding 12 months (or for such shorter period that the registrant was required to file such reports), and (2) has been subject to such filing requirements for the past 90 days. Yes x No ¨
Indicate by check mark whether the registrant has submitted electronically and posted on its corporate Web site, if any, every Interactive Data File required to be submitted and posted pursuant to Rule 405 of Regulation S-T (§ 232.405) during the preceding 12 months (or for such shorter period that the registrant was required to submit and post such files). Yes ¨ No ¨
Indicate by check mark if disclosure of delinquent filers pursuant to Item 405 of Regulation S-K (§ 229.405 of this chapter) is not contained herein, and will not be contained, to the best of registrant’s knowledge, in definitive proxy or information statements incorporated by reference in Part III of this Form 10-K or any amendment to this Form 10-K. x
Indicate by check mark whether the registrant is a large accelerated filer, an accelerated filer, a non-accelerated filer, or a smaller reporting company. See the definitions of “large accelerated filer,” “accelerated filer” and “smaller reporting company” in Rule 12b-2 of the Exchange Act. (Check one):
Large accelerated filer ¨ Accelerated filer ¨ Non-accelerated filer x Smaller reporting company ¨
(Do not check if a smaller reporting company)
Indicate by check mark whether the registrant is a shell company (as defined in Rule 12b-2 of the Exchange Act). Yes ¨ No x
The aggregate market value of common stock, par value $0.001 per share, held by non-affiliates (based upon the closing sales price on the NASDAQ Global Market on June 30, 2009), the last business day of registrant’s most recently completed second fiscal quarter was approximately $43.4 million.
As of March 1, 2010, 39,396,564 shares of the registrant’s common stock, par value $0.001 per share, were outstanding.
DOCUMENTS INCORPORATED BY REFERENCE
Information required by Part III, Items 10, 11, 12, 13 and 14, is incorporated by reference to portions of the registrant’s definitive proxy statement for its 2010 annual meeting of stockholders, which will be filed on or before April 30, 2010.
Table of Contents
GeoMet, Inc.
Form 10-K
| PART I |
||||
| Items 1 and 2. |
8 | |||
| Item 1A. |
26 | |||
| Item 1B. |
37 | |||
| Item 3. |
37 | |||
| Item 4. |
38 | |||
| PART II |
||||
| Item 5. |
39 | |||
| Item 6. |
42 | |||
| Item 7. |
Management’s Discussion and Analysis of Financial Condition and Results of Operations |
44 | ||
| Item 7A. |
64 | |||
| Item 8. |
66 | |||
| Item 9. |
Changes in and Disagreements with Accountants on Accounting and Financial Disclosure |
102 | ||
| Item 9A. |
102 | |||
| Item 9B. |
103 | |||
| PART III |
||||
| Item 10. |
106 | |||
| Item 11. |
106 | |||
| Item 12. |
Security Ownership of Certain Beneficial Owners and Management and Related Stockholder Matters |
106 | ||
| Item 13. |
Certain Relationships and Related Transactions, and Director Independence |
106 | ||
| Item 14. |
106 | |||
| PART IV |
||||
| Item 15. |
107 | |||
2
Table of Contents
CAUTIONARY STATEMENT CONCERNING FORWARD-LOOKING STATEMENTS
Included in this annual report are certain forward-looking statements, within the meaning of Section 27A of the Securities Act of 1933, as amended (the “Securities Act”), and Section 21E of the Exchange Act. All statements, other than statements of historical facts, included in this annual report that address activities, events or developments that we expect or anticipate will or may occur in the future are forward-looking statements, including statements regarding our planned capital expenditures, increases in gas production, the number of anticipated wells to be drilled, future cash flows and borrowings, our financial position, business strategy and other plans and objectives for future operations. We use the words “may,” “will,” “expect,” “anticipate,” “estimate,” “believe,” “continue,” “intend,” “plan,” “budget” and other similar words to identify forward-looking statements. You should read statements that contain these words carefully and should not place undue reliance on these statements. Although we believe that the expectations reflected in these forward-looking statements are reasonable, they do involve certain assumptions, risks and uncertainties. Our results could differ materially from those anticipated in these forward-looking statements as a result of certain factors, including, among others:
| • | our business strategy; |
| • | our financial position, including our cash flow and liquidity; |
| • | the effects of our indebtedness, which could adversely restrict our ability to operate, could make us vulnerable to general adverse economic and industry conditions, could place us at a competitive disadvantage compared to our competitors that have less debt, and could have other adverse consequences; |
| • | our ability to obtain additional financing on satisfactory terms to fund our operations; |
| • | volatility in the international and domestic capital and credit markets, including fluctuations in interest rates and availability of capital; |
| • | general economic conditions may be less favorable than expected, including the possibility that the economic recession in the United States will be prolonged or that any economic recovery will be weak, which could adversely affect the demand for gas and make it difficult, if not impossible, to access financial markets; |
| • | declines in the prices we receive for our gas affecting our operating results, cash flows and credit capacity; |
| • | uncertainties in estimating our proved gas reserves; |
| • | our ability to replace our proved gas reserves; |
| • | uncertainties in exploring for and producing gas; |
| • | the coalbeds and other strata from which we produce methane gas may contain impurities that may increase the cost of production; |
| • | actions of third party co-owners of interests in properties in which we also own an interest; |
| • | new gas development projects and exploration for gas in areas where we have little or no proven gas reserves; |
| • | our ability to acquire water supplies needed for drilling, or our ability to dispose of water used or removed from strata at a reasonable cost and within applicable environmental rules; |
| • | other persons could have ownership rights in our advanced gas extraction techniques which could force us to cease using those techniques or pay royalties; |
| • | availability of drilling and production equipment and field service providers; |
| • | disruptions, capacity constraints in, or other limitations on the pipeline systems that deliver our gas; |
3
Table of Contents
| • | our need to use unproven technologies to extract coalbed methane in some properties; |
| • | our ability to retain key members of our senior management and key technical employees; |
| • | the outcomes of material legal proceedings; |
| • | the possibility that the industry may be subject to future regulatory or legislative actions (including changes to existing tax rules and regulations and changes in environmental regulation); |
| • | the effects of government regulation and permitting and other legal requirements; and |
| • | other economic, competitive, governmental, legislative, regulatory, geopolitical and technological factors may negatively impact our businesses, operations or pricing. |
All forward-looking statements attributable to us or persons acting on our behalf are expressly qualified in their entirety by the cautionary statements in this paragraph and elsewhere in this prospectus. All forward-looking statements speak only as of the date of this annual report. Other than as required under securities laws, we do not assume a duty to update these forward-looking statements, whether as a result of new information, subsequent events or circumstances, changes in expectations or otherwise.
All references in this annual report to the “Company,” “GeoMet,” “we,” “us” or “our” are to GeoMet, Inc. and our wholly owned subsidiaries. Unless otherwise noted, all information in this annual report relating to natural gas reserves and the estimated future net cash flows attributable to those reserves is based on estimates prepared by independent engineers and is net to our interest.
4
Table of Contents
GLOSSARY OF NATURAL GAS AND COALBED METHANE TERMS
The following is a description of the meanings of some of the oil and natural gas industry terms used in this document.
Additional drilling locations. Identified potential drilling locations on our existing acreage that are not included in our proved undeveloped reserves.
Appalachian Basin. A mountainous region in the eastern United States of America (“U.S.”), running from northern Alabama to Pennsylvania, and including parts of Georgia, South Carolina, North Carolina, Tennessee, Kentucky, Virginia, and all of West Virginia.
Bcf. Billion cubic feet of natural gas.
Btu or British Thermal Unit. The quantity of heat required to raise the temperature of one pound of water by one degree Fahrenheit.
CBM. Coalbed methane.
CBM acres. Acreage under a lease that excludes oil, natural gas, and all other minerals other than CBM.
Coal seam. A single layer or stratum of coal.
Coal rank. Coal is a carbon rich rock derived from plant material accumulated in peat swamps. With increasing depth of burial, the plant material undergoes coalification, releasing volatile matter. The coal rank increases as the percentage of volatile mater (%VM) decreases. The generation of methane is a result of the thermal maturation or increasing rank of the coal. Coals targeted for CBM projects, from low rank to high rank, are lignite, sub-bituminous, high volatile bituminous, medium volatile bituminous and low volatile bituminous coals. The range of %VM associated with these coal ranks decrease from lignite at approximately 60%VM to low volatile bituminous coals at approximately 15%VM.
Completion. The installation of permanent equipment for the production of oil or natural gas, or in the case of a dry hole, the reporting of abandonment to the appropriate agency.
Developed acreage. The number of acres that are allocated or assignable to productive wells or wells capable of production.
Development well. A well drilled within the proved boundaries of an oil or natural gas reservoir with the intention of completing the stratigraphic horizon known to be productive.
Dry hole. A well found to be incapable of producing hydrocarbons in sufficient quantities such that proceeds from the sale of such production exceed production expenses and taxes.
Estimated proved reserves. The estimated quantities of crude oil, natural gas and natural gas liquids that geological and engineering data demonstrate with reasonable certainty to be recoverable in future years from known reservoirs under existing economic and operating conditions.
Estimated proved undeveloped reserves. Estimated proved reserves that are expected to be recovered from new wells on undrilled acreage or from existing wells where a relatively major expenditure is required for recompletion.
5
Table of Contents
Exploratory well. A well drilled to find and produce oil or natural gas reserves not classified as proved, to find a new reservoir in a field previously found to be productive of oil or natural gas in another reservoir or to extend a known reservoir.
Field. An area consisting of either a single reservoir or multiple reservoirs all grouped on or related to the same individual geological structural feature and/or stratigraphic condition.
Finding and development costs. A non-GAAP performance measure, expressed in dollars per Mcf, commonly used throughout the oil and gas industry to measure the efficiency of a company in adding new reserves. The finding and development cost measure is calculated for the three year time period by taking the sum of the cost incurred for exploration, development, and acquisition and dividing such amount by the total proved reserve additions. Management believes that this information is useful to an investor in evaluating GeoMet because it measures the efficiency of a company in adding proved reserves as compared to others in the industry. The cost and reserve information is derived directly from line items disclosed in the schedules of Capitalized Costs, Capitalized Costs Incurred, Natural Gas Reserves and Standardized Measure, which the Financial Accounting Standard Board (“FASB”) requires to be disclosed by Accounting Standards Codification (“ASC”) 932, formerly Statement of Financial Accounting Standards (“SFAS”) No. 69, Disclosures About Oil and Gas Producing Activities—an amendment of FASB Statements No. 19, 25, 33, and 39).
Gas desorption test. A process to estimate the volume of natural gas adsorbed in a volume of coal (usually expressed as cubic feet per ton) by placing a sample of coal into a sealed canister and taking periodic measurements of gas desorbed, temperature and pressure for up to 90 days. The estimate of total gas adsorbed in the coal sample is the sum of: (i) the measurements of natural gas during the test period, corrected to standard temperature and pressure (the “measured natural gas”), (ii) the “lost natural gas,” which is calculated using the elapsed time the sample desorbed before its placement into the canister and the rate of desorption determined from the test period, and (iii) the “remaining natural gas,” which is determined by measuring the natural gas released while grinding the coal sample into a powder or which is calculated mathematically using the measurements from the test period.
Gas in-place. The total gas measured within any particular formation before any production. A portion of this total resource base is not economically recoverable. This portion varies due to the formation’s reservoir characteristics such as pressure and permeability.
Gathering system. Pipelines and other equipment used to move natural gas from the wellhead to the trunk or the main transmission lines of a pipeline system.
Gross acres or gross wells. The total acres or wells, as the case may be, in which a working interest is owned.
Mcf. Thousand cubic feet of natural gas.
MMBtu. Million British thermal units.
MMcf. Million cubic feet of natural gas.
Net acres or net wells. The sum of the fractional working interests owned in gross acres or wells, as the case may be.
NYMEX. The New York Mercantile Exchange.
Productive well. A well that is found to be capable of producing hydrocarbons in sufficient quantities such that proceeds from the sale of such production exceed production expenses and taxes.
6
Table of Contents
PV-10 or present value of estimated future net revenues. An estimate of the present value of the estimated future net revenues from estimated proved natural gas reserves at a date indicated after deducting estimated production and ad valorem taxes, future capital costs and operating expenses, but before deducting any estimates of federal income taxes, a measure not in accordance with accounting principles generally accepted in the United States of America (“GAAP”), or a non-GAAP measure. The estimated future net revenues are discounted at an annual rate of 10% in accordance with the practice of the Securities and Exchange Commission (“SEC”), to determine their “present value.” The present value is shown to indicate the effect of time on the value of the revenue stream and should not be construed as being the fair market value of the properties. Estimates of future net revenues are made using oil and natural gas prices and operating costs at the date indicated and held constant for the life of the reserves.
Reservoir. A porous and permeable underground formation containing a natural accumulation of producible oil and/or natural gas that is confined by impermeable rock or water barriers and is individual and separate from other reservoirs.
Shale. A well hardened, very fine to fine grained sedimentary rock. Shale has ultra-low permeability and is formed from the compaction of silt, clay, or mud. Many shales contain a mixture of organic compounds called kerogen, which liberates natural gas during the maturation process of the shale. Gas within the shale can be stored onto the molecular surface of insoluble organic matter, trapped within the rock’s pore space or present within open fractures.
Shut-in. Stopping an oil or natural gas well from producing.
Undeveloped acreage. Lease acreage on which wells have not been drilled or completed to a point that would permit the production of commercial quantities of oil or natural gas regardless of whether or not such acreage contains estimated proved reserves.
Working interest. The operating interest that gives the owner the right to drill, produce and conduct operating activities on the property and receive a share of production.
7
Table of Contents
PART I
Items 1 and 2. Business and Properties
Overview
GeoMet, Inc. is an independent energy company primarily engaged in the exploration for and development and production of natural gas from coal seams (“coalbed methane” or “CBM”) and non-conventional shallow gas. We were originally founded as a consulting company to the coalbed methane industry in 1985 and have been active as an operator and developer of coalbed methane properties since 1993. Our principal operations and producing properties are located in the Cahaba Basin in Alabama and the central Appalachian Basin in West Virginia and Virginia. We also control additional coalbed methane and oil and gas development rights, principally in Alabama, British Columbia, Virginia, and West Virginia. As of December 31, 2009, we control a total of approximately 187,000 net acres of coalbed methane and oil and gas development rights.
We primarily explore for, develop, and produce CBM and non-conventional shallow gas. Our objective is to create the premier non-conventional shallow gas company in North America (emphasizing coalbed methane) while maximizing stockholder value through the efficient investment of capital to increase reserves, production, cash flow and earnings. We believe that substantial expertise and experience is required to develop, produce, and operate coalbed methane and non-conventional shallow gas fields in an efficient manner. We believe that the inherent geologic and production characteristics of coalbed methane and non-conventional shallow gas offer certain operational advantages compared to conventional gas production.
Our ability to successfully leverage our competitive strengths and execute our strategy depends upon many factors and is subject to a variety of risks. For example, our ability to drill on our properties and fund our capital budgets depends, to a large extent, upon our ability to generate cash flow from operations above current levels, maintain borrowing capacity at or near current levels under our revolving credit facility, and the availability of future debt and equity financing on satisfactory terms. Our ability to fund CBM property acquisitions and compete for and retain the qualified personnel necessary to conduct our business is also dependent upon our financial resources. Prolonged weakness in the global economy and in natural gas prices, which may affect both our cash flows and the value of our gas reserves, limitations on our ability to replace production through drilling activities, a material adverse change in our gas reserves due to factors other than gas pricing changes, our ability to transport our gas to markets, drilling costs, lower than expected production rates, material adverse outcomes from lawsuits and other factors, many of which are beyond our control, may adversely affect our ability to fund our anticipated capital expenditures, pursue property acquisitions, and compete for qualified personnel, among other things.
We believe that we are taking the necessary actions to position ourselves to continue operations in the current credit and commodity market environment with premium natural gas pricing due to the geographic location of our properties, natural gas hedges, and long-lived reserves with shallow Company-wide annual production decline rates.
We expect to fund our capital expenditure budget for 2010 from our operating cash flows. If our cash flows are not sufficient to fund all of our planned capital projects, we expect to reduce our capital budget accordingly. The amount and timing of our expenditures are subject to change based upon market conditions, results of operations and other factors. We routinely adjust our capital expenditure budget in response to changes in natural gas prices, drilling and acquisition costs, cash flow, drilling results and borrowing base redeterminations under our revolving credit facility.
Effective March 30, 2010, the parties to the revolving credit facility agreement unanimously approved the Third Amendment to the revolving credit facility (“Third Amendment”) as summarized below:
| • | The maturity date of the revolving credit facility was extended four months to May 6, 2011 pursuant to a request by the Company. |
8
Table of Contents
| • | Pursuant to a request by the Company, the borrowing base was reduced to $123.0 million and the bank group agreed that (1) the next borrowing base determination would be as of June 15, 2010, and (2) the bank group agreed not to call for a determination of the borrowing base prior to that date. |
| • | The minimum current ratio, adjusted for unrealized (gains) losses on derivative contracts and borrowing availability under the revolving credit agreement, is adjusted to .80 to 1 solely for the quarter ended March 31, 2010. |
| • | The outstanding balances on the revolving credit facility will bear interest at the Company’s option of either (a) the bank’s adjusted base rate, which is the greatest of (i) the bank’s base rate, (ii) the Federal Funds Rate plus 0.5%, or (iii) the one-month LIBOR rate plus 1%, plus a margin of 2.625%, or (b) the adjusted LIBOR rate, plus a margin of 3.50%. |
On March 29, 2010, we executed commitment letters with NGP Capital Resources Company (“NGPC”) and North Shore Energy, LLC (“North Shore”), an affiliate of our largest stockholder, whereby NGPC and North Shore have agreed to the preliminary terms of a commitment to purchase up to $20 million each ($40 million in the aggregate) of the Company’s convertible preferred stock in the event that a proposed rights offering of the convertible preferred stock is not fully subscribed by our common stockholders. Under the terms of the proposed $40 million rights offering, we would distribute, at no charge to the holders of our common stock, rights to purchase up to an aggregate of 4,000,000 new shares of convertible preferred stock at a subscription price of $10.00 per share. The number of rights to be distributed per share of common stock would be determined after our board of directors approves and sets a record date for the rights offering. Any rights offering will be made only by means of a prospectus supplement and accompanying prospectus to our effective registration statement on Form S-3 (Registration No. 333-163193). In the event that we are able to complete the proposed rights offering, we intend to use the net proceeds to repay a portion of our outstanding indebtedness. We cannot assure that we will be successful in completing the proposed rights offering on the terms outlined above, and any discussion of the proposed rights offering in this filing on Form 10-K does not constitute an offer or the solicitation of an offer of the Company’s securities. Our Board of Directors approved the execution of the commitment letters after its receipt of a recommendation to do so by a Special Committee comprised of two independent directors with no affiliation with our largest stockholder. The Special Committee retained the services of independent legal counsel and a financial advisor in evaluating and formulating its recommendation to the Board.
We currently have limited borrowing availability under our revolving credit facility, which matures on May 6, 2011, and we have no assurances that our lenders will extend the maturity date. Accordingly, we will continue to explore various alternatives for additional financing for the Company in order to reduce our debt and provide additional capital for growth. These alternatives may include private or public offerings of debt or equity securities or the sale of assets. The terms, timing and structure of any such financing or sale will depend on several factors, including market conditions, execution risk, timing, possible dilution of existing shareholders and relative cost of the various financing alternatives. There can be no assurance that we will be able to obtain debt or equity financing or complete an asset sale on terms favorable to us, or at all.
Our proved natural gas reserves as of December 31, 2009, as estimated by DeGolyer and MacNaughton (“D&M”), independent petroleum engineers, totaled approximately 209 Bcf, a decrease of approximately 1%, after production, from the approximate 213 Bcf of proved natural gas reserves at September 30, 2009, as audited by D&M, and a decrease, after production, of 32% from the approximate 320 Bcf of proved natural gas reserves at December 31, 2008. Proved reserve estimates are based on the unweighted arithmetic average prices on the first day of each month, adjusted for regional price differentials, for the 12-month period ended December 31, 2009. The average Henry Hub spot market price was $3.87 per Mcf, resulting in a natural gas price of $4.06 per Mcf when adjusted for regional price differentials. All prices and costs associated with operating wells were held constant in accordance with the amended SEC guidelines which were effective for financial statements for periods ending on or after December 31, 2009. The natural gas price used in the valuation of natural gas reserves as of September 30, 2009 was $4.43 per Mcf ($4.29 per Mcf market price for October 30, 2009, adjusted for
9
Table of Contents
regional price differentials), and as of December 31, 2008 was $5.84 per Mcf ($5.71 per Mcf Henry Hub spot market price for December 31, 2008, adjusted for regional price differentials).
Our proved reserves were 100% from coalbed methane reservoirs and were 75% developed. Approximately 62% of total year-end 2009 proved reserves are in the Pond Creek and Lasher fields in West Virginia and Virginia and 38% are in the Gurnee field in Alabama. The present value of proved reserves discounted at ten percent was approximately $98 million at December 31, 2009 as compared to $352 million at year-end 2008. Downward revisions, due in large part to under-performance in the Gurnee field, totaled approximately 103 Bcf, of which 101 Bcf were revisions reported as of September 30, 2009 in our filing on Form 10-Q. Our proved reserves at December 31, 2009 were also impacted by lower natural gas prices and costs in 2009. We were able to limit the effect of lower natural gas prices through our ongoing cost reduction strategy, which we implemented in April 2009.
Natural gas reserve engineering requires subjective estimates of underground accumulations of natural gas and assumptions concerning future natural gas prices, production levels, and operating and development costs. Coalbed methane-producing natural gas reservoirs generally are characterized by an initial period of inclining production rates as pressure in the reservoir decreases, followed by declining production rates that vary depending upon reservoir characteristics and other factors. These decline rates, however, are commonly lower than what is generally experienced with non-coalbed methane wells.
Initial estimates of future production in the Gurnee field were generally consistent with comparable coalbed methane-producing natural gas reservoirs in the adjacent Black Warrior Basin, which produces from the same Pottsville coal formations directly across an anticline. However, the actual performance of our wells in the Gurnee field has not demonstrated the characteristic initial inclining production rates common to coalbed methane reservoirs. D&M lowered estimates of future production in the Gurnee field in connection with the preparation of its reports on our proved reserves as of December 31, 2007 and December 31, 2008. Now that the portion of the field east of the Cahaba River is substantially developed, and based upon continued monitoring of production results of our wells there, we concluded that actual production results did not support, with reasonable certainty, prior estimates of future production for the Gurnee field. Consequently, effective September 30, 2009, we further reduced estimates of future production, eliminating all projected inclines in current production rates (other than those wells that have clearly demonstrated actual inclines in production) and have projected future production rates based on the current production performance of individual wells in the field.
Changes in natural gas prices significantly affect our revenues, financial condition, cash flows, natural gas reserves and borrowing capacity. Markets for natural gas have historically been volatile and we expect this trend to continue. Prices for natural gas may fluctuate in response to changes in supply and demand, market uncertainty, seasonal, political and other factors beyond our control. We are unable to accurately predict the prices we will receive for our natural gas. Accordingly, any significant or sustained declines in natural gas prices will materially adversely affect our financial condition, operating results, liquidity and ability to obtain financing. Declining or prolonged low natural gas prices may also result in non-compliance with the covenants in our revolving credit facility agreement and could result in a lower determination of our borrowing base. Although we will attempt to cure any non-compliance with covenants in our revolving credit facility in the event they occur, no assurance can be given that we will be able to cure such non-compliance. Lower natural gas prices also may reduce the amount of natural gas that we can produce economically. Further declines in natural gas prices could have a material adverse effect on the estimated value and estimated quantities of our proved natural gas reserves, our ability to fund our operations and our financial condition, cash flow, results of operations and access to capital. Our capital expenditure budgets are highly dependent on future natural gas prices.
10
Table of Contents
Proved reserve estimates are based on the unweighted arithmetic average prices on the first day of each month, adjusted for regional price differentials, for the 12-month period ended December 31, 2009. The average Henry Hub spot market price was $3.87 per Mcf, resulting in a natural gas price of $4.06 per Mcf when adjusted for regional price differentials. Impairments recorded to gas properties for the year ended December 31, 2009, were:
| United States | Canada | Total | |||||||||
| Impairment of gas properties |
$ | 255,401,961 | $ | 1,886,296 | $ | 257,288,257 | |||||
| Deferred income tax benefit |
(97,627,986 | ) | — | (97,627,986 | ) | ||||||
| Impairment of gas properties, net of tax |
$ | 157,773,975 | $ | 1,886,296 | $ | 159,660,271 | |||||
The following impairments were recorded solely due to the application of new SEC rules that became effective December 31, 2009, and are included in the table above:
| United States | Canada | Total | |||||||||
| Impairment of gas properties |
$ | 20,847,742 | $ | — | $ | 20,847,742 | |||||
| Deferred income tax benefit |
(8,028,207 | ) | — | (8,028,207 | ) | ||||||
| Impairment of gas properties, net of tax |
$ | 12,819,535 | $ | — | $ | 12,819,535 | |||||
The natural gas price used in the valuation of natural gas reserves as of December 31, 2008 was $5.84 per Mcf ($5.71 Henry Hub spot market price for December 31, 2008, adjusted for regional price differentials). Impairments recorded to gas properties for the year ended December 31, 2008, were:
| United States | Canada | Total | |||||||||
| Impairment of gas properties |
$ | 32,047,484 | $ | 18,686,273 | $ | 50,733,757 | |||||
| Deferred income tax benefit |
(12,087,937 | ) | — | (12,087,937 | ) | ||||||
| Impairment of gas properties, net of tax |
$ | 19,959,547 | $ | 18,686,273 | $ | 38,645,820 | |||||
There were no impairments recorded for the year ended December 31, 2007.
Qualifications of Third Party Engineer
As discussed above, we engaged D&M, independent petroleum engineers, to perform independent estimates of our proved reserves. The technical person responsible for review of our reserve estimates meets the requirements regarding qualifications, independence, objectivity and confidentiality set forth in the Standards Pertaining to Estimating and Auditing of Oil and Gas Reserves Information promulgated by the Society of Petroleum Engineers. D&M does not own an interest in our properties nor is it employed on a contingent fee basis.
Internal Controls
A significant component of our internal controls in our reserve estimation effort is our practice of using an independent third-party reserve engineering firm to estimate 100% of our year-end reserves. The qualifications of the firm are discussed above under “Qualifications of Third Party Engineer.”
Our internal reserve engineer accumulates and reviews the inputs and assumptions used by the third party engineer firm to estimate our year-end reserves and assesses them for reasonableness. Our internal reserve engineer has a Bachelor of Science degree in Mineral Engineering with an emphasis in Petroleum Engineering, is a Certified Professional Engineer in the state of Alabama and has 24 years of experience. The report of our year-end reserves is reviewed by senior management, including the Chief Executive Officer, the Chief Financial Officer, the Chief Accounting Officer, and the Senior Vice President of Operations.
11
Table of Contents
Additionally, the Audit Committee formed a reserve sub-committee consisting of two independent directors who each has more than 35 years of relevant experience to review the inputs, assumptions and issues surrounding our reserves.
Characteristics of Coalbed Methane and Non-Conventional Shallow Gas
The source rock in conventional natural gas is usually different from the reservoir rock, while in coalbed methane the coal seam serves as both the source rock and the reservoir rock. The storage mechanism is also different. Gas is stored in the pore or void space of the rock in conventional natural gas, but in coalbed methane, most, and frequently all, of the gas is stored by adsorption. Adsorption allows large quantities of gas to be stored at relatively low pressures. A unique characteristic of coalbed methane is that the gas flow can be increased by reducing the reservoir pressure. Frequently the coalbed pore space, which is in the form of cleats or fractures, is filled with water. The reservoir pressure is reduced by pumping out the water, releasing the methane from the molecular structure, which allows the methane to flow through the cleat structure to the well bore. While a conventional natural gas well typically decreases in flow as the reservoir pressure is drawn down, a coalbed methane well will typically increase in production for up to five years from initial production depending on well spacing.
Coalbed methane and conventional natural gas both have methane as their major component. While conventional natural gas often has more complex hydrocarbon gases, coalbed methane rarely has more than 2% of the more complex hydrocarbons. In the eastern coal fields of the U.S., coalbed methane is generally 98% to 99% pure methane and requires only dehydration of the gas to remove moisture to achieve pipeline quality. In the western coal fields of the U.S., it is also sometimes necessary to strip out either carbon dioxide or nitrogen. Once coalbed methane has been produced, it is gathered, transported, marketed, and priced in the same manner as conventional natural gas.
The content of gas within a coal seam is measured through gas desorption testing. The ability to flow gas and water to the well bore in a coalbed methane well is determined by the fracture or cleat network in the coal. At shallow depths of less than 500 feet, these fractures often open enough to produce the fluids naturally. At greater depths the networks are progressively squeezed shut, reducing the ability to flow. It is necessary to provide other avenues of flow such as hydraulically fracturing the coal seam. By pumping fluids at high pressure, fractures are opened in the coal and a slurry of fluid and sand proppant is pumped into the fractures so that the fractures remain open after the release of pressure, thereby enhancing the flow of both water and gas to allow the economic production of gas.
Areas of Operation
Cahaba Basin
We hold the development rights to approximately 40,000 net CBM acres throughout the Gurnee field in the Cahaba Basin of central Alabama. At December 31, 2009, approximately 38% of our estimated proved reserves, or 79 Bcf, were located in the Gurnee field, of which approximately 85% were classified as proved developed. We are the operator and own a 100% working interest in the area. As of December 31, 2009, we had 245 productive wells in the Gurnee field. Net daily sales of gas averaged 5,804 Mcf for 2009.
We extract gas from six coal groups within the Pottsville coal formation at depths ranging from 700 feet to 3,400 feet. At these depths, overall seam thickness in this area averages approximately 50 feet of high volatile bituminous rank coal. A total of 33 core holes have been drilled and over 600 gas desorption tests have been conducted on our acreage to determine the gas content of the coal and to define the coalbed methane resource under a substantial portion of the acreage in our leasehold position.
Our acreage is roughly evenly divided between a northern block, largely on the east side of the Cahaba River, and a southern block, largely on the west side of the river. The geology is generally more complex on the
12
Table of Contents
east side of the river with beds dipping from northwest to southeast. The geological setting west of the river tends to be less complex with more gently dipping beds. Most of the development to date in the Gurnee field has been on the east side of the river which is near existing infrastructure.
We own and operate an approximate 38.5-mile pipeline from the Cahaba Basin to the Black Warrior River for the disposal of produced water under a permit issued by the Alabama Department of Environmental Management. This pipeline has a maximum design capacity of approximately 45,000 barrels of water per day, but would require additional pump stations and looping a portion of the line in order to reach the maximum design capacity, if needed. We are currently transporting less than 10,000 barrels of produced water per day through this line and we believe we have adequate takeaway capacity to meet our future needs.
We control and operate a 17.3-mile, 12-inch high pressure steel pipeline and a gas treatment and compression facility through which we gather, dehydrate, and compress our gas for delivery into the Southern Natural Gas pipeline system. As we control the gathering and delivery pipeline system, we incur no third party costs to gather and deliver our gas to market. We believe we have adequate takeaway capacity to meet our future needs.
Garden City
The Garden City Chattanooga Shale prospect is located in north central Alabama. At December 31, 2009, we have approximately 62,000 net acres of leasehold. As of December 31, 2009, we have no proved reserves booked for our Garden City Chattanooga Shale prospect. An economic solution to dispose of produced water will be necessary to develop this prospect and we intend to pursue various produced water disposal options in 2010.
Pond Creek
In the Pond Creek field in the central Appalachian Basin of southern West Virginia and southwestern Virginia, we have the rights to develop approximately 33,000 net CBM acres. At December 31, 2009, approximately 61% of our estimated proved reserves, or 127 Bcf, were located within the Pond Creek field, of which approximately 68% were classified as proved developed. As of December 31, 2009, we are the operator and own an average 99% working interest in 245 gross productive wells in the Pond Creek field. Net daily sales of gas averaged 14,319 Mcf for 2009. In 2010, we intend to drill at least 8 wells and construct related infrastructure in the Pond Creek field.
We extract gas from an average of 12 coal seams within the Pocahontas and New River coal formations at depths ranging from 430 feet to 2,400 feet. At these depths overall coal thickness in this area ranges from 10 to 30 feet of low-medium volatile bituminous rank Pennsylvanian Age coal. Prior mining activity revealed that these coal groups are gas rich. A total of 42 core holes have been drilled on and in the area of our acreage in the central Appalachian Basin and a geographically extensive gas desorption testing program has been conducted to determine the gas content of the coal and to define the coalbed methane resource under a substantial portion of our leasehold position.
Wells in the Pond Creek field produce comparatively lower levels of water. Produced water is used in our operations, injected into our disposal well or ground applied after being processed through our reverse osmosis system that became operational in late 2009. We believe we have adequate capacity to meet our future water disposal requirements in the Pond Creek field.
Our gas from the Pond Creek field is gathered into our central dehydration and compression facilities and delivered into the Jewell Ridge pipeline system owned by East Tennessee Natural Gas, LLC (“ETNG”). In January 2007, we executed two long-term transportation agreements with ETNG which became effective when our pipeline was placed in service on April 1, 2007, with total maximum daily quantities of 15,000 MMBtu’s and 10,000 MMBtu’s and primary terms of 15 years and 10 years, respectively. We believe we have adequate takeaway capacity to meet our future needs.
13
Table of Contents
Lasher
In the Lasher field in the central Appalachian Basin of southern West Virginia, we have the rights to develop approximately 8,000 net CBM acres. At December 31, 2009, approximately 1% of our estimated proved reserves, or 3 Bcf, were located within the Lasher field, of which approximately 100% were classified as proved developed. As of December 31, 2009, we are the operator and own a 100% working interest in 18 productive wells. Our gas from the Lasher field is delivered into a Columbia Gas Transmission pipeline. We believe we have adequate takeaway capacity to meet our future needs.
British Columbia
Our Peace River Project is comprised of approximately 25,000 net acres along the Peace River near Hudson’s Hope, British Columbia. We have drilled 4 core holes targeting the medium volatile bituminous rank Lower Cretaceous Gething coals. Multiple, mostly thin, coal seams with an aggregate average thickness of 52 feet, exist at depths from 1,000 to 3,000 feet. As of December 31, 2009, we have no proved reserves booked for our Peace River Project. As of December 31, 2009, we own a 50% working interest in eight gross productive wells and we are the operator. Our gas from Peace River is delivered on a Spectra Energy Corp pipeline. There are two primary delivery options, namely Westcoast Station 2 in British Columbia and Sumas, located near the U.S. and Canadian border. We believe we have adequate takeaway capacity to meet our future needs. We are planning to shut in the eight producing wells in our Peace River Project prior to May 1, 2010 as a result of decreased natural gas prices and longer than expected dewatering time.
Estimated Proved Reserves
Estimates of proved reserves at December 31, 2009, 2008, and 2007 were prepared by D&M. The technical persons responsible for preparing the reserve estimates are independent petroleum engineers and geoscientists that meet the requirements regarding qualifications, independence, objectivity, and confidentiality set forth in the Standards Pertaining to the Estimating and Auditing of Oil and Gas Reserves Information promulgated by the Society of Petroleum Engineers. The Audit Committee of our Board of Directors has delegated the responsibility of reviewing the reserve reporting process to two independent directors, both of whom have experience in reserve evaluations. Additionally, both the Company’s Chief Executive Officer and Chief Financial Officer are charged with the responsibility of reviewing and approving the natural gas reserve estimates prepared by D&M.
The reserves information in this filing on Form 10-K represents only estimates. There are a number of uncertainties inherent in estimating quantities of proved reserves, including many factors beyond our control, such as commodity pricing. Reserve engineering is a subjective process of estimating underground accumulations of natural gas that cannot be measured in an exact manner. The accuracy of any reserve estimate is a function of the quality of available data and of engineering and geological interpretation and judgment. As a result, estimates of different engineers may vary. In addition, results of drilling, testing and production subsequent to the date of an estimate may lead to revising the original estimate. Accordingly, initial reserve estimates are often different from the quantities of natural gas that are ultimately recovered. The meaningfulness of such estimates depends primarily on the accuracy of the assumptions upon which they were based. Except to the extent we acquire additional properties containing proved reserves or conduct successful exploration and development activities or both, our proved reserves will decline as reserves are produced. For additional information regarding estimates of proved reserves, the preparation of such estimates by D&M and other information about our natural gas reserves, see Supplementary Financial and Operating Information on Gas Exploration, Development and Producing Activities (Unaudited).
14
Table of Contents
Proved reserve estimates are based on the unweighted arithmetic average prices on the first day of each month, adjusted for regional price differentials, for the 12-month period ended December 31, 2009. The average Henry Hub spot market price was $3.87 per Mcf, resulting in a natural gas price of $4.06 per Mcf when adjusted for regional price differentials. All prices and costs associated with operating wells were held constant in accordance with the amended SEC guidelines which were effective for financial statements for periods ending on or after December 31, 2009. The following table presents certain information as of December 31, 2009.
| Estimated Proved Reserves | |||||||||||
| Field |
Proved Developed Producing |
Proved Developed Non- Producing |
Proved Undeveloped |
Total Proved |
PV-10(1) | ||||||
| (MMcf) | (MMcf) | (MMcf) | (MMcf) | (In thousands) | |||||||
| Central Appalachia: |
|||||||||||
| Pond Creek field |
86,179 | — | 40,823 | 127,002 | $ | 66,320 | |||||
| Lasher field |
2,767 | 226 | — | 2,993 | 1,253 | ||||||
| Alabama: |
|||||||||||
| Gurnee field |
54,071 | 12,906 | 12,210 | 79,187 | 29,853 | ||||||
| White Oak Creek field |
92 | — | — | 92 | 240 | ||||||
| Totals |
143,109 | 13,132 | 53,033 | 209,274 | $ | 97,666 | |||||
The following table represents a price sensitivity analysis of estimated proved reserves as of December 31, 2009 using a natural gas price of $6.00 per Mcf, which would have been the price used under the SEC rules in effect prior to December 31, 2009 ($5.79 Henry Hub spot price for December 31, 2009, adjusted for regional price differentials).
| Estimated Proved Reserves | |||||||||||
| Field |
Proved Developed Producing |
Proved Developed Non- Producing |
Proved Undeveloped |
Total Proved |
PV-10(1) | ||||||
| (MMcf) | (MMcf) | (MMcf) | (MMcf) | (In thousands) | |||||||
| Central Appalachia: |
|||||||||||
| Pond Creek field |
86,878 | — | 41,288 | 128,166 | $ | 150,649 | |||||
| Lasher field |
3,080 | 226 | 5,868 | 9,174 | 759 | ||||||
| Alabama: |
|||||||||||
| Gurnee field |
57,480 | 13,341 | 13,056 | 83,877 | 63,620 | ||||||
| White Oak Creek field |
92 | — | — | 92 | 356 | ||||||
| Totals |
147,530 | 13,567 | 60,212 | 221,309 | $ | 215,384 | |||||
| (1) | PV-10, a non-GAAP measure, is our estimated present value of future net revenues from estimated proved reserves before income taxes. We believe PV-10 to be an important measure for evaluating the relative significance of our CBM gas properties and that PV-10 is widely used by professional analysts and investors in evaluating gas companies. Because many factors that are unique to each individual company impact the amount of future income taxes to be paid, the use of a pre-tax measure provides greater comparability of assets when evaluating companies. We believe that most other companies in the oil and gas industry calculate PV-10 on the same basis. Management also uses PV-10 in evaluating acquisition candidates. PV-10 only differs from the standardized measure of discounted future net cash flows (“SMOG”), as calculated and presented in accordance with ASC 932, in that SMOG takes into account the present value of income taxes related to our future net cash flows. See “Selected Financial Data—Reconciliation of Non-GAAP Financial Measures.” |
CBM-producing natural gas reservoirs generally are characterized by an initial period of incline followed by an extended period of declining production rates that vary depending upon reservoir characteristics and other factors. Therefore, without reserve additions in excess of production through successful exploration and
15
Table of Contents
development activities or acquisitions, our reserves and production are expected to decline. This decline rate, however, is slower than what is generally experienced with non-CBM wells. See “Risk Factors” and the notes to our consolidated financial statements included elsewhere in this annual report for a discussion of the risks inherent in CBM gas estimates and for certain additional information concerning the estimated proved reserves.
Production and Operating Statistics
The following table presents certain information with respect to our production and operating data for the periods presented.
| Year Ended December 31, | |||||||||
| 2009 | 2008 | 2007 | |||||||
| Gas: |
|||||||||
| Net sales volume (Bcf) |
7.5 | 7.5 | 7.1 | ||||||
| Average natural gas sales price ($ per Mcf) |
$ | 4.05 | $ | 9.17 | $ | 6.97 | |||
| Average natural gas sales price ($ per Mcf) realized(1) |
$ | 5.47 | $ | 9.10 | $ | 7.52 | |||
| Total production expenses ($ per Mcf) |
$ | 2.67 | $ | 2.87 | $ | 2.86 | |||
| Expenses: ($ per Mcf) |
|||||||||
| Lease operations expenses |
$ | 1.85 | $ | 1.98 | $ | 1.96 | |||
| Compression and transportation expenses |
$ | 0.66 | $ | 0.60 | $ | 0.73 | |||
| Production taxes |
$ | 0.16 | $ | 0.29 | $ | 0.17 | |||
| Depletion of gas properties |
$ | 1.51 | $ | 1.35 | $ | 1.24 | |||
| General and administrative |
$ | 1.11 | $ | 1.26 | $ | 1.30 | |||
The following table presents certain information with respect to our production and operating data for each of the three month periods in the year ended December 31, 2009.
| Three Months Ended | ||||||||||||
| March 31, 2009 |
June 30, 2009 |
September 30, 2009 |
December 31, 2009 | |||||||||
| Gas: |
||||||||||||
| Net sales volume (Bcf) |
1.8 | 1.9 | 1.9 | 1.9 | ||||||||
| Average natural gas sales price ($ per Mcf) |
$ | 5.01 | $ | 3.59 | $ | 3.36 | $ | 4.26 | ||||
| Average natural gas sales price ($ per Mcf) realized(1) |
$ | 6.45 | $ | 5.03 | $ | 5.03 | $ | 5.37 | ||||
| Total production expenses ($ per Mcf) |
$ | 3.38 | $ | 2.60 | $ | 2.46 | $ | 2.21 | ||||
| Expenses: ($ per Mcf) |
||||||||||||
| Lease operations expenses |
$ | 2.42 | $ | 1.76 | $ | 1.68 | $ | 1.52 | ||||
| Compression and transportation expenses |
$ | 0.77 | $ | 0.72 | $ | 0.65 | $ | 0.52 | ||||
| Production taxes |
$ | 0.19 | $ | 0.13 | $ | 0.13 | $ | 0.17 | ||||
| Depletion of gas properties |
$ | 1.52 | $ | 0.97 | $ | 2.64 | $ | 0.92 | ||||
| General and administrative |
$ | 1.58 | $ | 1.15 | $ | 0.97 | $ | 0.72 | ||||
| (1) | Average realized price includes the effects of realized gains and losses on derivative contracts. |
16
Table of Contents
Productive Wells and Acreage
The following table sets forth our interest in undeveloped acreage, developed acreage and productive wells in which we own a working interest as of December 31, 2009. Gross represents the total number of acres or wells in which we own a working interest. Net represents our proportionate working interest resulting from our ownership in the gross acres or wells. Productive wells are wells in which we have a working interest and that are producing and wells capable of producing natural gas.
| Productive Wells | Developed Acres | Undeveloped Acres | ||||||||||
| Area |
Gross | Net | Gross | Net | Gross | Net | ||||||
| Gurnee |
245.0 | 245.0 | 17,307 | 17,227 | 22,884 | 22,951 | ||||||
| Garden City |
4.0 | 4.0 | 640 | 640 | 64,458 | 61,397 | ||||||
| Pond Creek |
245.0 | 243.0 | 15,875 | 15,875 | 22,323 | 16,747 | ||||||
| Lasher |
18.0 | 18.0 | 1,012 | 1,012 | 15,665 | 7,233 | ||||||
| Peace River |
8.0 | 4.0 | 720 | 360 | 51,138 | 25,569 | ||||||
| Other |
— | — | 240 | 240 | 17,470 | 17,470 | ||||||
| Total |
472.0 | 466.0 | 35,794 | 35,354 | 193,938 | 151,367 | ||||||
Our material undeveloped leases are in Alabama, which includes the Gurnee and Garden City fields, the Central Appalachian Basin, which includes the Pond Creek and Lasher fields, and Canada which includes the Peace River field. Generally, the undeveloped acreage expires on various dates from 2010 through 2013; however, the term of the undeveloped acreage can be extended by drilling and production operations. As to the Gurnee field, we have fulfilled drilling commitments on our largest lease, giving us the ability to postpone further drilling until 2010. Otherwise, the remaining acreage either has expirations that occur from 2010 through 2013 or the leases can be extended by drilling and production operations or option payments.
Drilling Activity
The following table sets forth the number of completed gross exploratory and gross development wells drilled in the U.S. and Canada that we participated in for each of the last three fiscal years. The number of wells drilled refers to the number of wells commenced at any time during the respective year. Productive wells are producing wells and wells capable of production.
| Gross | ||||||||||||
| Exploratory | Development | |||||||||||
| Well Activity (Gross)—U.S. |
Productive | Dry | Total | Productive | Dry | Total | ||||||
| Year ended December 31, 2009(1) |
— | — | — | 4 | — | 4 | ||||||
| Year ended December 31, 2008 |
2 | — | 2 | 54 | — | 54 | ||||||
| Year ended December 31, 2007 |
4 | — | 4 | 49 | — | 49 | ||||||
| Exploratory | Development | |||||||||||
| Well Activity (Gross)—Canada |
Productive | Dry | Total | Productive | Dry | Total | ||||||
| Year ended December 31, 2009 |
— | — | — | — | — | — | ||||||
| Year ended December 31, 2008 |
— | — | — | 5 | — | 5 | ||||||
| Year ended December 31, 2007 |
1 | — | 1 | — | — | — | ||||||
The following table sets forth, for each of the last three fiscal years, the number of completed net exploratory and net development wells drilled by us based on our proportionate working interest in such wells.
| Net | ||||||||||||
| Exploratory | Development | |||||||||||
| Well Activity (Net)—U.S. |
Productive | Dry | Total | Productive | Dry | Total | ||||||
| Year ended December 31, 2009(1) |
— | — | — | 4.0 | — | 4.0 | ||||||
| Year ended December 31, 2008 |
2.0 | — | 2.0 | 54.0 | — | 54.0 | ||||||
| Year ended December 31, 2007 |
4.0 | — | 4.0 | 47.0 | — | 47.0 | ||||||
17
Table of Contents
| Exploratory | Development | |||||||||||
| Well Activity (Net)—Canada |
Productive | Dry | Total | Productive | Dry | Total | ||||||
| Year ended December 31, 2009 |
— | — | — | — | — | — | ||||||
| Year ended December 31, 2008 |
— | — | — | 2.5 | — | 2.5 | ||||||
| Year ended December 31, 2007 |
0.5 | — | 0.5 | — | — | — | ||||||
| (1) | The 2009 development wells were drilled in 2008 and completed in early 2009. |
Title to Properties
Our properties are subject to customary royalty interests, liens incident to operating agreements, liens for current taxes and other burdens, including other mineral encumbrances and restrictions. We do not believe that any of these burdens materially interfere with our use of the properties in the operation of our business.
We believe that we have generally satisfactory title to or rights in all of our producing properties. As is customary in the oil and gas industry, we make minimal investigation of title at the time we acquire undeveloped properties. We make title investigations and receive title opinions of local counsel only before we commence drilling operations. We believe that we have satisfactory title to all of our other assets. Although title to our properties is subject to encumbrances in certain cases, we believe that none of these burdens will materially detract from the value of our properties or from our interest therein or will materially interfere with our use in the operation of our business.
Strategy
Our objective is to create the premier non-conventional shallow gas company in North America (emphasizing coalbed methane) while maximizing stockholder value through the efficient investment of capital to increase reserves, production, cash flow and earnings. We intend to focus on the following strategies:
| • | Focus primarily on coalbed methane and non-conventional shallow gas to exploit our substantial expertise and experience. |
| • | Maximize present value in existing development projects and expand into adjacent areas to leverage our information, knowledge and infrastructure. |
| • | Develop new large scale projects, maintain operational control and reduce costs through economies of scale. |
| • | Maintain financial discipline. |
Competitive Strengths
We primarily explore for, develop, and produce CBM and non-conventional shallow gas. We believe that substantial expertise and experience is required to develop, produce, and operate coalbed methane and non-conventional shallow gas fields in an efficient manner. We believe that the inherent geologic and production characteristics of coalbed methane and non-conventional shallow gas offer certain operational advantages compared to conventional gas production, including:
| • | Production Rates. Unlike conventional and unconventional natural gas production, which typically declines after initial production is established, production from CBM wells typically increases for the first few years of their productive lives although eventual peak rates are often lower than those of typical conventional gas wells. CBM wells also generally decline at a shallow rate relative to typical conventional gas wells. |
| • | Low Geologic Risks. Most CBM areas are located in known coal basins where the coal resource has been evaluated for coal mining. These areas have extensive existing geologic information databases. The drilling of new coreholes and a limited number of production test wells reduces the geologic risk prior to committing large development expenditures. |
18
Table of Contents
| • | Low Costs. Our costs of finding and developing coalbed methane tend to be low compared to industry averages because our well costs are generally lower due to the relatively shallow depths of gas-bearing coal seams underlying our projects. Coal seams possess the ability to store significantly more gas volumetrically at shallow depths than conventional reservoirs. In the early stages of a CBM project development per unit operating costs are higher because natural gas production per well is initially low and many of our costs are fixed. As average production per well from a project increases over time and economies of scale are realized, the per unit operating costs typically decrease. Over the life of a project, we believe our average per unit costs of finding, developing and producing natural gas will be lower than those of many conventional and unconventional natural gas industry projects. |
| • | Long-lived Reserves. Because CBM wells typically have inclining production rates early in their lives and low decline rates thereafter, CBM projects typically result in a reserve life that is significantly longer than many types of conventional gas production. |
| • | Highly Experienced Team of CBM Professionals. Our 16-person CBM management, professional, and project management team has an average of more than 18 years of CBM experience and has participated in the drilling and operation of more than 2,700 CBM wells worldwide since 1977. |
| • | Large Inventory of Organic Growth Opportunities. Our extensive undeveloped acreage position provides us with an additional 460 net drilling locations. |
| • | Track Record of Success in Identifying and Exploiting Large Underdeveloped Resource Plays. We pursue those projects that leverage our CBM and shallow gas expertise to exploit underdeveloped resource potential. We have a history of developing large scale projects in multiple basins with low finding and development costs. |
Changes in Global Economy
Our business is influenced by trends that affect the natural gas industry. In particular, declines in natural gas prices and recent economic trends have adversely affected our business, liquidity, results of operations and financial condition.
Beginning in early 2009, we began implementing countermeasures in response to the above referenced trends in order to enhance our ability to execute our business strategy. These countermeasures included reducing costs, increasing hedging to reduce exposure to volatile natural gas prices and limiting capital spending. We continue to evaluate additional measures in light of the current credit and commodity markets, including selling assets, entering into joint venture agreements with industry partners to reduce our capital outlays, and exploring other financing alternatives.
The natural gas industry is capital intensive. We have made, and anticipate that we will continue to make, substantial capital expenditures in the exploration for, development and acquisition of natural gas reserves. Historically, our capital expenditures have been financed primarily with internally generated cash from operations, proceeds from bank borrowings, and industry joint venture arrangements. The continued availability of these capital sources depends upon a number of variables, including proved reserves, production from existing wells, the sales prices for natural gas, our ability to acquire, locate and produce new reserves, and events occurring within the global capital markets.
Competition
Our operations primarily compete regionally in the U.S. and Canada. Competition throughout the U.S. and Canada is regionalized. We believe that the gas market is generally highly fragmented and not dominated by any single producer except in the immediate area of our Virginia development operations, where we believe there is one dominate producer that controls a substantial portion of the market. We believe that several of our competitors have devoted far greater resources than we have to gas exploration and development. We believe that competition within our market is based primarily on price and the proximity of gas fields to customers.
19
Table of Contents
Seasonality of Business
Weather conditions affect the demand for and prices of natural gas and can also delay drilling activities, disrupting our overall business plans. Demand for natural gas is typically higher in the fourth and first quarters resulting in higher natural gas prices. Due to these seasonal fluctuations, results of operations for individual quarterly periods may not be indicative of the results that may be realized on an annual basis.
Governmental, State and Local Regulations
Our coalbed methane exploration and production operations are subject to significant federal, state, and local laws and regulations governing the gathering and transportation of our gas production across state and federal boundaries. The following is a summary of some of the existing regulations to which our operations are subject.
Regulation by the Federal Energy Regulatory Commission (“FERC”) of Interstate Natural Gas Pipelines. We do not own any interstate natural gas pipelines, so the Federal Energy Regulatory Commission, or the FERC, does not directly regulate any of our operations. However, the FERC’s regulation influences certain aspects of our business and the market for our products. In general, the FERC has authority over natural gas companies that provide natural gas pipeline transportation services in interstate commerce, and its authority to regulate those services includes:
| • | the certification and construction of new facilities; |
| • | the extension or abandonment of services and facilities; |
| • | the maintenance of accounts and records; |
| • | the acquisition and disposition of facilities; |
| • | the initiation and discontinuation of services; and |
| • | various other matters. |
In recent years, the FERC has pursued pro-competitive policies in its regulation of interstate natural gas pipelines. However, we cannot assure you that the FERC will continue this approach as it considers matters such as pipeline rates and rules and policies that may affect rights of access to natural gas transportation capacity.
Intrastate Regulation of Natural Gas Transportation Pipelines. We own a pipeline in Alabama that provides intrastate natural gas transportation as defined by the Alabama Public Service Commission (APSC). The APSC regulates gas pipelines that transport gas on an intrastate basis in situations where the gas has been cleaned and pressurized to the point that it is ready for sale. All pipeline systems in Alabama must be constructed, operated and maintained to be in compliance with the defined federal minimum safety standards. The APSC has not enacted its own regulations relating to pipeline safety. Instead, it enforces the U.S. Department of Transportation Office of Pipeline Safety Regulations, including as to reporting, design, construction, and operating requirements of the pipeline. We are inspected annually by the APSC to ensure we are in compliance with the regulations.
Gathering Pipeline Regulation. Section 1(b) of the Natural Gas Act exempts natural gas gathering facilities from the jurisdiction of the FERC. We own an intrastate natural gas pipeline that we believe would meet the traditional tests the FERC has used to establish a pipeline’s status as a gatherer not subject to the FERC’s jurisdiction. However, the distinction between the FERC-regulated transmission services and federally unregulated gathering services is the subject of regular litigation, so, in such a circumstance, the classification and regulation of some of our gathering facilities may be subject to change based on future determinations by the FERC and the courts.
In the states in which we operate, regulation of intrastate gathering facilities generally includes various safety, environmental and, in some circumstances, nondiscriminatory take requirement and complaint based rate
20
Table of Contents
regulation. For example, we are subject to state ratable take and common purchaser statutes. Ratable take statutes generally require gatherers to take, without undue discrimination, natural gas production that may be tendered to the gatherer for handling. In certain circumstances, such laws will apply even to gatherers like us that do not provide third party, fee-based gathering service and may require us to provide such third party service at a regulated rate. Similarly, common purchaser statutes generally require gatherers to purchase without undue discrimination as to source of supply or producer. These statutes are designed to prohibit discrimination in favor of one producer over another producer or one source of supply over another source of supply. These statutes have the effect of restricting our right as an owner of gathering facilities to decide with whom we contract to purchase or transport natural gas.
Natural gas gathering may receive greater regulatory scrutiny at both the state and federal levels now that the FERC has taken a less stringent approach to regulation of the gathering activities of interstate pipeline transmission companies and a number of such companies have transferred gathering facilities to unregulated affiliates. Our gathering operations could be adversely affected should they be subject in the future to the application of state or federal regulation of rates and services. Our gathering operations also may be or become subject to safety and operational regulations relating to the design, installation, testing, construction, operation, replacement, and management of gathering facilities. Additional rules and legislation pertaining to these matters are considered or adopted from time to time. We cannot predict what effect, if any, such changes might have on our operations, but the industry could be required to incur additional capital expenditures and increased costs depending on future legislative and regulatory changes.
Sales of Natural Gas. The price at which we sell natural gas currently is not subject to federal regulation and, for the most part, is not subject to state regulation. Our natural gas sales are affected by the availability, terms, and cost of pipeline transportation. As noted above, the price and terms of access to pipeline transportation are subject to extensive federal and state regulation. The FERC is continually proposing and implementing new rules and regulations affecting those segments of the natural gas industry, most notably interstate natural gas transmission companies that remain subject to the FERC’s jurisdiction. These initiatives also may affect the intrastate transportation of natural gas under certain circumstances. The stated purpose of many of these regulatory changes is to promote competition among the various sectors of the natural gas industry, and these initiatives generally reflect more light handed regulation. We cannot predict the ultimate impact of these regulatory changes to our natural gas operations, and we note that some of the FERC’s more recent proposals may adversely affect the availability and reliability of interruptible transportation service on interstate pipelines. We do not believe that we will be affected by any such FERC action materially differently than other sellers of natural gas with whom we compete.
Virginia Regulation. The Virginia Supreme Court has stated that the grant of coal rights only does not include rights to coalbed methane absent an express grant of coalbed methane, natural gases, or minerals in general. The situation may be different if there is any expression in the severance deed indicating more than mere coal is conveyed. Virginia courts have also found that the owner of the coalbed methane did not have the right to fracture the coal in order to retrieve the coalbed methane and that the coal operator had the right to ventilate the coalbed methane in the course of mining. In Virginia, we believe that we control the relevant property rights in order to capture gas from the vast majority of our producing properties. In addition, Virginia has established the Virginia Gas and Oil Board and a procedure for the development of coalbed methane by an operator in those instances where the owner of the coalbed methane has not leased it to the operator or in situations where there are conflicting claims of ownership of the coalbed methane. The general practice is to force pool both the coal owner and the gas owner. In those instances, any royalties otherwise payable are paid into escrow and the burden then is upon the conflicting claimants to establish ownership by court action. The Virginia Gas and Oil Board does not make ownership decisions.
West Virginia Regulation. The West Virginia’s Supreme Court has held that, in a conventional oil and gas lease executed prior to the inception of widespread public knowledge regarding coalbed methane operations, the oil and gas lessee did not acquire the right to produce coalbed methane. As of December 31, 2009, the West
21
Table of Contents
Virginia courts have not clarified who owns coalbed methane in West Virginia. Therefore, the ownership of coalbed methane is an open question in West Virginia. West Virginia has enacted a law, the Coalbed Methane Wells and Units Act (the “West Virginia Act”), regulating the commercial recovery and marketing of coalbed methane. Although the West Virginia Act does not specify who owns, or has the right to exploit, coalbed methane in West Virginia and instead refers ownership disputes to judicial resolution, it contains provisions similar to Virginia’s pooling law. Under the pooling provisions of the West Virginia Act, an applicant who proposes to drill can prosecute an administrative proceeding with the West Virginia Coalbed Methane Review Board to obtain authority to produce coalbed methane from pooled acreage. Owners and claimants of coalbed methane interests who have not consented to the drilling are afforded certain elective forms of participation in the drilling (e.g., royalty or owner) but their consent is not required to obtain a pooling order authorizing the production of coalbed methane by the operator within the boundaries of the drilling unit. The West Virginia Act also provides that, where title to subsurface minerals has been severed in such a way that title to coal and title to natural gas are vested in different persons, the operator of a coalbed methane well permitted, drilled and completed under color of title to the coalbed methane from either the coal seam owner or the natural gas owner has an affirmative defense to an action for willful trespass relating to the drilling and commercial production of coalbed methane from that well.
Alabama Regulation. In 1983 the State Oil & Gas Board of Alabama, in cooperation with the coalbed methane operator’s group, established the first rules for coalbed methane drilling, development and producing operations. The evolution of Alabama coalbed methane permits is a continuing process. The coalbed methane industry in Alabama has a long history of working closely with Alabama Department of Environmental Management and other government agencies on the continual improvement of coalbed methane permits.
Canadian Governmental Regulation. Our operations in Canada are subject to regulation by the National Energy Board (“NEB”) and provincial agencies in Canada. These agencies have jurisdiction similar to the FERC for regulation. Business in Western Canada is regulated by the NEB pursuant to a framework for light-handed regulation under which the NEB acts on a complaints basis. However, the natural gas industry in Canada remains subject to extensive controls and regulations imposable by various levels of government. We do not expect that any of these controls or regulations will affect our operations in a manner materially different than they would affect other natural gas industry participants of similar size.
In addition to federal regulation, each province has legislation and regulations that govern land tenure, royalties, production rates, environmental protection and other matters. The royalty regime is a significant factor in the profitability natural gas production. Royalties payable on production from lands other than government lands are determined by negotiations between the mineral owner and the lessee. Royalties on government land are determined by government regulation and are generally calculated as a percentage of the value of gross production, and the rate of royalties payable generally depends upon prescribed reference prices, well productivity, geographical location, field discovery date and the type or quality of the petroleum product produced.
NAFTA. The North American Free Trade Agreement among the governments of Canada, the U.S. and Mexico became effective on January 1, 1994. NAFTA carries forward most of the material energy terms that are contained in the Canada-U.S. Free Trade Agreement. Subject to the General Agreement on Tariffs and Trade, Canada continues to remain free to determine whether exports of energy resources to the U.S. or Mexico will be allowed, so long as any export restrictions do not reduce the proportion of energy resources exported relative to total supply (based upon the proportion prevailing in the most recent 36-month period or another representative period agreed upon by the parties), impose an export price higher than the domestic price (subject to an exception that applies to some measures that only restrict the value of exports), or disrupt normal channels of supply. All three countries are prohibited from imposing minimum or maximum export or import price requirements, with some limited exceptions.
22
Table of Contents
Environmental Regulations
Our coalbed methane exploration and production operations are subject to significant federal, state, local, and Canadian environmental laws and regulations governing environmental protection as well as the discharge of substances into the environment. These laws and regulations may restrict the types, quantities, and concentrations of various substances that can be released into the environment as a result of natural gas drilling, production, and processing activities; suspend, limit or prohibit construction, drilling and other activities in certain lands lying within wilderness, wetlands and other protected areas; require remedial measures to mitigate pollution from historical and on-going operations such as the use of pits and plugging of abandoned wells; and restrict injection of liquids into subsurface strata that may contaminate groundwater. Governmental authorities have the power to enforce compliance with their laws, regulations and permits, and violations are subject to injunction, as well as administrative, civil and even criminal penalties. The effects of these laws and regulations, as well as other laws or regulations that are adopted in the future could have a material adverse impact on our operations.
We believe that we are in substantial compliance with existing applicable environmental laws and regulations. However, it is possible that new environmental laws or regulations or the modification of existing laws or regulations could have a material adverse effect on our operations. As a general matter, the recent trend in environmental legislation and regulation is toward stricter standards, and this trend will likely continue. To date, we have not been required to expend extraordinary resources in order to satisfy existing applicable environmental laws and regulations. However, costs to comply with existing and any new environmental laws and regulations could become material. Moreover, a serious incident of pollution may result in the suspension or cessation of operations in the affected area or in substantial liabilities to third parties. Although we maintain insurance coverage against costs of clean-up operations, no assurance can be given that we are fully insured against all such potential risks. The imposition of any of these liabilities or compliance obligations on us may have a material adverse effect on our financial condition and results of operations.
The following is a summary of some of the existing environmental laws, rules and regulations to which our operations in the U.S. are subject. Our operations in Canada are subject to similar Canadian requirements.
Comprehensive Environmental Response, Compensation and Liability Act. The Comprehensive Environmental Response, Compensation and Liability Act, or CERCLA, also known as the Superfund law, imposes strict, joint and several liability without regard to fault or legality of conduct, on persons who are considered to have contributed to the release of a “hazardous substance” into the environment. These persons include the owner or operator of the site where the release occurred and companies that disposed or arranged for the disposal of the hazardous substance released at the site. Under CERCLA, such persons may be liable for the costs of cleaning up the hazardous substances that have been released into the environment, for damages to natural resources, and for the costs of certain health studies. In addition, it is not uncommon for neighboring land owners and other third parties to file claims for personal injury and property damage allegedly caused by the hazardous substances released into the environment. Although CERCLA currently excludes “petroleum” and “natural gas, natural gas liquids, liquefied natural gas or synthetic gas useable for fuel” from the definition of “hazardous substance,” our operations may generate materials that are subject to regulation as hazardous substances under CERCLA.
CERCLA may require payment for cleanup of certain abandoned waste disposal sites, even if such waste disposal activities were undertaken in compliance with regulations applicable at the time of disposal. Under CERCLA, one party may, under certain circumstances, be required to bear more than its proportional share of cleanup costs if payment cannot be obtained from other responsible parties. CERCLA authorizes the U.S. Environmental Protection Agency and, in some cases, third parties to take actions in response to threats to the public health or the environment and to seek to recover from the responsible classes of persons the costs they incur. The scope of financial liability under these laws involves inherent uncertainties.
Resource Conservation and Recovery Act. The Resource Conservation and Recovery Act, or RCRA, and comparable state programs regulate the management, treatment, storage, and disposal of hazardous and
23
Table of Contents
non-hazardous solid wastes. Our operations generate wastes, including hazardous wastes that are subject to RCRA and comparable state laws. We believe that these operations are currently complying in all material respects with applicable RCRA requirements. Although RCRA currently exempts certain natural gas and oil exploration and production wastes from the definition of hazardous waste, we cannot assure you that this exemption will be preserved in the future, which could have a significant impact on us as well as on the oil and natural gas industry, in general.
Water Discharges. Our operations are subject to the Clean Water Act, or CWA, as well as the Oil Pollution Act, or OPA, and analogous state laws and regulations. These laws and regulations impose detailed requirements and strict controls regarding the discharge of pollutants, including spills and leaks of oil and other substances, into waters of the U.S., including wetlands. Under the CWA and OPA, any unpermitted release of pollutants from operations could cause us to become subject to the costs of remediating a release; administrative, civil or criminal fines or penalties; or OPA specified damages, such as damages for loss of use and natural resource damages. In addition, in the event that spills or releases of produced water from CBM production operations were to occur, we would be subject to spill notification and response requirements under the CWA or the equivalent state regulatory program. Depending on the nature and location of these operations, spill response plans may also have to be prepared.
Our CBM exploration and production operations produce substantial volumes of water that must be disposed of in compliance with requirements of the CWA, Safe Drinking Water Act, or SDWA, or an equivalent state regulatory program. This produced water is disposed of by re-injection into the subsurface through disposal wells, discharge to surface streams, or in evaporation ponds. Discharge of produced water to surface streams and other bodies of water must be authorized in advance pursuant to permits issued under the CWA, and disposal of produced water in underground injection wells must be authorized in advance pursuant to permits issued under the SDWA. To date, we believe that all necessary surface discharge or disposal well permits have been obtained and that the produced water has been disposed in substantial compliance with such permits and applicable laws.
Air Emissions. The Clean Air Act, or CAA, and comparable state laws and regulations govern emissions of various air pollutants through the issuance of permits and the imposition of other requirements. Air emissions from some equipment used in our operations, such as gas compressors, are potentially subject to regulations under the CAA or equivalent state and local regulatory programs, although many small air emission sources are expressly exempt from such regulations. To the extent that these air emissions are regulated, they are generally regulated by permits issued by state regulatory agencies. To date, we believe that no unusual difficulties have been encountered in obtaining air permits, and we believe that our operations are in substantial compliance with the CAA and analogous state and local laws and regulations. However, in the future, we may be required to incur capital expenditures or increased operating costs to comply with air emission-related requirements.
Other Laws and Regulations. Our operations are also subject to regulations governing the handling, transportation, storage and disposal of naturally occurring radioactive materials. Furthermore, owners, lessees and operators of natural gas and oil properties are also subject to increasing civil liability brought by surface owners and adjoining property owners. Such claims are predicated on the damage to or contamination of land resources occasioned by drilling and production operations and the products derived therefrom, and are often based on negligence, trespass, nuisance, strict liability or fraud.
In addition, our operations may in the future be subject to the regulation of greenhouse gas emissions. Numerous countries, including Canada but not the U.S., are participants in the Kyoto Protocol to the United Nations Framework Convention on Climate Change. Participating countries are required to implement national programs to reduce emissions of certain gases, generally referred to as greenhouse gases that are suspected of contributing to global warming. Although the U.S. is not participating in the Protocol, there has been support in various regions of the country for legislation that requires reductions in greenhouse gas emissions, and some states have already adopted legislation addressing greenhouse gas emissions from certain greenhouse gas emission sources, primarily power plants. The oil and gas exploration and production industry is a direct source
24
Table of Contents
of certain greenhouse gas emissions, namely carbon dioxide and methane, and future restrictions on such emissions could impact our future operations. Our operations in the U.S. currently are not adversely impacted by current state and local climate change initiatives. Our Canadian operations are subject to the Protocol, but implementation of the Protocol’s greenhouse gas emission reduction requirements in British Columbia are not presently expected to have a material adverse effect on our operations. However, it is not possible to accurately estimate how potential future laws or regulations addressing greenhouse gas emissions may impact our business.
Canadian Environmental Regulation. The natural gas industry is governed by environmental regulation under Canadian federal and provincial laws, rules and regulations, which restrict and prohibit the release or emission and regulate the storage and transportation of various substances produced or utilized in association with natural gas industry operations. In addition, applicable environmental laws require that well and facility sites be abandoned and reclaimed, to the satisfaction of provincial authorities, in order to remediate these sites to near natural conditions. Also, environmental laws may impose upon “responsible persons” remediation obligations on property designated as a contaminated site. Responsible persons include persons responsible for the substance causing the contamination, persons who caused the release of the substance and any present or past owner, tenant or other person in possession of the site. Compliance with such legislation can require significant expenditures. A breach of environmental laws may result in the imposition of fines and penalties and suspension of production, in addition to the costs of abandonment and reclamation.
Industry Segment and Geographic Information
We operate in one industry, which is the exploration, development and production of natural gas. Our operational activities are conducted in the U.S. and Canada with only the U.S. currently having material revenue generating operating results.
Employees
At December 31, 2009, we had 73 full-time employees and one full-time contractor. None of our employees are represented by a labor union or covered by any collective bargaining agreement. We believe that our relations with our employees are satisfactory.
Corporate Offices
Our corporate headquarters are located at 909 Fannin, Suite 1850, Houston, Texas 77010. Our technical and operational headquarters are located at 5336 Stadium Trace Parkway, Suite 206, Birmingham, Alabama 35244.
Access to Company Reports
We file periodic reports, proxy statements and other information with the SEC in accordance with the requirements of the Exchange Act of 1934, as amended, or the Securities Exchange Act of 1934, as amended. We make our annual reports on Form 10-K, quarterly reports on Form 10-Q, current reports on Form 8-K, and any amendments to such reports available free of charge through our corporate website at www.geometinc.com as soon as reasonably practicable after we file any such report with the SEC. In addition, information related to the following items, among other information, can be found on our website: our press releases, our corporate governance guidelines, our corporate code of business ethics and conduct, our audit committee charter, our compensation committee charter and our nominating, corporate governance and ethics committee charter. You may also read and copy any document we file with the SEC at the SEC’s Public Reference Room at 100 F Street, N.E., Washington, D.C. 20549. You may obtain information on the operation of the Public Reference Room by calling the SEC at 1-800-SEC-0330. In addition, the SEC maintains an internet site that contains our reports, proxy and information statements, and our other filings which are also available to the public over the internet at the SEC’s website at www.sec.gov.
25
Table of Contents
If any of the following risks develop into actual events, our business, financial condition, results of operations, cash flows, strategies and prospects could be materially adversely affected.
Natural gas prices are volatile, and a decline primarily in natural gas prices would significantly affect our financial results and impede our growth.
Our revenue, profitability, and cash flow depend upon the prices and demand for natural gas. The market for natural gas is very volatile and even relatively modest drops in prices can significantly affect our financial results and impede our growth. Changes in natural gas prices have a significant impact on the value of our reserves and on our cash flow. Prices for natural gas may fluctuate widely in response to relatively minor changes in the supply of and demand for natural gas, market uncertainty and a variety of additional factors that are beyond our control, such as:
| • | the domestic and foreign supply of natural gas; |
| • | the price of foreign imports; |
| • | overall domestic and global economic conditions; |
| • | the consumption pattern of industrial consumers, electricity generators, and residential users; |
| • | weather conditions; |
| • | technological advances affecting energy consumption; |
| • | domestic and foreign governmental regulations; |
| • | proximity and capacity of gas pipelines and other transportation facilities; and |
| • | the price and availability of alternative fuels. |
Many of these factors are beyond our control. Because all of our estimated proved reserves as of December 31, 2009 were natural gas reserves, our financial results are sensitive to movements in natural gas prices. Recent natural gas prices have been extremely volatile and we expect this volatility to continue. Natural gas prices have recently been the lowest since 2002 and continue to be highly volatile; however, we have recently seen a seasonal increase in natural gas prices from the low levels reached in September 2009.
The results of increased investment in the exploration for and production of gas and oil and other factors, such as global economic and financial conditions discussed below, may cause the price of gas to fall. Lower natural gas prices may not only decrease our revenues on a per Mcf basis, but also may reduce the amount of natural gas that we can produce economically. This may result in substantial downward adjustments to our estimated proved reserves and could have a material adverse effect on our financial condition, results of operations and cash flow. If there are substantial downward adjustments to our estimated proved reserves or if our estimates of development costs increase, production data factors change or our exploration results deteriorate, accounting rules may require us to write down, as a non-cash charge to earnings, the carrying value of our properties for impairments. We are required to perform impairment tests on our assets whenever events or changes in circumstances lead to a reduction of the estimated useful life or estimated future cash flows that would indicate that the carry amount may not be recoverable or whenever management’s plans change with respect to those assets. We may incur impairment charges in the future, which could have a material adverse effect on our results of operations in the period taken.
If natural gas prices decline further or remain low for an extended period of time, we may, among other things, be unable to maintain our borrowing capacity or extend the maturity of our revolving credit facility, repay current or future indebtedness or obtain additional capital on satisfactory terms, all of which could adversely affect the value of our common stock.
26
Table of Contents
We have indebtedness, which makes us more vulnerable to economic downturns and adverse developments in our business.
We have incurred debt amounting to approximately $119.5 million as of December 31, 2009. As a result of our indebtedness, we must use a portion of our cash flow to pay interest, which reduces the amount we have available to finance our operations and other business activities and could limit our flexibility in planning for or reacting to changes in our business and the industry in which we operate. Our indebtedness under our revolving credit facility is at a variable interest rate. As such, an increase in interest rates will generate greater interest expense. The amount of our debt makes us more vulnerable to economic downturns and adverse developments in our business.
Additionally, our revolving credit facility is scheduled to mature in May 2011. Although we intend to amend our bank credit agreement to provide for a multi-year extension of the maturity date, there can be no assurance that we will be able to reach such an agreement with our lenders. We expect that any such agreement will be contingent upon our ability to secure additional financing to repay a portion of the indebtedness under the revolving credit facility. If we are unable to extend the maturity date under our revolving credit facility, or are unable to refinance or restructure our existing indebtedness prior to maturity, we could be in default of our bank credit agreement, which could adversely affect our business, financial condition and results of operations and could require us to pursue a restructuring of our indebtedness or file for protection under the U.S. Bankruptcy Code.
We have limited availability under our current borrowing base, which was reduced to $123 million in connection with the extension of the maturity of our revolving credit facility. The next regular borrowing base determination, which will be based on our December 31, 2009 reserve report prepared by D&M, independent petroleum engineers, is scheduled to be complete on or after June 15, 2010. Our lenders have the ability to reduce our borrowing base on the basis of subjective factors. If natural gas prices remain low for an extended period of time, our lenders will likely redetermine our borrowing base by evaluating our reserves in light of such lower natural gas prices. Such determination could result in a negative revision to the value of our proved reserves and a further reduction of our borrowing base, which could result in a default by the Company under the terms of our bank credit agreement.
We will require additional capital to fund our future activities. If we fail to obtain additional capital, we may not be able to implement fully our business plan, which could lead to a decline in reserves and production.
Historically, we have financed our business plan and operations primarily with internally generated cash flow, bank borrowings, and issuances of common stock. If our revenues decrease as a result of lower natural gas prices, operating difficulties, declines in reserves or for any other reason, we will have limited ability to obtain the capital necessary to sustain our operations at current levels. We intend to seek additional financing. There can be no assurance that we will secure additional financing or that our lenders will consent to the terms of such financing, if applicable. If we incur additional debt, the related risks that we now face could intensify. A higher level of debt also increases the risk that we may default on our debt obligations. Our level of debt affects our operations in several important ways, including the following:
| • | a portion of our cash flow from operations is used to pay interest on borrowings; |
| • | a high level of debt may impair our ability to obtain additional financing in the future for working capital, capital expenditures, acquisitions, general corporate or other purposes; |
| • | a leveraged financial position would make us more vulnerable to economic downturns and could limit our ability to withstand competitive pressures; and |
| • | any debt that we incur under our revolving credit facility will be at variable rates which makes us vulnerable to increases in interest rates. |
We may not be able to obtain debt or equity financing on terms favorable to us, or at all. If cash generated by operations or available under our revolving credit facility is not sufficient to meet our capital requirements,
27
Table of Contents
the failure to obtain additional financing could result in a curtailment of our operations relating to exploration and development of our projects, which in turn could lead to a possible loss of properties and a decline in our natural gas reserves.
Our revolving credit facility contains a number of financial and other covenants, and our obligations under the revolving credit facility are secured by substantially all of our assets. If we are unable to comply with these covenants, our lenders could accelerate the repayment of our indebtedness.
Our revolving credit facility subjects us to a number of covenants that impose restrictions on us, including our ability to incur indebtedness and liens, make loans and investments, sell assets, engage in mergers, consolidations and acquisitions, enter into transactions with affiliates, or pay dividends. We are also required by the terms of our revolving credit facility to comply with certain financial ratios. Our revolving credit facility also provides for periodic redeterminations of our borrowing base, which may affect our borrowing capacity. Our revolving credit facility is secured by a lien on substantially all of our assets, including equity interests in our subsidiaries.
A breach of any of the covenants imposed on us by the terms of our revolving credit facility, including the financial covenants, could result in a default under such indebtedness. In the event of a default, the lenders could terminate their commitments to us, and they could accelerate the repayment of all of our indebtedness. In such case, we may not have sufficient funds to pay the total amount of accelerated obligations, and our lenders could proceed against the collateral securing the revolving credit facility. Any acceleration in the repayment of our indebtedness or related foreclosure could adversely affect our business.
In addition, the borrowing base under our revolving credit facility is redetermined semi-annually and may be redetermined at other times upon request by the lenders under certain circumstances. Redeterminations are based upon a number of factors, including natural gas prices and reserve levels.
Our revolving credit facility expires in May 2011.
If credit and capital markets worsen, then we may not be able to obtain funding under our current revolving credit facility or funding on acceptable terms. The inability to obtain funding could deter us from meeting our future capital needs to fund our development program.
Capital and credit markets have experienced significant volatility and disruption during the past two years and continue to be unpredictable. Given the current levels of market volatility and disruption, the availability of funds from those markets has diminished substantially. Further, the cost of accessing the credit markets has increased as many lenders have raised interest rate spreads, enacted tighter lending standards or altogether ceased to provide funding to borrowers.
As a result of these capital and credit market conditions, we cannot be certain that funding will be available if needed, and to the extent required, on acceptable terms. If funding is not available when needed, or is available only on unfavorable terms, we may not be able to meet our obligations as they come due or be required to post collateral to support our obligations, or we may not be able to implement our development program, grow our existing business through acquisitions, or otherwise take advantage of business opportunities or respond to competitive pressures, any of which could have a material adverse effect on our business, financial condition and results of operations.
The deterioration of global economic and financial conditions and a prolonged decline in the price of natural gas may materially and adversely affect our business, financial condition and results of operations.
Our business, financial condition and results of operations are affected by conditions in the capital markets and the economy generally. The ongoing global economic financial crisis and worldwide economic slowdown
28
Table of Contents
could lead to prolonged national or global recession, which would likely reduce domestic and foreign demand for natural gas and result in lower natural gas prices. Substantial decreases in natural gas prices could have a material adverse effect on our business, financial condition and results of operations, could limit our access to liquidity and credit and could hinder our ability to fund our development program, which would limit our ability to grow or replace our proved reserves, and, eventually, our production levels.
Changes in tax laws may impair our results of operations and adversely impact the value of our common stock.
Under current federal tax laws, we are entitled to certain deductions relating to our operations, including deductions for intangible drilling costs, manufacturing tax deductions and percentage depletion deductions. The President’s budget for the fiscal year 2010 outlines proposals to eliminate several oil and gas federal income tax incentives, including the repeal of the manufacturing tax deduction and percentage depletion allowance for oil and natural gas and expensing of intangible drilling costs. It is not possible at this time to predict how legislation or new regulations that may be adopted to address these proposals would impact our business, but any such future laws and regulations could adversely affect the amount of our taxable income or loss and could have a negative impact on the value of our common stock.
We may incur substantial costs to comply with, and demand for our products may be reduced by, climate change legislation and regulatory initiatives.
The United States Congress is considering legislation to reduce emissions of greenhouse gases and more than one-third of the states, either individually or through multi-state initiatives, already have begun implementing legal measures to reduce emissions of greenhouse gases. In addition, the Environmental Protection Agency has announced possible future regulation of greenhouse gas emissions under the Clean Air Act. Depending on the nature of potential regulations and legislation, such future laws and regulations could result in increased compliance costs or additional operating restrictions, and could have an adverse effect on our business or demand for the natural gas we produce.
We face uncertainties in estimating proved gas reserves, and inaccuracies in our estimates could result in lower than expected reserve quantities and a lower present value of our reserves.
Natural gas reserve engineering requires subjective estimates of underground accumulations of natural gas and assumptions concerning future natural gas prices, production levels, and operating and development costs. In addition, in the early stages of a coalbed methane project, it is difficult to predict the production curve of a coalbed methane field. The estimated production profile of a field in the early stage of operations may vary significantly from the actual production profile as the field matures. As a result, quantities of estimated proved reserves, projections of future production rates, and the timing of development expenditures may be incorrect. Over time, material changes to reserve estimates may be made, taking into account the results of actual drilling, testing, and production. Also, we make certain assumptions regarding future natural gas prices, production levels, and operating and development costs that may prove incorrect. Any significant variance from these assumptions to actual figures could greatly affect our estimates of our reserves, the economically recoverable quantities of natural gas attributable to any particular group of properties, the classifications of reserves based on risk of recovery, and estimates of the future net cash flows. Numerous changes over time to the assumptions on which our reserve estimates are based, as described above, often result in the actual quantities of gas we ultimately recover being different from reserve estimates.
The present value of future net cash flows from our estimated proved reserves is not necessarily the same as the current market value of our estimated natural gas reserves. We base the estimated discounted future net cash flows from our estimated proved reserves on current prices and costs. However, actual future net cash flows from our gas properties also will be affected by factors such as:
| • | geological conditions; |
29
Table of Contents
| • | changes in governmental regulations and taxation; |
| • | assumptions governing future prices; |
| • | the amount and timing of actual production; |
| • | future gas prices and operating costs; and |
| • | capital costs of drilling new wells. |
The timing of both our production and our incurrence of expenses in connection with the development and production of natural gas properties will affect the timing of actual future net cash flows from estimated proved reserves, and thus their actual present value. In addition, the 10% discount factor we use when calculating discounted future net cash flows may not be the most appropriate discount factor based on interest rates in effect from time to time and risks associated with us or the natural gas industry in general.
Our results of operations could be adversely affected as a result of non-cash impairments.
For the year ended December 31, 2009, we recorded full cost ceiling impairments of approximately $159.7 million, net of income tax benefit of $97.6 million. Future adverse changes to any of these factors could lead to an impairment of all or a portion of our full cost pool in future periods which could significantly reduce earnings during the period in which the impairment occurs, and would result in a corresponding reduction to the full cost pool and stockholders’ equity.
Unless we replace our natural gas reserves, our reserves and production will decline, which would adversely affect our business, financial condition, results of operations, borrowing capacity and cash flows.
Producing natural gas reservoirs are typically characterized by declining production rates that vary depending upon reservoir characteristics and other factors. CBM production generally declines at a shallow rate after initial increases in production which result as a consequence of the pressuring process. The rate of decline from our existing wells may change in a manner different than we have estimated. Thus, our future natural gas reserves and production and, therefore, our borrowing capacity, cash flow and income are highly dependent on our success in efficiently developing and exploiting our current reserves and economically finding or acquiring additional recoverable reserves. We may not be able to develop, find, or acquire additional reserves to replace our current and future production at acceptable costs.
Currently the vast majority of our producing properties are located in two counties in Alabama, one county in West Virginia, and one county in Virginia, making us vulnerable to risks associated with having our production concentrated in a few areas.
The vast majority of our producing properties are geographically concentrated in two counties in Alabama, one county in West Virginia, and one county in Virginia. As a result of this concentration, we may be disproportionately exposed to the impact of delays or interruptions of production from these wells caused by significant governmental regulation, transportation capacity constraints, curtailment of production, natural disasters, interruption of transportation of natural gas produced from the wells in these basins, or other events which impact these areas.
Our ability to sell the gas we produce depends in substantial part on the availability and capacity of pipeline systems owned and operated by third parties. Operational impediments on these pipeline systems may hinder our access to natural gas markets or delay our production.
The availability of a ready market for our natural gas production depends on a number of factors, including the proximity of our reserves to pipelines, capacity constraints on pipelines, and disruption of transportation of natural gas through pipelines. We transport the natural gas we produce principally through pipelines owned by
30
Table of Contents
third parties. If we cannot access these third-party pipelines, or if transportation of gas through any of these pipelines is disrupted, we may be required to shut in or curtail production from some of our wells or seek alternate methods of transportation of our production. If any of these were to occur, our revenues would be reduced, which would in turn have a material adverse effect on our financial condition and results of operations.
Certain of our undeveloped leasehold acreage is subject to leases that will expire over the next several years unless production is established on units containing the acreage.
As of December 31, 2009, we own leasehold interests in approximately 62,000 net acres in areas we believe are prospective for the Chattanooga Shale. A large portion of the acreage is not currently held by production. Unless production in paying quantities is established on units containing these leases during their terms, these leases will expire. If our leases expire, we will lose our right to develop the related properties. Our drilling plans for these areas are subject to change based upon various factors, including factors that are beyond our control, including drilling results, oil and natural gas prices, the availability and cost of capital, drilling and production costs, availability of drilling services and equipment, gathering system and pipeline transportation constraints, and regulatory approvals.
We may be unable to obtain adequate acreage to develop additional large-scale projects.
To achieve economies of scale and produce gas economically, we need to acquire large acreage positions to reduce our per unit costs. There are a limited number of coalbed formations in North America that we believe are favorable for CBM development. We face competition when acquiring additional acreage, and we may be unable to find or acquire additional acreage at prices that are acceptable to us.
Our exploration and development activities may not be commercially successful.
The exploration for and production of natural gas involves numerous high risks. The cost of drilling, completing, and operating wells for coalbed methane or other gas is often uncertain, and a number of factors can delay or prevent drilling operations or production, including:
| • | unexpected drilling conditions; |
| • | title problems; |
| • | pressure or irregularities in geologic formations; |
| • | equipment failures or repairs; |
| • | fires or other accidents; |
| • | adverse weather conditions; |
| • | reductions in natural gas prices; |
| • | pipeline ruptures; |
| • | regulatory permitting problems; |
| • | inability to dispose of produced water; |
| • | legal issues; and |
| • | unavailability or high cost of drilling rigs, other field services, and equipment. |
Our future drilling activities may not be successful, and our drilling success rates could decline. Unsuccessful drilling activities could result in higher costs without any corresponding reserves and revenues.
31
Table of Contents
Federal climate change regulation could increase our operating and capital costs.
The American Clean Energy and Security Act of 2009 (ACES), also known as the Waxman-Markey Bill, was approved by the House of Representatives on June 26, 2009. The ACES, if passed by the Senate, would establish a variant of a “cap-and-trade” plan for greenhouse gases (GHG) in order to address climate change. A “cap-and-trade” plan would require businesses that emit more greenhouse gases than permitted to acquire emission allowances from other businesses that emit greenhouse gases at levels lower than the limits specified and then surrender these allowances as a credit against such emissions. As a result of such a plan, we could be required to purchase and surrender emission allowances for GHG emissions resulting from our operations.
Although it is not possible at this time to predict the final outcome of the ACES, any new federal restrictions on GHG emissions, including a cap-and-trade-plan, that may be imposed in areas in which we conduct business could result in increased compliance costs or additional operating restrictions, and could have an adverse effect on our business or demand for the natural gas we produce.
The adoption of derivatives legislation by Congress could have an adverse impact on our ability to hedge risks associated with our business.
Congress is currently considering legislation to impose restrictions on certain transactions involving derivatives, which could affect the use of derivatives in hedging transactions. ACES contains provisions that would prohibit private energy commodity derivative and hedging transactions. ACES would expand the power of the Commodity Futures Trading Commission, or CFTC, to regulate derivative transactions related to energy commodities, including natural gas, and to mandate clearance of such derivative contracts through registered derivative clearing organizations. Under ACES, the CFTC’s expanded authority over energy derivatives would terminate upon the adoption of general legislation covering derivative regulatory reform. The Chairman of the CFTC has announced that the CFTC intends to conduct hearings to determine whether to set limits on trading and positions in commodities with finite supply, particularly energy commodities, such as natural gas. The CFTC also is evaluating whether position limits should be applied consistently across all markets and participants. In addition, the Treasury Department recently has indicated that it intends to propose legislation to subject all OTC derivative dealers and all other major OTC derivative market participants to substantial supervision and regulation, including by imposing conservative capital and margin requirements and strong business conduct standards. Derivative contracts that are not cleared through central clearinghouses and exchanges may be subject to substantially higher capital and margin requirements. Although it is not possible at this time to predict whether or when Congress may act on derivatives legislation or how any climate change bill approved by the Senate would be reconciled with ACES, any laws or regulations that may be adopted that subject us to additional capital or margin requirements relating to, or to additional restrictions on, our natural gas positions could have an adverse effect on our ability to hedge risks associated with our business or on the cost of our hedging activity.
Federal and state legislation and regulatory initiatives relating to hydraulic fracturing could result in increased costs and additional operating restrictions or delays.
Congress is currently considering legislation to amend the federal Safe Drinking Water Act to require the disclosure of chemicals used by the natural gas industry in the hydraulic fracturing process. Hydraulic fracturing involves the injection of water, sand and chemicals under pressure into rock formations to stimulate natural gas production. Sponsors of bills currently pending before the Senate and House of Representatives have asserted that chemicals used in the fracturing process could adversely affect drinking water supplies. The proposed legislation would require the reporting and public disclosure of chemicals used in the fracturing process, which could make it easier for third parties opposing the hydraulic fracturing process to initiate legal proceedings based on allegations that specific chemicals used in the fracturing process could adversely affect groundwater. In addition, these bills, if adopted, could establish an additional level of regulation at the federal level that could lead to operational delays or increased operating costs and could result in additional regulatory burdens that could make it more difficult to perform hydraulic fracturing and increase our costs of compliance and doing business.
32
Table of Contents
We operate in a highly competitive environment and many of our competitors have greater resources than we do.
The gas industry is intensely competitive and we compete with companies from various regions of the U.S. and Canada and may compete with foreign suppliers for domestic sales, many of whom are larger and have greater financial, technological, human and other resources. If we are unable to compete, our operating results and financial position may be adversely affected.
In addition, larger companies may be able to pay more to acquire new properties for future exploration, limiting our ability to replace gas we produce or to grow our production. Our ability to acquire additional properties and to discover new reserves also depends on our ability to evaluate and select suitable properties and to consummate these transactions in a highly competitive environment.
Our ability to produce natural gas may be hampered by the water present in the formation, which could affect our profitability.
Unlike conventional natural gas production, coalbeds and shales frequently contain brine water that must be removed in order for the gas to desorb from the coal and flow to the well bore. Our ability to remove and dispose of sufficient quantities of water from the coal seam will determine whether or not we can produce gas in commercial quantities. The cost of water disposal may affect our profitability.
We may face unanticipated water disposal costs.
Where water produced from our projects fails to meet the quality requirements of applicable regulatory agencies or our wells produce water in excess of the applicable volumetric permit limit, we may have to shut in wells, reduce drilling activities, or upgrade facilities. The costs to dispose of this produced water may increase if any of the following occur:
| • | we cannot obtain future permits from applicable regulatory agencies; |
| • | water of lesser quality is produced; |
| • | our wells produce excess water; or |
| • | new laws and regulations require water to be disposed of in a different manner. |
Obtaining production from our additional drilling locations could take five years or longer, making them susceptible to uncertainties that could alter the occurrence of their drilling.
The additional drilling locations on our existing acreage represent a significant part of our growth strategy. Our ability to drill and produce these locations depends on a number of uncertainties, including, but not limited to, natural gas prices, permitting and the availability of capital. Additionally, the size of these projects dictates that development proceeds in an orderly manner to assure continuity of resources and producibility. Furthermore, the additional drilling locations on acreage in our two early-stage CBM development projects and our Chattanooga Shale exploration prospect face additional uncertainties regarding the economic returns achievable in these areas where only a few wells have been drilled to date.
Our operations in British Columbia present unique risks and uncertainties, different from or in addition to those we face in our domestic operations.
We conduct our operations in British Columbia through a wholly owned subsidiary, Hudson’s Hope Gas, Ltd. Our operations in British Columbia may be adversely affected by currency fluctuations. The expenses of such operations are payable in Canadian dollars. As a result, our Canadian operations are subject to risk of fluctuations in the relative value of the Canadian and U.S. dollars. Other risks of operations in Canada include, among other things, increases in taxes and governmental royalties and changes in laws and policies governing operations of foreign-based companies. Laws and policies of the U.S. affecting foreign trade and taxation may also adversely affect our operations in British Columbia.
33
Table of Contents
We may be unable to retain our existing senior management team and/or other key personnel that have expertise in coalbed methane extraction and our failure to continue to attract qualified new personnel could adversely affect our business.
Our business requires disciplined execution at all levels of our organization to ensure that we continually develop our reserves and produce gas at profitable levels. This execution requires an experienced and talented management and operations team. If we were to lose the benefit of the experience, efforts and abilities of any of our key executives or the members of our team that have developed substantial expertise in coalbed methane extraction, our business could be adversely affected. We have not entered into employment agreements or non-competition agreements with any of our key employees, other than J. Darby Seré, our President and Chief Executive Officer, and William C. Rankin, our Executive Vice President and Chief Financial Officer. We do not maintain key person life insurance on any of our personnel. Our ability to manage our growth, if any, will require us to continue to train, motivate, and manage our employees and to attract, motivate, and retain additional qualified managerial and operations personnel. Competition for these types of personnel is intense, and we may not be successful in attracting, assimilating, and retaining the personnel required to grow and operate our business profitably.
Government laws, regulations, and other legal requirements relating to protection of the environment, health and safety matters and others that govern our business increase our costs and may restrict our operations.
We are subject to laws, regulations and other legal requirements enacted or adopted by federal, state, local, and foreign authorities, relating to protection of the environment and health and safety matters, including those legal requirements that govern discharges of substances into the air and water, the management and disposal of hazardous substances and wastes, the clean-up of contaminated sites, groundwater quality and availability, plant and wildlife protection, reclamation and restoration of mining or drilling properties after mining or drilling is completed, control of surface subsidence from underground mining, and work practices related to employee health and safety. Complying with these requirements, including the terms of our permits, has had, and will continue to have, a significant effect on our respective costs of operations and competitive position. In addition, we could incur substantial costs, including clean-up costs, fines and civil or criminal sanctions, and third party damage claims for personal injury, property damage, wrongful death, or exposure to hazardous substances, as a result of violations of or liabilities under environmental and health and safety laws.
Additionally, the gas industry is subject to extensive legislation and regulation, which is under constant review for amendment or expansion. Any changes may affect, among other things, the cost of production. State and local authorities regulate various aspects of gas drilling and production activities, including the drilling of wells (through permit and bonding requirements), the spacing of wells, the unitization or pooling of gas properties, environmental matters, safety standards, market sharing, and well site restoration. If we fail to comply with statutes and regulations, we may be subject to substantial penalties, which would decrease our profitability.
We must obtain governmental and/or third party permits and approvals for drilling operations, which can be a costly and time consuming process and result in restrictions on our operations.
Regulatory authorities exercise considerable discretion in the timing and scope of permit issuance. Requirements imposed by these authorities may be costly and time consuming and may result in delays in the commencement or continuation of our exploration or production operations. For example, we are often required to prepare and present to federal, state or local authorities data pertaining to the effect or impact that proposed exploration for or production of gas may have on the environment. Further, the public may comment on and otherwise engage in the permitting process, including through intervention in the courts. In some cases, consents from third parties may be required before a permit is issued. Accordingly, the permits we need may not be issued, or if issued, may not be issued in a timely fashion, or may involve requirements that restrict our ability to conduct our operations or to do so profitably.
34
Table of Contents
We depend on technology owned by others.
We rely on the technological expertise of the independent contractors that we retain for our operations. We have no long-term agreements with these contractors, and thus we cannot be sure that we will continue to have access to this expertise.
We may incur additional costs to produce gas because our confirmation of title for gas rights for some of our properties may be inadequate or incomplete.
We generally obtain title opinions on significant properties that we drill or acquire. However, we cannot be sure that we will not suffer a monetary loss from title defects or failure. In addition, the steps needed to perfect our ownership varies from state to state and some states permit us to produce the gas without perfected ownership under forced pooling arrangements while other states do not permit this. As a result, we may have to incur title costs and pay royalties to produce gas on acreage that we control and these costs may be material and vary depending upon the state in which we operate.
The availability or high cost of drilling rigs, equipment, supplies, personnel, and field services could adversely affect our ability to execute our exploration and development plans on a timely basis and within our budget.
Our industry is cyclical, and from time to time there is a shortage of drilling rigs, equipment, supplies or qualified personnel. During these periods, the costs and delivery times of rigs, equipment, and supplies are substantially greater. As a result of historically strong prices of gas, the demand for field services has risen, and the costs of these services are increasing. If the availability or high cost of drilling rigs, equipment, supplies, or qualified personnel were particularly severe in the areas where we operate, we could be materially and adversely affected.
Hedging transactions may limit our potential gains.
In order to manage our interest rate exposure and natural gas price risks, we have entered into interest rate swaps and natural gas price hedging arrangements with respect to a portion of our expected production. We will most likely enter into additional hedging transactions in the future. While intended to reduce the effects of volatile interest rates and natural gas prices, such transactions may limit our potential gains or increase our potential losses.
We do not insure against all potential risks. We may incur substantial losses and be subject to substantial liability claims as a result of our natural gas operations.
We maintain insurance for some, but not all, of the potential risks and liabilities associated with our business. For some risks, we may not obtain insurance if we believe the cost of available insurance is excessive relative to the risks presented. As a result of market conditions, premiums and deductibles for certain insurance policies can increase substantially, and in some instances, certain insurance may become unavailable or available only for reduced amounts of coverage. As a result, we may not be able to renew our existing insurance policies or procure other desirable insurance on commercially reasonable terms, if at all. Although we maintain insurance at levels we believe are appropriate and consistent with industry practice, we are not fully insured against all risks, including drilling and completion risks that are generally not recoverable from third parties or insurance. In addition, pollution and environmental risks generally are not fully insurable. Losses and liabilities from uninsured and underinsured events and delay in the payment of insurance proceeds could have a material adverse effect on our financial condition and results of operations.
35
Table of Contents
Risks Related to Our Capital Stock
Our common stock has experienced, and may continue to experience, price volatility and a low trading volume.
The trading price of our common stock has been and may continue to be subject to large fluctuations, which may result in losses to investors. Our stock price may increase or decrease in response to a number of events and factors, including:
| • | results of our drilling or the results of drilling by offset operators; |
| • | global economic recession; |
| • | trends in our industry and the markets in which we operate; |
| • | changes in the market price of the natural gas we sell; |
| • | changes in financial estimates and recommendations by securities analysts; |
| • | acquisitions and financings; |
| • | quarterly variations in operating results; |
| • | operating and stock price performance of other companies that investors may deem comparable to us; and |
| • | issuances, purchases or sales of blocks of our common stock. |
This volatility may adversely affect the price of our common stock regardless of our operating performance.
Shares eligible for future sale may cause the market price for our common stock to drop significantly, even if our business is doing well.
If our existing shareholders sell our common stock in the market, or if there is a perception that significant sales may occur, the market price of our common stock could drop significantly. In such case, our ability to raise additional capital in the financial markets at a time and price favorable to us might be impaired. In addition, our board of directors has the authority to issue additional shares of our authorized but unissued common stock without the approval of our shareholders, subject to certain limitations under the rules of the exchange on which our common stock is listed. Additional issuances of our common stock, or securities convertible into common stock, would dilute the ownership percentage of existing shareholders and may dilute the earnings per share of our common stock.
We have not previously paid dividends on our common stock and we do not anticipate doing so in the foreseeable future.
We have not in the recent past paid, and do not anticipate paying in the foreseeable future, cash dividends on our common stock. Our outstanding revolving bank credit agreement contains covenants that restrict our ability to pay dividends on our common stock. Additionally, any future decision to pay a dividend and the amount of any dividend paid, if permitted, will be made at the discretion of our board of directors.
We may not be able to maintain compliance with NASDAQ’s continued listing requirements.
We must comply with NASDAQ’s continued listing requirements in order to maintain our listing on NASDAQ’s Global Market. These continued listing standards include requirements addressing the number of shares publicly held, market value of publicly held shares, stockholder’s equity, number of round lot holders, and a $1.00 minimum closing bid price. Our stock price has traded below the $1.00 minimum bid price since March 2, 2010. If a company’s closing bid price is below $1.00 for 30 consecutive trading days, it receives a
36
Table of Contents
notice from NASDAQ that it will be subject to delisting if it fails to regain compliance within 180 days following the date of the notice letter by maintaining a minimum bid closing price of at least $1.00 for ten consecutive business days. If the closing bid price for our common stock is below $1.00 per share for 30 consecutive days or if we in the future fail to meet the other requirements for continued listing on the NASDAQ Global Market, then our common stock could be delisted. On March 30, 2010, the Company’s stock closed at a bid price of $0.89.
In order to regain compliance with the $1.00 minimum bid requirement, we would have to attain a stock price of at least $1.00 per share for a minimum of 10 consecutive business days prior to the expiration of 180 days from the date of the notice letter from NASDAQ, but the NASDAQ may in its discretion require that we maintain a bid price of at least $1.00 per share for a period in excess of 10 consecutive business days.
The delisting of our common stock would adversely affect the market liquidity for our common stock, the per share price of our common stock and impair our ability to raise capital that may be needed for future operations. Delisting from NASDAQ could also have other negative results, including the potential loss of confidence by customers and employees, the loss of institutional investor interest and fewer business development opportunities. In addition, we would be subject to a number of restrictions regarding the registration and qualification of our common stock under federal and state securities laws.
If our common stock is not eligible for quotation on another market or exchange, trading of our common stock could be conducted in the over-the-counter market or on an electronic bulletin board established for unlisted securities such as the Pink Sheets or the OTC Bulletin Board. In such event, it could become more difficult to dispose of, or obtain accurate quotations for the price of our common stock, and there would likely also be a reduction in our coverage by security analysts and the news media, which could cause the price of our common stock to decline further.
If our stock price trades below $1.00 for a sustained period and we face delisting on the NASDAQ, we may seek to implement a reverse stock split. However, reverse stock splits frequently result in a loss in stockholder value as the actual post-split price is often lower than the pre-split price, adjusted for the split. Accordingly, a reverse stock split may not solve the listing requirement deficiency even if implemented.
Item 1B. Unresolved Staff Comments
None.
From time to time we are a party to litigation in the normal course of business. While the outcome of lawsuits or other proceedings against us cannot be predicted with certainty, management does not believe that the adverse effect on our financial condition, results of operations or cash flows, if any, will be material.
CNX Antitrust Action
We filed a complaint against CNX Gas Company LLC (“CNX”) and Island Creek Coal Company (“Island Creek”), an affiliate of CNX, in the Circuit Court of Tazewell County, Virginia on February 14, 2007, in which we sought damages arising from alleged violations of the Virginia Antitrust Act, tortious interference with contractual relations with third parties and statutory and common law conspiracy. The suit sought compensatory and consequential damages for alleged violations of the Virginia Antitrust Act, including alleged anticompetitive efforts of CNX to dominate and maintain its control over the market for the production and transportation of coalbed methane gas from the Oakwood Field in Buchanan County, Virginia and for CNX’s alleged efforts to conspire and act in concert with Island Creek and others to dominate and maintain control over the market for the production and transportation of coalbed methane gas from the Oakwood Field in violation of the Virginia Antitrust Act and Virginia statutory and common law. The suit also alleged CNX’s intentional interference with
37
Table of Contents
our existing and prospective third-party business relationships in an attempt to harm us and improve CNX’s position and corporate and financial interests. In December 2007, we filed an amended petition that restated with specificity our claims against CNX and Island Creek, and added Cardinal States Gathering Company and CONSOL Energy Inc., the ultimate parent of the other defendants, as defendants. On June 3, 2009, the Court ruled on the demurrers to our claims that had been filed by CNX, denying CNX’s demurrers with respect to four of our five state-law antitrust claims for monopolization and attempted monopolization and upholding only the demurrers to one antitrust theory and the claims under Virginia law for tortious interference. As a result of this ruling, we are proceeding to full discovery and moving towards a trial on the merits, seeking $385.6 million in actual damages, with the possibility for trebling of those damages under the statute, as well as injunctive relief to prevent CNX and the other defendants from continuing these alleged anticompetitive activities. Although we remain open to a commercially reasonable settlement, we intend to pursue discovery and trial in this matter.
Environmental and Regulatory
As of December 31, 2009, there were no known environmental or other regulatory matters related to our operations that are reasonably expected to result in a material liability to us.
38
Table of Contents
PART II
| Item 5. | Market for Registrant’s Common Equity, Related Stockholder Matters and Issuer Purchases of Equity Securities. |
Common Stock
Our common stock is listed on the NASDAQ Global Market under the symbol “GMET”. The table below shows the high and low closing prices of our common stock for the periods indicated.
| High | Low | |||||
| Fiscal Year 2006: |
||||||
| Quarter ended September 30, 2006 |
$ | 11.71 | $ | 9.40 | ||
| Quarter ended December 31, 2006 |
$ | 11.25 | $ | 8.66 | ||
| Fiscal Year 2007: |
||||||
| Quarter ended March 31, 2007 |
$ | 10.34 | $ | 7.73 | ||
| Quarter ended June 30, 2007 |
$ | 9.67 | $ | 7.26 | ||
| Quarter ended September 30, 2007 |
$ | 7.75 | $ | 5.09 | ||
| Quarter ended December 31, 2007 |
$ | 5.49 | $ | 4.86 | ||
| Fiscal Year 2008: |
||||||
| Quarter ended March 31, 2008 |
$ | 7.28 | $ | 4.21 | ||
| Quarter ended June 30, 2008 |
$ | 9.52 | $ | 6.38 | ||
| Quarter ended September 30, 2008 |
$ | 9.40 | $ | 5.04 | ||
| Quarter ended December 31, 2008 |
$ | 5.32 | $ | 1.36 | ||
| Fiscal Year 2009: |
||||||
| Quarter ended March 31, 2009 |
$ | 1.81 | $ | 0.54 | ||
| Quarter ended June 30, 2009 |
$ | 1.62 | $ | 0.57 | ||
| Quarter ended September 30, 2009 |
$ | 1.75 | $ | 0.79 | ||
| Quarter ended December 31, 2009 |
$ | 2.29 | $ | 1.08 | ||
Approximately 1,500 stockholders of record as of December 31, 2009 held our common stock. In many instances, a registered stockholder is a broker or other entity holding shares in street name for one or more customers who beneficially own the shares. Holders of our common stock are entitled to receive dividends if, as and when such dividends are declared by our board out of assets legally available therefore after payment of dividends required to be paid on shares of preferred stock, if any. We have not declared or paid any dividends on our shares of common stock and do not currently anticipate paying any dividends on our shares of common stock in the future. Currently our plan is to retain any future earnings for use in the operations and expansion of our natural gas exploration business. Our revolving credit facility prohibits us from paying any cash dividends.
Changes in Securities, Use of Proceeds and Issuer Purchases of Equity Securities
We did not purchase any of our equity securities during the fourth quarter of 2009. In addition, we did not sell any of our equity securities which were not registered under the Securities Act of 1933, as amended, during the fourth quarter of 2009.
39
Table of Contents
Equity Compensation Plan Information
The following table summarizes information regarding the number of shares of our common stock that are available for issuance under all of our existing equity compensation plans as of December 31, 2009.
| Plan Category |
(a) Number of securities to be issued upon exercise of outstanding options, warrants and rights |
(b) Weighted-average exercise price of outstanding options, warrants and rights |
(c) Number of securities remaining available for future issuance under equity compensation plans —excluding securities reflected in column(a) |
|||||
| Equity compensation plans approved by security holders |
2,398,546 | $ | 3.75 | 2,152,195 | (1) | |||
| Equity compensation plans not approved by security holders |
— | — | — | |||||
| Total |
2,398,546 | $ | 3.75 | 2,152,195 | ||||
| (1) | A total of 4,000,000 shares of our common stock were reserved for awards to be granted under the GeoMet, Inc. 2006 Long-Term Incentive Plan, which was originally adopted and approved by our stockholders in 2006 and amended in 2009. In conjunction with the original approval of the 2006 Plan, no additional awards will be granted under our 2005 Plan; however, we will continue to issue shares of our common stock upon exercise of awards that were previously granted. The 2,152,195 shares of common stock available for future issuance does not include 242,448 shares that were reserved but not granted under our 2005 Plan. |
40
Table of Contents
Performance Graph
The following performance graph and related information shall not be deemed “soliciting material” or to be “filed” with the SEC, nor shall such information be incorporated by reference into any future filing under the Securities Act of 1933 or Securities Exchange Act of 1934, each as amended, except to the extent that we specifically incorporate the performance graph by reference into such filing.
The following graph compares the cumulative total stockholder return on our common stock from July 28, 2006, the date our common stock was listed on the Nasdaq Global Market, through December 31, 2009 and compares it with the cumulative total return on the Russell 2000 and the S&P Oil and Gas Exploration and Production Index. The comparison assumes $100 was invested on July 28, 2006 and assumes reinvestment of dividends, if any. The comparisons in this table are not intended to forecast or be indicative of possible future performance of our stock.
COMPARISON OF CUMULATIVE TOTAL RETURN
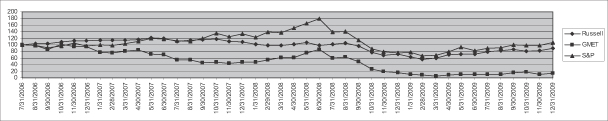
| 7/28/06 | 12/31/06 | 12/31/07 | 12/31/08 | 12/31/09 | ||||||
| GeoMet, Inc. |
100.00 | 94.80 | 47.40 | 15.68 | 13.31 | |||||
| Russell 2000 Index |
100.00 | 112.52 | 109.43 | 71.35 | 89.34 | |||||
| S&P Oil & Gas |
100.00 | 97.01 | 132.82 | 75.92 | 106.40 |
41
Table of Contents
Item 6. Selected Financial Data
The following table shows our selected historical consolidated financial and operating data as of and for each of the last five years ended December 31, 2009. The selected historical consolidated audited financial data as of December 31 2009 and 2008 and for each of the three years in the period ended December 31, 2009 are derived from our consolidated audited financial statements included herein. The selected historical consolidated audited financial data as of December 31, 2007, 2006 and 2005 and for each of the two years in the period ended December 31, 2006 was derived from our consolidated audited financial statements which are not included herein. The table reflects a four-for-one common stock split in 2006 and prior periods have been adjusted for the stock split. You should read the following data in conjunction with “Management’s Discussion and Analysis of Financial Condition and Results of Operations” and our consolidated audited financial statements and related notes included elsewhere in this annual report where there is additional disclosure regarding the information in the following table. Our historical results are not necessarily indicative of the results that may be expected in future periods.
| 2009 | 2008 | 2007 | 2006 | 2005 | ||||||||||||||||
| STATEMENT OF OPERATIONS (in thousands): |
||||||||||||||||||||
| Total revenues |
$ | 30,964 | $ | 69,094 | $ | 50,984 | $ | 44,947 | $ | 41,980 | ||||||||||
| Realized (gains) losses on derivative contracts |
$ | (10,694 | ) | $ | 500 | $ | (3,895 | ) | $ | (1,118 | ) | $ | 7,473 | |||||||
| Unrealized losses (gains) from the change in market value of open derivative contracts |
$ | 3,995 | $ | (4,993 | ) | $ | 3,007 | $ | (16,877 | ) | $ | 12,059 | ||||||||
| Impairment of gas properties |
$ | 257,288 | $ | 50,734 | — | — | — | |||||||||||||
| Total operating expenses |
$ | 291,093 | $ | 87,590 | $ | 37,852 | $ | 13,678 | $ | 41,149 | ||||||||||
| Operating (loss) income from continuing operations |
$ | (260,129 | ) | $ | (18,496 | ) | $ | 13,132 | $ | 31,269 | $ | 831 | ||||||||
| Interest expense, net of amounts capitalized |
$ | (5,174 | ) | $ | (4,783 | ) | $ | (5,130 | ) | $ | (3,130 | ) | $ | (3,895 | ) | |||||
| (Loss) income before income taxes, minority interest, discontinued operations and cumulative effect of change in accounting principle |
$ | (265,275 | ) | $ | (23,199 | ) | $ | 7,983 | $ | 28,162 | $ | (3,008 | ) | |||||||
| Income tax (benefit) expense |
$ | (98,142 | ) | $ | (712 | ) | $ | 2,988 | $ | 10,866 | $ | (993 | ) | |||||||
| (Loss) income before minority interest, discontinued operations and cumulative effect of change in accounting principle, net of income tax |
$ | (167,134 | ) | $ | (22,487 | ) | $ | 4,995 | $ | 17,296 | $ | (2,015 | ) | |||||||
| Discontinued operations, net of income tax |
— | — | $ | 174 | $ | 23 | — | |||||||||||||
| Minority interest, net of income tax |
— | — | — | $ | (23 | ) | $ | 442 | ||||||||||||
| Income from discontinued operations |
— | — | $ | 174 | — | $ | 442 | |||||||||||||
| Net (loss) income |
$ | (167,134 | ) | $ | (22,487 | ) | $ | 5,169 | $ | 17,296 | $ | (1,573 | ) | |||||||
| EARNINGS PER COMMON SHARE (in dollars): |
||||||||||||||||||||
| (Loss) Income from continuing operations |
||||||||||||||||||||
| Basic |
$ | (4.28 | ) | $ | (0.58 | ) | $ | 0.13 | $ | 0.49 | $ | (0.07 | ) | |||||||
| Diluted |
$ | (4.28 | ) | $ | (0.58 | ) | $ | 0.13 | $ | 0.48 | $ | (0.07 | ) | |||||||
| Discontinued operations |
||||||||||||||||||||
| Basic |
— | — | — | — | $ | 0.02 | ||||||||||||||
| Diluted |
— | — | — | — | $ | 0.02 | ||||||||||||||
| Net (loss) income per common share |
||||||||||||||||||||
| Basic |
$ | (4.28 | ) | $ | (0.58 | ) | $ | 0.13 | $ | 0.49 | $ | (0.06 | ) | |||||||
| Diluted |
$ | (4.28 | ) | $ | (0.58 | ) | $ | 0.13 | $ | 0.48 | $ | (0.06 | ) | |||||||
| BALANCE SHEET DATA (in thousands, at period end): |
||||||||||||||||||||
| Working capital (deficit)(1) |
$ | (35 | ) | $ | (1,441 | ) | $ | (2,063 | ) | $ | (1,625 | ) | $ | (7,368 | ) | |||||
| Total assets (including impairment of gas properties) |
$ | 160,928 | $ | 377,600 | $ | 378,677 | $ | 335,195 | $ | 247,909 | ||||||||||
| Long-term debt |
$ | 119,996 | $ | 117,118 | $ | 96,730 | $ | 60,832 | $ | 99,926 | ||||||||||
| Stockholders’ equity |
$ | 26,908 | $ | 192,432 | $ | 218,676 | $ | 210,007 | $ | 95,422 | ||||||||||
| Cash flow data (in thousands): |
||||||||||||||||||||
| Net cash provided by operating activities |
$ | 8,518 | $ | 32,958 | $ | 17,487 | $ | 21,472 | $ | 12,433 | ||||||||||
| Net cash used in investing activities |
$ | (12,696 | ) | $ | (52,719 | ) | $ | (53,832 | ) | $ | (78,669 | ) | $ | (59,661 | ) | |||||
| Net cash provided by financing activities |
$ | 2,888 | $ | 20,493 | $ | 36,191 | $ | 58,086 | $ | 44,906 | ||||||||||
| Capital expenditures |
$ | 12,566 | $ | 52,797 | $ | 54,026 | $ | 79,061 | $ | 59,817 | ||||||||||
| OTHER DATA: |
||||||||||||||||||||
| Net sales volume (Bcf) |
7.5 | 7.5 | 7.1 | 6.2 | 4.6 | |||||||||||||||
| Average natural gas sales price ($ per Mcf) |
$ | 4.05 | $ | 9.17 | $ | 6.97 | $ | 7.19 | $ | 9.06 | ||||||||||
| Average natural gas sales price ($ per Mcf) realized(2) |
$ | 5.47 | $ | 9.10 | $ | 7.52 | $ | 7.37 | $ | 7.43 | ||||||||||
| Total production expenses ($ per Mcf) |
$ | 2.67 | $ | 2.87 | $ | 2.86 | $ | 2.75 | $ | 2.81 | ||||||||||
| Depletion of gas properties($ per Mcf) |
$ | 1.51 | $ | 1.35 | $ | 1.24 | $ | 1.26 | $ | 1.06 | ||||||||||
| Estimated proved reserves (Bcf)(3)(4) |
209.3 | 319.5 | 350.2 | 325.7 | 262.5 | |||||||||||||||
| Standardized measure of discounted future net cash flows ($ millions) |
$ | 149.2 | $ | 310.3 | $ | 495.9 | $ | 359.5 | $ | 632.7 | ||||||||||
| Non-GAAP Measures:(5) |
||||||||||||||||||||
| PV-10 ($ millions) |
$ | 97.7 | $ | 351.9 | $ | 662.8 | $ | 525.6 | $ | 880.2 | ||||||||||
42
Table of Contents
| (1) | Working capital (deficit) is defined as current assets less current liabilities and is unaudited. |
| (2) | Average realized price includes the effects of realized gains on derivative contracts. |
| (3) | Based on the reserve reports prepared by D&M, independent petroleum engineers, at each period end. Natural gas prices are volatile and may fluctuate widely affecting significantly the calculation of estimated net cash flows. Refer to “Risk Factors” for a more complete discussion. |
| (4) | There was a significant revision of reserves at September 30, 2009 due in large part to continued under-performance in the Gurnee field discussed in Item 7 below. |
| (5) | See reconciliation of non-GAAP financial measures. |
Reconciliation of Non-GAAP Financial Measures
The following table shows our reconciliation of our PV-10 to our standardized measure of discounted future net cash flows (the most directly comparable measure calculated and presented in accordance with GAAP). PV-10 is our estimate of the present value of future net revenues from estimated proved natural gas reserves after deducting estimated production and ad valorem taxes, future capital costs and operating expenses, but before deducting any estimates of future income taxes. The estimated future net revenues are discounted at an annual rate of 10% to determine their “present value.” We believe PV-10 to be an important measure for evaluating the relative significance of our CBM gas properties and that the presentation of the non-GAAP financial measure of PV-10 provides useful information to investors because it is widely used by professional analysts and sophisticated investors in evaluating oil and gas companies. Because there are many unique factors that can impact an individual company when estimating the amount of future income taxes to be paid, we believe the use of a pre-tax measure is valuable for evaluating our company. We believe that most other companies in the oil and gas industry calculate PV-10 on the same basis. PV-10 should not be considered as an alternative to the standardized measure of discounted future net cash flows as computed under GAAP.
| As of December 31, | ||||||||||||||||||||
| 2009 | 2008 | 2007 | 2006 | 2005 | ||||||||||||||||
| (In thousands) | ||||||||||||||||||||
| Future cash inflows |
$ | 849,379 | $ | 1,865,131 | $ | 2,654,214 | $ | 1,858,104 | $ | 2,536,279 | ||||||||||
| Less: Future production costs |
426,105 | 734,911 | 725,272 | 501,956 | 463,416 | |||||||||||||||
| Less: Future development costs |
68,321 | 105,737 | 106,356 | 101,777 | 76,297 | |||||||||||||||
| Future net cash flows |
354,953 | 1,024,483 | 1,822,586 | 1,254,371 | 1,996,566 | |||||||||||||||
| Less: 10% discount factor |
257,287 | 672,534 | 1,159,780 | 728,739 | 1,116,413 | |||||||||||||||
| PV-10 |
97,666 | 351,949 | 662,806 | 525,632 | 880,153 | |||||||||||||||
| Less: Undiscounted income taxes |
(157,820 | ) | (423,795 | ) | (724,399 | ) | (410,391 | ) | (579,689 | ) | ||||||||||
| Plus: 10% discount factor |
209,352 | 382,193 | 557,461 | 244,245 | 332,201 | |||||||||||||||
| Discounted income taxes |
51,532 | (41,602 | ) | (166,938 | ) | (166,146 | ) | (247,488 | ) | |||||||||||
| Standardized measure of discounted future net cash flows |
$ | 149,198 | $ | 310,347 | $ | 495,868 | $ | 359,486 | $ | 632,665 | ||||||||||
43
Table of Contents
Item 7. Management’s Discussion and Analysis of Financial Condition and Results of Operations
The following discussion and analysis of our financial condition and results of operations should be read in conjunction with the financial statements and the related notes and other information included elsewhere in this report.
Overview
GeoMet, Inc. is an independent energy company primarily engaged in the exploration for and development and production of natural gas from coal seams (“coalbed methane” or “CBM”) and non-conventional shallow gas. We were originally founded as a consulting company to the coalbed methane industry in 1985 and have been active as an operator and developer of coalbed methane properties since 1993. Our principal operations and producing properties are located in the Cahaba Basin in Alabama and the central Appalachian Basin in West Virginia and Virginia. We also control additional coalbed methane and oil and gas development rights, principally in Alabama, British Columbia, Virginia, and West Virginia. As of December 31, 2009, we control a total of approximately 187,000 net acres of coalbed methane and oil and gas development rights.
We primarily explore for, develop, and produce CBM and non-conventional shallow gas. Our objective is to create the premier non-conventional shallow gas company in North America (emphasizing coalbed methane) while maximizing stockholder value through the efficient investment of capital to increase reserves, production, cash flow and earnings. We believe that substantial expertise and experience is required to develop, produce, and operate coalbed methane and non-conventional shallow gas fields in an efficient manner. We believe that the inherent geologic and production characteristics of coalbed methane and non-conventional shallow gas offer certain operational advantages compared to conventional gas production.
On March 29, 2010, we executed commitment letters with NGP Capital Resources Company, or NGPC, and North Shore Energy, LLC, which we refer to as North Shore, an affiliate of our largest stockholder, whereby NGPC and North Shore have agreed to the preliminary terms of a commitment to purchase up to $20 million each ($40 million in the aggregate) of the Company’s convertible preferred stock in the event that a proposed rights offering of the convertible preferred stock is not fully subscribed by our common stockholders. Under the terms of the proposed $40 million rights offering, we would distribute, at no charge to the holders of our common stock, rights to purchase up to an aggregate of 4,000,000 new shares of convertible preferred stock at a subscription price of $10.00 per share. The number of rights to be distributed per share of common stock would be determined after our board of directors approves and sets a record date for the rights offering. Any rights offering will be made only by means of a prospectus supplement and accompanying prospectus to our effective registration statement on Form S-3 (Registration No. 333-163193). In the event that we are able to complete the proposed rights offering, we intend to use the net proceeds to repay a portion of our outstanding indebtedness. We cannot assure that we will be successful in completing the proposed rights offering on the terms outlined above, and any discussion of the proposed rights offering in this filing on Form 10-K does not constitute an offer or the solicitation of an offer of the Company’s securities. Our Board of Directors approved the execution of the commitment letters after its receipt of a recommendation to do so by a Special Committee comprised of two independent directors with no affiliation with our largest stockholder. The Special Committee retained the services of independent legal counsel and a financial advisor in evaluating and formulating its recommendation to the Board.
Effective March 30, 2010, the parties to the revolving credit facility agreement unanimously approved the Third Amendment to the revolving credit facility (“Third Amendment”) as summarized below:
| • | The maturity date of the revolving credit facility was extended four months to May 6, 2011 pursuant to a request by the Company. |
| • | Pursuant to a request by the Company, the borrowing base was reduced to $123.0 million and the bank group agreed that (1) the next borrowing determination would be as of June 15, 2010, and (2) the bank group agreed not to call for a determination of the borrowing base prior to that date. |
44
Table of Contents
| • | The minimum current ratio, adjusted for unrealized (gains) losses on derivative contracts and borrowing availability under the revolving credit agreement, is adjusted to .80 to 1 solely for the quarter ended March 31, 2010. |
| • | The outstanding balances on the revolving credit facility will bear interest at the Company’s option of either (a) the bank’s adjusted base rate, which is the greatest of (i) the bank’s base rate, (ii) the Federal Funds Rate plus 0.5%, or (iii) the one-month LIBOR rate plus 1%, plus a margin of 2.625%, or (b) the adjusted LIBOR rate, plus a margin of 3.50%. |
We currently have limited borrowing availability under our revolving credit facility, which matures on May 6, 2011 and we have no assurances that our lenders will extend the maturity date. Accordingly, we will continue to explore various alternatives for additional financing for the Company in order to reduce our debt and provide additional capital for growth. These alternatives may include private or public offerings of debt or equity securities or the sale of assets. The terms, timing and structure of any such financing or sale will depend on several factors, including market conditions, execution risk, timing, possible dilution of existing shareholders and relative cost of the various financing alternatives. There can be no assurance that we will be able to obtain debt or equity financing or complete an asset sale on terms favorable to us, or at all.
Our ability to successfully leverage our competitive strengths and execute our strategy depends upon many factors and is subject to a variety of risks. For example, our ability to drill on our properties and fund our capital budgets depends, to a large extent, upon our ability to generate cash flow from operations at or above current levels and maintain borrowing capacity at or near current levels under our revolving credit facility, or the availability of future debt and equity financing at attractive prices. Changes in natural gas prices affect both our cash flows and the value of our proved natural gas reserves or our ability to replace production through drilling activities. Many other factors beyond our control, including a material adverse change in our proved natural gas reserves due to factors other than gas pricing changes, our ability to transport our gas to markets, a change in drilling costs, lower than expected production rates, and other factors may adversely affect our ability to fund our anticipated capital expenditures, pursue property acquisitions, and compete for qualified personnel.
Impact of Current Credit Market Conditions and Decreasing Natural Gas Prices
Changes in natural gas prices significantly affect our revenues, financial condition, cash flows, natural gas reserves and borrowing capacity. Markets for natural gas have historically been volatile and we expect this trend to continue. Prices for natural gas may fluctuate in response to changes in supply and demand, market uncertainty, seasonal, political and other factors beyond our control. We are unable to accurately predict the prices we will receive for our natural gas. Accordingly, any significant or sustained declines in natural gas prices will materially adversely affect our financial condition, operating results, liquidity and ability to obtain financing. Declining or prolonged low natural gas prices may also result in non-compliance with the covenants in our revolving credit facility agreement and could result in a lower determination of our borrowing base. Although we intend to cure any non-compliance with covenants in our revolving credit facility in the event they occur, no assurance can be given that we will be able to cure such non-compliance. Lower natural gas prices also may reduce the amount of natural gas that we can produce economically. Further declines in natural gas prices could have a material adverse effect on the estimated value and estimated quantities of our proved natural gas reserves, our ability to fund our operations and our financial condition, cash flow, results of operations and access to capital. Our capital expenditure budgets are highly dependent on future natural gas prices.
45
Table of Contents
Proved reserve estimates are based on the unweighted arithmetic average prices on the first day of each month, adjusted for regional price differentials, for the 12-month period ended December 31, 2009. The average Henry Hub spot market price was $3.87 per Mcf, resulting in a natural gas price of $4.06 per Mcf when adjusted for regional price differentials. Impairments recorded to gas properties for the year ended December 31, 2009, were:
| United States | Canada | Total | |||||||||
| Impairment of gas properties |
$ | 255,401,961 | $ | 1,886,296 | $ | 257,288,257 | |||||
| Deferred income tax benefit |
(97,627,986 | ) | — | (97,627,986 | ) | ||||||
| Impairment of gas properties, net of tax |
$ | 157,773,975 | $ | 1,886,296 | $ | 159,660,271 | |||||
Impairments recorded solely due to the new SEC rules that became effective December 31, 2009, and are included above were:
| United States | Canada | Total | |||||||||
| Impairment of gas properties |
$ | 20,847,742 | $ | — | $ | 20,847,742 | |||||
| Deferred income tax benefit |
(8,028,207 | ) | — | (8,028,207 | ) | ||||||
| Impairment of gas properties, net of tax |
$ | 12,819,535 | $ | — | $ | 12,819,535 | |||||
The natural gas price used in the valuation of natural gas reserves as of December 31, 2008 was $5.84 per Mcf ($5.71 Henry Hub spot market price for December 31, 2008, adjusted for regional price differentials). Impairments recorded to gas properties for the year ended December 31, 2008, were:
| United States | Canada | Total | |||||||||
| Impairment of gas properties |
$ | 32,047,484 | $ | 18,686,273 | $ | 50,733,757 | |||||
| Deferred income tax benefit |
(12,087,937 | ) | — | (12,087,937 | ) | ||||||
| Impairment of gas properties, net of tax |
$ | 19,959,547 | $ | 18,686,273 | $ | 38,645,820 | |||||
Holding all factors constant other than natural gas prices, a 10% and 20% decline in the prices used at December 31, 2009 would have resulted in an additional ceiling test impairment of approximately $26.0 million and $52.1 million, respectively, of our full cost pool.
We believe that we are taking the necessary actions to position ourselves to continue operations in the current credit and commodity market environment with premium natural gas pricing due to the geographic location of our properties, natural gas hedges, and long-lived reserves with shallow annual production decline rates.
We expect to fund our capital expenditure budget for 2010 from our operating cash flows. If our cash flows are not sufficient to fund all of our planned capital projects, we expect to reduce our capital budget accordingly. The amount and timing of our expenditures are subject to change based upon market conditions, results of operations and other factors. We routinely adjust our capital expenditure budget in response to changes in natural gas prices, drilling and acquisition costs, cash flow, drilling results and borrowing base redeterminations under our revolving credit facility.
Decrease in Proved Reserves
Our proved natural gas reserves as of December 31, 2009, as estimated by DeGolyer and MacNaughton (“D&M”), independent petroleum engineers, totaled approximately 209 Bcf, a decrease of approximately 1%, after production, from the approximate 213 Bcf of proved natural gas reserves at September 30, 2009, as audited by D&M, and a decrease, after production, of 32% from the approximate 320 Bcf of proved natural gas reserves at December 31, 2008. Proved reserve estimates are based on the unweighted arithmetic average prices on the first day of each month, adjusted for regional price differentials, for the 12-month period ended December 31, 2009. The average Henry Hub spot market price was $3.87 per Mcf, resulting in a natural gas price of $4.06 per Mcf when adjusted for regional price differentials. All prices and costs associated with operating wells were held constant in accordance with the amended SEC guidelines which were effective for financial statements for
46
Table of Contents
periods ending on or after December 31, 2009. The natural gas price used in the valuation of natural gas reserves as of September 30, 2009 was $4.43 per Mcf ($4.29 per Mcf market price for October 30, 2009, adjusted for regional price differentials), and as of December 31, 2008 was $5.84 per Mcf ($5.71 per Mcf Henry Hub spot market price for December 31, 2008, adjusted for regional price differentials).
Our proved reserves were 100% from coalbed methane reservoirs and were 75% developed. Approximately 62% of total year-end 2009 proved reserves are in the Pond Creek and Lasher fields in West Virginia and Virginia and 38% are in the Gurnee field in Alabama. The present value of proved reserves discounted at ten percent was approximately $98 million at December 31, 2009 as compared to $352 million at year-end 2008. Downward revisions, due in large part to under-performance in the Gurnee field, totaled approximately 103 Bcf, of which 101 Bcf were revisions reported as of September 30, 2009 in our filing on Form 10-Q. Our proved reserves at December 31, 2009 were also impacted by lower natural gas prices and costs in 2009. We were able to limit the effect of lower natural gas prices through our ongoing cost reduction strategy, which we implemented in April 2009.
Natural gas reserve engineering requires subjective estimates of underground accumulations of natural gas and assumptions concerning future natural gas prices, production levels, and operating and development costs. Coalbed methane-producing natural gas reservoirs generally are characterized by an initial period of inclining production rates as pressure in the reservoir decreases, followed by declining production rates that vary depending upon reservoir characteristics and other factors. These decline rates, however, are commonly lower than what is generally experienced with non-coalbed methane wells.
Initial estimates of future production in the Gurnee field were generally consistent with comparable coalbed methane-producing natural gas reservoirs in the adjacent Black Warrior Basin, which produces from the same Pottsville coal formations directly across an anticline. However, the actual performance of our wells in the Gurnee field has not demonstrated the characteristic initial inclining production rates common to coalbed methane reservoirs. D&M lowered estimates of future production in the Gurnee field in connection with the preparation of its reports on our proved reserves as of December 31, 2007 and December 31, 2008. Now that the portion of the field east of the Cahaba River is substantially developed, and based upon continued monitoring of production results of our wells there, we concluded that actual production results did not support, with reasonable certainty, prior estimates of future production for the Gurnee field. Consequently, effective September 30, 2009, we further reduced estimates of future production, eliminating all projected inclines in current production rates (other than those wells that have clearly demonstrated actual inclines in production) and have projected future production rates based on the current production performance of individual wells in the field.
Trends
Our business is influenced by trends that affect the natural gas industry. In particular, declines in natural gas prices and recent economic trends have adversely affected our business, liquidity, results of operations and financial condition.
Beginning in early 2009, we began implementing countermeasures in response to the above referenced trends in order to enhance our ability to execute our business strategy. These countermeasures included reducing costs, increasing hedging to reduce exposure to volatile natural gas prices and limiting capital spending. We are evaluating additional measures in light of the current credit and commodity markets include selling assets, entering into joint venture agreements with industry partners to reduce our capital outlays, or alternate forms of financing.
The natural gas industry is capital intensive. We have made, and anticipate that we will continue to make, substantial capital expenditures in the exploration for, development and acquisition of natural gas reserves. Historically, our capital expenditures have been financed primarily with internally generated cash from operations, proceeds from bank borrowings, and industry joint venture arrangements. The continued availability of these capital sources depends upon a number of variables, including proved reserves, production from existing wells, the sales prices for natural gas, our ability to acquire, locate and produce new reserves, and events occurring within the global capital markets.
47
Table of Contents
Critical Accounting Policies
Our discussion and analysis of our financial condition and results of operations are based upon our consolidated financial statements that have been prepared in accordance with GAAP. The preparation of our financial statements requires us to make assumptions and estimates that affect the reported amounts of assets and liabilities and disclosure of contingent assets and liabilities at the dates of the financial statements and the reported amounts of revenues and expenses during the reporting periods. We base our estimates on historical experiences and various other assumptions that we believe are reasonable; however, actual results may differ. Our significant accounting policies are described in Note 2 to our consolidated audited financial statements included elsewhere in this annual report. We believe the following critical accounting policies involve significant judgments, estimates, and a high degree of uncertainty in the preparation of our financial statements:
Reserves. Our most significant financial estimates are based on estimates of proved gas reserves. Proved gas reserves represent estimated quantities of gas that geological and engineering data demonstrate, with reasonable certainty, to be recoverable in future years from known reservoirs under economic and operating conditions existing at the time the estimates were made. There are numerous uncertainties inherent in estimating quantities of proved reserves and in projecting future revenues, rates of production, and timing of development expenditures, including many factors beyond our control. The estimation process relies on assumptions and interpretations of available geologic, geophysical, engineering, and production data and, the accuracy of reserve estimates is a function of the quality and quantity of available data, engineering and geologic interpretation, and judgment. In addition, as a result of changing market conditions, natural gas prices and future development costs will change from year to year, causing estimates of proved reserves to also change. Estimates of proved reserves are key components of our most significant financial estimates involving our unevaluated properties, our rate for recording depreciation, depletion and amortization and our full cost ceiling limitation. Our reserves are fully engineered on an annual basis by D&M, independent petroleum engineers.
Gas Properties—The method of accounting for gas properties determines what costs are capitalized and how these costs are ultimately matched with revenues and expenses. We use the full cost method of accounting for gas properties as prescribed by the United States Securities and Exchange Commission (“SEC”). Under this method, all direct costs and certain indirect costs associated with the acquisition, exploration, and development of our gas properties are capitalized and segregated into U.S. and Canadian cost centers.
Gas properties are depleted using the units-of-production method. The depletion expense is significantly affected by the unamortized historical and future development costs and the estimated proved gas reserves.
Estimation of proved gas reserves relies on professional judgment and use of factors that cannot be precisely determined. Subsequent proved reserve estimates materially different from those reported would change the depletion expense recognized during the future reporting period. No gains or losses are recognized upon the sale or disposition of gas properties unless the sale or disposition represents a significant quantity of gas reserves, which would have a significant impact on the depreciation, depletion and amortization rate.
Under full cost accounting rules, total capitalized costs are limited to a ceiling equal to the present value of future net revenues, discounted at 10% per annum, plus the lower of cost or fair value of unevaluated properties less income tax effects (the “ceiling limitation”). We perform a quarterly ceiling test to evaluate whether the net book value of our full cost pool exceeds the ceiling limitation. The ceiling test is imposed separately for our U.S. and Canadian cost centers. If capitalized costs (net of accumulated depreciation, depletion and amortization) less related deferred taxes are greater than the discounted future net revenues or ceiling limitation, a write-down or impairment of the full cost pool is required. A write-down of the carrying value of the full cost pool is a non-cash charge that reduces earnings and impacts stockholders’ equity in the period of occurrence and typically results in lower depreciation, depletion and amortization expense in future periods. Once incurred, a write-down is not reversible at a later date. The ceiling limitation test is calculated using natural gas prices in effect as of the balance sheet date and adjusted for regional price differentials, held constant over the life of the reserves. In addition, subsequent to the adoption of ASC 410-20-25, the future cash outflows associated with settling asset
48
Table of Contents
retirement obligations are not included in the computation of the discounted present value of future net revenues for the purposes of the ceiling limitation test calculation.
Unevaluated Properties—The costs directly associated with unevaluated properties and properties under development are not initially included in the amortization base and relate to unproved leasehold acreage, seismic data, wells and production facilities in progress and wells pending determination of proved reserves together with overhead and interest costs capitalized for these projects. Unevaluated leasehold costs are transferred to the amortization base once determination has been made or upon expiration of a lease. Geological and geophysical costs associated with a specific unevaluated property are transferred to the amortization base with the associated leasehold costs on a specific project basis. Costs associated with wells in progress and wells pending determination are transferred to the amortization base once a determination is made whether or not proved reserves can be assigned to the property. All items included in our unevaluated property balance are assessed on a quarterly basis for possible impairment or reduction in value. Any impairment to unevaluated properties is transferred to the amortization base.
Asset Retirement Liability—We adopted ASC 410-20-25, effective January 1, 2003. It establishes accounting and reporting standards for retirement obligations associated with tangible long-lived assets that result from the legal obligation to plug, abandon and dismantle existing wells and facilities that we have acquired, constructed or developed. It requires that the fair value of the liability for asset retirement obligations be recognized in the period in which it is incurred. Upon initial recognition of the asset retirement liability, the asset retirement cost is capitalized by increasing the carrying amount of the long-lived asset by the same amount as the liability. The liability is accreted to its then present value each period, and the capitalized cost is depreciated over the useful life of the related asset.
Income Taxes—We record our income taxes using an asset and liability approach in accordance with the provisions of ASC 740, formerly SFAS No. 109, Accounting for Income Taxes. This results in the recognition of deferred tax assets and liabilities for the expected future tax consequences of temporary differences between the book carrying amounts and the tax bases of assets and liabilities using enacted tax rates at the end of the period. Under ASC 740, the effect of a change in tax rates of deferred tax assets and liabilities is recognized in the year of the enacted change. Deferred tax assets are reduced by a valuation allowance when, in the opinion of management, it is more likely than not that some portion or all of the deferred tax assets will not be realized.
Estimating the amount of valuation allowance is dependent on estimates of future taxable income, alternative minimum tax income, and changes in stockholder ownership that could trigger limits on use of net operating losses under Internal Revenue Code Section 382. We have a significant deferred tax asset associated with net operating loss carryforwards (“NOL’s”).
ASC 740 also clarifies the accounting for uncertainty in income taxes recognized in an entity’s financial statements and prescribes a consistent threshold and measurement attribute for financial statement recognition and disclosure of tax positions taken, or expected to be taken, on a tax return. The adoption of this pronouncement did not have a significant impact on the Company’s consolidated financial statements.
Revenue Recognition and Gas Balancing. We derive revenue primarily from the sale of produced natural gas. We use the sales method of accounting for the recognition of gas revenue whereby revenues, net of royalties, are recognized as the production is sold to purchaser. The amount of gas sold may differ from the amount to which the Company is entitled based on its working interest or net revenue interest in the properties. We typically do not have any significant producer gas imbalance positions because we own 100% working interest in the majority of our properties. A ready market for natural gas allows us to sell our natural gas shortly after production at various pipeline receipt points at which time title and risk of loss transfers to the buyer. Revenue is recorded when title is transferred based on our nominations and net revenue interests. Pipeline imbalances occur when our production delivered into the pipeline varies from the gas we nominated for sale. Pipeline imbalances are settled with cash approximately thirty days from date of production and are recorded as a reduction of revenue or increase of revenue depending upon whether we are over-delivered or under-delivered.
49
Table of Contents
Settlements of gas sales occur after the month in which the gas was produced. We estimate and accrue for the value of these sales using information available at the time financial statements are generated. Differences are reflected in the accounting period during which payments are received from the purchaser.
Derivative Instruments and Hedging Activities. Our hedging activities consist of derivative instruments entered into to hedge against changes in natural gas prices and changes in interest rates related to outstanding debt under our credit facility primarily through the use of fixed price swap agreements, basis swap agreements, three-way collars, and traditional collars. Consistent with our hedging policy, we entered into a series of derivative instruments to hedge a significant portion of our expected natural gas production through 2009 and 2010. We also entered into interest rate swap agreements to hedge interest rates associated with a portion of our variable rate debt through 2010. Typically, these derivative instruments require payments to (receipts from) counterparties based on specific indices as required by the derivative agreements. These transactions are recorded in our financial statements in accordance with ASC 815-20-25, formerly Statement No. 133, Accounting for Derivative Instruments and Hedging Activities. Although not risk free, we believe this policy will reduce our exposure to natural gas price fluctuations and changes in interest rates and thereby achieve a more predictable cash flow. As a result, our derivative instruments are cash flow hedge transactions in which we are hedging the variability of cash flow related to a forecasted transaction. We do not enter into derivative instruments for trading or other speculative purposes.
In accordance with ASC 815-20-25, as amended, all our derivative instruments are recorded on the balance sheet at fair market value and changes in the fair market value of the derivatives are recorded each period in current earnings for the natural gas derivatives or other comprehensive income (loss) for our interest rate swaps. The natural gas derivatives have not been designated as hedge transactions while the interest rate swaps qualify and have been designated as cash flow hedges in accordance with ASC 815-20-25.
At the inception of a derivative contract, we may designate the derivative as a cash flow hedge. For all derivatives designated as cash flow hedges, we document the relationship between the derivative instrument and the hedged items as well as the risk management objective for entering into the derivative instrument. To be designated as a cash flow hedge transaction, the relationship between the derivative and hedge items must be highly effective in achieving the offset of changes in cash flows attributable to the risk both at the inception of the derivative and on an ongoing basis.
Stock-Based Compensation—We follow the fair value recognition provisions of ASC 718, formerly SFAS No. 123(R), Share-Based Payment, using the prospective transition method. The application of ASC 718 requires the use of an option pricing model, such as the Black Scholes model, to measure the estimated fair value of the options and as a result various assumptions must be made by management that require judgment and the assumptions could be highly uncertain. For share-based awards outstanding prior to the adoption of ASC 718, we will continue using the accounting principles originally applied to those awards before adoption. Therefore, we do not recognize any equity compensation cost on these prior awards in the future unless such awards are modified, repurchased or cancelled.
Fair Value Measurement—Effective January 1, 2008, we adopted ASC 820-10-55, formerly SFAS No. 157, Fair Value Measurements, which provides a framework for measuring fair value under GAAP. ASC 820-10-55 defines fair value as the exchange price that would be received for an asset or paid to transfer a liability (an exit price) in the principal or most advantageous market for the asset or liability in an orderly transaction between market participants on the measurement date. ASC 820-10-55 also establishes a fair value hierarchy that requires an entity to maximize the use of observable inputs and minimize the use of unobservable inputs when measuring fair value. The standard describes three levels of inputs that may be used to measure fair value. Level 1 inputs are quoted prices (unadjusted) in active markets for identical assets or liabilities that the reporting entity has the ability to access at the measurement date. Level 2 inputs other than quoted prices included within Level 1 that are observable for the asset or liability, either directly or indirectly, such as quoted prices for similar assets or liabilities; quoted prices in markets that are not active; or other inputs that are observable or can be corroborated by observable market data for substantially the full term of the assets or liabilities. Level 3 inputs are derived from unobservable inputs that are supported by little or no market activity and that are significant to the fair value of the assets or liabilities. See disclosure related to the implementation of
50
Table of Contents
ASC 820-10-55 in Note 8—Derivative Instruments and Hedging Activities. The FASB has also issued Staff Position FAS 157-2 (“FSP 157-2”), which delays the effective date of ASC 820-10-55 for nonfinancial assets and liabilities, except for items that are recognized or disclosed at fair value in the financial statements on a recurring basis (at least annually), until fiscal years beginning after November 15, 2008. We have elected to defer the application of ASC 820-10-55 thereof to nonfinancial assets and liabilities in accordance with FSP 157-2. Non-recurring nonfinancial assets and nonfinancial liabilities for which the Company has not applied the provisions of ASC 820-10-55 include those measured at fair value in goodwill impairment testing, asset retirement obligations initially measured at fair value, and those initially measured at fair value in a business combination. On October 10, 2008, the FASB issued Staff Position No. FAS 157-3 (“FSP 157-3”). FSP 157-3 clarifies the application of ASC 820-10-55 in a market that is not active and provides an example to illustrate key considerations in determining the fair value of a financial asset when the market for that financial asset is not active. On January 1, 2009, we will adopt ASC 820-10-55 as it relates to nonfinancial assets and liabilities, including nonfinancial assets and liabilities measured at fair value in a business combination; impaired property, plant and equipment; goodwill; and initial recognition of asset retirement obligations. There has been no significant impact to our consolidated audited financial statements related to the implementation of ASC 820-10-55 for our existing non-financial assets and liabilities.
Natural Gas Producing Fields Operations Summary
The table below presents information on gas revenues, sales volumes, production expenses and per Mcf data for the years ended December 31, 2009, 2008 and 2007. This table should be read with the discussion of the results of operations for the periods presented below.
| Year Ended December 31, | |||||||||
| 2009 | 2008 | 2007 | |||||||
| Gas sales |
$ | 30,597 | $ | 68,314 | $ | 49,694 | |||
| Lease operating expenses |
$ | 13,935 | $ | 14,757 | $ | 13,981 | |||
| Compression and transportation expenses |
5,012 | 4,498 | 5,209 | ||||||
| Production taxes |
1,178 | 2,137 | 1,164 | ||||||
| Total production expenses |
$ | 20,125 | $ | 21,392 | $ | 20,354 | |||
| Net sales volumes (Consolidated) (MMcf) |
7,549 | 7,453 | 7,125 | ||||||
| Pond Creek field (MMcf) |
5,226 | 5,003 | 4,494 | ||||||
| Gurnee field (MMcf) |
2,118 | 2,241 | 2,235 | ||||||
| Per Mcf data ($/Mcf): |
|||||||||
| Average natural gas sales price (Consolidated) |
$ | 4.05 | $ | 9.17 | $ | 6.97 | |||
| Pond Creek field |
$ | 4.06 | $ | 9.17 | $ | 6.96 | |||
| Gurnee field |
$ | 4.06 | $ | 9.15 | $ | 6.94 | |||
| Average natural gas sales price realized (Consolidated)(1) |
$ | 5.47 | $ | 9.10 | $ | 7.52 | |||
| Lease operating expenses (Consolidated) |
$ | 1.85 | $ | 1.98 | $ | 1.96 | |||
| Pond Creek field |
$ | 1.38 | $ | 1.54 | $ | 1.60 | |||
| Gurnee field |
$ | 2.47 | $ | 2.98 | $ | 3.05 | |||
| Compression and transportation expenses (Consolidated) |
$ | 0.66 | $ | 0.60 | $ | 0.73 | |||
| Pond Creek field |
$ | 0.67 | $ | 0.68 | $ | 0.92 | |||
| Gurnee field |
$ | 0.49 | $ | 0.49 | $ | 0.47 | |||
| Production taxes (Consolidated) |
$ | 0.16 | $ | 0.29 | $ | 0.17 | |||
| Pond Creek field |
$ | 0.13 | $ | 0.15 | $ | 0.01 | |||
| Gurnee field |
$ | 0.23 | $ | 0.55 | $ | 0.41 | |||
| Total production expenses (Consolidated) |
$ | 2.67 | $ | 2.87 | $ | 2.86 | |||
| Pond Creek field |
$ | 2.18 | $ | 2.37 | $ | 2.53 | |||
| Gurnee field |
$ | 3.19 | $ | 4.02 | $ | 3.93 | |||
| Depletion (Consolidated) |
$ | 1.51 | $ | 1.35 | $ | 1.24 | |||
| (1) | Average realized price includes the effects of realized gains and losses on derivative contracts. |
51
Table of Contents
The following table presents certain information with respect to our production and operating data for each of the three month periods in the year ended December 31, 2009.
| Three Months Ended | ||||||||||||
| March 31, 2009 |
June 30, 2009 |
September 30, 2009 |
December 31, 2009 | |||||||||
| Gas: |
||||||||||||
| Net sales volume (Bcf) |
1.8 | 1.9 | 1.9 | 1.9 | ||||||||
| Average natural gas sales price ($ per Mcf) |
$ | 5.01 | $ | 3.59 | $ | 3.36 | $ | 4.26 | ||||
| Average natural gas sales price ($ per Mcf) realized(1) |
$ | 6.45 | $ | 5.03 | $ | 5.03 | $ | 5.37 | ||||
| Total production expenses ($ per Mcf) |
$ | 3.38 | $ | 2.60 | $ | 2.46 | $ | 2.21 | ||||
| Expenses: ($ per Mcf) |
||||||||||||
| Lease operations expenses |
$ | 2.42 | $ | 1.76 | $ | 1.68 | $ | 1.52 | ||||
| Compression and transportation expenses |
$ | 0.77 | $ | 0.72 | $ | 0.65 | $ | 0.52 | ||||
| Production taxes |
$ | 0.19 | $ | 0.13 | $ | 0.13 | $ | 0.17 | ||||
| Depletion of gas properties |
$ | 1.52 | $ | 0.97 | $ | 2.64 | $ | 0.92 | ||||
| General and administrative |
$ | 1.58 | $ | 1.15 | $ | 0.97 | $ | 0.72 | ||||
Results of Operations
Year Ended December 31, 2009 compared with Year Ended December 31, 2008
The following are selected items derived from our Consolidated Statement of Operations and their percentage changes from the comparable period are presented below.
| Year Ended December 31, |
|||||||||||
| 2009 | 2008 | Change | |||||||||
| (in thousands) | |||||||||||
| Gas sales |
$ | 30,597 | $ | 68,314 | -55 | % | |||||
| Lease operating expenses |
$ | 13,935 | $ | 14,757 | -6 | % | |||||
| Compression expense |
$ | 3,346 | $ | 3,054 | 10 | % | |||||
| Transportation expense |
$ | 1,666 | $ | 1,444 | 15 | % | |||||
| Production taxes |
$ | 1,178 | $ | 2,137 | -45 | % | |||||
| Depreciation, depletion and amortization |
$ | 12,030 | $ | 10,589 | 14 | % | |||||
| Impairment of gas properties |
$ | 257,288 | $ | 50,734 | NM | ||||||
| General and administrative |
$ | 8,349 | $ | 9,368 | -11 | % | |||||
| Realized (gains) losses on derivative contracts |
$ | (10,694 | ) | $ | 500 | NM | |||||
| Unrealized losses (gains) from the change in market value of open derivative contracts |
$ | 3,995 | $ | (4,993 | ) | NM | |||||
| Interest expense, net of amounts capitalized |
$ | (5,174 | ) | $ | (4,783 | ) | 8 | % | |||
| Income tax benefit |
$ | (98,142 | ) | $ | (712 | ) | NM | ||||
NM-Not Meaningful
Gas sales. Gas sales decreased by $37.7 million, or 55%, to $30.6 million compared to the prior year. The decrease in gas sales was a result of significantly lower natural gas prices, which decreased approximately 56% excluding hedging transactions, partially offset by increased production, which increased 1%. The increase in production was principally attributable to the prior year development activities at our Pond Creek field and the commencement of gas sales in our Garden City field in July 2008, Lasher field in October 2008, and Peace River in December 2008, partially offset by the sale of an overriding royalty interest that was sold effective July 1, 2008 and decreased current year production in our Gurnee field.
52
Table of Contents
Lease operating expenses. Lease operating expenses decreased by $0.8 million, or 6%, to $13.9 million compared to the prior year. The $0.8 million decrease in lease operating expenses consisted of $1.0 million decrease in costs, partially offset by a $0.2 million increase in production. The $1.0 million decrease in costs was primarily due to a company-wide cost reduction strategy implemented in April 2009, partially offset by increased expenses related to the commencement of gas sales in our Garden City field in July 2008, Lasher field in October 2008, and Peace River in December 2008.
Compression expense. Compression expense increased by $0.3 million, or 10%, to $3.3 million compared to the same period in the prior year. The increase in compression expense was primarily due to the addition of Peace River compression costs where gas sales commenced on December 31, 2008.
Transportation expense. Transportation expense increased by $0.2 million, or 15%, to $1.7 million compared to the prior year period. The increase was primarily due to the fact that a greater amount of excess capacity was released in the prior year period effectively reducing transportation expense for that period. The excess transportation capacity that caused the increase was permanently released in May 2009. As a result of this permanent release, we expect to incur less transportation costs in the future.
Production taxes. Production taxes decreased by $1.0 million, or 45%, to $1.2 million compared to the prior year period. The decrease in production taxes was primarily due to decreased natural gas sales caused by lower natural gas prices.
Depreciation, depletion and amortization. Depreciation, depletion and amortization increased by $1.4 million, or 14%, to $12.0 million compared to the prior year period. The depreciation, depletion and amortization increase consisted of $3.9 million in accelerated depletion caused by estimated natural gas reserve revisions recorded as of September 30, 2009, offset by a $2.5 million decrease due to the decrease in the depletion rate resulting from our ceiling write-downs incurred to-date.
Impairment of gas properties. For the year ended December 31, 2009, impairments recorded to gas properties were $159.7 million, net of tax benefit of $97.6 million. These impairments were caused by lower natural gas prices, as well as downward reserve revisions due in large part to continued under-performance in the Gurnee field. We were able to limit the effect of lower natural gas prices through our ongoing cost reduction strategy, which we implemented in April 2009.
General and administrative. General and administrative expenses decreased by $1.0 million, or 11%, to $8.3 million compared to the prior year period. The primary driver of the decrease in general and administrative expenses was the cost reduction strategy implemented in April 2009, offset by $0.8 million less capitalized overhead as a result of decreased drilling activities.
Realized (gains) losses on derivative contracts. Realized gains on derivative contracts were $10.7 million in the current year period as compared to realized losses of $0.5 million in the prior year period. Realized losses represent net cash flow settlements paid to the contract counterparty, while realized gains represent net cash flow settlements paid to us from the contract counterparty. Realized losses occur when natural gas prices exceed the derivative ceiling prices. Conversely, realized gains occur when natural gas prices go below the derivative floor prices.
Unrealized losses (gains) from the change in market value of open derivative contracts. Unrealized losses on open derivative contracts were $4.0 million in the current year period as compared to unrealized gains of $5.0 million in the prior year period. Unrealized losses and gains are non-cash transactions that occur when the corresponding asset or liability derivative contracts are marked to market at the end of each reporting period.
Interest expense (net of amounts capitalized). Interest expense (net of amounts capitalized) increased by $0.4 million, or 8%, to $5.2 million compared to the prior year period. The increase is due to the effect of a
53
Table of Contents
higher average outstanding debt balance in the current year period, partially offset by a lower average interest rate in the current year period. Additionally, the prior year included $0.3 million of capitalized interest for which there was no comparable capitalized interest in the current year period as a result of no drilling activity.
Income tax benefit (expense). Income tax benefit was $98.1 million in the current year as compared to $0.7 million in the prior year. The increased benefit was primarily the result of the impairments recorded to gas properties of $159.7 million, net of tax benefit of $97.6 million. These impairments were caused by lower natural gas prices, as well as downward revisions due in large part to continued under-performance in the Gurnee field. We were able to limit the effect of lower natural gas prices through our ongoing cost reduction strategy, which we implemented in April 2009. The effective tax rate for the period was 37.0%. Income tax benefit for the year ended December 31, 2009 was different than the amount computed using the statutory rate as follows:
| U.S. | Canada | Total | |||||||||||||||||||
| Amount computed using statutory rates |
$ | (87,751,624 | ) | 34.00 | % | $ | (1,867,426 | ) | 26.00 | % | $ | (89,619,050 | ) | 33.78 | % | ||||||
| State income taxes—net of federal benefit |
(10,714,162 | ) | 4.15 | % | — | 0.00 | % | (10,714,162 | ) | 4.04 | % | ||||||||||
| Valuation Allowance |
— | 0.00 | % | 1,867,426 | -26.00 | % | 1,867,426 | -0.70 | % | ||||||||||||
| Nondeductible items and other |
324,027 | -0.12 | % | — | 0.00 | % | 324,027 | -0.12 | % | ||||||||||||
| Income tax (benefit) provision |
$ | (98,141,759 | ) | 38.03 | % | $ | — | 0.00 | % | $ | (98,141,759 | ) | 37.00 | % | |||||||
Year Ended December 31, 2008 compared with Year Ended December 31, 2007
The following are selected items derived from our Consolidated Statement of Operations and their percentage changes from the comparable period are presented below.
| Year Ended December 31, |
|||||||||||
| 2008 | 2007 | Change | |||||||||
| (in thousands) | |||||||||||
| Gas sales |
$ | 68,314 | $ | 49,694 | 37 | % | |||||
| Lease operating expenses |
$ | 14,757 | $ | 13,981 | 6 | % | |||||
| Compression expense |
$ | 3,054 | $ | 2,557 | 19 | % | |||||
| Transportation expense |
$ | 1,444 | $ | 2,652 | -46 | % | |||||
| Production taxes |
$ | 2,137 | $ | 1,164 | 84 | % | |||||
| Depreciation, depletion and amortization |
$ | 10,589 | $ | 9,092 | 16 | % | |||||
| Impairment of gas properties |
$ | 50,734 | $ | — | NM | ||||||
| General and administrative |
$ | 9,368 | $ | 9,294 | 1 | % | |||||
| Realized losses (gains) on derivative contracts |
$ | 500 | $ | (3,895 | ) | NM | |||||
| Unrealized (gains) losses from the change in market value of open derivative contracts |
$ | (4,993 | ) | $ | 3,007 | NM | |||||
| Interest expense, net of amounts capitalized |
$ | (4,783 | ) | $ | (5,130 | ) | -7 | % | |||
| Income tax (benefit) expense |
$ | (712 | ) | $ | 2,987 | NM | |||||
| Discontinued operations |
$ | — | $ | 174 | NM | ||||||
NM-Not Meaningful
Gas sales. Gas sales increased by $18.6 million, or 37%, to $68.3 million compared to the prior year. The increase in gas sales was a result of both increased gas prices and production. Production increased 5% and average gas prices, excluding hedging transactions, increased 32%. The $18.6 million increase in gas sales consisted of a $2.3 million increase in production and a $16.3 million increase in average prices. The increase in production was principally attributable to the continued development activities at our Pond Creek and Gurnee fields.
54
Table of Contents
Lease operating expenses. Lease operating expenses increased by $0.8 million, or 6%, to $14.8 million compared to the prior year. The $0.8 million increase in lease operating expenses consisted of $0.6 million increase in production and $0.2 million increase in costs.
Compression expense. Compression expense increased by $0.5 million, or 19%, to $3.1 million compared to the same period in the prior year. The increase in compression expense consisted of a $0.1 million increase in production and a $0.4 million increase in costs. The $0.4 million increase in costs was primarily due to an increase in repair and maintenance expenses for the compressors in our Pond Creek field.
Transportation expense. Transportation expense decreased by $1.2 million, or 46%, to $1.4 million compared to the prior year period. The decrease was primarily due to lower transportation expenses resulting from the commencement of transportation on our own system from the Pond Creek field and the temporary release of a portion of our firm capacity commitments related to our Pond Creek field.
Production taxes. Production taxes increased by $1.0 million, or 84%, to $2.1 million compared to the prior year period. The increase in production taxes was due to the phase-in of state taxes on production of natural gas in our Pond Creek field, higher gas prices and increased production.
Depreciation, depletion and amortization. Depreciation, depletion and amortization increased by $1.5 million, or 16%, to $10.6 million compared to the prior year period. The depreciation, depletion and amortization increase consisted of a $0.4 million increase in production and a $1.1 million increase in the depletion rate.
Impairment of gas properties. At December 31, 2008, the carrying value of the Company’s oil and gas properties exceeded the full cost ceiling limitation by approximately $50.7 million. For the year ended December 31, 2007, no such write-down was recorded.
General and administrative. General and administrative expenses increased by $0.1 million, or 1%, to $9.4 million compared to the prior year period. The primary driver for the increased general and administrative expenses was increased office expense, share based awards and investor relation expense, offset by a decrease in employee bonuses.
Realized losses (gains) on derivative contracts. Realized losses on derivative contracts were $0.5 million in the current year period as compared to $3.9 million of realized gains in the prior year period. Realized losses represent net cash flow settlements paid to the counterparty while realized gains represent net cash flow settlement paid to us from the counterparty. Realized losses occur when natural gas prices or the derivative index price exceeds the derivative ceiling price. Conversely, realized gains occur when natural gas prices go below the derivative floor price.
Unrealized (gains) losses from the change in market value of open derivative contracts. Unrealized gains on open derivative contracts were $5.0 million in the current year period as compared to a $3.0 million in unrealized losses in the prior year period. Unrealized losses and gains are non-cash transactions that occur when the corresponding natural gas derivative contract asset or liability is marked to market at the end of each reporting period.
Interest expense (net of amounts capitalized). Interest expense (net of amounts capitalized) decreased by $0.3 million, or 7%, to $4.8 million compared to the prior year period. Gross interest expense for the period was $5.1 million net of $0.3 million capitalized. Gross interest expense decreased 11% from the prior year period due to lower interest rates, while capitalized interest decreased 48% from the prior year period due to the deferral of certain capital projects.
55
Table of Contents
Income tax benefit (expense). Income tax benefit was $0.7 million for the year ended December 31, 2008. The effective tax rate for the period was 3.07%. Income tax benefit for the year ended December 31, 2008 was different than the amount computed using the statutory rate as follows:
| U.S. | Canada | Total | |||||||||||||||||||
| Amount computed using statutory rates |
$ | (938,137 | ) | 34.00 | % | $ | (6,949,350 | ) | 34.00 | % | $ | (7,887,487 | ) | 34.00 | % | ||||||
| State income taxes—net of federal benefit |
(147,556 | ) | 5.35 | % | — | 0.00 | % | (147,556 | ) | 0.64 | % | ||||||||||
| Valuation Allowance |
121,865 | -4.42 | % | 6,949,350 | -34.00 | % | 7,071,215 | -30.48 | % | ||||||||||||
| Nondeductible items and other |
251,928 | -9.13 | % | — | 0.00 | % | 251,928 | -1.09 | % | ||||||||||||
| Income tax (benefit) provision |
$ | (711,900 | ) | 25.80 | % | $ | — | 0.00 | % | $ | (711,900 | ) | 3.07 | % | |||||||
Discontinued operations. In September of 2007, we discontinued the third party marketing business and second reportable segment which had been created in connection with the consolidation of Shamrock Energy LLC, a variable interest entity under ASC 810, formerly FIN 46 (R), on August 1, 2006. The consolidation of the variable interest entity had no impact on our net income (loss) due to the 100% minority interest to Shamrock Energy LLC. On January 1, 2007, we acquired Shamrock Energy LLC as a wholly owned subsidiary and the consolidation of this wholly owned subsidiary had an insignificant impact on our net income (loss). As a result of exiting our third party marketing business, we are treating these activities as a discontinued operation for all the periods presented.
Liquidity and Capital Resources
Cash Flows and Liquidity
Cash flows provided by operations for the year ended December 31, 2009 and 2008 were $8.5 million and $33.0 million, respectively. Cash flows from operations of $8.5 million for the year ended December 31, 2009, combined with net cash provided by financing activities of $2.9 million and the use of available cash, were sufficient to fund net cash used in investing activities of $12.7 million, which primarily includes capital expenditures for the exploration and development of our gas properties a significant portion of which was carryover costs from our 2008 program. Net cash provided by financing activities was related to revolving credit facility net borrowings.
As of December 31, 2009, we had a working capital deficit of less than $0.1 million. As of December 31, 2008, we had a working capital deficit of approximately $1.4 million.
Based upon current expectations, we believe that our cash flow from operations and other financial resources such as borrowings under our revolving credit facility and proceeds from potential transactions such as equity offerings, joint ventures, or asset sales will provide the ability to develop certain existing properties.
Beginning in early 2009, we began implementing countermeasures in response to the above referenced trends in order to enhance our ability to execute our business strategy. These countermeasures included reducing costs, increasing hedging to reduce exposure to volatile natural gas prices and limiting capital spending. We are evaluating additional measures in light of the current credit and commodity markets include selling assets, entering into joint venture agreements with industry partners to reduce our capital outlays, or alternate forms of financing.
Revolving Credit Facility
Effective March 30, 2010, the parties to the revolving credit facility agreement unanimously approved the Third Amendment to the revolving credit facility (“Third Amendment”) as summarized below:
| • | The maturity date of the revolving credit facility was extended four months to May 6, 2011 pursuant to a request by the Company. |
56
Table of Contents
| • | Pursuant to a request by the Company, the borrowing base was reduced to $123.0 million and the bank group agreed that (1) the next borrowing base determination would be as of June 15, 2010, and (2) the bank group agreed not to call for a determination of the borrowing base prior to that date. |
| • | The minimum current ratio, adjusted for unrealized (gains) losses on derivative contracts and borrowing availability under the revolving credit agreement, is adjusted to .80 to 1 solely for the quarter ended March 31, 2010. |
| • | The outstanding balances on the revolving credit facility will bear interest at the Company’s option of either (a) the bank’s adjusted base rate, which is the greatest of (i) the bank’s base rate, (ii) the Federal Funds Rate plus 0.5%, or (iii) the one-month LIBOR rate plus 1%, plus a margin of 2.625%, or (b) the adjusted LIBOR rate, plus a margin of 3.50%. |
Commitments for Additional Financing
On March 29, 2010, we executed commitment letters with NGP Capital Resources Company and North Shore Energy, LLC, an affiliate of our largest stockholder, whereby NGPC and North Shore have agreed to the preliminary terms of a commitment to purchase up to $20 million each ($40 million in the aggregate) of the Company’s convertible preferred stock in the event that a proposed rights offering of the convertible preferred stock is not fully subscribed by our common stockholders. NGPC and North Shore each received an initial non-refundable payment of $250,000 from the Company in exchange for the commitment letters. The initial payment will be credited against a $600,000 fee due to each of NGPC and North Shore upon the closing of a rights offering and backstop commitment. Our Board of Directors approved the execution of the commitment letters after its receipt of a recommendation to do so by a Special Committee comprised of two independent directors with no affiliation with our largest stockholder. The Special Committee retained the services of independent legal counsel and a financial advisor in evaluating and formulating its recommendation to the Board.
The proposed rights offering will be made only by means of a prospectus supplement and accompanying prospectus that will contain the specific terms of the proposed transaction and will be provided to our stockholders in connection with any such offering. The disclosure in this filing on Form 10-K does not constitute an offer or the solicitation of an offer of the Company’s securities. Any such offer will only be made by registration under federal and state securities laws, or pursuant to an applicable exemption from registration thereunder.
Proposed Rights Offering
Under the terms of the proposed $40 million rights offering, we would distribute, at no charge to the holders of our common stock, rights to purchase up to an aggregate of 4,000,000 new shares of convertible preferred stock at a subscription price of $10.00 per share. The number of rights to be distributed per share of common stock would be determined when our Board of Directors sets a record date for the rights offering and would be set forth in a prospectus supplement to our effective registration statement on Form S-3. The prospectus supplement would be distributed to stockholders of record as of the record date. Each whole right would entitle a holder to purchase one share of convertible preferred stock at the subscription price. In the even that our stockholders do not subscribe for all 4,000,000 shares of preferred stock offered, NGPC and North Shore would purchase the remaining unsubscribed shares of preferred stock pursuant to the terms of a backstop agreement. Consummation of the rights offering is subject to the execution of a definitive backstop agreement between the Company, NGPC and North Shore, completion of title and environmental due diligence satisfactory to NGPC and North Shore, the approval of our stockholders and other terms and conditions described in the commitment letters. We cannot assure that we will be successful in completing the proposed preferred stock rights offering on the terms outlined herein.
Terms of Proposed Backstop Commitment
Under the proposed terms set forth in the commitment letters, NGPC and North Shore agree to purchase all shares of convertible preferred stock that remain unsubscribed as a result of any unexercised rights by our common stockholders during the proposed rights offering. NGPC and North Shore each would purchase up to
57
Table of Contents
$20 million of convertible preferred stock assuming no stockholder subscriptions and would participate equally in any unsubscribed shares of convertible preferred stock. The material terms of the preferred stock as set forth in the commitment letters are more fully described in “Item 9B. Other Information.”
Under the terms set forth in the commitment letters, NGPC and North Shore are entitled to receive a backstop fee of $600,000 each, or $1.2 million in the aggregate, upon the closing of the rights offering and backstop commitment. An initial $500,000 aggregate payment already made by the Company will be credited against the backstop fee. In addition, in the event that less than $15 million of convertible preferred stock is available for NGPC or North Shore to purchase following the rights offering, the Company will be required to pay NGPC and/or North Shore an additional fee of 3% of the shortfall (i.e., the difference between $15 million and the amount of convertible preferred stock actually purchased). We have agreed to pay or reimburse NGPC and North Shore for all reasonable costs and out-of-pocket expenses relating to their commitments.
As additional consideration for their commitment to backstop the proposed rights offering, NGPC and North Shore would each be entitled to appoint one member to our board of directors so long as it held a threshold amount of convertible preferred stock, and our board would be comprised of no more than nine directors. Certain Company actions would require the approval of a supermajority (70%) of our board, including our annual operating budget, capital expenditure budget and general and administrative budget. The terms of these and other proposed governance arrangements are more fully described in “Item 9B. Other Information.”
The commitment letters also outline certain covenants that are expected to be included in the backstop agreement, including:
| • | A debt incurrence test during the first year following closing of the proposed rights offering; |
| • | A maximum debt-to-EBITDA ratio, which would be less restrictive than the ratio required under our senior credit facility; |
| • | A limit on general and administrative expenses; and |
| • | A $5 million reduction in Company debt each year that a threshold amount of convertible preferred stock remains outstanding. |
In addition, so long as a threshold amount of convertible preferred stock remains outstanding, the Company may not incur additional material debt, issue any equity senior or on par with the convertible preferred stock, engage in any material acquisitions or other significant corporate transactions, incur any exploration expenses, or engage in certain other activities without the consent of NGPC and North Shore.
We currently have limited borrowing availability under our revolving credit facility, which matures on May 6, 2011, and we have no assurances that our lenders will extend the maturity date. Accordingly, we will continue to explore various alternatives for additional financing for the Company in order to reduce our debt and provide additional capital for growth. These alternatives may include private or public offerings of debt or equity securities or the sale of assets. The terms, timing and structure of any such financing or sale will depend on several factors, including market conditions, execution risk, timing, possible dilution of existing shareholders and relative cost of the various financing alternatives. There can be no assurance that we will be able to obtain debt or equity financing or complete an asset sale on terms favorable to us, or at all.
Changes in natural gas prices significantly affect our revenues, financial condition, cash flows and borrowing capacity. Markets for natural gas have historically been volatile and we expect this trend to continue. Prices for natural gas may fluctuate in response to changes in supply and demand, market uncertainty, seasonal, political and other factors beyond our control. We are unable to accurately predict the prices we will receive for our natural gas. Accordingly, any significant or sustained declines in natural gas prices will materially adversely affect our financial condition, operating results, liquidity and ability to obtain financing. Continued declining or prolonged low natural gas prices may also result in non-compliance with the covenants in our revolving credit facility agreement and could result in a lower determination of our borrowing base. Lower natural gas prices also may reduce the amount of natural gas that we can produce economically. Further declines in natural gas prices
58
Table of Contents
could have a material adverse effect on the estimated value and estimated quantities of our proved natural gas reserves, our ability to fund our operations and our financial condition, cash flow, results of operations and access to capital. Our capital expenditure budgets are highly dependent on future natural gas prices.
The recent disruption in the credit markets has had a significant adverse impact on a number of financial institutions. We have reviewed the creditworthiness of the banks and financial institutions with which we maintain our cash and short-term investments. Thus far, our liquidity and financial position have not been impacted. However, we cannot predict with any certainty the impact of any further disruption in the credit markets.
The following table is a summary of our capital expenditures on an accrual basis by category:
| Year Ended December 31, | |||||||||
| 2009 | 2008 | 2007 | |||||||
| (In thousands) | |||||||||
| Capital expenditures: |
|||||||||
| Leasehold acquisition |
$ | 1,197 | $ | 3,669 | $ | 7,333 | |||
| Exploration |
29 | 405 | 2,999 | ||||||
| Development |
6,273 | 48,404 | 44,831 | ||||||
| Other items (primarily capitalized overhead and interest) |
1,767 | 5,294 | 4,649 | ||||||
| Total capital expenditures |
$ | 9,266 | $ | 57,772 | $ | 59,812 | |||
We expect our capital expenditure budget for 2010 to be $7.3 million. The amount and timing of our expenditures are subject to change based upon market conditions, natural gas prices, results of operations and other factors. We routinely adjust our capital expenditure budget in response to changes in natural gas prices, drilling and acquisition costs, cash flow, drilling results and changes in borrowing capacity under our revolving credit facility.
The development of coalbed methane fields requires substantial initial investment before meaningful production and resulting cash flows are realized. Among the factors that can be expected to affect our cash flows and liquidity are the characteristics of the field, the amount of water produced, the methods utilized to dispose of produced water, the transportation alternatives, and the timing and rate of initial and subsequent natural gas production volumes.
There continues to be an unprecedented uncertainty in the financial markets. The uncertainty in the market brings additional potential risks to us. The risks include less availability and higher costs of additional credit, potential counterparty defaults, and further commercial bank failures. Although the financial institutions in our bank group appear to be capable of meeting their obligation under the facility, some that have been and others could be considered take-over candidates. Although we have no indication that any such transactions would impact our current revolving credit facility, the possibility exists. Financial market disruptions may impact our ability to collect trade receivables. We constantly monitor the credit worthiness of our customers. We believe that our current group of counterparties are sound and represent no abnormal business risk.
Changes in natural gas prices significantly affect our revenues, financial condition, cash flows and borrowing capacity. Markets for natural gas have historically been volatile and we expect this trend to continue. Prices for natural gas may fluctuate in response to changes in supply and demand, market uncertainty, seasonal, political and other factors beyond our control. We are unable to accurately predict the prices we will receive for our natural gas. Accordingly, any significant or sustained declines in natural gas prices will materially adversely affect our financial condition, operating results, liquidity and ability to obtain financing. Continued or prolonged low natural gas prices may also result in non-compliance with the covenants in our revolving credit facility agreement and could result in a lower determination of our borrowing base. Lower natural gas prices also may reduce the amount of natural gas that we can produce economically. Further declines in natural gas prices had a material adverse effect on the estimated value and estimated quantities of our proved natural gas reserves, our ability to fund our operations and our financial condition, cash flow, results of operations and access to capital. Our capital expenditure budgets are highly dependent on future natural gas prices.
59
Table of Contents
Natural Gas Price Risk and Related Hedging Activities.
The energy markets have historically been very volatile, and there can be no assurance that natural gas prices will not be subject to wide fluctuations in the future. In an effort to reduce the effects of the volatility of the price of natural gas on our operations, management has adopted a policy of hedging natural gas prices from time to time primarily using derivative instruments in the form of three-way collars, traditional collars and swaps. While the use of these hedging arrangements limits the downside risk of adverse price movements, it also limits future gains from favorable movements. Our price risk management policy strictly prohibits the use of derivatives for speculative positions.
We enter into hedging transactions, generally for forward periods up to two years or more, which increase the probability of achieving our targeted level of cash flows. We generally limit the amount of these hedges during any period to no more than 50% to 70% of the then expected gas production for such future periods. Swaps exchange floating price risk in the future for a fixed price at the time of the hedge. Costless collars set both a maximum ceiling (a sold ceiling) and a minimum floor (a bought floor) future price. Three-way costless collars are similar to regular costless collars except that, in order to increase the ceiling price, we agree to limit the amount of the floor price protection (through a sold floor) to a predetermined amount, generally between $2.00 and $3.00 per MMBtu below the bought floor. We have accounted for these transactions using the mark-to-market accounting method. Generally, we incur accounting losses on derivatives during periods where prices are rising and gains during periods where prices are falling which may cause significant fluctuations in our consolidated balance sheets and consolidated statements of operations.
We believe that the use of derivative instruments does not expose us to material risk. However, the use of derivative instruments may materially affect our financial position and results of operations as a result of changes in the estimated market value of our natural gas derivatives. Nevertheless, we believe that the use of these instruments will not have a material adverse effect on our cash flows.
Commodity Price Risk and Related Hedging Activities
At December 31, 2009, we had the following natural gas collar positions:
| Period |
Volume (MMBtu) |
Sold Ceiling |
Bought Floor |
Sold Floor |
Fair Value | |||||||||
| January 2010 through March 2010 |
540,000 | $ | 11.20 | $ | 9.50 | $ | 7.00 | $ | 1,326,724 | |||||
| January 2010 through March 2010 |
360,000 | $ | 6.65 | $ | 5.50 | $ | 3.50 | 65,098 | ||||||
| April through October 2010 |
856,000 | $ | 6.80 | $ | 5.50 | $ | 3.50 | 172,072 | ||||||
| April through October 2010 |
856,000 | $ | 6.35 | $ | 5.50 | — | 116,559 | |||||||
| November 2010 through March 2011 |
604,000 | $ | 7.45 | $ | 6.50 | — | 160,745 | |||||||
| $ | 1,841,198 | |||||||||||||
At December 31, 2009, we had the following natural gas swap positions:
| Period |
Volume (MMBtu) |
Price | Fair Value | |||||
| April through October 2010 |
856,000 | $ | 5.70 | 5,341 | ||||
| April through October 2010 |
642,000 | $ | 6.30 | 387,383 | ||||
| November 2010 through March 2011 |
604,000 | $ | 6.67 | 61,493 | ||||
| November 2010 through March 2011 |
906,000 | $ | 7.27 | 625,564 | ||||
| April 2011 through October 2011 |
856,000 | $ | 6.37 | 236,887 | ||||
| November 2011 through March 2012 |
608,000 | $ | 7.12 | 166,836 | ||||
| $ | 1,483,504 | |||||||
60
Table of Contents
Interest Rate Risks and Related Hedging Activities
When we enter into an interest rate swap, we may designate the derivative as a cash flow hedge, at which time we prepare the documentation required under ASC 815-20-25. Hedges of our interest rate are designated as cash flow hedges based on whether the interest on the underlying debt is converted to a fixed interest rate. Changes in derivative fair values that are designated as cash flow hedges are deferred as other comprehensive income or loss to the extent that they are effective and then recognized in earnings when the hedged transactions occur.
We use fixed rate swaps to limit our exposure to fluctuations in interest rates with the objective of realizing a fixed cash flow stream from these activities. At December 31, 2009, we had the following interest rate swaps:
| Description |
Effective date |
Designated maturity date |
Fixed rate(1) |
Notional amount |
Fair Value |
|||||||||
| Floating-to-fixed swap |
12/14/2007 | 12/14/2010 | 3.86 | % | $ | 15,000,000 | $ | (479,566 | ) | |||||
| Floating-to-fixed swap |
1/3/2008 | 1/4/2010 | 3.95 | % | $ | 10,000,000 | (87,493 | ) | ||||||
| Floating-to-fixed swap |
3/25/2008 | 3/25/2010 | 2.38 | % | $ | 10,000,000 | (50,745 | ) | ||||||
| Floating-to-fixed swap |
5/13/2008 | 5/13/2010 | 3.07 | % | $ | 5,000,000 | (67,783 | ) | ||||||
| Floating-to-fixed swap |
1/6/2009 | 1/6/2011 | 1.38 | % | $ | 5,000,000 | (38,278 | ) | ||||||
| $ | (723,865 | ) | ||||||||||||
| (1) | The floating rate paid by the counterparty is the British Bankers’ Association LIBOR rate. |
Revolving Credit Facility
On November 5, 2009, the Company’s bank syndicate approved a borrowing base of $135 million after completing its mid-year borrowing base determination based on our internally prepared reserve report as of September 30, 2009. Our revolving credit facility permits us to borrow and repay amounts as needed based on the available borrowing base as determined in the revolving credit facility agreement. The revolving credit facility is secured by substantially all of our gas properties and the capital stock of our subsidiaries.
As of December 31, 2009, we had $119.5 million of borrowings outstanding under our revolving credit facility, resulting in a borrowing availability of $15.5 million under our $135.0 million borrowing base. For the year ended December 31, 2009 we borrowed $39.4 million and made payments of $36.4 million under the revolving credit facility. The outstanding balances on the revolving credit facility bear interest at the Company’s option of either (a) the bank’s adjusted base rate, which is the greatest of (i) the bank’s base rate, (ii) the Federal Funds Rate plus 0.5%, or (iii) the one-month LIBOR rate plus 1%, plus a margin of 1.375% to 2.125% based on borrowing base usage, or (b) the adjusted LIBOR rate, plus a margin of 2.25% to 3.00%, based on borrowing base usage. The rates at December 31, 2009 and 2008, excluding the effect of our interest rate swaps, were 3.03% and 2.49%, respectively. For the years ended December 31, 2009 and 2008, interest on the borrowings averaged 3.12% per annum and 4.56% per annum, respectively.
We are subject to certain restrictive covenants under the revolving credit facility agreement, including a minimum current ratio, adjusted for unrealized (gains) losses on derivative contracts and borrowing availability under the revolving credit agreement, of 1.0 to 1.0, and a ratio of consolidated EBITDA, as defined in the revolving credit facility agreement, to interest expense of up to 2.75 to 1.0, both as defined in the revolving credit facility agreement. As of December 31, 2009, we were in compliance with all of the covenants in the revolving credit facility agreement.
Effective March 30, 2010, the parties to the revolving credit facility agreement unanimously approved the Third Amendment to the revolving credit facility (“Third Amendment”) as summarized below:
| • | The maturity date of the revolving credit facility was extended four months to May 6, 2011 pursuant to a request by the Company. |
61
Table of Contents
| • | Pursuant to a request by the Company, the borrowing base was reduced to $123.0 million and the bank group agreed that (1) the next borrowing base determination would be as of June 15, 2010, and (2) the bank group agreed not to call for a determination of the borrowing base prior to that date. |
| • | The minimum current ratio, adjusted for unrealized (gains) losses on derivative contracts and borrowing availability under the revolving credit agreement, is adjusted to .80 to 1 solely for the quarter ended March 31, 2010. |
| • | The outstanding balances on the revolving credit facility will bear interest at the Company’s option of either (a) the bank’s adjusted base rate, which is the greatest of (i) the bank’s base rate, (ii) the Federal Funds Rate plus 0.5%, or (iii) the one-month LIBOR rate plus 1%, plus a margin of 2.625%, or (b) the adjusted LIBOR rate, plus a margin of 3.50%. |
Contractual Commitments
We have numerous contractual commitments in the ordinary course of business, debt service requirements and operating lease commitments. The following table summarizes these commitments at December 31, 2009, beginning January 1, 2010 (in thousands):
| 2010 | 2011 | 2012 | 2013 | 2014 and thereafter | |||||||||||
| Long-term debt and other obligations(1) |
$ | 122 | $ | 119,633 | $ | 92 | $ | 100 | $ | 171 | |||||
| Interest expense on revolving credit facility(2) |
3,617 | 59 | — | — | — | ||||||||||
| Operating lease obligations |
1,408 | 1,354 | 630 | 426 | 971 | ||||||||||
| Interest rate swap contracts |
724 | — | — | — | — | ||||||||||
| Asset retirement obligations |
108 | — | — | — | 4,862 | ||||||||||
| Firm transportation contracts |
1,343 | 1,313 | 1,313 | 1,313 | 8,202 | ||||||||||
| Other operating commitments |
176 | — | — | — | — | ||||||||||
| ASC 740 (formerly FIN 48)(3) |
— | — | — | — | — | ||||||||||
| Total commitments |
$ | 7,498 | $ | 122,359 | $ | 2,035 | $ | 1,839 | $ | 14,206 | |||||
| (1) | Maturities based on the June 2006 amended bank credit agreement terms, as amended, which extended the maturity date to May 6, 2011. |
| (2) | The outstanding balances on the revolving credit facility bear interest at the Company’s option of either (a) the bank’s adjusted base rate, which is the greatest of (i) the bank’s base rate, (ii) the Federal Funds Rate plus 0.5%, or (iii) the one-month LIBOR rate plus 1%, plus a margin of 1.375% to 2.125% based on borrowing base usage, or (b) the adjusted LIBOR rate, plus a margin of 2.25% to 3.00%, based on borrowing base usage. The rate at December 31, 2009, excluding the effect of our interest rate swaps, was 3.03%. |
| (3) | As of December 31, 2009, we had a liability for unrecognized tax benefits of approximately $273,000. We are unable to reliably estimate the timing and amount of any payments related to this liability because there are currently no outstanding unpaid assessments from any tax authority, and it is likely that assessments would be offset by existing deferred tax attributes as they arise. |
The following were maturities of long-term debt for each of the next five years at December 31, 2009:
| Year |
Amount | ||
| 2010 |
$ | 121,792 | |
| 2011 |
119,632,744 | ||
| 2012 |
91,757 | ||
| 2013 |
100,467 | ||
| 2014 |
110,035 | ||
| Thereafter |
61,160 | ||
| Total Debt |
$ | 120,117,955 | |
62
Table of Contents
Environmental and Regulatory
As of December 31, 2009, there were no known environmental or other regulatory matters related to our operations that are reasonably expected to result in a material liability to us.
Operating Lease Commitments—We have operating leases for office space, office equipment and field compressors expiring in various years through 2019. Future minimum lease commitments as of December 31, 2009 under non-cancelable operating leases having remaining terms in excess of one year are as follows:
| Year Ended December 31, |
Amount | ||
| 2010 |
$ | 1,408,201 | |
| 2011 |
1,354,079 | ||
| 2012 |
629,560 | ||
| 2013 |
426,383 | ||
| 2014 |
188,040 | ||
| Thereafter |
782,672 | ||
| Total future minimum lease commitments |
$ | 4,788,935 | |
Total rental expenses under operating leases were approximately $1,857,026, $2,005,994 and $1,542,660 for the years ended December 31, 2009, 2008 and 2007, respectively.
Transportation Contracts—As of December 31, 2009, under the following firm transportation contracts, we can transport maximum daily volumes of (1) 500 MMBtu’s continuing until October 31, 2010, (2) 15,000 MMBtu’s continuing until April 1, 2022, and (3) 10,000 MMBtu’s continuing until April 1, 2017. We have a right to extend each of these contracts, in five-year increments, at the maximum tariff rate. As of December 31, 2009, the maximum commitment remaining under the transportation contracts is approximately $13.5 million.
Recent Accounting Pronouncements
In June 2009, the FASB issued Accounting Standards Update (“ASU”) No. 2009-01, Generally Accepted Accounting Principles (ASU 2009-01). ASU 2009-01 establishes “The FASB Accounting Standards Codification,” or Codification, which became the source of authoritative GAAP recognized by the FASB to be applied by nongovernmental entities. On the effective date, the Codification superseded all then-existing non-SEC accounting and reporting standards. All other nongrandfathered non-SEC accounting literature not included in the Codification will become nonauthoritative. ASU 2009-01 is effective for interim and annual periods ending after September 15, 2009. The Company adopted the provisions of ASU 2009-01 for the period ended September 30, 2009. There was no impact on the Company’s operating results, financial position or cash flows.
In August 2009, the FASB issued ASU No. 2009-05, Fair Value Measurements and Disclosures (ASU 2009-05). ASU 2009-05 amends Subtopic 820-10, Fair Value Measurements and Disclosures, to provide guidance on the fair value measurement of liabilities. ASU 2009-05 provides clarification for circumstances in which a quoted price in an active market for the identical liability is not available. ASU 2009-05 is effective for interim and annual periods beginning after August 26, 2009. The Company adopted the provisions of ASU 2009-05 for the period ended December 31, 2009. There was no impact on the Company’s operating results, financial position or cash flows.
In April 2009, the FASB issued FSP No. FAS 115-2 and FAS 124-2, Recognition and Presentation of Other-Than-Temporary Impairments, (ASC 320-10-65), to expand other-than-temporary impairment guidance for debt securities to enhance the application of the guidance and improve the presentation and disclosure of other-than temporary impairments on debt and equity securities within the financial statements. The adoption of ASC 320-10-65 in the second quarter of 2009 did not have a significant impact on the Company’s operating results, financial position or cash flows.
63
Table of Contents
In April 2009, the FASB issued FSP No. FAS 157-4, Determining Fair Value When the Volume and Level of Activity for the Asset or Liability Have Significantly Decreased and Identifying Transactions That Are Not Orderly, (ASC 820-10-65) to provide additional guidance for estimating fair value when the volume and level of activity for an asset or liability has significantly decreased. In addition, ASC 820-10-65 includes guidance on identifying circumstances that indicate a transaction is not orderly. The adoption of ASC 820-10-65 in the second quarter of 2009 did not have a significant impact on the Company’s operating results, financial position or cash flows.
In December 2008, the SEC issued Release No. 33-8995, Modernization of Oil and Gas Reporting (ASC 2010-3), which amends the oil and gas disclosures for oil and gas producers contained in Regulations S-K and S-X, as well as adding a section to Regulation S-K (Subpart 1200) to codify the revised disclosure requirements in Securities Act Industry Guide 2, which is being eliminated. The goal of Release No. 33-8995 is to provide investors with a more meaningful and comprehensive understanding of oil and gas reserves. Energy companies affected by Release No. 33-8995 are now required to price proved oil and gas reserves using the unweighted arithmetic average of the price on the first day of each month within the 12-month period prior to the end of the reporting period, unless prices are defined by contractual arrangements, excluding escalations based on future conditions. SEC Release No. 33-8995 is effective beginning for financial statements for fiscal years ending on or after December 31, 2009. The impact on the Company’s operating results, financial position and cash flows has been recorded in the financial statements; additional disclosures were added to the accompanying notes to the consolidated financial statements for the Company’s supplemental oil and gas disclosure. See Supplementary Financial and Operating Information on Gas Exploration, Development and Producing Activities (Unaudited) for more details.
In January 2010, the FASB issued FASB ASU No. 2010-03 Oil and Gas Reserve Estimations and Disclosures (ASU 2010-03). This update aligns the current oil and natural gas reserve estimation and disclosure requirements of the Extractive Industries Oil and Gas topic of the FASB Accounting Standards Codification (ASC Topic 932) with the changes required by the SEC final rule ASC 2010-3, as discussed above, ASU 2010-03 expands the disclosures required for equity method investments, revises the definition of oil- and natural gas-producing activities to include nontraditional resources in reserves unless not intended to be upgraded into synthetic oil or natural gas, amends the definition of proved oil and natural gas reserves to require 12-month average pricing in estimating reserves, amends and adds definitions in the Master Glossary that is used in estimating proved oil and natural gas quantities and provides guidance on geographic area with respect to disclosure of information about significant reserves. ASU 2010-03 must be applied prospectively as a change in accounting principle that is inseparable from a change in accounting estimate and is effective for entities with annual reporting periods ending on or after a change in accounting estimate and is effective for entities with annual reporting periods ending on or after December 31, 2009. The Company adopted ASU 2010-03 effective December 31, 2009. See Supplementary Financial and Operating Information on Gas Exploration, Development and Producing Activities (Unaudited) for more details.
Item 7A. Quantitative and Qualitative Disclosures About Market Risk
Commodity Price Risk. Our major commodity price risk exposure is to the prices received for our natural gas production. Realized commodity prices received for our production are natural gas prices per Mcf in effect, adjusted for regional price differentials. Prices received for natural gas are volatile and unpredictable and are beyond our control. At December 31, 2009, a 10% decrease in the prices received for natural gas production would have had a negative impact of approximately $3.9 million on our revenues.
Interest Rate Risk. We have long-term debt subject to the risk of loss associated with movements in interest rates. At December 31, 2009, we had $119.5 million outstanding under our revolving credit facility. At December 31, 2009 the average interest rate for the outstanding amount of the revolving credit facility was 3.03% per annum, respectively. Borrowing availability at December 31, 2009 was $15.5 million. All of the debt outstanding under our revolving credit facility accrues interest at floating or market rates. Fluctuations in market interest rates will cause our interest costs to fluctuate. Based upon the balance outstanding under our revolving
64
Table of Contents
credit facility at December 31, 2009, a 1% increase in market interest rates would have increased interest expense and negatively impacted our annual cash flows by approximately $0.8 million. $45 million of the outstanding balance was excluded from our market rate analysis due to lack of interest rate exposure based on the interest rate swaps we have in place.
Foreign Currency Exchange Rate Risk. We have operations in Canada and do not have operations in any other foreign countries. We do not hedge our foreign currency risk and are exposed to foreign currency exchange rate risk in the Canadian dollar. Because our cash flows from our Canadian project are not material, changes in the exchange rate do not significantly impact our revenues or expenses but primarily affect the costs of unevaluated properties. We continue to monitor the foreign currency exchange rate in Canada and may implement measures to protect against the foreign currency exchange rate risk in the future.
65
Table of Contents
Item 8. Financial Statements and Supplementary Data
GEOMET, INC. AND SUBSIDIARIES
| Page | ||
| CONSOLIDATED AUDITED FINANCIAL STATEMENTS |
||
| 67 | ||
| Consolidated Balance Sheets as of December 31, 2009 and 2008 |
68 | |
| Consolidated Statements of Operations for the years ended December 31, 2009, 2008 and 2007 |
69 | |
| 70 | ||
| Consolidated Statements of Cash Flows for the years ended December 31, 2009, 2008 and 2007 |
71 | |
| 72 | ||
| SUPPLEMENTARY INFORMATION (UNAUDITED)— |
||
| 97 | ||
| 102 | ||
66
Table of Contents
REPORT OF INDEPENDENT REGISTERED PUBLIC ACCOUNTING FIRM
To the Board of Directors and Stockholders of GeoMet, Inc.
Houston, TX
We have audited the accompanying consolidated balance sheets of GeoMet, Inc. and subsidiaries (the “Company”) as of December 31, 2009 and 2008, and the related consolidated statements of operations, stockholders’ equity and comprehensive income (loss), and cash flows for each of the three years in the period ended December 31, 2009. We also have audited the Company’s internal control over financial reporting as of December 31, 2009, based on criteria established in Internal Control—Integrated Framework issued by the Committee of Sponsoring Organizations of the Treadway Commission. The Company’s management is responsible for these financial statements, for maintaining effective internal control over financial reporting, and for its assessment of the effectiveness of internal control over financial reporting, included in the accompanying Management’s Report on Internal Control Over Financial Reporting. Our responsibility is to express an opinion on these financial statements and an opinion on the Company’s internal control over financial reporting based on our audits.
We conducted our audits in accordance with the standards of the Public Company Accounting Oversight Board (United States). Those standards require that we plan and perform the audit to obtain reasonable assurance about whether the financial statements are free of material misstatement and whether effective internal control over financial reporting was maintained in all material respects. Our audits of the financial statements included examining, on a test basis, evidence supporting the amounts and disclosures in the financial statements, assessing the accounting principles used and significant estimates made by management, and evaluating the overall financial statement presentation. Our audit of internal control over financial reporting included obtaining an understanding of internal control over financial reporting, assessing the risk that a material weakness exists, and testing and evaluating the design and operating effectiveness of internal control based on the assessed risk. Our audits also included performing such other procedures as we considered necessary in the circumstances. We believe that our audits provide a reasonable basis for our opinions.
A company’s internal control over financial reporting is a process designed by, or under the supervision of, the company’s principal executive and principal financial officers, or persons performing similar functions, and effected by the company’s board of directors, management, and other personnel to provide reasonable assurance regarding the reliability of financial reporting and the preparation of financial statements for external purposes in accordance with generally accepted accounting principles. A company’s internal control over financial reporting includes those policies and procedures that (1) pertain to the maintenance of records that, in reasonable detail, accurately and fairly reflect the transactions and dispositions of the assets of the company; (2) provide reasonable assurance that transactions are recorded as necessary to permit preparation of financial statements in accordance with generally accepted accounting principles, and that receipts and expenditures of the company are being made only in accordance with authorizations of management and directors of the company; and (3) provide reasonable assurance regarding prevention or timely detection of unauthorized acquisition, use, or disposition of the company’s assets that could have a material effect on the financial statements.
Because of the inherent limitations of internal control over financial reporting, including the possibility of collusion or improper management override of controls, material misstatements due to error or fraud may not be prevented or detected on a timely basis. Also, projections of any evaluation of the effectiveness of the internal control over financial reporting to future periods are subject to the risk that the controls may become inadequate because of changes in conditions, or that the degree of compliance with the policies or procedures may deteriorate.
In our opinion, the consolidated financial statements referred to above present fairly, in all material respects, the financial position of GeoMet, Inc. and subsidiaries as of December 31, 2009 and 2008, and the results of their operations and their cash flows for each of the three years in the period ended December 31, 2009, in conformity with accounting principles generally accepted in the United States of America. Also, in our opinion, the Company maintained, in all material respects, effective internal control over financial reporting as of December 31, 2009, based on the criteria established in Internal Control—Integrated Framework issued by the Committee of Sponsoring Organizations of the Treadway Commission.
As discussed in Note 3 to the consolidated financial statements, on December 31, 2009, the Company adopted Accounting Standards Update No. 2010-03, “Oil and Gas Reserve Estimation and Disclosures”.
/s/ DELOITTE & TOUCHE LLP
Houston, TX
March 31, 2010
67
Table of Contents
CONSOLIDATED BALANCE SHEETS
| December 31, | ||||||||
| 2009 | 2008 | |||||||
| ASSETS | ||||||||
| Current Assets: |
||||||||
| Cash and cash equivalents |
$ | 973,720 | $ | 2,096,561 | ||||
| Accounts receivable, both amounts net of allowance of $60,848 |
2,909,293 | 5,364,456 | ||||||
| Inventory |
2,131,901 | 3,339,228 | ||||||
| Derivative asset |
2,563,898 | 6,596,360 | ||||||
| Other current assets |
475,025 | 541,311 | ||||||
| Total current assets |
9,053,837 | 17,937,916 | ||||||
| Gas properties—utilizing the full cost method of accounting: |
||||||||
| Proved gas properties |
461,003,091 | 447,968,536 | ||||||
| Unevaluated gas properties, not subject to amortization |
— | 5,017 | ||||||
| Other property and equipment |
3,480,202 | 3,429,890 | ||||||
| Total property and equipment |
464,483,293 | 451,403,443 | ||||||
| Less accumulated depreciation, depletion, amortization and impairment of gas properties |
(365,784,964 | ) | (93,104,323 | ) | ||||
| Property and equipment—net |
98,698,329 | 358,299,120 | ||||||
| Other noncurrent assets: |
||||||||
| Derivative asset |
761,192 | 723,669 | ||||||
| Deferred income taxes |
51,804,971 | — | ||||||
| Other |
609,972 | 639,648 | ||||||
| Total other noncurrent assets |
53,176,135 | 1,363,317 | ||||||
| TOTAL ASSETS |
$ | 160,928,301 | $ | 377,600,353 | ||||
| LIABILITIES AND STOCKHOLDERS’ EQUITY | ||||||||
| Current Liabilities: |
||||||||
| Accounts payable |
$ | 5,169,174 | $ | 13,384,675 | ||||
| Accrued liabilities |
2,808,227 | 2,623,640 | ||||||
| Deferred income taxes |
157,256 | 2,426,798 | ||||||
| Derivative liability |
724,253 | 714,903 | ||||||
| Asset retirement liability |
108,111 | 117,423 | ||||||
| Current portion of long-term debt |
121,792 | 111,767 | ||||||
| Total current liabilities |
9,088,813 | 19,379,206 | ||||||
| Long-term debt |
119,996,163 | 117,117,955 | ||||||
| Asset retirement liability |
4,862,278 | 4,348,938 | ||||||
| Other long-term accrued liabilities |
73,308 | 105,890 | ||||||
| Derivative liability |
— | 374,489 | ||||||
| Deferred income taxes |
— | 43,841,950 | ||||||
| TOTAL LIABILITIES |
134,020,562 | 185,168,428 | ||||||
| Commitments and contingencies (Note 15) |
||||||||
| Stockholders’ Equity: |
||||||||
| Preferred stock, $0.001 par value—authorized 10,000,000, none issued |
— | — | ||||||
| Common stock, $0.001 par value—authorized 125,000,000 shares; issued and outstanding 39,460,060 and 39,305,152 at December 31, 2009 and December 31, 2008, respectively |
39,294 | 39,050 | ||||||
| Treasury stock—10,432 shares at December 31, 2009 and December 31, 2008 |
(94,424 | ) | (93,811 | ) | ||||
| Paid-in capital |
189,681,816 | 188,692,242 | ||||||
| Accumulated other comprehensive loss |
(1,768,521 | ) | (2,399,992 | ) | ||||
| Retained (deficit) earnings |
(160,710,889 | ) | 6,422,772 | |||||
| Less notes receivable |
(239,537 | ) | (228,336 | ) | ||||
| Total stockholders’ equity |
26,907,739 | 192,431,925 | ||||||
| TOTAL LIABILITIES AND STOCKHOLDERS’ EQUITY |
$ | 160,928,301 | $ | 377,600,353 | ||||
See accompanying Notes to Consolidated Audited Financial Statements.
68
Table of Contents
CONSOLIDATED STATEMENTS OF OPERATIONS
FOR THE YEARS ENDED DECEMBER 31,
| 2009 | 2008 | 2007 | ||||||||||
| Revenues: |
||||||||||||
| Gas sales |
$ | 30,596,551 | $ | 68,313,948 | $ | 49,694,489 | ||||||
| Operating fees and other |
367,519 | 780,267 | 1,289,575 | |||||||||
| Total revenues |
30,964,070 | 69,094,215 | 50,984,064 | |||||||||
| Expenses: |
||||||||||||
| Lease operating expense |
13,934,840 | 14,756,521 | 13,981,093 | |||||||||
| Compression and transportation expense |
5,011,511 | 4,498,243 | 5,209,206 | |||||||||
| Production taxes |
1,178,435 | 2,136,963 | 1,164,159 | |||||||||
| Depreciation, depletion and amortization |
12,029,982 | 10,589,490 | 9,091,610 | |||||||||
| Impairment of gas properties |
257,288,257 | 50,733,757 | — | |||||||||
| General and administrative |
8,349,268 | 9,368,279 | 9,294,279 | |||||||||
| Realized losses (gains) on derivative contracts |
(10,694,496 | ) | 500,452 | (3,895,138 | ) | |||||||
| Unrealized (gains) losses from the change in market value of open derivative contracts |
3,995,327 | (4,993,238 | ) | 3,006,916 | ||||||||
| Total operating expenses |
291,093,124 | 87,590,467 | 37,852,125 | |||||||||
| Operating (loss) income from continuing operations |
(260,129,054 | ) | (18,496,252 | ) | 13,131,939 | |||||||
| Other income (expense): |
||||||||||||
| Interest income |
27,739 | 43,876 | 39,341 | |||||||||
| Interest expense (net of amounts capitalized) |
(5,174,185 | ) | (4,783,076 | ) | (5,129,847 | ) | ||||||
| Other |
80 | 36,961 | (58,589 | ) | ||||||||
| Total other income (expense): |
(5,146,366 | ) | (4,702,239 | ) | (5,149,095 | ) | ||||||
| (Loss) income before income taxes & discontinued operations |
(265,275,420 | ) | (23,198,491 | ) | 7,982,844 | |||||||
| Income tax (benefit) expense |
(98,141,759 | ) | (711,900 | ) | 2,987,407 | |||||||
| (Loss) income before discontinued operations |
(167,133,661 | ) | (22,486,591 | ) | 4,995,437 | |||||||
| Income from discontinued operations, net of tax |
— | — | 173,782 | |||||||||
| Net (loss) income |
$ | (167,133,661 | ) | $ | (22,486,591 | ) | $ | 5,169,219 | ||||
| (Loss) earnings per share: |
||||||||||||
| (Loss) income from continuing operations |
||||||||||||
| Basic |
$ | (4.28 | ) | $ | (0.58 | ) | $ | 0.13 | ||||
| Diluted |
$ | (4.28 | ) | $ | (0.58 | ) | $ | 0.13 | ||||
| Discontinued operations |
||||||||||||
| Basic |
$ | — | $ | — | $ | — | ||||||
| Diluted |
$ | — | $ | — | $ | — | ||||||
| Net (loss) income per common share |
||||||||||||
| Basic |
$ | (4.28 | ) | $ | (0.58 | ) | $ | 0.13 | ||||
| Diluted |
$ | (4.28 | ) | $ | (0.58 | ) | $ | 0.13 | ||||
| Weighted average number of common shares: |
||||||||||||
| Basic |
39,084,740 | 38,856,841 | 38,822,671 | |||||||||
| Diluted |
39,084,740 | 38,856,841 | 39,699,694 | |||||||||
See accompanying Notes to Consolidated Audited Financial Statements.
69
Table of Contents
CONSOLIDATED STATEMENTS OF STOCKHOLDERS’ EQUITY
AND COMPREHENSIVE INCOME (LOSS)
| Common Stock Par Value $0.001 (shares outstanding) |
Common Stock Par Value $0.001 |
Treasury Stock |
Paid-in Capital |
Accumulated Other Comprehensive Income (Loss) |
Retained Earnings (Deficit) |
Notes Receivable |
Total Stockholders’ Equity |
||||||||||||||||||||||||
| Balance at January 1, 2007 |
38,678,713 | $ | 38,679 | $ | — | $ | 186,852,852 | $ | (193,888 | ) | $ | 23,740,144 | $ | (430,281 | ) | $ | 210,007,506 | ||||||||||||||
| Restricted stock awards |
178,081 | 178 | (178 | ) | — | ||||||||||||||||||||||||||
| Exercise of stock options |
105,565 | 105 | 224,660 | 224,765 | |||||||||||||||||||||||||||
| Stock-based compensation |
526,575 | 526,575 | |||||||||||||||||||||||||||||
| Purchase of treasury stock |
(70,452 | ) | 66,070 | (4,382 | ) | ||||||||||||||||||||||||||
| Payments on notes receivable |
164,134 | 164,134 | |||||||||||||||||||||||||||||
| Accrued interest on notes receivable |
17,027 | (17,027 | ) | — | |||||||||||||||||||||||||||
| Comprehensive income: |
|||||||||||||||||||||||||||||||
| Net income |
5,169,219 | 5,169,219 | |||||||||||||||||||||||||||||
| Gain on interest rate swap, net of income tax of $0 |
10,884 | 10,884 | |||||||||||||||||||||||||||||
| Foreign currency translation adjustment, net of income tax of $0 |
2,577,005 | 2,577,005 | |||||||||||||||||||||||||||||
| Total comprehensive income |
7,757,108 | ||||||||||||||||||||||||||||||
| Balance at December 31, 2007 |
38,962,359 | $ | 38,962 | $ | (70,452 | ) | $ | 187,620,936 | $ | 2,394,001 | $ | 28,909,363 | $ | (217,104 | ) | $ | 218,675,706 | ||||||||||||||
| Exercise of stock options |
68,605 | 69 | 118,377 | 118,446 | |||||||||||||||||||||||||||
| Stock-based compensation |
18,720 | 19 | 941,697 | 941,716 | |||||||||||||||||||||||||||
| Purchase of treasury stock |
(23,359 | ) | (23,359 | ) | |||||||||||||||||||||||||||
| Accrued interest on notes receivable |
11,232 | (11,232 | ) | — | |||||||||||||||||||||||||||
| Comprehensive loss: |
|||||||||||||||||||||||||||||||
| Net loss |
(22,486,591 | ) | (22,486,591 | ) | |||||||||||||||||||||||||||
| Loss on interest rate swap, net of income taxes of $410,906 |
(689,370 | ) | (689,370 | ) | |||||||||||||||||||||||||||
| Foreign currency translation adjustment, net of income taxes of $0 |
(4,104,623 | ) | (4,104,623 | ) | |||||||||||||||||||||||||||
| Total comprehensive income |
(27,280,584 | ) | |||||||||||||||||||||||||||||
| Balance at December 31, 2008 |
39,049,684 | $ | 39,050 | $ | (93,811 | ) | $ | 188,692,242 | $ | (2,399,992 | ) | $ | 6,422,772 | $ | (228,336 | ) | $ | 192,431,925 | |||||||||||||
| Stock-based compensation |
244,705 | 245 | 978,373 | 978,618 | |||||||||||||||||||||||||||
| Purchase and cancellation of treasury stock |
(406 | ) | (1 | ) | (613 | ) | (614 | ) | |||||||||||||||||||||||
| Accrued interest on notes receivable |
11,201 | (11,201 | ) | — | |||||||||||||||||||||||||||
| Comprehensive loss: |
|||||||||||||||||||||||||||||||
| Net loss |
(167,133,661 | ) | (167,133,661 | ) | |||||||||||||||||||||||||||
| Gain on interest rate swap, net of income taxes of $134,389 |
231,138 | 231,138 | |||||||||||||||||||||||||||||
| Foreign currency translation adjustment, net of income taxes of $0 |
400,333 | 400,333 | |||||||||||||||||||||||||||||
| Total comprehensive income |
(166,502,190 | ) | |||||||||||||||||||||||||||||
| Balance at December 31, 2009 |
39,293,983 | $ | 39,294 | $ | (94,424 | ) | $ | 189,681,816 | $ | (1,768,521 | ) | $ | (160,710,889 | ) | $ | (239,537 | ) | $ | 26,907,739 | ||||||||||||
See accompanying Notes to Consolidated Audited Financial Statements.
70
Table of Contents
CONSOLIDATED STATEMENTS OF CASH FLOWS
| Years Ended December 31, | ||||||||||||
| 2009 | 2008 | 2007 | ||||||||||
| Cash flows provided by operating activities: |
||||||||||||
| Net (loss) income |
$ | (167,133,661 | ) | $ | (22,486,591 | ) | $ | 5,169,219 | ||||
| Adjustments to reconcile net (loss) income to net cash flows provided by operating activities: |
||||||||||||
| Depreciation, depletion and amortization |
12,029,982 | 10,589,490 | 9,265,167 | |||||||||
| Impairment of gas properties |
257,288,257 | 50,733,757 | — | |||||||||
| Amortization of debt issuance costs |
196,152 | 172,935 | 146,280 | |||||||||
| Deferred income tax (benefit) expense |
(98,050,852 | ) | (736,900 | ) | 3,066,333 | |||||||
| Unrealized losses (gains) from the change in market value of open derivative contracts (including premium amortization) |
3,995,327 | (4,993,238 | ) | 3,006,916 | ||||||||
| Stock-based compensation |
792,560 | 566,416 | 311,482 | |||||||||
| Loss (gain) on sale of other assets |
22,248 | 41,521 | (64,834 | ) | ||||||||
| Accretion expense |
431,733 | 365,103 | 209,850 | |||||||||
| Allowance for doubtful accounts |
— | 60,848 | — | |||||||||
| Changes in operating assets and liabilities: |
||||||||||||
| Accounts receivable |
2,553,045 | (595,689 | ) | 6,111,907 | ||||||||
| Other current assets |
(102,448 | ) | (1,058,790 | ) | (2,348,588 | ) | ||||||
| Accounts payable |
(3,394,439 | ) | 3,130,996 | 244,892 | ||||||||
| Accrued income tax payable |
— | — | (6,709,656 | ) | ||||||||
| Other accrued liabilities |
(109,645 | ) | (2,831,465 | ) | (922,101 | ) | ||||||
| Net cash provided by operating activities |
8,518,259 | 32,958,393 | 17,486,867 | |||||||||
| Cash flows used in investing activities: |
||||||||||||
| Capital expenditures (including lease acquisitions) |
(12,566,498 | ) | (52,797,122 | ) | (54,026,382 | ) | ||||||
| Proceeds from sale of assets |
36,315 | 43,084 | 126,285 | |||||||||
| Other assets |
(166,260 | ) | 35,161 | 67,927 | ||||||||
| Net cash used in investing activities |
(12,696,443 | ) | (52,718,877 | ) | (53,832,170 | ) | ||||||
| Cash flows provided by financing activities: |
||||||||||||
| Debt issuance costs |
— | — | (100,000 | ) | ||||||||
| Proceeds from exercise of stock options |
— | 118,446 | 224,765 | |||||||||
| Proceeds from revolver borrowings |
39,350,000 | 115,000,000 | 83,000,000 | |||||||||
| Payments on revolver |
(36,350,000 | ) | (94,500,000 | ) | (47,000,000 | ) | ||||||
| Treasury stock |
(613 | ) | (23,359 | ) | (4,382 | ) | ||||||
| Proceeds from notes receivable and accrued interest |
— | — | 164,134 | |||||||||
| Payments on other debt |
(111,767 | ) | (102,586 | ) | (93,979 | ) | ||||||
| Net cash provided by financing activities |
2,887,620 | 20,492,501 | 36,190,538 | |||||||||
| Effect of exchange rate changes on cash and cash equivalents |
167,723 | (175,972 | ) | 280,805 | ||||||||
| Increase (decrease) in cash and cash equivalents |
(1,122,841 | ) | 556,045 | 126,040 | ||||||||
| Cash and cash equivalents at beginning of year |
2,096,561 | 1,540,516 | 1,414,476 | |||||||||
| Cash and cash equivalents at end of year |
$ | 973,720 | $ | 2,096,561 | $ | 1,540,516 | ||||||
| Supplemental disclosure of cash flow information: |
||||||||||||
| Cash paid during the year for: |
||||||||||||
| Interest expense |
$ | 5,197,538 | $ | 4,891,199 | $ | 5,672,771 | ||||||
| Income taxes |
$ | 25,000 | $ | 36,192 | $ | 25,000 | ||||||
| Significant noncash investing and financing activities: |
||||||||||||
| Accrued capital expenditures |
$ | 397,375 | $ | 5,556,897 | $ | 1,994,186 | ||||||
See accompanying Notes to Consolidated Audited Financial Statements.
71
Table of Contents
NOTES TO CONSOLIDATED AUDITED FINANCIAL STATEMENTS
Note 1—Organization and Our Business
GeoMet, Inc. (“GeoMet,” “Company,” “we,” or “our”) (formerly GeoMet Resources, Inc.) was incorporated under the laws of the state of Delaware on November 9, 2000. We are an independent natural gas producer primarily involved in the exploration, development and production of natural gas from coal seams (coal bed methane) and non-conventional shallow gas. Our principal operations and producing properties are located in Alabama, West Virginia, Virginia and Canada.
Note 2—Summary of Significant Accounting Policies
Principles of Consolidation—The accompanying Consolidated Audited Financial Statements are presented in conformity with accounting principles generally accepted in the United States of America (“GAAP”) and include our accounts and the accounts of our wholly-owned subsidiaries, GeoMet Operating Company, Inc., GeoMet Gathering Company LLC, GeoMet Gathering Virginia, Inc., Hudson’s Hope Gas, Ltd. and Shamrock Energy LLC. All inter-company accounts and transactions have been eliminated in consolidation.
Use of Estimates in the Preparation of Financial Statements—The preparation of consolidated financial statements in conformity with GAAP requires management to make estimates and assumptions that affect the reported amounts of assets and liabilities and disclosure of contingent assets and liabilities at the date of the consolidated audited financial statements and the reported amounts of revenues and expenses during the reporting period. Our most significant financial estimates are related to our proved gas reserves. Estimates of proved gas reserves are key components of our depletion rate for natural gas properties, our unevaluated properties and our full cost ceiling test limitation. In addition, other significant estimates include estimates used in computing taxes, stock-based compensation, asset retirement obligations, fair value of derivative contracts and accrued receivables and payables. Actual results could differ from these estimates.
Gas Properties—The method of accounting for gas properties determines what costs are capitalized and how these costs are ultimately matched with revenues and expenses. We use the full cost method of accounting for gas properties as prescribed by the United States Securities and Exchange Commission (“SEC”). For more information see Note 6—Gas Properties.
Unevaluated Properties—The costs directly associated with unevaluated properties and properties under development are not initially included in the amortization base and relate to unproved leasehold acreage, seismic data, wells and production facilities in progress and wells pending determination of proved reserves together with overhead and interest costs capitalized for these projects. Unevaluated leasehold costs are transferred to the amortization base once determination has been made or upon expiration of a lease. Geological and geophysical costs associated with a specific unevaluated property are transferred to the amortization base with the associated leasehold costs on a specific project basis. Costs associated with wells in progress and wells pending determination are transferred to the amortization base once a determination is made whether or not proved reserves can be assigned to the property. All items included in our unevaluated property balance are assessed on a quarterly basis for possible impairment or reduction in value. Any impairment to unevaluated properties is transferred to the amortization base.
Asset Retirement Liability—ASC 410-20-25 establishes accounting and reporting standards for retirement obligations associated with tangible long-lived assets that result from the legal obligation to plug, abandon and dismantle existing wells and facilities that we have acquired, constructed or developed. It requires that the fair value of the liability for asset retirement obligations be recognized in the period in which it is incurred. Upon initial recognition of the asset retirement liability, the asset retirement cost is capitalized by increasing the
72
Table of Contents
GEOMET, INC. AND SUBSIDIARIES
NOTES TO CONSOLIDATED AUDITED FINANCIAL STATEMENTS—(Continued)
carrying amount of the long-lived asset by the same amount as the liability. The liability is accreted to its then present value each period, and the capitalized cost is depreciated over the useful life of the related asset.
Other Property and Equipment—The cost of other property and equipment is depreciated over the estimated useful lives of the related assets. The cost of leasehold improvements is depreciated over the lesser of the length of the related leases or the estimated useful lives of the assets. Depreciation is computed on the straight-line basis over the following estimated useful lives which range from three to seven years.
| Furniture and fixtures |
7 years | |
| Automobiles |
3 years | |
| Machinery and equipment |
5 years | |
| Software and computer equipment |
3 years |
Cash and Cash Equivalents—For purposes of these statements, short-term investments, which have an original maturity of three months or less, are considered cash equivalents.
Inventory—Inventory consists primarily of materials and supplies used in the development and production of coal bed methane and is recorded at the lower of cost or market value using the specific identification costing method.
Notes Receivable Included in Stockholders’ Equity—We have loaned money to employees to purchase our common stock. Such amounts, including accrued interest, are recorded as Notes Receivable, and are included as a component of Stockholders’ Equity. The balances at December 31, 2009 and 2008 are solely attributable to employees.
Income Taxes—We record our income taxes using an asset and liability approach in accordance with the provisions of ASC 740, formerly Statement of Financial Accounting Standards (“SFAS”) No. 109, Accounting for Income Taxes. This results in the recognition of deferred tax assets and liabilities for the expected future tax consequences of temporary differences between the book carrying amounts and the tax bases of assets and liabilities using enacted tax rates at the end of the period. Under ASC 740, the effect of a change in tax rates of deferred tax assets and liabilities is recognized in the year of the enacted change. Deferred tax assets are reduced by a valuation allowance when, in the opinion of management, it is more likely than not that some portion or all of the deferred tax assets will not be realized.
Estimating the amount of valuation allowance is dependent on estimates of future taxable income, alternative minimum tax income, and changes in stockholder ownership that could trigger limits on use of net operating losses under Internal Revenue Code Section 382. We have a significant deferred tax asset associated with net operating loss carryforwards (“NOL’s”).
ASC 740 also clarifies the accounting for uncertainty in income taxes recognized in an entity’s financial statements and prescribes a consistent threshold and measurement attribute for financial statement recognition and disclosure of tax positions taken, or expected to be taken, on a tax return.
Revenue Recognition and Gas Balancing—We derive revenue primarily from the sale of produced natural gas. We use the sales method of accounting for the recognition of gas revenue whereby revenues, net of royalties, are recognized as the production is sold to purchaser. The amount of gas sold may differ from the amount to which the Company is entitled based on its working interest or net revenue interest in the properties. We typically do not have any significant producer gas imbalance positions because we own 100% working interest in
73
Table of Contents
GEOMET, INC. AND SUBSIDIARIES
NOTES TO CONSOLIDATED AUDITED FINANCIAL STATEMENTS—(Continued)
the majority of our properties. A ready market for natural gas allows us to sell our natural gas shortly after production at various pipeline receipt points at which time title and risk of loss transfers to the buyer. Revenue is recorded when title is transferred based on our nominations and net revenue interests. Pipeline imbalances occur when our production delivered into the pipeline varies from the gas we nominated for sale. Pipeline imbalances are settled with cash approximately thirty days from date of production and are recorded as a reduction of revenue or increase of revenue depending upon whether we are over-delivered or under-delivered.
Settlements of gas sales occur after the month in which the gas was produced. We estimate and accrue for the value of these sales using information available at the time financial statements are generated. Differences are reflected in the accounting period during which payments are received from the purchaser.
Industry Segment and Geographic Information—We operate in one industry, which is the exploration, development and production of natural gas. Our operational activities are conducted in the U.S. and Canada with only the U.S. currently having material revenue generating operating results.
Concentrations of Market Risk—Our future results will be affected by the market price of natural gas. The availability of a ready market for natural gas will depend on numerous factors beyond our control, including weather, production of natural gas, imports, marketing, competitive fuels, proximity of natural gas pipelines and other transportation facilities, any oversupply or undersupply of natural gas, the regulatory environment, and other regional and political events, none of which can be predicted with certainty.
Concentration of Credit Risk—Financial instruments, which subject us to concentrations of credit risk, consist primarily of cash, accounts receivable and derivative assets. We place our cash investments with highly qualified financial institutions. Risks with respect to receivables as of December 31, 2009 and 2008 arise substantially from the sales of natural gas and joint interest billings. We routinely assess the recoverability of all material trade and other receivables to determine their collectability. We accrue a reserve on a receivable when, based on management’s judgment, it is probable that a receivable will not be collected and the amount of such reserve may be reasonably estimated. Risks with respect to derivative assets as of December 31, 2009 arise from cash settlements due to us from our derivative counterparties. We have primarily one purchaser of our natural gas production. For the year ended December 31, 2009, 2008 and 2007, the aforementioned purchaser purchased 99%, 100% and 100%, respectively, of our net natural gas production. As of December 31, 2009 and 2008, the aforementioned purchaser represented 98% and 99%, respectively, of our accounts receivable related to gas sales. At December 31, 2009 and 2008, we have recorded an allowance for doubtful accounts receivable of $60,848 related to other revenue and not a purchaser of our natural gas. We have not experienced any significant losses from uncollectible accounts. We do not believe the loss of our purchaser would materially affect our ability to sell the natural gas we produce as we believe other purchasers are available in our area of operations.
Fair Value of Financial Instruments—The fair value of cash and cash equivalents, current receivables and payables, approximate book value because of the short maturity of these accounts. The outstanding note receivable in Other Non-Current Assets and certain Other Debt carries a fixed interest rate. See Notes 5 and 9 for the fair values of the receivable and debt.
Operating Fees and Other—Operating fees and other for the years ended December 31, 2009, 2008 and 2007 include produced water disposal fees.
Capitalized General and Administrative Expenses—Under the full cost method of accounting, a portion of our general and administrative expenses that are directly attributable to our acquisition, exploration and development activities are capitalized as part of our natural gas properties. These capitalized costs include
74
Table of Contents
GEOMET, INC. AND SUBSIDIARIES
NOTES TO CONSOLIDATED AUDITED FINANCIAL STATEMENTS—(Continued)
salaries, employee benefits, costs of consulting services and other costs directly associated with those activities. We capitalized general and administrative costs related to our acquisition, exploration and development activities, during the periods ended December 31, 2009, 2008, and 2007 of $1,485,510, $2,329,748, and $1,991,760, respectively.
Capitalized Interest Costs—We capitalize interest based on the cost of major development projects which are excluded from current depreciation, depletion and amortization calculations. For the year ended December 31, 2009 we did not capitalize any interest. For the years ended December 31, 2008 and 2007, we capitalized $304,342 and $587,884 of interest, respectively. See Unevaluated Properties above for additional information on the criteria for including costs in unevaluated properties.
Derivative Instruments and Hedging Activities. Our hedging activities consist of derivative instruments entered into to hedge against changes in natural gas prices and changes in interest rates related to outstanding debt under our credit facility primarily through the use of fixed price swap agreements, basis swap agreements, three-way collars, and traditional collars. Consistent with our hedging policy, we entered into a series of derivative instruments to hedge a significant portion of our expected natural gas production through 2010 and 2011. We also entered into an interest rate swap agreement to hedge interest rates associated with a portion of our variable rate debt through 2011. Typically, these derivative instruments require payments to (receipts from) counterparties based on specific indices as required by the derivative agreements. These transactions are recorded in our consolidated audited financial statements in accordance with ASC 815, formerly SFAS No. 133, Accounting for Derivative Instruments and Hedging Activities. Although not risk free, we believe this policy will reduce our exposure to natural gas price fluctuations and changes in interest rates and thereby achieve a more predictable cash flow. As a result, our derivative instruments are cash flow hedge transactions in which we are hedging the variability of cash flow related to a forecasted transaction. We do not enter into derivative instruments for trading or other speculative purposes. In accordance with ASC 815-20-25, as amended, all our derivative instruments are recorded on the balance sheet at fair value and changes in the fair value of the derivatives are recorded each period in current earnings for the natural gas derivatives or other comprehensive income (loss) for our interest rate swaps. The natural gas derivatives have not been designated as hedge transactions while the interest rate swaps qualify and have been designated as such in accordance with ASC 815-20-25.
At the inception of a derivative contract, we may designate the derivative as a cash flow hedge. For all derivatives designated as cash flow hedges, we document the relationship between the derivative instrument and the hedged items as well as the risk management objective for entering into the derivative instrument. To be designated as a cash flow hedge transaction, the relationship between the derivative and hedge items must be highly effective in achieving the offset of changes in cash flows attributable to the risk both at the inception of the derivative and on an ongoing basis.
Foreign Currency Translation—For our wholly-owned Canadian subsidiary, Hudson’s Hope Gas, Ltd., whose functional currency is deemed to be other than the U.S. dollar, asset and liability accounts are translated at period end exchange rates and revenue and expenses are translated at average exchange rates prevailing during the period. Translation adjustments are included in the Accumulated Other Comprehensive Income (Loss). Any gains or losses on transactions or monetary assets or liabilities in currencies other than the functional currency are included in net (loss) income in the current period. Hudson’s Hope Gas, Ltd. is our only foreign subsidiary.
Stock-Based Compensation—We use the fair value recognition provisions of ASC 718, formerly SFAS No. 123(R), Share-Based Payment, using the prospective transition method. The application of ASC 718 requires the use of an option pricing model, such as the Black Scholes model, to measure the estimated fair value of the options and as a result various assumptions must be made by management that require judgment and the
75
Table of Contents
GEOMET, INC. AND SUBSIDIARIES
NOTES TO CONSOLIDATED AUDITED FINANCIAL STATEMENTS—(Continued)
assumptions could be highly uncertain. For share-based awards outstanding as of January 1, 2006, we will continue using the accounting principles originally applied to those awards before adoption. Therefore, we will not recognize any equity compensation cost on these prior awards in the future unless such awards are modified, repurchased or cancelled.
Discontinued Operations—We use the criteria in ASC 360, formerly SFAS No. 144, Accounting for the Impairment or Disposal of Long-Lived Assets, applying the conditions included therein to determine whether our components that are being disposed of or are classified as held for sale are required to be reported as discontinued operations in the Consolidated Statements of Operations. To qualify as a discontinued operation under ASC 360, the component being disposed of must have clearly distinguishable operations and cash flows. Additionally, we must not have significant continuing involvement in the operations after the disposal (i.e. we must not have the ability to influence the operating or financial policies of the disposed component) and cash flows of the operations being disposed of must have been eliminated from GeoMet’s ongoing operations (i.e. we do not expect to generate significant direct cash flows from activities involving the disposed component after the disposal transaction is completed).
Assuming both preceding conditions are met, the related results of operations for the current and prior periods, including any related impairments, are reflected as Income From Discontinued Operations, net of income tax, in the Consolidated Statements of Operations.
Fair Value Measurement—Effective January 1, 2008, we adopted ASC 820-10-55, formerly SFAS No. 157, Fair Value Measurements, which provides a framework for measuring fair value under GAAP. ASC 820-10-55 defines fair value as the exchange price that would be received for an asset or paid to transfer a liability (an exit price) in the principal or most advantageous market for the asset or liability in an orderly transaction between market participants on the measurement date. ASC 820-10-55 also establishes a fair value hierarchy that requires an entity to maximize the use of observable inputs and minimize the use of unobservable inputs when measuring fair value. The standard describes three levels of inputs that may be used to measure fair value. Level 1 inputs are quoted prices (unadjusted) in active markets for identical assets or liabilities that the reporting entity has the ability to access at the measurement date. Level 2 inputs other than quoted prices included within Level 1 that are observable for the asset or liability, either directly or indirectly, such as quoted prices for similar assets or liabilities; quoted prices in markets that are not active; or other inputs that are observable or can be corroborated by observable market data for substantially the full term of the assets or liabilities. Level 3 inputs are derived from unobservable inputs that are supported by little or no market activity and that are significant to the fair value of the assets or liabilities. See disclosure related to the implementation of ASC 820-10-55 in Note 8—Derivative Instruments and Hedging Activities.
Note 3—Recent Accounting Pronouncements
In June 2009, the FASB issued Accounting Standards Update (“ASU”) No. 2009-01, Generally Accepted Accounting Principles (ASU 2009-01). ASU 2009-01 establishes “The FASB Accounting Standards Codification,” or Codification, which became the source of authoritative GAAP recognized by the FASB to be applied by nongovernmental entities. On the effective date, the Codification superseded all then-existing non-SEC accounting and reporting standards. All other nongrandfathered non-SEC accounting literature not included in the Codification became nonauthoritative. ASU 2009-01 was effective for interim and annual periods ending after September 15, 2009. The Company adopted the provisions of ASU 2009-01 for the period ended September 30, 2009. There was no impact on the Company’s operating results, financial position or cash flows.
In August 2009, the FASB issued ASU No. 2009-05, Fair Value Measurements and Disclosures (ASU 2009-05). ASU 2009-05 amends Subtopic 820-10, Fair Value Measurements and Disclosures, to provide
76
Table of Contents
GEOMET, INC. AND SUBSIDIARIES
NOTES TO CONSOLIDATED AUDITED FINANCIAL STATEMENTS—(Continued)
guidance on the fair value measurement of liabilities. ASU 2009-05 provides clarification for circumstances in which a quoted price in an active market for the identical liability is not available. ASU 2009-05 is effective for interim and annual periods beginning after August 26, 2009. The Company adopted the provisions of ASU 2009-05 for the period ended December 31, 2009. There was no impact on the Company’s operating results, financial position or cash flows.
In April 2009, the FASB issued FSP No. FAS 115-2 and FAS 124-2, Recognition and Presentation of Other-Than-Temporary Impairments, (ASC 320-10-65), to expand other-than-temporary impairment guidance for debt securities to enhance the application of the guidance and improve the presentation and disclosure of other-than temporary impairments on debt and equity securities within the financial statements. The adoption of ASC 320-10-65 in the second quarter of 2009 did not have a significant impact on the Company’s operating results, financial position or cash flows.
In April 2009, the FASB issued FSP No. FAS 157-4, Determining Fair Value When the Volume and Level of Activity for the Asset or Liability Have Significantly Decreased and Identifying Transactions That Are Not Orderly, (ASC 820-10-65) to provide additional guidance for estimating fair value when the volume and level of activity for an asset or liability has significantly decreased. In addition, ASC 820-10-65 includes guidance on identifying circumstances that indicate a transaction is not orderly. The adoption of ASC 820-10-65 in the second quarter of 2009 did not have a significant impact on the Company’s operating results, financial position or cash flows.
In December 2008, the SEC issued Release No. 33-8995, Modernization of Oil and Gas Reporting (ASC 2010-3), which amends the oil and gas disclosures for oil and gas producers contained in Regulations S-K and S-X, as well as adding a section to Regulation S-K (Subpart 1200) to codify the revised disclosure requirements in Securities Act Industry Guide 2, which is being eliminated. The goal of Release No. 33-8995 is to provide investors with a more meaningful and comprehensive understanding of oil and gas reserves. Energy companies affected by Release No. 33-8995 are now required to price proved oil and gas reserves using the unweighted arithmetic average of the price on the first day of each month within the 12-month period prior to the end of the reporting period, unless prices are defined by contractual arrangements, excluding escalations based on future conditions. SEC Release No. 33-8995 is effective beginning for financial statements for fiscal years ending on or after December 31, 2009. The impact on the Company’s operating results, financial position and cash flows has been recorded in the financial statements; additional disclosures were added to the accompanying notes to the consolidated financial statements for the Company’s supplemental oil and gas disclosure. See Supplementary Financial and Operating Information on Gas Exploration, Development and Producing Activities (Unaudited) for more details.
In January 2010, the FASB issued FASB Accounting Standards Update (“ASU”) No. 2010-03 Oil and Gas Reserve Estimations and Disclosures (ASU 2010-03). This update aligns the current oil and natural gas reserve estimation and disclosure requirements of the Extractive Industries Oil and Gas topic of the FASB Accounting Standards Codification (ASC Topic 932) with the changes required by the SEC final rule ASC 2010-3, as discussed above, ASU 2010-03 expands the disclosures required for equity method investments, revises the definition of oil- and natural gas-producing activities to include nontraditional resources in reserves unless not intended to be upgraded into synthetic oil or natural gas, amends the definition of proved oil and natural gas reserves to require 12-month average pricing in estimating reserves, amends and adds definitions in the Master Glossary that is used in estimating proved oil and natural gas quantities and provides guidance on geographic area with respect to disclosure of information about significant reserves. ASU 2010-03 must be applied prospectively as a change in accounting principle that is inseparable from a change in accounting estimate and is effective for entities with annual reporting periods ending on or after a change in accounting estimate and is effective for entities with annual reporting periods ending on or after December 31, 2009. The Company adopted ASU 2010-03 effective December 31, 2009. See Supplementary Financial and Operating Information on Gas Exploration, Development and Producing Activities (Unaudited) for more details.
77
Table of Contents
GEOMET, INC. AND SUBSIDIARIES
NOTES TO CONSOLIDATED AUDITED FINANCIAL STATEMENTS—(Continued)
Note 4—Net (Loss) Income Per Share
Net (Loss) Income Per Share of Common Stock—Basic (loss) income per share is calculated by dividing net (loss) income by the weighted average number of shares of common stock outstanding during the period. No dilution for any potentially dilutive securities is included. Fully diluted net (loss) income per share assumes the conversion of all potentially dilutive securities and is calculated by dividing net (loss) income by the sum of the weighted average number of shares of common stock outstanding plus potentially dilutive securities. Dilutive (loss) income per share considers the impact of potentially dilutive securities except in periods in which there is a loss because the inclusion of the potential common shares would have an anti-dilutive effect. A reconciliation of the numerator and denominator is as follows:
| 2009 | 2008 | 2007 | |||||||||
| (Loss) income from continuing operations |
|||||||||||
| Basic |
$ | (4.28 | ) | $ | (0.58 | ) | $ | 0.13 | |||
| Diluted |
$ | (4.28 | ) | $ | (0.58 | ) | $ | 0.13 | |||
| Discontinued operations |
|||||||||||
| Basic |
$ | — | $ | — | $ | — | |||||
| Diluted |
$ | — | $ | — | $ | — | |||||
| Net (loss) income per common share |
|||||||||||
| Basic |
$ | (4.28 | ) | $ | (0.58 | ) | $ | 0.13 | |||
| Diluted |
$ | (4.28 | ) | $ | (0.58 | ) | $ | 0.13 | |||
| Numerator |
|||||||||||
| Net (loss) income available to common stockholders |
$ | (167,133,661 | ) | $ | (22,486,591 | ) | $ | 5,169,219 | |||
| Denominator: |
|||||||||||
| Weighted average shares outstanding-basic |
39,084,740 | 38,856,841 | 38,822,671 | ||||||||
| Add potentially dilutive securities: |
|||||||||||
| Stock options |
— | — | 877,023 | ||||||||
| Dilutive securities |
39,084,740 | 38,856,841 | 39,699,694 | ||||||||
Diluted net loss per share for the year ended December 31, 2009 excluded the effect of outstanding options to purchase 2,398,546 shares and 311,684 restricted shares because we reported a net loss which caused options to be anti-dilutive. Diluted net loss per share for the year ended December 31, 2008 excluded the effect of outstanding options to purchase 1,757,256 shares and 401,075 restricted shares because we reported a net loss which caused options to be anti-dilutive. Diluted net income per share for the year ended December 31, 2007 excluded the effect of outstanding options to purchase 640,477 shares because the average market price at December 31, 2007 was less than the exercise price.
78
Table of Contents
GEOMET, INC. AND SUBSIDIARIES
NOTES TO CONSOLIDATED AUDITED FINANCIAL STATEMENTS—(Continued)
Note 5—Note Receivable
We have an unsecured note receivable of $242,074 and $271,736 as of December 31, 2009 and 2008, respectively, from a third party included in other non-current assets. The note requires payment on a semi-monthly basis, including interest at 8.25%, of $2,168. The fair value of the receivable was $242,074 and $271,736 at December 31, 2009 and 2008, respectively. Scheduled maturities of the note receivable are detailed in the table below.
| 2010 |
$ | 32,346 | |
| 2011 |
35,273 | ||
| 2012 |
38,466 | ||
| 2013 |
41,947 | ||
| 2014 |
45,743 | ||
| Thereafter |
48,299 | ||
| Total note receivable |
242,074 | ||
| Less current portion of note receivable |
32,346 | ||
| Non-current note receivable |
$ | 209,728 | |
Note 6—Gas Properties
The method of accounting for gas properties determines what costs are capitalized and how these costs are ultimately matched with revenues and expenses. We use the full cost method of accounting for gas properties as prescribed by the United States Securities and Exchange Commission (“SEC”). Under this method, all direct costs and certain indirect costs associated with the acquisition, exploration, and development of our gas properties are capitalized and segregated into United States of America (“U.S.”) and Canadian cost centers. The Canadian cost center was fully impaired in 2009.
Gas properties are depleted using the units-of-production method. The depletion expense is significantly affected by the unamortized historical and future development costs and the estimated proved gas reserves. Depletion for the years ended December 31, 2009, 2008 and 2007 was $1.51, $1.35 and $1.24 per Mcf, respectively.
Estimation of proved gas reserves relies on professional judgment and use of factors that cannot be precisely determined. Subsequent proved reserve estimates materially different from those reported would change the depletion expense recognized during future reporting periods. No gains or losses are recognized upon the sale or disposition of gas properties unless the sale or disposition represents a significant quantity of gas reserves, which would have a significant impact on the depreciation, depletion and amortization rate.
Under full cost accounting rules, total capitalized costs are limited to a ceiling equal to the present value of estimated future net revenues, discounted at 10% per annum, plus cost of properties not being amortized plus the lower of cost or fair value of unevaluated properties less income tax effects (the “ceiling limitation”). We perform a quarterly ceiling test to evaluate whether the net book value of our full cost pool exceeds the ceiling limitation. The ceiling test is performed separately for our U.S. and Canadian cost centers. If capitalized costs (net of accumulated depreciation, depletion and amortization) less related deferred taxes are greater than the discounted future net revenues or ceiling limitation, a write-down or impairment of the full cost pool is required. A write-down of the carrying value of the full cost pool is a non-cash charge that reduces earnings and impacts stockholders’ equity in the period of occurrence and typically results in lower depreciation, depletion and amortization expense in future periods. Once incurred, a write-down is not reversible at a later date.
79
Table of Contents
GEOMET, INC. AND SUBSIDIARIES
NOTES TO CONSOLIDATED AUDITED FINANCIAL STATEMENTS—(Continued)
The ceiling test is calculated using the unweighted arithmetic average of the natural gas price on the first day of each month within the 12-month period prior to the end of the reporting period, unless prices are defined by contractual arrangements, excluding escalations based on future conditions, as allowed by the guidelines of the SEC. In addition, subsequent to the adoption of Accounting Standards Codification (“ASC”) 410-20-25, formerly Financial Accounting Standard Board (“FASB”) Statement No. 143, Accounting for Asset Retirement Obligations, the future cash outflows associated with settling asset retirement obligations were not included in the computation of the discounted present value of future net revenues for the purposes of the ceiling test calculation. The average Henry Hub spot market price was $3.87 per Mcf, resulting in a natural gas price of $4.06 per Mcf when adjusted for regional price differentials. Impairments recorded to gas properties for the year ended December 31, 2009, were:
| United States | Canada | Total | |||||||||
| Impairment of gas properties |
$ | 255,401,961 | $ | 1,886,296 | $ | 257,288,257 | |||||
| Deferred income tax benefit |
(97,627,986 | ) | — | (97,627,986 | ) | ||||||
| Impairment of gas properties, net of tax |
$ | 157,773,975 | $ | 1,886,296 | $ | 159,660,271 | |||||
Impairments recorded solely due to the new SEC rules that became effective December 31, 2009, and are included above were:
| United States | Canada | Total | |||||||||
| Impairment of gas properties |
$ | 20,847,742 | $ | — | $ | 20,847,742 | |||||
| Deferred income tax benefit |
(8,028,207 | ) | — | (8,028,207 | ) | ||||||
| Impairment of gas properties, net of tax |
$ | 12,819,535 | $ | — | $ | 12,819,535 | |||||
The natural gas price used in the valuation of natural gas reserves as of December 31, 2008 was $5.84 per Mcf ($5.71 Henry Hub spot market price for December 31, 2008, adjusted for regional price differentials). Impairments recorded to gas properties for the year ended December 31, 2008, were:
| United States | Canada | Total | |||||||||
| Impairment of gas properties |
$ | 32,047,484 | $ | 18,686,273 | $ | 50,733,757 | |||||
| Deferred income tax benefit |
(12,087,937 | ) | — | (12,087,937 | ) | ||||||
| Impairment of gas properties, net of tax |
$ | 19,959,547 | $ | 18,686,273 | $ | 38,645,820 | |||||
There were no impairments recorded for the year ended December 31, 2007.
80
Table of Contents
GEOMET, INC. AND SUBSIDIARIES
NOTES TO CONSOLIDATED AUDITED FINANCIAL STATEMENTS—(Continued)
The following table provides a summary of the capitalized cost of our gas properties as of December 31, 2009 and 2008, by the year in which the costs were incurred.
| 2009 | 2008 | |||||||
| Subject to depletion |
$ | 461,003,091 | $ | 447,968,536 | ||||
| Not subject to depletion: |
||||||||
| Acquisition costs |
— | 5,017 | ||||||
| Exploration costs |
— | — | ||||||
| Total 2009 |
— | — | ||||||
| Total 2008 |
— | 5,017 | ||||||
| Total 2007 and prior |
— | — | ||||||
| Total not subject to depletion |
— | 5,017 | ||||||
| Gross gas properties |
461,003,091 | 447,973,553 | ||||||
| Less impairment of gas properties |
(311,416,980 | ) | (50,733,757 | ) | ||||
| Less accumulated depletion |
(52,202,296 | ) | (40,695,806 | ) | ||||
| Net gas properties |
$ | 97,383,815 | $ | 356,543,990 | ||||
Note 7—Asset Retirement Liability
We record an asset retirement obligation (“ARO”) on the consolidated balance sheet and capitalize the asset retirement costs in gas properties in the period in which the retirement obligation is incurred. The amount of the ARO and the costs capitalized are equal to the estimated future costs to satisfy the obligation using current prices that are escalated by an assumed inflation factor up to the estimated settlement date, which is then discounted back to the date the abandonment obligation was incurred using an assumed cost of funds for GeoMet. Once the ARO is recorded, it is then accreted to its estimated future value using the same assumed cost of funds.
The following table describes the changes to our asset retirement liability for the years ending December 31, 2009 and 2008.
| 2009 | 2008 | |||||||
| Asset retirement obligation at beginning of year |
$ | 4,466,361 | $ | 2,990,242 | ||||
| Liabilities incurred |
11,937 | 237,657 | ||||||
| Liabilities settled |
(14,545 | ) | (124,415 | ) | ||||
| Accretion expense |
431,733 | 365,103 | ||||||
| Revisions in estimates |
36,466 | 1,040,014 | ||||||
| Currency translation adjustment |
38,437 | (42,240 | ) | |||||
| Asset retirement obligation at end of year |
4,970,389 | 4,466,361 | ||||||
| Less: current portion of obligation |
108,111 | 117,423 | ||||||
| Long-term asset retirement obligation |
$ | 4,862,278 | $ | 4,348,938 | ||||
Revisions in estimates of our asset retirement liability for the year ended December 31, 2008 totaling $1,040,014 were due primarily to specific lease agreement requirements related to plugging and abandonment of certain wells and were capitalized in the full cost pool of our gas properties.
81
Table of Contents
GEOMET, INC. AND SUBSIDIARIES
NOTES TO CONSOLIDATED AUDITED FINANCIAL STATEMENTS—(Continued)
Note 8—Derivative Instruments and Hedging Activities
The energy markets have historically been volatile, and there can be no assurance that future natural gas prices will not be subject to wide fluctuations. In an effort to reduce the effects of the volatility of the price of natural gas on our operations, management has adopted a policy of hedging natural gas prices from time to time primarily using derivative instruments in the form of three-way collars, traditional collars and swaps. While the use of these hedging arrangements limits the downside risk of adverse price movements, it also limits future gains from favorable movements. Our price risk management policy strictly prohibits the use of derivatives for speculative positions.
We enter into hedging transactions, generally for forward periods up to two years or more, which increase the probability of achieving our targeted level of cash flows. We generally limit the amount of these hedges during any period to no more than 50% to 70% of the then expected gas production for such future periods. Swaps exchange floating price risk in the future for a fixed price at the time of the hedge. Costless collars set both a maximum ceiling (a sold ceiling) and a minimum floor (a bought floor) future price. Three-way costless collars are similar to regular costless collars except that, in order to increase the ceiling price, we agree to limit the amount of the floor price protection (through a sold floor) to a predetermined amount, generally between $2.00 and $3.00 per MMBtu below the bought floor. We have accounted for these transactions using the mark-to-market accounting method. Generally, we incur accounting losses on derivatives during periods where prices are rising and gains during periods where prices are falling which may cause significant fluctuations in our consolidated balance sheets and consolidated statements of operations.
Commodity Price Risk and Related Hedging Activities
At December 31, 2009, we had the following natural gas collar positions:
| Period |
Volume (MMBtu) |
Sold Ceiling |
Bought Floor |
Sold Floor |
Fair Value | |||||||||
| January 2010 through March 2010 |
540,000 | $ | 11.20 | $ | 9.50 | $ | 7.00 | $ | 1,326,724 | |||||
| January 2010 through March 2010 |
360,000 | $ | 6.65 | $ | 5.50 | $ | 3.50 | 65,098 | ||||||
| April through October 2010 |
856,000 | $ | 6.80 | $ | 5.50 | $ | 3.50 | 172,072 | ||||||
| April through October 2010 |
856,000 | $ | 6.35 | $ | 5.50 | — | 116,559 | |||||||
| November 2010 through March 2011 |
604,000 | $ | 7.45 | $ | 6.50 | — | 160,745 | |||||||
| $ | 1,841,198 | |||||||||||||
At December 31, 2009, we had the following natural gas swap positions:
| Period |
Volume (MMBtu) |
Price | Fair Value | |||||
| April through October 2010 |
856,000 | $ | 5.70 | 5,341 | ||||
| April through October 2010 |
642,000 | $ | 6.30 | 387,383 | ||||
| November 2010 through March 2011 |
604,000 | $ | 6.67 | 61,493 | ||||
| November 2010 through March 2011 |
906,000 | $ | 7.27 | 625,564 | ||||
| April 2011 through October 2011 |
856,000 | $ | 6.37 | 236,887 | ||||
| November 2011 through March 2012 |
608,000 | $ | 7.12 | 166,836 | ||||
| $ | 1,483,504 | |||||||
82
Table of Contents
GEOMET, INC. AND SUBSIDIARIES
NOTES TO CONSOLIDATED AUDITED FINANCIAL STATEMENTS—(Continued)
At December 31, 2008, we had the following natural gas collar positions:
| Period |
Volume (MMBtu) |
Sold Ceiling |
Bought Floor |
Sold Floor |
Fair Value | |||||||||
| January through March 2009 |
540,000 | $ | 11.00 | $ | 8.50 | $ | 6.25 | $ | 1,138,548 | |||||
| January through March 2009 |
540,000 | $ | 11.00 | $ | 8.84 | $ | 6.00 | $ | 1,403,907 | |||||
| April through October 2009 |
1,284,000 | $ | 10.00 | $ | 7.50 | $ | 5.25 | $ | 1,615,808 | |||||
| April through October 2009 |
1,284,000 | $ | 10.00 | $ | 8.50 | $ | 6.50 | $ | 1,864,114 | |||||
| November 2009 through March 2010 |
906,000 | $ | 11.20 | $ | 9.50 | $ | 7.00 | $ | 1,297,652 | |||||
| $ | 7,320,029 | |||||||||||||
Interest Rate Risks and Related Hedging Activities
When we enter into an interest rate swap, we may designate the derivative as a cash flow hedge, at which time we prepare the documentation required under ASC 815-20-25. Hedges of our interest rate are designated as cash flow hedges based on whether the interest on the underlying debt is converted to a fixed interest rate. Changes in derivative fair values that are designated as cash flow hedges are deferred as other comprehensive income or loss to the extent that they are effective and then recognized in earnings when the hedged transactions occur.
We use fixed rate swaps to limit our exposure to fluctuations in interest rates with the objective of realizing a fixed cash flow stream from these activities. At December 31, 2009, we had the following interest rate swaps:
| Description |
Effective date |
Designated maturity date |
Fixed rate (1) |
Notional amount |
Fair Value |
|||||||||
| Floating-to-fixed swap |
12/14/2007 | 12/14/2010 | 3.86 | % | $ | 15,000,000 | $ | (479,566 | ) | |||||
| Floating-to-fixed swap |
1/3/2008 | 1/4/2010 | 3.95 | % | $ | 10,000,000 | (87,493 | ) | ||||||
| Floating-to-fixed swap |
3/25/2008 | 3/25/2010 | 2.38 | % | $ | 10,000,000 | (50,745 | ) | ||||||
| Floating-to-fixed swap |
5/13/2008 | 5/13/2010 | 3.07 | % | $ | 5,000,000 | (67,783 | ) | ||||||
| Floating-to-fixed swap |
1/6/2009 | 1/6/2011 | 1.38 | % | $ | 5,000,000 | (38,278 | ) | ||||||
| $ | (723,865 | ) | ||||||||||||
At December 31, 2008, we had the following interest rate swaps:
| Description |
Effective date |
Designated maturity date |
Fixed rate(1) |
Notional amount |
Fair Value |
|||||||||
| Floating-to-fixed swap |
12/14/2007 | 12/14/2010 | 3.86 | % | $ | 15,000,000 | $ | (608,561 | ) | |||||
| Floating-to-fixed swap |
1/3/2008 | 1/4/2010 | 3.95 | % | $ | 10,000,000 | (243,520 | ) | ||||||
| Floating-to-fixed swap |
3/25/2008 | 3/25/2010 | 2.38 | % | $ | 10,000,000 | (131,102 | ) | ||||||
| Floating-to-fixed swap |
5/13/2008 | 5/13/2010 | 3.07 | % | $ | 5,000,000 | (106,209 | ) | ||||||
| $ | (1,089,392 | ) | ||||||||||||
| (1) | The floating rate paid by the counterparty is the British Bankers’ Association LIBOR rate. |
For the year ended December 31, 2009, we have recognized no ineffective portion of our cash flow hedges. We have reviewed the financial strength of our hedge counterparties and believe our credit risk to be minimal. Our hedge counterparties are participants in our revolving credit facility agreement and the collateral for the outstanding borrowings under our revolving credit facility agreement is used as collateral for our hedges. We do not have rights to collateral from our counterparties, nor do we have rights of offset against borrowings under our revolving credit facility agreement.
83
Table of Contents
GEOMET, INC. AND SUBSIDIARIES
NOTES TO CONSOLIDATED AUDITED FINANCIAL STATEMENTS—(Continued)
The application of ASC 820-10-55, formerly SFAS No. 157, Fair Value Measurements, currently applies to our derivative instruments. Under the provisions of ASC 820-10-55, we estimate the fair value of our natural gas hedges and interest rate swaps using the income approach. The income approach uses valuation techniques that convert future cash flows to a single discounted value. ASC 820-10-55 clarifies that a fair value measurement for an asset or liability reflects its nonperformance risk, the risk that the obligation will not be fulfilled. Because nonperformance risk includes our counterparties’ and our credit risk, we have considered the effect of our credit risk on the fair value of the liabilities stated below. This consideration involved discounting our counterparties’ and our liabilities based on the difference between the S&P credit rating of a comparable company to ours and the 13-week Treasury bill rate, both at December 31, 2009. The following is a description of the valuation methodologies used for our derivative instruments measured at fair value:
| • | Natural Gas Hedges—In order to estimate the fair value of our natural gas hedge positions, a forward price curve and volatility estimates were compiled from sources that include NYMEX settlements and observed trading activity in the Over-the-Counter (OTC) markets. Pricing estimates for the theoretical market value of hedge positions were developed using analytical models accepted and employed by a broad cross-section of industry participants. To extrapolate future cash flows, discount factors incorporating our counterparties’ and our credit standing are used to discount future cash flows. |
| • | Interest Rate Swaps—In order to estimate the fair value of our interest rate swaps, we use a yield curve based on Money Market rates and Interest Rate swaps, extrapolate a forecast of future interest rates, estimate each future cash flow, derive discount factors to value the fixed and floating rate cash flows of each swap, and then discount to present value all known (fixed) and forecasted (floating) swap cash flows. Curve building and discounting techniques used to establish the theoretical market value of interest bearing securities are based on readily available Money Market rates and Interest Rate swap market data. To extrapolate future cash flows, discount factors incorporating our counterparties’ and our credit standing are used to discount future cash flows. |
Based on the use of observable market inputs, we have designated these types of instruments as Level 2 for ASC 820-10-55 reporting purposes. The fair value of our derivative instruments were as follows:
| Asset Derivatives |
Liability Derivatives | |||||||||||||||||||
| December 31, 2009 |
December 31, 2008 |
December 31, 2009 |
December 31, 2008 | |||||||||||||||||
| Balance Sheet |
Fair Value |
Balance Sheet |
Fair Value |
Balance Sheet |
Fair Value |
Balance Sheet |
Fair Value | |||||||||||||
| Derivatives designated as hedging instruments under ASC 815-20-25 |
||||||||||||||||||||
| Interest rate swaps |
Derivative asset (current) | $ | — | Derivative asset (current) | $ | — | Derivative liability (current) | $ | 724,253 | Derivative liability (current) | $ | 714,903 | ||||||||
| Interest rate swaps |
Derivative asset (non- current) | 388 | Derivative asset (non- current) | — | Derivative liability (non- current) | — | Derivative liability (non- current) | 374,489 | ||||||||||||
| Total derivatives designated as hedging instruments under ASC 815-20-25 |
$ | 388 | $ | — | $ | 724,253 | $ | 1,089,392 | ||||||||||||
84
Table of Contents
GEOMET, INC. AND SUBSIDIARIES
NOTES TO CONSOLIDATED AUDITED FINANCIAL STATEMENTS—(Continued)
| Asset Derivatives |
Liability Derivatives | |||||||||||||||||||
| December 31, 2009 |
December 31, 2008 |
December 31, 2009 |
December 31, 2008 | |||||||||||||||||
| Balance Sheet |
Fair Value |
Balance Sheet |
Fair Value |
Balance Sheet |
Fair Value |
Balance Sheet |
Fair Value | |||||||||||||
| Derivatives not designated as hedging instruments under ASC 815-20-25 |
||||||||||||||||||||
| Natural gas collar positions |
Derivative asset (current) | $ | 1,784,318 | Derivative asset (current) | $ | 6,596,360 | Derivative liability (current) | $ | — | Derivative liability (current) | $ | — | ||||||||
| Natural gas collar positions |
Derivative asset (non- current) | 56,880 | Derivative asset (non- current) | 723,669 | Derivative liability (non- current) | — | Derivative liability (non- current) | — | ||||||||||||
| Natural gas swap positions |
Derivative asset (current) | 779,580 | Derivative asset (current) | — | Derivative liability (current) | — | Derivative liability (current) | — | ||||||||||||
| Natural gas swap positions |
Derivative asset (non- current) | 703,924 | Derivative asset (non- current) | — | Derivative liability (non- current) | — | Derivative liability (non- current) | — | ||||||||||||
| Total derivatives not designated as hedging instruments under ASC 815-20-25 |
$ | 3,324,702 | $ | 7,320,029 | $ | — | $ | — | ||||||||||||
The following (gains) losses on our hedging instruments included in the consolidated statements of operations and other comprehensive (loss) income (“OCI”) are as follows:
The Effect of Derivative Instruments on the Consolidated Statements of Operations and
Other Comprehensive Income for the Years Ended December 31, 2009 and 2008
| Derivatives |
Location of (Gain) or Loss Recognized
in |
Amount of (Gain) or Loss Recognized in Income on Derivative |
||||||||
| 2009 | 2008 | |||||||||
| Derivatives designated as hedging instruments under ASC 815-20-25 |
||||||||||
| Interest rate swaps |
Interest expense (net of amounts capitalized) | $ | 1,111,829 | $ | 137,002 | |||||
| Total gain (loss) |
$ | 1,111,829 | $ | 137,002 | ||||||
| Derivatives not designated as hedging instruments under ASC 815-20-25 |
||||||||||
| Natural gas collar positions |
Realized gains on derivative contracts | $ | (10,694,496 | ) | $ | 500,452 | ||||
| Natural gas collar positions |
Unrealized (gains) losses from the change in market value of open derivative contracts | 3,995,327 | (4,993,238 | ) | ||||||
| Total gain (loss) |
$ | (6,699,169 | ) | $ | (4,492,786 | ) | ||||
85
Table of Contents
GEOMET, INC. AND SUBSIDIARIES
NOTES TO CONSOLIDATED AUDITED FINANCIAL STATEMENTS—(Continued)
| Derivatives in ASC 815-20-25 Cash Flow Hedging Relationships |
Amount of Gain or (Loss) Recognized in OCI on Derivative (Effective Portion) |
Location of |
Amount of Gain or (Loss) Reclassified from Accumulated OCI into Income (Effective Portion) |
|||||||||||||||
| 2009 | 2008 | 2009 | 2008 | |||||||||||||||
| Interest rate contracts |
$ | (746,302 | ) | $ | (1,237,278 | ) | Interest expense | $ | (1,111,829 | ) | $ | (137,002 | ) | |||||
| Total |
$ | (746,302 | ) | $ | (1,237,278 | ) | $ | (1,111,829 | ) | $ | (137,002 | ) | ||||||
Accumulated comprehensive loss of $1,768,521 as of December 31, 2009 consists of $1,321,173 in foreign currency translation adjustments and a $447,348 loss on interest rate swaps, net of income tax benefit. Accumulated comprehensive loss of $447,348 as of December 31, 2009 is expected to be realized as interest expense in the statement of operations for the year ended December 31, 2010.
Note 9—Long-Term Debt
On November 5, 2009, the Company’s bank syndicate approved a borrowing base of $135 million after completing its mid-year borrowing base determination based on our internally prepared reserve report as of September 30, 2009. Our revolving credit facility permits us to borrow and repay amounts as needed based on the available borrowing base as determined in the revolving credit facility agreement. The revolving credit facility is secured by substantially all of our gas properties and the capital stock of our subsidiaries.
As of December 31, 2009, we had $119.5 million of borrowings outstanding under our revolving credit facility, resulting in a borrowing availability of $15.5 million under our $135.0 million borrowing base. For the year ended December 31, 2009 we borrowed $39.4 million and made payments of $36.4 million under the revolving credit facility. The outstanding balances on the revolving credit facility bear interest at the Company’s option of either (a) the bank’s adjusted base rate, which is the greatest of (i) the bank’s base rate, (ii) the Federal Funds Rate plus 0.5%, or (iii) the one-month LIBOR rate plus 1%, plus a margin of 1.375% to 2.125% based on borrowing base usage, or (b) the adjusted LIBOR rate, plus a margin of 2.25% to 3.00%, based on borrowing base usage. The rates at December 31, 2009 and 2008, excluding the effect of our interest rate swaps, were 3.03% and 2.49%, respectively. For the years ended December 31, 2009 and 2008, interest on the borrowings averaged 3.12% per annum and 4.56% per annum, respectively.
86
Table of Contents
GEOMET, INC. AND SUBSIDIARIES
NOTES TO CONSOLIDATED AUDITED FINANCIAL STATEMENTS—(Continued)
The following is a summary of our long-term debt at December 31, 2009 and 2008:
| December 31, 2009 |
December 31, 2008 |
|||||||
| Borrowings under revolving credit facility |
$ | 119,500,000 | $ | 116,500,000 | ||||
| Note payable to a third party, annual installments of $53,000 through January 2011, interest-bearing at 8.25% annually, unsecured |
94,190 | 135,972 | ||||||
| Note payable to an individual, semi-monthly installments of $644, through September 2015, interest-bearing at 12.6% annually, unsecured |
106,825 | 118,735 | ||||||
| Salary continuation payable to an individual, semi-monthly installments of $3,958, through December 2015, non-interest-bearing (less amortization discount of $572,074, with an effective rate of 8.25%), unsecured |
416,940 | 475,015 | ||||||
| Total debt |
120,117,955 | 117,229,722 | ||||||
| Less current maturities included in current liabilities |
(121,792 | ) | (111,767 | ) | ||||
| Total long-term debt |
$ | 119,996,163 | $ | 117,117,955 | ||||
We are subject to certain restrictive covenants under the revolving credit facility agreement, including a minimum current ratio, adjusted for unrealized (gains) losses on derivative contracts and borrowing availability, of 1.0 to 1.0, and a ratio of consolidated EBITDA to interest expense of up to 2.75 to 1.0, both as defined in the revolving credit facility agreement. As of December 31, 2009, we were in compliance with all of the covenants in the revolving credit facility agreement.
After the Company received commitment letters from two parties to provide additional financing for the Company, effective March 30, 2010, the parties to the revolving credit facility agreement unanimously approved the Third Amendment to the revolving credit facility (“Third Amendment”) as summarized below:
| • | The maturity date of the revolving credit facility was extended four months to May 6, 2011 pursuant to a request by the Company. |
| • | Pursuant to a request by the Company, the borrowing base was reduced to $123.0 million and the bank group agreed that (1) the next borrowing base determination would be as of June 15, 2010, and (2) the bank group agreed not to call for a determination of the borrowing base prior to that date. |
| • | The minimum current ratio, adjusted for unrealized (gains) losses on derivative contracts and borrowing availability under the revolving credit agreement, is adjusted to .80 to 1 solely for the quarter ended March 31, 2010. |
| • | The outstanding balances on the revolving credit facility will bear interest at the Company’s option of either (a) the bank’s adjusted base rate, which is the greatest of (i) the bank’s base rate, (ii) the Federal Funds Rate plus 0.5%, or (iii) the one-month LIBOR rate plus 1%, plus a margin of 2.625%, or (b) the adjusted LIBOR rate, plus a margin of 3.50%. |
The fair value of long-term debt at December 31, 2009 and 2008 was approximately $115,817,126 and $92,485,449, respectively. ASC 820-10-55 clarifies that a fair value measurement for an asset or liability reflects its nonperformance risk, the risk that the obligation will not be fulfilled. Because nonperformance risk includes our credit risk, we have considered the effect of our credit risk on the fair value of the long-term debt. This consideration involved discounting our long-term debt based on the difference between the S&P credit rating of a comparable company to ours and the stated interest rates of the debt instruments included our long-term debt, both at December 31, 2009.
87
Table of Contents
GEOMET, INC. AND SUBSIDIARIES
NOTES TO CONSOLIDATED AUDITED FINANCIAL STATEMENTS—(Continued)
The following were maturities of long-term debt for each of the next five years at December 31, 2009:
| Year |
Amount | ||
| 2010 |
$ | 121,792 | |
| 2011 |
119,632,744 | ||
| 2012 |
91,757 | ||
| 2013 |
100,467 | ||
| 2014 |
110,035 | ||
| Thereafter |
61,160 | ||
| Total Debt |
$ | 120,117,955 | |
Note 10—Discontinued Operations
As of September 30, 2007, we discontinued the third-party marketing business and second reportable segment which had been created in connection with the consolidation of Shamrock Energy LLC, a variable interest entity under ASC 810, formerly FIN 46(R), on August 1, 2006. The consolidation of the variable interest entity had no impact on our net income (loss) due to the 100% minority interest to Shamrock Energy LLC. On January 1, 2007, we exercised our purchase option and acquired 100% of Shamrock Energy LLC, our discontinued gas marketing subsidiary. Over 99% of the net assets acquired were current, approximated their fair value and were equal to zero. Shamrock Energy LLC was a low margin business and as a result it did not have a significant impact on our results of operations. The acquisition was accounted for as a purchase in accordance with SFAS 141, whereby the purchase price of the net assets acquired was allocated to those net assets based on their fair value. Goodwill was not recorded because the purchase price approximated the fair value of the net assets acquired.
As a result of exiting the third-party marketing business, we are treating these activities as a discontinued operation for all the periods presented. Results for activities reported as discontinued operations were as follows:
Statement of Operations Data (for the year ended December 31):
| 2009 | 2008 | 2007 | ||||||||
| Gas marketing revenues |
$ | — | $ | — | $ | 21,873,248 | ||||
| Purchased gas expense |
— | — | (21,595,540 | ) | ||||||
| Income from discontinued operations before tax |
— | — | 277,708 | |||||||
| Income tax expense |
— | — | (103,926 | ) | ||||||
| Income from discontinued operations |
$ | — | $ | — | $ | 173,782 | ||||
There are no balance sheet balances to report at December 31, 2009 and 2008.
Note 11—Income Taxes
We record our income taxes using an asset and liability approach in accordance with the provisions of ASC 740, formerly SFAS No. 109, Accounting for Income Taxes. This results in the recognition of deferred tax assets and liabilities for the expected future tax consequences of temporary differences between the book carrying amounts and the tax bases of assets and liabilities using enacted tax rates at the end of the period. Under ASC 740, the effect of a change in tax rates of deferred tax assets and liabilities is recognized in the year of the enacted change.
88
Table of Contents
GEOMET, INC. AND SUBSIDIARIES
NOTES TO CONSOLIDATED AUDITED FINANCIAL STATEMENTS—(Continued)
Deferred tax assets are reduced by a valuation allowance when, in the opinion of management, it is more likely than not that some portion or all of the deferred tax assets will not be realized. Estimating the amount of valuation allowance is dependent on estimates of future taxable income, alternative minimum tax income, and changes in stockholder ownership that could trigger limits on use of net operating losses under Section 382 of the Internal Revenue Code. We have a significant deferred tax asset associated with net operating loss carryforwards (NOL’s). It is more likely than not that we will use the NOL’s in the U.S. to offset current tax liabilities in future years.
Our effective tax rate differs from the federal statutory rate primarily due to losses in Canada that we are unable to benefit from and state income taxes. The Canadian losses, as well as certain state losses, are fully reserved because it is more likely than not that we will not use those NOL’s to offset current tax liabilities in future years.
The Company filed a refund claim to carry back its 2008 net operating losses and will recover $108,953 of alternative minimum tax previously paid. A receivable has been recorded in current assets on the Consolidated Balance Sheet at December 31, 2009 for this amount.
An analysis of our deferred taxes follows:
| 2009 | 2008 | |||||||
| Current deferred tax asset: |
||||||||
| Compensation expense and other |
$ | 545,487 | $ | 93,012 | ||||
| Total current deferred tax asset |
545,487 | 93,012 | ||||||
| Current deferred tax liability: |
||||||||
| Book basis in excess of tax basis of derivative contracts |
(702,743 | ) | (2,519,810 | ) | ||||
| Net current deferred tax liability |
$ | (157,256 | ) | $ | (2,426,798 | ) | ||
| Long-term deferred tax asset: |
||||||||
| Net operating loss carryforward |
$ | 37,732,386 | $ | 30,937,418 | ||||
| Compensation expense and other |
277,231 | 240,993 | ||||||
| Accrued asset retirement obligations |
1,212,465 | 1,051,917 | ||||||
| Alternative minimum tax credit carryforward |
— | 115,907 | ||||||
| Book basis of gas properties in excess of tax basis |
12,873,665 | — | ||||||
| Total long-term deferred tax assets |
52,095,747 | 32,346,235 | ||||||
| Long-term deferred tax liability: |
||||||||
| Book basis in excess of tax basis of derivative contracts |
(290,776 | ) | (276,442 | ) | ||||
| Book basis of gas properties in excess of tax basis |
— | (75,911,743 | ) | |||||
| Total long-term deferred tax liabilities |
(290,776 | ) | (76,188,185 | ) | ||||
| Net long-term deferred tax asset (liability) |
$ | 51,804,971 | $ | (43,841,950 | ) | |||
Federal income tax expense from continuing operations for each of the years ended December 31, 2009, 2008, and 2007 was different than the amount computed using the Federal statutory rate as follows:
89
Table of Contents
GEOMET, INC. AND SUBSIDIARIES
NOTES TO CONSOLIDATED AUDITED FINANCIAL STATEMENTS—(Continued)
Income tax expense for the year ended December 31, 2009 was different than the amount computed using the statutory rate as follows:
| U.S. | Canada | Total | ||||||||||||||||
| Amount computed using statutory rates |
(87,751,624 | ) | 34.00 | % | (1,867,426 | ) | 26.00 | % | (89,619,050 | ) | 33.78 | % | ||||||
| State income taxes—net of federal benefit |
(10,714,162 | ) | 4.15 | % | — | 0.00 | % | (10,714,162 | ) | 4.04 | % | |||||||
| Valuation Allowance |
— | 0.00 | % | 1,867,426 | -26.00 | % | 1,867,426 | -0.70 | % | |||||||||
| Nondeductible items and other |
324,027 | -0.12 | % | — | 0.00 | % | 324,027 | -0.12 | % | |||||||||
| Income tax (benefit) provision |
(98,141,759 | ) | 38.03 | % | — | 0.00 | % | (98,141,759 | ) | 37.00 | % | |||||||
| Income tax expense for the for the year ended December 31, 2008 was different than the amount computed using the statutory rate as follows: |
| |||||||||||||||||
| U.S. | Canada | Total | ||||||||||||||||
| Amount computed using statutory rates |
(938,137 | ) | 34.00 | % | (6,949,350 | ) | 34.00 | % | (7,887,487 | ) | 34.00 | % | ||||||
| State income taxes—net of federal benefit |
(147,556 | ) | 5.35 | % | — | 0.00 | % | (147,556 | ) | 0.64 | % | |||||||
| Valuation Allowance |
121,865 | -4.42 | % | 6,949,350 | -34.00 | % | 7,071,215 | -30.48 | % | |||||||||
| Nondeductible items and other |
251,928 | -9.13 | % | — | 0.00 | % | 251,928 | -1.09 | % | |||||||||
| Income tax (benefit) provision |
(711,900 | ) | 25.80 | % | — | 0.00 | % | (711,900 | ) | 3.07 | % | |||||||
| Income tax expense for the year ended December 31, 2007 was different than the amount computed using the statutory rate as follows: |
| |||||||||||||||||
| U.S. | Canada | Total | ||||||||||||||||
| Amount computed using statutory rates |
3,010,889 | 34.00 | % | (296,722 | ) | 34.00 | % | 2,714,167 | 34.00 | % | ||||||||
| State income taxes—net of federal benefit |
(84,618 | ) | -0.96 | % | — | 0.00 | % | (84,618 | ) | -1.06 | % | |||||||
| Valuation Allowance |
— | 0.00 | % | 296,722 | -34.00 | % | 296,722 | 3.72 | % | |||||||||
| Nondeductible items and other |
61,136 | 0.69 | % | — | 0.00 | % | 61,136 | 0.76 | % | |||||||||
| Income tax (benefit) provision |
2,987,407 | 33.73 | % | — | 0.00 | % | 2,987,407 | 37.42 | % | |||||||||
The following components of the income tax expense for the years ended December 31, 2009, 2008 and 2007 are as follows:
| Years Ended December 31, | ||||||||||||
| 2009 | 2008 | 2007 | ||||||||||
| Current: |
||||||||||||
| State |
$ | 25,000 | $ | 25,000 | $ | 25,000 | ||||||
| Federal |
(115,907 | ) | — | — | ||||||||
| Deferred: |
||||||||||||
| State |
(9,964,882 | ) | (106,231 | ) | (109,618 | ) | ||||||
| Federal |
(88,085,970 | ) | (630,669 | ) | 3,072,025 | |||||||
| Income tax provision |
$ | (98,141,759 | ) | $ | (711,900 | ) | $ | 2,987,407 | ||||
90
Table of Contents
GEOMET, INC. AND SUBSIDIARIES
NOTES TO CONSOLIDATED AUDITED FINANCIAL STATEMENTS—(Continued)
For tax reporting purposes, we have federal and state NOL’s of approximately $97.7 and $106.4, respectively, at December 31, 2009 that are available to reduce future taxable income. If not utilized, the federal NOL’s would begin to expire in 2022. Certain immaterial portions of the state NOL’s will expire prior to 2022. Our long-term deferred tax asset at December 31, 2009 does not include $1.9 million in deferred tax asset related to our Canadian operations and gas properties as a valuation allowance has been recorded in accordance with ASC 740.
Uncertain Tax Positions
ASC 740 also clarifies the accounting for uncertainty in income taxes recognized in an entity’s financial statements and prescribes a consistent threshold and measurement attribute for financial statement recognition and disclosure of tax positions taken, or expected to be taken, on a tax return. We identified $269,900 of unrecognized tax benefits, largely related to depletion methods used in years prior to 2006 from net deferred tax assets. There was no cumulative effect adjustment to retained earnings, our financial condition or results of operations. The amount of unrecognized tax benefits has not materially changed and as of December 31, 2009 and 2008 was $272,600.
It is expected that the amount of unrecognized tax benefits may change in the next twelve months; however we do not expect the change to have a significant impact on our results of operations or the financial position.
We file a consolidated federal income tax return in the U.S. and various combined and separate filings in Canada and several state and local jurisdictions. With limited exceptions, we are no longer subject to U.S. federal, state and local, or non-U.S. income tax examinations by tax authorities for years before 2002.
Our continuing practice is to recognize estimated interest related to potential underpayment on any unrecognized tax benefits as a component of interest expense in the consolidated statement of operations. Penalties, if incurred, would be recognized as a component of penalty expense. We did not have any accrued interest or penalties associated with any unrecognized tax benefits at December 31, 2009 and 2008, nor was any interest expense recognized during the years ended December 31, 2009, 2008 and 2007. We do not anticipate that total unrecognized tax benefits will significantly change due to the settlement of audits and the expiration of statute of limitations prior to December 31, 2010.
Note 12—Common Stock
At December 31, 2009 and 2008, there were 39,460,060 shares and 39,305,152 shares, respectively, of common stock outstanding, both including 10,432 shares of treasury stock held by the Company. At December 31, 2009 and 2008, there were 311,684 and 401,075 shares of restricted stock, respectively, included in the aforementioned common stock outstanding.
For the year ended December 31, 2009, no common stock was issued upon the exercise of stock options granted under our 2005 Stock Option Plan and our 2006 Long-Term Incentive Plan. On March 23, 2009 606,507 incentive stock options were granted to our key employees, including four executive officers and one other officer, and 114,012 non-qualified stock options were granted to our five executive officers and one other officer. On the same date we issued 166,668 shares of common stock to our independent directors representing 50% of their 2009 retainer. For the year ended December 31, 2009, 11,354 shares of restricted stock were forfeited. On June 15, 2009, 403 shares of common stock were purchased by us from a non-executive employee for the payment of $613 in withholding taxes due on vested shares of restricted stock issued under our 2006 Long-Term Incentive Plan. The shares were not retained as treasury stock as they were immediately cancelled.
91
Table of Contents
GEOMET, INC. AND SUBSIDIARIES
NOTES TO CONSOLIDATED AUDITED FINANCIAL STATEMENTS—(Continued)
For the years ended December 31, 2008 and 2007, a total of 68,605 and 105,565 shares, respectively, of common stock were issued upon the exercise of stock options granted under our 2005 Stock Option Plan. For the year ended December 31, 2008, no stock options were granted. In March 2008, we issued 253,806 shares of restricted stock to key employees, including four executive officers and two other officers, of the Company and 18,720 shares of common stock to our independent directors, representing 50% of their annual retainer. In September 2008, we issued 46,694 shares of restricted stock to key employees of the Company. The shares of common stock for our independent directors and the restricted stock were issued pursuant to our 2006 Long-Term Incentive Plan. For the years ended December 31, 2008 and 2007, 45,032 shares and 31,500 shares of restricted stock, respectively, were forfeited.
Note 13—Share-Based Awards
As of December 31, 2009, we have two stock-based award plans authorized, which include our 2005 Stock Option Plan and our 2006 Long-Term Incentive Plan. However, we will not grant any additional awards under our 2005 Stock Option Plan now that we have adopted our 2006 Long-Term Incentive Plan, although we will continue to issue shares of our common stock upon exercise of awards previously granted under the 2005 Stock Option Plan.
Our 2006 Long-Term Incentive Plan authorized the granting of incentive stock options, non-qualified stock options, stock appreciation rights, stock awards, restricted stock, restricted stock units and performance awards. A maximum of 4,000,000 shares are reserved for grant under this plan, of which 2,152,195 remain available for issuance at December 31, 2009. The 2006 Long-Term Incentive Plan is available to our employees and independent directors and is designed to attract and retain employees and independent directors, to further align the interests of our employees and independent directors with the interests of our stockholders, and to closely link compensation with our performance. The exercise price of stock options granted under this plan may not be less than the fair market value of the common stock on the date of grant. The options generally have a term of seven years and vest evenly over three years, except performance-based awards and options issued to directors. Performance-based awards granted under the 2006 Long-Term Incentive Plan vest once the performance criteria have been met. Performance-based awards issued to our directors vest immediately.
During the year ended December 31, 2009, we recorded a compensation expense accrual of $978,634 which was allocated among lease operating expenses ($54,008), general and administrative expenses ($738,568), and capitalized to unevaluated gas properties ($186,058). During 2008, we recorded a compensation expense accrual of $941,697 which was allocated among lease operating expenses ($53,737), general and administrative expenses ($512,680), and capitalized to unevaluated gas properties ($375,280). During 2007, we recorded a compensation expense accrual of $526,576 which was allocated among lease operating expenses ($118,830), general and administrative expenses ($118,830), and capitalized to unevaluated gas properties ($215,093). The future compensation cost of all the outstanding awards is $1,023,880 which will be amortized over the vesting period of such stock options and restricted stock. The weighted average remaining useful life of the future compensation cost is 1.18 years. The significant assumptions used in determining the compensation costs included an expected volatility of 56.10%, risk-free interest rate of 1.25%, an expected term of 4.5 years, forfeiture rates from 5% to 15%, and no expected dividends.
92
Table of Contents
GEOMET, INC. AND SUBSIDIARIES
NOTES TO CONSOLIDATED AUDITED FINANCIAL STATEMENTS—(Continued)
Incentive Stock Options
The table below summarizes incentive stock option activity for the three years ended December 31, 2009:
| Number of Options |
Weighted Average Exercise Price |
Average Remaining Contractual Life |
Aggregate Intrinsic Value | ||||||||
| Outstanding at January 1, 2007 |
572,838 | $ | 6.32 | ||||||||
| Granted |
329,216 | $ | 7.75 | ||||||||
| Exercised |
(105,565 | ) | $ | 2.13 | |||||||
| Transferred |
(42,224 | ) | $ | 13.00 | |||||||
| Forfeited |
(71,988 | ) | $ | 9.05 | |||||||
| Outstanding at December 31, 2007 |
682,277 | $ | 6.96 | 4.61 | $ | 610,027.00 | |||||
| Options exercisable at December 31, 2007 |
299,763 | $ | 4.79 | 2.80 | $ | 602,933.00 | |||||
| Exercised |
(68,605 | ) | $ | 1.72 | |||||||
| Forfeited |
(136,503 | ) | $ | 5.63 | |||||||
| Outstanding at December 31, 2008 |
477,169 | $ | 8.09 | 4.43 | $ | 4,008.00 | |||||
| Options exercisable at December 31, 2008 |
279,126 | $ | 7.84 | 3.83 | $ | 4,008.00 | |||||
| Granted |
606,507 | $ | 0.72 | ||||||||
| Transferred |
(12,048 | ) | $ | 8.30 | |||||||
| Forfeited |
(73,842 | ) | $ | 3.47 | |||||||
| Outstanding at December 31, 2009 |
997,786 | $ | 3.95 | 5.09 | $ | 422,100.00 | |||||
| Options exercisable at December 31, 2009 |
334,302 | $ | 8.52 | 3.29 | $ | — | |||||
During the years ended December 31, 2009 and 2007, incentive stock options were granted with a weighted average grant-date fair value of $0.33 and $2.32 per share, respectively. The total intrinsic value of incentive stock options exercised during the years ended December 31, 2008 and 2007 was $0.6 million and $0.5 million, respectively.
93
Table of Contents
GEOMET, INC. AND SUBSIDIARIES
NOTES TO CONSOLIDATED AUDITED FINANCIAL STATEMENTS—(Continued)
Non-Qualified Stock Options
The table below summarizes non-qualified stock option activity for the three years ended December 31, 2009:
| Number of Options |
Weighted Average Exercise Price |
Average Remaining Contractual Life |
Aggregate Intrinsic Value | ||||||||
| Outstanding at January 1, 2007 |
1,113,865 | $ | 3.20 | ||||||||
| Granted |
154,966 | $ | 7.46 | ||||||||
| Transferred |
42,224 | $ | 13.00 | ||||||||
| Outstanding at December 31, 2007 |
1,311,055 | $ | 4.02 | 5.36 | $ | 2,814,000 | |||||
| Options exercisable at December 31, 2007 |
1,070,376 | $ | 2.80 | 5.22 | $ | 2,814,000 | |||||
| Forfeited |
(30,968 | ) | $ | 10.22 | |||||||
| Outstanding at December 31, 2008 |
1,280,087 | $ | 3.87 | 4.32 | $ | — | |||||
| Options exercisable at December 31, 2008 |
1,156,313 | $ | 3.33 | 4.20 | $ | — | |||||
| Granted |
114,012 | $ | 0.72 | ||||||||
| Transferred |
12,048 | $ | 8.30 | ||||||||
| Forfeited |
(5,387 | ) | $ | 13.00 | |||||||
| Outstanding at December 31, 2009 |
1,400,760 | $ | 3.61 | 3.56 | $ | 84,369 | |||||
| Options exercisable at December 31, 2009 |
1,114,196 | $ | 3.05 | 3.18 | $ | — | |||||
During the years ended December 31, 2009 and 2007, incentive stock options were granted with a weighted average grant-date fair value of $0.33 and $1.18 per share, respectively.
Restricted Stock Awards
The table below summarizes non-vested restricted stock awards activity for the three years ended December 31, 2009:
| Number of Shares |
Weighted Average Value at Grant Date | |||||
| Non-vested restricted stock at January 1, 2007 |
21,436 | $ | 8.61 | |||
| Granted |
188,145 | $ | 7.21 | |||
| Forfeited |
(31,500 | ) | $ | 8.05 | ||
| Vested |
(4,083 | ) | $ | 8.05 | ||
| Non-vested restricted stock at December 31, 2007 |
173,998 | $ | 7.21 | |||
| Granted |
300,500 | $ | 6.34 | |||
| Forfeited |
(45,032 | ) | $ | 6.84 | ||
| Vested |
(28,391 | ) | $ | 7.23 | ||
| Non-vested restricted stock at December 31, 2008 |
401,075 | $ | 6.60 | |||
| Forfeited |
(11,354 | ) | $ | 6.35 | ||
| Vested |
(78,037 | ) | $ | 6.75 | ||
| Non-vested restricted stock at December 31, 2009 |
311,684 | $ | 6.57 | |||
94
Table of Contents
GEOMET, INC. AND SUBSIDIARIES
NOTES TO CONSOLIDATED AUDITED FINANCIAL STATEMENTS—(Continued)
For the year ended December 31, 2009, 78,037 restricted shares vested with a grant date fair value of $526,582. For the year ended December 31, 2008, 28,391 restricted shares vested with a grant date fair value of $205,209. For the year ended December 31, 2007, 4,083 restricted shares vested with a grant date fair value of $34,869.
Note 14—Profit Sharing Plan
Substantially all of the employees are covered by our profit sharing plan under Section 401(k) of the Internal Revenue Code. Eligible employees may make contributions to the plan by electing to defer some of their compensation. We are required to match 100 percent of the first three percent of their annual compensation contributed and 50 percent of the following two percent of their annual compensation contributed. Our matching contribution vests evenly over three years. Once a participant is fully vested all future matching contributions vest immediately. Our contributions to the Plan for the years ended December 31, 2009, 2008 and 2007 were $216,842, $264,305 and $170,062, respectively.
Note 15—Commitments and Contingencies
From time to time we are a party to litigation in the normal course of business. While the outcome of lawsuits or other proceedings against us cannot be predicted with certainty, management does not believe that the adverse effect on our financial condition, results of operations or cash flows, if any, will be material.
CNX Antitrust Action
We filed a complaint against CNX Gas Company LLC (“CNX”) and Island Creek Coal Company (“Island Creek”), an affiliate of CNX, in the Circuit Court of Tazewell County, Virginia on February 14, 2007, in which we sought damages arising from alleged violations of the Virginia Antitrust Act, tortious interference with contractual relations with third parties and statutory and common law conspiracy. The suit sought compensatory and consequential damages for alleged violations of the Virginia Antitrust Act, including alleged anticompetitive efforts of CNX to dominate and maintain its control over the market for the production and transportation of coalbed methane gas from the Oakwood Field in Buchanan County, Virginia and for CNX’s alleged efforts to conspire and act in concert with Island Creek and others to dominate and maintain control over the market for the production and transportation of coalbed methane gas from the Oakwood Field in violation of the Virginia Antitrust Act and Virginia statutory and common law. The suit also alleged CNX’s intentional interference with our existing and prospective third-party business relationships in an attempt to harm us and improve CNX’s position and corporate and financial interests. In December 2007, we filed an amended petition that restated with specificity our claims against CNX and Island Creek, and added Cardinal States Gathering Company and CONSOL Energy Inc., the ultimate parent of the other defendants, as defendants. On June 3, 2009, the Court ruled on the demurrers to our claims that had been filed by CNX, denying CNX’s demurrers with respect to four of our five state-law antitrust claims for monopolization and attempted monopolization and upholding only the demurrers to one antitrust theory and the claims under Virginia law for tortious interference. As a result of this ruling, we are proceeding to full discovery and moving towards a trial on the merits, seeking $385.6 million in actual damages, with the possibility for trebling of those damages under the statute, as well as injunctive relief to prevent CNX and the other defendants from continuing these alleged anticompetitive activities. Although we remain open to a commercially reasonable settlement, we intend to pursue discovery and trial in this matter.
95
Table of Contents
GEOMET, INC. AND SUBSIDIARIES
NOTES TO CONSOLIDATED AUDITED FINANCIAL STATEMENTS—(Continued)
Environmental and Regulatory
As of December 31, 2009, there were no known environmental or other regulatory matters related to our operations that are reasonably expected to result in a material liability to us.
Operating Lease Commitments—We have operating leases for office space, office equipment and field compressors expiring in various years through 2014. Future minimum lease commitments as of December 31, 2009 under non-cancelable operating leases having remaining terms in excess of one year are as follows:
| Year Ended December 31, |
Amount | ||
| 2010 |
$ | 1,408,201 | |
| 2011 |
1,354,079 | ||
| 2012 |
629,560 | ||
| 2013 |
426,383 | ||
| 2014 |
188,040 | ||
| Thereafter |
782,672 | ||
| Total future minimum lease commitments |
$ | 4,788,935 | |
Total rental expenses under operating leases were approximately $1,857,026, $2,005,994 and $1,542,660 for the years ended December 31, 2009, 2008 and 2007, respectively.
Transportation Contracts—As of December 31, 2009, under the following firm transportation contracts, we can transport maximum daily volumes of (1) 500 MMBtu’s continuing until October 31, 2010, (2) 15,000 MMBtu’s continuing until April 1, 2022, and (3) 10,000 MMBtu’s continuing until April 1, 2017. We have a right to extend each of these contracts, in five-year increments, at the maximum tariff rate. As of December 31, 2009, the maximum commitment remaining under the transportation contracts is approximately $13.5 million.
Note 16—Additional Financial Statement Information
Certain balance sheet amounts are comprised of the following:
| December 31, | ||||||
| 2009 | 2008 | |||||
| Accounts payable: |
||||||
| Trade payables |
$ | 2,075,002 | $ | 4,924,486 | ||
| Capital costs payable |
397,375 | 5,556,897 | ||||
| Revenues and royalties payable |
1,807,085 | 1,869,935 | ||||
| Lease operating expenses payable |
878,551 | 760,862 | ||||
| Other |
11,161 | 272,495 | ||||
| Total accounts payable |
$ | 5,169,174 | $ | 13,384,675 | ||
| Accrued liabilities: |
||||||
| Accrued interest expense |
$ | 377,602 | $ | 400,955 | ||
| Accrued employee compensation |
1,237,751 | 1,219,100 | ||||
| Accrued ad valorem taxes payable |
1,113,574 | 923,835 | ||||
| Accrued franchise taxes |
79,300 | 79,750 | ||||
| Total accrued liabilites |
$ | 2,808,227 | $ | 2,623,640 | ||
96
Table of Contents
SUPPLEMENTARY FINANCIAL AND OPERATING INFORMATION ON GAS
EXPLORATION, DEVELOPMENT AND PRODUCING ACTIVITIES (UNAUDITED)
This supplemental schedule provides unaudited information pursuant to ASC 932, formerly SFAS No. 69, Disclosures About Oil and Gas Producing Activities — an amendment of FASB Statements No. 19, 25, 33, and 39) and certain other information.
Capitalized Costs—Capitalized costs and accumulated depletion and impairment of gas properties relating to our gas producing activities, all of which are conducted within the continental U.S. and Canada at December 31, 2009, 2008, and 2007 are summarized below.
We capitalize certain payroll and other internal costs directly attributable to acquisition, exploration and development activities as part of our investment in natural gas properties over the periods benefited by these activities. During the years ended December 31, 2009, 2008 and 2007, these capitalized costs amounted to $1,485,510, $2,329,748, and $1,991,760, respectively. Capitalized costs do not include any costs related to production, general corporate overhead or similar activities. Capitalized costs in 2007 include a $3.0 million purchase price adjustment for a 2004 acquisition. For the year ended December 31, 2009, no interest costs were capitalized. For the years ended December 31, 2008 and 2007, interest costs of $304,342 and $587,884, respectively, were capitalized.
| December 31, | ||||||||||||
| 2009 | 2008 | 2007 | ||||||||||
| Unevaluated properties—U.S. |
$ | — | $ | 5,017 | $ | 6,651,594 | ||||||
| Unevaluated properties—Canada |
— | — | 18,523,170 | |||||||||
| Properties subject to amortization—U.S. |
434,093,992 | 425,437,272 | 370,404,336 | |||||||||
| Properties subject to amortization—Canada |
26,909,099 | 22,531,264 | — | |||||||||
| Capitalized costs—consolidated |
461,003,091 | 447,973,553 | 395,579,100 | |||||||||
| Accumulated depletion and impairment of gas properties—U.S. |
(336,710,177 | ) | (72,743,290 | ) | (30,661,248 | ) | ||||||
| Accumulated depletion and impairment of gas properties—Canada |
(26,909,099 | ) | (18,686,273 | ) | — | |||||||
| Net capitalized costs—consolidated |
97,383,815 | 356,543,990 | 364,917,852 | |||||||||
| Net capitalized costs—Canada |
— | 3,844,991 | 18,523,170 | |||||||||
| Net capitalized costs—U.S. |
97,383,815 | 352,698,999 | 343,394,682 | |||||||||
| Net capitalized costs—consolidated |
$ | 97,383,815 | $ | 356,543,990 | $ | 364,917,852 | ||||||
97
Table of Contents
Capitalized Costs Incurred
The following table discloses costs incurred in gas property acquisition, exploration and development activities for years ended December 31, 2009, 2008 and 2007.
| For the Years Ended December 31, | |||||||||
| 2009 | 2008 | 2007 | |||||||
| Acquisition costs-proved—U.S. |
$ | 2,623,672 | $ | 3,153,568 | $ | 3,827,641 | |||
| Acquisition costs-unproved—U.S. |
— | 2,779,865 | 4,883,982 | ||||||
| Exploration costs incurred—U.S. |
28,549 | 6,055,041 | 1,937,858 | ||||||
| Development costs incurred—U.S. |
5,999,482 | 34,670,459 | 42,561,606 | ||||||
| Total costs incurred—U.S. |
8,651,703 | 46,658,933 | 53,211,087 | ||||||
| Acquisition costs-proved—Canada |
59,318 | 65,251 | — | ||||||
| Acquisition costs-unproved—Canada |
— | — | 435,133 | ||||||
| Exploration costs incurred—Canada |
— | 51,542 | 5,523,744 | ||||||
| Development costs incurred—Canada |
4,318,517 | 5,618,726 | — | ||||||
| Total costs incurred—Canada |
4,377,835 | 5,735,519 | 5,958,877 | ||||||
| Total costs incurred—consolidated |
$ | 13,029,538 | $ | 52,394,452 | $ | 59,169,964 | |||
Reserves—The following table summarizes our net ownership interests in estimated quantities of proved gas reserves and changes in net proved reserves, all of which are located in the continental U.S. Reserve estimates for natural gas contained below were prepared by DeGolyer and MacNaughton (“D&M”), independent petroleum engineers.
Users of this information should be aware that the process of estimating quantities of “proved,” “proved developed” and “proved undeveloped” natural gas reserves is very complex, requiring significant subjective decisions in the evaluation of all available geological, engineering and economic data for each reservoir. The data for a given reservoir may also change substantially over time as a result of numerous factors including, but not limited to, additional development activity, evolving production history, and continual reassessment of the viability of production under varying economic conditions. Consequently, material revisions (upward or downward) to existing reserve estimates may occur from time to time. Although every reasonable effort is made to ensure that reserve estimates reported represent the most accurate assessments possible, the significance of the subjective decisions required and variances in available data for various reservoirs make these estimates generally less precise than other estimates presented in connection with financial statement disclosures.
| 2009 | 2008 | 2007 | |||||||
| Natural Gas Reserves (Mcf)—U.S. |
|||||||||
| Proved reserves at beginning of year |
315,711,000 | 350,176,000 | 325,663,000 | ||||||
| Revisions of previous estimates(1) |
(101,172,000 | ) | (42,708,000 | ) | (15,343,000 | ) | |||
| Extensions and discoveries |
— | 17,613,000 | 46,982,000 | ||||||
| Acquisition |
— | — | — | ||||||
| Disposition |
— | (1,917,000 | ) | — | |||||
| Revisions – new rules(2) |
2,242,000 | — | — | ||||||
| Production |
(7,507,000 | ) | (7,453,000 | ) | (7,126,000 | ) | |||
| Proved reserves at end of year |
209,274,000 | 315,711,000 | 350,176,000 | ||||||
| Proved developed reserves at beginning of year |
242,518,000 | 266,943,000 | 242,918,000 | ||||||
| Proved developed reserves at end of year |
156,241,000 | 242,518,000 | 266,943,000 | ||||||
98
Table of Contents
| 2009 | 2008 | 2007 | |||||
| Natural Gas Reserves (Mcf)—Canada |
|||||||
| Proved reserves at beginning of year |
3,818,000 | — | — | ||||
| Revisions of previous estimates |
(3,776,000 | ) | — | — | |||
| Extensions and discoveries |
— | 3,818,000 | — | ||||
| Acquisition |
— | — | — | ||||
| Disposition |
— | — | — | ||||
| Production |
(42,000 | ) | — | — | |||
| Proved reserves at end of year |
— | 3,818,000 | — | ||||
| Proved developed reserves at beginning of year |
3,818,000 | — | — | ||||
| Proved developed reserves at end of year |
— | 3,818,000 | — | ||||
| (1) | Includes 97,360,000 Mcf in revisions reported as of September 30, 2009 in our filing on Form 10-Q |
| (2) | Aggregated revisions resulting from the new SEC guidelines which became effective December 31, 2009 |
The reserves information in this filing on Form 10-K represents only estimates. There are a number of uncertainties inherent in estimating quantities of proved reserves, including many factors beyond our control, such as commodity pricing. Reserve engineering is a subjective process of estimating underground accumulations of natural gas that cannot be measured in an exact manner. The accuracy of any reserve estimate is a function of the quality of available data and of engineering and geological interpretation and judgment. As a result, estimates of different engineers may vary. In addition, results of drilling, testing and production subsequent to the date of an estimate may lead to revising the original estimate. Accordingly, initial reserve estimates are often different from the quantities of natural gas that are ultimately recovered. The meaningfulness of such estimates depends primarily on the accuracy of the assumptions upon which they were based. Except to the extent we acquire additional properties containing proved reserves or conduct successful exploration and development activities or both, our proved reserves will decline as reserves are produced.
Our proved natural gas reserves as of December 31, 2009, totaled approximately 209 Bcf, a decrease of approximately 1%, after production, from the approximate 213 Bcf of proved natural gas reserves at September 30, 2009, as audited by D&M, and a decrease, after production, of 32% from the approximate 320 Bcf of proved natural gas reserves at December 31, 2008. Proved reserve estimates are based on the unweighted arithmetic average prices on the first day of each month, adjusted for regional price differentials, for the 12-month period ended December 31, 2009. The average Henry Hub spot market price was $3.87 per Mcf, resulting in a natural gas price of $4.06 per Mcf when adjusted for regional price differentials. All prices and costs associated with operating wells were held constant in accordance with the amended SEC guidelines which were effective for financial statements for periods ending on or after December 31, 2009. The natural gas price used in the valuation of natural gas reserves as of September 30, 2009 was $4.43 per Mcf ($4.29 per Mcf market price for October 30, 2009, adjusted for regional price differentials), and as of December 31, 2008 was $5.84 per Mcf ($5.71 per Mcf Henry Hub spot market price for December 31, 2008, adjusted for regional price differentials).
Our proved reserves were 100% from coalbed methane reservoirs and were 75% developed. Approximately 62% of total year-end 2009 proved reserves are in the Pond Creek and Lasher fields in West Virginia and Virginia and 38% are in the Gurnee field in Alabama. The present value of proved reserves discounted at ten percent was approximately $98 million at December 31, 2009 as compared to $352 million at year-end 2008. Downward revisions, due in large part to under-performance in the Gurnee field, totaled approximately 103 Bcf, of which 101 Bcf were revisions reported as of September 30, 2009 in our filing on Form 10-Q. Our proved reserves at December 31, 2009 were also impacted by lower natural gas prices and costs in 2009. We were able to limit the effect of lower natural gas prices through our ongoing cost reduction strategy, which we implemented in April 2009.
99
Table of Contents
The following table presents the standardized measure of future net cash flows related to proved gas reserves in accordance with ASC 932. All components of the standardized measure are from proved reserves, all of which are located entirely within the continental U.S. and Canada. As prescribed by this statement, the amounts shown for December 31, 2009 are will be calculated using the unweighted arithmetic average of the price on the first day of each month within the 12-month period prior to the end of the reporting period, unless prices are defined by contractual arrangements, excluding escalations based on future conditions. The amounts shown for December 31, 2008 and 2007 are based on prices and costs at December 31, 2008 and 2007 and assume continuation of existing economic conditions. Future income taxes are based on year-end statutory rates, adjusted for tax credits. A discount factor of 10 percent was used to reflect the timing of future net cash flows. Extensive judgments are involved in estimating the timing of future production and the costs that will be incurred throughout the remaining lives of the fields. Accordingly, the estimates of future net revenues from proved reserves and the present value thereof may not be materially correct when judged against actual subsequent results. Further, since prices and costs do not remain static, and no price or cost changes have been considered, and future production and development costs are estimated to be incurred in developing and producing the estimated proved gas reserves, the results are not necessarily indicative of the fair market value of estimated proved reserves, and the results may not be comparable to estimates disclosed by other gas producers.
| December 31, | ||||||||||||
| Standardized Measure—U.S. |
2009 | 2008 | 2007 | |||||||||
| Future cash inflows |
$ | 849,379,000 | $ | 1,844,199,000 | $ | 2,654,214,000 | ||||||
| Future production costs |
(426,105,000 | ) | (727,785,000 | ) | (725,272,000 | ) | ||||||
| Future development costs |
(68,321,000 | ) | (105,707,000 | ) | (106,356,000 | ) | ||||||
| Future income taxes |
(47,935,000 | ) | (290,341,000 | ) | (602,319,000 | ) | ||||||
| Future net cash flows |
307,018,000 | 720,366,000 | 1,220,267,000 | |||||||||
| 10% annual discount to reflect timing of cash flows |
(157,820,000 | ) | (413,859,000 | ) | (724,399,000 | ) | ||||||
| Standardized measure of discounted future net cash flows(1) |
$ | 149,198,000 | $ | 306,507,000 | $ | 495,868,000 | ||||||
| December 31, | ||||||||||||
| Standardized Measure—Canada |
2009 | 2008 | 2007 | |||||||||
| Future cash inflows |
$ | — | $ | 20,932,000 | $ | — | ||||||
| Future production costs |
— | (7,126,000 | ) | — | ||||||||
| Future development costs |
— | (30,000 | ) | — | ||||||||
| Future income taxes |
— | — | — | |||||||||
| Future net cash flows |
— | 13,776,000 | — | |||||||||
| 10% annual discount to reflect timing of cash flows |
— | (9,936,000 | ) | — | ||||||||
| Standardized measure of discounted future net cash flows |
$ | — | $ | 3,840,000 | $ | — | ||||||
| (1) | Standardized measure of discounted future net cash flows as of December 31, 2009 is in excess of PV-10 due to the income tax impact of the ceiling write-downs incurred to-date. In other words, the tax basis of our gas properties is in excess of the book basis of our gas properties as of December 31, 2009. See the reconciliation of our PV-10 to our standardized measure of discounted future net cash flows in “Item 6. Selected Financial Data.” |
100
Table of Contents
Changes in standardized measure relating to proved gas reserves for the years ended December 31, 2009, 2008 and 2007 are summarized below:
| Changes in Standardized Measure |
2009 | 2008 | 2007 | |||||||||
| Standardized measure at beginning of year |
$ | 310,347,000 | $ | 495,868,000 | $ | 359,487,000 | ||||||
| Sales and transfers of oil and gas produced—net of production cost |
(10,472,000 | ) | (46,908,000 | ) | (29,340,000 | ) | ||||||
| Net changes in prices and production cost |
(168,683,000 | ) | (238,413,000 | ) | 248,627,000 | |||||||
| Extensions and discoveries |
— | 17,666,000 | 58,936,000 | |||||||||
| Acquisition/disposition (net) |
— | (9,708,000 | ) | — | ||||||||
| Net change in development cost |
14,862,000 | 19,685,000 | (43,181,000 | ) | ||||||||
| Revision of previous quantity estimates |
(71,363,000 | ) | (55,087,000 | ) | (35,222,000 | ) | ||||||
| Accretion of discount before income taxes |
35,195,000 | 66,281,000 | 52,563,000 | |||||||||
| Net change in income taxes |
93,133,000 | 125,336,000 | (8,678,000 | ) | ||||||||
| Changes in production rates (timing) and other |
(53,821,000 | ) | (64,373,000 | ) | (107,324,000 | ) | ||||||
| Subtotal net change |
(161,149,000 | ) | (185,521,000 | ) | 136,381,000 | |||||||
| Standardized measure at end of year |
$ | 149,198,000 | $ | 310,347,000 | $ | 495,868,000 | ||||||
The above tables were calculated using natural gas prices in effect as of the balance sheet date, adjusted for regional price differentials, held constant over the life of the reserves. The natural gas prices used at December 31, 2009, 2008 and 2007 were $4.06, $5.84, and $7.58 per Mcf, respectively.
101
Table of Contents
QUARTERLY RESULTS OF OPERATIONS (Unaudited)
Quarterly Results of Operations. The following table sets forth the results of operations by quarter for the years ended December 31, 2009 and 2008 (in thousands):
| Quarter Ended | ||||||||||||||||
| Mar. 31 | Jun. 30 | Sept. 30 | Dec. 31 | |||||||||||||
| Fiscal Year 2009: |
||||||||||||||||
| Total revenues |
$ | 9,551 | $ | 6,915 | $ | 6,490 | $ | 8,008 | ||||||||
| Lease operating expense |
$ | (4,569 | ) | $ | (3,348 | ) | $ | (3,195 | ) | $ | (2,823 | ) | ||||
| Compression and transportation expense |
$ | (1,450 | ) | $ | (1,365 | ) | $ | (1,235 | ) | $ | (962 | ) | ||||
| General and administrative |
$ | (2,973 | ) | $ | (2,181 | ) | $ | (1,853 | ) | $ | (1,342 | ) | ||||
| Impairment of gas properties |
$ | (139,712 | ) | $ | (27,582 | ) | $ | (69,147 | ) | $ | (20,847 | ) | ||||
| Operating (loss) from continuing operations |
$ | (139,649 | ) | $ | (29,194 | ) | $ | (74,753 | ) | $ | (16,533 | ) | ||||
| Net (loss) |
$ | (87,726 | ) | $ | (19,386 | ) | $ | (48,343 | ) | $ | (11,679 | ) | ||||
| Net (loss) per share: |
||||||||||||||||
| Basic |
$ | (2.25 | ) | $ | (0.50 | ) | $ | (1.23 | ) | $ | (0.30 | ) | ||||
| Diluted |
$ | (2.25 | ) | $ | (0.50 | ) | $ | (1.23 | ) | $ | (0.30 | ) | ||||
| Fiscal Year 2008: |
||||||||||||||||
| Total revenues |
$ | 15,879 | $ | 20,904 | $ | 18,820 | $ | 13,491 | ||||||||
| Lease operating expense |
$ | (3,751 | ) | $ | (3,640 | ) | $ | (3,475 | ) | $ | (3,891 | ) | ||||
| Compression and transportation expense |
$ | (1,043 | ) | $ | (1,005 | ) | $ | (1,129 | ) | $ | (1,321 | ) | ||||
| General and administrative |
$ | (2,492 | ) | $ | (2,887 | ) | $ | (2,098 | ) | $ | (1,891 | ) | ||||
| Impairment of gas properties |
$ | — | $ | — | $ | — | $ | (50,734 | ) | |||||||
| Operating (loss) income from continuing operations |
$ | (2,074 | ) | $ | (3,343 | ) | $ | 29,169 | $ | (42,248 | ) | |||||
| Net (loss) income |
$ | (2,142 | ) | $ | (3,177 | ) | $ | 17,482 | $ | (34,650 | ) | |||||
| Net (loss) income per share: |
||||||||||||||||
| Basic |
$ | (0.05 | ) | $ | (0.08 | ) | $ | 0.44 | $ | (0.89 | ) | |||||
| Diluted |
$ | (0.05 | ) | $ | (0.08 | ) | $ | 0.44 | $ | (0.89 | ) | |||||
Item 9. Changes in and Disagreements with Accountants on Accounting and Financial Disclosure
None.
Item 9A. Controls and Procedures
Management’s Evaluation of Disclosure Controls and Procedures
Disclosure controls and procedures are controls and other procedures that are designed to ensure that information required to be disclosed by us in the reports we file or submit under the Exchange Act is recorded, processed, summarized, and reported, within the time periods specified by the SEC’s rules and forms and include, without limitation, controls and procedures designed to provide reasonable assurance that information required to be disclosed by us is accumulated and communicated to management, including our Chief Executive Officer and Chief Financial Officer, as appropriate to allow timely decisions regarding required disclosure.
Under the supervision and with the participation of management, our Chief Executive Officer and Chief Financial Officer have evaluated the effectiveness of our disclosure controls and procedures (as such term is defined in Rule 13a-15(e) and 15d-15(e) of the Exchange Act) as of December 31, 2009, and, based upon this evaluation, our Chief Executive Officer and Chief Financial Officer have concluded that these controls and procedures are effective in providing reasonable assurance that information requiring disclosure is recorded, processed, summarized, and reported within the timeframe specified by the SEC’s rules and forms.
102
Table of Contents
Changes in Internal Control over Financial Reporting
Under the supervision and with the participation of management, including the Chief Executive Officer and Chief Financial Officer, we have evaluated our internal controls over financial reporting (as such term is defined in Rules 13a-15(f) and 15d-15(f) under the Exchange Act) that occurred during the three months ended December 31, 2009 and found no change that has materially affected, or is reasonably likely to materially affect, internal control over financial reporting.
Management’s Annual Report On Internal Control Over Financial Reporting
Management of GeoMet, Inc. (the “Company”), including the Company’s Chief Executive Officer and Chief Financial Officer, is responsible for establishing and maintaining adequate internal control over financial reporting for the Company. The Company’s internal control system was designed to provide reasonable assurance to the Company’s Management and Directors regarding the preparation and fair presentation of published financial statements. Because of its inherent limitations, internal control over financial reporting may not prevent or detect misstatements. Also, projections of any evaluation of effectiveness to future periods are subject to the risk that controls may become inadequate because of changes in conditions, or that the degree of compliance with the policies or procedures may deteriorate.
Management conducted an evaluation of the effectiveness of internal control over financial reporting based on the Internal Control—Integrated Framework issued by the Committee of Sponsoring Organizations of the Treadway Commission. Based on this evaluation, management concluded that the Company’s internal control over financial reporting was effective as of December 31, 2009.
| /s/ J. DARBY SERÉ |
/s/ WILLIAM C. RANKIN | |
| J. Darby Seré, Chief Executive Officer |
William C. Rankin Chief Financial Officer |
Houston, Texas
March 31, 2010
The independent auditor’s attestation report is incorporated by reference to Report of Independent Registered Public Accounting Firm, included in Item 8, Financial Statements and Supplementary Data.
On March 29, 2010, the Company executed commitment letters with NGP Capital Resources Company, or NGPC, and North Shore Energy, LLC, or North Shore, an affiliate of our largest stockholder, whereby NGPC and North Shore have agreed to the preliminary terms of a commitment to purchase up to $20 million each ($40 million in the aggregate) of the Company’s convertible preferred stock in the event that a proposed rights offering of the convertible preferred stock is not fully subscribed by our common stockholders. NGPC and North Shore each received an initial non-refundable payment of $250,000 from the Company in exchange for the commitment letters. The initial payment will be credited against a $600,000 fee due to each of NGPC and North Shore upon the closing of a rights offering and backstop commitment. Our Board of Directors approved the execution of the commitment letters after its receipt of a recommendation to do so by a Special Committee comprised of two independent directors with no affiliation with our largest stockholder. The Special Committee retained the services of independent legal counsel and a financial advisor in evaluating and formulating its recommendation to the Board.
Under the terms of the commitment letters, neither NGPC nor North Shore will be obligated to purchase the aggregate $40 million in convertible preferred stock until a definitive backstop agreement is executed by the Company, NGPC and North Shore. In addition, the backstop commitment by NGPC and North Shore is subject to the following conditions precedent:
| • | completion of title, environmental and corporate due diligence by NGPC and North Shore; |
103
Table of Contents
| • | absence of any change, occurrence or development that would have a material adverse effect on the Company; |
| • | absence of any material adverse conditions in the financial or capital markets; |
| • | extension of the Company’s senior credit facility; and |
| • | other customary closing conditions. |
Under the terms of the proposed $40 million backstop commitment, we would distribute to our stockholders rights to purchase up to an aggregate of 4,000,000 new shares of convertible preferred stock at a price of $10.00 per share. The number of rights to be distributed per share of common stock would be determined when our board of directors sets a record date for the rights offering and would be set forth in a prospectus supplement to our effective registration statement on Form S-3 (Registration No. 333-163193). Each whole right would entitle a holder to purchase one share of convertible preferred stock at the subscription price. In the even that our stockholders do not subscribe for all 4,000,000 shares of preferred stock offered, NGPC and North Shore would purchase any unsubscribed shares of convertible preferred stock pursuant to the terms of a backstop agreement. Specifically, NGPC and North Shore each would purchase up to $20 million of convertible preferred stock assuming no stockholder subscriptions and would participate equally in the remaining shares of convertible preferred stock.
The following is a description of the proposed terms of the Company’s convertible preferred stock that would be issued in connection with the proposed rights offering, as set forth in the commitment letters:
| • | Convertible into the Company’s common stock at a conversion price of $1.30 per share, as adjusted for dividends, stock splits or similar events affecting the Company’s common stock; |
| • | Dividends payable quarterly either in cash at an annual rate of 9.6% or, until the fifth anniversary of the closing date, in additional shares of preferred stock at an annual rate of 12.5%; |
| • | After fifth anniversary of the closing date, the Company, subject to certain limits based on the recent trading volume of the Company’s common stock, may elect to convert portions of the convertible preferred stock if the average trading price of the Company’s common stock exceeds 225% of the conversion price which is currently $2.93; |
| • | Redeemable at the option of the holder upon the earlier of (i) a liquidation event or (ii) the eighth anniversary of the closing date, and the redemption price for each share of convertible preferred stock will be equal the price paid for such share plus any accrued and unpaid dividends on such share; |
| • | A liquidation preference that would entitle the holder of convertible preferred stock to receive an amount equal to the greater of: |
| (i) | the original purchase price for each share of convertible preferred stock held, including shares issued as dividends, plus any accrued and unpaid dividends; or |
| (ii) | a per share amount equal to the liquidation distribution payable with respect to shares of the Company’s common stock. |
Under the terms set forth in the commitment letters, NGPC and North Shore are entitled to receive a backstop fee of $600,000 each, or $1.2 million in the aggregate, upon the closing of the rights offering and backstop commitment. An initial $500,000 aggregate payment already made by the Company will be credited against the backstop fee. In addition, in the event that less than $15 million of convertible preferred stock is available for NGPC or North Shore to purchase following the rights offering, the Company will be required to pay NGPC and/or North Shore an additional fee of 3% of the shortfall (i.e., the difference between $15 million and the amount of convertible preferred stock actually purchased). We have agreed to pay or reimburse NGPC and North Shore for all reasonable costs and out-of-pocket expenses relating to their commitments.
104
Table of Contents
As additional consideration for their commitment to backstop the proposed rights offering, NGPC and North Shore would each be entitled to appoint one member to our board of directors so long as it held a threshold amount of convertible preferred stock, and our board would be comprised of no more than nine directors. Certain Company actions would require the approval of a supermajority (70%) of our board, including approval of our annual operating budget, capital expenditure budget and general and administrative budget.
The commitment letters also outline certain covenants that are expected be included in the backstop agreement, including:
| • | A debt incurrence test during the first year following closing of the proposed rights offering; |
| • | A maximum debt-to-EBITDA ratio, which would be less restrictive than the ratio required under our senior credit facility; |
| • | A limit on general and administrative expenses; and |
| • | A $5 million reduction in Company debt each year that a threshold amount of convertible preferred stock remains outstanding. |
In addition, so long as a threshold amount of convertible preferred stock remains outstanding, the Company may not incur additional material debt, issue any equity senior or on par with the convertible preferred stock, engage in any material acquisitions or other significant corporate transactions, incur any exploration expenses, or engage in certain other activities without the consent of NGPC and North Shore.
In the event of a default by the Company under the proposed backstop agreement, NGPC and North Shore would have the right to appoint a majority of the members of the Company’s board of directors until such default is cured or waived by NGPC and North Shore. If the default continues for more than 12 months (absent a cure or waiver), NGPC and North Shore would have the right to require the Company to redeem their shares of convertible preferred stock at the redemption price described above.
Under the terms of the commitment letters, the Company has agreed to indemnify NGPC and North Shore for any and all losses, claims, liabilities, damages and expenses incurred by NGPC and North Shore arising out or relating to the commitment letters, proposed backstop agreement, other than those incurred by reason of NGPC’s or North Shore’s gross negligence or willful misconduct. Further, the Company has agreed to pay or reimburse NGPC and North Shore for all reasonable costs and out-of-pocket expenses incurred in connection with the negotiation, preparation, administration and enforcement of the commitment letters and proposed backstop agreement.
The foregoing summary of the terms of the commitment letters with NGPC and North Shore is not intended to be complete and is qualified in its entirety by reference to the commitment letters, which are filed with this annual report on Form 10-K as Exhibits 10.21 and 10.22.
105
Table of Contents
PART III
Item 10. Directors, Executive Officers and Corporate Governance
The information required by this item is incorporated herein by reference to the 2010 Proxy Statement, which will be filed with the Commission not later than 120 days subsequent to December 31, 2009. Pursuant to Item 401(b) of Regulation S-K, the information required by this item with respect to our executive officers is set forth in Part I of this report.
Item 11. Executive Compensation
The information required by this item is incorporated herein by reference to the 2010 Proxy Statement, which will be filed with the Commission not later than 120 days subsequent to December 31, 2009.
Item 12. Security Ownership of Certain Beneficial Owners and Management and Related Stockholder Matters
The information required by this item is incorporated herein by reference to the 2010 Proxy Statement, which will be filed with the Commission not later than 120 days subsequent to December 31, 2009.
Item 13. Certain Relationships and Related Transactions, and Director Independence
The information required by this item is incorporated herein by reference to the 2010 Proxy Statement, which will be filed with the Commission not later than 120 days subsequent to December 31, 2009.
Item 14. Principal Accountant Fees and Services
The information required by this item is incorporated herein by reference to the 2010 Proxy Statement, which will be filed with the Commission not later than 120 days subsequent to December 31, 2009.
106
Table of Contents
PART IV
Item 15. Exhibits and Financial Statement Schedules
List of Documents Filed as Part of this Report
(1) Financial Statements
| Page | ||
| CONSOLIDATED AUDITED FINANCIAL STATEMENTS |
||
| 67 | ||
| Consolidated Balance Sheets as of December 31, 2009 and 2008 |
68 | |
| Consolidated Statements of Operations for the years ended December 31, 2009, 2008 and 2007 |
69 | |
| 70 | ||
| Consolidated Statements of Cash Flows for the years ended December 31, 2009, 2008 and 2007 |
71 | |
| 72 | ||
| SUPPLEMENTARY INFORMATION (UNAUDITED)— |
||
| 97 | ||
| 102 | ||
(2) Financial Statement Schedules
None.
(3) Exhibits:
The following is a list of exhibits filed as part of this Form 10-K. Where so indicated, previously filed exhibits are incorporated herein by reference.
| Exhibit No. |
Description | |
| 3.1 | Form of Amended and Restated Certificate of Incorporation of GeoMet, Inc. (incorporated herein by reference to Exhibit 3.1 to the Company’s Registration Statement on Form S-1 filed on July 25, 2006 (Registration No. 333-131716)). | |
| 3.2 | Amended and Restated Bylaws of GeoMet, Inc. (incorporated herein by reference to Exhibit 3.1 to the Company’s 8-K filed on November 13, 2007 (Registration No. 000-52155)). | |
| 4.1 | Registration Rights Agreement between GeoMet, Inc. and Banc of America Securities LLC, dated as of January 30, 2006 (incorporated herein by reference to Exhibit 4.1 to the Company’s Registration Statement on Form S-1 filed on February 10, 2006 (Registration No. 333-131716)). | |
| 10.1 | 2005 Stock Option Plan of GeoMet Inc., dated April 15, 2005 (incorporated herein by reference to Exhibit 10.2 to the Company’s Registration Statement on Form S-1 filed on February 10, 2006 (Registration No. 333-131716)). | |
| 10.2 | Form of Incentive Stock Option Agreement for the 2005 Stock Option Plan of GeoMet, Inc. (incorporated herein by reference to Exhibit 10.3 to the Company’s Registration Statement on Form S-1 filed on February 10, 2006 (Registration No. 333-131716)). | |
| 10.3 | Federal Income Tax Allocation Agreement among the Members of the GeoMet Resources, Inc. Consolidated Group, dated as of January 1, 2001 (incorporated herein by reference to Exhibit 10.4 to the Company’s Registration Statement on Form S-1 filed on February 10, 2006 (Registration No. 333-131716)). | |
107
Table of Contents
| Exhibit No. |
Description | |
| 10.4 | Incentive Bonus Pool Plan, dated as of May 29, 2001 (incorporated herein by reference to Exhibit 10.5 to the Company’s Registration Statement on Form S-1 filed on February 10, 2006 (Registration No. 333-131716)). | |
| 10.5 | Employment Agreement dated as of December 7, 2000 between GeoMet Resources, Inc. and William C. Rankin (incorporated herein by reference to Exhibit 10.6 to the Company’s Registration Statement on Form S-1 filed on February 10, 2006 (Registration No. 333-131716)). | |
| 10.6 | Employment Agreement dated as of December 7, 2000 between GeoMet Resources, Inc. and J. Darby Seré (incorporated herein by reference to Exhibit 10.7 to the Company’s Registration Statement on Form S-1 filed on February 10, 2006 (Registration No. 333-131716)). | |
| 10.7 | Third Amended and Restated Credit Agreement dated June 9, 2006, among GeoMet, Inc., Bank of America, N.A., as Administrative Agent, and BNP Paribas, as Syndication Agent (incorporated herein by reference to Exhibit 10.8 to the Company’s Registration Statement on Form S-1 filed on June 21, 2006 (Registration No. 333-131716)). | |
| 10.8 | Precedent Agreement dated March 28, 2006 between East Tennessee Natural Gas, LLC and GeoMet, Inc. (incorporated herein by reference to Exhibit 10.10 to the Company’s Registration Statement on Form S-1 filed on May 12, 2006 (Registration No. 333-131716)) (portions of this exhibit have been omitted and filed separately with the Securities and Exchange Commission pursuant to a request for confidential treatment in accordance with Rule 406 under the Securities Act). | |
| 10.9 | Option Agreement dated June 13, 2006 between Jon M. Gipson and GeoMet, Inc. (incorporated herein by reference to Exhibit 10.11 to the Company’s Registration Statement on Form S-1 filed on June 21, 2006 (Registration No. 333-131716)). | |
| 10.10 | Amendment to Employment Agreement dated March 13, 2007 between GeoMet, Inc. and J. Darby Seré (incorporated herein by reference to Exhibit 10.13 to the Company’s 10-K filed on March 20, 2007 (Registration No. 000-52155)). | |
| 10.11 | Amendment to Employment Agreement dated March 13, 2007 between GeoMet, Inc. and William C. Rankin (incorporated herein by reference to Exhibit 10.14 to the Company’s 10-K filed on March 20, 2007 (Registration No. 000-52155)). | |
| 10.12 | Employee Cash Bonus and Stock Award Retention Agreement dated November 9, 2007 between GeoMet, Inc. and Tony Oviedo (incorporated herein by reference to Exhibit 10.14 to the Company’s 10-K filed on March 13, 2009 (Registration No. 000-52155)). | |
| 10.13 | Second Amendment to Employment Agreement dated effective as of December 31, 2008 between GeoMet, Inc. and J. Darby Seré (incorporated herein by reference to Exhibit 10.15 to the Company’s 10-K filed on March 13, 2009 (Registration No. 000-52155)). | |
| 10.14 | Second Amendment to Employment Agreement dated effective as of December 31, 2008 between GeoMet, Inc. and William C. Rankin (incorporated herein by reference to Exhibit 10.16 to the Company’s 10-K filed on March 13, 2009 (Registration No. 000-52155)). | |
| 10.15 | Stock Acquisition and Stockholders Agreement dated December 7, 2000 by and among GeoMet Resources, Inc., Yorktown Energy Partners IV, L.P., J. Darby Seré, and William C. Rankin (incorporated by reference to Exhibit 4.3 of the Company’s Registration Statement on Form S-8, File No. 333-136924 filed on August 28, 2006). | |
108
Table of Contents
| Exhibit No. |
Description | |
| 10.16 | Form of Amended and Restated Non-Qualified Stock Option Agreement dated December 2, 2008 (incorporated herein by reference to Exhibit 10.18 to the Company’s 10-K filed on March 13, 2009 (Registration No. 000-52155)). | |
| 10.17 | Form of Stock Option Award Agreement for the GeoMet, Inc. 2006 Long-Term Incentive Plan (incorporated herein by reference to Exhibit 10.19 to the Company’s 10-K filed on March 13, 2009 (Registration No. 000-52155)). | |
| 10.18 | Business Opportunities Agreement among GeoMet, Inc. and the other signatories thereto dated March 12, 2009 (incorporated herein by reference to Exhibit 10.20 to the Company’s 10-K filed on March 13, 2009 (Registration No. 000-52155)). | |
| 10.19 | Second Amendment to Third Amended and Restated Credit Agreement dated March 24, 2009 by and among Bank of America, N.A., as administrative agent, and certain financial institutions, as lenders (incorporated by reference to Exhibit 10.1 to the Company’s 8-K filed on March 25, 2009) | |
| 10.20 | GeoMet, Inc. 2006 Long-Term Incentive Plan (Amended and Restated Effective March 12, 2009) (incorporated by reference to Exhibit 10.1 to the Company’s 8-K filed on May 13, 2009) | |
| 10.21* | Commitment Letter dated effective March 29, 2010 by and between NGP Capital Resources Company and GeoMet, Inc. | |
| 10.22* | Commitment Letter dated effective March 29, 2010 by and between North Shore Energy, LLC and GeoMet, Inc. | |
| 10.23* | Third Amendment to Third Amended and Restated Credit Agreement dated March 30, 2010 by and among Bank of America, N.A., as administrative agent, and certain financial institutions, as lenders | |
| 21.1* | List of Subsidiaries of GeoMet, Inc. | |
| 23.1* | Consent of Deloitte & Touche LLP | |
| 23.2* | Consent of Independent Petroleum Engineers DeGolyer and MacNaughton. | |
| 31.1* | Certification of Chief Executive Officer pursuant to Section 302 of the Sarbanes-Oxley Act of 2002. | |
| 31.2* | Certification of Chief Financial Officer pursuant to Section 302 of the Sarbanes-Oxley Act of 2002. | |
| 32* | Certification pursuant to 18 U.S.C. 1350, as adopted pursuant to Section 906 of the Sarbanes-Oxley Act of 2002. | |
| 99.1* | Report of DeGolyer and MacNaughton. | |
| * | Filed herewith. |
109
Table of Contents
SIGNATURES
In accordance with Section 13 or 15(d) of the Exchange Act, the registrant has duly caused this report to be signed on its behalf by the undersigned, thereunto duly authorized on March 31, 2010.
| GEOMET, INC. | ||
| By: | /s/ J. DARBY SERÉ | |
| Name: | J. Darby Seré | |
| Title: | President and Chief Executive Officer | |
In accordance with the Exchange Act, this report has been signed below by the following persons on behalf of the registrants and in the capacities on March 31, 2010.
| Signature |
Capacity | |
| /s/ J. DARBY SERÉ J. Darby Seré |
Chairman of the Board, President, Chief Executive Officer (Principal Executive Officer) | |
| /s/ WILLIAM C. RANKIN William C. Rankin |
Executive Vice President, Chief Financial Officer (Principal Financial Officer) | |
| /s/ TONY OVIEDO Tony Oviedo |
Vice President, Chief Accounting Officer and Controller | |
| /s/ J. HORD ARMSTRONG, III J. Hord Armstrong, III |
Director | |
| /s/ JAMES C. CRAIN James C. Crain |
Director | |
| /s/ STANLEY L. GRAVES Stanley L. Graves |
Director | |
| /s/ CHARLES D. HAYNES Charles D. Haynes |
Director | |
| /s/ W. HOWARD KEENAN, JR. W. Howard Keenan, Jr. |
Director | |
| /s/ PHILIP G. MALONE Philip G. Malone |
Director | |
110
Table of Contents
INDEX TO EXHIBITS
| Exhibit No. |
Description | |
| 3.1 | Form of Amended and Restated Certificate of Incorporation of GeoMet, Inc. (incorporated herein by reference to Exhibit 3.1 to the Company’s Registration Statement on Form S-1 filed on July 25, 2006 (Registration No. 333-131716)). | |
| 3.2 | Form Amended and Restated Bylaws of GeoMet, Inc. (incorporated herein by reference to Exhibit 3.1 to the Company’s 8-K filed on November 13, 2007 (Registration No. 000-52155)). | |
| 4.1 | Registration Rights Agreement between GeoMet, Inc. and Banc of America Securities LLC, dated as of January 30, 2006 (incorporated herein by reference to Exhibit 4.1 to the Company’s Registration Statement on Form S-1 filed on February 10, 2006 (Registration No. 333-134070)). | |
| 10.1 | 2005 Stock Option Plan of GeoMet Inc., dated April 15, 2005 (incorporated herein by reference to Exhibit 10.2 to the Company’s Registration Statement on Form S-1 filed on February 10, 2006 (Registration No. 333-134070)). | |
| 10.2 | Form of Incentive Stock Option Agreement for the 2005 Stock Option Plan of GeoMet, Inc. (incorporated herein by reference to Exhibit 10.3 to the Company’s Registration Statement on Form S-1 filed on February 10, 2006 (Registration No. 333-134070)). | |
| 10.3 | Federal Income Tax Allocation Agreement among the Members of the GeoMet Resources, Inc. Consolidated Group, dated as of January 1, 2001 (incorporated herein by reference to Exhibit 10.4 to the Company’s Registration Statement on Form S-1 filed on February 10, 2006 (Registration No. 333-134070)). | |
| 10.4 | Incentive Bonus Pool Plan, dated as of May 29, 2001 (incorporated herein by reference to Exhibit 10.5 to the Company’s Registration Statement on Form S-1 filed on February 10, 2006 (Registration No. 333-134070)). | |
| 10.5 | Employment Agreement dated as of December 7, 2000 between GeoMet Resources, Inc. and William C. Rankin (incorporated herein by reference to Exhibit 10.6 to the Company’s Registration Statement on Form S-1 filed on February 10, 2006 (Registration No. 333-134070)). | |
| 10.6 | Employment Agreement dated as of December 7, 2000 between GeoMet Resources, Inc. and J. Darby Seré (incorporated herein by reference to Exhibit 10.7 to the Company’s Registration Statement on Form S-1 filed on February 10, 2006 (Registration No. 333-134070)). | |
| 10.7 | Third Amended and Restated Credit Agreement dated June 9, 2006, among GeoMet, Inc., Bank of America, N.A., as Administrative Agent, and BNP Paribas, as Syndication Agent (incorporated herein by reference to Exhibit 10.8 to the Company’s Registration Statement on Form S-1 filed on June 21, 2006 (Registration No. 333-131716)). | |
| 10.8 | Precedent Agreement dated March 28, 2006 between East Tennessee Natural Gas, LLC and GeoMet, Inc. (incorporated herein by reference to Exhibit 10.10 to the Company’s Registration Statement on Form S-1 filed on May 12, 2006 (Registration No. 333-131716)) (portions of this exhibit have been omitted and filed separately with the Securities and Exchange Commission pursuant to a request for confidential treatment in accordance with Rule 406 under the Securities Act). | |
| 10.9 | Option Agreement dated June 13, 2006 between Jon M. Gipson and GeoMet, Inc. (incorporated herein by reference to Exhibit 10.11 to the Company’s Registration Statement on Form S-1 filed on June 21, 2006 (Registration No. 333-131716)). | |
111
Table of Contents
| Exhibit No. |
Description | |
| 10.10 | Amendment to Employment Agreement dated March 13, 2007 between GeoMet, Inc. and J. Darby Seré (incorporated herein by reference to Exhibit 10.13 to the Company’s 10-K filed on March 20, 2007 (Registration No. 000-52155)). | |
| 10.11 | Amendment to Employment Agreement dated March 13, 2007 between GeoMet, Inc. and William C. Rankin (incorporated herein by reference to Exhibit 10.14 to the Company’s 10-K filed on March 20, 2007 (Registration No. 000-52155)). | |
| 10.12 | Employee Cash Bonus and Stock Award Retention Agreement dated November 9, 2007 between GeoMet, Inc. and Tony Oviedo (incorporated herein by reference to Exhibit 10.14 to the Company’s 10-K filed on March 13, 2009 (Registration No. 000-52155)). | |
| 10.13 | Second Amendment to Employment Agreement dated effective as of December 31, 2008 between GeoMet, Inc. and J. Darby Seré (incorporated herein by reference to Exhibit 10.15 to the Company’s 10-K filed on March 13, 2009 (Registration No. 000-52155)). | |
| 10.14 | Second Amendment to Employment Agreement dated effective as of December 31, 2008 between GeoMet, Inc. and William C. Rankin (incorporated herein by reference to Exhibit 10.16 to the Company’s 10-K filed on March 13, 2009 (Registration No. 000-52155)). | |
| 10.15 | Stock Acquisition and Stockholders Agreement dated December 7, 2000 by and among GeoMet Resources, Inc., Yorktown Energy Partners IV, L.P., J. Darby Seré, and William C. Rankin (incorporated by reference to Exhibit 4.3 of the Company’s Registration Statement on Form S-8, File No. 333-136924 filed on August 28, 2006). | |
| 10.16 | Form of Amended and Restated Non-Qualified Stock Option Agreement dated December 2, 2008 (incorporated herein by reference to Exhibit 10.18 to the Company’s 10-K filed on March 13, 2009 (Registration No. 000-52155)). | |
| 10.17 | Form of Stock Option Award Agreement for the GeoMet, Inc. 2006 Long-Term Incentive Plan (incorporated herein by reference to Exhibit 10.19 to the Company’s 10-K filed on March 13, 2009 (Registration No. 000-52155)). | |
| 10.18 | Business Opportunities Agreement among GeoMet, Inc. and the other signatories thereto dated March 12, 2009 (incorporated herein by reference to Exhibit 10.20 to the Company’s 10-K filed on March 13, 2009 (Registration No. 000-52155)). | |
| 10.19 | Second Amendment to Third Amended and Restated Credit Agreement dated March 24, 2009 by and among Bank of America, N.A., as administrative agent, and certain financial institutions, as lenders (incorporated by reference to Exhibit 10.1 to the Company’s 8-K filed on March 25, 2009). | |
| 10.20 | GeoMet, Inc. 2006 Long-Term Incentive Plan (Amended and Restated Effective March 12, 2009) (incorporated by reference to Exhibit 10.1 to the Company’s 8-K filed on May 13, 2009). | |
| 10.21* | Commitment Letter dated effective March 29, 2010 by and between NGP Capital Resources Company and GeoMet, Inc. | |
| 10.22* | Commitment Letter dated effective March 29, 2010 by and between North Shore Energy, LLC and GeoMet, Inc. | |
| 10.23* | Third Amendment to Third Amended and Restated Credit Agreement dated March 30, 2010 by and among Bank of America, N.A., as administrative agent, and certain financial institutions, as lenders. | |
| 21.1* | List of Subsidiaries of GeoMet, Inc. | |
| 23.1* | Consent of Deloitte & Touche LLP | |
| 23.2* | Consent of DeGolyer and MacNaughton. | |
| 31.1* | Certification of chief executive officer required by Rules 13a-14 and 15d-14 under the Securities Exchange Act of 1934. | |
112
Table of Contents
| Exhibit No. |
Description | |
| 31.2* | Certification of chief financial officer required by Rules 13a-14 and 15d-14 under the Securities Exchange Act of 1934. | |
| 32* | Certification pursuant to 18 U.S.C. 1350, as adopted pursuant to Section 906 of the Sarbanes-Oxley Act of 2002. | |
| 99.1* | Report of DeGolyer and MacNaughton. | |
| * | Filed herewith. |
113