Attached files
| file | filename |
|---|---|
| EX-21 - EXHIBIT 21 - NUMEREX CORP /PA/ | exhibit21.htm |
| EX-23 - EXHIBIT 23 - NUMEREX CORP /PA/ | exhibit23.htm |
| EX-11 - EXHIBIT 11 - NUMEREX CORP /PA/ | exhibit11.htm |
| EX-31.1 - EXHIBIT 31.1 - NUMEREX CORP /PA/ | exhibit31_1.htm |
| EX-32.1 - EXHIBIT 32.1 - NUMEREX CORP /PA/ | exhibit32_1.htm |
| EX-31.2 - EXHIBIT 31.2 - NUMEREX CORP /PA/ | exhibit31_2.htm |
| EX-32.2 - EXHIBIT 32.2 - NUMEREX CORP /PA/ | exhibit32_2.htm |
UNITED
STATES
SECURITIES
AND EXCHANGE COMMISSION
Washington,
D.C. 20549
FORM
10-K
|
x
|
Annual
Report Pursuant to Section 13 or 15(d) of the Securities Exchange Act
of 1934
|
For
the fiscal year ended December 31, 2009
|
¨
|
Transition
Report Pursuant to Section 13 or 15(d) of the Securities Exchange Act
of 1934
|
For
the transition period from
to
Commission
File Number 0-22920
NUMEREX
CORP.
(Name
of Registrant as Specified in Its Charter)
|
Pennsylvania
|
11-2948749
|
|
|
(State
or Other Jurisdiction
of
Incorporation or Organization)
|
(I.R.S.
Employer
Identification
Number)
|
|
|
1600
Parkwood Circle, Suite 500, Atlanta, GA
|
30339
|
|
|
(Address
of Principal Executive Offices)
|
(Zip
Code)
|
|
(770)
693-5950
(Registrant’s
Telephone Number, Including Area Code)
Securities
Registered Pursuant to Section 12(b) of the Act:
|
Class
A Common Stock, no par value
(Title
of each class)
|
The
NASDAQ Stock Market LLC
(Name
of each exchange on which registered)
|
|
Securities
Registered Pursuant to Section 12(g) of the Act: None
Indicate
by check mark if the registrant is a well-known seasoned issuer, as defined in
Rule 405 of the Securities Act. Yes o No þ
Indicate by check mark if the
registrant is not required to file reports pursuant to Section 13 or 15
(d) of the Act. Yes o No þ
Indicate
by check mark whether the registrant (1) has filed all reports required to
be filed by Section 13 or 15(d) of the Securities Exchange Act of 1934
during the preceding 12 months (or for such shorter period that the
registrant was required to file such reports), and (2) has been subject to
such filing requirements for the past
90 days. Yes þ No o
Indicate
by check mark whether the registrant has submitted electronically and posted on
its corporate Web site, if any, every Interactive Data File required to be
submitted and posted pursuant to Rule 405 of Regulation S-T during the preceding
12 months (or for such shorter period that the registrant was required to submit
and post such files). Yes o No o
Indicate
by check mark if disclosure of delinquent filers pursuant to Item 405 of
Regulation S-K (§229.405 of this chapter) is not contained herein, and will
not be contained, to the best of registrant’s knowledge, in definitive proxy or
information statements incorporated by reference in Part III of this
Form 10-K or any amendment to this
Form 10-K. o
Indicate
by check mark whether the registrant is a large accelerated filer, an
accelerated filer, a non-accelerated filer, or a smaller reporting company. See
the definitions of “large accelerated filer,” “accelerated filer” and “smaller
reporting company” in Rule 12b-2 of the Exchange Act. (Check
one):
Large
accelerated
filer Accelerated
filer Non-accelerated filer þ Smaller
Reporting Company
Indicate
by check mark whether the registrant is a shell company (as defined in
Rule 12b-2 of the Act). Yes o No þ
The
aggregate market value of voting and non-voting common stock held by
nonaffiliates of the registrant (9,278,229 shares) based on the closing price of
the registrant’s common stock as reported on the NASDAQ Global Market on
June 30, 2009, was $46,576,710. For purposes of this
computation, all officers, directors, and 10% beneficial owners of the
registrant are deemed to be affiliates. Such determination should not
be deemed to be an admission that such officers, directors, or 10% beneficial
owners are, in fact, affiliates of the registrant.
The
number of shares outstanding of the registrant’s Class A Common Stock as of
March 26, 2010, was 15,070,501 shares.
DOCUMENTS
INCORPORATED BY REFERENCE
The
registrant intends to file a definitive proxy statement pursuant to
Regulation 14A within 120 days of the end of the fiscal year ended
December 31, 2009. The proxy statement is incorporated herein by reference
into the following parts of the Form 10-K:
Part III,
Item 10, Directors, Executive Officers and Corporate
Governance;
Part III,
Item 11, Executive Compensation;
Part III,
Item 12, Security Ownership of Certain Beneficial Owners and Management and
Related
Stockholder
Matters;
Part III,
Item 13, Certain Relationships and Related Transactions, and Director
Independence; and
Part III,
Item 14, Principal Accountant Fees and Services.
NUMEREX CORP.
ANNUAL
REPORT ON FORM 10-K
FOR
THE FISCAL YEAR ENDED DECEMBER 31, 2009
TABLE
OF CONTENTS
|
Page
|
||
|
PART
I
|
||
|
1
|
||
|
Risk
Factors
|
12
|
|
|
22
|
||
|
23
|
||
|
23
|
||
|
23
|
||
|
|
||
|
Securities
|
24
|
|
|
26
|
||
|
27
|
||
|
44
|
||
|
45
|
||
|
79
|
||
|
79
|
||
|
81
|
||
|
|
||
|
81
|
||
|
81
|
||
|
81
|
||
|
81
|
||
|
81
|
||
|
|
||
|
82
|
||
Forward-Looking
Statements
This
document may contain forward-looking statements with respect to Numerex future
financial or business performance, conditions or strategies and other financial
and business matters, including expectations regarding growth trends and
activities in the wireless data business. Forward-looking statements are
typically identified by words or phrases such as "believe," "expect,"
"anticipate," "intend," "estimate," "assume," "strategy," "plan," "outlook,"
"outcome," "continue," "remain," "trend," and variations of such words and
similar expressions, or future or conditional verbs such as "will," "would,"
"should," "could," "may," or similar expressions. Numerex cautions that these
forward-looking statements are subject to numerous assumptions, risks and
uncertainties, which change over time. These forward-looking statements speak
only as of the date of this press release, and Numerex assumes no duty to update
forward-looking statements. Actual results could differ materially from those
anticipated in these forward-looking statements and future results could differ
materially from historical performance.
The
following factors, among others, could cause actual results to differ materially
from forward-looking statements or historical performance: our inability to
reposition our platform to capture greater recurring service revenues; the risks
that a substantial portion of our revenues are derived from government contracts
that may be terminated by the government at any time; variations in quarterly
operating results; delays in the development, introduction, integration and
marketing of new wireless services; customer acceptance of services; economic
conditions resulting in decreased demand for our products and services; the risk
that our strategic alliances and partnerships will not yield substantial
revenues; changes in financial and capital markets, and the inability to raise
growth capital; the inability to attain revenue and earnings growth in our
wireless data business; changes in interest rates; inflation; the introduction,
withdrawal, success and timing of business initiatives and strategies;
competitive conditions; the inability to realize revenue enhancements; and
extent and timing of technological changes. Numerex SEC reports identify
additional factors that can affect forward-looking statements.
PART I. BUSINESS
Overview
Numerex
Corp. (“Numerex” or “Company”) is a wireless provider of a broad spectrum of
secure machine-to-machine (M2M) services. We emphasize recurring
revenues [through subscription sales] in order to enhance shareholder value
creation. We have continuously developed technology, networks, and
applications towards that end. We believe that simplifying the development
and deployment process is an important key to promoting sustainable growth in
the M2M industry. Numerex
DNA™ is our way of combining a device, a network and an application to
bring a customer’s M2M solution to life rapidly and easily. Our goal is to
“jumpstart” the application process for our customers, through our foundation
application software technology or Numerex FAST™, and to be a
single source for M2M products and services, i.e., a “one stop
shop.”
M2M is
defined as electronic (wireless) data communications between devices, systems,
and people that turns data into useful information across many industries.
At Numerex, we concentrate our efforts on several critical vertical
markets: commercial and residential security, energy and utilities,
healthcare, financial services, and government & transportation. We
endeavor to ensure data confidentiality, integrity and availability through the
full range of our services.
We
believe that Numerex has established a leadership position in M2M through
delivering end-to-end, single-source solutions as well as “white label”
products, i.e., products that are available for distribution as
branded offerings through Value Added Resellers (VARs), vertically focused
System Integrators (SIs) and Original Equipment Manufacturers (OEMs) who choose
to integrate our products and services into their own solutions. Numerex
customers can select from a menu of products and services that address their
specific M2M needs.
Numerex
has developed industry-specific expertise in offering M2M solutions with a host
of value added services. We provide value to our customers in removing much of
the complexity associated with the design, development, deployment and support
of their own M2M solutions so that they can better focus on their primary
business objectives and speed time to market. Generally, our
customers serve the final end user such as, for example
1
consumers
as car drivers or homeowners, as well as industrial users who want to better
monitor and control their operational processes.
We
continue to look for ways to expand our expertise by entering new vertical
sectors conducive to our long-term recurring revenue model. We may choose to
enter those sectors through industry partnerships, organically, or by
acquisition.
Our
offerings are wireless-based, using cellular and satellite networks. We
are technology-neutral and utilize a diverse range of manufacturing sources and
telecommunications standards. We emphasize high-margin
application-centered offerings, and have transitioned our business from
hardware-only sales to service contracts.
We have
developed an integrating platform resting on the data processing power of the
internet (a.k.a “cloud computing”) to provide turnkey solutions, i.e., the
complete Numerex DNA, to our customers. We call this platform Numerex
FAST™ (Foundation Application Software Technology), which is an “Open Platform
as a Service,” akin to a traditional “service bureau” that limits upfront
investment and risk.
Numerex
Corp is headquartered in Atlanta, Georgia, and organized under the laws of the
Commonwealth of Pennsylvania. The Company was founded in 1992
and first traded publicly in March 1994 (NASDAQ: NMRX). At the time, the Company
focused on “derived channel”, a wireline-based telemetry data communications
solution (“telemetry” is eventually subsumed by the ‘M2M’ acronym) and served
select vertical markets that included alarm security and line monitoring. In
November 1999, we sold our wireline business to British Telecommunications PLC
(“BT”) in order to focus on our nascent wireless data communications
business.
In May
1998, Numerex Corp., BellSouth Corporation and BellSouth Wireless, which became
Cingular in 2001, completed a transaction whereby Cellemetry LLC, a joint
venture between Numerex and Cingular, was formed. Cellemetry LLC provided a
cost-effective, two-way wireless data communications network throughout the
United States, Canada, Mexico, Colombia, Argentina, Paraguay, the Dutch
Antilles, and Puerto Rico. On March 28, 2003, we acquired Cingular’s interest in
Cellemetry LLC.
During
this period, we developed a Short Message Service Center (SMSC)-operated service
bureau, “Data1Source,” providing SMS-related services to tier 2 and 3 carriers
throughout the US. While Data1Source was subsequently sold, it helped
advance our technical expertise in the digital GSM and CDMA realms, and provided
a solid bedrock on which to build our current network. In parallel, we expanded
our technical platform to serve the mobile tracking and alarm monitoring
markets.
At the
beginning of 2006, the Company further enhanced its portfolio of wireless
products and services through the acquisition of the assets of Airdesk, Inc.
Airdesk’s wireless data solutions, network access and technical support have
been fully integrated into the Company’s operations.
In 2007,
Numerex acquired the assets of Orbit One Communications, Inc which provides
satellite data products and services to government agencies and the emergency
service market.
In
January 2008, Numerex was awarded the international ISO/IEC 27001:2005
Certification (ISO 27001) by BSI Management Systems. ISO 27001 is ISO’s highest
security certification for information security that ensures data
confidentiality, integrity and availability every step of the way. The ISO 27001
certification facilitates compliance with an array of information
security-related legislation and regulations in Numerex’s target markets such as
utilities (NERC CIP Cyber Security mandates), financial services (GLBA and PCI
DSS), healthcare (HIPAA), government (FISMA), and across markets (state laws
governing security breach notification and Sarbanes Oxley Act).
In
October 2008, Numerex acquired Ublip, a privately-held M2M software and services
company headquartered in Dallas, Texas. With this acquisition, Numerex gained an
infusion of technology and expertise, including middleware designed to simplify
and jumpstart application development and deployment.
During
the past 17 years, we have moved from a product-centric to a solution-centric
business. Due to strong organic growth and strategic
acquisitions that added to our core competencies in the M2M space, we
have
2
assembled
the principal elements of Numerex DNA™ (DNA = Device, Network, and Application)
that address all critical components of the M2M value chain.
NUMEREX’S
CORE BUSINESS
Numerex
has evolved from primarily a proprietary network service into a comprehensive
M2M business using a variety of wireless technologies to serve a wide range of
markets.
Numerex
Production Environment
The four
dimensions of our production environment are: Numerex FAST, Numerex
DNA, the Numerex enabling services, and service quality.
|
Ø
|
Numerex
FAST
|
Through
Numerex FAST (Foundation Application Software Technology), which is an
Open-Platform-as-a-Service (OPaaS) architecture, we simplify the application
development and implementation process. It is delivered as a
web-service and exploits the benefits of cloud computing and large scale,
relational database technology to solve technical and cost barriers to
deployment of advanced device management and smart services.
Openness
is central to Numerex‘s Open Platform as a Service, which rests on the
flexibility, adaptability and interoperability of Service Oriented Architecture
(SOA). Numerex provides scalable Linux-based hosting with the pre-installed
applications, ranging from development to fully-developed production-quality
virtual servers.
We
provide customers with the development tools to write their own device interface
or they can contract with our Professional Services group to develop or modify
their interface. Numerex FAST supports solutions utilizing different networks
and devices. It is the versatile factory that produces Numerex
DNA.
|
Ø
|
Numerex
DNA
|
Numerex DNA offerings include
hardware Devices, Network services and software
Applications that are
the foundational components of Numerex customers’ M2M solutions. The
DNA concept implemented at Numerex is increasingly being used in the industry to
explain the nature of M2M.
|
v
|
Device
|
Our
Numerex FAST platform can communicate and support devices developed by a myriad
of hardware manufacturers in addition to our own devices such as AnyNET and the
SX1.
|
v
|
Network
|
Numerex
has partnerships with US and foreign carriers, including their roaming partners.
Numerex utilizes multiple wireless standards and technologies such as GSM, CDMA
and satellite services.
|
v
|
Application
|
Numerex
provides several options with various degrees of customization; from
(off-the-shelf) pre-packaged web-based applications already deployed in key
vertical markets to fully customized applications. In addition, we
offer application hosting services.
|
Ø
|
Enabling
Services
|
Numerex
offers a variety of value added services to customers, including:
3
v 24x7 Customer
Support: An “around-the-clock” support center, or help desk,
to provide assistance to customers;
v Flexible
billing: Accurate, timely invoices in flexible formats that
detail usage per device, and various billing options. This
flexibility is a key differentiator for customers’ end-user billing
requirements;
v Integration
services: Development support to ensure timely and efficient
production, the glue which brings together Numerex DNA;
v Automated
provisioning: Automated, Web-based online provisioning of
devices for immediate activation and account management;
v Device Management Portal:
Designs and sets up customized portals specifically tailored to its
customers’ needs;
v Network Operations
Center: Customers and industry partners receive 24x7x365
network support from our Network Operations Center in Atlanta,
Georgia;
v Product Certification: We
have put many devices through the PCS Type Certification Review Board (PTCRB)
certification process. Our experience also includes FCC (Federal
Communications Commission), CE (conformity marking for the European Economic
Area) and Industry Canada type certifications. We have efficient
processes to provide accurate documentation to the certification testing labs.
This expertise extends to the carrier’s certification process for devices using
AT&T, Rogers (Canada), Telcel (Mexico), and other carrier
networks. Also, Numerex ‘s Chief Technology Officer is Chairman of
the Telecommunications Industry Association (TIA) TR-50 Smart Devices
Communications (SDC) engineering committee, which is responsible for developing
interface standards for communicating with smart devices used in M2M
applications; and
v Ancillary services provided at the
customer’s discretion: A
host of ancillary services aimed at facilitating and enhancing its customers’
performance such as warehousing, fulfillment, reverse logistics, web-based
provisioning and quality assurance.
|
Ø
|
Service
Quality
|
Numerex’s
overall service quality is built on certain critical elements, such
as:
v Gateway: Our Network
Operation Center (NOC) architecture is built on the latest generation of best of
class processing power, using high-grade servers in a totally redundant and hot
swappable configuration, i.e., where components can be easily removed and
replaced while the system remains in operation. The hardware and software
network topology features high grade, robust platforms for increased
reliability;
v Redundancy and Reliability:
The operations sites are geographically diverse and are interconnected over
Synchronous Optical Network bidirectional, fault-tolerant facilities. We believe
this architecture provides Numerex Networks with service level standards that
meet and exceed requirements for mission-critical applications;
v Secure Network: Numerex is
ISO 27001-certified, ISO’s highest security certification for information
security that helps to ensure data confidentiality, integrity and availability.
Numerex is the first North American M2M service provider to become ISO 27001
certified, and we continue to use advanced security standards throughout our
business;
4
v Network Management: The
system allows for the automation of help desk management—from submission to
monitoring to lifecycle management of customer issues. It also
facilitates the management of tasks and asset inventory records, and indicates
which business services are impacted by a given incident or problem. We believe
that this helps Technical Support Center develop priorities that resolve
customer issues based on business requirements and translates into higher
customer satisfaction and quality of service;
v Network Support Services:
Building on its operating experience and a solid understanding of data networks
and technology, Numerex network support personnel bring a working knowledge of
systems and processes for GSM, CDMA, and Satellite service activation, service
provisioning, inventory planning and management, and supply chain logistical
support; and
v Core Values: Our core values
reflect Numerex‘s dedication to providing the best possible service and
commitment, i.e., Numerex PRIDE© (People, Responsiveness, Integrity, Development
and Excellence).
Target
Markets
|
Ø
|
Sales,
Marketing and Distribution
|
Numerex
primarily employs an indirect sales model through private label/OEM agreements,
channel partners, system integrators, and VARs (collectively referred to in some
cases as “industry partners”). We also indirectly market and sell certain
Numerex branded products and services through distribution and dealer channels,
specifically the Uplink product suite.
Our
network is integrated and bundled with other Numerex products and services to
provide private-labeled solutions for both fixed and portable applications. It
is also sold and marketed to VARs, integrators, and application service
providers who bundle and resell it with their end-to-end
solutions. In addition, the Numerex network is also sold as a
data-only network offering for enterprise customers running M2M
applications.
Our
private-label solutions are designed for and marketed to specific vertical
markets. Typically, these customers are sales and marketing
organizations with vertical market expertise without adequate technical
resources that are seeking rapid entry into a market.
Our three
focus areas are: residential and commercial security; fixed wireless; and
Location-Based services (mobile wireless). In 2009, we have expanded
our international capabilities.
|
Ø
|
Residential
and Commercial Security
|
Despite
the prolonged decline of the U.S. real estate market, Numerex’s residential and
commercial security sales, utilizing a recurring revenue-based
business model, have demonstrated resilient growth. We believe that
product innovation, service quality and customer intimacy are the hallmarks of
our success in the industry.
Our
wireless-based products and services are sold through a wide network of
independent dealers and distributors. Our technology is well positioned in light
of the growing wireless substitution, i.e., the growing replacement of
traditional landline phone by wireless service. Preliminary results
of the January-June 2009 National Health Interview Survey, released in December
2009, indicate that the American homes with only wireless telephones continues
to grow. More than one of every five American homes (22.7%) had only
wireless telephones during the second half of 2009, an increase of 2.5% since
the first half of 2008.
5
|
Ø
|
Fixed
Wireless
|
According
to Berg Insight, most of the machines produced annually are for housing and
industrial purposes. Home appliances, energy meters, HVAC equipment,
health monitoring devices, and POS terminals are examples of machines that can
utilize fixed wireless services.
Numerex
expects the fixed wireless telemetry segment to continue growing, since it
encompasses a broad range of applications and critical government-financed
projects. In addition, we believe that services such as remote
patient monitoring will also benefit from the wireless
substitution.
We were
the first M2M business with a dedicated and integrated solution for
transitioning analog-based applications to new digital network
platforms. We provided an effective migration path to a broad array
of businesses, and as a result, in a challenging environment, we have benefitted
from account retention.
|
Ø
|
Location-Based
Services (LBS)
|
Location-Based
Services (LBS) consist of applications that incorporate value-added features and
functions in addition to the real-time generation and delivery of location
data. LBS lies at the intersection of many technologies such as the
Internet; mobile computing platforms; Geographic Information Systems (GIS); as
well as various geo-positioning and wireless communications technologies and the
market trend requiring greater visibility, intelligent information, security and
worldwide ubiquity for high dollar / critical assets or loads.
The range
of LBS applications is extremely diverse, i.e., from intelligent transport
systems, such as fleet management, to personal location
services.
We
provide complete tracking and back-end services that achieve a cost-effective
solution to deliver on what the market needs for visibility, security and
worldwide coverage that encompasses devices, (satellite and cellular-based)
networks and applications ideally suited to our customers’ needs and
requirements. These services are primarily supplied on the Numerex FAST and
FELIX (Numerex‘s Total Asset Visibility Software) platforms.
Market
segments that we currently serve include federal emergency and military
programs; energy including oil and gas; and transportation
|
Ø
|
International
Markets
|
Numerex
has been strengthening its international capabilities in 2009. We believe
that we are in a solid position to provide secure and efficient M2M services
across the globe, either locally or internationally. Starting with our
strong foothold in North America, we are expanding into various international
markets.
6
NUMEREX
NON-CORE BUSINESS: DIGITAL MULTIMEDIA, NETWORKING AND WIRELINE DATA
COMMUNICATIONS
Numerex’s
primary focus is wireless M2M networks and solutions as described above. We
continue to offer products and services to certain customers in Digital
Multimedia education, networking integration and Derived Channel wireline data
communications. These products and services currently comprise about 6% of our
revenue base and are managed as a single business group.
|
Ø
|
Digital
Multimedia
|
We
design, develop, and market complete video conferencing and digital multimedia
system products and services for high-quality communications networks. We
manufacture both the products upon which the systems are based and incorporate
third-party products where appropriate. The offerings include PowerPlay™, a digital
multimedia solution for high-bandwidth private network applications. PowerPlay
provides capability for interactive videoconferencing and is an integrated
hardware-software system that supports user-friendly control over network
devices. PowerPlay
is supplemented by our desktop videoconferencing software version, IPContact™, which offers
high-quality and high-performance video.
|
Ø
|
Networking
Integration (Digilog)
|
We
provide products under the Digilog brand that assist both wireline and
wireless carriers in the engineering, installation, and servicing of new
telecommunications control networks. These telecommunications network
operational support systems and services can be categorized as: Services,
including system integration (rack and stack) and Installation: Products, Test
Access and Interconnecting Devices.
|
Ø
|
Wireline
Data Communications (Derived
Channel)
|
This
licensed technology creates a “derived channel” on an existing telephone line by
using an inaudible frequency below the voice communications spectrum for data
transmission. This creates a two-way communication system that continuously
monitors the integrity of a user’s telephone line and security
system.
|
Ø
|
Non-Core
Products and Services: Sales and
Marketing
|
Our
digital multimedia products and services are marketed through a combination of
system integrators and VARs. Our networking products are sold
and marketed under the Digilog brand. Distribution is focused on wireless and
wireline telecommunications companies through system integration agreements with
a number of suppliers of telecommunications and monitoring equipment and
services. Our Wireline Data Communications service is marketed under
the DCX brand directly to carriers primarily in the United States and
Australia.
NUMEREX
BUSINESS ENVIRONMENT
|
Ø
|
Key
Customers
|
For the
year ended December 31, 2009, revenue from our largest customer, General
Electric (GE), accounted for an aggregate of approximately 14.7% of our total
revenue. We do not have any other customers that comprise more
than 10% of our total revenue.
|
Ø
|
Suppliers
|
We rely
on third-party contract manufacturers and wireless network operators/ carriers,
both in the United States and overseas, to manufacture most of the equipment
used to provide our wireless M2M solutions, networking equipment and products,
and to provide the underlying network service infrastructure that we use to
support our M2M data network, respectively.
7
|
Ø
|
Competition
|
Several
businesses that share our M2M space can be viewed as competitors, such as
application service providers, Mobile Virtual Network Operators (MVNOs), system
integrators, and wireless operators/ carriers that offer a variety of the
components and services required for the delivery of complete M2M
solutions. However, Numerex believes it has a competitive advantage
and is uniquely positioned as an M2M service provider since it provides all of
the key components of the M2M value chain, including enabling hardware, multiple
wireless technologies and custom applications, and wireless network
services. We market and sell complete network-enabled solutions, or
individual components, based upon the specific needs of the
customer.
We
believe that our current M2M services combined with the continuing development
of our network offerings and technology positions us to compete effectively with
emerging providers of M2M solutions using Global System for Mobile
Communications (GSM), Code Division Multiple Access (CDMA) and satellite
technology. Other potentially competitive offerings may include “wireless
fidelity” (Wi-Fi), World Interoperability for Microwave Access (WiMAX) and other
emerging technologies and networks. We believe that principal
competitive factors when selecting an M2M service or network-only provider are
network reliability, data security, and customer support. We view the
recent increased interest in M2M from wireless carriers, such as, but not
limited to Verizon’s Open Development Initiative, Sprint’s Emerging Solutions,
Vodafone’s Global M2M Services Platform and AT&T’s Control Center, in the
United States and abroad, as a source of competitive threats as well as
opportunities. Those operators have the capability and wherewithal to
provide M2M competitive offerings. However, we offer expertise,
experience and services that complement well the operators’ in the M2M
arena.
We
believe that our M2M service platforms, our network gateways, together with
competitive pricing, end-to-end solution offerings, a ‘single source’ approach
to the M2M market, extensive experience and intellectual property, will allow
Numerex to effectively maintain and increase its current market
share.
Our
Uplink security products and services have three primary competitors in the
existing channels of distribution — Honeywell’s AlarmNet, Telular’s Teleguard
and DSC, the security division of TYCO. The principal competitive
factors when making a product selection in the business and consumer security
industry are hardware price, service price, reliability, industry certification
status and feature requirements for specific security applications, for example
fire, burglary, bank vault, etc. Additional competitors have entered the market
in the last several years with a focus on blending security monitoring and home
automation. These products and services are targeted for the do-it-yourself
market as opposed to traditional security dealers. Several companies,
including GE Security, offer OEM versions or include alarm monitoring technology
and network services provided by Numerex. We believe that the Uplink products
and services are competitively positioned and priced.
Our
Numerex Mobile end-to-end product is offered to a variety of customers,
primarily comprised of resellers and VARs. There are many competitors offering
vehicle location and recovery services, but the principal direct competitor to
our customer base in the new car after-market vehicle location and recovery
business is LoJack Corporation, the industry’s market leader. OnStar Corp., a
subsidiary of General Motors Corp., which offers a full suite of concierge
services, markets and sells their services primarily through automobile
manufacturers. Other manufacturers are also moving to provide factory direct
“networked cars” including Ford and others. There are also numerous
other small companies that currently offer or are developing other wireless
products and services for this market. The principal competitive factors are
channel distribution, hardware price, network service price, features, and the
ability to locate a vehicle at any time on demand.
Our
competitive challenge is the pressure to maintain our hardware margins with an
on-going process of cost reduction associated with the in-vehicle hardware and
the expansion of our distribution network. We believe our mobile
hardware-based solution for this market will continue to undergo pricing
pressure and will require hardware cost reduction in order to remain
competitive.
8
The
market for our technology and platforms has been characterized by rapid
technological change. The principal competitive factors in this market include
product performance, ease of use, reliability, price, breadth of product lines,
sales and distribution capability, technical support and service, customer
relations, and general industry and economic conditions. The ability to provide
wireless network service, wireless radios, device and modem technology, and
end-to-end solutions -- including integration, network and service management --
has set Numerex apart from the competition. We believe that our distribution
agreements with module manufacturers give us a competitive advantage in
combining the sale of their radio modules with the marketing and selling of our
network and technology services.
|
Ø
|
Engineering
and Development
|
Technology
is subject to abrupt change, and the introduction by competitors of new
products, technologies, and applications in our markets could adversely affect
our business. Our success will depend, in part, on our ability to enhance our
existing products and introduce new products and applications on a timely basis.
We plan to continue to devote a portion of our resources to research and
development. Our engineering and development expenses were $2.4
million for the year ended December 31, 2009, as compared to $2.2 million for
the year ended December 31, 2008 and $1.5 million for the year ended December
31, 2007.
We
continue to invest in new services and improvements to our various technologies,
especially networks and digital fixed and mobile solutions. We primarily focus
on the development of M2M services and enabling platforms, enhancement of our
gateway and network services, reductions in the cost of delivery of our network
services and solutions, and enhancements and expansion of our application
capabilities.
We have
concentrated on providing customers with industry-benchmark offerings that go
beyond the network requirement. Prudent integration of new digital and Web
technology into our wireless businesses is an active and ongoing process. We are
committed to taking full advantage of such new technology whenever and wherever
it makes sense to our customers.
|
Ø
|
Product
Warranty and Service
|
Our M2M
wireless communications business typically provides a limited, one-year repair
or replacement warranty on all hardware-based products. Our wireline data
communications (Derived Channel) business provides customers with limited
one-year repair or replacement warranties on scanners and message switch
software, while Subscriber Terminal Units (STUs) are typically sold with a
limited one-year repair or replacement warranty. Our digital multimedia business
typically provides a limited one-year warranty on parts and labor. Our
networking business provides a limited one- or two-year repair or replacement
warranty on all telecommunications networking hardware products. In addition, a
help desk and training support is offered to users of telecommunications
networking products. To date, warranty costs and the cost of maintaining our
warranty programs have not been material to our business.
|
Ø
|
Intellectual
Property
|
We hold
patents either directly (under Numerex Corp.) or through our subsidiaries
covering the technologies we have developed in support of our product and
service offerings in the United States and various other
countries. These patents are by law subject to
expiration. It is our practice to apply for patents as we develop new
technologies, products, or processes suitable for patent
protection. No assurance can be given about the scope of the patent
protection.
We also
hold other intellectual property rights including, without limitation,
copyrights, trademarks, and trade secret protections relating to our technology,
products, and processes. Patents have a limited legal lifespan,
typically 20 years from the filing date for a utility patent filed on or after
June 8, 1995. We believe that rapid technological developments in the
telecommunications and locate-bases services industries may limit the protection
afforded by patents. We believe that our success will also depend on
our manufacturing, engineering, and marketing know-how and the quality and
economic value of our products, services, and solutions.
9
In an
effort to maintain the confidentiality and ownership of our trade secrets and
proprietary information, we require all of our employees and consultants to sign
confidentiality agreements. Employees and consultants involved in technical
endeavors also sign invention assignment agreements. We intend these
confidentiality and assignment agreements to protect our proprietary information
by controlling the disclosure and use of technology to which we have rights.
These agreements also provide that we will own all the proprietary technology
developed at Numerex or developed using our resources.
|
Ø
|
Regulation
|
Federal,
state, and local telecommunications laws and regulations have not posed any
significant impediments to either the delivery of wireless data signals/
messaging using our networks. However, we may be subject to certain
governmentally imposed telecommunications taxes, surcharges, fees, and other
regulatory charges, as well as new laws and regulations governing our business
and markets. As we expand our international sales, we may be
subject to telecommunications regulations in those foreign
jurisdictions.
10
|
Ø
|
Economic
Outlook
|
Our
operations and performance depend on overall domestic and global economic
conditions. Recessionary forces worldwide have contributed to slowdowns in the
technology industry generally, and the specific markets we serve, such as the
residential real estate and home security markets. Declining consumer confidence
driven by fears of a prolonged recession, may impact the demand for our
products, increase price competition in the markets we serve, and increase our
risk of carrying excess inventory. On the other hand, an uncertain economic
environment may contribute to a sentiment of insecurity that may be conducive to
increasing the demand for alarm monitoring services and vehicle tracking
solutions. In addition, as federal, state and local governments are considering
investing billions of dollars to repair the country’s ailing infrastructure, the
demand for “smart” technologies, including the type of products and services
offered by Numerex, could increase significantly.
Employees
As of
March 15, 2010, we had 124 employees in the U.S., consisting of 31 in sales,
marketing and customer service, 59 in engineering and operations and 34 in
management and administration. We have experienced no work stoppages and none of
our employees are represented by collective bargaining
arrangements. We believe our relationship with our employees is
good.
Available
Information
We make
available free of charge through our website at www.numerex.com our annual
reports on Form 10-K, quarterly reports on Form 10-Q and current reports on Form
8-K, and all amendments thereto filed or furnished pursuant to 13(a) or 15(d) of
the Securities and Exchange act of 1934, as soon as reasonably practicable after
such reports are filed with or furnished to the Securities and Exchange
Commission. Our filings are also available through the Securities and
Exchange Commission via their website, http://www.sec.gov. You may also read and
copy any materials we file with the SEC at the SEC's Public Reference Room at
100 F Street, N.E., Washington, D.C. 20549. You may obtain
information on the operation of the Public Reference Room by calling the SEC at
1-800-SEC-0330. The information contained on our website is not incorporated by
reference in this annual report on form 10-K and should not be considered a part
of this report.
Executive
Officers of the Registrant
Our
executive officers, and all persons chosen to become executive officers, and
their ages and positions as of March 31, 2010, are as follows:
|
Name
|
Age
|
Position
|
|
Stratton
J. Nicolaides*
|
56
|
Chairman
of the Board of Directors, Chief Executive Officer
|
|
Michael
A. Marett
|
55
|
Chief
Operating Officer
|
|
Alan
B. Catherall
|
56
|
Chief
Financial Officer
|
|
Louis
Fienberg
|
55
|
Executive
Vice President, Corporate Development
|
|
Michael
Lang
|
44
|
Executive
Vice President, Sales & Marketing
|
|
Jeff
Smith, PhD
|
49
|
Chief
Technology Officer
|
*Member
of the Board of Directors
Mr.
Nicolaides has served as Chief Executive Officer of the Company since April
2000, having served as Chief Operating Officer from April 1999 until March 2000
and as Chairman of the Board since December 1999. From July 1994
until April 1999, Mr. Nicolaides managed a closely held investment
partnership.
11
Mr.
Marett has been an Officer of the Company since February 2001. In February 2005
he was named Chief Operating Officer. From 1999 to 2001, Mr. Marett
was Vice President, Sales and Marketing, of TManage, Inc., which provided
planning, installation, and support services to companies with large remote
workforces. From 1997 to 1999 Mr. Marett was Vice President, Business
Development, of Mitel Business Communications Systems, a division of Mitel
Corporation. Prior to 1997, Mr. Marett held a number of executive
positions at Bell Atlantic.
Mr.
Catherall has been the Chief Financial Officer of the Company since June
2003. From 1998 to 2002, Mr. Catherall served as Chief Financial
Officer of AirGate PCS, a NASDAQ-listed wireless company. From 1996
to 1998, Mr. Catherall was a partner in Tatum CFO LLP, a financial services
consulting company. Prior to 1996, he held a number of executive and
management positions at MCI Communications.
Mr.
Fienberg serves as the Company’s Executive Vice President for Corporate
Development and has been with the Company since July 2004. From
August 2003 to July 2004, Mr. Fienberg served as Managing Director of an
investment banking firm. From 1992 to 2003, Mr. Fienberg was a Senior Vice
President and merger and acquisition specialist with Jefferies and Company,
Inc.
Mr. Lang
has been an Executive Vice President of the Company since January 2008 and
directs the focus and execution of sales and marketing. From January 2006
through December 2007 Mr. Lang served as Senior Vice President of Sales for the
Company and President of Airdesk, LLC. Prior to joining the Company in January
of 2006, Mr. Lang was founder and President of Airdesk, Inc. From 1988 to 1997,
Mr. Lang founded and led a wireless voice and data services company and also
co-founded an internet services company which was sold to Verio in
1997.
Dr. Smith
has served as the Chief Technology Officer since October 9,
2008. From June 2007 to October 2008, he served as the President and
Chief Executive Officer of Ublip, Inc. a provider of M2M and location based
services that Dr. Smith founded. From January 2002 until June 2007,
Dr. Smith served as President and Chief Executive Officer of SensorLogics, Inc.,
an M2M application service provider that he also founded. From June
1996 until January 2000, Dr. Smith served as regional President and director of
NTT/Verio, an internet service provider and web hosting company. From
October 1993 until January 1997, he served as President and Chief Executive
Officer of OnRamp Technologies, an internet service provider that he
co-founded.
Item 1A. Risk Factors
An
investment in our common stock involves a high degree of risk. You should
carefully consider the following information about these risks before buying
shares of our common stock. The following risks and uncertainties are not the
only ones facing us. Additional risks and uncertainties of which we are unaware
or we currently believe are not material could also adversely affect us. In any
case, the value of our common stock could decline, and you could lose all or
part of your investment. You should also refer to the other information
contained in this Form 10-K or incorporated herein by reference, including our
consolidated financial statements and the notes to those statements. See also,
“Special Note Regarding Forward-Looking Statements.”
Risks
Related to Our Business
We
have a history of losses and are uncertain as to our future
profitability.
We have
had mixed success with regard to generating profits. We incurred losses in 2008
and 2009 after being profitable from 2005-2007. Prior to 2005, we had net
operating losses in each year dating back to 1998. In view of our operating
costs, and given all other risk factors discussed herein, we may not be
profitable in the future. Moreover, as a holding company our primary material
assets are our ownership interests in our subsidiaries and in certain
intellectual property rights. Consequently, our earnings derive from our
subsidiaries and we depend on accumulated cash flows, distributions, and other
inter-affiliate transfers from our subsidiaries. In view of all of the risk
factors discussed herein, we cannot assure you that the operating results of our
subsidiaries, accumulated cash flows, or the distributions they make to us at
any given time will be sufficient to sustain our earnings.
12
A
prolonged overall economic downturn, or one or more market-specific downturns,
could have a material adverse effect on our financial condition and operating
results.
Our
operations and performance depend significantly on overall domestic and global
economic conditions. Economic conditions worldwide continue to contribute to
slowdowns in the technology industry generally, as well as to slowdowns within
the specific markets we serve, such as transportation and commercial and
residential security. The current, highly uncertain macroeconomic climate
including, but not limited to, limited availability of credit, eroding home
values and a slowdown in new housing starts, and declining consumer confidence
driven by fears of a prolonged recession, threatens to reduce demand for our
products, increase price competition in the markets we serve, and increase our
risk of carrying excess inventory. In particular, we anticipate that a continued
slowdown in the number of new housing starts will result in a slowdown in the
sales of our residential alarm monitoring products. If overall conditions worsen
significantly, commercial and residential consumers may also decide to cancel
wireless monitoring services in an effort to eliminate expenses they may view as
“discretionary” or “non-critical”. Similarly, declining vehicle sales associated
with an overall economic downturn negatively impacts sales of our vehicle
tracking solutions. All of these and other macroeconomic factors could have a
material adverse effect on demand for our products and services and on our
financial condition and operating results.
The
markets in which we operate are highly competitive, and we may not be able to
compete effectively.
We face
competition from many companies with significantly greater financial resources,
well-established brand names, and larger customer bases. Numerous companies also
may try to enter our market and expose us to greater price competition. We
expect such competition to intensify in the future. If our competitors
successfully focus on the markets we serve, our business could be adversely
affected.
Our
future operating performance depends on the performance of resellers, value
added resellers, and other distributors.
We
distribute our products through wholesalers, resellers, value-added resellers,
and other distributors, many of whom distribute products from competing
manufacturers. Many resellers operate on narrow margins and have been adversely
affected by current overall economic conditions. Our financial condition and
operating results could be materially adversely affected if the financial
condition of these resellers weakens, if resellers stop distributing our
products, or if uncertainty regarding demand for our products causes resellers
to reduce their orders for, and curtail the marketing of, our products. We have
invested and will continue to invest in programs to enhance reseller sales.
These programs could require a substantial investment while providing no
assurance of return or incremental revenue.
We
operate in new and rapidly evolving markets where rapid technological change can
quickly make products, including those that we offer, obsolete.
The
markets we operate in are subject to rapid advances in technology, continuously
evolving industry standards and regulatory requirements, and ever-shifting
customer requirements. The M2M wireless data communications field, in
particular, is currently undergoing profound and rapid technological change. For
example, cellular carriers that we rely upon in delivering our network services
began dismantling their analog networks in 2008 and by the end of 2009 were only
supporting digital connections. While we were largely successful in managing
that risk and transitioning our existing customer base to the digital standard,
the introduction of unanticipated new technologies by carriers, or the
development of unanticipated new end use applications by our customers, could
render our current solutions obsolete. In that regard, we must discern current
trends and anticipate an uncertain future. We must engage in product development
efforts in advance of events that we cannot be sure will happen and time our
production cycles and marketing activities accordingly. If our projections are
incorrect, or if our product development efforts are not properly directed and
timed, or if the demands of the marketplace shift in directions that we failed
to anticipate, we may lose market share and revenues as a result. To remain
competitive, we continue to support engineering and development efforts intended
to bring new products to the markets that we serve. However, those efforts are
capital intensive. If we are unable to adequately fund our engineering and
development efforts, we may not be successful in keeping our product line
current with advances in technology and evolving customer requirements. Even
with adequate funding, our development efforts may not yield any appreciable
short-term results and may never result in products that produce revenues over
and above our cumulative development costs or that gain traction in the
marketplace, causing us to either lose market share or fail to increase and
forego increased sales and revenues as a result.
13
Failure
of our new products and services to gain market acceptance would adversely
affect our financial condition.
Over the
past several years, among many initiatives, we have introduced a system enabling
alarm signals to be transmitted digitally over the cellular network to central
monitoring stations; a cellular and GPS-based vehicle tracking solution;
satellite-based asset monitoring and tracking solutions; a multimedia
videoconferencing solution, enhanced “back end” services; and, most recently,
with our acquisition of uBlip, Inc., enhanced application development
capabilities. If these products and services, or any of our other existing
products and services, do not perform as expected, or if our sales are less than
expected, our business may be adversely affected.
We
may experience long sales cycles for our products, as a result of a variety of
factors.
Certain
of our product offerings, for example our satellite-based asset tracking
solutions, are subject to long sales cycles in view of the need for testing of
our products in combination with our customers’ applications and third parties’
technologies, the need for regulatory approvals and export clearances, and the
need to resolve other complex operational and technical issues. In the
government contracting arena in particular, longer sales cycles are reflective
of the fact that government contracts can take months or longer to progress from
a “request for proposal” to a finalized contract document pursuant to which we
are able to sell a finished product or service. Terms and conditions of sale
unique to the government sector may also affect when we are able to recognize
revenues. For that reason, quarter-over-quarter comparisons of our financial
results may not always be meaningful.
If
we are unable to provide our suppliers with accurate forecasts of our product
needs, margins could be adversely affected.
We are
contractually obligated to provide our suppliers with forecasts of our demand
for manufactured products. Specific terms and conditions vary by contract,
however, if our forecasts do not result in the production of a quantity of units
sufficient to meet demand we may be subject to contractual penalties under some
of our contracts with our customers. By contrast, overproduction of units based
on forecasts that that overestimate demand could result in an accumulation of
excess inventory that, under some of our contracts with our customers, would
have to be managed at our expense thus adversely impacting our margins. Excess
inventory that becomes obsolete or that we are otherwise unable to sell would
also be subject to write-offs resulting in adverse affects on our
margins.
The
loss of one or just a few of our significant customers could negatively impact
our revenues.
In 2009,
a single customer, General Electric, accounted for approximately 14.7% of our
annual revenues and it is possible that such customer’s purchases in 2010 will
account for 10% or more of our anticipated revenues for 2010. The loss of such a
customer could have a material adverse affect on our revenues, operating income
and net earnings.
We
are dependent on a number of network service providers, manufacturers and
suppliers of our products and product components, the loss of any one of which
could adversely impact our ability to service or supply our
customers.
The loss
or disruption of key telecommunications infrastructure services and key wireless
network services supplied to the Company would unfavorably impact our ability to
adequately service our customers. Our long-term success depends on our ability
to operate, manage, and maintain a reliable and cost effective network, as well
as our ability to keep pace with changes in technology. Furthermore, our network
operations are dependent on third parties. If we experience technical or
logistical impediments to our ability to transfer traffic onto our network, fail
to generate additional traffic on our network, or if we experience difficulties
with our third party providers, we may not achieve our revenue goals or
otherwise be successful in growing our business.
14
We
outsource the manufacturing of our products to independent companies located in
the United States and overseas and do not have internal manufacturing
capabilities to meet the demands of our customers. Any delay, interruption, or
termination of the manufacture of our products could harm our ability to provide
our products to our customers and, consequently, could have a material adverse
effect on our business and operations. The manufacture of our products requires
specialized know-how and capabilities possessed by a limited number of
enterprises. Consequently, we are reliant on just a few suppliers for the
manufacture of key products and product components. If a key supplier
experiences production problems or financial difficulties, we may not be able to
obtain enough units to meet demand, which could result in failure to meet our
contractual commitments to our customers, further causing us to lose sales and
generate less revenue. If any of our products or product components contain
significant manufacturing defects that the existing manufacturer or supplier is
unable to resolve, we could also have difficulty locating a suitable alternative
manufacturer or supplier. Related efforts to design replacement products or
product components could also take longer and prove costlier than planned,
resulting in a material adverse impact on our financial condition and operating
results.
The
loss of a few key technical personnel could have an adverse affect on us in the
short-term.
We rely
on a relatively small number of technical personnel who play key roles in
maintaining the back-end technology and systems that enable us to provide
network services to our customers and that is also central to our product
development efforts. Other personnel have crucial expertise in
application development. The loss of some of those personnel could result,
temporarily, in shortfalls in the knowledge base of our remaining technical
staff concerning existing products and services as well as products and services
that are under development.
Our
products and services experience quality problems from time to time that can
result in decreased sales and operating margin.
Our
products and services, and the applications they support, are complex. While we
test our products, they may still have errors, defects, or bugs that we find
only after commercial production has begun. In the past, we have experienced
errors, defects, and bugs in connection with new products. Our customers may not
purchase our products if the products have reliability, quality, or
compatibility problems. Furthermore, product errors, defects, or bugs could
result in additional development costs, diversion of resources from our other
development efforts, claims by our customers or others against us, or the loss
of credibility with our current and prospective customers. Historically, the
time required for us to correct defects has caused delays in product shipments
and resulted in lower than expected revenues. Significant capital and resources
may be required to address and fix problems in new products. Failure to do so
could result in lost revenue, harm to reputation, and significant warranty and
other expenses, and could have a material adverse impact on our financial
condition and operating results.
We
may lose customers if we experience system failures that significantly disrupt
the availability and quality of the service our network provides.
The
operation of our network depends on our ability to avoid or limit any
interruptions in service to our customers. Interruptions in service or
performance problems, for whatever reason, could undermine confidence in our
services and cause us to lose customers or make it more difficult to attract new
customers. In addition, because most of our customers are businesses, any
significant interruption in service could result in lost profits or other losses
to our customers. Although we attempt to disclaim or limit liability in our
agreements with these customers, a court may not enforce a limitation on
liability, which could expose us to losses. The failure of any equipment on our
network, or that of a customer’s or end user’s equipment, could result in the
interruption of service until necessary repairs are made or replacement
equipment is installed. Network failures, delays, and errors may result from
natural disasters, power losses, security breaches, viruses or terrorist acts.
These failures or faults cause delays, service interruptions, expose us to
customer liability, or require expensive modifications that could have a
material adverse effect on our business and operating results.
15
We
may have difficulty identifying the source of a problem in our
network.
If a
problem occurs on our network, it may be difficult to identify the source of the
problem due to the overlay of our network with cellular, and/or satellite
networks and our network’s reliance on those other networks. The occurrence of
hardware or software errors, regardless of whether such errors are caused by our
products or our network, may result in the delay or loss of market acceptance of
our products and services, and any necessary revisions may result in significant
and additional expenses. The occurrence of some of these types of problems may
seriously harm our business, financial condition, or operations. Given our
dependence on cellular, and satellite telecommunications service providers,
risks specific or unique to their technologies, i.e., the loss or malfunction of
a satellite or satellite ground station, should also be viewed as having the
potential to impair our ability to provide services.
A
natural disaster or other weather events could diminish our ability to provide
service; our revenues may be impacted by weather patterns.
Although
our internal platform is very robust and supported by redundant systems
including, for example, a leased facility that is physically remote from our
primary network operations center and would enable us to maintain continuity
of network operations were our primary site to cease operating, there
is the possibility that natural or other disasters including, without
limitation, hurricanes, tornadoes, earthquakes, or solar flares could damage or
destroy our facilities resulting in a disruption of service to our customers. If
a future natural or other disaster impairs or destroys any of our facilities, we
may be unable to provide service to our customers in the affected area for a
period of time. In addition, even if our facilities are not affected by natural
disasters, our service could be disrupted if a natural disaster damages the
third party cellular or satellite networks we are interconnected with. Further,
in the event of an emergency, the telecommunications networks that we rely upon
may become capacity constrained or preempted by governmental
authorities.
With
respect to our satellite-based asset tracking unit in particular, sales may be
influenced by weather patterns. For example, if government agencies and
emergency responders anticipate a relatively “mild” storm season, they buy fewer
of our units for deployment in support of disaster response
operations.
We
may require additional capital to fund further development, and our competitive
position could decline if we are unable to obtain additional capital, or access
the credit markets.
To
address our long-term capital needs, we intend to continue to pursue strategic
relationships that would provide resources for the further development of our
product candidates. There can be no assurance, however, that these discussions
will result in relationships or additional funding. In addition, we may continue
to seek capital through the public or private sale of securities, if market
conditions are favorable for doing so. If we are successful in raising
additional funds through the issuance of equity securities, stockholders will
likely experience dilution, or the equity securities may have rights,
preferences, or privileges senior to those of the holders of our common stock.
If we raise funds through the issuance of debt securities, those securities
would have rights, preferences, and privileges senior to those of our common
stock.
The
current credit environment has negatively affected credit market liquidity,
which could increase borrowing costs or limit availability of
funds. If we are not successful in obtaining sufficient capital
because we are unable to access the capital markets at financially economical
interest rates, it could reduce our product development efforts and may
materially adversely affect our future growth, results of operations and
financial results, and we may be required to curtail significantly, or eliminate
at least temporarily, one or more of our engineering and development programs
involving new products and technologies.
16
If
we achieve our growth goals, we may be unable to manage our resulting
expansion.
To the
extent that we are successful in implementing our business strategy, we may
experience periods of rapid expansion. In order to effectively manage growth,
whether organic or through acquisitions, we will need to maintain and improve
our operations and effectively train and manage our employees. Our expansion
through acquisitions is contingent on successful management of those
acquisitions, which will require proper integration of new employees, processes
and procedures, and information systems, which can be both difficult and
demanding from an operational, managerial, cultural, and human resources
perspective. We must also expand the capacity of our sales and distribution
networks in order to achieve continued growth in our existing and future
markets. The failure to manage growth effectively in any of these areas could
have a material adverse effect on our financial condition and operating
results.
We
are subject to risks associated with laws, regulations and industry-imposed
standards related to mobile communications devices.
Laws and
regulations related to mobile communications devices in the many jurisdictions
in which the Company operates are extensive and subject to change. Such changes,
which could include but are not limited to restrictions on production,
manufacture, distribution, and use of mobile devices, locking the devices to a
carrier’s network, or mandating the use of the device on more than one carrier’s
network, could have a material adverse effect on our financial condition and
operating results. Mobile communication devices we sell are subject
to certification and regulation by governmental and standardization bodies, as
well as by cellular network carriers for use on their networks. These
certification processes are extensive and time consuming, and could result in
additional testing requirements, product modifications or delays in product
shipment dates, which could have a material adverse effect on our financial
condition and operating results.
Our
expansion into government markets subjects us to increased regulation. We must
comply with a complex set of rules and regulations applicable to government
contractors. Failure to comply with an applicable rule or regulation could
result in our suspension of doing business with the government or cause us to
incur substantial penalties.
Many of
the ultimate consumers of our PowerPlay™ hardware and services are elementary
and secondary schools that pay for their purchases with funding that they
receive through the Schools and Libraries Program (commonly known as the “E-Rate
Program”) of the Universal Service Fund, which is administered by the
Universal Service Administrative Company (USAC) under the direction of the FCC.
Demand for products and services under the E-Rate Program is very difficult to
predict and changes in the program itself could also affect demand.
We may be
subject to telecommunications taxes, surcharges, and fees, and changes in these
could affect our results of operations. And, as we expand beyond the
“business-to-business” market and begin providing some services directly to end
user consumers, some of our sales could become subject to federal and state
level consumer protection laws and other regulations that could prompt adverse
legal action in the event of an alleged violation of those laws.
If
our goodwill or amortizable intangible assets become impaired we may be required
to record a significant charge to earnings.
Under
generally accepted accounting principles, we review our amortizable intangible
assets for impairment when events or changes in circumstances indicate the
carrying value may not be recoverable. Goodwill is tested for impairment at
least annually. Factors that may be considered a change in circumstances,
indicating that the carrying value of our goodwill or amortizable intangible
assets may not be recoverable, include a decline in stock price and market
capitalization, reduced future cash flow estimates, and slower growth rates in
our industry. We may be required to record a significant charge in our financial
statements during the period in which any impairment of our goodwill or
amortizable intangible assets is determined, negatively impacting our results of
operations.
17
An
increasing portion of our future revenue will be derived from contracts with the
U.S. government, government agencies, or other U.S. government
contractors. These agreements are subject to uncertain future funding
and possible termination.
Historically,
a significant portion of our revenues from the sale of satellite-based tracking
solutions through our location-based services division has been derived from
sales made by us indirectly as a subcontractor to a prime government contractor
that has the direct relationship with the U.S. government. If the
prime contractor loses business with respect to which we serve as a
subcontractor, our government business would be hurt. We also maintain a
Federal Supply Schedule with the General Services Administration and anticipate
doing an increasing amount of business directly with the U.S. government and
government agencies. If we, as the prime contractor, were to lose some or all of
such business, our revenues derived from the sale of satellite-based tracking
solutions would suffer as a result. The funding of U.S. government programs is
uncertain and dependent on continued congressional appropriations and
administrative allotment of funds based on an annual budgeting
process. We cannot assure you that current levels of congressional
funding for our location-based services division’s offerings will
continue. Furthermore, all of our contracts with the U.S. government
are terminable by the U.S. government (or, in certain circumstances, by us)
at will. A significant decline in government expenditures generally,
or with respect to programs for which we provide products, could adversely
affect our business and prospects. Our operating results may
also be negatively affected by other developments that affect these government
programs generally, including the following:
|
·
|
changes
in government programs that are related to our products and
services;
|
|
·
|
adoption
of new laws or regulations relating to government contracting or changes
to existing laws or regulations;
|
|
·
|
changes
in political or public support for
programs;
|
|
·
|
delays
or changes in the government appropriations process;
and
|
|
·
|
delays
in the payment of invoices by government payment offices and the prime
contractors.
|
These
developments and other factors could cause governmental agencies to reduce their
purchases under existing contracts, to exercise their rights to terminate
contracts at-will or to abstain from renewing contracts, any of which would
cause our revenue to decline and could otherwise harm our business, financial
condition and results of operations.
Agreements
with government agencies may lead to claims against us under the Federal False
Claims Act or other federal statutes. These claims could result in substantial
fines and other penalties.
Our
agreements with the U.S. government are subject to substantial financial
penalties under the Civil Monetary Penalties Act and the False Claims Act and,
in particular, actions under the False Claims Act’s “whistleblower”
provisions. Private enforcement of fraud claims against businesses on
behalf of the U.S. government has increased due in large part to amendments to
the False Claims Act that encourage private individuals to sue on behalf of the
government. These whistleblower suits by private individuals, known
as qui tam actions, may be filed by almost anyone, including present and former
employees. The False Claims Act statute provides for treble damages and up to
$11,000 per claim on the basis of the alleged claims. Prosecutions,
investigations or qui tam actions could have a material adverse effect on our
liquidity, financial condition and results of operations. Finally, various state
false claim and anti-kickback laws also may apply to us. Violation of any of the
foregoing statutes can result in criminal and/or civil penalties that could have
a material adverse effect our business.
18
U.S.
government contracts contain provisions that are unfavorable to us.
U.S.
government contracts contain provisions, and are subject to laws and
regulations, that give the government rights and remedies not typically found in
commercial contracts. These provisions may allow the government to
|
·
|
Terminate
existing contracts for convenience, as well as for
default,
|
|
·
|
Reduce
or modify contracts or
subcontracts,
|
|
·
|
Cancel
multi-year contracts and related orders if funds for contract performance
for any subsequent year become
unavailable,
|
|
·
|
Decline
to exercise an option to renew a multi-year
contract,
|
|
·
|
Claim
rights in products and systems produced by
us,
|
|
·
|
Suspend
or debar us from doing business with the federal government or with a
governmental agency, and
|
|
·
|
Control
or prohibit the export of our
products.
|
If the
government terminates a contract for convenience, we may recover only our
incurred or committed costs, settlement expenses and profit on work completed
prior to the termination. If the government terminates a contract for default,
we may not recover even those amounts, and instead may be liable for excess
costs incurred by the government in procuring undelivered items and services
from another source. We may experience performance issues on some of our
contracts. We may receive show cause or cure notices under contracts that, if
not addressed to the government’s satisfaction, could give the government the
right to terminate those contracts for default or to cease procuring our
services under those contracts in the future.
Unfavorable
results of legal proceedings could materially adversely affect us.
We are
subject to various legal proceedings and claims that have arisen out of the
ordinary conduct of our business and are not yet resolved and additional claims
may arise in the future. Results of legal proceedings cannot be predicted with
certainty. Regardless of its merit, litigation may be both time-consuming and
disruptive to our operations and cause significant expense and diversion of
management attention. In recognition of these considerations, we may enter into
material settlements. Should we fail to prevail in certain matters, or should
several of these matters be resolved against us in the same reporting period, we
may be faced with significant monetary damages or injunctive relief against us
that would materially adversely affect a portion of our business and might
materially affect our financial condition and operating results.
We
operate internationally, which subjects us to international regulation and
business uncertainties that create additional risk for us.
We have
been doing business directly, or via our distributors, in Australia, Canada,
Mexico, and Pakistan, and are expanding, directly or via our distributors, into
additional countries in Latin America, Europe, the Middle East, and Asia.
Accordingly, we or our distributors are subject to additional risks, such
as:
|
·
|
a
continued international economic
downturn,
|
|
·
|
export
control requirements, including restrictions on the export of critical
technology,
|
|
·
|
restrictions
imposed by local laws and
regulations,
|
|
·
|
restrictions
imposed by local product certification
requirements;
|
|
·
|
currency
exchange rate fluctuations,
|
|
·
|
generally
longer receivable collection periods and difficulty in collecting
accounts receivable,
|
|
·
|
trade
restrictions and changes in
tariffs,
|
|
·
|
difficulties
in repatriating earnings,
|
|
·
|
difficulties
in staffing and managing international operations,
and
|
|
·
|
potential
insolvency of channel partners.
|
19
We have
only limited experience in marketing and operating our services in certain
international markets. Moreover, we have in some cases experienced and expect to
continue to experience in some cases higher costs as a percentage of revenues in
connection with establishing and providing services in international markets
versus the U.S. In addition, certain international markets may be slower than
the U.S. in adopting the outsourced communications solutions and so our
operations in international markets may not develop at a rate that supports our
level of investments.
If
we become subject to unanticipated foreign tax liabilities, it could materially
increase our costs.
We are
doing business in, and are expanding into, foreign tax jurisdictions. We believe
that we have complied in all material respects with our obligations to pay taxes
in these jurisdictions. If the applicable taxing authorities were to challenge
successfully our current tax positions, or if there were changes in the manner
in which we conduct our activities, we could become subject to material
unanticipated tax liabilities. We may also become subject, prospectively or
retrospectively, to additional tax liabilities following changes in tax
laws. The application of existing, new or future laws could
have adverse effects on our business, prospects and operating results. There
have been, and will continue to be, substantial ongoing costs associated with
complying with the various indirect tax requirements in the numerous markets in
which we conduct or will conduct business.
We may not be aware of certain
foreign government regulations.
Because
regulatory schemes vary by country, we may be subject to regulations in foreign
countries of which we are not presently aware. If that were to be the
case, we could be subject to sanctions by a foreign government that could
materially and adversely affect our ability to operate in that country. We
cannot assure you that any current regulatory approvals held by us are, or will
remain, sufficient in the view of foreign regulatory authorities, or that any
additional necessary approvals will be granted on a timely basis or at all, in
all jurisdictions in which we wish to operate, or that applicable restrictions
in those jurisdictions will not be unduly burdensome. The failure to obtain the
authorizations necessary to operate satellites internationally could have a
material adverse effect on our ability to generate revenue and our overall
competitive position. We, our customers and companies with whom we do
business may be required to have authority from each country in which we or they
provide services or provide our customers use of our products and services.
Because regulations in each country are different, we may not be aware if some
of our customers and/or companies with which we do business do not hold the
requisite licenses and approvals.
Risks
Related to Our Intellectual Property
The
loss of intellectual property protection both U.S. and international, could have
a material adverse effect on our operations.
Our
future success and competitive position depend upon our ability to obtain and
maintain intellectual property protection, especially with regard to our core
business. We cannot be sure that steps taken by us to protect our technology
will prevent misappropriation of the technology. Our services are highly
dependent upon our technology and the scope and limitations of our proprietary
rights therein. If our assertion of proprietary rights is held to be invalid, or
if another party’s use of our technology were to occur to any substantial
degree, our business, financial condition and results of operations could be
materially adversely affected. In order to protect our technology, we rely on a
combination of patents, copyrights, and trade secret laws, as well as certain
customer licensing agreements, employee and customer confidentiality and
non-disclosure agreements, and other similar arrangements. Loss of such
protection could compromise any advantage obtained and, therefore, impact our
sales, market share, and results. To the extent that our licensees develop
inventions or processes independently that may be applicable to our products,
disputes may arise as to the ownership of the proprietary rights to this
information. These inventions or processes will not necessarily become our
property, but may remain the property of these persons or their full-time
employers. We could be required to make payments to the owners of these
inventions or processes, in the form of either cash or equity, or a combination
of both.
20
Furthermore,
our future or pending patent applications may not be issued with the scope of
the claims sought by us, if at all. In addition, others may develop technologies
that are similar or superior to our technology, duplicate our technology or
design around the patents owned or licensed by us. Effective patent, trademark,
copyright, and trade secret protection may be unavailable or limited in foreign
countries where we may need protection.
We
rely on access to third-party patents and intellectual property, and our future
results could be materially adversely affected if we are unable to secure such
access in the future.
Many of
our products are designed to include third-party intellectual property, and in
the future we may need to seek or renew licenses relating to various aspects of
its products and business methods. Although we believe that, based on past
experience and industry practice, such licenses generally could be obtained on
reasonable terms, there is no assurance that the necessary licenses would be
available on acceptable terms or at all. Some licenses we obtain may be
nonexclusive and, therefore, our competitors may have access to the same
technology licensed to us. If we fail to obtain a required license or are unable
to design around a patent, we may be unable to sell some of our products, and
there can be no assurance that we would be able to design and incorporate
alternative technologies, without a material adverse effect on our business,
financial condition, and results of operations.
Our
competitors may obtain patents that could restrict our ability to offer our
products and services, or subject us to additional costs, which could impede our
ability to offer our products and services and otherwise adversely affect us. We
may, from time to time, also be subject to litigation over intellectual property
rights or other commercial issues.
Several
of our competitors have obtained and can be expected to obtain patents that
cover products or services directly or indirectly related to those offered by
us. There can be no assurance that we are aware of all patents containing claims
that may pose a risk of infringement by its products or services. In addition,
patent applications in the United States are confidential until a patent is
issued and, accordingly, we cannot evaluate the extent to which our products or
services may infringe on future patent rights held by others.
Even with
technology that we develop independently, a third party may claim that we are
using inventions claimed by their patents and may go to court to stop us from
engaging in our normal operations and activities, such as engineering and
development and the sale of any of our products or services. Furthermore,
because of technological changes in the M2M industry, current extensive patent
coverage, and the rapid issuance of new patents, it is possible that certain
components of our products and business methods may unknowingly infringe the
patents or other intellectual property rights of third parties. From time to
time, we have been notified that we may be infringing such rights.
In the
highly competitive and technology-dependent telecommunications field in
particular, litigation over intellectual property rights is significant business
risk, and some entities are pursuing a litigation strategy the goal of which is
to monetize otherwise unutilized intellectual property portfolios via licensing
arrangements entered into under threat of continued litigation. Regardless of
merit, responding to such litigation can consume significant time and expense.
In certain cases, we may consider the desirability of entering into licensing
agreements, although no assurance can be given that such licenses can be
obtained on acceptable terms or that litigation will not occur. If we are found
to be infringing such rights, we may be required to pay substantial damages. If
there is a temporary or permanent injunction prohibiting us from marketing or
selling certain products or a successful claim of infringement against us
requires us to pay royalties to a third party, our financial condition and
operating results could be materially adversely affected, regardless of whether
we can develop non-infringing technology. While in management’s opinion we do
not have a potential liability for damages or royalties from any known current
legal proceedings or claims related to the infringement of patent or other
intellectual property rights that would individually or in the aggregate have a
material adverse effect on its financial condition and operating results, the
results of such legal proceedings cannot be predicted with certainty. Should we
fail to prevail in any of the matters related to infringement of patent or other
intellectual property rights of others or should several of these matters be
resolved against us in the same reporting period, our financial condition and
operating results could be materially adversely affected.
21
Risks
Related to Our Common Stock and Ownership Structure
Because
our stock is held by a relatively small number of investors and is thinly
traded, it may be more difficult for you to sell your shares or buy additional
shares when you desire to do so and the price may be volatile.
Our
common stock is currently listed on the NASDAQ. Our stock is thinly traded
and we cannot guarantee that an active trading market will develop, or that it
will maintain its current market price. A large number of shares of our common
stock are held by a small number of investors. An attempt to sell a large number
of shares by a large holder could adversely affect the price of our stock. In
addition, it may be difficult for a purchaser of our shares of our common stock
to sell such shares without experiencing significant price
volatility.
The
structure of our company limits the voting power of our stockholders and certain
factors may inhibit changes in control of our company.
The
concentration of ownership of our common stock may have the effect of delaying,
deferring, or preventing a change in control, merger, consolidation, or tender
offer that could involve a premium over the price of our common stock.
Currently, our executive officers, directors and greater-than-five percent
stockholders and their affiliates, in the aggregate, beneficially own
approximately 39% of our outstanding common stock. These
stockholders, if they vote together, are able to exercise significant influence
over all matters requiring stockholder approval, including the election of
directors and approval of significant corporate transactions and matters. The
interests of these stockholders may be different than those of our unaffiliated
stockholders and our unaffiliated stockholders may be dissatisfied with the
outcome of votes that may be controlled by our affiliated
stockholders.
Our
articles of incorporation generally limit holdings by persons of our common
stock to no more than 10% without prior approval by our Board. Except as
otherwise permitted by the Board, no stockholder has the right to cast more than
10% of the total votes regardless of the number of shares of common stock owned.
In addition, if a person acquires holdings in excess of this ownership limit,
our Board may terminate all voting rights of the person during the time that the
ownership limit is violated, bring a lawsuit against the person seeking
divestiture of amounts in excess of the limit, or take other actions as the
Board deems appropriate. Our articles of incorporation also have a procedure
that gives us the right to purchase shares of common stock held in excess of the
ownership limit. In addition, our articles of incorporation permit
our Board to authorize the issuance of preferred stock without stockholder
approval. Any future series of preferred stock may have voting provisions that
could delay or prevent a change in control or other transaction that might
involve a premium price or otherwise be in the best interests of our common
stockholders.
Item 1B. Unresolved Staff Comments.
None.
22
Item 2. Properties.
All of
our facilities are leased. Set forth below is certain information
with respect to our leased facilities:
|
Principal Business
|
Square Footage
|
Lease Term
|
|
|
Atlanta,
Georgia
|
M2M
Services and Principal Executive Office
|
31,526
|
2012
|
|
Warminster,
Pennsylvania
|
M2M
Services and Wireline Services
|
18,000
|
2011
|
|
Bozeman,
Montana
|
M2M
Services
|
5,060
|
2012
|
|
State
College, Pennsylvania
|
Wireline
Services
|
10,788
|
Month
to Month
|
|
Addison,
Texas
|
M2M
Services
|
7,731
|
2010
|
We
conduct engineering, sales and marketing, and administrative activities at many
of these locations. We believe that our
existing facilities are adequate for our current needs. As we grow and expand
into new markets and develop additional hardware, we may require additional
space, which we believe will be available at reasonable rates.
We engage
in limited manufacturing, equipment and hardware assembly and testing for
certain hardware. We also use contract manufacturers for production,
sub-assembly and final assembly of certain hardware. We believe there
are other manufacturers that could perform this work on comparable
terms.
Item 3. Legal Proceedings.
As
previously reported, Orbit One Communications, Inc. (“Orbit One”) and
David Ronsen (“Ronsen”) filed an action against Numerex alleging, inter alia, breach of
contract in frustrating Orbit One’s ability to achieve earn out targets in the
acquisition and employment agreements. Numerex has filed counterclaims
against the plaintiffs for fraud, theft of trade secrets and confidential
information and breach of the Asset Purchase Agreement; and against Messrs.
Ronsen, Naden and Rosenzweig for breach of their fiduciary duties and duty of
loyalty to Numerex, as well as breach of their respective Severance
Agreements. The action is pending before the United States District Court,
Southern District of New York. On April 17, 2009, the parties filed
cross-motions for summary judgment. On March 12, 2010, the
court entered a decision on the cross-motions for summary judgment. The
court held that Mr. Ronsen’s claim that he had “good reason” to resign presented
material issues of fact requiring a trial. Similarly, the Court held that
Numerex’s claims against Orbit One and its principals for breach of contract,
fraudulent inducement, breach of fiduciary duty, and other related claims
presented material issues of fact requiring a trial. No trial date has
been set.
Numerex
believes that the plaintiffs' claims in each of the related actions are without
merit and intends to defend against the allegations and to vigorously
pursue its counterclaims.
Item
4. Reserved.
23
PART II
Item 5. Market for the Registrant's Common Stock and
Related Shareholder Matters and Issuer Purchases of Equity
Securities.
The
Company’s Common Stock trades publicly on the NASDAQ Global Market System under
the symbol NMRX.
The
following table sets forth, for the fiscal quarters indicated, the high and low
sales prices per share for the Common Stock on the NASDAQ Global Market for the
applicable periods.
|
Fiscal 2009
|
High
|
Low
|
||||||
|
First
Quarter (January 1, 2009 to March 31, 2009)
|
$ | 4.00 | $ | 1.71 | ||||
|
Second
Quarter (April 1, 2009 to June 30, 2009)
|
5.60 | 2.91 | ||||||
|
Third
Quarter (July 1, 2009 to September 30, 2009)
|
5.75 | 4.48 | ||||||
|
Fourth
Quarter (October 1, 2009 to December 31, 2009)
|
5.10 | 3.95 | ||||||
|
Fiscal 2008
|
High
|
Low
|
||||||
|
First
Quarter (January 1, 2008 to March 31, 2008)
|
$ | 8.75 | $ | 6.01 | ||||
|
Second
Quarter (April 1, 2008 to June 30, 2008)
|
8.45 | 6.51 | ||||||
|
Third
Quarter (July 1, 2008 to September 30, 2008)
|
7.15 | 2.80 | ||||||
|
Fourth
Quarter (October 1, 2008 to December 31, 2008)
|
5.10 | 2.29 | ||||||
On March
26, 2010, the last reported sale price of our Class A common stock on The NASDAQ
Global Market was $4.29 per share.
As of
March 26, 2010, there were 60 holders of record of our Common Stock,
approximately one beneficial shareholder and 15,070,501 shares of Common
Stock outstanding. Because many of the shares of our common stock are
held by brokers and other institutions on behalf of stockholders, we are unable
to estimate the total number of stockholders represented by these record
holders.
Dividend
Policy
We
currently do not pay any cash dividends. In deciding whether or not
to declare or pay dividends in the future, the Board of Directors will consider
all relevant factors, including our earnings, financial condition and working
capital, capital expenditure requirements, any restrictions contained in loan
agreements and market factors and conditions. We have no plans now or
in the foreseeable future to declare or pay cash dividends on our common
stock.
24
Performance
Graph
The
information included under the heading "Performance Graph" in this Item 5 of
this Annual Report on Form 10-K is "furnished" and not "filed" and shall not be
deemed to be "soliciting material" or subject to Regulation 14A or 14C, nor
shall it be deemed "filed" for purposes of Section 18 of the Securities Exchange
Act of 1934, as amended (the "Exchange Act"), or otherwise subject to the
liabilities of that section, nor shall it be deemed incorporated by reference in
any filing under the Securities Act of 1933, as amended, or the Exchange Act,
except to the extent that we specifically incorporate it by reference into any
such filing.
The
following graph shows a comparison of the cumulative total return for Common
Stock, the NASDAQ Composite Index and the NASDAQ Telecomm Index, assuming
(i) an investment of $100 in each, on December 31, 2004, the last
trading day before the beginning of the Company’s five preceding years, and,
(ii) in the case of the Indices, the reinvestment of all
dividends.
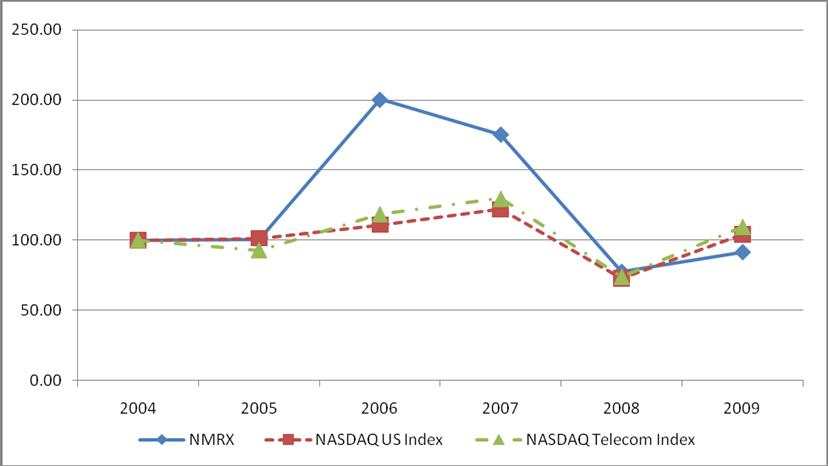
|
SHAREHOLDER
VALUE AT YEAR END
|
||||||||||||||||||||||||
|
2004
|
2005
|
2006
|
2007
|
2008
|
2009
|
|||||||||||||||||||
|
NMRX
|
100.00 | 100.64 | 200.43 | 175.53 | 77.45 | 91.49 | ||||||||||||||||||
|
NASDAQ
US Index
|
100.00 | 101.38 | 111.03 | 121.93 | 72.51 | 104.32 | ||||||||||||||||||
|
NASDAQ
Telecom Index
|
100.00 | 92.90 | 118.69 | 129.80 | 73.74 | 109.60 | ||||||||||||||||||
25
Item 6. Selected Consolidated Financial
Data.
The
following selected financial data should be read in conjunction with the
consolidated financial statements and the notes contained in “Item
8. Financial Statements and Supplementary Data” and the information
contained in “Item 7. Management’s Discussion and Analysis of Financial
Condition and Results of Operations.” Historical results are not
necessarily indicative of future results.
The
following financial information was derived using the consolidated financial
statements of Numerex Corp. The table lists historical financial data
of the Company for the fiscal years ended December 31, 2009, 2008, 2007,
2006 and 2005.
|
(in
thousands)
|
December
31, 2009
|
December
31, 2008
|
December
31, 2007
|
December
31, 2006
|
December
31, 2005
|
|||||||||||||||
|
Statement
of Operations Data
|
||||||||||||||||||||
|
Revenues
|
$ | 50,836 | $ | 72,319 | $ | 68,004 | $ | 52,788 | $ | 29,946 | ||||||||||
|
Gross
profit
|
22,348 | 25,420 | 23,407 | 18,922 | 12,717 | |||||||||||||||
|
Goodwill
and long-lived asset impairment
|
- | 5,289 | - | 2,140 | - | |||||||||||||||
|
Operating
income (loss)
|
(1,656 | ) | (6,389 | ) | 2,500 | 1,674 | 961 | |||||||||||||
|
Provision
(benefit) for income taxes
|
285 | 3,047 | 728 | (2,950 | ) | 52 | ||||||||||||||
|
Net
income (loss)
|
(5,829 | ) | (10,975 | ) | 440 | 4,103 | 593 | |||||||||||||
|
Earnings
(loss) per common share (diluted)
|
(0.40 | ) | (0.78 | ) | 0.03 | 0.32 | 0.05 | |||||||||||||
|
Balance
Sheet Data
|
||||||||||||||||||||
|
Cash,
cash equivalents and short term investments
|
$ | 5,306 | $ | 8,917 | $ | 7,425 | $ | 20,384 | $ | 4,359 | ||||||||||
|
Total
Assets
|
52,747 | 62,506 | 74,098 | 66,394 | 36,348 | |||||||||||||||
|
Total
debt and obligations under capital leases (short and long term) and other
long-term liabilities
|
523 | 10,746 | 10,683 | 14,337 | 1,326 | |||||||||||||||
|
Shareholders'
equity
|
42,037 | 40,394 | 46,865 | 41,420 | 27,729 | |||||||||||||||
|
Cash
Flow Data
|
||||||||||||||||||||
|
Net
cash provided by (used in) operations
|
$ | 5,089 | $ | 8,359 | $ | (3,305 | ) | $ | 2,663 | $ | 3,277 | |||||||||
26
Item 7. Management's Discussion and Analysis of
Financial Condition and Results of Operations.
This
Management’s Discussion and Analysis of financial condition and results of
operations contains forward-looking statements that involve risks and
uncertainties. Please see “Forward Looking Statements” on page [1] for a
discussion of the uncertainties, risks and assumptions associated with these
statements. You should read the following discussion in conjunction
with our historical consolidated financial statements and the notes thereto
appearing elsewhere in this Annual Report on Form 10-K. The results of
operations for the periods reflected herein are not necessarily indicative of
results that may be expected for future periods, and our actual results may
differ materially from those discussed in the forward-looking statements as a
result of various factors, including but not limited to those listed under “Risk
Factors” in Section 1A of this Annual Report on Form 10-K.
Overview
We are
a machine-to-machine (M2M) data communications, technology and solutions
business. We combine our network services, hardware and applications
development capabilities to create packaged and custom designed M2M solutions
for customers across multiple market segments.
Fiscal
year 2009 represented a decline in revenues over 2008 and 2007. Full
year revenues of $50.8 million decreased $21.5 million, or 29.7%, from
2008. This decrease was primarily the result of decreased hardware
sales, as service sales for the comparative years increased.
Gross
margins for 2009 were 44.0% compared with 35.1% in 2008. Gross
margins were favorably affected by an increase in service revenues, which
typically earn a higher gross margin than those achieved by hardware
sales.
Fiscal
year 2009 overheads, which include selling, general and administrative
(SG&A) costs, as well as engineering and development expenses and bad debt
costs, collectively were $24.0 million or $7.8 million lower than
2008. The decrease was primarily related to the impairment of
goodwill and long-lived assets of $5.3 million incurred during 2008. The
decrease is also related to a reduction in professional service and promotional
fees of $900,000, a reduction in bad debt costs of $565,000, and a reduction in
employee related expenses of $500,000.
Our
growth rates were slowed by the impact of the economic downturn, which we expect
may continue to adversely affect our revenues. Operating results
could be impacted by legal expenses related to litigation.
The
following is a discussion of our consolidated financial condition and results of
operations for the fiscal years ended December 31, 2009, 2008 and
2007.
Critical
Accounting Policies
Note A of
the Notes to the Consolidated Financial Statements includes a summary of the
significant accounting policies and methods used in the preparation of Numerex’s
Consolidated Financial Statements. The following is a brief discussion of the
more significant accounting policies and methods used.
General
The
preparation of financial statements in conformity with accounting principles
generally accepted in the United States of America requires management to make
estimates and assumptions that affect the reported amounts of assets and
liabilities and the disclosure of contingent assets and liabilities at the dates
of the financial statements and the reported amounts of revenues and expenses
during the reporting periods. The most significant estimates and assumptions
relate to revenue recognition, accounts receivable and allowance for doubtful
accounts, inventories and the adequacy of reserves for excess and obsolete
inventories, accounting for income taxes and valuation of goodwill and other
intangible assets. Actual amounts could differ significantly from these
estimates.
27
Revenue
Recognition
Revenues
are recognized when the following criteria are met: (1) persuasive evidence
of the customer arrangement exists, (2) fees are fixed and determinable,
(3) delivery and acceptance have occurred, and (4) collectibility is
deemed probable. We primarily sell hardware, recurring services (most billed on
a monthly basis) and on-demand services. Hardware revenues are
recognized at the time title passes to the customer, which is generally at the
time of shipment.
We bill
most of our recurring service revenues on a monthly basis, which are generated
by providing customers access to our M2M communications network (the
Network). We sell these services to value added resellers (VARS) and
wholesalers of the service. For services sold to VARS, monthly
service fees are generally a fixed monthly amount billed at the beginning of
each month. For services sold to wholesalers, the customers are
billed a fixed base fee in advance and usage fees in arrears at the end of each
month. We defer the advance billing of the base fee and recognize the
revenues when the services are performed.
We also
provide services on a demand basis. These types of services are
generally completed in a short period of time (usually less than one month) and
are billed and the revenue recognized when the services are completed.
Some of
our customers prepay for services for up to a year in advance. These
services include our satellite communication services, 24 hour a day access to
our internet based mapping software and other support services.
Additionally, these prepaid services expire after a specified period of
time. We defer these revenues until the services have been performed or,
for unused services, when the term expires.
The
Company’s arrangements do not generally include acceptance clauses. However, for
those arrangements that include multiple deliverables, we first determine
whether each service, or deliverable, meets the separation criteria of
counterparty is in accordance with ASC Subtopic 985-605 (American Institute of
Certified Public Accountants (“AICPA”) Statement of Position (“SOP”) 97-2, Software Revenue
Recognition),
ASC Subtopic 605-25 (Emerging Issues Task
Force (“EITF”) Issue No. 00-21, Revenue Arrangements with Multiple
Deliverables), and ASC Section 605-10-S99 (Staff Accounting Bulletin
(“SAB”) No. 104, Revenue
Recognition). Specifically, if we enter into contracts for the sale of
services and hardware, we evaluate whether the services are essential to the
functionality of the hardware and whether there is objective fair value evidence
for each deliverable in the transaction. If we conclude the services to be
provided are not essential to the functionality of the hardware and we can
determine objective fair value evidence for each deliverable of the transaction,
then we account for each deliverable in the transaction separately, based on the
relevant revenue recognition policies. Generally, all deliverables of our
multiple element arrangements meet these criteria. We may provide multiple
services under the terms of an arrangement and are required to assess whether
one or more units of accounting are present. Service fees are
typically accounted for as one unit of accounting as fair value evidence for
individual tasks or milestones is not available. We follow the
guidelines discussed above in determining revenues; however, certain judgments
and estimates are made and used to determine revenues recognized in any
accounting period. If estimates are revised, material differences may result in
the amount and timing of revenues recognized for a given period.
Allowance
for Doubtful Accounts
We
maintain an allowance for doubtful accounts for estimated losses resulting from
the inability of our customers to make required payments. Changes in the
financial condition of our customers could result in upward or downward
adjustments to the allowance for doubtful accounts.
28
Inventories
and Reserves for Excess, Slow-Moving and Obsolete Inventory
We value
our inventory at the lower of cost or market. We continually evaluate
the composition of our inventory and identify, with estimates, potential future
excess, obsolete and slow-moving inventories. We specifically identify obsolete
hardware for reserve purposes and analyze historical usage, forecasted
production based on demand forecasts, current economic trends, and historical
write-offs when evaluating the adequacy of the reserve for excess and
slow-moving inventory. If we are not able to achieve our expectations of the net
realizable value of the inventory at its current carrying value, we adjust our
reserves accordingly.
Valuation
of Goodwill and Long-lived Assets
Goodwill
and certain intangible assets with indefinite lives are not amortized but are
subject to an annual impairment test, and more frequently, if events or
circumstances occur that would indicate a potential decline in our fair
value. An impairment charge will be recognized only when the implied
fair value of a reporting unit’s goodwill is less than its carrying
amount. As of December 31, 2009, we identified four reporting units,
3 of which had associated goodwill. The four reporting units were M2M
Services (which excludes Orbit One LLC), Orbit One LLC (“Orbit One”), BNI and
Wireline Services. The three reporting units with associated goodwill
were M2M Services, Orbit One, LLC and Wireline Services. Due to the
consolidation of our hardware management and network platforms in late 2008, we
no longer maintained separate reporting for Airdesk and M2M Services, and thus
combined the Airdesk reporting unit with M2M Services (excluding Airdesk LLC and
Orbit One LLC) reporting unit beginning January 1, 2009. For our 2009
annual review, we used standard modeling techniques to estimate a fair market
value for each of the three reporting units containing goodwill. This
included a combination of a discounted cash flow models and, where available,
the use of public company market comparables in similar
industries. We used historical information, our 2010 business plan
and expected future development projects to prepare nine year financial
projections used in the discounted cash flow analysis for each of the reporting
units.
The
growth rate assumptions used in our most recent annual impairment test were
consistent with operating results for the twelve months ended December 31, 2009,
and no events or circumstances occurred that would require us to perform an
interim impairment test for these same periods.
A summary
of the critical assumptions utilized for our impairment tests are outlined
below. We believe this information provides relevant information to understand
our goodwill impairment testing and evaluate our goodwill balances.
As of
December 31, 2009, a breakdown of our goodwill balance by reporting unit is as
follows:
|
(In
thousands)
|
||||
|
M2M
Services excluding Airdesk and Orbit One Unit
|
$
|
18,433
|
||
|
Orbit
One Unit (part of M2M Services)
|
4,428
|
|||
|
BNI
Unit (part of Wireline Services)
|
926
|
|||
|
Total
Goodwill
|
$
|
23,787
|
||
During
2009, we did not record a goodwill impairment charge. In determining
whether an impairment charge was necessary, we considered economic conditions,
which we expect to improve in 2010 and subsequently return to more normal
levels, as compared to general economic conditions of 2009.
For our
M2M Services (excluding Orbit One LLC) reporting unit, we use a discounted cash
flow model to determine the fair value and a 21% discount rate, as this
reporting unit’s risks mirror that of the Company as a whole. Our
historical revenue growth rate averaged 17% over the past four
years. We use a more conservative revenue growth rate than our
historical growth rate in this reporting unit, as we expect the market to
mature. We expect our margins to remain at the historical four year
average of 42% for this reporting unit for the forecast period. The
growth rates used for SG&A and R&D are expected lower than that of our
historical growth rates as we built out a new internal service sales team which
would not occur in future periods. Depreciation and amortization and
capital expenditures are kept at historic run rates. We used
historical accounts receivable as a percentage of sales, inventory as a
percentage of cost of sales and accounts payable as a percentage of cost of
sales to determine the projected changes in working capital
requirements.
29
Based
upon our goodwill impairment analysis conducted in the fourth quarter of 2009, a
hypothetical reduction in the fair value of our M2M Services
(excluding Orbit One LLC) reporting unit of 14.2% , would have
resulted in the carrying value of the reporting unit exceeding its fair value
and thus require a Step 2 analysis and possible impairment. Over the
forecast period, this means that our cumulative projected revenues would have to
decrease by 4% (representing a proportional decrease in our average growth rate
of 7% over the forecast period), or our cumulative projected profitability would
have to decrease by 12%. A 1.9% increase to the discount rate that we
applied also would have resulted in the carrying value of the reporting unit
exceeding its fair value.
We
believe that our cash flow analysis was appropriate as our projections took the
present challenging economic environment into account and are consistent with
our current operating results.
In our Orbit One reporting
unit, we used a discounted cash flow model to determine the fair value as we
cannot determine any market comparables for this unit. We used a 21%
discounted rate as this reporting unit’s risks mirrored that of the Company as a
whole. A combination of existing contractual agreements and targeting
of specific industries is used to determine the first year’s revenue growth
rate, the following years’ revenue growth rates are based on expected industry
growth rates. Margins are projected to decline as a combination of
expected pricing pressures in the market and lower margin hardware sales are
expected to make up a larger portion of total revenues versus higher margin
service sales. SG&A expenses are forecasted to increase in the
first year as the result of a build out of necessary sales support to meet
projected revenue targets then the SG&A growth are expected to moderate for
the balance of the forecast period. Depreciation and amortization and
capital expenditures are kept at historic run rates. We used
historical accounts receivable as a percentage of sales, inventory as a
percentage of cost of sales and accounts payable as a percentage of cost of
sales to determine the projected changes in working capital
requirements.
Based
upon our goodwill impairment analysis conducted in the fourth quarter of 2009, a
hypothetical reduction in the fair value of our Orbit One LLC
reporting unit of 9.4% , would have resulted in the carrying value of
the reporting unit exceeding its fair value and thus require a Step 2 analysis
and possible impairment. Over the forecast period, this means that
our cumulative projected revenues would have to decrease by 3% (representing a
proportional decrease in our average growth rate of 4% over the forecast
period), or our cumulative projected profitability would have to decrease by
8%. A 1.0% increase to the discount rate that we applied also would
have resulted in the carrying value of the reporting unit exceeding its fair
value.
In our
Digital Multimedia reporting unit, we used a combination of a discounted cash
flow analysis and use of public company market comparables to determine the fair
value. Since this reporting unit’s revenues mostly result from government
related contracts, the revenue can fluctuate significantly from year to year and
over our forecast period. Taking this into consideration, we used two
cash flow models for this reporting with two possible revenue streams over the
forecast period. We then applied a weighting to each outcome to
determine the unit’s fair value on a discounted cash flow
basis. We used the company’s overall 21% discount rate as we
accounted for this units fluctuating revenue by weighting two separate cash flow
models. We gave the combination of these cash flow models greater
weighting totaling 90% with the balance on the market comparables since we only
had a limited number of market comparables. In the first year of the
forecast combined weighted revenues increase over the forecast period over 2009,
but do not grow over 2008 revenue levels until 2011 and for the balance of the
forecast period. This growth is the result of the completion of
new product development projects currently in process, and new
contracts. Weighted combined margins were projected to decline due to
changes in the mix of hardware and service sales and expected pricing
pressures. SG&A expenses are forecast to decrease in the first
year as the result of cost reductions planned and returning to historical growth
rates. Depreciation and amortization and capital expenditures are
kept at historic run rates. We used historical accounts receivable as
a percentage of sales, our sales growth rate for inventory and accounts payable
as a percentage of cost of sales to determine the projected changes in working
capital requirements. The combination of all these factors determined
our cash flow growth rates. For the market comparables, we used
a combination of EBITDA and sales ratio’s to determine fair value.
Based
upon our goodwill impairment analysis conducted in the fourth quarter of 2009, a
hypothetical reduction in the fair value of our Digital Multimedia
reporting unit of 63% , would have resulted in the carrying value of
the reporting unit exceeding its fair value and thus require a Step 2 analysis
and possible impairment. Over the forecast period, this means that
our cumulative projected revenues would have to decrease by 44%, or our
cumulative projected profitability would have to decrease by 44%. A
46% increase to the discount rate that we applied also would have resulted in
the carrying value of the reporting unit exceeding its fair
value.
30
Additionally,
the sum of the fair value of all our reporting units was less than our market
capital at December 31, 2009, indicating that our projections were reasonable
and not aggressive.
Deferred
Tax Assets
Estimates
and judgments are required in the calculation of certain tax liabilities and in
the determination of the recoverability of certain deferred tax
assets, which arise from net operating losses, tax credit carryforwards and
temporary differences between the tax and financial statement recognition of
revenue and expense. Significant changes to these estimates may result
in an increase or decrease to our tax provision in a subsequent
period.
ASC 740,
"Accounting for Income Taxes", requires that the deferred tax assets
be reduced by a valuation allowance, if based on the weight of available
evidence, it is more likely than not that some portion or all of the recorded
deferred tax assets will not be realized in future periods. In evaluating the
ability to recover the deferred tax assets, in full or in part, management
considers all available positive and negative evidence including past operating
results, the existence of cumulative losses in the most recent years and the
forecast of future taxable income on a jurisdiction by jurisdiction
basis. Management is responsible for the assumptions utilized
including the amount of state, federal and international pre-tax operating
income, the reversal of temporary differences and the implementation of feasible
and prudent tax planning strategies. These assumptions require significant
judgment. Actual operating results and the underlying assumptions could differ
materially from our current assumptions, judgments and estimates of recoverable
net deferred taxes.
Cumulative
losses incurred in recent years and the potential impact of the current economic
environment on future taxable income represented sufficient negative evidence
for management to conclude that the deferred tax assets require a full valuation
allowance. As such, management established a full valuation allowance against
the net deferred tax assets, which will remain until sufficient positive
evidence exists to support reversal. Deferred tax assets generated during the
current year primarily due to net operating losses were offset by an increase to
the valuation allowance resulting in no net benefit recorded in the current
year. Future reversals or increases to the valuation allowance could have a
significant impact on our future earnings. Current tax expense resulted from
foreign operations and certain state taxes.
31
Result
of Operations
The
following table sets forth, for the periods indicated, certain revenue and
expense items and the percentage increases and decreases for those items in the
Company’s Consolidated Statements of Operations.
|
For
the years ended December 31,
|
2009
vs. 2008
|
2008
vs. 2007
|
||||||||||||||||||
|
(in
thousands, except per share amounts)
|
2009
|
2008
|
2007
|
%
Change
|
%
Change
|
|||||||||||||||
|
Net
sales:
|
||||||||||||||||||||
|
M2M
Services
|
||||||||||||||||||||
|
Hardware
|
$ | 19,654 | $ | 40,197 | $ | 41,661 | -51.1 | % | -3.5 | % | ||||||||||
|
Service
|
27,727 | 25,952 | 21,164 | 6.8 | % | 22.6 | % | |||||||||||||
|
Sub-total
|
47,381 | 66,149 | 62,825 | -28.4 | % | 5.3 | % | |||||||||||||
|
Wireline
Services
|
||||||||||||||||||||
|
Hardware
|
628 | 2,851 | 1,747 | -78.0 | % | 63.2 | % | |||||||||||||
|
Service
|
2,827 | 3,319 | 3,432 | -14.8 | % | -3.3 | % | |||||||||||||
|
Sub-total
|
3,455 | 6,170 | 5,179 | -44.0 | % | 19.1 | % | |||||||||||||
|
Total
net sales
|
||||||||||||||||||||
|
Hardware
|
20,282 | 43,048 | 43,408 | -52.9 | % | -0.8 | % | |||||||||||||
|
Service
|
30,554 | 29,271 | 24,596 | 4.4 | % | 19.0 | % | |||||||||||||
|
Sub-total
|
50,836 | 72,319 | 68,004 | -29.7 | % | 6.3 | % | |||||||||||||
|
Cost
of hardware sales
|
17,319 | 37,469 | 38,491 | -53.8 | % | -2.7 | % | |||||||||||||
|
Cost
of services
|
11,169 | 9,430 | 6,106 | 18.4 | % | 54.4 | % | |||||||||||||
|
Gross
Profit
|
22,348 | 25,420 | 23,407 | -12.1 | % | 8.6 | % | |||||||||||||
|
Gross
Profit %
|
44.0 | % | 35.1 | % | 34.4 | % | ||||||||||||||
|
Selling,
general, and administrative expenses
|
17,649 | 20,113 | 16,320 | -12.2 | % | 23.2 | % | |||||||||||||
|
Engineering
and development expenses
|
2,421 | 2,198 | 1,459 | 10.1 | % | 50.7 | % | |||||||||||||
|
Bad
debt expense
|
536 | 1,102 | 635 | -51.4 | % | 73.4 | % | |||||||||||||
|
Depreciation
and amortization
|
3,398 | 3,107 | 2,493 | 9.4 | % | 24.6 | % | |||||||||||||
|
Goodwill
and long-lived asset impairment
|
- | 5,289 | - |
nm
|
nm
|
|||||||||||||||
|
Operating
earnings (loss)
|
(1,656 | ) | (6,389 | ) | 2,500 | -74.1 | % | -355.6 | % | |||||||||||
|
Interest
income and (expense), net
|
(3,931 | ) | (1,531 | ) | (1,365 | ) | 12.1 | % | ||||||||||||
|
Other
income and (expense), net
|
43 | (8 | ) | 33 |
nm
|
nm
|
||||||||||||||
|
Provision
for income tax
|
285 | 3,047 | 728 |
nm
|
nm
|
|||||||||||||||
|
Net
earnings (loss)
|
(5,829 | ) | (10,975 | ) | 440 | -46.9 | % |
nm
|
||||||||||||
|
Basic
earnings (loss) per common share
|
$ | (0.40 | ) | $ | (0.78 | ) | $ | 0.03 | ||||||||||||
|
Diluted
earnings (loss) per common share
|
$ | (0.40 | ) | $ | (0.78 | ) | $ | 0.03 | ||||||||||||
|
Basic
|
14,409 | 14,144 | 13,137 | |||||||||||||||||
|
Diluted
|
14,409 | 14,144 | 13,700 | |||||||||||||||||
<TABLE><CAPTION>
See notes
to consolidated financial statements.
32
Fiscal
Years Ended December 31, 2009 and December 31, 2008
Net
revenues decreased 29.7% to $50.8 million for the year ended December 31, 2009,
as compared to $72.3 million for the year ended December 31,
2008. The decrease in total net revenues for the year ended December
31, 2009 is attributable to a 52.9% decrease to $20.3 million in hardware
revenues as compared to $43.0 million for the year ended December 31,
2008. The decrease in hardware revenues is due primarily to a
decrease in demand for our wireless modules due to the end of the technology
transition from analog to digital. The decrease is also due to the
effect of the economy on our customers, as well as a result of our tighter
credit controls, which were implemented in the second half of 2008.
Cost of
hardware sales decreased 53.8% to $17.3 million for the year ended December 31,
2009, as compared to $37.5 million for the year ended December 31,
2008. The decrease was primarily due to the corresponding decrease in
hardware sales.
Cost of
services increased 18.4% to $11.2 million for the year ended December 31, 2009,
as compared to $9.4 million for the year ended December 31, 2008. The
increase in cost of services was primarily the result of an increase in the
number of subscriptions to our M2M network. Subscription increases
were generated by sales of our security hardware as well as by end users and
value added resellers who utilize our network to provide customer
solutions. We continue to focus on increasing subscriptions to our
network due to the recurring nature of the service net sales.
Gross
profit, as a percentage of net revenue, was 44.0% for the year ended December
31, 2009, as compared to 35.1% for the year ended December 31,
2008. The increase for 2009, as compared to 2008, is primarily a
result of a change in the overall revenue mix. For the year ended December 31,
2009, service revenues were 60.1% and of total revenues, as compared to 40.5%
for the year ended December 31, 2008. This causes an overall margin improvement
since service revenues have a significantly higher gross margin than those
achieved through the sale of hardware.
Selling,
general, administrative and other expenses decreased 12.2% to $17.6 million for
the year ended December 31, 2009, as compared to $20.1 million for the year
ended December 31, 2008. The decrease of $2.5 million is primarily
the result of a $1.1 million decrease in employee compensation and other
employee related costs, $598,000 decrease in professional service fees, a
$455,000 decrease in litigation fees, and a $305,000 decrease in marketing
related costs.
Engineering
and development expenses increased 10.1% to $2.4 million for the year ended
December 31, 2009, as compared to $2.2 million for the year ended December 31,
2008. The increase in engineering and development expenses is
primarily the result of increased employee compensation and expenses related to
new product testing and certifications.
Bad debt
expense decreased to $536,000 for the year ended December 31, 2009, as compared
to $1.1 million for the year ended December 31, 2008. We analyze
accounts receivable and consider our historical bad debt experience, customer
credit-worthiness, current economic trends and changes in our customer payment
terms when evaluating the adequacy of the allowance for doubtful
accounts. Bad debt expense decreased over the prior year as a result
of our tighter credit
controls particularly in regard to our hardware-only customer
sales.
Depreciation
and amortization expense increased 9.4% to $3.4 million for the year ended
December 31, 2009, as compared to $3.1 million for the year ended December 31,
2008. This increase is primarily the result of increased capital
expenditures for computer and office equipment and for capitalized software
projects that have been placed into service.
Interest
expense increased to $3.9 million in 2009, as compared to $1.5 million in
2008. The increase is primarily the result of the $2.4 million
expense associated with the debt conversion. In 2009 we repaid an
aggregate of $5.7 million under our outstanding convertible promissory
notes. Under generally accepted accounted principles, specifically,
ASC 470-20 (formerly FAS 84), an adjustment to the conversion price of the
convertible note should be accounted for as an inducement to convert the note,
even though there was no economic incentive offered. The increase in interest
expense also includes $499,000, the non-cash expense associated with the
expensing of the deferred fees associated with the early extinguishment of
debt.
The
company recorded a tax provision of $285,000 for the year ended December 31,
2009, as compared to a tax provision of $3,047,000 for
the year ended December 31, 2008, representing effective tax rates of
(5.15)% and (38.44)% respectively. The difference between the
company's effective tax rate and the 34% federal statutory rate in the current
year resulted primarily from the existence of a valuation allowance against the
Company's net deferred tax assets, foreign taxes, state tax accruals, and
uncertain tax position.
The
weighted average basic shares outstanding increased to 14,409,000 for the year
ended December 31, 2009, as compared to 14,144,000 for the year ended December
31, 2008. The increase in weighted average basic shares outstanding
for the year ended December 31, 2009 was primarily due to the issuance of 44,000
common shares related to the employee stock option plan and 889,000 common
shares issued in lieu of debt payments.
33
Fiscal
Years Ended December 31, 2008 and December 31, 2007
Net
revenues increased 6.3% to $72.3 million for the year ended December 31, 2008,
as compared to $68.0 million for the year ended December 31,
2007. The increase in total net revenues for the year ended December
31, 2008 is attributable to a 19.0% increase to $29.3 million in service
revenues as compared to $24.6 million for the year ended December 31,
2007. The increase in service revenues is due primarily to the growth
of network subscriptions and approximately $519,000 of revenue related to the
acquisitions of Orbit One, LLC and Ublip, LLC. Hardware sales for the year ended
December 31, 2008 remained relatively flat at $43.0 million.
Cost of
hardware sales decreased 2.7% to $37.5 million for the year ended December 31,
2008 as compared to $38.5 million for the year ended December 31,
2007. The decrease was primarily the result of reduced costs for our
M2M hardware.
Cost of
services increased 54.4% to $9.4 million for the year ended December 31, 2008 as
compared to $6.1 million for the year ended December 31, 2007. The
increase in cost of services was primarily the result of higher service sales
volume in M2M attributed to an increase in subscriptions to our M2M
network. The increase in subscriptions was a direct correlation to
our increase in costs.
Gross
profit, as a percentage of net revenue, was 35.1% for the year ended December
31, 2008 as compared to 34.4% for the year ended December 31,
2007. The increase for 2008, as compared to 2007 is primarily a
result of a change in the overall revenue mix. In the twelve month period ended
December 31, 2007, service revenues were 36.2% of total revenues compared to
40.5% in the twelve month period ended December 31, 2008. This change causes an
overall margin improvement since service revenues have a significantly higher
gross margin than those achieved through the sale of hardware.
Selling,
general, administrative and other expenses increased 23.2% to $20.1 million for
the year ended December 31, 2008, as compared to $16.3 million for the year
ended December 31, 2007. As a percentage of revenue, selling,
general, administrative and other expenses increased to 27.8% for the year ended
December 31, 2008 as compared to 24.0% for the year ended December 31,
2007. The increase of $3.8 million is primarily the result of higher
general and administrative expenses associated with litigation expenses related
to our satellite M2M unit ($2.3 million), higher personnel related costs ($1.1
million) and an increase in sales and marketing expenses
($400,000).
Engineering
and development expenses increased 50.7% to $2.2 million for the year ended
December 31, 2008, as compared to $1.5 million for the year ended December 31,
2007. The increase in engineering and development expenses is
primarily due to higher personnel related expenses.
Bad debt
expense increased to $1.1 million for the year ended December 31, 2008, as
compared to $635,000 for the year ended December 31, 2007. We analyze
accounts receivable and consider our historical bad debt experience, customer
credit-worthiness, current economic trends and changes in our customer payment
terms when evaluating the adequacy of the allowance for doubtful
accounts. Bad debt expense increased over the prior year period as a
result of our identification of specific collection issues.
Depreciation
and amortization expense increased 24.2% to $3.1 million for the year ended
December 31, 2008, as compared to $2.5 million for the year ended December 31,
2007. This increase is attributable to amortization beginning on
engineering and development projects that have been completed and released, as
well as the purchase of depreciable computer and office equipment.
During
2008, we recorded a pre-tax, non-cash charge of $4.0 million for the impairment
of goodwill and a pre-tax, non-cash charge of $1.3 million for the impairment of
long-lived assets.
Interest
expense decreased to $1.6 million in 2008, as compared to $1.9 million in
2007. This decrease was the result of declining debt due to continued
payments.
34
The
company recorded a tax provision of $3,047,000 for the year ended December 31,
2008, as compared to a tax provision of $728,000 for
the year ended December 31, 2007, representing effective tax rates
of (38.44)% and 65.74%, respectively. The difference between the
company's effective tax rate and the 34% federal statutory rate in the current
year resulted primarily from an increase in the Company's valuation allowance,
stock option expenses, impairment charges, state tax accruals, and uncertain tax
position expense. The Company's negative effective tax rate in 2008 of (38.44)%
can be attributed to the increase in the valuation allowance against net
deferred tax assets.
The
weighted average basic shares outstanding increased to 14,144,000 for the year
ended December 31, 2008, as compared to 13,137,000 for the year ended December
31, 2007. The increase in weighted average basic shares outstanding
for the year ended December 31, 2008 was primarily due to the issuance of 27,000
common shares related to the employee stock option plan, 200,000 common shares
related to the acquisition of Airdesk, Inc. and 405,000 common shares
related to the acquisition of the assets of Ublip, Inc.
35
Segment
Information
|
For
the years ended December 31,
|
2009
vs. 2008
|
2008
vs. 2007
|
||||||||||||||||||
|
(In
thousands)
|
2009
|
2008
|
2007
|
%
Change
|
%
Change
|
|||||||||||||||
|
Net
sales:
|
||||||||||||||||||||
|
M2M
Services
|
||||||||||||||||||||
|
Hardware
|
$ | 19,654 | $ | 40,197 | $ | 41,661 | -51.1 | % | -3.5 | % | ||||||||||
|
Service
|
27,727 | 25,952 | 21,164 | 6.8 | % | 22.6 | % | |||||||||||||
|
Sub-total
|
47,381 | 66,149 | 62,825 | -28.4 | % | 5.3 | % | |||||||||||||
|
Wireline
Services
|
||||||||||||||||||||
|
Hardware
|
628 | 2,851 | 1,747 | -78.0 | % | 63.2 | % | |||||||||||||
|
Service
|
2,827 | 3,319 | 3,432 | -14.8 | % | -3.3 | % | |||||||||||||
|
Sub-total
|
3,455 | 6,170 | 5,179 | -44.0 | % | 19.1 | % | |||||||||||||
|
Total
net sales
|
||||||||||||||||||||
|
Hardware
|
20,282 | 43,048 | 43,408 | -52.9 | % | -0.8 | % | |||||||||||||
|
Service
|
30,554 | 29,271 | 24,596 | 4.4 | % | 19.0 | % | |||||||||||||
|
Total
net sales
|
50,836 | 72,319 | 68,004 | -29.7 | % | 6.3 | % | |||||||||||||
|
Cost
of Sales:
|
||||||||||||||||||||
|
M2M
Services
|
||||||||||||||||||||
|
Cost
of hardware sales
|
$ | 17,026 | $ | 36,184 | 37,443 | -52.9 | % | -3.4 | % | |||||||||||
|
Cost
of service sales
|
10,199 | 8,182 | 4,803 | 24.7 | % | 70.4 | % | |||||||||||||
|
Subtotal
|
27,255 | 44,366 | 42,246 | -38.6 | % | 67 | % | |||||||||||||
|
Wireline
Services
|
||||||||||||||||||||
|
Cost
of hardware sales
|
293 | 1,285 | 1,048 | -77.2 | % | 22.6 | % | |||||||||||||
|
Cost
of service sales
|
970 | 1,248 | 1,303 | -22.3 | % | -4.2 | % | |||||||||||||
|
Subtotal
|
1,263 | 2,533 | 2,351 | -50.1 | % | 18 | % | |||||||||||||
|
Total
cost of sales
|
$ | 28,488 | $ | 46,899 | $ | 44,597 | -39.3 | % | 5.2 | % | ||||||||||
|
Gross
Profit
|
$ | 22,348 | $ | 25,420 | $ | 23,407 | -12.1 | % | 8.6 | % | ||||||||||
|
Gross
Profit %
|
44.0 | % | 35.1 | % | 34.4 | % | -52.9 | % | ||||||||||||
|
Percent
of Total Sales
|
||||||||||||
|
2009
|
2008
|
2007
|
||||||||||
|
Net
sales:
|
||||||||||||
|
M2M
Services
|
||||||||||||
|
Hardware
|
38.7 | % | 55.6 | % | 61.3 | % | ||||||
|
Service
|
54.5 | % | 35.9 | % | 31.1 | % | ||||||
|
Sub-total
|
93.2 | % | 91.5 | % | 92.4 | % | ||||||
|
Wireline
Services
|
||||||||||||
|
Hardware
|
1.2 | % | 3.9 | % | 2.6 | % | ||||||
|
Service
|
5.6 | % | 4.6 | % | 5.0 | % | ||||||
|
Sub-total
|
6.8 | % | 8.5 | % | 7.6 | % | ||||||
|
Total
net sales
|
||||||||||||
|
Hardware
|
39.9 | % | 59.5 | % | 63.8 | % | ||||||
|
Service
|
60.1 | % | 40.5 | % | 36.2 | % | ||||||
|
Total
net sales
|
100.0 | % | 100.0 | % | 100.0 | % | ||||||
36
Fiscal
Years Ended December 31, 2009 and December 31, 2008
M2M
Services Segment
Net
revenues from M2M Services decreased 28.4% to $47.4 million for the year ended
December 31, 2009, as compared to $66.1 million for the year ended December
31, 2008. This decrease was the result a 51.1% decrease in hardware
revenue, partially offset by a 6.8% increase in service revenue. The
decrease in M2M Services hardware revenue of $20.5 million was primarily the
result of a decrease in demand for our wireless modules due to the effect of the
prolonged economic slump on our customers, as well as a result of our tighter
credit controls, which were implemented in January 2009. The increase in the M2M
Services service revenue was primarily the result of connection increases that
were generated by sales of our security hardware, sales of our wireless modules
used in the door entry control solutions used by real estate agents and brokers,
as well as by end users and value added resellers who utilize our network to
provide customer solutions. Our wireless subscriptions at December 31, 2009 were
937,000, a 34.0% increase in subscriptions over the year ended December 31,
2008. While subscriptions have increased at a higher rate than service net
sales, the average revenue per unit has decreased due to our customer
mix. We continue to focus on increasing subscriptions to our network
due to the recurring nature of the service revenues.
Cost of
hardware sales for our M2M Services segment decreased 52.9% to $17.0 million for
the twelve months December 31, 2009, as compared to $36.2 million for the twelve
months ended December 31, 2008. The decrease in cost of hardware
sales for our M2M Services segment is primarily the result of lower hardware
sales.
Cost of
service sales for our M2M Services segment increased 24.7% for the year ended
December 31, 2009 to $10.2 million, as compared to $8.2 million for the year
ended December 31, 2008. M2M Services service net costs increased
primarily due to the costs related to the increase in the number of
subscriptions to our M2M Services network during the year ended December 31,
2009. Subscription increases were generated by sales of our security
hardware as well as by end users and value added resellers who utilize our
network to provide customer solutions. We continue to focus on
increasing subscriptions to our network due to the recurring nature of the
service net sales.
Wireline
Services Segment
Net
revenue from Wireline Services decreased 44.0% to $3.5 million for the year
ended December 31, as compared to $6.2 million for the year ended December 31,
2008. This decrease was primarily the result of a decrease in sales
of our interactive videoconferencing hardware (PowerPlay), which is sold
directly and indirectly to distance-learning customers. Capital spending by
targeted distance learning customers is largely funded by government entities
and, as a result, is difficult to predict and can fluctuate significantly from
period to period. The decrease in net revenue is also due to service revenues
decreasing. Our installation and integration services are primarily,
either directly or indirectly, provided to large wireline and wireless
telecommunication companies. The decrease in service revenues is due
to a decrease in demand for these services.
Cost of
hardware sales for our Wireline Services segment decreased 77.2% to
$293,000 for the year ended December 31, 2009, as compared to $1.3 million for
the year ended December 31, 2008. The decrease in cost of hardware sales
for our Wireline Services segment is in direct correlation to the decrease in
hardware sales.
Cost of
service sales for our Wireline Services segment decreased 22.3% to $970,000 for
the year ended December 31, 2009 as compared to $1.2 million for the year ended
December 31, 2008. The decrease in cost of service sales for the
Wireline Services segment is in direct correlation to the decrease in services
net sales.
37
Fiscal
Years Ended December 31, 2008 and December 31, 2007
M2M
Services Segment
Net
revenues from M2M Services increased 5.3% to $66.1 million for the year ended
December 31, 2008, as compared to $62.8 million for the year ended December
31, 2007. This increase was the result a 22.6% increase in service
revenues, partially offset by a 3.5% decrease in hardware sales. The
increase in M2M Services service sales of $4.8 million was primarily the result
of an increase in network subscriptions that were generated by sales of our
security hardware as well as by end users and value added resellers who utilize
our network to provide customer solutions. We continue to focus on
increasing subscriptions to our network due to the recurring nature of the
service revenues. Our growth was also attributable to increased
subscriptions from wireless modules used in the door entry control solution used
by real estate agents and brokers. The slight decrease in the M2M
Services hardware revenue was primarily the result of decline in sales of our
wireless security devices due to the decreased demand for wireless security
hardware now that our customers have fully transitioned from analog network
services.
Cost of
hardware sales for our M2M Services segment decreased 3.4% to $36.1 million for
the twelve months December 31, 2008 as compared to $37.4 million for the twelve
months ended December 31, 2007. The decrease in cost of hardware
sales for our M2M Services segment for the year ended December 31, 2008 is
primarily the result of decreased hardware sales due to the completion of the
analog to digital transition in the commercial and residential security market
coupled with reduced demand from M2M Services customers for wireless modules
adjusting to the macroeconomic slowdown.
Cost of
service sales for our M2M Services segment increased 70.4% for the year ended
December 31, 2008 to $8.2 million as compared to $4.8 million for the year ended
December 31, 2007. M2M Services service net costs increased primarily
due to an increase in the number of subscriptions to our wireless M2M Services
network during the year ended December 31, 2008. Connection increases
were generated by sales of our security hardware as well as by end users and
value added resellers who utilize our network to provide customer
solutions. We continue to focus on increasing subscriptions to our
network due to the recurring nature of the service net sales.
Wireline
Services Segment
Net
revenue from Wireline Services increased 19.1% to $6.2 million for the year
ended December 31, 2008 as compared to $5.2 million for the year ended December
31, 2007. This increase was primarily due to a 63.2% increase in
hardware sales. The increase in hardware sales was primarily the
result of an increase in sales of our interactive videoconferencing hardware
(PowerPlay), which is sold directly and indirectly to distance-learning
customers. Capital spending by targeted distance learning customers is largely
funded by government entities and, as a result, is difficult to predict and can
fluctuate significantly from period to period.
Cost of
hardware sales for our Wireline Services segment increased 22.6% to $1.3
million for the year ended December 31, 2008 as compared to $1.0 million for the
year ended December 31, 2007. The increase in cost of hardware sales for
our Wireline Services segment for year ended December 31, 2008 was primarily the
result of higher hardware sales volume in our interactive videoconferencing
hardware (PowerPlay).
Cost of
service sales for our Wireline Services segment decreased 4.2% to $1.2 million
for the year ended December 31, 2008 as compared to $1.3 million for the year
ended December 31, 2007. The decrease in cost of service sales for
the Wireline Services segment for the year ended December 31, 2008 is in direct
correlation to the decrease in services net sales for this segment.
38
Selected
Quarterly Financial Data
The
following tables detail certain unaudited financial data of Numerex for each
quarter of the last two fiscal years ended December 31, 2009 and 2008,
respectively.
Our
financial results may fluctuate from quarter to quarter as a result of certain
factors related to our business, including the timing of hardware shipments, new
hardware introductions and equipment, and hardware and system sales that
historically have been of a non-recurring nature.
This
information has been prepared from our books and records in accordance with
accounting principles generally accepted in the United States of America for
interim financial information. In the opinion of management, all
(including only normal, recurring) adjustments considered necessary for fair
presentation have been included. Interim results for any quarter are
not necessarily indicative of the results that may be expected for any future
period.
39
Selected
Quarterly Financial Data (Unaudited)
|
For
the Three Months Ended
|
||||||||||||||||
|
(in
thousands)
|
March
31,
|
June
30,
|
September
30,
|
December
31,
|
||||||||||||
|
2009
|
2009
|
2009
|
2009
|
|||||||||||||
|
Net
sales:
|
||||||||||||||||
|
M2M
Services
|
||||||||||||||||
|
Hardware
|
$ | 5,572 | $ | 4,711 | $ | 3,793 | $ | 5,578 | ||||||||
|
Service
|
6,235 | 6,907 | 7,002 | 7,583 | ||||||||||||
|
Sub-total
|
11,807 | 11,618 | 10,795 | 13,161 | ||||||||||||
|
Wireline
Services
|
||||||||||||||||
|
Hardware
|
103 | 193 | 184 | 148 | ||||||||||||
|
Service
|
752 | 793 | 570 | 712 | ||||||||||||
|
Sub-total
|
855 | 986 | 754 | 860 | ||||||||||||
|
Total
net sales
|
||||||||||||||||
|
Hardware
|
5,675 | 4,904 | 3,977 | 5,726 | ||||||||||||
|
Service
|
6,987 | 7,700 | 7,572 | 8,295 | ||||||||||||
|
Sub-total
|
12,662 | 12,604 | 11,549 | 14,021 | ||||||||||||
|
Cost
of hardware sales
|
4,928 | 4,235 | 3,449 | 4,707 | ||||||||||||
|
Cost
of services
|
2,434 | 2,687 | 2,995 | 3,053 | ||||||||||||
|
Gross
Profit
|
5,300 | 5,682 | 5,105 | 6,261 | ||||||||||||
|
Selling,
general, and administrative expenses
|
5,184 | 4,473 | 3,907 | 4,085 | ||||||||||||
|
Engineering
and development expenses
|
508 | 651 | 584 | 678 | ||||||||||||
|
Bad
debt expense
|
155 | 136 | 102 | 143 | ||||||||||||
|
Depreciation
and amortization
|
792 | 844 | 879 | 883 | ||||||||||||
|
Goodwill
impairment
|
- | - | - | - | ||||||||||||
|
Operating
earnings (loss)
|
(1,339 | ) | (422 | ) | (367 | ) | 472 | |||||||||
|
Costs
of early extinguishment of debt
|
- | - | (1,577 | ) | (1,359 | ) | ||||||||||
|
Net
interest expense
|
(347 | ) | (343 | ) | (204 | ) | (101 | ) | ||||||||
|
Net
other income
|
- | 1 | - | 42 | ||||||||||||
|
Loss
before income taxes
|
(1,686 | ) | (764 | ) | (2,148 | ) | (946 | ) | ||||||||
|
Provision
for income taxes
|
37 | 28 | 31 | 189 | ||||||||||||
|
Net
loss
|
$ | (1,723 | ) | $ | (792 | ) | $ | (2,179 | ) | $ | (1,135 | ) | ||||
|
Foreign
currency translation adjustment
|
(2 | ) | 4 | 6 | - | |||||||||||
|
Comprehensive
loss
|
$ | (1,725 | ) | $ | (788 | ) | $ | (2,173 | ) | $ | (1,135 | ) | ||||
|
Basic
loss per common share
|
$ | (0.12 | ) | $ | (0.06 | ) | $ | (0.15 | ) | $ | (0.08 | ) | ||||
|
Diluted
loss per common share
|
$ | (0.12 | ) | $ | (0.06 | ) | $ | (0.15 | ) | $ | (0.08 | ) | ||||
|
Weighted
average shares used in per share:
|
||||||||||||||||
|
Basic
|
14,169 | 14,152 | 14,360 | 14,947 | ||||||||||||
|
Diluted
|
14,169 | 14,152 | 14,360 | 14,947 | ||||||||||||
40
Selected
Quarterly Financial Data (Unaudited)
|
For
the Three Months Ended
|
||||||||||||||||
|
(in
thousands)
|
March
31,
|
June
30,
|
September
30,
|
December
31,
|
||||||||||||
|
2008
|
2008
|
2008
|
2008
|
|||||||||||||
|
Net
sales:
|
||||||||||||||||
|
M2M
Services
|
||||||||||||||||
|
Hardware
|
$ | 13,421 | $ | 9,442 | $ | 10,235 | $ | 7,099 | ||||||||
|
Service
|
6,132 | 6,212 | 6,486 | 7,121 | ||||||||||||
|
Sub-total
|
19,553 | 15,654 | 16,721 | 14,220 | ||||||||||||
|
Wireline
Services
|
||||||||||||||||
|
Hardware
|
203 | 1,048 | 1,397 | 203 | ||||||||||||
|
Service
|
700 | 723 | 859 | 1,038 | ||||||||||||
|
Sub-total
|
903 | 1,771 | 2,256 | 1,241 | ||||||||||||
|
Total
net sales
|
||||||||||||||||
|
Hardware
|
13,624 | 10,490 | 11,632 | 7,302 | ||||||||||||
|
Service
|
6,832 | 6,935 | 7,345 | 8,159 | ||||||||||||
|
Sub-total
|
20,456 | 17,425 | 18,977 | 15,461 | ||||||||||||
|
Cost
of hardware sales
|
12,162 | 9,013 | 9,663 | 6,631 | ||||||||||||
|
Cost
of services
|
1,839 | 2,143 | 2,773 | 2,675 | ||||||||||||
|
Gross
Profit
|
6,455 | 6,269 | 6,541 | 6,155 | ||||||||||||
|
Selling,
general, and administrative expenses
|
5,015 | 5,047 | 4,558 | 5,493 | ||||||||||||
|
Engineering
and development expenses
|
530 | 485 | 473 | 710 | ||||||||||||
|
Bad
debt expense
|
138 | 125 | 209 | 630 | ||||||||||||
|
Depreciation
and amortization
|
751 | 766 | 773 | 817 | ||||||||||||
|
Goodwill
impairment
|
- | - | - | 3,986 | ||||||||||||
|
Long-lived
assets impairment
|
- | - | - | 1.303 | ||||||||||||
|
Operating
earnings (loss)
|
21 | (154 | ) | 528 | (6,784 | ) | ||||||||||
|
Interest
expense, net
|
(403 | ) | (407 | ) | (331 | ) | (387 | ) | ||||||||
|
Other
income (expense)
|
(2 | ) | (2 | ) | 5 | (12 | ) | |||||||||
|
Earnings
(loss) before income taxes
|
(384 | ) | (563 | ) | 202 | (7,183 | ) | |||||||||
|
Provision
(benefit) for Income taxes
|
(166 | ) | (380 | ) | 125 | 3,468 | ||||||||||
|
Net
earnings (loss)
|
$ | (218 | ) | $ | (183 | ) | $ | 77 | $ | (10,651 | ) | |||||
|
Foreign
currency translation adjustment
|
10 | - | - | (12 | ) | |||||||||||
|
Comprehensive
earnings (loss)
|
$ | (208 | ) | $ | (183 | ) | $ | 77 | $ | (10,663 | ) | |||||
|
Basic
earnings (loss) per common share
|
$ | (0.02 | ) | $ | (0.01 | ) | $ | 0.01 | $ | (0.78 | ) | |||||
|
Diluted
earnings (loss) per common share
|
$ | (0.02 | ) | $ | (0.01 | ) | $ | 0.01 | $ | (0.78 | ) | |||||
|
Weighted
average shares used in per share:
|
||||||||||||||||
|
Basic
|
13,725 | 13,736 | 13,742 | 14,160 | ||||||||||||
|
Diluted
|
13,725 | 13,736 | 13,986 | 14,160 | ||||||||||||
41
Liquidity
and capital resources
We had
working capital of $9.3 million as of December 31, 2009 compared to working
capital of $14.1 million as of December 31, 2008. We had cash
balances of $5.3 million and $8.9 million, respectively, as of December 31, 2009
and December 31, 2008. The decrease in cash balances is primarily
related to the decrease in accounts payable and the principal payments on notes
payable and debt, partially offset by a decrease in accounts receivable and
inventory.
The
following table shows information about our cash flows and liquidity positions
during the twelve months ended December 31, 2009 and 2008. You should read this
table and the discussion that follows in conjunction with our consolidated
statements of cash flows contained in “Item 8. Financial Statements” of this
report.
|
Year
ended December 31,
|
||||||||
|
2009
|
2008
|
|||||||
|
Net
cash provided by operating activities
|
$ | 5,089 | $ | 8,359 | ||||
|
Net
cash used in investing activities
|
(2,393 | ) | (4,053 | ) | ||||
|
Net
cash used in financing activities
|
(6,315 | ) | (2,812 | ) | ||||
|
Effect
of exchange differences on cash
|
8 | (2 | ) | |||||
|
Net
increase (decrease) in cash and cash equivalents
|
$ | (3,611 | ) | $ | 1,492 | |||
We
provided cash from operating activities totaling $5.1 million for the year ended
December 31, 2009 compared to $8.4 million for the year ended December 31,
2008. The decrease in cash provided by operating activities during
2009 was primarily due the decrease in accounts payable and other current
liabilities, partially offset by the decrease in accounts receivable and
inventory.
We used
cash in investing activities totaling $2.4 million for the year ended December
31, 2009 compared to $4.1 million for the year ended December 31,
2008. The decrease in cash used in investing activities during
2009 was primarily due to the payment for the acquisition of Orbit One
Communications, Inc. of $1.8 million during 2008.
We used
cash in financing activities totaling $6.3 million for the year ended December
31, 2009 compared to $2.8 million for the year ended December 31,
2008. The increase in cash used in financing activities during 2009
was primarily due to the principal payments on notes payable and debt of $6.2
million during 2009.
Our
business has traditionally not been capital intensive; accordingly, capital
expenditures have not been material. To date, we have funded all
capital expenditures from working capital, capital leases and other long-term
obligations.
As of
December 31, 2009, the Company had $500,000 outstanding in notes payable, which
was repaid in full during January 2010. There are no covenants
associated with this debt.
During
2009, we incurred approximately $1.7 million in legal expenses related to our
litigation with Orbit One Communications, Inc. (see Item 3 – Legal
Proceedings). For 2010, our expectation of legal fees related to this
matter may be significant.
42
We
believe that our existing cash and cash equivalents together with expected cash
generated from operations will be sufficient to meet our operating requirements
through at least December 31, 2010. This belief could be affected by
future results that differ from expectations or a material adverse change in our
operating business.
Contractual
Obligations
The table
below sets forth our contractual obligations at December 31,
2009. Additional details regarding these obligations are provided in
the notes to our consolidated financial statements.
|
(in
thousands)
|
||||||||||||||||||||
|
Payments
due by period
|
||||||||||||||||||||
|
Total
|
Less
than 1 Year
|
1 -
3 Years
|
3 -
5 Years
|
More
than 5 Years
|
||||||||||||||||
|
Debt(1)
|
$ | 500 | $ | 500 | $ | - | - | - | ||||||||||||
|
Capital
lease obligations(2)
|
30 | 24 | 6 | - | - | |||||||||||||||
|
Operating
lease obligations(3)
|
2,404 | 952 | 1,452 | - | - | |||||||||||||||
|
Total(4)
|
$ | 2,934 | $ | 1,476 | $ | 1,458 | $ | - | $ | - | ||||||||||
|
(1)
|
Long-term
debt includes estimated interest. Interest rates used on the
debt outstanding is fixed at 9.75%. See Note J to the
consolidated financial statements contained in this report for further
information.
|
|
(2)
|
Amounts
represent future minimum lease payments under non-cancelable capital
leases for computer equipment. The value of the computer
equipment recorded in property and equipment at the inception of the
leases was $30,000.
|
|
(3)
|
Amounts
represent future minimum rental payments under non-cancelable operating
leases for our facilities.
|
|
(4)
|
Liabilities
of approximately $476,000 related to ASC Subtopic 740-10, Income Taxes, (Formerly
FASB Interpretation No. 48, an interpretation of FASB Statement No. 109,
Accounting for
Uncertainty in Income Taxes) have not been included in the table
above because we are uncertain as to if or when such amounts may be
settled. See Note A to the consolidated financial statements contained in
this report for further
information.
|
Off-Balance
Sheet Arrangements
As of
December 31, 2009, we did not have any off-balance sheet arrangements, as
defined in Item 303(a)(4)(ii) of SEC Regulation S-K.
Recent
Accounting Pronouncements
For
information with respect to new accounting pronouncements and the impact of
these pronouncements on our consolidated financial statements, see Note 22 of
the Notes to Consolidated Financial Statements.
Effect
of Inflation
Inflation
has not been a material factor affecting our business. In recent
years the cost of electronic components has remained relatively stable, due to
competitive pressures within the industry, which has enabled us to contain our
hardware costs. Our general operating expenses, such as salaries,
employee benefits, and facilities costs are subject to normal inflationary
pressures, but to date inflation has not had a material effect on our operating
results.
43
Item 7A. Quantitative and Qualitative Disclosures about Market
Risk.
The
market risk in our financial instruments represents the potential loss arising
from adverse changes in financial rates. We are exposed to market risk in the
area of interest rates. These exposures are directly related to our normal
funding and investing activities.
Substantially
all of our debt as of December 31, 2009 is at fixed rates. The fair market
value of long-term fixed interest rate debt is subject to interest rate risk.
Generally, the fair market value of fixed interest rate debt will increase as
interest rates fall and decrease as interest rates rise. Fair market values are
determined based on estimates made by investment bankers. For fixed rate debt,
interest rate changes do not impact book value, operations, or cash
flows.
Foreign
Currency
Our
functional and reporting currency is the U.S. Dollar. Fluctuations in foreign
currency exchange rates have not, and are not expected to have a material impact
on our results of operations or liquidity.
44
ITEM 8. FINANCIAL STATEMENTS AND SUPPLEMENTARY
DATA
INDEX
TO CONSOLIDATED FINANCIAL STATEMENTS
|
Page
|
|
|
Consolidated
Balance Sheets as of December 31, 2009 and 2008
|
46
|
|
Consolidated
Statements of Operations and Comprehensive Income (Loss) for the Years
ended December 31, 2009, 2008 and 2007
|
47
|
|
Consolidated
Statements of Shareholders’ Equity for the Years ended December 31, 2009,
2008 and 2007
|
48
|
|
Consolidated
Statements of Cash Flows for the Years ended December 31, 2009, 2008 and
2007
|
50
|
|
Notes
to Consolidated Financial Statements
|
52
|
|
Report
of Independent Registered Public Accounting Firm on the Consolidated
Financial Statements
|
78
|
45
|
Numerex
Corp. and Subsidiaries
|
||||||||
|
Consolidated
Balance Sheets
|
||||||||
|
(In
thousands, except share information)
|
||||||||
|
December
31,
|
December
31,
|
|||||||
|
2009
|
2008
|
|||||||
|
ASSETS
|
||||||||
|
CURRENT
ASSETS
|
||||||||
|
Cash
and cash equivalents
|
$ | 5,306 | $ | 8,917 | ||||
|
Accounts
receivable, less allowance for doubtful accounts of $548 at December 31,
2009 and $1,010 at December 31, 2008
|
6,341 | 9,159 | ||||||
|
Inventory
|
6,290 | 8,506 | ||||||
|
Prepaid
expenses and other current assets
|
1,569 | 1,508 | ||||||
|
TOTAL
CURRENT ASSETS
|
19,506 | 28,090 | ||||||
|
Property
and equipment, net
|
1,603 | 1,765 | ||||||
|
Goodwill,
net
|
23,787 | 23,771 | ||||||
|
Other
intangibles, net
|
4,985 | 5,796 | ||||||
|
Software,
net
|
2,747 | 2,796 | ||||||
|
Other
assets
|
119 | 288 | ||||||
|
TOTAL
ASSETS
|
$ | 52,747 | $ | 62,506 | ||||
|
LIABILITIES
AND SHAREHOLDERS’ EQUITY
|
||||||||
|
CURRENT
LIABILITIES
|
||||||||
|
Accounts
payable
|
$ | 5,888 | $ | 7,289 | ||||
|
Other
current liabilities
|
2,555 | 2,943 | ||||||
|
Notes
payable, current
|
493 | 2,568 | ||||||
|
Deferred
revenues
|
1,261 | 1,134 | ||||||
|
Obligations
under capital leases, current portion
|
24 | 29 | ||||||
|
TOTAL
CURRENT LIABILITIES
|
10,221 | 13,963 | ||||||
|
LONG
TERM LIABILITIES
|
||||||||
|
Obligations
under capital leases and other long term liabilities
|
335 | 472 | ||||||
|
Deferred
income tax
|
154 | 48 | ||||||
|
Notes
payable
|
- | 7,629 | ||||||
|
TOTAL
LONG TERM LIABILITIES
|
489 | 8,149 | ||||||
|
COMMITMENTS
AND CONTINGENCIES (Note M)
|
||||||||
|
SHAREHOLDERS’
EQUITY
|
||||||||
|
Preferred
stock - no par value; authorized 3,000,000; none issued
|
- | - | ||||||
|
Class
A common stock – no par value; authorized 30,000,000; issued 16,307,963
shares at December 31, 2009 and 15,349,327 shares at December 31, 2008;
outstanding 15,082,154 shares at December 31, 2009 and 14,163,518 shares
at December 31, 2008
|
57,430 | 50,801 | ||||||
|
Additional
paid-in-capital
|
5,582 | 4,587 | ||||||
|
Treasury
stock, at cost, 1,225,809 shares at December 31, 2009 and 1,185,809 shares
December 31, 2008
|
(5,213 | ) | (5,053 | ) | ||||
|
Class
B common stock – no par value; authorized 5,000,000; none
issued
|
- | - | ||||||
|
Accumulated
other comprehensive loss
|
- | (8 | ) | |||||
|
Retained
deficit
|
(15,762 | ) | (9,933 | ) | ||||
|
TOTAL
SHAREHOLDERS' EQUITY
|
42,037 | 40,394 | ||||||
|
TOTAL
LIABILITIES AND SHAREHOLDERS’ EQUITY
|
$ | 52,747 | $ | 62,506 | ||||
The
accompanying notes are an integral part of these financial
statements.
46
|
Numerex
Corp. and Subsidiaries
|
||||||||||||
|
Consolidated
Statements of Operations and Comprehensive Income (Loss)
|
||||||||||||
|
(In
thousands, except per share data)
|
||||||||||||
|
For
the Years
|
||||||||||||
|
Ended
December 31,
|
||||||||||||
|
2009
|
2008
|
2007
|
||||||||||
|
Hardware
|
$ | 20,282 | $ | 43,048 | $ | 43,408 | ||||||
|
Service
|
30,554 | 29,271 | 24,596 | |||||||||
|
Total
net sales
|
50,836 | 72,319 | 68,004 | |||||||||
|
Cost
of hardware sales, exclusive of depreciation and
amortization
|
17,319 | 37,469 | 38,491 | |||||||||
|
Cost
of services, exclusive of depreciation and amortization
|
11,169 | 9,430 | 6,106 | |||||||||
|
Gross
profit
|
22,348 | 25,420 | 23,407 | |||||||||
|
Selling,
general, and administrative expenses
|
17,649 | 20,113 | 16,320 | |||||||||
|
Engineering
and development expenses
|
2,421 | 2,198 | 1,459 | |||||||||
|
Bad
debt expense
|
536 | 1,102 | 635 | |||||||||
|
Depreciation
and amortization
|
3,398 | 3,107 | 2,493 | |||||||||
|
Goodwill
and long-lived asset impairment
|
- | 5,289 | - | |||||||||
|
Operating
earnings (loss)
|
(1,656 | ) | (6,389 | ) | 2,500 | |||||||
|
Costs
of early extinguishment of debt
|
(2,936 | ) | - | - | ||||||||
|
Interest
expense
|
(1,058 | ) | (1,665 | ) | (1,940 | ) | ||||||
|
Interest
income
|
63 | 134 | 575 | |||||||||
|
Net
other income and (expense)
|
43 | (8 | ) | 33 | ||||||||
|
Earnings
(loss) before income taxes
|
(5,544 | ) | (7,928 | ) | 1,168 | |||||||
|
Provision
for income taxes
|
285 | 3,047 | 728 | |||||||||
|
Net
earnings (loss)
|
(5,829 | ) | (10,975 | ) | 440 | |||||||
|
Other
comprehensive income (loss), net of income tax:
|
||||||||||||
|
Foreign
currency translation adjustment
|
8 | (2 | ) | (8 | ) | |||||||
|
Comprehensive
income (loss)
|
$ | (5,821 | ) | $ | (10,977 | ) | $ | 432 | ||||
|
Basic
earnings (loss) per share
|
$ | (0.40 | ) | $ | (0.78 | ) | $ | 0.03 | ||||
|
Diluted
earnings (loss) per share
|
$ | (0.40 | ) | $ | (0.78 | ) | $ | 0.03 | ||||
|
Weighted
average common shares used in per share calculation
|
||||||||||||
|
Basic
|
14,409 | 14,144 | 13,137 | |||||||||
|
Diluted
|
14,409 | 14,144 | 13,700 | |||||||||
The
accompanying notes are an integral part of these financial
statements.
47
|
Consolidated
Statement Of Shareholders' Equity
|
||||||||||||||||||||||||||||
|
Common
Shares
|
Accumulated
Other
|
|||||||||||||||||||||||||||
|
Additional
paid
|
Treasury
|
Comprehensive
|
Retained
|
|||||||||||||||||||||||||
|
DESCRIPTION:
|
Number
|
$
Amount
|
in
capital
|
Stock
|
Income
(loss)
|
Earnings
(Deficit)
|
TOTAL
|
|||||||||||||||||||||
|
Balance
@ 12/31/06
|
14,145 | $ | 43,133 | $ | 2,486 | $ | (5,053 | ) | $ | 2 | $ | 852 | $ | 41,420 | ||||||||||||||
|
Adoption
of ASC 740-10-25 (previously FIN 48)
|
- | - | - | - | - | (250 | ) | (250 | ) | |||||||||||||||||||
|
Issuance
of shares under Directors Stock Plan
|
6 | 62 | - | - | - | - | 62 | |||||||||||||||||||||
|
Issuance
of shares in connection with employee stock option plan
|
134 | 569 | - | - | - | - | 569 | |||||||||||||||||||||
|
Issuance
of shares in connection with purchase of assets of Airdesk,
Inc.
|
100 | 1,018 | - | - | - | - | 1,018 | |||||||||||||||||||||
|
Issuance
of shares in connection with purchase of assets of Orbit One
Communications, Inc.
|
321 | 2,673 | - | - | - | - | 2,673 | |||||||||||||||||||||
|
Translation
adjustment
|
- | - | - | - | (8 | ) | - | (8 | ) | |||||||||||||||||||
|
Share
based compensation
|
- | - | 941 | - | - | - | 941 | |||||||||||||||||||||
|
Net
earnings
|
- | - | - | - | - | 440 | 440 | |||||||||||||||||||||
|
Balance
@ 12/31/07
|
14,706 | 47,455 | $ | 3,427 | $ | (5,053 | ) | $ | (6 | ) | $ | 1,042 | $ | 46,865 | ||||||||||||||
|
Issuance
of shares under Directors Stock Plan
|
12 | 70 | - | - | - | - | 70 | |||||||||||||||||||||
|
Issuance
of shares in connection with employee stock option plan
|
27 | 124 | - | - | - | - | 124 | |||||||||||||||||||||
|
Issuance
of shares in connection with purchase of assets of Airdesk,
Inc.
|
200 | 1,706 | - | - | - | - | 1,706 | |||||||||||||||||||||
|
Issuance
of shares in connection with purchase of Ublip, Inc.
|
405 | 1,446 | - | 1,446 | ||||||||||||||||||||||||
|
Translation
adjustment
|
- | - | - | - | (2 | ) | - | (2 | ) | |||||||||||||||||||
|
Share
based compensation
|
- | - | 1,160 | - | - | - | 1,160 | |||||||||||||||||||||
|
Net
loss
|
- | - | - | - | - | (10,975 | ) | (10,975 | ) | |||||||||||||||||||
|
Balance
@ 12/31/08
|
15,350 | $ | 50,801 | $ | 4,587 | $ | (5,053 | ) | $ | (8 | ) | $ | (9,933 | ) | $ | 40,394 | ||||||||||||
48
|
Issuance
of shares under Directors Stock Plan
|
25 | 103 | - | - | - | - | 103 | |||||||||||||||||||||
|
Issuance
of shares in connection with employee stock option plan
|
44 | 41 | - | - | - | - | 41 | |||||||||||||||||||||
|
Issuance
of shares in lieu of debt payment
|
889 | 6,485 | - | - | - | - | 6,485 | |||||||||||||||||||||
|
Translation
adjustment
|
- | - | - | - | 8 | - | 8 | |||||||||||||||||||||
|
Share
based compensation
|
- | - | 995 | - | - | - | 995 | |||||||||||||||||||||
|
Purchase
of treasury shares
|
- | - | - | (160 | ) | - | - | (160 | ) | |||||||||||||||||||
|
Net
loss
|
- | - | - | - | - | (5,829 | ) | (5,829 | ) | |||||||||||||||||||
|
Balance
@ 12/31/09
|
16,308 | $ | 57,430 | $ | 5,582 | $ | (5,213 | ) | $ | - | $ | (15,762 | ) | $ | 42,037 |
The
accompanying notes are an integral part of these financial
statements.
49
|
CONSOLIDATED
STATEMENTS OF CASH FLOWS
|
||||||||||||
|
(In
thousands)
|
||||||||||||
|
For
the years ended December 31,
|
||||||||||||
|
2009
|
2008
|
2007
|
||||||||||
|
Cash
flows from operating activities:
|
||||||||||||
|
Net
(loss) earnings
|
$ | (5,829 | ) | $ | (10,975 | ) | $ | 440 | ||||
|
Adjustments
to reconcile net (loss) earnings to net cash provided by (used in)
operating activities:
|
||||||||||||
|
Depreciation
|
941 | 824 | 699 | |||||||||
|
Amortization
|
2,457 | 2,283 | 1,794 | |||||||||
|
Allowance
for Doubtful Accounts
|
536 | 1,102 | 635 | |||||||||
|
Inventory
Reserves
|
110 | 266 | (13 | ) | ||||||||
|
Non-cash
interest expense
|
3,297 | 485 | 290 | |||||||||
|
Stock
option compensation expense
|
995 | 1,160 | 941 | |||||||||
|
Stock
issued in lieu of directors fees
|
104 | 70 | 62 | |||||||||
|
Impairment
of goodwill
|
- | 3,986 | - | |||||||||
|
Impairment
of long-lived assets
|
- | 1,303 | - | |||||||||
|
Deferred
income taxes
|
106 | 2,776 | 528 | |||||||||
|
Changes
in assets and liabilities which provided (used) cash:
|
||||||||||||
|
Accounts
and notes receivable
|
2,168 | 6,035 | (5,176 | ) | ||||||||
|
Inventory
|
2,106 | 1,357 | (6,129 | ) | ||||||||
|
Prepaid
expenses
|
(138 | ) | 417 | 411 | ||||||||
|
Other
assets
|
12 | 42 | 480 | |||||||||
|
Accounts
payable
|
(1,403 | ) | (3,133 | ) | 2,586 | |||||||
|
Other
liabilities
|
(501 | ) | 585 | 377 | ||||||||
|
Deferred
revenues
|
127 | (235 | ) | (492 | ) | |||||||
|
Income
taxes
|
1 | 11 | (738 | ) | ||||||||
|
Net
cash provided by (used in) operating activities:
|
5,089 | 8,359 | (3,305 | ) | ||||||||
|
Cash
flows from investing activities:
|
||||||||||||
|
Purchase
of property and equipment
|
(779 | ) | (453 | ) | (613 | ) | ||||||
|
Purchase
of intangible assets, software and other assets
|
(1,614 | ) | (1,544 | ) | (1,461 | ) | ||||||
|
Purchase
of short-term investment
|
- | - | (8,051 | ) | ||||||||
|
Sale
of short-term investment, net
|
- | - | 8,051 | |||||||||
|
Purchase
of Airdesk, Inc. assets
|
- | - | - | |||||||||
|
Purchase
of Orbit One Communications, Inc. assets
|
- | (1,807 | ) | (6,625 | ) | |||||||
|
Purchase
of Ublip, Inc. assets
|
- | (249 | ) | - | ||||||||
|
Net
cash used in investing activities
|
(2,393 | ) | (4,053 | ) | (8,699 | ) | ||||||
|
Cash
flows from financing activities:
|
||||||||||||
|
Proceeds
from exercise of common stock options
|
41 | 124 | 569 | |||||||||
|
Purchase
of treasury stock
|
(160 | ) | - | - | ||||||||
|
Principal
payments on capital lease obligations
|
(29 | ) | (79 | ) | (87 | ) | ||||||
|
Principal
payments on notes payable and debt
|
(6,167 | ) | (2,857 | ) | (1,429 | ) | ||||||
|
Net
cash used in financing activities:
|
(6,315 | ) | (2,812 | ) | (947 | ) | ||||||
|
Effect
of exchange differences on cash
|
8 | (2 | ) | (8 | ) | |||||||
|
Net
increase (decrease) in cash and cash equivalents
|
(3,611 | ) | 1,492 | (12,959 | ) | |||||||
|
Cash
and cash equivalents at beginning of year
|
8,917 | 7,425 | 20,384 | |||||||||
|
Cash
and cash equivalents at end of year
|
$ | 5,306 | $ | 8,917 | $ | 7,425 | ||||||
50
|
Supplemental Disclosures of Cash Flow
Information
|
||||||||||||
|
Cash
payments for:
|
||||||||||||
|
Interest
|
$ | 697 | $ | 1,196 | $ | 1,444 | ||||||
|
Income
taxes
|
$ | 89 | $ | 233 | $ | 17 | ||||||
|
Disclosure
of non-cash financing activities:
|
||||||||||||
|
Non-cash
interest expense
|
$ | 860 | $ | 485 | $ | 290 | ||||||
|
Non-cash
inducement cost of extinguishment of debt
|
$ | 2,437 | $ | - | $ | - | ||||||
|
Non-cash
financing payments
|
$ | 4,048 | $ | - | $ | - | ||||||
|
Non-cash
leasehold improvement
|
$ | - | $ | 127 | $ | 140 | ||||||
|
Disclosure
of non-cash investing activities:
|
||||||||||||
|
Common
stock issued for the purchase of assets of Airdesk, Inc.
|
$ | - | $ | 1,706 | $ | 1,018 | ||||||
|
Common
stock issued for the purchase of assets of Orbit One Communications,
Inc.
|
$ | - | $ | - | $ | 2,673 | ||||||
|
Common
stock issued for the purchase of assets of Ublip, Inc.
|
$ | - | $ | 1,446 | $ | - | ||||||
The
accompanying notes are an integral part of these financial
statements.
51
NUMEREX
CORP. AND SUBSIDIARIES
NOTES
TO CONSOLIDATED FINANCIAL STATEMENTS
Years
ended December 31, 2009, 2008 and 2007
NOTE
A - SUMMARY OF SIGNIFICANT ACCOUNTING POLICIES
A summary
of the significant accounting policies consistently applied in the preparation
of the accompanying financial statements follows:
1. Nature of
Business
Numerex
Corp. (NASDAQ: NMRX) is the single source machine-to-machine (M2M) product and
service provider to some of the world's largest organizations delivering the
foundational components of device, network, and application, used by its
customers in the development of their M2M solutions. Customers typically
subscribe to Numerex network and application services that are delivered through
its hosted platforms. The Company's offerings and expertise enable its customers
to efficiently build reliable and secure solutions that are used to monitor and
manage assets remotely whenever and wherever needed, while simplifying and
speeding up development and deployment. Numerex DNA(TM) offerings include
hardware Devices, Network services, and
software Applications
that are delivered through its Numerex FAST(TM) (Foundation Application
Software Technology) platform. Numerex is the first M2M service provider in
North America to carry the ISO 27001 information security certification.
"Machines Trust Us®" represents the Company's focus on M2M data security,
service reliability, and round-the-clock support of its customers' M2M
solutions.
2. Principles of
Consolidation
The
consolidated financial statements include the results of operations and
financial position of Numerex and its wholly owned
subsidiaries. Intercompany accounts and transactions have been
eliminated in consolidation.
The
Company’s revenue is generated from three sources:
· the supply of
hardware, under non recurring agreements,
· the provision
of services,
· the provision
of data transportation services, under recurring or multi-year contractually
based agreements.
Revenue
is recognized when persuasive evidence of an agreement exists, the hardware or
service has been delivered, fees and prices are fixed and determinable, and
collectability is probable and when all other significant obligations have been
fulfilled.
52
The
Company recognizes revenue from hardware sales at the time of shipment and
passage of title. Provision for rebates, promotions, product returns and
discounts to customers is recorded as a reduction in revenue in the same period
that the revenue is recognized. The Company offers customers the right to return
hardware that does not function properly within a limited time after delivery.
The Company continuously monitors and tracks such hardware returns and records a
provision for the estimated amount of such future returns, based on historical
experience and any notification received of pending returns. While such returns
have historically been within expectations and the provisions established, the
Company cannot guarantee that it will continue to experience the same return
rates that it has experienced in the past. Any significant increase in hardware
failure rates and the resulting credit returns could have a material adverse
impact on operating results for the period or periods in which such returns
materialize. Numerex recognizes revenue from the provision of
services at the time of the completion, delivery or performance of the service.
In the case of revenue derived from maintenance services the Company recognizes
revenue ratably over the contract term. In certain instances the Company may,
under an appropriate agreement, advance charge for the service to be provided.
In these instances the Company recognizes the advance charge as deferred revenue
(classified as a liability) and releases the revenue ratably over future periods
in accordance with the contract term as the service is completed, delivered or
performed. The Company’s revenues in the consolidated statement of
operations are net of sales taxes.
The
Company recognizes revenue from the provision of data transportation services
when it performs the services or processes transactions in accordance with
contractual performance standards. Revenue is earned monthly on the basis of the
contracted monthly fee and an excess message fee charge, should it apply, that
is volume based. In certain instances the Company may, under an
appropriate agreement, advance charge for the data transport service to be
provided. In these instances the Company recognizes the advance charge (even if
nonrefundable) as deferred revenue (classified as a liability) and releases the
revenue over future periods in accordance with the contract term as the data
transport service is delivered or performed.
The
Company’s arrangements do not generally include acceptance clauses. However, for
those arrangements that include multiple deliverables, we first determine
whether each service, or deliverable, meets the separation criteria of
counterparty is in accordance with ASC Subtopic 985-605 (American Institute of
Certified Public Accountants (“AICPA”) Statement of Position (“SOP”) 97-2, Software Revenue
Recognition),
ASC Subtopic 605-25 (Emerging Issues Task
Force (“EITF”) Issue No. 00-21, Revenue Arrangements with Multiple
Deliverables), and ASC Section 605-10-S99 (Staff Accounting Bulletin
(“SAB”) No. 104, Revenue
Recognition). Specifically, if we enter into contracts for the sale of
services and hardware, we evaluate whether the services are essential to the
functionality of the hardware and whether there is objective fair value evidence
for each deliverable in the transaction. If we conclude the services to be
provided are not essential to the functionality of the hardware and we can
determine objective fair value evidence for each deliverable of the transaction,
then we account for each deliverable in the transaction separately, based on the
relevant revenue recognition policies. Generally, all deliverables of our
multiple element arrangements meet these criteria. We may provide multiple
services under the terms of an arrangement and are required to assess whether
one or more units of accounting are present. Service fees are
typically accounted for as one unit of accounting as fair value evidence for
individual tasks or milestones is not available. We follow the
guidelines discussed above in determining revenues; however, certain judgments
and estimates are made and used to determine revenues recognized in any
accounting period. If estimates are revised, material differences may result in
the amount and timing of revenues recognized for a given period.
4. Cash and Cash
Equivalents
Cash
equivalents consist of overnight repurchase agreements, money market deposit
accounts and amounts on deposit in a foreign bank. Cash of $42,000
and $47,000 at December 31, 2009 and 2008, respectively was held in our foreign
bank accounts.
53
5. Intangible
Assets
Intangible
assets consist of
developed software, patents and acquired intellectual property, customer
relationships and goodwill. These assets, except for goodwill, are
amortized over their expected useful lives. Developed software is
amortized using the straight-line method over 3 to 5 years. Patents
and acquired intellectual property are amortized using the straight-line method
over 7 to 16 years. Customer relationships are amortized using the
straight-line method over 4 years.
We
perform an impairment test for goodwill at least annually. This test
involves comparing the fair value of each reporting unit as a whole to its
carrying value including goodwill. If the reporting unit’s fair value
exceeds its carrying value, goodwill is not impaired. If, however,
the carrying value of the reporting unit exceeds its fair value, a second step
of the impairment test is required. The second test involves comparing an
estimate of the implied fair value of goodwill to its carrying
amount. If the carrying amount of goodwill exceeds the implied value,
the goodwill is impaired and is written down to the implied fair
value. The implied fair value of goodwill is the excess of the fair
value of the reporting unit as a whole, over the fair values that would be
assigned to its assets and liabilities in a purchase business
combination.
During
2008, we recorded an impairment of goodwill of $4.0 million. See Note
G (Intangible Assets) for additional information.
We
capitalize software development costs when project technological feasibility is
established and conclude capitalization when the hardware is ready for
release. Software development costs incurred prior to the
establishment of technological feasibility are expensed as
incurred.
6.
Property and
Equipment
Depreciation
is provided in amounts sufficient to relate the cost of depreciable assets to
operations over their estimated service lives. Leased property under
capital leases is amortized over the lives of the respective leases or over the
service lives of the assets for those leases, whichever is
shorter. Depreciation for property and equipment is calculated using
the straight-line method over the following estimated lives:
· Short-term
leasehold improvements over the term of the
lease 3-10
years
· Plant and
machinery 4-10
years
· Equipment,
fixtures and
fittings 3-10
years
7. Impairment of Long-lived
Assets
Long-lived
assets, such as property and equipment, and purchased intangibles subject to
amortization, are reviewed for impairment whenever events or changes in
circumstances indicate that the carrying amount of an asset may not be
recoverable. Recoverability of assets to be held and used is measured
by a comparison of the carrying amount of an asset to estimated undiscounted
future cash flows expected to be generated by the asset. If the
carrying amount of an asset exceeds its estimated future cash flows, an
impairment charge is recognized by the amount by which the carrying amount of
the asset exceeds the fair value of the asset. Assets to be disposed
of by sale would be separately presented in the consolidated balance sheet and
reported at the lower of the carrying amount or fair value less costs to sell,
and are no longer depreciated. The assets and liabilities of a
disposed group classified as held for sale would be presented separately in the
appropriate asset and liability sections of the consolidated balance
sheet.
During
2008, we recorded an impairment of long-lived assets of $1.3
million. See Note G (Intangible Assets) for additional
information.
54
8. Income
Taxes
The
Company accounts for income taxes using the asset and liability method. Under
this method, deferred tax assets and liabilities are recognized for the future
tax consequences attributable to the differences between the financial statement
carrying amounts of existing assets and liabilities and their respective tax
basis. Deferred tax assets and liabilities are measured using the enacted tax
rates applied to taxable income. The effect on deferred tax assets and
liabilities of a change in tax rates is recognized in income in the period that
includes the enactment date. A valuation allowance is provided for deferred tax
assets when it is more likely than not that the asset will not be
realized.
In July
2006, the FASB issued guidance which clarifies the accounting for income taxes
by prescribing a minimum probability threshold that a tax position must meet
before a financial statement benefit is recognized. The minimum threshold is
defined as a tax position that is more likely than not to be sustained upon
examination by the applicable taxing authority, including resolution of any
related appeals or litigation processes, based on the technical merits of the
position. The tax benefit to be recognized is measured as the largest amount of
benefit that is greater than fifty percent likely of being realized upon
ultimate settlement. The Company adopted the guidance on income taxes on January
1, 2007. The Company recognizes potential accrued interest and
penalties related to unrecognized tax benefits within operations as income tax
expense. The cumulative effect of applying this guidance on income taxes has
been reported as an adjustment to the opening balance of retained earnings as of
January 1, 2007.
Applying
this guidance to all tax positions resulted in the Company recording a liability
for unrecognized tax benefits of $250,000 inclusive of interest and
penalties of $24,250 and $11,700, respectively. The $250,000 unrecognized
benefit also caused a corresponding decrease to retained earnings as of January
1, 2007. The Company has made an accounting policy election to treat interest
and penalties as tax expense. The Company has recorded a net decrease to
the liability for unrecognized tax benefits for the year ended December 31, 2009
of approximately $2,000. This amount is made up of an accrual of interest and
penalties related to state tax exposure in prior years of approximately $33,000,
and approximately $35,000 of tax benefit recognized on the settlement of certain
state tax exposure. The Company's total unrecognized tax benefits as
of December 31, 2009 were approximately $476,000 inclusive of interest and
penalties of $155,000. The Company anticipates a decrease to the balance of
total unrecognized tax benefits within the next twelve months of approximately
$67,000. If the Company were to recognize these tax benefits, all of the benefit
would impact the effective tax rate.
The
following table summarizes the activity related to the company's unrecognized
tax benefits, net of federal benefit, excluding interest and penalties (in
thousands):
|
(in
thousands)
|
2009
|
2008
|
||||||
|
Balance
at January 1
|
$ | 345 | $ | 297 | ||||
|
Increases
as a result of positions taken during prior periods
|
3 | - | ||||||
|
Decreases
as a result of positions taken during prior periods
|
(27 | ) | (5 | ) | ||||
|
Increases
as a result of positions taken during current periods
|
- | 53 | ||||||
|
Decreases
as a result of positions taken during current periods
|
- | - | ||||||
|
Balance
at December 31
|
$ | 321 | $ | 345 | ||||
During
2009, the company repaid an aggregate of $5.7 million under our outstanding
convertible promissory notes. Under generally accepted accounted
principles, specifically, ASC 470-20 (formerly FAS 84), an adjustment to the
conversion price of the convertible note should be accounted for as an
inducement to convert the note, even though there was no economic incentive
offered. The expense associated with the inducement is approximately $2.4
million and is not deductible for tax purposes. The permanent impact of
the non-cash debt charge is approximately $829,000.
55
9. Inventory
Inventories,
valued at the lower of cost or market, consist of i) M2M Modems &
Modules, ii) Security devices and iii) M2M Modems via Satellite. Cost is
generally determined on the first-in, first-out (“FIFO”) basis. We
include raw material freight costs to manufacturers in inventory and these costs
are recognized in cost of sales when the product is sold. Lower of
cost or market value of inventory is determined at the operating unit level and
evaluated periodically. Estimates for obsolescence or slow moving inventory are
maintained based on current economic conditions, historical sales quantities and
patterns and, in some cases, the specific risk of loss on specifically
identified inventories. Such inventories are recorded at estimated realizable
value net of the costs of disposal.
10. Accounts Receivable and
Allowance for Doubtful Accounts
Trade
receivables are stated at gross invoiced amount less discounts, other allowances
and provision for uncollectible accounts. Credit is extended to
customers based on an evaluation of a customer’s financial condition and,
generally, collateral is not required. Accounts receivable are generally due
within 30-90 days and are stated at amounts due from customers net of an
allowance for doubtful accounts. We maintain an allowance for estimated losses
resulting from the inability of our customers to make required
payments. The allowance for doubtful accounts is based principally
upon specifically identified amounts where collection is deemed doubtful.
Additional non-specific allowances are recorded based on historical experience
and management’s assessment of a variety of factors related to the general
financial condition and business prospects of our customer base. Management
reviews the collectability of individual accounts and assesses the adequacy of
the allowance for doubtful accounts quarterly. Account balances are
charged off against the allowance after all means of collection have been
exhausted and the potential for recovery is considered remote.
11. Notes
Receivable
Notes
receivable are included in prepaid expenses and other current assets on the
accompanying consolidated balance sheets. The notes are payable
in installments. The Company recognizes interest on the interest-bearing
notes only when interest payments are received. For purposes of valuation,
the collectability of notes receivable is evaluated separately to determine if
the notes are impaired. Notes receivable are determined to be
impaired after all means of collection have been exhausted and the potential for
recovery is considered remote. At December 31, 2009 and 2008, all of our
notes receivable were determined to be collectible and current.
12. Debt Issuance
Costs
Debt
issuance costs are included in other assets on the accompanying consolidated
balance sheets and are amortized to interest expense over the terms of the
related debt.
13. Warrants
The fair
value of the warrants associated with notes payable are calculated using the
Black-Scholes fair value pricing model. The fair value is amortized on a
straight-line basis over the term of the related note. The warrants
are included in the balance sheet as a reduction to the note
payable.
56
14. Fair Value of Financial
Instruments
The
hierarchy below lists three levels of fair value, which prioritizes the inputs
used in the valuation methodologies, as follows:
Level 1—Valuations based
on quoted prices for identical assets and liabilities in active
markets.
Level 2—Valuations based
on observable inputs other than quoted prices included in Level 1, such as
quoted prices for similar assets and liabilities in active markets, quoted
prices for identical or similar assets and liabilities in markets that are not
active, or other inputs that are observable or can be corroborated by observable
market data.
Level 3—Valuations based
on unobservable inputs reflecting our own assumptions, consistent with
reasonably available assumptions made by other market participants. These
valuations require significant judgment.
The
carrying amount of cash and cash equivalents, receivables, accounts payable and
accrued expenses approximates fair value because of their short
maturity.
15. Use of
Estimates
In
preparing our financial statements in conformity with accounting principles
generally accepted in the United States of America, management is required to
make estimates and assumptions that affect the reported amounts of assets and
liabilities, the disclosure of contingent assets and liabilities at the date of
the financial statements, and the reported amounts of revenues and expenses
during the reporting period. Actual results could differ from those
estimates.
16. Concentration of Credit
Risk
Financial
instruments that potentially subject us to a concentration of credit risk are
primarily cash investments and accounts receivable. We maintain our
cash and overnight investment balances in financial institutions, which at times
may exceed federally insured limits. We had cash balances in excess
of these limits of $5.0 million and $8.7 million at December 31, 2009 and 2008,
respectively. We have not experienced any losses in such accounts and
believe we are not exposed to any significant credit risk on cash and cash
equivalents. Concentration of credit risk with respect to accounts
receivable from customers is limited. We perform credit evaluations of
prospective customers and we evaluate our trade receivables
periodically. Our accounts receivable is at risk to the extent that
we may not be able to collect from some of our customers. See Note L
for more information.
17. Foreign Currency
Translation
The
assets and liabilities of our foreign operations are translated into U.S.
dollars at current exchange rates, and revenues and expenses are translated at
the ending exchange rate from the prior period which materially approximates the
average exchange rates for each period. Resulting translation adjustments are
reflected as other comprehensive income within shareholders’ equity. Transaction
gains and losses that arise from exchange rate fluctuations on transactions
denominated in a currency other than the functional currency are included in the
results of operations as incurred. Foreign operations are not
significant to the Company.
57
18.
Engineering and
Development
Engineering
and development expenses are charged to operations in the period in which they
are incurred. Engineering and development costs consist primarily of
salaries, and other personnel-related costs, bonuses, and third-party services.
For the years ended December 31, 2009, 2008 and 2007 engineering and development
costs amounted to $2.4 million, $2.2 million and $1.5 million,
respectively.
19. Share-Based
Compensation
We
measure and recognize compensation expense for all share-based payment awards
made to employees and directors. See Note K for additional
information.
20. Earnings (Loss) Per
Share
Basic net
earnings (loss) per common share available to common shareholders is based on
the weighted-average number of common shares outstanding excluding the dilutive
impact of common stock equivalents. For periods in which we have net
earnings, we base diluted net earnings per share on the weighted-average number
of common shares outstanding and dilutive potential common shares, such as
dilutive employee stock options.
21. Advertising
Expenses
Advertising
expenses are charged to operations in the period in which they are
incurred. For the years ended December 31, 2009, 2008 and 2007,
advertising costs were approximately $600,000, $905,000 and $526,000,
respectively.
22. Recent Accounting
Pronouncements
On
January 1, 2009, we adopted authoritative guidance issued by the Financial
Accounting Standards Board (“FASB”) on business combinations. The guidance
retains the fundamental requirements that the acquisition method of accounting
(previously referred to as the purchase method of accounting) be used for all
business combinations, but requires a number of changes, including changes in
the way assets and liabilities are recognized and measured as a result of
business combinations. It also requires the capitalization of in-process
research and development at fair value and requires the expensing of
acquisition-related costs as incurred. Adoption of the new guidance did not have
a material impact on our financial statements, as we did not have an acquisition
in the year ending December 31, 2009; however, we will apply this guidance to
business combinations as they are completed in the future.
On
January 1, 2009, we adopted the authoritative guidance issued by the FASB that
changes the accounting and reporting for non-controlling interests.
Non-controlling interests are to be reported as a component of equity separate
from the parent’s equity, and purchases or sales of equity interests that do not
result in a change in control are to be accounted for as equity transactions. In
addition, net income attributable to a non-controlling interest is to be
included in net income and, upon a loss of control, the interest sold, as well
as any interest retained, is to be recorded at fair value with any gain or loss
recognized in net income. Adoption of the new guidance did not have a material
impact on our financial statements.
On
January 1, 2009, we adopted the authoritative guidance issued by the FASB on
fair value measurement for nonfinancial assets and liabilities, except for items
that are recognized or disclosed at fair value in the financial statements on a
recurring basis (at least annually). Adoption of the new guidance did
not have a material impact on our financial statements.
58
On April
1, 2009, we adopted the authoritative guidance issued by the FASB on determining
fair value when the volume and level of activity for the asset or liability have
significantly decreased and identifying transactions that are not orderly, which
clarifies the objective and method of fair value measurement even when there has
been a significant decrease in market activity for the asset being measured.
Adoption of the new guidance did not have a material impact on our financial
statements.
On April
1, 2009, we adopted the authoritative guidance issued by the FASB on disclosures
of fair values of financial instruments, which requires the fair value for
certain financial instruments to be disclosed in the interim periods, as well as
in annual financial statements. Adoption did not have a material
impact on our financial statements.
On April
1, 2009, we adopted the authoritative guidance issued by the FASB on the
recognition and presentation of other-than-temporary impairments, which is
intended to bring greater consistency to the timing of impairment recognition
and provide greater clarity about the credit and noncredit components of debt
securities whose fair value is below amortized cost and that are not expected to
be sold. Increased disclosures regarding expected cash flows, credit
losses and an aging of securities with unrealized losses are also
required. Adoption of the new guidance did not have a material impact
on our financial statements.
On June
30, 2009, we adopted the authoritative guidance issued by the FASB related to
subsequent events, which establishes general standards of accounting for and
disclosure of events that occur after the balance sheet date but before
financial statements are issued or are available to be
issued. Adoption of the new guidance did not have a material impact
on our financial statements.
On
September 30, 2009, we adopted the FASB Accounting Standards Codification
(Codification). The Codification is the source of authoritative U.S.
GAAP recognized by the FASB to be applied by nongovernmental
agencies. Adoption of the new guidance did not have a material impact
on our financial statements.
RECENT
ACCOUNTING GUIDANCE NOT YET ADOPTED
In June
2009, the FASB issued authoritative guidance on the consolidation of variable
interest entities, which is effective for us beginning January 1, 2010. The
new guidance requires revised evaluations of whether entities represent variable
interest entities, ongoing assessments of control over such entities, and
additional disclosures for variable interests. We believe adoption of this new
guidance will not have a material impact on our financial
statements.
In
October 2009, the FASB issued amendments to the accounting and disclosure for
revenue recognition. These amendments, effective for fiscal years
beginning on or after June 15, 2010 (early adoption is permitted), modify the
criteria for recognizing revenue in multiple element arrangements and the scope
of what constitutes a non-software deliverable. We believe adoption
of this new guidance will not have a material impact on our financial
statements.
In
January 2010, the FASB issued guidance to amend the disclosure requirements
related to recurring and nonrecurring fair value measurements. The guidance
requires new disclosures on the transfers of assets and liabilities between
Level 1 (quoted prices in active market for identical assets or liabilities) and
Level 2 (significant other observable inputs) of the fair value measurement
hierarchy, including the reasons and the timing of the transfers. Additionally,
the guidance requires a roll forward of activities on purchases, sales,
issuance, and settlements of the assets and liabilities measured using
significant unobservable inputs (Level 3 fair value measurements). The guidance
will become effective for us with the reporting period beginning January 1,
2010, except for the disclosure on the roll forward activities for Level 3 fair
value measurements, which will become effective for us with the reporting period
beginning January 1, 2011. Other than requiring additional disclosures, adoption
of this new guidance will not have a material impact on our financial
statements.
59
NOTE
B – ACQUISITIONS
Ublip,
Inc. Acquistion
On
October 9, 2008, the Company completed the acquisition of Ublip, Inc.
(“Ublip”). The results of Ublip’s operations were included in the
consolidated financial statements from October 9, 2008. Ublip is a
M2M software and services company based in Dallas, Texas operating in the United
States. This acquisition generated approximately $1.6 million in
goodwill which the Company believes is appropriate as we now have the ability to
provide a full range of comprehensive M2M services to industry through
technology that includes middleware designed to simplify application development
and deployment and ‘virtual’ hosting architecture.
The
assets acquired consist of computer equipment, software, inventory, accounts
receivable, and other intellectual property, including Ublip’s ‘Foundation’
software.
Ublip was
merged into a wholly-owned subsidiary of Numerex and has been fully integrated
into the Company’s operations. The aggregate purchase price of
approximately $1.7 million consists of 405,000 shares of restricted Numerex
Class A Common Stock, valued at $1.4 million, using the average selling price
three days prior and subsequent to the date of the acquisition of $3.56 per
share, which approximates the average selling price on the announcement date,
and approximately $240,000 in cash.
The
following table summarizes the estimated fair values of the assets acquired and
liabilities assumed at the date of acquisition:
|
(in
thousands)
|
||||
|
Assets
|
$ | 344 | ||
|
Goodwill
|
1,640 | |||
|
Total
assets acquired
|
1,984 | |||
|
Liabilities
assumed
|
(190 | ) | ||
|
Net
assets acquired
|
$ | 1,794 | ||
The $1.6
million of goodwill was assigned to the M2M Services segment. The goodwill is
not deductible for income tax purposes.
Orbit
One Communications Acquisition
On August
1, 2007, with an effective date of July 31, 2007 the Company completed the
acquisition of the assets of Orbit One Communications, Inc. through its wholly
owned subsidiary, Orbit One Communications LLC (“Orbit One”). The
results of Orbit One’s operations have been included in the consolidated
financial statements from August 1, 2007. The assets relate to Orbit
One’s satellite-based M2M solutions it provides to government agencies and
emergency services markets primarily in the United States. These
solutions include hardware, software, data management, installation,
maintenance, and use of its proprietary operational support
platform. This acquisition initially generated approximately $7.5
million in goodwill which the Company believed was appropriate because it
expanded the Company’s M2M hardware and service technologies, it increased
penetration into the governmental markets, and improved
capabilities to enable M2M applications globally in areas underserved by
terrestrial-based and cellular communications providers.
60
The
assets acquired consist of software (including Orbit One’s proprietary mapping
and operational support platform), inventory, equipment (primarily
communications related computer hardware) accounts receivable, trademarks and
other intellectual property.
Initial
consideration for the asset purchase was approximately $5.5 million paid in cash
plus $384,000 of transaction costs. An additional $732,000 was paid 60 days
after closing based on satisfying a net working capital test. In addition, if
certain revenue and EBITDA performance objectives and milestones were achieved,
subsequent payments could include shares of Numerex Corp’s common
stock. If all earn-out objectives were achieved stock payments could
be up to 1,100,000 shares of the Company’s Class A common
stock. If the performance targets were exceeded, Orbit One
could receive up to an additional 471,729 shares of the Company’s Class A common
stock and an additional cash payment of $2.5 million. In consequence,
approximately 1.6 million shares were issued to an escrow agent for the benefit
of Orbit One Communications, Inc. or Numerex as their interests may
appear. The earn-out milestones were measured over three periods: (i) from
the closing date of the transaction through December 31, 2007; (ii) calendar
year 2008; and (iii) calendar year 2009. The Company and Orbit One entered into
an escrow agreement, whereby 10% of the cash payments not subject to
performance-related milestones were placed in escrow for one year from the
closing date in order to settle any indemnification claims under the Agreement
and subject to the limitations described therein. Any additional
payments of either cash or equity would be reflected as incremental
goodwill.
On
December 31, 2007 certain revenue and EBITDA targets were met for the first
measurement period, ending December 31, 2007. As a result,
320,833 shares of the Company’s Class A common stock were deemed issued to Orbit
One Communications, Inc. for purposes of computing common stock
dilution. These shares were valued using the average share price on the
measurement date for meeting the contingencies on December 31, 2007 of $8.33 per
share, thus increasing goodwill by $2.7 million and our common stock by the same
amount. An additional $1.8 million in cash was paid in January 2008 after
certain customer agreements were extended. These shares, however,
remain in escrow and the January 2008 payment of $1.8 million is being disputed
as part of a legal action. The earn-out milestones for calendar years 2008 and
2009 were not met.
61
The
following table summarizes the estimated fair values of the assets acquired and
liabilities assumed on August 1, 2007, and updated for the additional cash
payment in conjunction with the extension of certain customer
agreements.
|
Life
|
||||||||
|
of
intangible
|
||||||||
|
(in
thousands)
|
Fair
Value
|
Assets
|
||||||
|
Net
receivables
|
$ | 454 | - | |||||
|
Prepaid
assets
|
418 | - | ||||||
|
Inventory
|
1,162 | - | ||||||
|
Property,
plant and equipment
|
647 | - | ||||||
|
Other
intangibles, net
|
940 |
7 -
10 years
|
||||||
|
Software,
net
|
1,283 |
3 -
9 years
|
||||||
|
Deposits
|
16 | - | ||||||
|
Goodwill
|
7,488 |
Indefinite
|
||||||
|
Total
assets acquired
|
12,408 | |||||||
|
Accrued
liabilities
|
(191 | ) | ||||||
|
Capital
lease obligations
|
(8 | ) | ||||||
|
Contract
obligations
|
(1,103 | ) | ||||||
|
Total
liabilities assumed
|
(1,302 | ) | ||||||
|
Net
assets acquired
|
$ | 11,106 | ||||||
The $1.3
million of acquired software includes $1.2 million assigned to its proprietary
satellite communications, tracking and mapping software. The $940,000
of acquired intangible assets comprised $170,000 assigned to trademarks, and
$770,000 assigned to customer relationships. The estimated useful
lives for these assets are 10 years for proprietary software, 1 year for
trademarks and 9 years for customer relationships. However, the valuation of
the assets of Orbit One at the time of the acquisition is the subject of
litigation. See Note P for further information.
The $7.4
million of goodwill was assigned to the M2M Services segment. The
Company conducted its annual goodwill and long lived asset analysis and
assessment for December 31, 2008. As a result of our impairment
analysis, with assistance from an external appraisal firm, goodwill was impaired
by $3.1 million and thus the fair value was adjusted at December 31,
2008.
The
goodwill and intangible assets will be deductible for income tax
purposes.
62
The
following unaudited pro-forma consolidated results of operations assume that the
acquisition of Orbit One assets was completed as of January 1 for the 12
months period shown below:
|
For
the Year
|
||||
|
Ended
December 31,
|
||||
|
(In
thousands, except per share data)
|
2007
|
|||
|
Revenues
|
$ | 71,952 | ||
|
Net
Income
|
$ | 836 | ||
|
Earnings
Per Common Share
|
$ | 0.08 | ||
|
Earnings
Per Common Share - diluted
|
$ | 0.07 | ||
These
pro-forma statements have been prepared for comparative purposes only
and is not intended to be indicative of what the Company’s results would have
been had the acquisition occurred at the beginning of the periods presented or
the results which may occur in the future.
Airdesk Acquisition
On
January 5, 2006 the Company completed the acquisition of the assets of
Airdesk, Inc. through its wholly owned subsidiary, Airdesk LLC
(“Airdesk”). The results of Airdesk’s operations have been included
in the consolidated financial statements from January 1, 2006. The
assets relate to Airdesk’s machine-to-machine (M2M) solutions and services
business in the United States and Canada. This acquisition generated
approximately $4.2 million in goodwill which the Company believes is appropriate
since it aligns Airdesk’s digital M2M hardware and portfolio of industry leading
radio modules with our M2M network and services platform. The
acquisition of Airdesk also gives the Company presence in multiple vertical
segments including utilities, fleet management and point-of-sale
terminals.
The
assets acquired consist of furniture, fixtures, equipment (consisting of
hardware and software), inventory, distribution rights agreements, accounts
receivable, trademarks and other intellectual property, including Airdesk’s
billing system and “Airsource” database library.
Initial
consideration for the asset purchase was approximately $4.2 million payable in
the form of shares of the Company’s common stock and the assumption of certain
existing indebtedness of Airdesk, Inc. In addition, if certain
revenue and other performance targets are achieved, the Company could issue an
additional 300,000 shares of its common stock over the three-year period from
the date of acquisition. At April 1, 2007 a portion of these targets
were achieved and accordingly 100,000 shares were issued at a value of $1.0
million which were valued using the average stock price on date of issuance
resulting in an increase to goodwill of $1.0 million and a corresponding
increase in common stock. Subsequent to December 31, 2007, the asset
purchase agreement was amended to remove the performance targets on the
remaining 200,000 un-issued shares with 60,000 shares to be issued on April 1,
2008, 60,000 shares issued on April 1, 2009 and the balance of 80,000 shares
issued on April 1, 2010. Since these shares were only time
contingent, we recognized the value of these shares on the date of the amendment
of January 1, 2008. This resulted in a $1.7 million increase in goodwill
and a corresponding increase in common stock. The average selling price on
the date of the amendment was $8.53 per share.
63
The
Company assumed approximately $2.5 million of debt, of which $1.2 million was
paid in cash at closing of the transaction as a reduction of part of the debt,
and the balance of $1.3 million was paid on August 17, 2006. The
Company also issued shares of common stock valued at approximately $196,000 to
Airdesk, Inc. at closing and deposited the remaining shares of common stock,
valued at closing at approximately $1.3 million, with an Escrow
Agent. Airdesk, Inc. retains voting and dividend rights to these
shares while held in escrow. The Escrow Agent will release the shares of common
stock to Airdesk, Inc. over a two-year period in accordance with the terms of
the Escrow Agreement. In addition, we incurred approximately $266,000 of direct
acquisition expenses that are in addition to the purchase price.
The
following table summarizes the estimated fair values of the assets acquired and
liabilities assumed on January 5, 2006 as updated for the additional issuance of
shares on April 1, 2007.
|
(in
thousands)
|
||||
|
Current
assets
|
$ | 2,410 | ||
|
Property,
plant and equipment
|
444 | |||
|
Other
non-current assets
|
12 | |||
|
Intangible
assets
|
934 | |||
|
Goodwill
|
4,232 | |||
|
Total
assets acquired
|
8,032 | |||
|
Current
liabilities
|
(3,346 | ) | ||
|
Long-term
debt
|
(700 | ) | ||
|
Total
liabilities assumed
|
(4,046 | ) | ||
|
Net
assets acquired
|
$ | 3,986 | ||
The
$934,000 of acquired intangible assets was comprised of $668,000 assigned to
trademarks, $189,000 assigned to customer relationships and $77,000 assigned to
a non-compete agreement. The estimated useful life of the customer
relationships is 4 years and the estimated useful life of the non-compete
agreement is 2 years. The trademarks are not subject to
amortization.
The $4.2
million of goodwill was assigned to the M2M Services segment. The goodwill is
not deductible for income tax purposes.
NOTE
C – ACCOUNTS RECEIVABLE
Accounts receivables and
related allowance for doubtful accounts consisted of the following:
|
December
31,
|
||||||||
|
(In
thousands)
|
2009
|
2008
|
||||||
|
Accounts
receivable
|
$ | 6,406 | $ | 9,952 | ||||
|
Unbilled
accounts receivable
|
483 | 217 | ||||||
|
Allowance
for doubtful accounts
|
(548 | ) | (1,010 | ) | ||||
|
Accounts
receivable
|
$ | 6,341 | $ | 9,159 | ||||
64
NOTE
D – PREPAID EXPENSES AND OTHER CURRENT ASSETS
Prepaid
expenses and other current assets consisted of the following:
|
December
31,
|
December
31,
|
|||||||
|
(In
thousands)
|
2009
|
2008
|
||||||
|
Notes
receivable
|
$ | 1,029 | $ | 916 | ||||
|
Prepaid
expenses
|
517 | 380 | ||||||
|
Debt
issuance costs
|
5 | 196 | ||||||
|
Misc.
and employee receivables
|
18 | 16 | ||||||
| $ | 1,569 | $ | 1,508 | |||||
At
December 31, 2009 and 2008, we had one note receivable, with a 10% interest
rate, of $1.0 million and $916,000, respectively.
NOTE
E – INVENTORY
Inventory
consisted of the following:
|
December
31,
|
||||||||
|
(In
thousands)
|
2009
|
2008
|
||||||
|
Raw
materials
|
$ | 1,503 | $ | 2,710 | ||||
|
Work-in-progress
|
14 | 14 | ||||||
|
Finished
goods
|
5,212 | 6,388 | ||||||
|
Less
reserve for obsolescence
|
(439 | ) | (606 | ) | ||||
|
Inventory,
net
|
$ | 6,290 | $ | 8,506 | ||||
NOTE
F – PROPERTY AND EQUIPMENT
Property
and equipment consisted of the following:
|
December
31,
|
||||||||
|
(In
thousands)
|
2009
|
2008
|
||||||
|
Leasehold
improvements
|
$ | 1,391 | $ | 1,228 | ||||
|
Plant
and machinery
|
10,577 | 10,004 | ||||||
|
Equipment,
fixtures, fittings
|
831 | 810 | ||||||
|
Total
property and equipment
|
12,799 | 12,042 | ||||||
|
Accumulated
depreciation
|
(11,196 | ) | (10,277 | ) | ||||
|
Property
and equipment, net
|
$ | 1,603 | $ | 1,765 | ||||
65
NOTE
G – INTANGIBLE ASSETS
The
following table provides a summary of the components of our intangible
assets:
|
For
the Year ended December 31, 2009
|
For
the Year ended December 31, 2008
|
|||||||
|
M2M
Services
|
||||||||
|
Balance
at the beginning of the period
|
||||||||
|
Goodwill
|
$ | 25,905 | $ | 20,728 | ||||
|
Accumulated
impairment losses
|
(3,060 | ) | - | |||||
| 22,845 | 20,728 | |||||||
|
Acquisition
of Ublip, Inc.
|
16 | 1,640 | ||||||
|
Acquisition
of assets of Airdesk, Inc.
|
- | 1,706 | ||||||
|
Acquisition
of assets of Orbit One, Inc.
|
- | 1,831 | ||||||
|
Impairment
of goodwill of Orbit One, Inc.
|
- | (3,060 | ) | |||||
|
Balance
at the end of the period
|
||||||||
|
Goodwill
|
25,921 | 25,905 | ||||||
|
Accumulated
impairment losses
|
(3,060 | ) | (3,060 | ) | ||||
| 22,861 | 22,845 | |||||||
|
Wireline
Services
|
||||||||
|
Balance
at the beginning of the period
|
||||||||
|
Goodwill
|
4,015 | 4,015 | ||||||
|
Accumulated
impairment losses
|
(3,089 | ) | (2,140 | ) | ||||
| 926 | 1,875 | |||||||
|
Impairment
of goodwill
|
- | (949 | ) | |||||
|
Balance
at the end of the period
|
||||||||
|
Goodwill
|
4,015 | 4,015 | ||||||
|
Accumulated
impairment losses
|
(3,089 | ) | (3,089 | ) | ||||
| 926 | 926 | |||||||
|
Total
at end of period
|
$ | 23,787 | $ | 23,771 | ||||
During
2009 and 2008, we prepared an analysis using standard modeling techniques to
estimate a fair market value for each of the three reporting units with
goodwill: M2M Services, Orbit One, LLC and Wireline Services and for
2008 we had an additional reporting unit of Airdesk. At the beginning
of 2009 it was necessary to combine the Airdesk reporting unit with the M2M
Services reporting unit as it had been so integrated with the M2M Services
reporting unit that it was no longer possible to report discrete financial
information for the Airdesk reporting unit. This analysis included a
combination of a discounted cash flow models and, where available, the use of
public company market comparables in similar industries. We used
historical information, our subsequent year business plan and expected future
development projects to prepare six year financial projections used in the
discounted cash flow analysis for each of the reporting units.
During
2009, we did not record goodwill or long-lived intangible asset impairment
charges. During 2008, we recorded a pre-tax goodwill and long-lived
intangible asset impairment, of $5.3 million, $4.3 million of which was
attributable to Orbit One as detailed in the prior note and $1.0 million related
to our Wireline Services reporting unit.
66
The
Company did not incur costs to renew or extend the term of acquired intangible
assets during the year ending December 31, 2009. Intangible assets, which
will continue to be amortized, consisted of the following (in
thousands):
|
December
31, 2009
|
December
31, 2008
|
|||||||||||||||||||||||
|
Gross
Carrying Amount
|
Accumulated
Amortization
|
Net
Book Value
|
Gross
Carrying Amount
|
Accumulated
Amortization
|
Net
Book Value
|
|||||||||||||||||||
|
Purchased
and developed software
|
$ | 8,344 | $ | (5,597 | ) | $ | 2,747 | $ | 7,272 | $ | (4,476 | ) | $ | 2,796 | ||||||||||
|
Patents,
trade and service marks
|
13,397 | (9,106 | ) | 4,291 | 13,116 | (8,124 | ) | 4,992 | ||||||||||||||||
|
Intangible
and other assets
|
1,523 | (829 | ) | 694 | 1,278 | (474 | ) | 804 | ||||||||||||||||
|
Total
Intangible and other assets
|
$ | 23,264 | $ | (15,532 | ) | $ | 7,732 | $ | 21,666 | $ | (13,074 | ) | $ | 8,592 | ||||||||||
At
December 31, 2009 and 2008, the Company had capitalized approximately $916,000
and $823,000 of internally generated software development costs, respectively.
Amortization of capitalized software development costs for the years ended
December 31, 2009 and 2008 was $910,000 and $706,000, respectively.
The
Company expects amortization expense for the next five years and thereafter to
be as follows based on intangible assets as of December 31, 2009 (in
thousands):
|
2010
|
$
2.6 million
|
|
2011
|
1.7
million
|
|
2012
|
1.4
million
|
|
2013
|
1.0
million
|
|
2014
|
0.6
million
|
|
Thereafter
|
0.4
million
|
|
Total
|
$
7.7 million
|
NOTE
H – OTHER ASSETS
Other
assets consisted of the following:
|
December
31,
|
December
31,
|
|||||||
|
(In
thousands)
|
2009
|
2008
|
||||||
|
Deposits
long term
|
$ | 119 | $ | 130 | ||||
|
Debt
issuance costs
|
- | 158 | ||||||
| $ | 119 | $ | 288 | |||||
The
long-term portion of debt issuance costs were $556,000, less accumulated
amortization of approximately $556,000, at December 31, 2009, and $556,000, less
accumulated amortization of approximately $398,000, at December 31,
2008.
67
NOTE
I – INCOME TAXES
The
provision for income taxes consisted of the following:
|
December
31,
|
||||||||||||
|
(in
thousands)
|
2009
|
2008
|
2007
|
|||||||||
|
Current:
|
||||||||||||
|
Federal
|
$ | - | $ | 26 | $ | 43 | ||||||
|
State
|
132 | 95 | 17 | |||||||||
|
Foreign
|
49 | 54 | - | |||||||||
|
Reserve
for Uncertain Tax Positions
|
(2 | ) | 106 | 140 | ||||||||
|
Deferred:
|
||||||||||||
|
Federal
|
98 | 2,664 | 529 | |||||||||
|
State
|
8 | 102 | (1 | ) | ||||||||
| $ | 285 | $ | 3,047 | $ | 728 | |||||||
Income
taxes recorded by the Company differ from the amounts computed by applying the
statutory U.S. federal income tax rate to income before income taxes. The
following schedule reconciles income tax expense (benefit) at the statutory rate
and the actual income tax expense as reflected in the consolidated statements of
operations for the respective periods:
|
(in
thousands)
|
December
31,
|
|||||||||||
|
2009
|
2008
|
2007
|
||||||||||
|
Income
tax (benefit) computed at
|
||||||||||||
|
U.S.
corporate tax rate of 34%
|
$ | (1,885 | ) | $ | (2,695 | ) | $ | 377 | ||||
|
Adjustments
attributable to:
|
||||||||||||
|
Deferred
Balance True Up
|
(13 | ) | (173 | ) | 639 | |||||||
|
State
Net Operating Losses
|
- | - | (93 | ) | ||||||||
|
Valuation
allowance
|
991 | 4,035 | (554 | ) | ||||||||
|
State
Tax
|
(11 | ) | 67 | 11 | ||||||||
|
Foreign
Tax
|
(25 | ) | 30 | (7 | ) | |||||||
|
Reserve
for Uncertain Tax Positions
|
(2 | ) | 106 | 140 | ||||||||
|
Non-deductible
expenses
|
272 | 284 | 215 | |||||||||
|
Non-cash
debt charge
|
829 | - | - | |||||||||
|
Goodwill
impairment
|
- | 1,263 | - | |||||||||
|
Expiration
of net operating loss
|
- | 98 | - | |||||||||
|
Stock
Option Shortfall
|
131 | - | - | |||||||||
|
Other
|
(2 | ) | 32 | - | ||||||||
| $ | 285 | $ | 3,047 | $ | 728 | |||||||
68
The
components of the Company’s net deferred tax assets and liabilities are as
follows:
|
(in
thousands)
|
December
31,
|
|||||||
|
2009
|
2008
|
|||||||
|
Current
deferred tax asset
|
||||||||
|
Inventories
|
$ | 349 | $ | 327 | ||||
|
Accruals
|
99 | 85 | ||||||
|
Net
operating loss carry forward
|
- | - | ||||||
|
Other
|
395 | 395 | ||||||
|
Valuation
allowance
|
(786 | ) | (807 | ) | ||||
| 57 | - | |||||||
|
Non-Current
deferred tax asset
|
||||||||
|
Intangibles
|
1,821 | 1,321 | ||||||
|
Foreign
NOL carry forward
|
- | - | ||||||
|
Net
operating loss carry forward
|
7,788 | 7,270 | ||||||
|
Tax
credit carry forward
|
1,303 | 1,303 | ||||||
|
Difference
between book and tax
|
||||||||
|
Basis
of property
|
(818 | ) | (580 | ) | ||||
|
Other
|
402 | 227 | ||||||
|
Valuation
allowance
|
(10,553 | ) | (9,541 | ) | ||||
| (57 | ) | - | ||||||
|
Deferred
Tax Liabilities
|
||||||||
|
Goodwill
|
(154 | ) | (48 | ) | ||||
|
Net
Deferred Tax Liabilities
|
$ | (154 | ) | $ | (48 | ) | ||
Management
has provided a full valuation allowance on deferred tax assets. Management
intends to maintain this valuation allowance until sufficient positive evidence
exists to support reversal of the valuation allowance. Income tax expense
recorded in the future will be reduced or increased to the extent of offsetting
decreases or increases to the valuation allowance.
The
future taxable income expected from the reversal of temporary differences
(deferred tax liabilities) is being offset by net operating loss carryforwards
(deferred tax assets) with the exception of the deferred tax liability generated
from the amortization of tax deductible goodwill which has an indefinite period
of reversal. Because the reversal of goodwill amortization cannot be assumed to
reverse during the statutory carryforward period of the Company's NOL's, this
liability is isolated and presented gross in the amount of $154,000 as a long
term liability in the Statement of Financial Position.
Net
operating loss carry forwards available at December 31, 2009, expire as
follows:
|
(in
thousands)
|
Year
of
|
|||||||
|
Amount
|
Expiration
|
|||||||
|
Federal
operating losses
|
$ | 14,447 | 2021-2029 | |||||
|
State
operating losses
|
$ | 53,165 | 2017-2029 | |||||
|
Minimum
Tax Credit Carryforward
|
$ | 738 | N/A | |||||
|
General
Business Credit Carryforward
|
$ | 565 | 2015-2022 | |||||
69
In
assessing the realizability of deferred tax assets, management considers whether
it is more likely than not that some portion or all of the deferred tax assets
will not be realized. The ultimate realization of deferred tax assets
is dependent upon the generation of future taxable income during the periods in
which those temporary differences become deductible. Management
considers projections of future taxable income, tax planning strategies and the
reversal of temporary differences in making this
assessment. Cumulative losses incurred in recent years and the
potential impact of the current economic environment on future taxable income
represented sufficient negative evidence to require a full valuation allowance.
As such, at December 31, 2008 management established a full valuation allowance
against the net deferred tax assets, which remains at December 31, 2009 and
until sufficient positive evidence exists to support reversal. Deferred tax
assets generated during the current year primarily due to net operating losses
were also offset by an increase to the valuation allowance resulting in no net
benefit recorded in the current year. Future reversals or increases to the
valuation allowance could have a significant impact on our future
earnings.
The
company files U.S., state and foreign income tax returns in jurisdictions with
varying statutes of limitation. The 2006 through 2008 tax years generally remain
subject to examination by federal and most state tax authorities. However,
certain returns from years in which net operating losses have arisen are still
open for examination by the tax authorities.
NOTE
J – NOTES PAYABLE
On
December 29, 2006, the Company completed a private placement to Laurus Master
Fund, Ltd. (“Laurus”) of (i) a convertible term note in the principal
amount of $10,000,000 (“Note C”), and (ii) a warrant to purchase up to
158,562 shares of our common stock. Interest accrues on this note at
a rate of 9.50% annually. This note has a four year term and is secured by
substantially all of our assets. Note C was fully repaid at December
31, 2009. The fair value of the warrant associated with Note C on December
29, 2006 was $735,000 and was calculated using the Black-Scholes fair value
pricing model.
On
May 30, 2006, the Company completed a private placement to Laurus Master
Fund, Ltd. (“Laurus”) of (i) a convertible term note in the principal
amount of $5,000,000 (“Note A”) (ii) a non-convertible term note in the
principal amount of $5,000,000 (“Note B”), and (iii) a
warrant to purchase up to 241,379 shares of our common
stock. Interest accrues on each of the notes at a rate of 9.75%
annually. Both notes have four year terms and are secured by
substantially all of our assets. The fair value of the warrant
associated with Note A and Note B on May 30, 2006 was $846,000 and was
calculated using the Black-Scholes fair value pricing
model.
Interest
under Note B must be paid in cash. The principal balance on Note B is
due and payable in cash on May 30, 2010. The Company fully repaid
Note B on January 8, 2010.
The
Company may only use common stock to make payments on convertible Note A if the
price per share of the common stock for the required number of trading days
immediately prior to conversion is greater than $8.70. The holder of
the convertible note may convert the entire principal amount of the convertible
note, and any accrued interest thereon, into the Company’s common stock at a
fixed conversion price equal to $7.91 per share.
70
In
consideration of the above private placements and other private placements for
term notes, the Company issued to Laurus warrants to purchase our common stock,
the terms of which are summarized as follows:
|
Number
of Securities
|
Common
Stock Exercise Price
|
Expiration
Date
|
|||||
| 150,000 | $ | 4.75 |
January
13, 2011
|
||||
| 100,000 | 5.17 |
January
13, 2011
|
|||||
| 116,000 | 5.99 |
January
13, 2011
|
|||||
| 50,000 | 5.51 |
January
28, 2012
|
|||||
| 50,000 | 5.72 |
January
28, 2012
|
|||||
| 241,379 | 7.73 |
May
30, 2013
|
|||||
| 158,562 | 10.13 |
December
29, 2013
|
|||||
During
2009, we made additional debt payments of $4.5 million in cash and converted
$4.047 million of outstanding debt associated with financings in May 2006 and
December 2006. This conversion of outstanding debt to equity resulted
in the issuance of 888,817 shares of the Company’s Class A Common Stock at a
conversion price ranging from $4.42 - $4.65 per share, as agreed upon by the
parties. Though no economic incentive was offered, we are required to
account for the inducement conversion under ASC 470-20 (previously SFAS No. 84
“Induced Conversions of
Convertible Debt”). We recognized non-cash debt conversion
charges of $2.4 million, which equaled the excess of the fair value of the
common stock issued over the fair value of the common stock issuable pursuant to
the original conversion terms. We recorded $499,000 in interest
expense as a result of expensing the deferred fees associated with the
debt.
As of
December 31, 2009, the Company had $500,000 outstanding under Note B and none
outstanding under Note C. As of December 31, 2009, the Company had a
balance of $7,300 for the unamortized warrant associated with Note B and none
for the unamortized warrant associated with Note C. The Company fully
repaid Note B on January 8, 2010.
Laurus is
an "accredited investor" as defined in Rule 501(d) of Regulation D under the
Securities Act of 1933, as amended (the "Securities Act"). The
Company issued the securities to Laurus in reliance on the exemption from
registration provided by Section 4(2) under the Securities Act.
71
NOTE
K – SHARE-BASED COMPENSATION
For the
years ended December 31, 2009, 2008 and 2007 share-based compensation expense
was $995,000, $1.2 million and $941,000, respectively. Share-based
compensation consisted of expense related to employee equity
awards. Total unrecognized compensation related to unvested
share-based awards granted to employees and members of our board of directors at
December 31, 2009, net of estimated forfeitures, is $1.0 million and is expected
to be recognized over a weighted-average period of 1.3 years.
Share-based
compensation expense recognized during the period is based on the value of the
portion of share-based payment awards that is ultimately expected to vest during
the period. Share-based compensation expense recognized in the Company’s
Consolidated Statement of Operations for the year ended December 31, 2009, 2008
and 2007 included compensation expense for share-based payment awards granted
prior to, but not yet vested as of December 31, 2005 based on the grant
date fair value estimate and compensation expense for the share-based payment
awards granted subsequent to December 31, 2005. The Company will
continue to use the method of attributing the value of share-based compensation
costs to expense on the straight-line method. As stock-based
compensation expense recognized in the Consolidated Statement of Operations for
the years ended December 31, 2009, 2008 and 2007 is based on awards ultimately
expected to vest, it has been reduced for estimated forfeitures. Forfeitures are
estimated at the time of grant and revised, if necessary, in subsequent periods
if actual forfeitures differ from those estimates.
The fair
value of share-based payment awards is estimated at the grant date using the
Black-Scholes option valuation model. The Company’s determination of fair value
of share-based payment awards on the date of grant using the option-pricing
model is affected by the Company’s stock price, as well as management’s
assumptions. These variables include, but are not limited to; the Company’s
expected stock price volatility over the term of the awards, and actual and
projected employee stock option exercise behaviors.
The
Company has outstanding stock options granted pursuant to four stock option
plans. The 1994 Long-Term Incentive Plan (the “1994 Plan”), which was adopted in
1994, the Non-Employee Director Stock Option Plan (the “Director Plan”) which
was adopted in 1996, the Long-Term Incentive Plan (the “1999 Plan”), which was
adopted in 1999 and the 2006 Long Term Incentive Plan (the “2006 Plan”) which
was adopted in 2006. The 1994 Plan and the Director Plan were
terminated and replaced by the 1999 Plan which was effective for options granted
from October 25, 1999. The 1999 Plan was terminated and replaced by
the 2006 Plan. Options outstanding under the 1994 Plan, the Director Plan and
the 1999 Plan remain in effect, but no new options may be granted under those
plans. Options issued under the 2006 Plan and the 1999 Plan typically
vest ratably over a four-year period. All options issued under the
1994 Plan are fully vested.
The
aggregate number of shares which may be issued under the 2006 plan is 750,000
shares of Class A Common Stock (“Shares”) plus (i) any available Shares
under the 1999 Plan as of its termination date and (ii) Shares subject to
options granted under the 1999 Plan that expire or terminate without having been
fully exercised. A summary of the company's stock option activity and
related information for the years ended December 31, 2009, 2008 and 2007
follows:
|
Weighted
|
Weighted
|
Weighted
Avg.
|
Aggregate
|
||||||||||||||
|
Average
|
Average
Remaining
|
Grant
Date
|
Intrinsic
|
||||||||||||||
|
Shares
|
Ex.
Price
|
Contractual
Life (Yrs)
|
Fair
Value
|
Value
|
|||||||||||||
|
Outstanding,
at 12/31/06
|
1,784,865 | $ | 5.55 | ||||||||||||||
|
Options
granted
|
301,500 | 8.47 | $ | 4.69 | |||||||||||||
|
Options
exercised
|
(133,830 | ) | 4.80 | $ | 777,777 | ||||||||||||
|
Options
cancelled
|
(26,063 | ) | 5.62 | ||||||||||||||
|
Options
expired
|
(250 | ) | 4.57 | ||||||||||||||
|
Outstanding,
at 12/31/07
|
1,926,222 | 6.06 | |||||||||||||||
|
Options
granted
|
199,500 | 5.39 | $ | 3.34 | |||||||||||||
|
Options
exercised
|
(26,541 | ) | 4.53 | $ | 49,356 | ||||||||||||
|
Options
cancelled
|
(54,188 | ) | 7.65 | ||||||||||||||
|
Options
expired
|
(39,272 | ) | 5.96 | ||||||||||||||
|
Outstanding,
at 12/31/08
|
2,005,721 | 5.97 | $ | 383,626 | |||||||||||||
|
Options
granted
|
140,500 | 4.38 | $ | 2.81 | |||||||||||||
|
Options
exercised
|
(124,500 | ) | 3.63 | $ | 90,800 | ||||||||||||
|
Options
cancelled
|
(141,875 | ) | 7.83 | ||||||||||||||
|
Options
expired
|
(41,750 | ) | 6.26 | ||||||||||||||
|
Outstanding,
at 12/31/09
|
1,838,096 | 5.86 |
5.17
|
$ | 632,057 | ||||||||||||
|
Exercisable,
at 12/31/09
|
1,449,843 | 5.85 |
4.30
|
$ | 582,174 | ||||||||||||
72
The
following table summarizes information related to fixed stock options
outstanding at December 31, 2009:
|
Options
outstanding
|
Options
exercisable
|
|||||||||||||||||||||
|
Range
of exercise prices
|
Number
outstanding at December 31, 2009
|
Weighted
average remaining contractual life (years)
|
Weighted
average exercise price
|
Number
exercisable at December 31, 2009
|
Weighted
average exercise price
|
|||||||||||||||||
| $ | 1.00 – 4.00 | 454,664 | 4.56 | $ | 2.93 | 398,415 | $ | 2.86 | ||||||||||||||
| 4.01 – 8.00 | 923,932 | 5.70 | $ | 5.57 | 664,118 | $ | 5.62 | |||||||||||||||
| 8.01 – 12.94 | 459,500 | 4.69 | $ | 9.32 | 387,310 | $ | 9.31 | |||||||||||||||
| 1,838,096 | 5.17 | $ | 5.86 | 1,449,843 | $ | 5.85 | ||||||||||||||||
The fair
value of options at date of grant was estimated using the Black-Scholes option
pricing model. The fair value is then amortized on a straight-line basis over
the requisite service periods of the awards, which is generally the vesting
period. Use of a valuation model requires management to make certain assumptions
with respect to selected model inputs. Expected stock price volatility was
calculated based on the historical volatility of our common stock over the
expected life of the option. The risk-free interest rate is based on U.S.
Treasury zero-coupon issues with a remaining term equal to the expected life
assumed at the date of grant. Forfeitures are estimated based on voluntary
termination behavior, as well as an analysis of actual option
forfeitures. Dividend yield is zero as there are no payments of
dividends. With regard to the estimate of the expected life, we
consider the exercise behavior of past grants and model the pattern of aggregate
exercises.
A summary
of the status of the Company’s nonvested shares as of December 31, 2009, and
changes during the year ended December 31, 2009, is presented
below:
|
Weighted
|
||||||||
|
Average
|
||||||||
|
Grant-date
|
||||||||
|
Nonvested
Shares
|
Shares
|
Fair
Value
|
||||||
|
Nonvested
at January 1, 2009
|
547,440 | $ | 4.09 | |||||
|
Options
granted
|
140,500 | 2.81 | ||||||
|
Options
vested
|
(116,061 | ) | 3.45 | |||||
|
Options
forfeited
|
(183,625 | ) | 4.45 | |||||
|
Nonvested
at December 31, 2009
|
388,254 | 3.60 | ||||||
The total
fair value of shares vested during the years ended December 31, 2009, 2008 and
2007 was $1.0 million, $1.3 million and $868,000, respectively.
73
The key
assumptions used in the valuation model during the twelve months ended December
31, 2009, 2008 and 2007 are provided below:
|
Twelve
Months Ended
|
|||
|
December
31,
|
|||
|
2009
|
2008
|
2007
|
|
|
Valuation
Assumptions:
|
|||
|
Volatility
|
70.70%
|
69.73%
|
57.24%
|
|
Expected
term
|
6.3
|
6.3
|
6.3
|
|
Risk
free interest rate
|
2.48%
|
3.15%
|
4.29%
|
|
Dividend
yield
|
0.00%
|
0.00%
|
0.00%
|
NOTE
L – SIGNIFICANT CUSTOMER, CONCENTRATION OF CREDIT RISK AND RELATED
PARTIES
One
customer accounted for approximately 14.7% of consolidated revenue for the year
ended December 31, 2009, principally from our M2M Services
segment. Accounts receivable from this customer was approximately
$140,000 at December 31, 2009. Two customers accounted for 15.3% and 10.3%,
respectively, of outstanding accounts receivable at December 31,
2009. One customer accounted for approximately 22% of consolidated
revenue for the year ended December 31, 2008, principally from our M2M Services
segment. Accounts receivable from this customer was $1.3 million at
December 31, 2008. One customer accounted for approximately 13% of
consolidated revenue for the year ended December 31, 2007, principally from our
M2M Services segment. Accounts receivable from this customer was $3.0 million at
December 31, 2007, which is approximately 18% of total accounts
receivable.
We had
two suppliers from which our purchases were approximately 44.2% of our hardware
cost of sales for the year ended December 31, 2009. Our
accounts payable to these suppliers was approximately $1.0 million at December
31, 2009. We had two suppliers from which our purchases were
approximately 67% of our hardware cost of sales for the year ended December 31,
2008. Our accounts payable to these suppliers was approximately
$3.6 million at December 31, 2008. We had two suppliers from which
our purchases were approximately 57% of cost of hardware sales for the year
ended December 31, 2007. The components included in the hardware
purchased from this supplier can be sourced from other suppliers.
We
conducted business with one related party during the year ended December 31,
2009. Mr. Ryan, a director on the Company’s Board of Directors is
also partner in the law firm of Salisbury & Ryan LLP. Salisbury
& Ryan LLP provided legal services to the Company in 2009 and will continue
to provide such services during 2010. During the year ended December
31, 2009, 2008, and 2007 Salisbury & Ryan LLP charged legal fees of
approximately $358,000, $762,000 and $277,000, respectively. Our
accounts payable to Salisbury & Ryan LLP was $28,000 and $201,000 at
December 31, 2009 and 2008, respectively.
74
NOTE
M – COMMITMENTS AND CONTINGENCIES
Capital
Leases
We
conduct a portion of our operations with leased equipment. For financial
reporting purposes, minimum lease rentals relating to the equipment have been
capitalized.
The
related assets and obligations have been recorded using our incremental
borrowing rate at the inception of the lease. The leases expire at
various dates through 2011. The gross value of the assets financed by the lease
obligations at the inception of the leases was $157,000. The net
carrying value of assets financed by capital lease obligations approximated
$30,000 as of December 31, 2009. The following is a schedule by years
of future minimum lease payments under capital leases together with the present
value of the net minimum lease payments as of December 31, 2009, (in
thousands).
|
2010
|
$ | 26 | ||
|
2011
|
7 | |||
|
Total
minimum lease payments
|
33 | |||
|
Less
amount representing interest
|
(3 | ) | ||
|
Present
value of net minimum lease payments
|
$ | 30 |
Subsequent
to year end the Company entered into an agreement to acquire certain equipment
for approximately $900,000.
Operating
Leases
We lease
certain property and equipment under non-cancelable operating leases with
initial terms in excess of one year, through 2013. Future minimum lease payments
under such non-cancelable operating leases subsequent to December 31, 2009, (in
thousands) are as follows:
|
2010
|
$ | 952 | ||
|
2011
|
887 | |||
|
2012
|
565 | |||
|
2013
|
- | |||
|
Total
minimum lease payments
|
$ | 2,404 |
Rent
expense, including short-term leases, amounted to approximately $1.0 million,
$1.1 million and $938,000 for the years ended December 31, 2009, 2008 and 2007,
respectively.
NOTE
N – BENEFIT PLAN
We
sponsor a 401(k) savings and investment plan, a plan that covers all eligible
employees of Numerex Corp and its subsidiaries. Employees are
eligible for participation on the enrollment date following six months of
service. We contribute an amount equal to 50% of the portion of the
employee’s elective deferral contribution that do not exceed 6% of the
employee’s total compensation for each payroll period in which an elective
deferral is made. Our contribution is made in cash on a monthly
basis. Our matching contributions are vested over a three year period
at a rate of 33% per year. Approximately $179,000, $182,000 and
$151,000 were expensed for the years ended December 31, 2009, 2008 and 2007,
respectively.
75
NOTE
O – EARNINGS (LOSS) PER SHARE
The
numerator in calculating both basic and diluted net earnings (loss) per share
for each period is net earnings (loss). The denominator is based on
the following number of common shares:
|
For
the years ended December 31,
|
||||||||||||
|
(In
thousands, except per share data)
|
2009
|
2008
|
2007
|
|||||||||
|
Common
Shares:
|
||||||||||||
|
Weighted
average common shares outstanding
|
14,409 | 14,144 | 13,137 | |||||||||
|
Dilutive
effect of common stock equivalents
|
- | - | 563 | |||||||||
|
Total
|
14,409 | 14,144 | 13,700 | |||||||||
|
Net
earnings (loss)
|
$ | (5,829 | ) | $ | (10,975 | ) | $ | 440 | ||||
|
Net
earnings (loss) per common share:
|
||||||||||||
|
Basic
|
$ | (0.40 | ) | $ | (0.78 | ) | $ | 0.03 | ||||
|
Diluted
|
$ | (0.40 | ) | $ | (0.78 | ) | $ | 0.03 | ||||
For the
year ended December 31, 2009 and 2008, the effect of our 1,838,096 and 2,005,721
stock options and warrants was not included, respectively, in the computation of
diluted earnings per share as their effect was anti-dilutive.
For the
years ended December 31, 2007, we excluded antidilutive options of 239,692
shares of common stock and common stock equivalents from the computation of
diluted earnings per share, as the exercise prices of those shares were greater
than the average market price of the common stock during the applicable
period.
In
connection with the acquisition of the assets of Orbit One Communications, , the
Company issued an additional 1,250,596 shares of the Company’s common
stock. These shares are currently held in escrow for the benefit of
Orbit One or Numerex, as their interest may appear in the future, and are not
included in the basic and diluted share calculation. The shares
could be released depending on the outcome of the litigation described in Note P
below.
NOTE
P – LEGAL PROCEEDINGS
On
January 7, 2008 Orbit One Communications, Inc. (“Orbit One”) and David Ronsen
(“Ronsen”) filed an action against Numerex in New York State Supreme Court,
County of New York, alleging,
inter alia, breach of contract in frustrating Orbit One’s ability to
achieve earn out targets in the acquisition and employment agreements.
Plaintiffs are claiming $20 million in damages. On January 25, 2008
Numerex removed the action to the United States District Court, Southern
District of New York. On March 11, 2008 Numerex answered and
counterclaimed asserting, inter alia, breach of
fiduciary duty and declaratory relief. On September 23, 2008, Orbit One,
Ronsen and related entities commenced an action in the District of Montana
seeking to declare Ronsen’s non-compete obligations void. On
December 9, 2008, the court transferred the case to the United States District
Court for the Southern District of New York. On January 7, 2009, the court
held a hearing on plaintiffs’ motion for a preliminary injunction. On
January 21, 2009, the Court denied plaintiffs’ motion for a preliminary
injunction. On January 30, 2009, Numerex filed counterclaims against
plaintiffs for fraud, theft of trade secrets and confidential information and
breach of the Asset Purchase Agreement; and from Ronsen, Naden and Rosenzweig
for breach of their fiduciary duties and duty of loyalty to Numerex, as well as
breach of their respective Severance Agreements. On February 24, 2009, the
court consolidated the actions and ordered the parties to complete their
discovery by February 27, 2009. Discovery has been
completed. On April 17, 2009, the parties filed cross-motions
for summary judgment. On March 12, 2010, the Court entered a
decision on the cross-motions for summary judgment. The Court held that
Mr. Ronsen’s claim that he had “good reason” to resign presented material issues
of fact requiring a trial. Similarly, the Court held that Numerex’s claims
against Orbit One and its principals for breach of contract, fraudulent
inducement, breach of fiduciary duty, and other related claims presented
material issues of fact requiring a trial. No trial date has been
set. Numerex believes that the plaintiffs' claims are without merit
and intends to defend against the allegations and to vigorously pursue its
counterclaims.
NOTE
Q – SEGMENT INFORMATION
The
Company has two reportable operating segments. These segments are M2M
Services and Wireline Services. The M2M Services segment is made up
of all our cellular and satellite machine-to-machine communications hardware and
services. The Wireline Services segment includes our networking
hardware and services, video conferencing hardware, and our wire-line security
detection hardware.
The
Company’s chief operating decision maker is the Chief Executive Officer (CEO).
While the CEO is apprised of a variety of financial metrics and information, the
Company’s business is principally managed on a segment basis, with the CEO
evaluating performance based upon segment operating profit or loss that includes
an allocation of common expenses, but excludes certain unallocated expenses. The
CEO does not view segment results below operating profit (loss) before
unallocated costs, and therefore unallocated expenses, interest income and
other, net, and the provision for income taxes are not broken out by segment.
Items below segment operating profit/(loss) are reviewed on a consolidated
basis.
76
Summarized
below are the Company’s revenues and operating earnings (loss) by
reportable segment.
Certain
Corporate expenses are allocated to the segments based on segment
revenues.
|
For
the years ended December 31,
|
||||||||||||
|
(In
thousands, except per share data)
|
2009
|
2008
|
2007
|
|||||||||
|
Revenues:
|
||||||||||||
|
M2M
Services
|
$ | 47,381 | $ | 66,149 | $ | 62,825 | ||||||
|
Wireline
Services
|
3,455 | 6,170 | 5,179 | |||||||||
| $ | 50,836 | $ | 72,319 | $ | 68,004 | |||||||
|
Operating
earnings (loss):
|
||||||||||||
|
M2M
Services
|
$ | 3,382 | $ | (6,729 | ) | $ | 2,374 | |||||
|
Wireline
Services
|
1,162 | 916 | 680 | |||||||||
|
Unallocated
Corporate
|
(6,200 | ) | (576 | ) | (554 | ) | ||||||
| $ | (1,656 | ) | $ | (6,389 | ) | $ | 2,500 | |||||
|
Depreciation
and amortization:
|
||||||||||||
|
M2M
Services
|
$ | 2,754 | $ | 1,589 | $ | 1,801 | ||||||
|
Wireline
Services
|
27 | 965 | 194 | |||||||||
|
Unallocated
Corporate
|
617 | 553 | 498 | |||||||||
| $ | 3,398 | $ | 3,107 | $ | 2,493 | |||||||
|
Dec.
31,
|
Dec.
31,
|
|||||||||||
|
Identifiable
Assets:
|
2009 | 2008 | ||||||||||
|
M2M
Services
|
$ | 43,739 | $ | 49,598 | ||||||||
|
Wireline
Services
|
2,181 | 2,168 | ||||||||||
|
Unallocated
Corporate
|
6,827 | 10,740 | ||||||||||
| $ | 52,747 | $ | 62,506 | |||||||||
77
REPORT OF INDEPENDENT REGISTERED
PUBLIC ACCOUNTING FIRM ON CONSOLIDATED FINANCIAL
STATEMENTS
Board of
Directors and Shareholders
Numerex
Corp.
We have
audited the accompanying balance sheets of Numerex Corp. (a Pennsylvania
corporation) and subsidiaries (the “Company”) as of December 31, 2009 and 2008,
and the related consolidated statements of operations and comprehensive income
(loss), shareholders’ equity, and cash flows for each of the three years in the
period ended December 31, 2009. Our audits of the basic
financial statements included the financial statement schedule listed in the
index appearing under Item 15 (a)(2). These financial statements and financial
statement schedule are the responsibility of the Company’s management. Our responsibility is
to express an opinion on these financial statements and financial statement
schedule based on our audits.
We
conducted our audits in accordance with the standards of the Public Company
Accounting Oversight Board (United States). Those standards require that we plan
and perform the audit to obtain reasonable assurance about whether the financial
statements are free of material misstatement. An audit includes examining, on a
test basis, evidence supporting the amounts and disclosures in the financial
statements. An audit also includes assessing the accounting principles used and
significant estimates made by management, as well as evaluating the overall
financial statement presentation. We believe that our audits provide a
reasonable basis for our opinion.
In our
opinion, the financial statements referred to above present fairly, in all
material respects, the financial position of Numerex Corp. and subsidiaries as
of December 31, 2009 and 2008, and the results of their operations and their
cash flows for each of the three years in the period ended December 31, 2009 in
conformity with accounting principles generally accepted in the United States of
America. Also, in our opinion, the related financial statement schedule, when
considered in relation of the basic financial statements taken as a whole,
presents fairly, in all material respects, the information set forth
therein.
As
discussed in Note A, the Company adopted new accounting guidance on January 1,
2007 related to the accounting for uncertainty in income tax
reporting.
We also
have audited, in accordance with the standards of the Public Company Accounting
Oversight Board (United States), Numerex Corp. and subsidiaries’ internal
control over financial reporting as of December 31, 2009, based on criteria
established in Internal Control—Integrated Framework issued by the Committee of
Sponsoring Organizations of the Treadway Commission (COSO) and our report dated
March 29, 2010 expressed an unqualified opinion thereon.
/s/
Grant Thornton
Atlanta,
Georgia
March 29,
2009
78
Item 9. Changes in and Disagreements with Accountants on
Accounting and Financial Disclosure.
None.
Item 9A. Controls and Procedures.
Evaluation
of Disclosure Controls and Procedures
As of the
end of the period covered by this report, we carried out an evaluation, under
the supervision and with the participation of our management, including our
Chief Executive Officer and Chief Financial Officer (its principal executive
officer and principal financial officer), of the effectiveness of the design and
operation of our disclosure controls and procedures (as defined in the
Securities Exchange Act of 1934 Rules 13a-15(e) and 15d-15(e)). Our Chief
Executive Officer and Chief Financial Officer have concluded that our disclosure
controls and procedures are effective to ensure that information required to be
disclosed by us in the reports that we file or submit under the Exchange Act is
recorded, processed, summarized and reported within the time periods specified
in the rules and forms of the Securities and Exchange Commission and that such
information is accumulated and communicated to our management (including our
Chief Executive Officer and Chief Financial Officer) to allow timely decisions
regarding required disclosures. Based on such evaluation, our Chief Executive
Officer and Chief Financial Officer have concluded these disclosure controls are
effective as of December 31, 2009.
Changes
in Internal Control Over Financial Reporting
During
the quarter ended December 31, 2009, there were no changes in our internal
control over financial reporting that have materially affected, or are
reasonably likely to materially affect, our internal control over financial
reporting.
Management’s
Annual Report on Internal Control Over Financial Reporting
Our
management is responsible for establishing and maintaining adequate internal
control over financial reporting as such term is defined in the Securities
Exchange Act Rules 13a – 15(f). Our internal control system is
designed to provide reasonable assurance to our management and the Board of
Directors regarding the preparation and fair presentation of published financial
statements. All internal control systems, no matter how well designed, have
inherent limitations. Therefore, even those systems determined to be effective
can provide only reasonable assurance as to the reliability of financial
statement preparation and presentation. Our management
assessed the effectiveness of our internal control over financial reporting as
of December 31, 2009. In making this assessment, our management
used the criteria set forth by the Committee of Sponsoring Organizations of the
Treadway Commission (“COSO”) in Internal Control – Integrated
Framework. Based on this assessment, management concludes that, as of
December 31, 2009, our internal control over financial reporting is
effective based on those criteria.
79
REPORT
OF INDEPENDENT REGISTERED PUBLIC ACCOUNTING FIRM ON INTERNAL CONTROL OVER
FINANCIAL REPORTING
Board of
Directors and Shareholders
Numerex
Corp. and subsidiaries
We have
audited Numerex Corp. (a Pennsylvania Corporation) and subsidiaries (the
“Company”) internal control over financial reporting as of December 31, 2009,
based on criteria established in Internal Control—Integrated
Framework issued by the Committee of Sponsoring Organizations of the
Treadway Commission (COSO). Numerex Corp. and subsidiaries’
management is responsible for maintaining effective internal control over
financial reporting and for its assessment of the effectiveness of internal
control over financial reporting, included in the accompanying Management’s
Report on Internal Controls over Financial Reporting. Our responsibility is to
express an opinion on Numerex Corp. and subsidiaries’ internal control over
financial reporting based on our audit.
We
conducted our audit in accordance with the standards of the Public Company
Accounting Oversight Board (United States). Those standards require that we plan
and perform the audit to obtain reasonable assurance about whether effective
internal control over financial reporting was maintained in all material
respects. Our audit included obtaining an understanding of internal control over
financial reporting, assessing the risk that a material weakness exists, testing
and evaluating the design and operating effectiveness of internal control based
on the assessed risk, and performing such other procedures as we considered
necessary in the circumstances. We believe that our audit provides a reasonable
basis for our opinion.
A
company’s internal control over financial reporting is a process designed to
provide reasonable assurance regarding the reliability of financial reporting
and the preparation of financial statements for external purposes in accordance
with generally accepted accounting principles. A company’s internal control over
financial reporting includes those policies and procedures that (1) pertain to
the maintenance of records that, in reasonable detail, accurately and fairly
reflect the transactions and dispositions of the assets of the company; (2)
provide reasonable assurance that transactions are recorded as necessary to
permit preparation of financial statements in accordance with generally accepted
accounting principles, and that receipts and expenditures of the company are
being made only in accordance with authorizations of management and directors of
the company; and (3) provide reasonable assurance regarding prevention or timely
detection of unauthorized acquisition, use, or disposition of the company’s
assets that could have a material effect on the financial
statements.
Because
of its inherent limitations, internal control over financial reporting may not
prevent or detect misstatements. Also, projections of any evaluation of
effectiveness to future periods are subject to the risk that controls may become
inadequate because of changes in conditions, or that the degree of compliance
with the policies or procedures may deteriorate.
In our
opinion, Numerex Corp. maintained, in all material respects, effective internal
control over financial reporting as of December 31, 2009, based on criteria
established in Internal
Control—Integrated Framework issued by COSO.
We also
have audited, in accordance with the standards of the Public Company Accounting
Oversight Board (United States), the consolidated balance sheets of Numerex
Corp. and subsidiaries as of December 31, 2009 and 2008, and the related
consolidated statements of operations and comprehensive income (loss),
shareholders’ equity, and cash flows for each of the three years in the period
ended December 31, 2009 and our report dated
March 29, 2010 expressed an unqualified opinion on those financial
statements.
/s/
Grant Thornton
Atlanta,
Georgia
March 29,
2010
80
Item 9B. Other Information.
None.
PART III
Item 10. Directors, Executive Officers of the
Registrant and Corporate Governance
Except as
set forth above under “Business - Executive Officers of the Registrant,” the
information required by Item 10 of Form 10-K is incorporated by reference from
the Company's Proxy Statement relating to the 2010 Annual Meeting of
Shareholders to be filed pursuant to General Instruction G (3) to Form 10-K.
Also incorporated by reference is the information under the caption “Section
16(a) Beneficial Ownership Reporting Compliance.”
Item 11. Executive Compensation.
Incorporated
by reference from our Proxy Statement relating to the 2010 Annual Meeting of
Shareholders to be filed pursuant to General Instruction G (3) to Form
10-K.
Item 12. Security Ownership of Certain Beneficial
Owners and Management and Related Stockholder Matters.
The
information required by Item 12 of Form 10-K is incorporated by reference from
our Company's Proxy Statement relating to the 2010 Annual Meeting of
Shareholders to be filed pursuant to General Instruction G (3) to Form
10-K.
Item 13. Certain Relationships and Related
Transactions and Director Independence.
Incorporated
by reference from our Proxy Statement relating to the 2010 Annual Meeting of
Shareholders to be filed pursuant to General Instruction G (3) to Form
10-K.
Item 14. Principal Accounting Fees and
Services
Incorporated
by reference from our Proxy Statement relating to the 2010 Annual Meeting of
Shareholders to be filed pursuant to General Instruction G (3) to Form
10-K.
81
PART IV
Item 15. Exhibits, Financial Statement
Schedules.
(a) Documents
filed as part of this report:
|
1.
|
Consolidated
Financial Statements. All financial statements of the Company as described
in Item I of this report on Form 10-K. The consolidated
financial statements required to be filed hereunder are listed in the
Index to Consolidated Financial Statements on page 43 of this
report.
|
|
2.
|
Financial
statement schedule included in Part IV of this
Form:
|
Reports of Independent Registered Public Accounting Firm
Schedule II -
Valuation and qualifying accounts
82
|
3. Exhibits
|
2.112
Asset Purchase Agreement, by and between Orbit One Communications LLC and
Orbit One Communications, Inc., effective as of July 31, 2007.
3.11
Amended and Restated Articles of Incorporation of the
Company
3.21
Bylaws of the Company
4.12
Common Stock Purchase Warrant, dated May 30, 2006 by and between the
Company and Laurus Master Fund, Ltd.
|
|
4.23
Common Stock Purchase Warrant, dated December 29, 2006 by and
between the Company and Laurus Master Fund,
Ltd.
|
|
|
4.34
Common Stock Purchase Warrant, dated January 13, 2004 by and
between the Company and Laurus Master Fund,
Ltd.
|
|
|
4.45
Common Stock Purchase Warrant, dated January 28, 2005 by and
between the Company and Laurus Master Fund,
Ltd.
|
10.
16
Registration Agreement between the Company and Dominion dated July 13,
1992
|
|
10.
27
Letter Agreement between the Company and Dominion (now Gwynedd)
dated October 25, 1994 re: designation of
director
|
|
|
10.
38
2006 Long-Term Incentive Plan (2006
Plan)*
|
|
|
10.49
Form of Non-Qualified Stock Option Grant Agreement (consultants)
under 2006 Long-Term Incentive
Plan*
|
|
|
10.
59
Form of Non-Qualified Stock Option Grant Agreement (non-employee
directors) under 2006 Long-Term Incentive
Plan*
|
10.
69 Form
of Incentive Stock Option Grant Agreement (employees) under 2006 Long-Term
Incentive Plan*
|
|
10.710
Severance Agreement, by and between Stratton Nicolaides and the Company
dated November 1, 2006. (Management Compensation
Plan)*
|
|
|
10.810
Severance Agreement, by and between Alan Catherall and the Company dated
November 1, 2006. (Management Compensation
Plan)*
|
|
|
10.910
Severance Agreement, by and between Michael Marett and the Company dated
November 1, 2006. (Management Compensation
Plan)*
|
|
|
10.1011
Subcontract Agreement by and between Stratix Corporation and Orbit One
Communications, Inc., dated as of June 1, 2007 (with certain information
omitted pursuant to a request for confidential treatment and filed
separately with the Securities and Exchange
Commission).
|
|
11
|
Computation
of Earnings Per Share
|
|
21
|
Subsidiaries
of Numerex Corp.
|
|
23
|
Consent
of Grant Thornton, LLP
|
83
|
|
24 Power
of Attorney (included with signature
page)
|
|
31.1
|
Rule
13a-14(a) Certification of Chief Executive
Officer
|
|
31.2
|
Rule
13a-14(a) Certification of Chief Financial
Officer
|
|
32.1
|
Rule
13a-14(b) Certification of Chief Executive
Officer
|
|
32.2
|
Rule
13a-14(b) Certification of Chief Financial
Officer
|
*Indicates
a management contract of any compensatory plan, contract or
arrangement.
|
1
|
Incorporated
by reference to the Exhibits filed with the Company's Annual Report on
Form 10-K filed with the Securities and Exchange Commission for the year
ended October 31, 1995 (File No.
0-22920)
|
|
2
|
Incorporated
by reference to the Exhibits filed with the Company's Current Report on
Form 8-K Filed with the Securities and Exchange Commission on June 5, 2006
(File No. 0-22920)
|
|
3
|
Incorporated
by reference to the Exhibits filed with the Company's Current Report on
Form 8-K Filed with the Securities and Exchange Commission on January 5,
2007 (File No. 0-22920)
|
|
4
|
Incorporated
by reference to the Exhibit filed with the Company's Current Report on
Form 8-K filed with the Securities and Exchange Commission on January 15,
2004 (File No. 0-22920)
|
|
5
|
Incorporated
by reference to the Exhibits filed with the Company's Current Report on
Form 8-K Filed with the Securities and Exchange Commission on February 3,
2005, 2005 (File No. 0-22920)
|
|
6
|
Incorporated
by reference to the Exhibit filed with the Company's Current Report on
Form 8-K filed with the Securities and Exchange Commission on July 20,
1994 (File No. 0-22920)
|
|
7
|
Incorporated
by reference to the Exhibits filed with the Company’s Registration
Statement on Form S-1 filed with the Securities and Exchange Commission
(File No. 33-89794)
|
|
8
|
Incorporated
by reference to the Exhibits filed with the Company's Proxy Statement on
Schedule 14A filed with the Securities and Exchange Commission on April
10, 2006 (File No. 0-22920)
|
|
9
|
Incorporated
by reference to the Exhibits filed with the Company’s Current Report on
Form 8-K filed with the Securities and Exchange Commission on July 12,
2007 (File No. 0-22920)
|
|
10
|
Incorporated
by reference to the Exhibits filed with the Company's Quarterly Report on
Form 10-Q filed with the Securities and Exchange Commission on November
14, 2006 (File No. 0-22920)
|
|
11
|
Incorporated
by reference to the Exhibits filed with the Company's Quarterly Report on
Form 10-Q filed with the Securities and Exchange Commission on November
14, 2007 (File No. 0-22920)
|
|
12
|
Incorporated
by reference to the Exhibits filed with the Company's Current Report on
Form 8-K filed with Securities and Exchange Commission on August 6, 2007
(File No. 0-22920)
|
84
SCHEDULE
II
NUMEREX
CORP.
VALUATION
AND QUALIFYING ACCOUNTS
Years
ended December 31, 2009, 2008, 2007
(in
thousands)
|
Description
|
Balance
at beginning of Period
|
Additions
charged to expense
|
Deductions
|
Balance
at end of Period
|
||||||||||||
|
Year
ended December 31, 2009:
|
||||||||||||||||
|
Accounts
receivable
|
||||||||||||||||
|
Allowance
for uncollectible accounts
|
1,010 | 536 | (998 | ) | $ | 548 | ||||||||||
|
Inventory
|
||||||||||||||||
|
Allowance
for obsolescence
|
606 | 110 | (277 | ) | 439 | |||||||||||
|
Year
ended December 31, 2008:
|
||||||||||||||||
|
Accounts
receivable
|
||||||||||||||||
|
Allowance
for uncollectible accounts
|
1,009 | 1,102 | (1,101 | ) | 1,010 | |||||||||||
|
Inventory
|
||||||||||||||||
|
Allowance
for obsolescence
|
340 | 476 | (210 | ) | 606 | |||||||||||
|
Year
ended December 31, 2007:
|
||||||||||||||||
|
Accounts
receivable
|
||||||||||||||||
|
Allowance
for uncollectible accounts
|
935 | 635 | (561 | )a | 1,009 | |||||||||||
|
Inventory
|
||||||||||||||||
|
Allowance
for obsolescence
|
353 | 99 | (112 | ) | 340 | |||||||||||
|
(a)
Amounts written off as uncollectible, net of
recoveries.
|
||||||||||||||||
85
SIGNATURES
Pursuant
to the requirements of Section 13 or 15(d) of the Securities Exchange Act of
1934, the registrant has duly caused this report to be signed on its behalf by
the undersigned, thereunto duly authorized.
NUMEREX CORP.
By: /s/
Stratton J. Nicolaides
Stratton
J. Nicolaides,
Chairman
and Chief Executive Officer
Date:
March 29, 2010
POWER OF
ATTORNEY
KNOWN ALL
PERSONS BY THESE PRESENTS, that each person whose signature appears below
constitutes and appoints [Alan Catherall and Andrew Ryan], and each of them, as
his true and lawful attorneys-in-fact and agents, each with full power of
substitution and resubstitution, for him and in his name, place and stead, in
any and all capacities, to sign any and all amendments to this Annual Report on
Form 10-K, and to file the same, with all exhibits thereto, and other
documents in connection therewith, with the Securities and Exchange Commission,
granting unto said attorneys-in-fact and agents, full power and authority to do
and perform each and every act and thing requisite and necessary to be done in
connection therewith, as fully to all intents and purposes as he might or could
do in person, hereby ratifying and confirming all that said attorney-in-fact and
agent, or his substitute or substitutes, may lawfully do or cause to be done by
virtue hereof.
Pursuant
to the requirements of the Securities Exchange Act of 1934, this report has been
signed below by the following persons on behalf of the registrant and in the
capacities and on the dates indicated.
|
Signature
|
Title
|
Date
|
|
/s/ Stratton J. Nicolaides
|
Chairman
and Chief Executive Office
|
March
29, 2010
|
|
Stratton
J. Nicolaides
|
||
|
/s/ Brian C. Beazer
|
Director
|
March
29, 2010
|
|
Brian
C. Beazer
|
||
|
/s/ George Benson
|
Director
|
March
29, 2010
|
|
George
Benson
|
||
|
/s/ E. James Constantine
|
Director
|
March
29, 2010
|
|
E.
James Constantine
|
||
|
/s/ John G. Raos
|
Director
|
March
29, 2010
|
|
John
G. Raos
|
||
|
/s/ Andrew J. Ryan
|
Director
|
March
29, 2010
|
|
Andrew
J. Ryan
|
||
|
/s/ Alan B. Catherall
|
Executive
Vice President,
|
March
29, 2010
|
|
Alan
B. Catherall
|
Chief
Financial Officer, Principal
|
|
|
Financial
and Accounting Officer
|
86