Attached files
| file | filename |
|---|---|
| 8-K - 8-K - FiberTower CORP | a10-6789_18k.htm |
Exhibit 99.1
|
|
FiberTower Corporation CTIA Investor Day Presentation March 24, 2010 |
|
|
Safe Harbor Statement FiberTower Confidential Statements included in this presentation which are not historical in nature are “forward-looking” statements, as that term is defined in the Private Securities Litigation Reform Act of 1995 or by the Securities and Exchange Commission, or SEC, in its rules, regulations and releases. Forward-looking statements relate to expectations, beliefs, projections, future plans and strategies, anticipated events or trends and similar expressions concerning matters that are not historical facts. These include statements regarding, among other things, guidance for expected ranges of 2010 revenue, adjusted EBITDA and capital acquisitions, our financial and business prospects, the deployment of our services, capital requirements, financing prospects, planned capital expenditures, expected cost per site, anticipated customer growth, expansion plans, and anticipated cash balances. There are many risks, uncertainties and other factors that can prevent the achievement of goals or cause results to differ materially form those expressed or implied by these forward-looking statements including, among other things, negative cash flows and operating losses, additional liquidity requirements, potential loss of significant customers, downturns on the wireless communications industry, regulatory costs and restrictions, potential loss of FCC licenses, equipment supply disruptions and cost increases, competition from alternative backhaul service providers and technologies, along with those risk factors described in the Company’s Annual Reports on Form 10-K and Quarterly Reports on Form 10-Q, as filed with the SEC. |
|
|
Agenda FiberTower Confidential Kurt Van Wagenen – President & Chief Executive Officer Ravi Potharlanka – SVP & Chief Operating Officer David Jones – SVP, Network Services Patrick Coughlin – SVP, Sales & Marketing Thomas Scott – SVP & Chief Financial Officer |
|
|
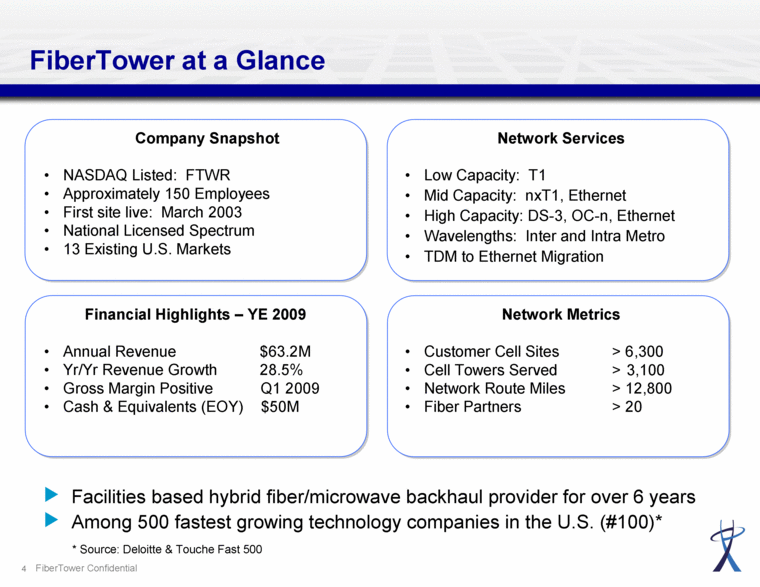
Financial Highlights – YE 2009 Annual Revenue $63.2M Yr/Yr Revenue Growth 28.5% Gross Margin Positive Q1 2009 Cash & Equivalents (EOY) $50M Network Metrics Customer Cell Sites > 6,300 Cell Towers Served > 3,100 Network Route Miles > 12,800 Fiber Partners > 20 Network Services Low Capacity: T1 Mid Capacity: nxT1, Ethernet High Capacity: DS-3, OC-n, Ethernet Wavelengths: Inter and Intra Metro TDM to Ethernet Migration Company Snapshot NASDAQ Listed: FTWR Approximately 150 Employees First site live: March 2003 National Licensed Spectrum 13 Existing U.S. Markets FiberTower at a Glance FiberTower Confidential Facilities based hybrid fiber/microwave backhaul provider for over 6 years Among 500 fastest growing technology companies in the U.S. (#100)* * Source: Deloitte & Touche Fast 500 |
|
|
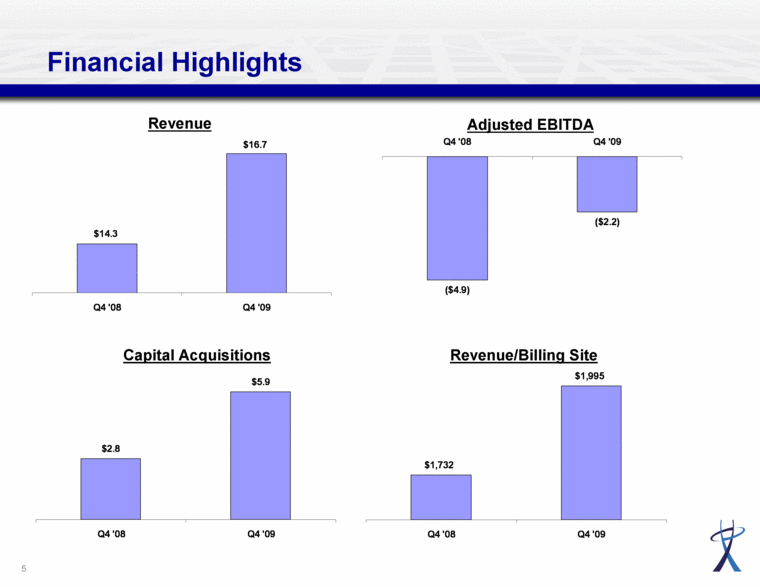
Financial Highlights Revenue Adjusted EBITDA Capital Acquisitions Revenue/Billing Site $14.3 $16.7 Q4 '08 Q4 '09 $2.8 $5.9 Q4 '08 Q4 '09 ($4.9) ($2.2) Q4 '08 Q4 '09 $1,732 $1,995 Q4 ’08 Q4 ‘09 |
|
|
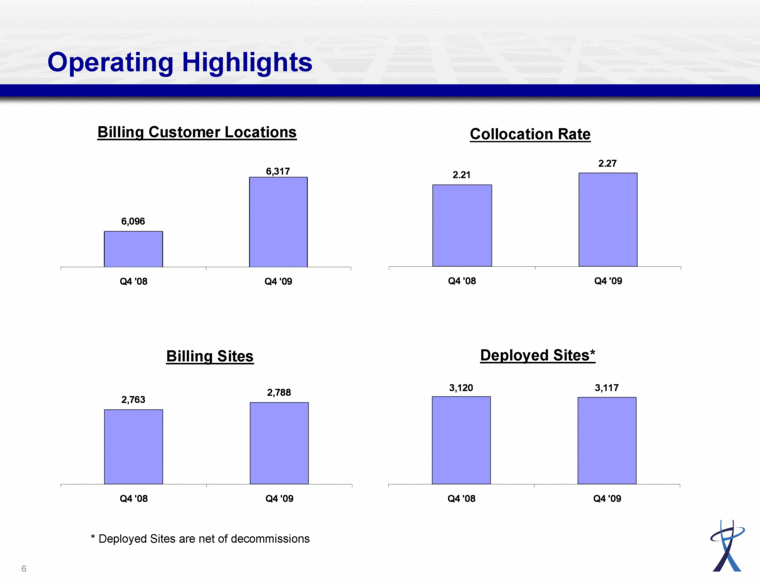
Operating Highlights Billing Customer Locations Collocation Rate Billing Sites Deployed Sites* * Deployed Sites are net of decommissions 6,096 6,317 Q4 '08 Q4 '09 3,120 3,117 Q4 '08 Q4 '09 2,763 2,788 Q4 '08 Q4 '09 2.21 2.27 Q4 ’08 Q4 '09 |
|
|
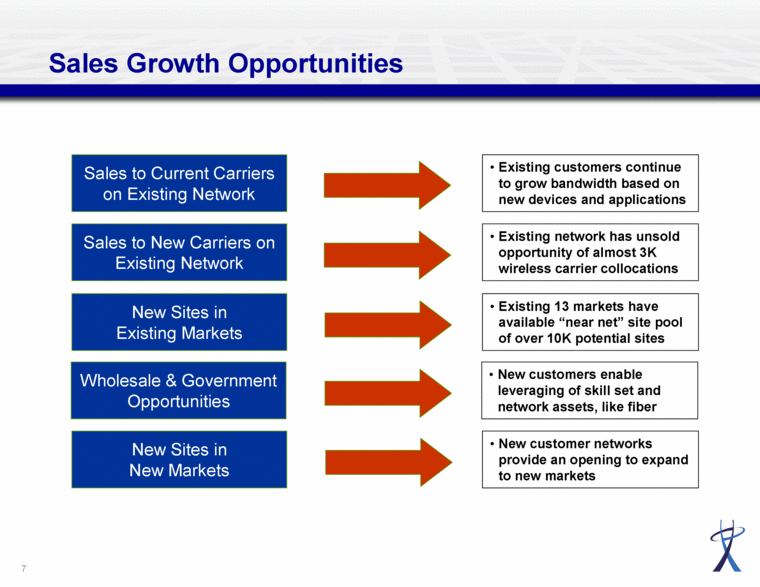
Sales to Current Carriers on Existing Network Sales to New Carriers on Existing Network New Sites in Existing Markets Wholesale & Government Opportunities New Sites in New Markets Sales Growth Opportunities Existing customers continue to grow bandwidth based on new devices and applications Existing network has unsold opportunity of almost 3K wireless carrier collocations Existing 13 markets have available “near net” site pool of over 10K potential sites New customers enable leveraging of skill set and network assets, like fiber New customer networks provide an opening to expand to new markets |
|
|
Ravi Potharlanka – Market Opportunity and Positioning |
|
|
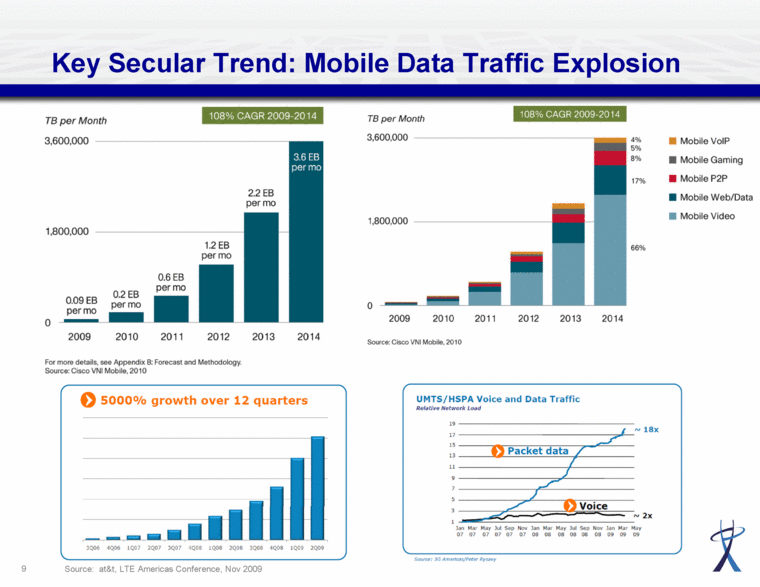
Key Secular Trend: Mobile Data Traffic Explosion Source: at&t, LTE Americas Conference, Nov 2009 |
|
|
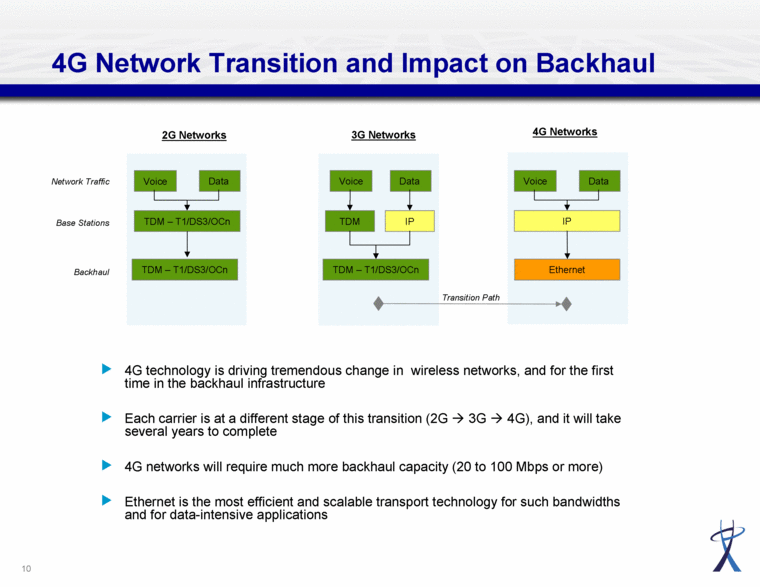
4G Network Transition and Impact on Backhaul 4G technology is driving tremendous change in wireless networks, and for the first time in the backhaul infrastructure Each carrier is at a different stage of this transition (2G 3G 4G), and it will take several years to complete 4G networks will require much more backhaul capacity (20 to 100 Mbps or more) Ethernet is the most efficient and scalable transport technology for such bandwidths and for data-intensive applications Voice Data Network Traffic Base Stations Backhaul TDM – T1/DS3/OCn TDM – T1/DS3/OCn Voice Data TDM TDM – T1/DS3/OCn IP Voice Data IP Ethernet 2G Networks 3G Networks 4G Networks Transition Path |
|
|
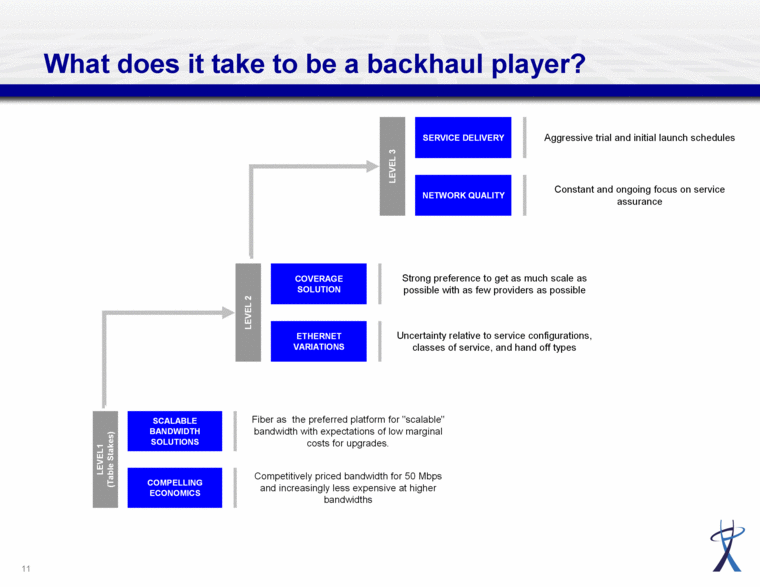
What does it take to be a backhaul player? SCALABLE BANDWIDTH SOLUTIONS Fiber as the preferred platform for "scalable" bandwidth with expectations of low marginal costs for upgrades. COMPELLING ECONOMICS Competitively priced bandwidth for 50 Mbps and increasingly less expensive at higher bandwidths LEVEL1 (Table Stakes) SERVICE DELIVERY Aggressive trial and initial launch schedules NETWORK QUALITY Constant and ongoing focus on service assurance LEVEL 3 COVERAGE SOLUTION Strong preference to get as much scale as possible with as few providers as possible ETHERNET VARIATIONS Uncertainty relative to service configurations, classes of service, and hand off types LEVEL 2 |
|
|
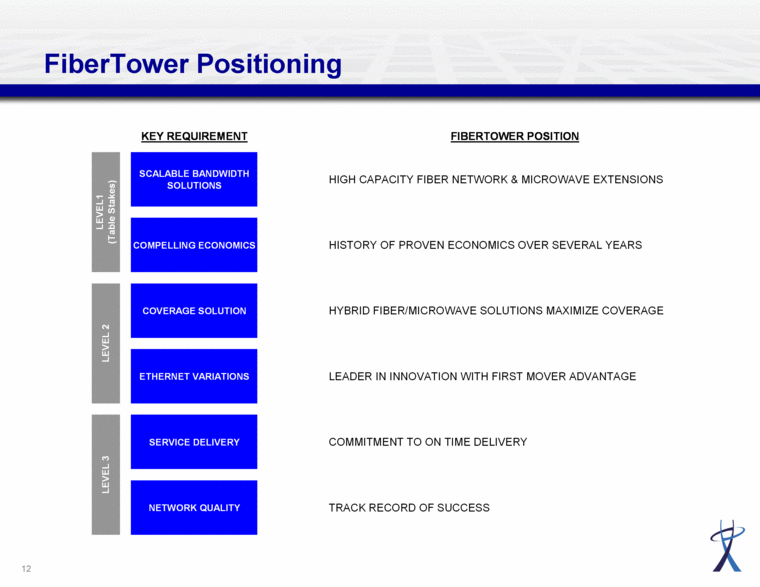
FiberTower Positioning KEY REQUIREMENT FIBERTOWER POSITION SCALABLE BANDWIDTH SOLUTIONS HIGH CAPACITY FIBER NETWORK & MICROWAVE EXTENSIONS COMPELLING ECONOMICS HISTORY OF PROVEN ECONOMICS OVER SEVERAL YEARS COVERAGE SOLUTION HYBRID FIBER/MICROWAVE SOLUTIONS MAXIMIZE COVERAGE ETHERNET VARIATIONS LEADER IN INNOVATION WITH FIRST MOVER ADVANTAGE SERVICE DELIVERY COMMITMENT TO ON TIME DELIVERY NETWORK QUALITY TRACK RECORD OF SUCCESS LEVEL1 (Table Stakes) LEVEL 2 LEVEL 3 |
|
|
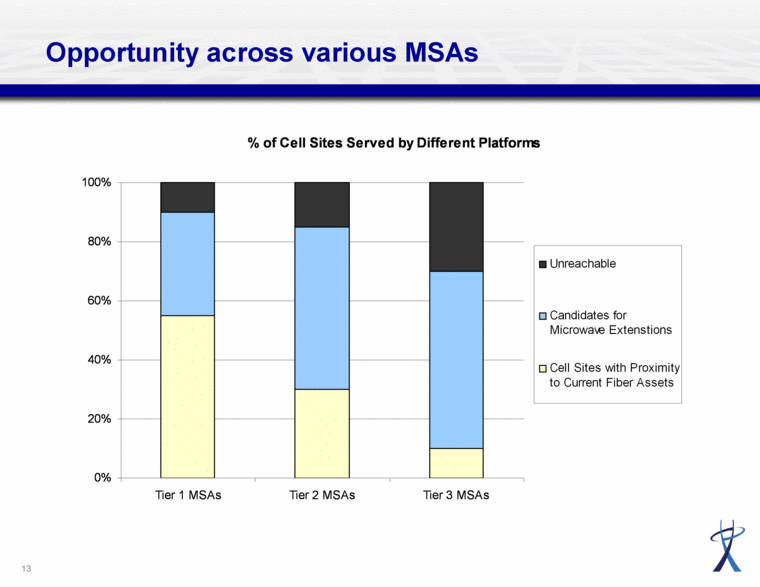
Opportunity across various MSAs % of Cell Sites Served by Different Platforms 0% 20% 40% 60% 80% 100% Tier 1 MSAs Tier 2 MSAs Tier 3 MSAs Unreachable Candidates for Microwave Extenstions Cell Sites with Proximity to Current Fiber Assets |
|
|
Dave Jones - Network and Technology Initiatives |
|
|
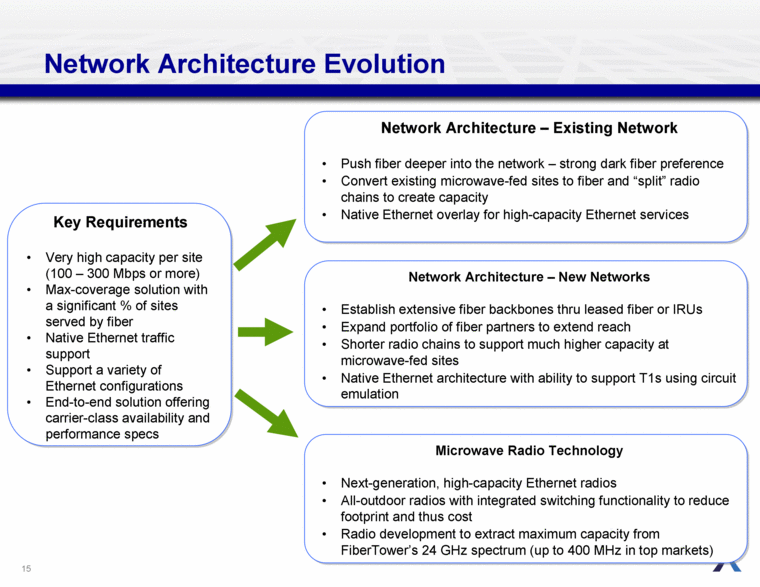
Network Architecture Evolution Network Architecture – Existing Network Push fiber deeper into the network – strong dark fiber preference Convert existing microwave-fed sites to fiber and “split” radio chains to create capacity Native Ethernet overlay for high-capacity Ethernet services Key Requirements Very high capacity per site (100 – 300 Mbps or more) Max-coverage solution with a significant % of sites served by fiber Native Ethernet traffic support Support a variety of Ethernet configurations End-to-end solution offering carrier-class availability and performance specs Microwave Radio Technology Next-generation, high-capacity Ethernet radios All-outdoor radios with integrated switching functionality to reduce footprint and thus cost Radio development to extract maximum capacity from FiberTower’s 24 GHz spectrum (up to 400 MHz in top markets) Network Architecture – New Networks Establish extensive fiber backbones thru leased fiber or IRUs Expand portfolio of fiber partners to extend reach Shorter radio chains to support much higher capacity at microwave-fed sites Native Ethernet architecture with ability to support T1s using circuit emulation |
|
|
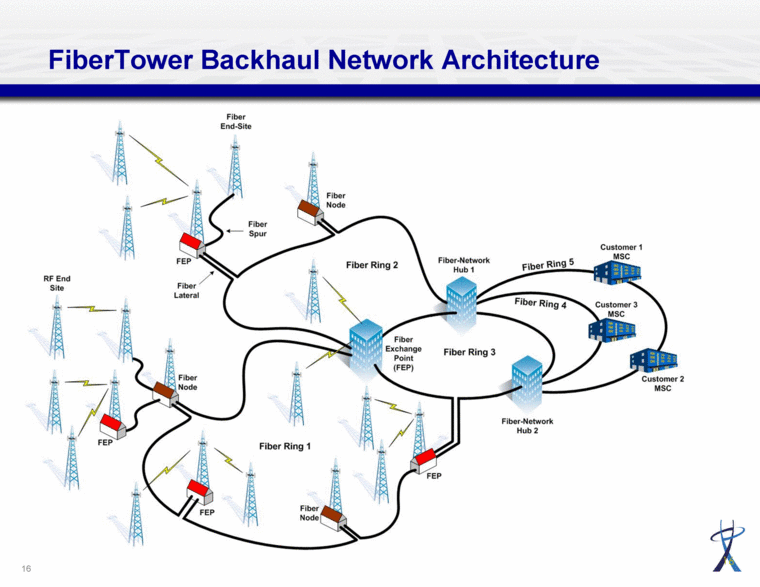
16 FiberTower Backhaul Network Architecture |
|
|
Patrick Coughlin – Customer Feedback |
|
|
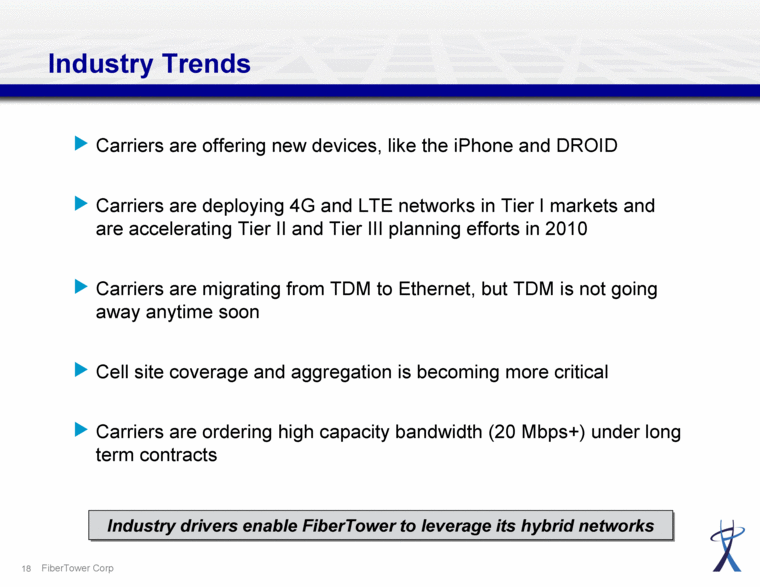
Industry Trends Carriers are offering new devices, like the iPhone and DROID Carriers are deploying 4G and LTE networks in Tier I markets and are accelerating Tier II and Tier III planning efforts in 2010 Carriers are migrating from TDM to Ethernet, but TDM is not going away anytime soon Cell site coverage and aggregation is becoming more critical Carriers are ordering high capacity bandwidth (20 Mbps+) under long term contracts FiberTower Corp Industry drivers enable FiberTower to leverage its hybrid networks |
|
|
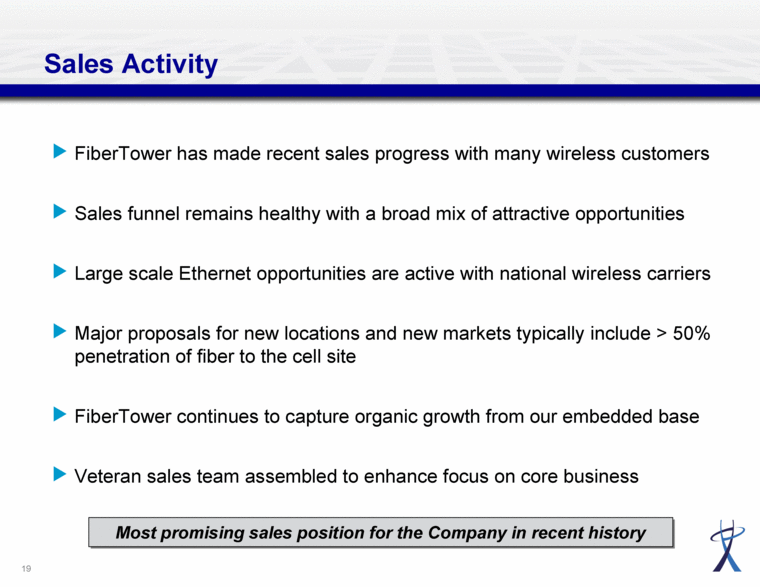
Sales Activity FiberTower has made recent sales progress with many wireless customers Sales funnel remains healthy with a broad mix of attractive opportunities Large scale Ethernet opportunities are active with national wireless carriers Major proposals for new locations and new markets typically include > 50% penetration of fiber to the cell site FiberTower continues to capture organic growth from our embedded base Veteran sales team assembled to enhance focus on core business Most promising sales position for the Company in recent history |
|
|
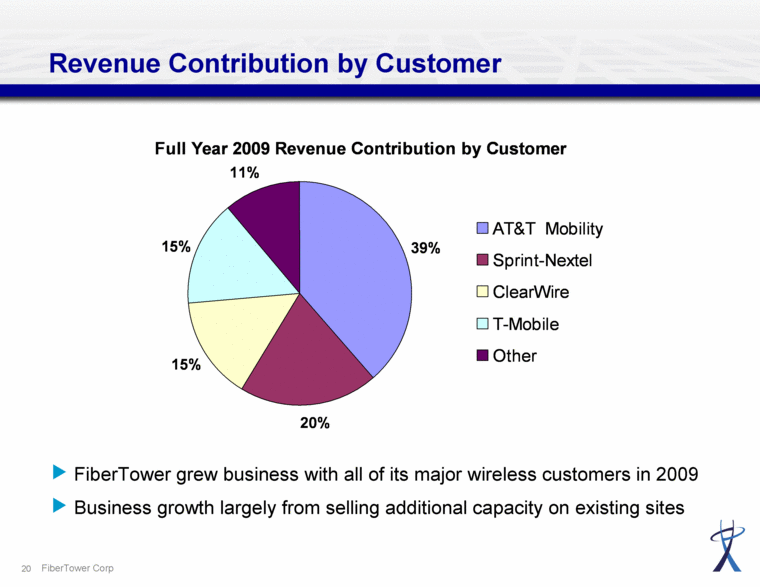
Revenue Contribution by Customer FiberTower grew business with all of its major wireless customers in 2009 Business growth largely from selling additional capacity on existing sites FiberTower Corp Full Year 2009 Revenue Contribution by Customer 39% 20% 15% 15% 11% AT&T Mobility Sprint-Nextel ClearWire T-Mobile Other |
|
|
Thomas Scott - Financial Review |
|
|
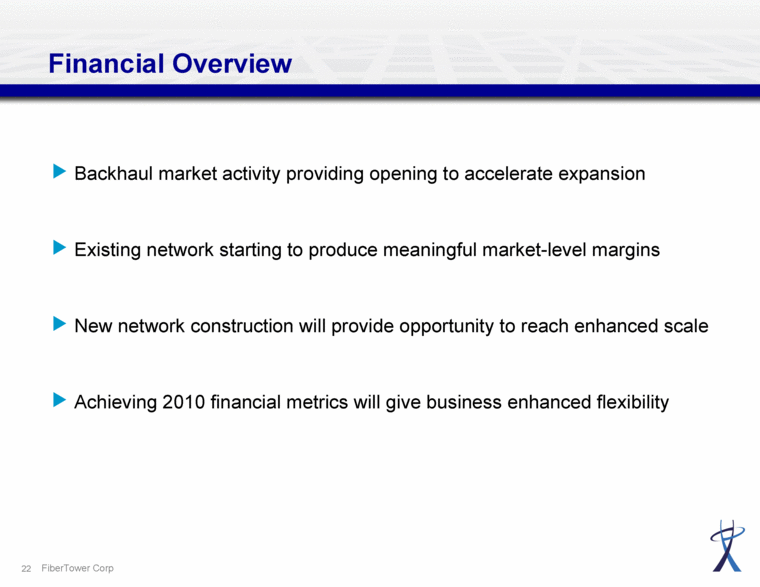
Financial Overview Backhaul market activity providing opening to accelerate expansion Existing network starting to produce meaningful market-level margins New network construction will provide opportunity to reach enhanced scale Achieving 2010 financial metrics will give business enhanced flexibility FiberTower Corp |
|
|
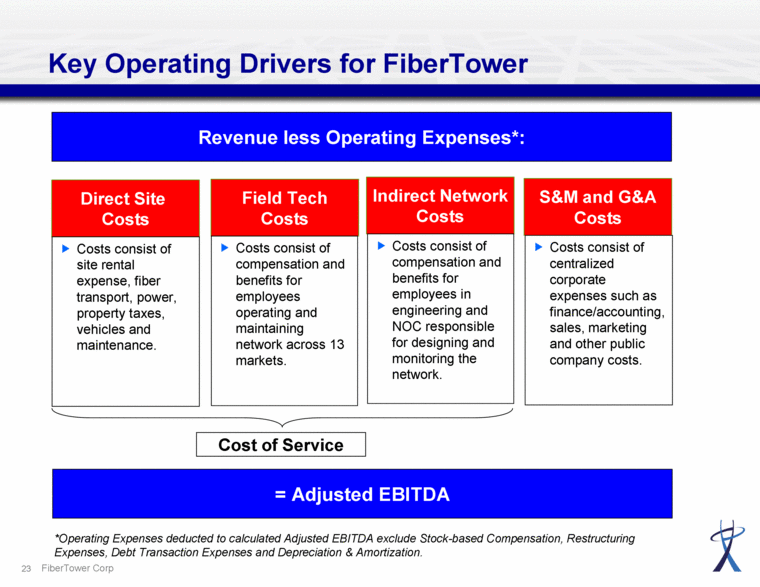
Key Operating Drivers for FiberTower FiberTower Corp Direct Site Costs Costs consist of site rental expense, fiber transport, power, property taxes, vehicles and maintenance. Field Tech Costs Costs consist of compensation and benefits for employees operating and maintaining network across 13 markets. Indirect Network Costs Costs consist of compensation and benefits for employees in engineering and NOC responsible for designing and monitoring the network. S&M and G&A Costs Costs consist of centralized corporate expenses such as finance/accounting, sales, marketing and other public company costs. Revenue less Operating Expenses*: = Adjusted EBITDA Cost of Service *Operating Expenses deducted to calculated Adjusted EBITDA exclude Stock-based Compensation, Restructuring Expenses, Debt Transaction Expenses and Depreciation & Amortization. |
|
|
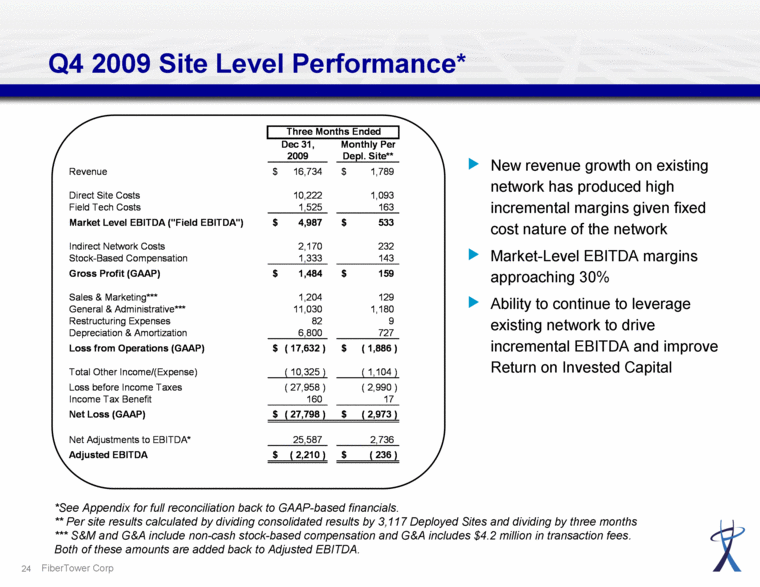
Q4 2009 Site Level Performance* FiberTower Corp *See Appendix for full reconciliation back to GAAP-based financials. ** Per site results calculated by dividing consolidated results by 3,117 Deployed Sites and dividing by three months *** S&M and G&A include non-cash stock-based compensation and G&A includes $4.2 million in transaction fees. Both of these amounts are added back to Adjusted EBITDA. New revenue growth on existing network has produced high incremental margins given fixed cost nature of the network Market-Level EBITDA margins approaching 30% Ability to continue to leverage existing network to drive incremental EBITDA and improve Return on Invested Capital $ ( 236 ) $ (2,210) Adjusted EBITDA 2,736 25,587 Net Adjustments to EBITDA* $ (2,973) $ ( 27,798 ) Net Loss (GAAP) 17 160 Income Tax Benefit (2,990 ) ( 27,958 ) Loss before Income Taxes ( 1,104 ) (10,325 ) Total Other Income/(Expense) $(1,886) $ (17,632) Loss from Operations (GAAP) 727 6,800 Depreciation & Amortization 9 82 Restructuring Expenses 1,180 11,030 General & Administrative*** 129 1,204 Sales & Marketing*** $ 159 $ 1,484 Gross Profit (GAAP) 143 1,333 Stock-Based Compensation 232 2,170 Indirect Network Costs $ 533 $ 4,987 Market Level EBITDA ("Field EBITDA") 163 1,525 Field Tech Costs 1,093 10,222 Direct Site Costs $ 1,789 $ 16,734 Revenue Depl. Site** 2009 Monthly Per Dec 31, Three Months Ended |
|
|
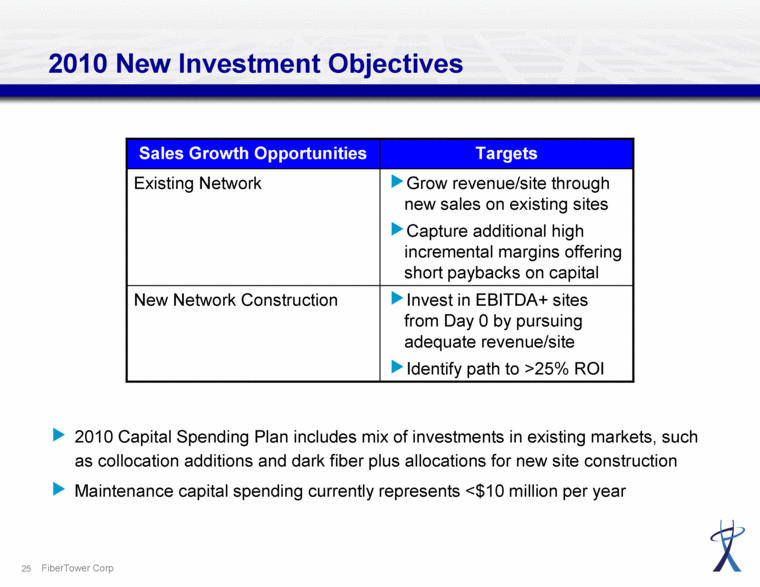
2010 New Investment Objectives FiberTower Corp Invest in EBITDA+ sites from Day 0 by pursuing adequate revenue/site Identify path to >25% ROI New Network Construction Grow revenue/site through new sales on existing sites Capture additional high incremental margins offering short paybacks on capital Existing Network Targets Sales Growth Opportunities 2010 Capital Spending Plan includes mix of investments in existing markets, such as collocation additions and dark fiber plus allocations for new site construction Maintenance capital spending currently represents <$10 million per year |
|
|
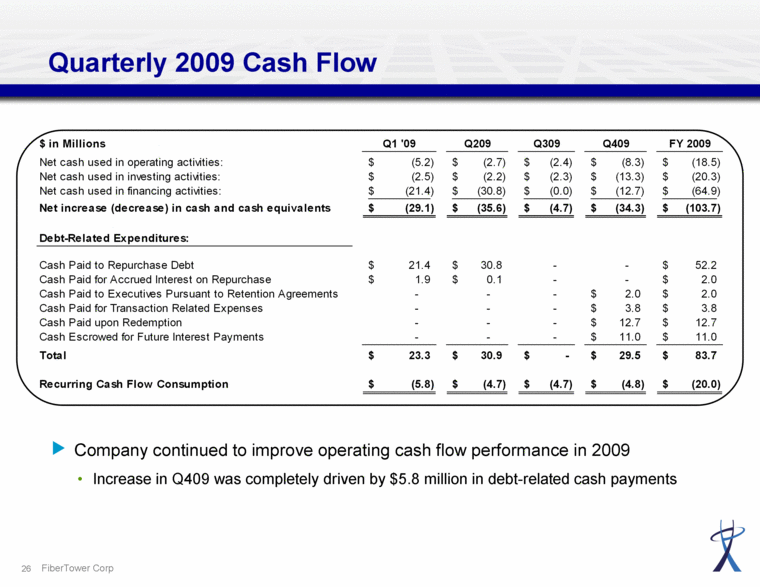
Quarterly 2009 Cash Flow Company continued to improve operating cash flow performance in 2009 Increase in Q409 was completely driven by $5.8 million in debt-related cash payments FiberTower Corp $ in Millions Q1 '09 Q209 Q309 Q409 FY 2009 Net cash used in operating activities: $(5.2) $(2.7) $(2.4) $(8.3) $(18.5) Net cash used in investing activities: $(2.5) $(2.2) $(2.3) $(13.3) $(20.3) Net cash used in financing activities: $(21.4) $(30.8) $(0.0) $(12.7) $(64.9) Net increase (decrease) in cash and cash equivalents $(29.1) $(35.6) $(4.7) $(34.3) $(103.7) Debt-Related Expenditures: Cash Paid to Repurchase Debt $21.4 $30.8 - - $52.2 Cash Paid for Accrued Interest on Repurchase $1.9 $0.1 - - $2.0 Cash Paid to Executives Pursuant to Retention Agreements - - - $2.0 $2.0 Cash Paid for Transaction Related Expenses - - - $3.8 $3.8 Cash Paid upon Redemption - - - $12.7 $12.7 Cash Escrowed for Future Interest Payments - - - $11.0 $11.0 Total $23.3 $30.9 $- $29.5 $83.7 Recurring Cash Flow Consumption $(5.8) $(4.7) $(4.7) $(4.8) $(20.0) |
|
|
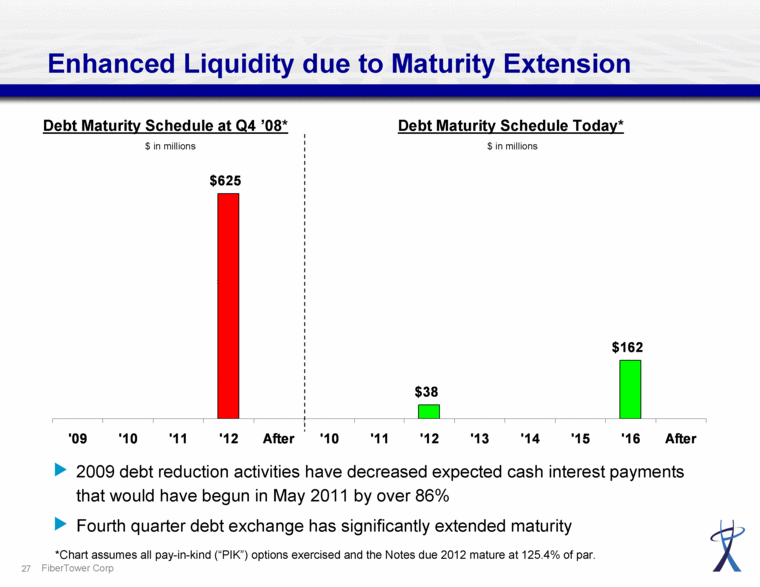
Enhanced Liquidity due to Maturity Extension 2009 debt reduction activities have decreased expected cash interest payments that would have begun in May 2011 by over 86% Fourth quarter debt exchange has significantly extended maturity FiberTower Corp Debt Maturity Schedule at Q4 ’08* $ in millions Debt Maturity Schedule Today* $ in millions *Chart assumes all pay-in-kind (“PIK”) options exercised and the Notes due 2012 mature at 125.4% of par. $625 $38 $162 '09 '10 '11 '12 After '10 '11 '12 '13 '14 '15 '16 After |
|
|
Kurt Van Wagenen – Conclusion |
|
|
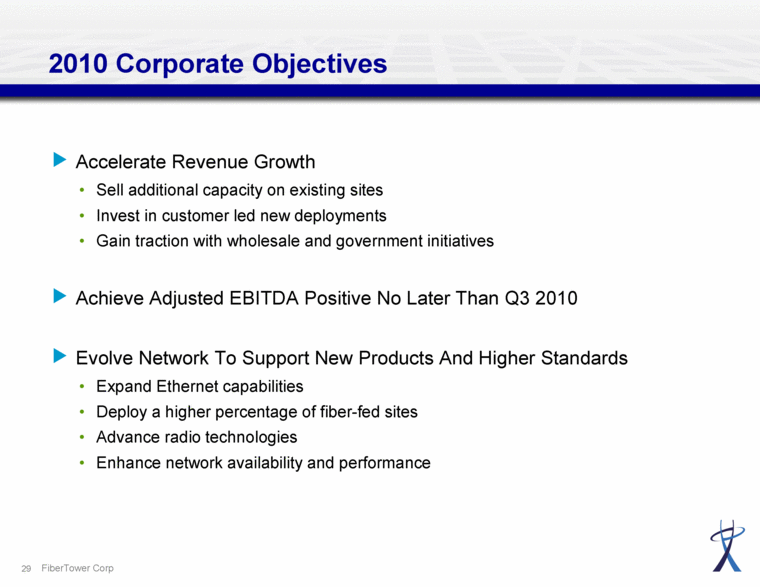
2010 Corporate Objectives Accelerate Revenue Growth Sell additional capacity on existing sites Invest in customer led new deployments Gain traction with wholesale and government initiatives Achieve Adjusted EBITDA Positive No Later Than Q3 2010 Evolve Network To Support New Products And Higher Standards Expand Ethernet capabilities Deploy a higher percentage of fiber-fed sites Advance radio technologies Enhance network availability and performance FiberTower Corp |
|
|
Question & Answer Period |
|
|
Appendix |
|
|
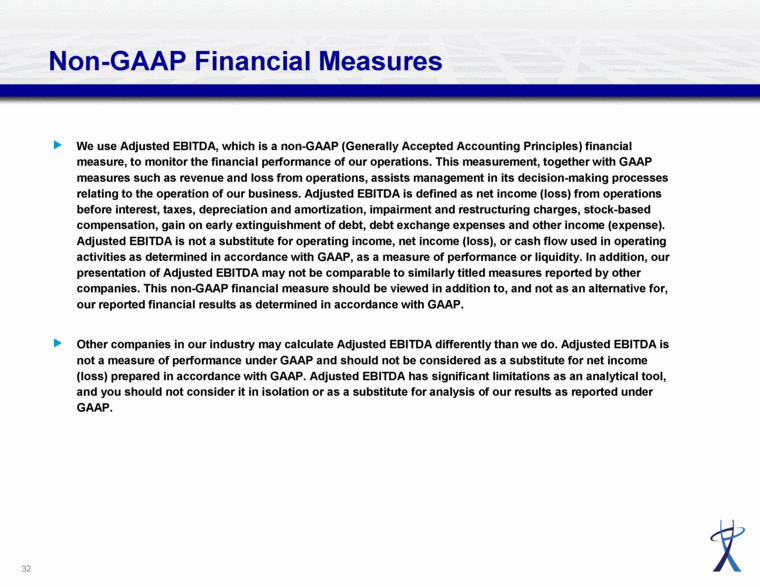
Non-GAAP Financial Measures We use Adjusted EBITDA, which is a non-GAAP (Generally Accepted Accounting Principles) financial measure, to monitor the financial performance of our operations. This measurement, together with GAAP measures such as revenue and loss from operations, assists management in its decision-making processes relating to the operation of our business. Adjusted EBITDA is defined as net income (loss) from operations before interest, taxes, depreciation and amortization, impairment and restructuring charges, stock-based compensation, gain on early extinguishment of debt, debt exchange expenses and other income (expense). Adjusted EBITDA is not a substitute for operating income, net income (loss), or cash flow used in operating activities as determined in accordance with GAAP, as a measure of performance or liquidity. In addition, our presentation of Adjusted EBITDA may not be comparable to similarly titled measures reported by other companies. This non-GAAP financial measure should be viewed in addition to, and not as an alternative for, our reported financial results as determined in accordance with GAAP. Other companies in our industry may calculate Adjusted EBITDA differently than we do. Adjusted EBITDA is not a measure of performance under GAAP and should not be considered as a substitute for net income (loss) prepared in accordance with GAAP. Adjusted EBITDA has significant limitations as an analytical tool, and you should not consider it in isolation or as a substitute for analysis of our results as reported under GAAP. |
|
|
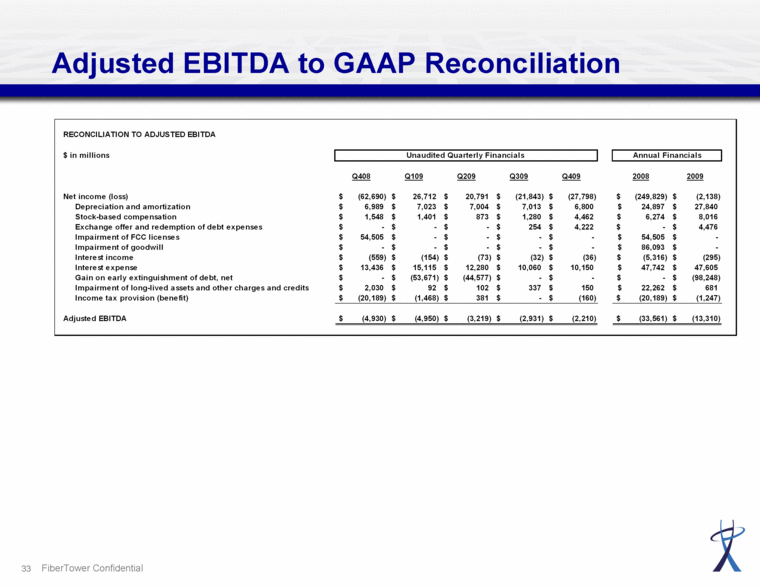
Adjusted EBITDA to GAAP Reconciliation FiberTower Confidential RECONCILIATION TO ADJUSTED EBITDA $ in millions Unaudited Quarterly Financials Annual Financials Q408 Q109 Q209 Q309 Q409 2008 2009 Net income (loss) $(62,690) $26,712 $20,791 $(21,843) $(27,798) $(249,829) $(2,138) Depreciation and amortization $6,989 $7,023 $7,004 $7,013 $6,800 $24,897 $27,840 Stock-based compensation $1,548 $1,401 $873 $1,280 $4,462 $6,274 $8,016 Exchange offer and redemption of debt expenses $- $- $- $254 $4,222 $- $4,476 Impairment of FCC licenses $54,505 $- $- $- $- $54,505 $- Impairment of goodwill $- $- $- $- $- $86,093 $- Interest income $(559) $(154) $(73) $(32) $(36) $(5,316) $(295) Interest expense $13,436 $15,115 $12,280 $10,060 $10,150 $47,742 $47,605 Gain on early extinguishment of debt, net $- $(53,671) $(44,577) $- $- $- $(98,248) Impairment of long-lived assets and other charges and credits $2,030 $92 $102 $337 $150 $22,262 $681 Income tax provision (benefit) $(20,189) $(1,468) $381 $- $(160) $(20,189) $(1,247) Adjusted EBITDA $(4,930) $(4,950) $(3,219) $(2,931) $(2,210) $(33,561) $(13,310) |
|
|
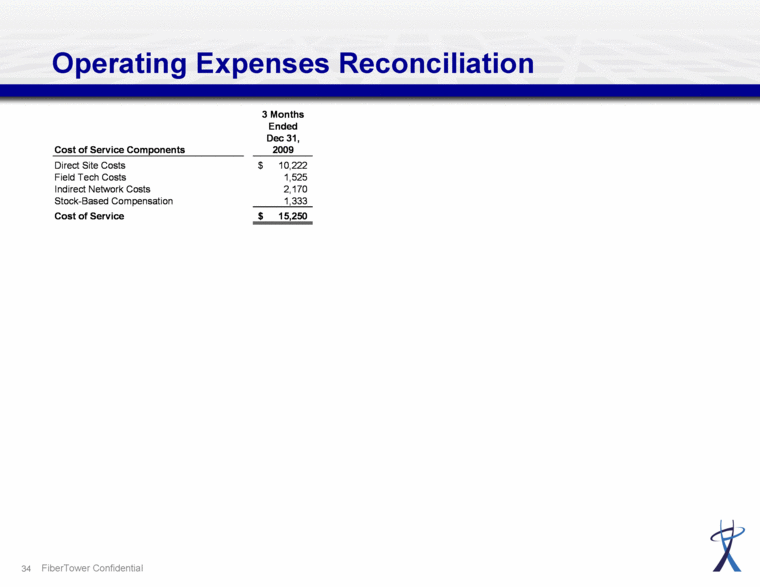
Operating Expenses Reconciliation FiberTower Confidential $ 15,250 Cost of Service 1,333 Stock-Based Compensation 2,170 Indirect Network Costs 1,525 Field Tech Costs $ 10,222 Direct Site Costs 2009 Cost of Service Components Dec 31, Ended 3 Months |

